2015 economy profile update - world business chicago...manufacturing (1) grp industry detail not...
TRANSCRIPT

Great Lakes & St. Lawrence Region 2015 Economy Profile Update

Best available data as of March 2011
Great Lakes & St. Lawrence Region
2/24/2015 2
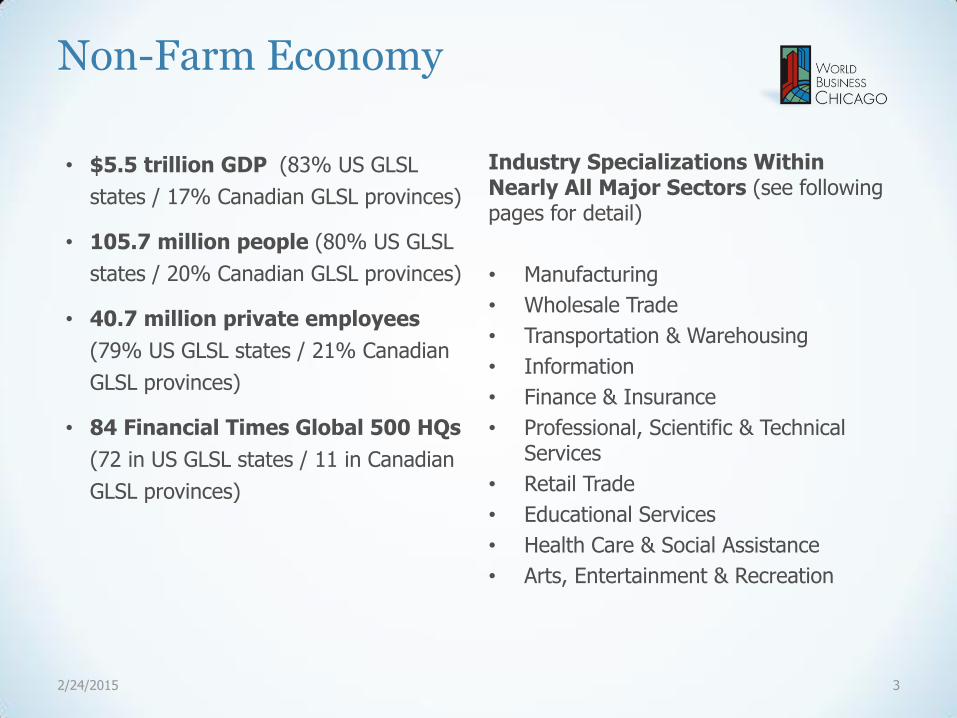
Non-Farm Economy
• $5.5 trillion GDP (83% US GLSL
states / 17% Canadian GLSL provinces)
• 105.7 million people (80% US GLSL
states / 20% Canadian GLSL provinces)
• 40.7 million private employees
(79% US GLSL states / 21% Canadian
GLSL provinces)
• 84 Financial Times Global 500 HQs
(72 in US GLSL states / 11 in Canadian
GLSL provinces)
Industry Specializations Within Nearly All Major Sectors (see following pages for detail)
• Manufacturing
• Wholesale Trade
• Transportation & Warehousing
• Information
• Finance & Insurance
• Professional, Scientific & Technical Services
• Retail Trade
• Educational Services
• Health Care & Social Assistance
• Arts, Entertainment & Recreation
2/24/2015 3

Manufacturing
(1) GRP industry detail not available for U.S. states,; share of total unable to be calculated (2) Sub-industries may not sum to total
Gross Product ($USD, Billions)(1) Employment(2)
Industry (Specializations)
Total GLSL
US GLSL states
Canada GLSL provinces
Total GLSL
US GLSL states
Canada GLSL provinces
Manufacturing – TOTAL $742.9 83.6% 16.4% 5,122,372 79.4% 20.6%
Paper (converted paper products)
(1) (1) (1) 181,637 77.1% 22.9%
Printing & related support (1) (1) (1) 215,516 82.6% 17.4%
Plastics & Rubber Products (plastics)
(1) (1) (1) 339,563 78.7% 21.3%
Primary Metal (iron & steel mills; ferroalloy; steel; aluminum; nonferrous metal; foundries)
(1) (1) (1) 238,943 81.5% 18.5%
Fabricated Metal (forging & stamping; handtools; boiler, tank & shipping containers; hardware; spring & wire products; machine shops; heat treating; other)
(1) (1) (1) 682,407 84.1% 15.9%
4 2/24/2015

Manufacturing (cont.)
(1) GRP industry detail not available for U.S. states,; share of total unable to be calculated (2) Sub-industries may not sum to total
Gross Product ($USD, Billions)(1) Employment(2)
Industry (Specializations)
Total GLSL
US GLSL states
Canada GLSL provinces
Total GLSL
US GLSL states
Canada GLSL provinces
Food (sugar & confectionery, dairy products, grain & oilseed milling; bakeries & tortillas; fruit & veg preserving/specialty food)
(1) (1) (1) 567,012 75.6%% 24.4%
Leather & Allied Products (leather & hide finishing)
(1) (1) (1) 10,805 77.3% 22.7%
Chemicals (pharmaceuticals & medicines; paint & adhesives; soap & cleaning products; other)
(1) (1) (1) 317,694 80.0% 20.0%
Nonmetallic Minerals (glass products)
(1) (1) (1) 148,031 76.7% 23.3%
5 2/24/2015
Manufacturing (cont.)
(1) GRP industry detail not available for U.S. states,; share of total unable to be calculated (2) Sub-industries may not sum to total
Gross Product ($USD, Billions)(1) Employment(2)
Industry (Specializations)
Total GLSL
US GLSL states
Canada GLSL provinces
Total GLSL
US GLSL states
Canada GLSL provinces
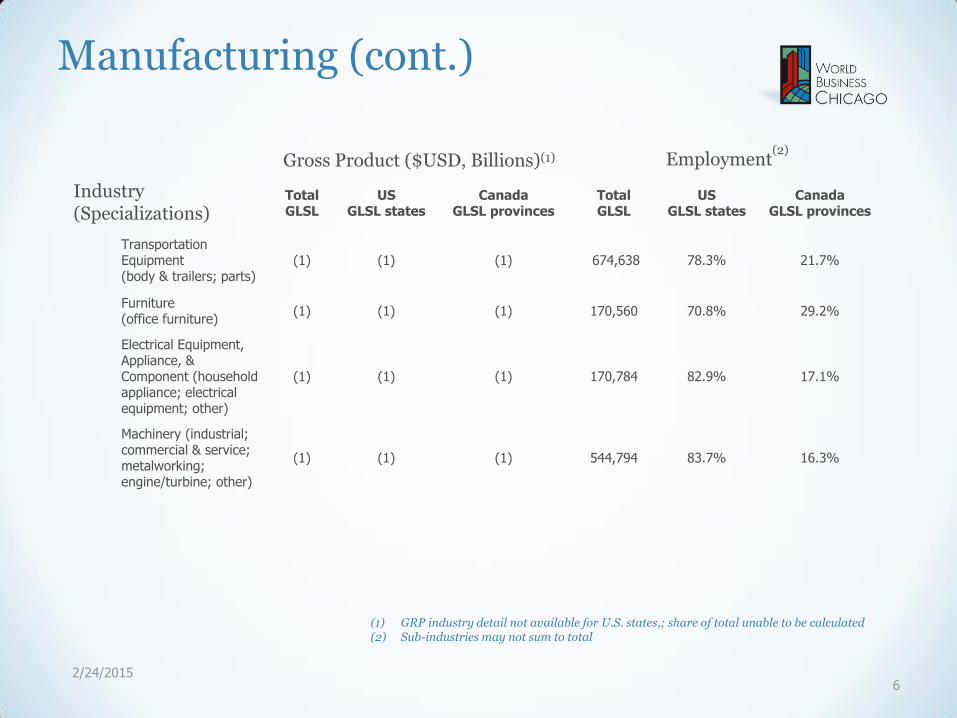
Transportation Equipment (body & trailers; parts)
(1) (1) (1) 674,638 78.3% 21.7%
Furniture (office furniture)
(1) (1) (1) 170,560 70.8% 29.2%
Electrical Equipment, Appliance, & Component (household appliance; electrical equipment; other)
(1) (1) (1) 170,784 82.9% 17.1%
Machinery (industrial; commercial & service; metalworking; engine/turbine; other)
(1) (1) (1) 544,794 83.7% 16.3%
6 2/24/2015

Wholesale Trade
(1) GRP industry detail not available for U.S. states,; share of total unable to be calculated (2) Sub-industries may not sum to total
Gross Product ($USD, Billions)(1) Employment(2)
Industry (Specializations)
Total GLSL
US GLSL states
Canada GLSL provinces
Total GLSL
US GLSL states
Canada GLSL provinces
Wholesale Trade – TOTAL $335.5 83.1% 16.9% 2,107,026 76.7% 23.3%
Apparel (1) (1) (1) 68,473 67.8% 32.2%
Household Appliances, Electric Housewares, & Consumer Electronics
(1) (1) (1) 12,081 57.0% 43.0%
Motor Vehicle & Motor Vehicle Parts & Supplies
(1) (1) (1) 144,409 73.9% 26.1%
Electrical Apparatus & Equipment, Wiring Supplies, & Related Equipment
(1) (1) (1) 72,511 57.4% 42.6%
Metal & Mineral (except Petroleum)
(1) (1) (1) 57,721 78.6% 21.4%
Drugs (drugs & druggists’ sundries)
(1) (1) (1) 85,505 62.4% 37.6%
7 2/24/2015
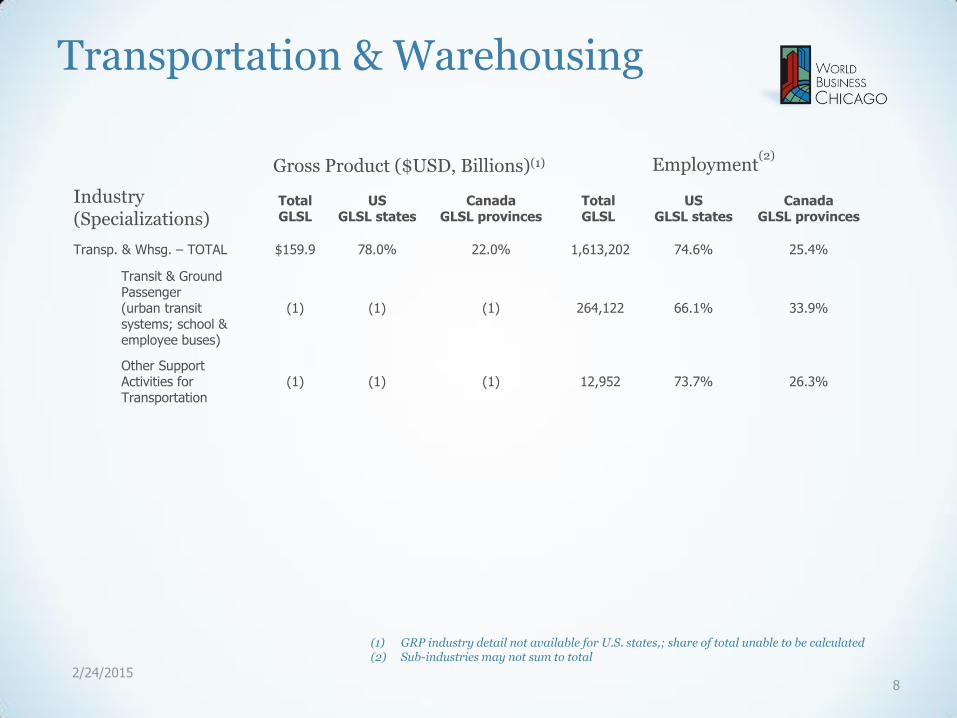
Transportation & Warehousing
(1) GRP industry detail not available for U.S. states,; share of total unable to be calculated (2) Sub-industries may not sum to total
Gross Product ($USD, Billions)(1) Employment(2)
Industry (Specializations)
Total GLSL
US GLSL states
Canada GLSL provinces
Total GLSL
US GLSL states
Canada GLSL provinces
Transp. & Whsg. – TOTAL $159.9 78.0% 22.0% 1,613,202 74.6% 25.4%
Transit & Ground Passenger (urban transit systems; school & employee buses)
(1) (1) (1) 264,122 66.1% 33.9%
Other Support Activities for Transportation
(1) (1) (1) 12,952 73.7% 26.3%
8 2/24/2015
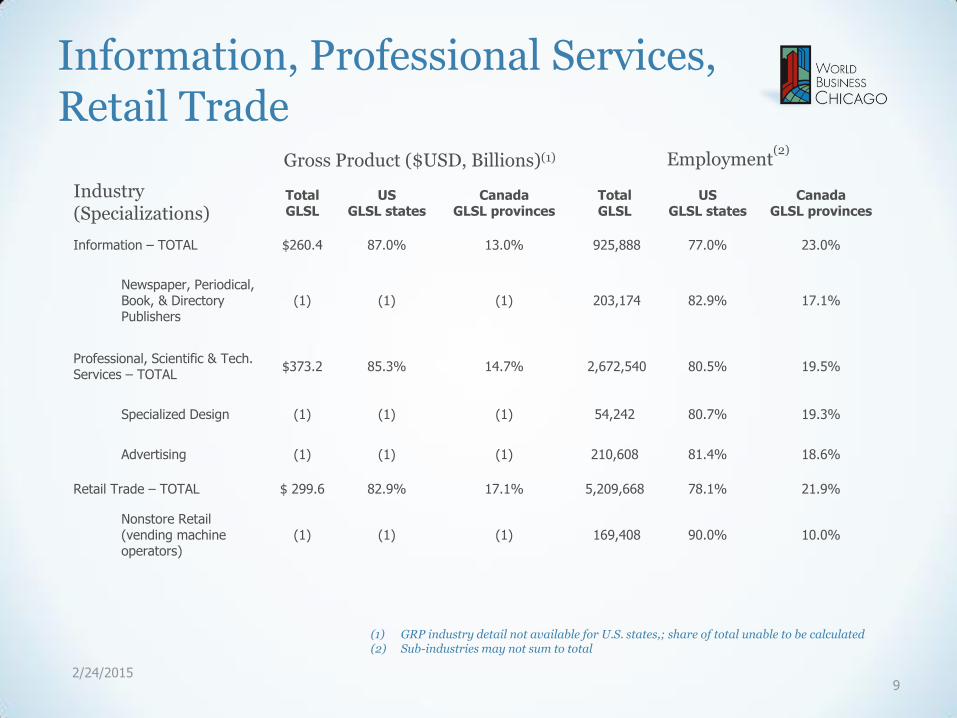
Information, Professional Services, Retail Trade
(1) GRP industry detail not available for U.S. states,; share of total unable to be calculated (2) Sub-industries may not sum to total
Gross Product ($USD, Billions)(1) Employment(2)
Industry (Specializations)
Total GLSL
US GLSL states
Canada GLSL provinces
Total GLSL
US GLSL states
Canada GLSL provinces
Information – TOTAL $260.4 87.0% 13.0% 925,888 77.0% 23.0%
Newspaper, Periodical, Book, & Directory Publishers
(1) (1) (1) 203,174 82.9% 17.1%
Professional, Scientific & Tech. Services – TOTAL
$373.2 85.3% 14.7% 2,672,540 80.5% 19.5%
Specialized Design (1) (1) (1) 54,242 80.7% 19.3%
Advertising (1) (1) (1) 210,608 81.4% 18.6%
Retail Trade – TOTAL $ 299.6 82.9% 17.1% 5,209,668 78.1% 21.9%
Nonstore Retail (vending machine operators)
(1) (1) (1) 169,408 90.0% 10.0%
9 2/24/2015
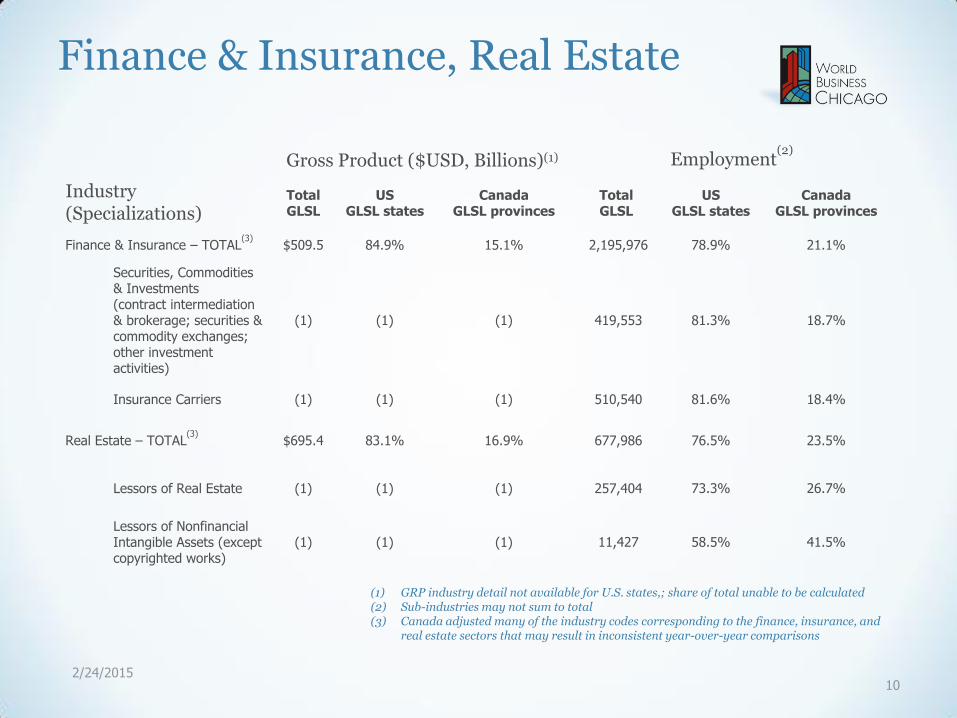
Finance & Insurance, Real Estate
(1) GRP industry detail not available for U.S. states,; share of total unable to be calculated (2) Sub-industries may not sum to total (3) Canada adjusted many of the industry codes corresponding to the finance, insurance, and
real estate sectors that may result in inconsistent year-over-year comparisons
Gross Product ($USD, Billions)(1) Employment(2)
Industry (Specializations)
Total GLSL
US GLSL states
Canada GLSL provinces
Total GLSL
US GLSL states
Canada GLSL provinces
Finance & Insurance – TOTAL(3)
$509.5 84.9% 15.1% 2,195,976 78.9% 21.1%
Securities, Commodities & Investments (contract intermediation & brokerage; securities & commodity exchanges; other investment activities)
(1) (1) (1) 419,553 81.3% 18.7%
Insurance Carriers (1) (1) (1) 510,540 81.6% 18.4%
Real Estate – TOTAL(3)
$695.4 83.1% 16.9% 677,986 76.5% 23.5%
Lessors of Real Estate (1) (1) (1) 257,404 73.3% 26.7%
Lessors of Nonfinancial Intangible Assets (except copyrighted works)
(1) (1) (1) 11,427 58.5% 41.5%
10 2/24/2015

Education, Healthcare & Social Services
(1) GRP industry detail not available for U.S. states,; share of total unable to be calculated (2) Sub-industries may not sum to total
Gross Product ($USD, Billions)(1) Employment(2)
Industry (Specializations)
Total GLSL
US GLSL states
Canada GLSL provinces
Total GLSL
US GLSL states
Canada GLSL provinces
Educational Services – TOTAL $119.4 54.8% 45.2% 1,663,473 55.2% 44.8%
Healthcare & Social Assistance – TOTAL
$438.5 84.5% 15.5% 6,507,921 83.8% 16.2%
Nursing & Residential Care Facilities (residential intellectual & developmental disability, mental health, & substance abuse; other)
(1) (1) (1) 1,340,123 82.7% 17.3%
Hospitals (general & surgical)
(1) (1) (1) 1,980,617 81.7% 18.3%
11 2/24/2015
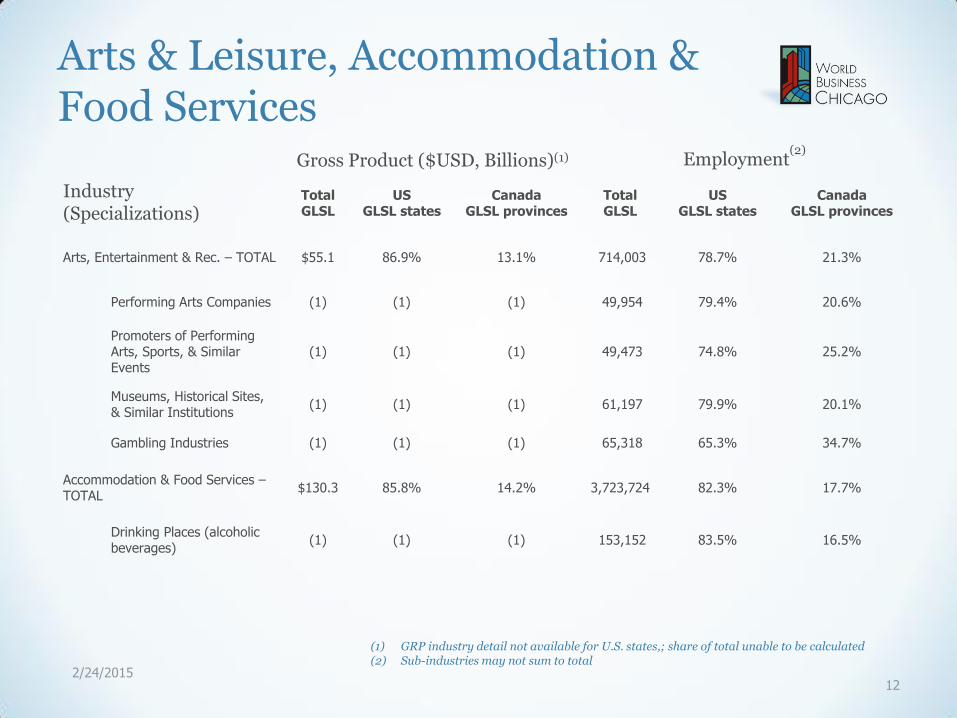
Arts & Leisure, Accommodation & Food Services
(1) GRP industry detail not available for U.S. states,; share of total unable to be calculated (2) Sub-industries may not sum to total
Gross Product ($USD, Billions)(1) Employment(2)
Industry (Specializations)
Total GLSL
US GLSL states
Canada GLSL provinces
Total GLSL
US GLSL states
Canada GLSL provinces
Arts, Entertainment & Rec. – TOTAL $55.1 86.9% 13.1% 714,003 78.7% 21.3%
Performing Arts Companies (1) (1) (1) 49,954 79.4% 20.6%
Promoters of Performing Arts, Sports, & Similar Events
(1) (1) (1) 49,473 74.8% 25.2%
Museums, Historical Sites, & Similar Institutions
(1) (1) (1) 61,197 79.9% 20.1%
Gambling Industries (1) (1) (1) 65,318 65.3% 34.7%
Accommodation & Food Services – TOTAL
$130.3 85.8% 14.2% 3,723,724 82.3% 17.7%
Drinking Places (alcoholic beverages)
(1) (1) (1) 153,152 83.5% 16.5%
12 2/24/2015

Other Services
(1) GRP industry detail not available for U.S. states,; share of total unable to be calculated (2) Sub-industries may not sum to total
Gross Product ($USD, Billions)(1) Employment(2)
Industry (Specializations)
Total GLSL
US GLSL states
Canada GLSL provinces
Total GLSL
US GLSL states
Canada GLSL provinces
Other Services – TOTAL $119.0 83.5% 16.5% 1,578,699 79.9% 20.1%
Religious, Grantmaking, Civic, Professional, & Similar Organizations
(1) (1) (1) 623,244 77.4% 22.6%
Civic & Social Organizations
(1) (1) (1) 207,534 75.5% 24.5%
Business, Professional, Labor & Political Organizations
(1) (1) (1) 193,224 68.2% 31.8%
13 2/24/2015

Demographics • 105.7 million people (80% US GLSL states / 20% Canadian GLSL provinces)
• 41.2 million households (78% US GLSL states / 22% Canadian GLSL provinces)
Agriculture • $114.9 billion GDP (81% US GLSL states / 19% Canadian GLSL provinces)
• 582,967 farms (86% US GLSL states / 14% Canadian GLSL provinces)
• 142.0 million farm acres (85% US GLSL states / 15% Canadian GLSL provinces)
• 108.6 million acres of cropland (88% US GLSL states / 12% Canadian GLSL provinces)
Harvested Crops (millions of US tons) • Corn for grain: 136.1 (93% US GLSL states / 7% Canadian GLSL provinces)
• Soybeans: 41.7 (92% US GLSL states / 8% Canadian GLSL provinces)
• Wheat for grain: 8.3 (72% US GLSL states / 28% Canadian GLSL provinces)
• Oats for grain: 0.7 (64% US GLSL states / 36% Canadian GLSL provinces)
• Sugar Beets: 16.7 (100% US GLSL states)
Livestock & Poultry (number of animals)
• Milk Cows: 4.5 (85% US GLSL states / 15% Canadian GLSL provinces)
• Hogs & Pigs: 27.8 (74% US GLSL states / 26% Canadian GLSL provinces)
• Egg-Producing Hens: 132.0 (88% US GLSL states / 12% Canadian GLSL provinces)
Demographics & Agriculture
14 2/24/2015
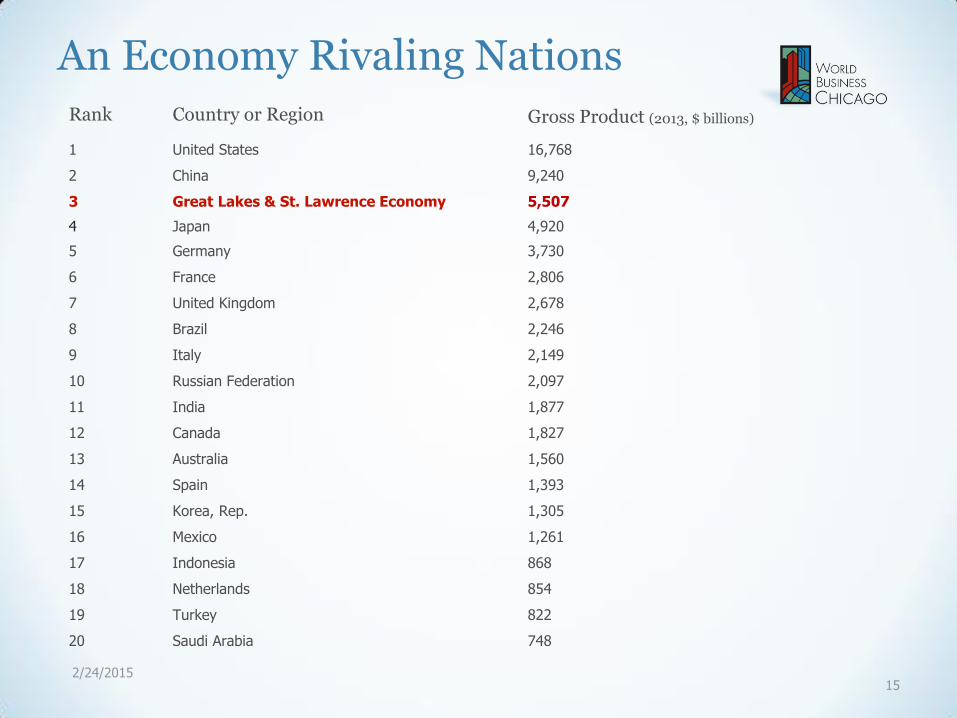
An Economy Rivaling Nations Rank Country or Region Gross Product (2013, $ billions)
1 United States 16,768
2 China 9,240
3 Great Lakes & St. Lawrence Economy 5,507
4 Japan 4,920
5 Germany 3,730
6 France 2,806
7 United Kingdom 2,678
8 Brazil 2,246
9 Italy 2,149
10 Russian Federation 2,097
11 India 1,877
12 Canada 1,827
13 Australia 1,560
14 Spain 1,393
15 Korea, Rep. 1,305
16 Mexico 1,261
17 Indonesia 868
18 Netherlands 854
19 Turkey 822
20 Saudi Arabia 748
15 2/24/2015
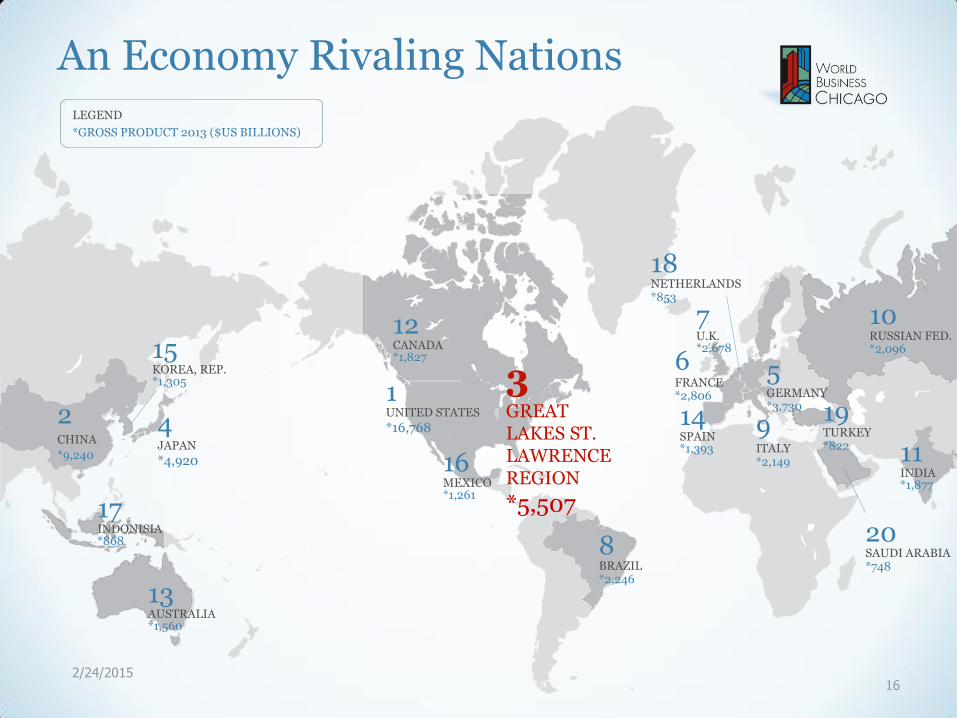
4 JAPAN
*4,920
3 GREAT LAKES ST. LAWRENCE REGION
*5,507
LEGEND
*GROSS PRODUCT 2013 ($US BILLIONS)
2 CHINA
*9,240
10 RUSSIAN FED. *2,096
20 SAUDI ARABIA *748
14 SPAIN *1,393
9 ITALY *2,149
7 U.K. *2,678
8 BRAZIL *2,246
6 FRANCE *2,806
12 CANADA *1,827
11 INDIA *1,877
1 UNITED STATES
*16,768
16 MEXICO *1,261
13 AUSTRALIA *1,560
15 KOREA, REP. *1,305
18 NETHERLANDS *853
17 INDONISIA *868
5 GERMANY *3,730 19
TURKEY *822
An Economy Rivaling Nations
16 2/24/2015

As Big as a Country Rank Country or Region Population (2013, Millions)
1 China 1,357
2 India 1,252
3 United States 316
4 Indonesia 250
5 Brazil 200
6 Pakistan 182
7 Nigeria 174
8 Bangladesh 157
9 Russian Federation 143
10 Japan 127
11 Mexico 122
12 Great Lakes & St. Lawrence Economy 106
13 Philippines 98
14 Ethiopia 94
15 Vietnam 90
16 Egypt, Arab Rep. 82
17 Germany 80
18 Iran, Islamic Rep. 77
19 Turkey 75
20 Congo 68
17 2/24/2015
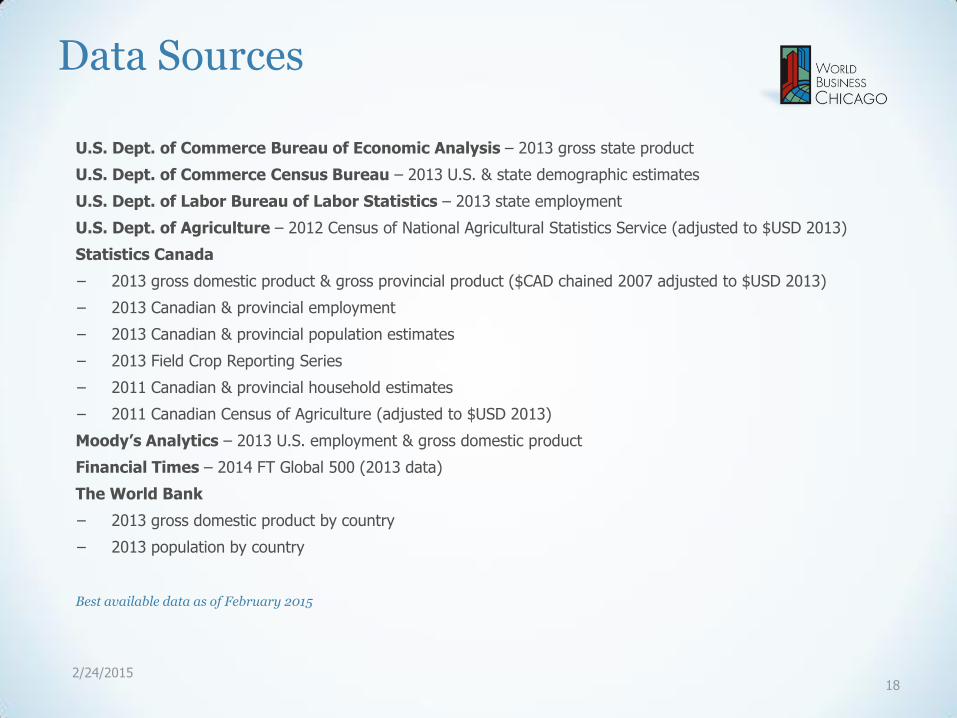
U.S. Dept. of Commerce Bureau of Economic Analysis – 2013 gross state product
U.S. Dept. of Commerce Census Bureau – 2013 U.S. & state demographic estimates
U.S. Dept. of Labor Bureau of Labor Statistics – 2013 state employment
U.S. Dept. of Agriculture – 2012 Census of National Agricultural Statistics Service (adjusted to $USD 2013)
Statistics Canada
− 2013 gross domestic product & gross provincial product ($CAD chained 2007 adjusted to $USD 2013)
− 2013 Canadian & provincial employment
− 2013 Canadian & provincial population estimates
− 2013 Field Crop Reporting Series
− 2011 Canadian & provincial household estimates
− 2011 Canadian Census of Agriculture (adjusted to $USD 2013)
Moody’s Analytics – 2013 U.S. employment & gross domestic product
Financial Times – 2014 FT Global 500 (2013 data)
The World Bank
− 2013 gross domestic product by country
− 2013 population by country
Best available data as of February 2015
Data Sources
18 2/24/2015

WorldBusinessChicago.com
@WorldBizChicago
Facebook.com/WorldBusinessChicago