2015 business finance survey: smes · sme perceptions of raising finance 4. growth 5. use of...
TRANSCRIPT

www.british-business-bank.co.uk
@britishbbank
2015 Business Finance Survey: SMEs
A report by BMG Research to the British Business Bank
February 2016

www.british-business-bank.co.uk Slide 2
Background
• In 2012, BIS commissioned a new survey exploring the stages SMEs go through when considering the need to raise external finance and the specific actions they take when seeking, applying and obtaining finance. 1,500 SMEs were interviewed by telephone using CATI.
• The survey was repeated in 2014 with 1,000 SMEs being interviewed.
• This latest 2015 survey is based on 1,608 interviews with SMEs. Some new questions are added, but core questions remain the same allowing a comparison over time.
• 300 mid-cap businesses were also surveyed and these results are presented separately.
• Statistically significant changes between the 2014 and 2015 surveys (at 95% confidence level) are identified by circles (increases) and squares (decreases). Other changes are not as significant, and care should be taken in interpreting these findings.

www.british-business-bank.co.uk Slide 3
Survey Methodology
• 1,608 CATI interviews conducted between 2nd October and 16th November 2015. The average questionnaire length was 22 minutes.
• SMEs defined as businesses having 0 to 249 employees. Sample structured by employment size and sector (2007 SIC).
• Interviews with person responsible for managing business finances.
• Data weighted to BIS’s Business Population Estimates 2014 (BPE) by size, sector and age:
390 with no employees interviewed (weighted to 76%)
652 micros (1-9) interviewed (weighted to 20%)
364 small (10-49) interviewed (weighted to 4%)
202 medium (50-249) interviewed (weighted to 1%)
• The results for SMEs overall are dominated by zero employee businesses that have different characteristics to SME employers, and this should be borne in mind when interpreting the results.

www.british-business-bank.co.uk Slide 4
Survey Findings
The report is structured into the following sections:
1. Finance usage and application
2. SMEs awareness of different types of finance
3. SME perceptions of raising finance
4. Growth
5. Use of finance in the future and discouragement
6. Export finance
7. Conclusions
• The mid-cap survey report contains greater information on differences between SMEs overall and SME employers.

www.british-business-bank.co.uk Slide 5
1) Finance usage and application

www.british-business-bank.co.uk Slide 6
Increased use of finance among employers evident in 2015 compared to 2014
89%
80%
70%
57%60%
77%
68%
55%52%
56%
85%83%
64%
52%56%
Medium (50-249)Small (10-49)Micro (1-9)No employeesAll
2015
2014
2012
Base = all SMEs (2015=1,608/2014= 1,000/2012 = 1,508). A5a (single code, prompted)
Used external finance in last 3 years - 2012-15 - by employee size

www.british-business-bank.co.uk Slide 7
With increased use of credit cards, family/colleague loans, leasing/HP and asset finance compared to 2014
28%
28%
23%
16%
15%
8%
4%
4%
1%
1%
26%
22%
13%
13%
16%
5%
2%
1%
1%
31%
22%
15%
13%
14%
5%
1%
1%
0%
Bank overdraft
Credit card finance
Family/colleague loan
Leasing/HP
Bank loan/mortgage
Grants
Trade finance
Asset finance
Equity finance
P2P lending
2015
2014
2012
Base = all SMEs (n=1,608 in 2015/n=1,000 in 2014/n=1,508 in 2012). Question A5a (multi-code, prompted)
Trade finance mainly used to support domestic trade (86%, 4%
international and 7% both). International trade is mostly using
import letters of credit
Equity investment from within the business (36%), other businesses (35%) or
family/friends (34%)
Use of forms of finance in the previous 3 years - 2012-2015

www.british-business-bank.co.uk Slide 8
More SMEs have sought finance in the last year compared to
2014, but similar to 2012 levels
39%38%
26%
15%18%
52%
30%
20%
8%
12%
45%
29%26%
15%18%
Medium (50-249)Small (10-49)Micro (1-9)No employeesAll
2015
2014
2012
Base = all SMEs (2015=1,608/2014 = 1,000/2012 = 1,508). A14 (single code, prompted)
Median amount applied for: £12,030 £8,140 £17,300 £43,150 £450,775
Sought external finance in the last year - 2012-15 - by employee size

www.british-business-bank.co.uk Slide 9
Applications for finance increased in production,
construction and other service sectors
19%
14%
19%
22%22%
18%
11%13%
14%
6%
14%12%
13%
18%
23%
19%
30%
18%
Other servicesBusiness servicesDistributionConstructionProductionAll
2015
2014
2012
Base = all SMEs (2015=1,608/2014=1,000/2012=1,508). A14 (single coded, prompted)
Sought external finance in the last year - 2012-15 - by sector
www.british-business-bank.co.uk Slide 10
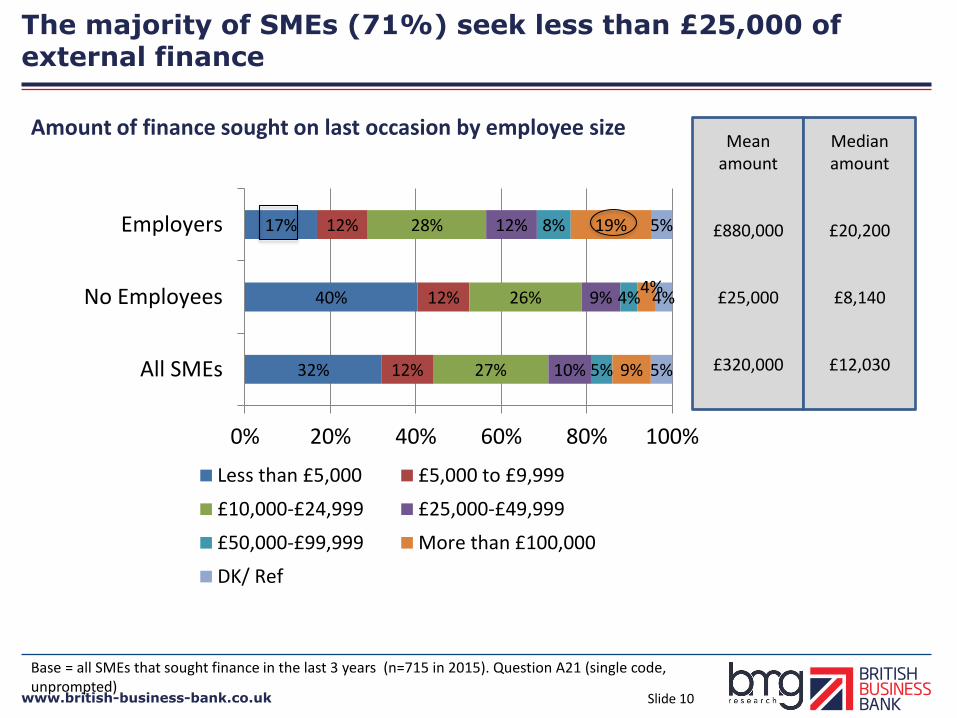
The majority of SMEs (71%) seek less than £25,000 of external finance
32%
40%
17%
12%
12%
12%
27%
26%
28%
10%
9%
12%
5%
4%
8%
9%
4%
19%
5%
4%
5%
0% 20% 40% 60% 80% 100%
All SMEs
No Employees
Employers
Less than £5,000 £5,000 to £9,999
£10,000-£24,999 £25,000-£49,999
£50,000-£99,999 More than £100,000
DK/ Ref
Amount of finance sought on last occasion by employee size Mean
amount
£880,000
£25,000
£320,000
Median amount
£20,200
£8,140
£12,030
Base = all SMEs that sought finance in the last 3 years (n=715 in 2015). Question A21 (single code, unprompted)

www.british-business-bank.co.uk Slide 11
0%0%2%3%4%
7%
20%
54%
5%2%1%
6%2%
7%8%
57%
1%1%2%1%2%
9%
14%
51% 2015
2014
2012
SMEs are still most likely to go to their main bank when they realise they need finance, but more are asking the advice of friends/colleagues than previously
Base = all SMEs that sought particular types of external finance in the last 3 years (n=706 in 2015/n=296 in 2014/n=552 in 2012). Question A16 (single code, unprompted)
50% of those seeking finance only approached the largest four UK banks (2014 = 49%)
Who spoke to first when finance need identified 2012-2015
www.british-business-bank.co.uk Slide 12
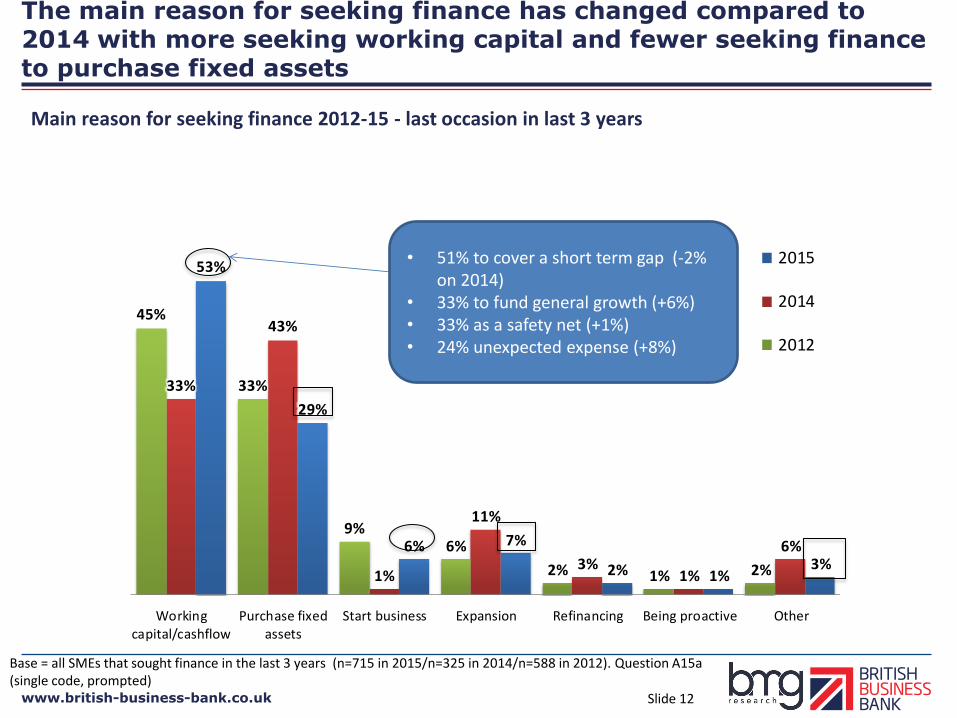
The main reason for seeking finance has changed compared to 2014 with more seeking working capital and fewer seeking finance to purchase fixed assets
3%1%2%
7%6%
29%
53%
6%
1%3%
11%
1%
43%
33%
2%1%2%
6%9%
33%
45%
OtherBeing proactiveRefinancingExpansionStart businessPurchase fixedassets
Workingcapital/cashflow
2015
2014
2012
Base = all SMEs that sought finance in the last 3 years (n=715 in 2015/n=325 in 2014/n=588 in 2012). Question A15a (single code, prompted)
Main reason for seeking finance 2012-15 - last occasion in last 3 years
• 51% to cover a short term gap (-2% on 2014)
• 33% to fund general growth (+6%) • 33% as a safety net (+1%) • 24% unexpected expense (+8%)

www.british-business-bank.co.uk Slide 13
The reduction in seeking finance for funding fixed assets is largely driven by zero employee SMEs
Base = all SMEs that sought finance in the last 3 years (n=715 in 2015/n=325 in 2014). Question A15a (single code, prompted)
Main reason for seeking finance 2012-15 - last occasion in last 3 years
30%
46%
38% 38%
58%
24%
43%
38%
0%
10%
20%
30%
40%
50%
60%
70%
Zero Employee Workingcapital/cashflow
Zero Employee Purchase fixedassets
Employers Workingcapital/cashflow
Employers Purchase fixed assets
2014 2015
www.british-business-bank.co.uk Slide 14
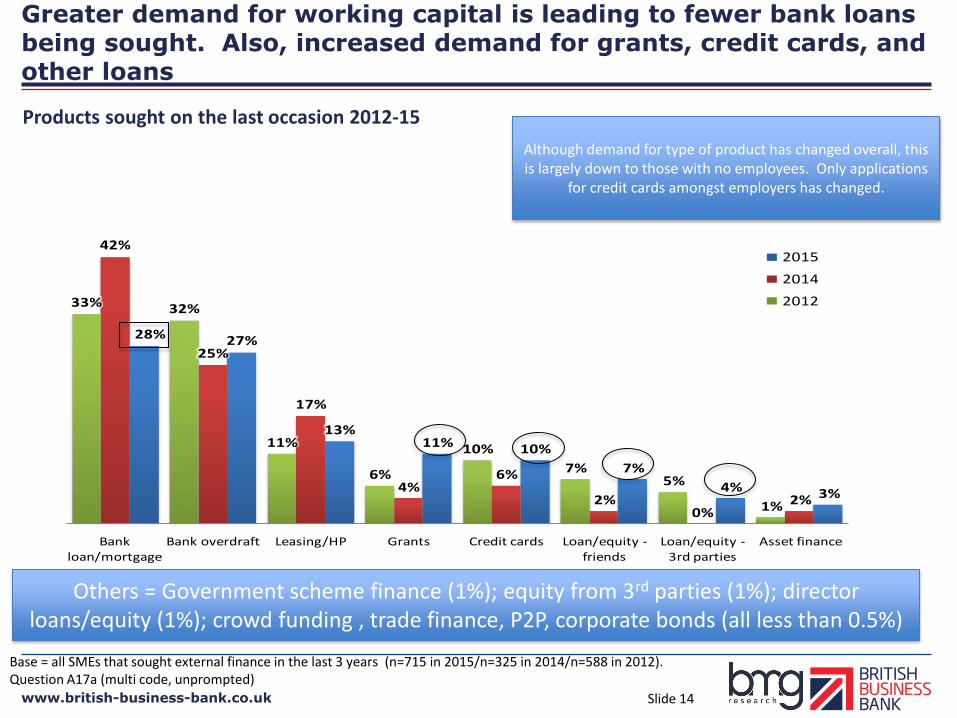
Greater demand for working capital is leading to fewer bank loans being sought. Also, increased demand for grants, credit cards, and other loans
3%4%
7%
10%11%13%
27%28%
2%0%
2%
6%4%
17%
25%
42%
1%
5%7%
10%
6%
11%
32%33%
Asset financeLoan/equity -3rd parties
Loan/equity -friends
Credit cardsGrantsLeasing/HPBank overdraftBank loan/mortgage
2015
2014
2012
Base = all SMEs that sought external finance in the last 3 years (n=715 in 2015/n=325 in 2014/n=588 in 2012). Question A17a (multi code, unprompted)
Others = Government scheme finance (1%); equity from 3rd parties (1%); director loans/equity (1%); crowd funding , trade finance, P2P, corporate bonds (all less than 0.5%)
Products sought on the last occasion 2012-15
Although demand for type of product has changed overall, this is largely down to those with no employees. Only applications
for credit cards amongst employers has changed.

www.british-business-bank.co.uk Slide 15
There is increased consideration of the long term cost and ease of application when choosing finance
4%6%
9%9%10%
12%
15%
26%
29%
6%7%7%
4%
8%10%
8%6%
19%
14%
6%
9%8%
6%
10%
5%
26%24%
Acceptable t&c
Likely successSpeed of obtaining it
Trusted brandFlexibilityShort term servicing
costs
Long term cost
Most suitable option
Ease of application
2015
2014
2012
Base = all SMEs that sought external finance in the last 3 years (n=715 in 2015/n=325 in 2014/n=588 in 2012). Question A17b (multi code, unprompted)
Reasons for choosing type of finance 2012-15

www.british-business-bank.co.uk Slide 16
Some indication that SMEs are considering/ contacting more suppliers for finance than was the case in 2012
61%
66%
71%
18%
18%
11%
10%
11%
7%
2%
1%
5%
4%
2%
4%
5%
3%
2%
2015
2014
2012
One Two Three Four Five+ DK/REF
Base = all SMEs that sought finance in the last 3 years (n=715 in 2015/n=325 in 2014/n=588 in 2012). Question A17d1/A17e (single code, unprompted)
Mean = 1.7 (working capital = 1.5, purchase assets = 1.7,
expansion = 2.3)
Mean = 1.5 (working capital = 1.3, purchase assets = 1.6,
expansion = 1.9)
Mean = 1.7 (working capital = 1.5, purchase assets = 1.7,
expansion = 2.6)
Main reasons for only approaching one provider • Longstanding relationship 48% (2014 = 59%) • Got all they needed from first approached 23% (2014 = 10%) •Too much hassle to shop around 11% (2014 = 12%)
Number of providers contacted 2012-2015
www.british-business-bank.co.uk Slide 17
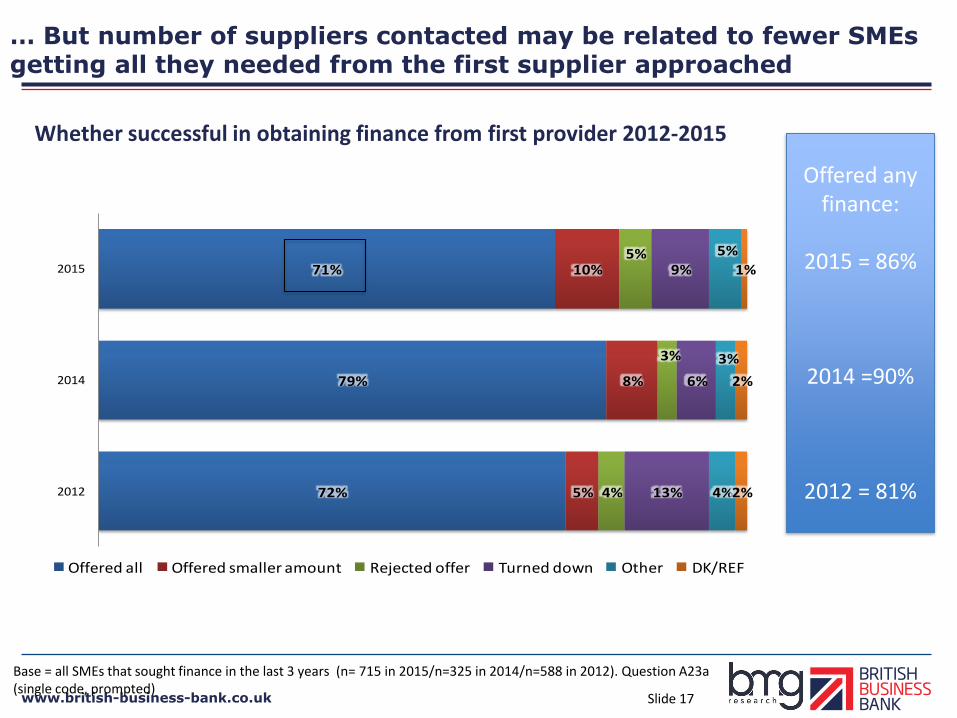
… But number of suppliers contacted may be related to fewer SMEs getting all they needed from the first supplier approached
47%
51%
13%
15%
2%
3%
3%
4%
9%
9%
23%
16%
3%
2%
2012
2014
Less than 1 hour 1-2 hours 3-5 hours 6-20 hours More than 20 hours Not applicable DK
Base = all SMEs that sought finance in the last 3 years (n= 715 in 2015/n=325 in 2014/n=588 in 2012). Question A23a (single code, prompted)
71%
79%
72%
10%
8%
5%
5%
3%
4%
9%
6%
13%
5%
3%
4%
1%
2%
2%
2015
2014
2012
Offered all Offered smaller amount Rejected offer Turned down Other DK/REF
Whether successful in obtaining finance from first provider 2012-2015
Offered any finance:
2015 = 86%
2014 =90%
2012 = 81%
www.british-business-bank.co.uk Slide 18
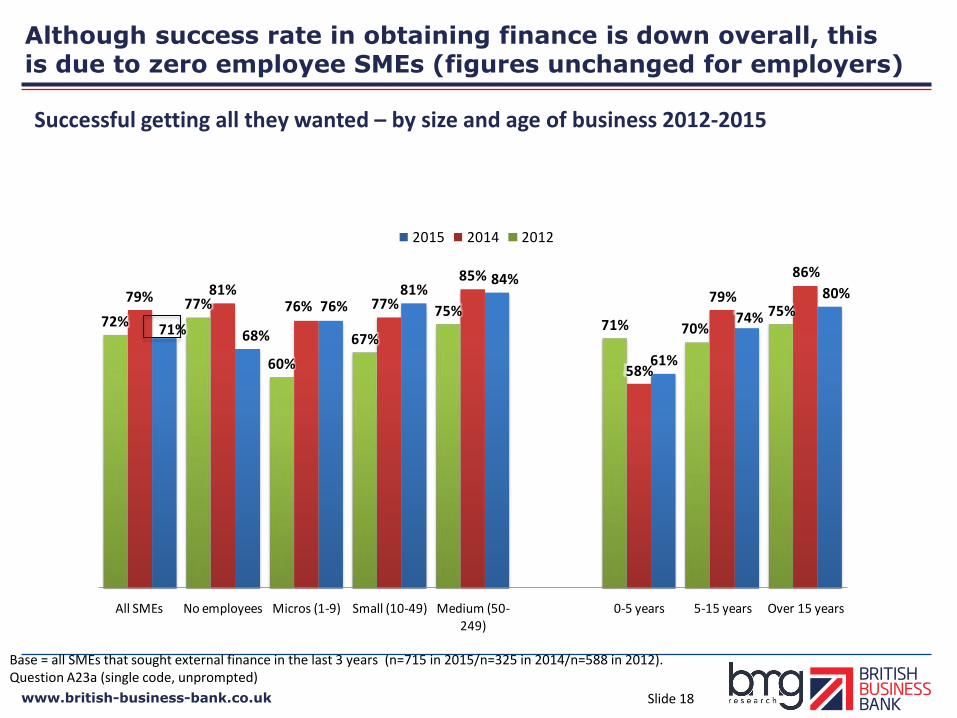
Although success rate in obtaining finance is down overall, this is due to zero employee SMEs (figures unchanged for employers)
80%
74%
61%
84%81%
76%
68%71%
86%
79%
58%
85%
77%76%81%79%
75%70%71%
75%
67%
60%
77%72%
Over 15 years5-15 years0-5 yearsMedium (50-249)
Small (10-49)Micros (1-9)No employeesAll SMEs
2015 2014 2012
Base = all SMEs that sought external finance in the last 3 years (n=715 in 2015/n=325 in 2014/n=588 in 2012). Question A23a (single code, unprompted)
Successful getting all they wanted – by size and age of business 2012-2015

www.british-business-bank.co.uk Slide 19
Fewer loans/mortgages approved in 2015 with more SMEs turned down than 2014
47%
51%
13%
15%
2%
3%
3%
4%
9%
9%
23%
16%
3%
2%
2012
2014
Less than 1 hour 1-2 hours 3-5 hours 6-20 hours More than 20 hours Not applicable DK
Base = all SMEs that sought bank loans/mortgages in the last 3 years (n= 208 in 2015/n=112 in 2014/n=185 in 2012). Question A23a (single code, prompted)
65%
81%
70%
14%
8%
6%
9%
4%
4%
11%
5%
18%
1%
1%
2015 -loans/mortgages
2014 -loans/mortgages
2012 -loans/mortgages
Offered all Offered smaller amount Rejected offer Turned down Other
Outcome of applications for bank loans/mortgages 2012-2015 Change in success rate down to zero employee
firms (81% successful 2014/65% in 2015)

www.british-business-bank.co.uk Slide 20
SMEs typically seek loans of 3-4 years, with only 5% seeking longer than 7 years
47%
51%
13%
15%
2%
3%
3%
4%
9%
9%
23%
16%
3%
2%
2012
2014
Less than 1 hour 1-2 hours 3-5 hours 6-20 hours More than 20 hours Not applicable DK
Base = all SMEs that sought bank loans or mortgages (n=208)
14%
16%
15%
17%
29%
33%
21%
23%
7%
5%
14%
6%
Bank loans/mortgages
Bank loans
One year or less 1-2 years 3-4 years 5-7 years Longer Don't know
Loan tenor periods 2015

www.british-business-bank.co.uk Slide 21
Base = all SMEs that obtained a bank loan/mortgage in the last 3 years (n=184). Question A23c (single code, prompted)
At least three quarters of bank loans/mortgages are granted at the tenor period requested by the SME
75%
8%
8% 10% Yes - for period
requested
No - longerperiod
No - shorterperiod
Don't know
Reasons for getting a mortgage/loan for a different
period:
“At the time the bank was searching for money itself.”
“The minimum tenor period was 12
months.”
“Complications with planning consent that the bank did not agree
with.”
Whether bank loan/mortgage obtained was for the same tenor period requested

www.british-business-bank.co.uk Slide 22
SMEs less likely to negotiate than previously if they did not get full amount of finance
34%
7%
12%
13%
29%
5%
38%
23%
15%
26%
17%
5%
38%
30%
23%
11%
17%
1%
Give up/cancel plans
Negotiate with provider
Talk to another provider
Use an existing form of finance
Other
Don't know
2015 2014 2012
Base = all SME that did not receive full amount of finance applied for from first institution approached (n =109 in 2015/n=52 in 2014/n=154 in 2012). Question A23b (multi-code, prompted)
These are mainly people who accepted the bank’s decision of a lower offer
If not offered full amount of finance – what would they do next? – 2012-2015
www.british-business-bank.co.uk Slide 23
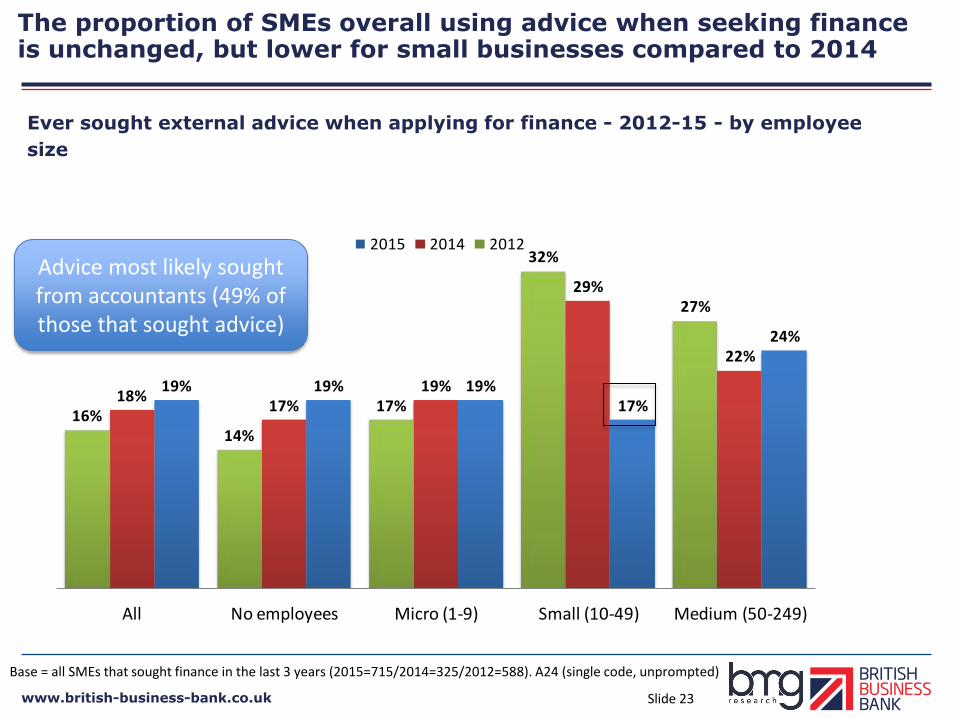
The proportion of SMEs overall using advice when seeking finance is unchanged, but lower for small businesses compared to 2014
24%
17%19%19%19%
22%
29%
19%17%
18%
27%
32%
17%
14%16%
Medium (50-249)Small (10-49)Micro (1-9)No employeesAll
2015 2014 2012
Base = all SMEs that sought finance in the last 3 years (2015=715/2014=325/2012=588). A24 (single code, unprompted)
Advice most likely sought from accountants (49% of those that sought advice)
Ever sought external advice when applying for finance - 2012-15 - by employee
size

www.british-business-bank.co.uk Slide 24
SMEs are less inclined to want to seek external advice in 2015
47%
51%
13%
15%
2%
3%
3%
4%
9%
9%
23%
16%
3%
2%
2012
2014
Less than 1 hour 1-2 hours 3-5 hours 6-20 hours More than 20 hours Not applicable DK
Base = all SMEs excluding mid-caps (n=1,512 in 2015/n=1,000 in 2014/n=1.508 in 2012). Question B4/B6 (single code, prompted)
18%
22%
27%
25%
24%
28%
8%
10%
7%
19%
15%
15%
29%
28%
20%
1%
2%
3%
2015
2014
2012
Very likely
Fairly likely
Neither
Fairly unlikely
Very unlikely
DK
52% of those that would take advice willing to pay for it (46% in both 2012 and 2014)
Likelihood of seeking external advice if had difficulties obtaining finance – 2012-2015

www.british-business-bank.co.uk Slide 25
2) SMEs awareness of different types of finance
www.british-business-bank.co.uk Slide 26
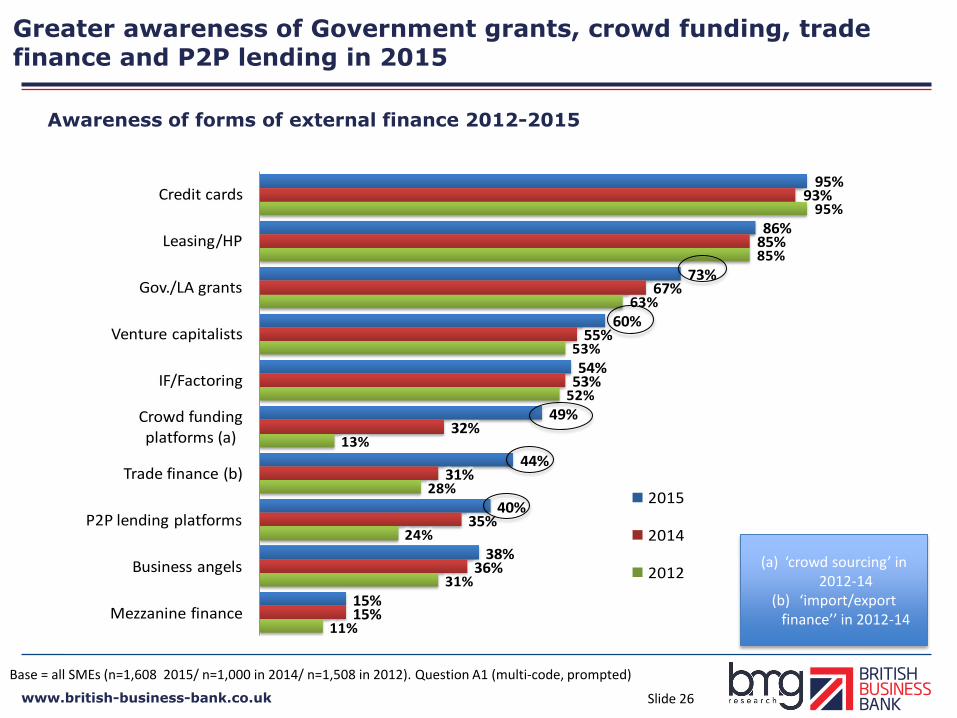
Greater awareness of Government grants, crowd funding, trade finance and P2P lending in 2015
95%
86%
73%
60%
54%
49%
44%
40%
38%
15%
93%
85%
67%
55%
53%
32%
31%
35%
36%
15%
95%
85%
63%
53%
52%
13%
28%
24%
31%
11%
Credit cards
Leasing/HP
Gov./LA grants
Venture capitalists
IF/Factoring
Crowd funding platforms (a)
Trade finance (b)
P2P lending platforms
Business angels
Mezzanine finance
2015
2014
2012
Base = all SMEs (n=1,608 2015/ n=1,000 in 2014/ n=1,508 in 2012). Question A1 (multi-code, prompted)
(a) ‘crowd sourcing’ in 2012-14
(b) ‘import/export finance’’ in 2012-14
Awareness of forms of external finance 2012-2015

www.british-business-bank.co.uk Slide 27
SMEs more aware of who to approach for these types of products than previously
76%
55%
44%
32%
26%
25%
22%
19%
18%
8%
75%
54%
36%
30%
14%
14%
20%
14%
15%
5%
78%
54%
37%
30%
5%
12%
18%
11%
12%
5%
Credit cards
Leasing/HP
Gov./LA grants
Asset finance
Crowd funding
Trade finance
Venture capitalists
P2P lending
Business angels
Mezzanine finance
2015
2014
2012
Base = all SMEs (n=1,608 in 2015/n=1,000 in 2014/n=1,508 in 2012). Question A1 (multi-code, prompted)
(a) ‘crowd sourcing’ in 2012-14
(b) ‘import/export finance’’ in 2012-14
Aware of who to approach for forms of external finance 2012-2015

www.british-business-bank.co.uk Slide 28
Awareness of Business Bank schemes has increased since 2012...
65%
28%
11%
23%
3%
Start-Up Loans
Enterprise FinanceGuarantee
Enterprise CapitalFunds
2015
2012
Base = all SMEs (n=1,608 in 2015/n=1,508 in 2012). Question D1 (multi-code, prompted)
With the exception of Start-Up Loans, larger SMEs more likely to be aware of these schemes
Awareness of Business Bank schemes 2012-2015

www.british-business-bank.co.uk Slide 29
...as has knowledge of where to access EFG (but not other finance schemes)
11%
7%
1%
2%
1%
Enterprise FinanceGuarantee
Start-Up Loans
Enterprise CapitalFunds 2015
2012
Base = all SMEs (n=1,608 in 2015/n=1,508 in 2012). Question D2 (multi-code, prompted)
Know how to access funding for schemes: 2012-2015

www.british-business-bank.co.uk Slide 30
Awareness of the British Business Bank
• 27% aware that UK Government has created a development bank to increase supply of finance to SMEs (2014 = 35%)
• 17% have heard of British Business Bank (2014 = 18%)
• 34% aware of either (2014 = 40%)
• The survey was introduced as a BIS survey to avoid biasing the results of this question.
Most likely to have heard:
• Exporters (42%, cf. 32% of non-exporters)
• Aged over 20 years (39%, cf. 28% aged up to 5 years, 33% aged 6-20 years)
• Medium-sized businesses (45%)
• Lower than average awareness in construction (17%), and distribution (25%)
www.british-business-bank.co.uk Slide 31
3) SMEs perceptions of raising finance

www.british-business-bank.co.uk Slide 32
SMEs are more confident in their ability to assess finance products offered by own bank than assessing other providers’ products and applying for financing generally
Base = all SMEs (n=1,608). Question A5 (single code, prompted)
30%
17%
17%
26%
16%
17%
23%
28%
26%
8%
18%
18%
10%
17%
19%
2%
4%
5%
Assessing finance products offered by own bank
Assessing finance products offered by other providers
Applying for external finance
Very confident Somewhat confident Neither
Somewhat unconfident Not at all confident DK Confidence levels strongly correlated
with size of business
Confidence in ability to raise finance 2015
Net Confident/ unconfident
56%/18%
33%/35%
34%/37%

www.british-business-bank.co.uk Slide 33
Slight increase in the proportion thinking it is easy to obtain finance in 2015, but a high proportion still think it is difficult
Base = all SMEs (n=1,608 in 2015/n=1,000 in 2014/n=1.508 in 2012). Question A29 (single code, prompted)
4%
2%
2%
11%
9%
6%
13%
19%
8%
28%
32%
26%
27%
26%
43%
17%
12%
15%
2015
2014
2012
Very easy Fairly easy Neither Fairly difficult Very difficult DK/REF
Those that last sought finance over three years ago are the most likely to think it difficult (62%)
In 2015 SMEs perceived that (on average) 38% of those that apply for bank
finance succeed in getting it (2014 = 42%; 2012 = 32%)
Perceptions of how easy/difficult it is to gain finance 2012-2015
Net Easy/ difficult
15%/55%
11%/58%
8%/69%

www.british-business-bank.co.uk Slide 34
4) Growth

www.british-business-bank.co.uk Slide 35
Micro businesses are the most likely to want to grow substantially but medium businesses are most likely to want to grow overall
47%
51%
13%
15%
2%
3%
3%
4%
9%
9%
23%
16%
3%
2%
2012
2014
Less than 1 hour 1-2 hours 3-5 hours 6-20 hours More than 20 hours Not applicable DK
Base = all SMEs (n=1,608 In 2015). Question B3c (single code, prompted)
16%
15%
19%
15%
12%
15%
15%
15%
20%
18%
26%
24%
29%
38%
47%
32%
33%
28%
22%
19%
11%
11%
8%
3%
2%
2%
2%
1%
3%
2%
All
No employees
Micro (1-9)
Small (10-49)
Medium (50-249)
Grow subtantially (20%+) Grow significantly (10-20%) Grow moderately (up to 10%)
Same size Shrink/sell/close Other/DK
Growth objectives – by number of employees (Increase turnover in next 12 months)
Overall increase in the proportion wanting to grow (2014 = 46%; 2015 = 56%) Aim to grow
56%
54%
62%
73%
77%

www.british-business-bank.co.uk Slide 36
SMEs in business services are the most likely to want to grow substantially
47%
51%
13%
15%
2%
3%
3%
4%
9%
9%
23%
16%
3%
2%
2012
2014
Less than 1 hour 1-2 hours 3-5 hours 6-20 hours More than 20 hours Not applicable DK
Base = all SMEs (n=1,608 In 2015). Question B3c (single code, prompted)
16%
13%
11%
12%
21%
15%
15%
9%
16%
16%
16%
14%
26%
30%
19%
29%
28%
25%
32%
38%
49%
27%
23%
32%
11%
10%
4%
14%
11%
12%
2%
2%
3%
2%
3%
All
ABCDE
Production
F Construction
GHI Distribution
JKLMN Business …
PQRS Other
services
Grow subtantially (20%+) Grow significantly (10-20%) Grow moderately (up to 10%)
Same size Shrink/sell/close Other/DK
Growth objectives – by sector
Aim to grow
56%
51%
46%
57%
65%
54%

www.british-business-bank.co.uk Slide 37
Growth ambition declines when the business is older than 20 years
47%
51%
13%
15%
2%
3%
3%
4%
9%
9%
23%
16%
3%
2%
2012
2014
Less than 1 hour 1-2 hours 3-5 hours 6-20 hours More than 20 hours Not applicable DK
Base = all SMEs (n=1,608 In 2015). Question B3c (single code, prompted)
16%
21%
18%
7%
15%
22%
15%
8%
26%
28%
25%
24%
32%
22%
28%
47%
11%
8%
12%
12%
2%
1%
2%
2%
All
0-5 years
5-20 years
Over 20 years
Grow subtantially (20%+) Grow significantly (10-20%) Grow moderately (up to 10%)
Same size Shrink/sell/close Other/DK
Growth objectives – by age
Aim to grow
56%
70%
59%
40%

www.british-business-bank.co.uk Slide 38
Domestic expansion and introducing new products/ services are the most common ways SMEs aim to achieve growth
20%24%
39%
61%63%
Expand internationallyInvest in assetsInvestment in staffNew products/servicesExpand in the UK
Base = all SMEs that intend to grow (n=1043 in 2015). Question B3d (multi code, prompted)
Ways in which growth will be achieved 2015
www.british-business-bank.co.uk Slide 39
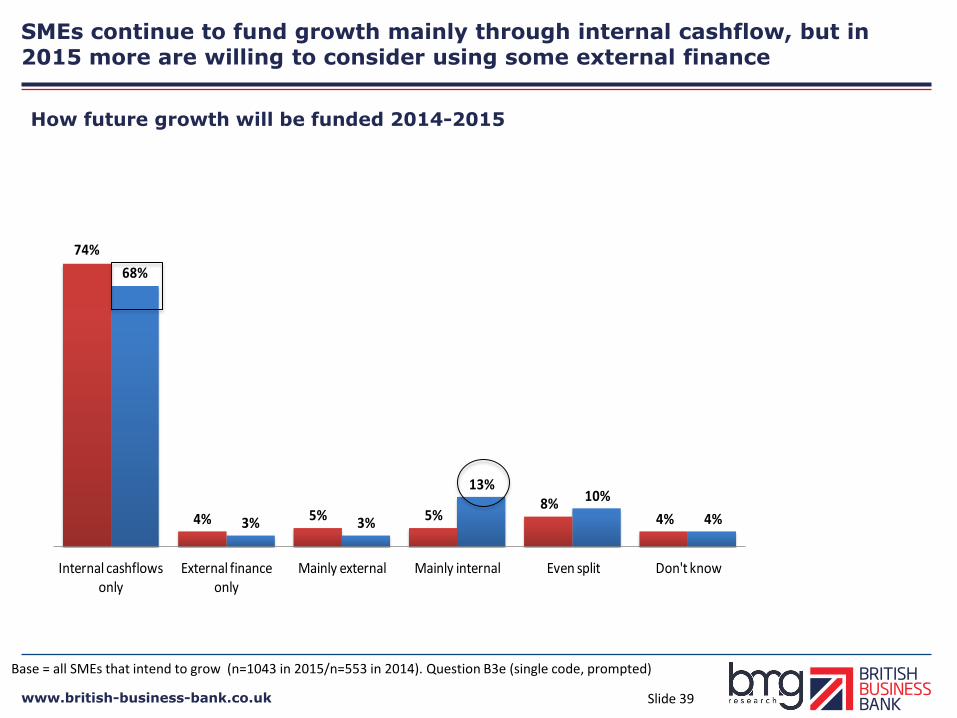
SMEs continue to fund growth mainly through internal cashflow, but in 2015 more are willing to consider using some external finance
4%
10%13%
3%3%
68%
4%8%
5%5%4%
74%
Don't knowEven splitMainly internalMainly externalExternal finance only
Internal cashflows only
Base = all SMEs that intend to grow (n=1043 in 2015/n=553 in 2014). Question B3e (single code, prompted)
How future growth will be funded 2014-2015

www.british-business-bank.co.uk Slide 40
44% of SMEs believe trading conditions in the next 12 months will be better
47%
51%
13%
15%
2%
3%
3%
4%
9%
9%
23%
16%
3%
2%
2012
2014
Less than 1 hour 1-2 hours 3-5 hours 6-20 hours More than 20 hours Not applicable DK
Base = all SMEs (n=1,608 In 2015). Question B3c (single code, prompted)
14%
20%
21%
3%
30%
35%
44%
12%
43%
35%
30%
62%
9%
8%
4%
16%
2%
1%
1%
5%
1%
1%
2%
All
Start up
Scale up
Stay ahead
Significantly better Slightly better About the same Slightly worse Significantly worse Don't know
•Start ups = less than 5 years old; Scale ups = 5+ years and planning to grow; Stay ahead = 5+ years and no plans to grow
Whether trading conditions will be better or worse in the next 12 months
Net better/ worse
44%/11%
55%/9%
65%/5%
15%/21

www.british-business-bank.co.uk Slide 41
5) Use of external finance in future and discouragement
www.british-business-bank.co.uk Slide 42
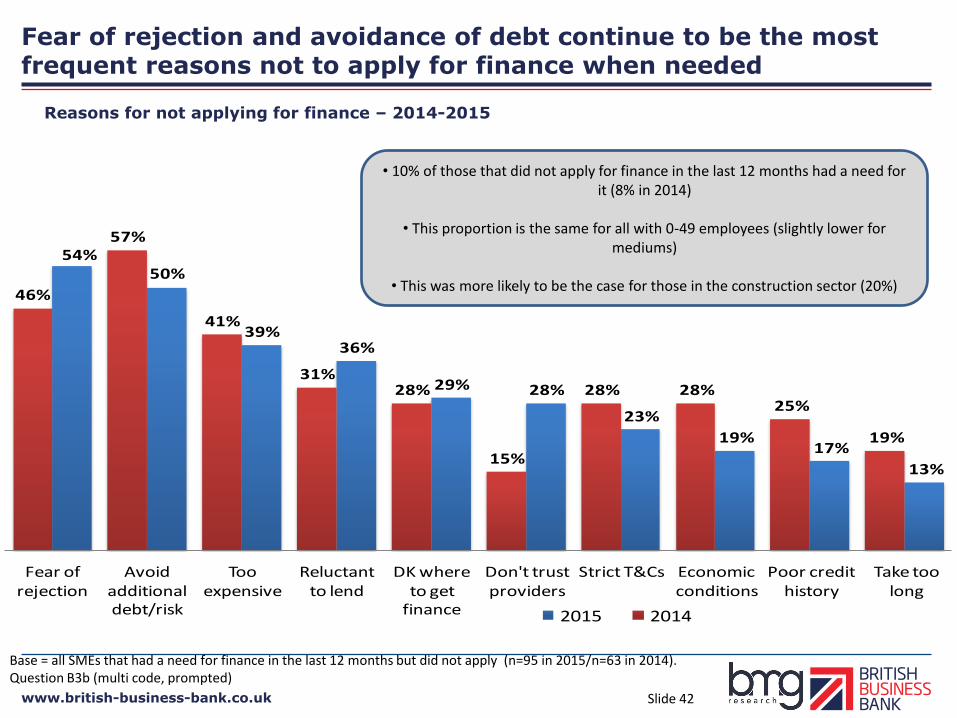
Fear of rejection and avoidance of debt continue to be the most frequent reasons not to apply for finance when needed
13%
17%19%
23%
28%29%
36%39%
50%54%
19%
25%28%28%
15%
28%31%
41%
57%
46%
Take too long
Poor credit history
Economic conditions
Strict T&CsDon't trust providers
DK where to get
finance
Reluctant to lend
Too expensive
Avoid additional debt/risk
Fear of rejection
2015 2014
Base = all SMEs that had a need for finance in the last 12 months but did not apply (n=95 in 2015/n=63 in 2014). Question B3b (multi code, prompted)
• 10% of those that did not apply for finance in the last 12 months had a need for it (8% in 2014)
• This proportion is the same for all with 0-49 employees (slightly lower for
mediums)
• This was more likely to be the case for those in the construction sector (20%)
Reasons for not applying for finance – 2014-2015

www.british-business-bank.co.uk Slide 43
Not wanting to take on debt is the main reason not to apply for finance
2%2%
4%
6%
8%
12%
16%
25%
1%
6%
2%
10%
1%
17%
12%
15%
25%
Take too long
Economic conditions
Strict T&CsPoor credit history
DK where to get
finance
Too expensive
Reluctant to lend
Fear of rejection
Avoid additional debt/risk 2015 2014
Base = all SMEs that had a need for finance in the last 12 months but did not apply (n=95 in 2015/n=63 in 2014). Question B3b1 (single code, prompted)
Main reasons for not applying for finance – 2014-2015
•Overall, 4% of SMEs are discouraged from seeking finance because of fear of rejection (as a main
reason, 1%)
• Almost all of these are zero employee or micro businesses

www.british-business-bank.co.uk Slide 44
Compared to 2012, leasing/HP less likely to be considered, but crowd funding is more likely to be considered than previously
25%
3%
10%12%12%
16%21%22%
38%34%
3%7%
12%10%
15%19%
20%
40%
23%
4%3%
16%
8%
28%
23%25%
49%
2015
2014
2012
Base = all SMEs (n=1,608 in 2015/n=1,000 in 2014/n=1,508 in 2012). Question B8 (multi code, prompted)
If had difficulties raising finance in future from a bank, which other forms of finance would be considered 2012-2015
www.british-business-bank.co.uk Slide 45
6) Export finance
www.british-business-bank.co.uk Slide 46
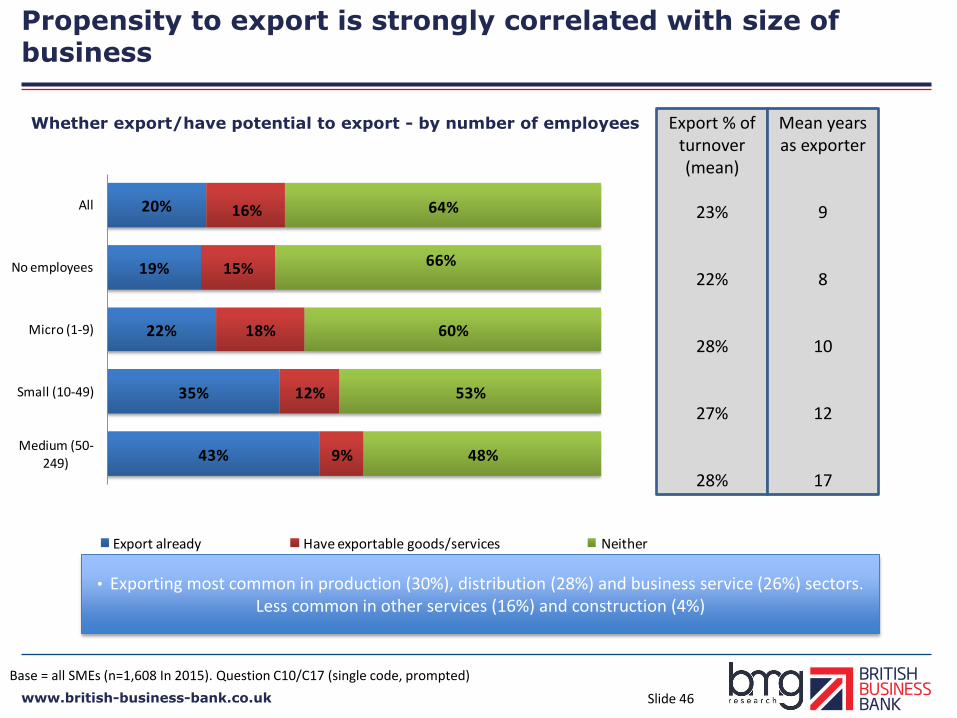
Propensity to export is strongly correlated with size of business
Base = all SMEs (n=1,608 In 2015). Question C10/C17 (single code, prompted)
20%
19%
22%
35%
43%
16%
15%
18%
12%
9%
64%
66%
60%
53%
48%
All
No employees
Micro (1-9)
Small (10-49)
Medium (50-249)
Export already Have exportable goods/services Neither
Export % of turnover (mean)
23%
22%
28%
27%
28%
Mean years as exporter
9
8
10
12
17
Whether export/have potential to export - by number of employees
• Exporting most common in production (30%), distribution (28%) and business service (26%) sectors. Less common in other services (16%) and construction (4%)
www.british-business-bank.co.uk Slide 47
Very few SMEs use trade finance and trade credit insurance
Trade finance
• Although 4% of all SMEs said that they had used trade finance in the past 3 years, only 1% of all exporters (0.2% of all SMEs) applied for it in this period.
• 67% of these were successful and had no difficulties getting it (base size = 17). Of the 3 SMEs that not obtain it, it had a significant impact for one, and no impact for two.
• 16% of exporters said they would increase the amount they exported if they had access to trade finance.
• 15% of non-exporters with exportable goods/services said that would start exporting if they had greater access to trade finance.
Trade credit insurance
• 1% of exporters (0.3% of all SMEs said that had applied for trade credit insurance in the last 3 years.
• 99% were successful in obtaining it and had no difficulties. Of the two SMEs that did not obtain it, there was a significant impact for one, and no impact for one.

www.british-business-bank.co.uk Slide 48
SMEs, particularly larger ones, are most likely to fund their exports through their own general business cash flow
14%
4%2%
4%8%
14%
24%
74%
No finance needed
Other financeInternal financeExternal loanPersonal credit card
Business credit card
Extended overdraft/credit
line
General business
cashflow
Base = all SME exporters (n=437 in 2015). Question C16 (multi code, prompted)
• Larger SMEs more likely to have their own general business cashflow
Exporters: ways of financing working capital– 2015

www.british-business-bank.co.uk Slide 49
Overseas regulations and the fear of not getting paid are the main barriers to export for both exporters and potential exporters
28%
25%
21%
19%
18%
17%
14%
14%
9%
8%
32%
19%
19%
13%
11%
17%
13%
14%
10%
6%
6%
37%
38%
32%
30%
27%
19%
23%
13%
17%
11%
10%
26%
Overseas regulations
Getting paid
Lack of knowledge
Customs/paperwork
Time to get paid
Language barriers
Lack of internal funds
Protecting IP
Lack of external finance
Cultural differences
No barriers
All
Exporters
Non-exporters
Base = all SME exporters and non-exporters with exportable products/services (n=707 in 2015). Question C20 (multi code, prompted)
Barriers to exporting – 2015

www.british-business-bank.co.uk Slide 50
7) Conclusions

www.british-business-bank.co.uk Slide 51
Conclusions 1
Finance demand and success rate
• 18% applied for external finance in the last 12 months up from 12% in 2014, but at a similar level to 2012.
• Finance is more likely to be sought for working capital in 2015 (53% compared to 33% in 2014), especially for zero employee businesses, with a higher proportion of SMEs seeking grants, credit cards and non-bank loans. The proportion of SMEs seeking bank loans has declined compared to 2014.
• SMEs more likely to consider multiple providers than before (34% in 2015 compared to 27% in 2012), but the main bank is still the most likely first port of call when a finance need is identified.
• Success in obtaining finance from first provider approached appears to have decreased overall compared to 2014, but this is only among those with zero employees. For businesses with employees there has been no change.

www.british-business-bank.co.uk Slide 52
Conclusions 2
Perceptions of raising finance • Although more SMEs perceive raising finance to be difficult rather than easy, the
proportion thinking it is difficult is decreasing compared to previous surveys.
• SMEs are more confident in their abilities to assess finance products offered by own bank but are less confident about assessing other providers’ products and applying for financing generally.
Awareness of different types of finance • Awareness of types of non-bank finance has increased since 2012, especially for
crowd funding and P2P lending.
Growth • A higher proportion of SMEs are now aiming to grow (56%), compared to 46%
in 2014 survey.
• SMEs are optimistic about the future with 44% believing trading conditions will get better in next 12 months.

www.british-business-bank.co.uk
British Business Bank plc is a public limited company registered in England and Wales registration number 08616013, registered office at Foundry House, 3 Millsands, Sheffield, S3 8NH. As the holding company of the group operating under the trading name of British Business Bank, it is a development bank wholly owned by HM Government and is not authorised or regulated by the Prudential Regulation Authority (PRA) or the Financial Conduct Authority (FCA). British Business Bank operates under its own trading name through a number of subsidiaries, one of which is authorised and regulated by the FCA. British Business Finance Ltd (registration number 09091928), British Business Bank Investments Ltd (registration number 09091930) and British Business Financial Services Ltd (registration number 09174621) are wholly owned subsidiaries of British Business Bank plc. These companies are all registered in England and Wales, with their registered office at Foundry House, 3 Millsands, Sheffield, S3 8NH. They are not authorised or regulated by the PRA or FCA. Capital for Enterprise Fund Managers Limited is a wholly owned subsidiary of British Business Bank plc, registered in England and Wales, registration number 06826072, registered office at Foundry House, 3 Millsands, Sheffield, S3 8NH. It is authorised and regulated by the FCA (FRN: 496977).British Business Bank plc and its subsidiary entities are not banking institutions and do not operate as such. A complete legal structure chart for British Business Bank plc and its subsidiaries can be found at www.british-business-bank.co.uk.
BBB 011114 22