2015 back-to-school survey reading, writing, and retail · 2015 back-to-school survey reading ......
TRANSCRIPT

2015 Back-to-School Survey
Reading, writing, and retail
Conducted July 5-8, 2015
1,015 responses

2 Copyright © 2015 Deloitte Development LLC. All rights reserved.
The survey was commissioned by Deloitte and
conducted online by an independent research
company between July 5 and 8, 2015. The survey
polled a sample of 1,015 parents of school-aged
children and has a margin of error for the entire
sample of plus or minus three percentage points.
All respondents had at least one child attending
school in grades K – 12 this fall.
www.deloitte.com/us/2015Back2School
Follow @DeloitteCB
Back2School15#
As used in this document, "Deloitte" means Deloitte LLP and its subsidiaries. Please see www.deloitte.com/us/about for a
detailed description of the legal structure of Deloitte LLP and its subsidiaries. Certain services may not be available to attest
clients under the rules and regulations of public accounting.
About the survey

3 Copyright © 2015 Deloitte Development LLC. All rights reserved.
Total household spending (including children) this
back-to-school season
“Whatis the total amount you [parent] and your children
expect to spend on back-to-school items thisseason?”
$672
$543
$434
$0
$100
$200
$300
$400
$500
$600
$700
2013 2014 2015
• Only 11% of parents intend to make cash purchases – down from a high of 26% in 2010

4 Copyright © 2015 Deloitte Development LLC. All rights reserved.
31% of respondents will complete their back-to-
school shopping after the school year starts
“Whendoyouplantocomplete your back-to-schoolshopping?”
3%
16%
54%
26%
1%
13%
54%
31%
2 months before the school year
1 month before the school year
Less than a month before the schoolyear
After the start of the school year
2014
2015

5 Copyright © 2015 Deloitte Development LLC. All rights reserved.
today”same“theor”better“issituationfinancialtheirsayrespondentsof79%
Consumer sentiment toward economy is unchanged
“Thinkingaboutyourhousehold'sassets(home,
cash, car, etc.) and your liabilities (credit card
bills, mortgage, etc.), is your household's financial
situation today…”
32%
44%
24%
35%
44%
21%
Better than it was ayear ago
The same as it wasa year ago
Worse than it was ayear ago
2014
201535%
48%
16%
31%
49%
20%
Yes No Don't know/noopinion
2014
2015
“Areyou more confident about the U.S.
economy’sprospectsnow(July2015),than
you were at the end of 2014?”

6 Copyright © 2015 Deloitte Development LLC. All rights reserved.
Top 5 concerns respondents have about the U.S.
economyortheirhousehold’sfinancesthatcould
impact their back-to-school shopping
“Which of the following concerns do you have about the U.S.
economy or your household's finances that could hold back your
back-to-school spending?”
64%
44%
55%
42%
28%
33%
60%
46%
40%
40%
29%
28%
0% 10% 20% 30% 40% 50% 60% 70%
Higher food prices
Higher medical bills and/or premiums
Higher energy prices
Personal debt level is still high
Political unrest in other countries
Lack of improvement in the job market
2014
2015

7 Copyright © 2015 Deloitte Development LLC. All rights reserved.
Respondents are modifying their back-to-school
shopping behaviors
“Howareyoulikelytochangethewayyoushopforback-to-school items this season
because of your concerns about the U.S. economy or your household's finances?”
(Percentage point change over the five-year period from 2011-present)
(Among total)
-14%
-5%
-11%
-8%
13% 12%
10%
-15%
-10%
-5%
0%
5%
10%
15%
useI’ll
more store
coupons
I’llbuymore
back-to-scho
olitems“on
sale”
Our
household
will reuse
lastyear’s
school items
rather than
buying new
I’llresearch
more
back-to-scho
ol items
online to find
the best
prices
I’llpurchase
more
back-to-scho
ol items
online, to find
the best
prices I’llshopat
different (less
expensive)
stores than I
usually do
I’llbuymore
lower-priced
back-to-school
items

8 Copyright © 2015 Deloitte Development LLC. All rights reserved.
Among the top school items respondents plan to
purchase, the brick-and-mortar store ranks higher
than online as the channel where they intend to buy
“Pleaseindicateifyouplantobuyin-store or online or both in-store and online.”
[Base: Among those who intend to purchase] Rank/Preference
1
2
3
4
6
5
7
87%
64%
80%
71%
66%
49%
30%
2%
4%
5%
10%
7%
25%
41%
11%
33%
15%
18%
27%
26%
30%
School supplies: Paper, pencils, books, etc.
Clothes
Shoes
Backpack/book bag/lunch box
Jewelry/handbag/personal accessories
Technology devices
Wearable devices
Yes, plan to buy in-store Yes, plan to buy online Yes, both online and in-store
Sorted in order of rank/preference
“Technologydevices”categoryincludesthe average of: computer software/small accessories; notebook or tablet; cell
phone/smart phone; computer - desktop/laptop; printer or other computer hardware; and other personal technology product

9 Copyright © 2015 Deloitte Development LLC. All rights reserved.
“Online”takessolepossessionofsecondplaceforfirsttimeinsurveyhistory
Top 5 shopping destinations this school season
“Inwhat types of retail environments do you plan to do your
back-to-school shopping?”
91%
20%
45%
22% 22%
31%
90%
36%
43%
30% 28% 28%
85%
38% 38%
27% 30% 31%
86%
44% 40%
36% 36% 30%
0%
20%
40%
60%
80%
100%
Discount/valuedepartment stores
Online sites Officesupply/technology
stores
Specialty clothingstores
Off-price stores Traditionaldepartment stores
2012
2013
2014
2015

10 Copyright © 2015 Deloitte Development LLC. All rights reserved.
80%
40%
35%
55%
50%
40%
88%
43%
31% 32%
38%
24%
86%
47% 48%
40%
34% 36%
79%
40%
49%
37%
33% 30%
0%
10%
20%
30%
40%
50%
60%
70%
80%
90%
100%
Discount/valuedepartment stores
Online sites Officesupply/technology
stores
Off-price stores Specialty clothingstores
Traditionaldepartment stores
18 - 29 30 - 44 45 - 60 61 - 74
Younger generations (18-29yearolds)areplanningtoshop“specialtyclothing,”
“off-price,”and“traditionaldepartmentstores”morefrequencythanotherage
groups this back-to-school season
Retail environments to be shopped by age cohort
“Inwhat types of retail environments do you plan to do your
back-to-school shopping?”
11 Copyright © 2015 Deloitte Development LLC. All rights reserved.
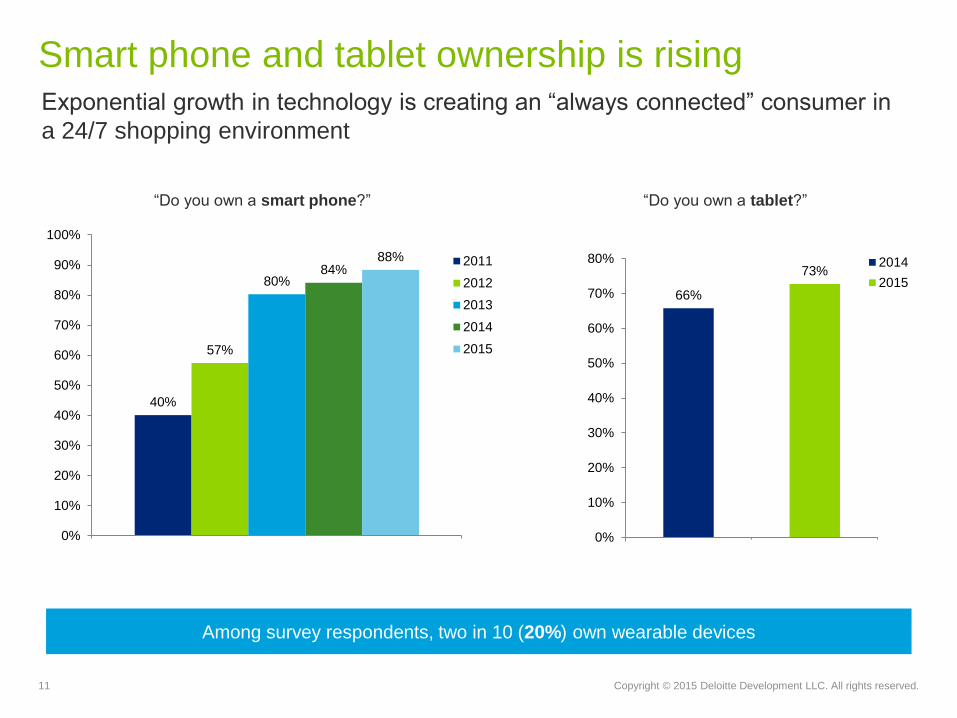
Exponentialgrowthintechnologyiscreatingan“alwaysconnected”consumerin
a 24/7 shopping environment
Smart phone and tablet ownership is rising
40%
57%
80% 84%
88%
0%
10%
20%
30%
40%
50%
60%
70%
80%
90%
100%
2011
2012
2013
2014
2015
“Doyouownasmart phone?”
66%
73%
0%
10%
20%
30%
40%
50%
60%
70%
80%
2014 2015
2014
2015
“Doyouownatablet?”
Among survey respondents, two in 10 (20%) own wearable devices

12 Copyright © 2015 Deloitte Development LLC. All rights reserved.
Smart phone and tablet owners will use their devices
in multiple and varied ways to engage with retailers
“Withregardtoyourback-to-school shopping, for
what purposes would you likely use a smart phone?”
[Base: Among 80% of smart phone owners who plan
to use them for back-to-school shopping] +6 vs. 2014
57%
57%
53%
44%
42%
37%
36%
Get/download discounts,coupons, sale information
Get price information
Get a store location
Access a retailer's website
Get product information
Locate a store that carriesa particular product
Shop online
65%
64%
59%
56%
53%
48%
46%
Shop online
Get priceinformation
Access a retailer'swebsite
Get productinformation
Make a purchase
Readproduct/retailer
reviews
View a retailer's ad
“Withregard to your back-to-school shopping, for what
purposes would you likely use a tablet?”
[Base: Among 53% of tablet owners who plan to use them
for back-to-school shopping]
Answer choices below 46% not represented for 2015 Answer choices below 36% not represented for 2015

13 Copyright © 2015 Deloitte Development LLC. All rights reserved.
Mobile payment and in-store beacons are still an emerging
technology and expect to be used by a small percentage of
respondents this back-to-school season
“Doyouplantouseamobilepaymentordigitalwalletservice to
complete a purchase this back-to-schoolseason?”
No 93%
Yes
7%
• Among smart phone
owners, 9% plan to
engage with in-store
beacon technology to a
greater extent than last
year while back-to-
school shopping
• Only half (49%) of
respondents know what
in-store beacon
technology is.
16% of respondents will engage with in-store beacon technology this back-to-school season

14 Copyright © 2015 Deloitte Development LLC. All rights reserved.
Social media is of declining importance to back-to-
school shoppers
35%
22% 21%
18%
10%
0%
5%
10%
15%
20%
25%
30%
35%
40%
2011 2012 2013 2014 2015
“Doyou plan to use social media sites to assist in your
back-to-school shopping?”

15 Copyright © 2015 Deloitte Development LLC. All rights reserved.
65%
55%
53%
51%
44%
33%
68%
54%
52%
50%
40%
28%
I am concerned about the protection of my personal data whenshopping online
I am more concerned about the protection of my personal data whenshopping online than one year ago
I am concerned about shopping at retailers that have experienced adata breach
I am concerned about the protection of my personal data whenshopping in the physical store
I am more likely to shop at a retailer who provides me educationsurrounding the security of my personal data
I will use a different form of payment when shopping as a result of adata breach
2014
2015
% who agree or somewhat agree
Respondents are concerned about the protection of
their personal data

16 Copyright © 2015 Deloitte Development LLC. All rights reserved.
Trends impacting school buying: From school lists to
freeshipping,and“buyonline,pickupinstore”
69% My back-to-schoolshoppingisinfluencedmorebytheschool’srecommendedproductlistthanmy
children’srequests
66% I am more likely to purchase from online retailers who offer free shipping during the back-to-school
shopping season
38% The back-to-school shopping season is less important to my family because we replenish school supplies
throughout the year and feel less need to stock up
32% I’mbuyingfewertraditionalschoolsupplies(i.e.,pencils,crayons,notebooks)becausemychildrenare
using more digital technologies like tablets/computers in and out of the classroom
17% I will shop physical stores less this back-to-schoolseasonbecausetheoptionto“buyonline,pickupin
store”ismoreconvenient
% who agree or somewhat agree
2015 Back-to-College Survey
Reading, writing, and retail
Conducted July 5-13, 2015
450 responses

18 Copyright © 2015 Deloitte Development LLC. All rights reserved.
The survey was commissioned by Deloitte
and conducted online by an independent
research company between July 5 and 13,
2015. The survey polled a sample of 450
parents of college children and has a
margin of error for the entire sample of plus
or minus five percentage points.
All respondents had at least one child
attending college this fall.
About the survey

19 Copyright © 2015 Deloitte Development LLC. All rights reserved.
Families (including children) will spend on average $1,313 this back-to-college
season – an increase of $90 from 2014
Collegefamilies’averagecombinedspending
“Whatisthetotalamountyou [parent] and your children
expect to spend on back-to-collegeitemsthisseason?”
$1,360
$1,223
$1,313
$1,150
$1,200
$1,250
$1,300
$1,350
$1,400
2013 2014 2015

20 Copyright © 2015 Deloitte Development LLC. All rights reserved. Items below 57% not presented in this chart for 2015
“Whichback-to-college items will you or your children be
purchasing this season?”
85%
82%
61%
61%
55%
84%
79%
62%
61%
57%
0% 20% 40% 60% 80% 100%
College supplies: Textbooks, calculator, etc.
Clothes
Shower and bathing items
Shoes
Dorm accessories and supplies: Bedding,storage solutions, etc.
2014
2015
College supplies, clothes and shower and bathing items rank 1-2-3, respectively
Top 5 college items most in demand

21 Copyright © 2015 Deloitte Development LLC. All rights reserved.
“Inwhat type(s) of retail environment(s) do you plan to do your
back-to-college shopping?”
Retail environment below 40% not presented in this chart for 2015
77%
62%
44%
40%
32%
74%
62%
43%
41%
40%
0% 20% 40% 60% 80% 100%
Discount/value department stores
Book stores/university stores
Internet, excluding auction sites
Office supply/technology stores
Home furnishings and housewares stores
2014
2015
Respondents expect to take on average 5 shopping trips when purchasing back-to-college items
Top 5 retail environments where consumers plan to
do their back-to-college shopping

22 Copyright © 2015 Deloitte Development LLC. All rights reserved.
Female respondents plan to be more price/budget conscious, prefer more flexible
shopping options; male respondents will purchase more online to find best prices
Gender differences in college buying behaviors
% who agree or somewhat agree
49%
48% 58%
62%
62% 58%
86% of college students will likely buy more used textbooks or textbook rentals to help stretch their
back-to-college spending budget
I will only shop in stores that offer sales this back-to-college season
I will purchase more items online to find the best
prices this back-to-college shopping season
I prefer to purchase from those retailers that offer an option to buy online/pick-
up in-store or buy online/return to store this back-to-college season
77%
I will seek more discounts, coupons, and deals when
back-to-college shopping this season 72%

23 Copyright © 2015 Deloitte Development LLC. All rights reserved.
“Smartphone”and“tablet”usershaveincreasedinparentgroup,however,
“digitalcamera”usershavedecreasedinchildrencategory
Electronic devices owned by parent and children
“Which of the following electronic devices
do you [parent] own?”
Wearable device data not available for 2014
“Which of the following electronic devices
does your college going children own?”
93%
80%
76%
52%
32%
93%
88%
71%
62%
37%
20%
0% 20% 40% 60% 80% 100%
Computer – Desktop/laptop
Smart phone
Digital camera
Tablet
E-reader
Wearable device (Apple Watch,Fitbit, etc.)
2014
2015
89%
84%
32%
45%
17%
90%
88%
37%
34%
16%
10%
0% 20% 40% 60% 80% 100%
Smart phone
Computer – Desktop/laptop
Tablet
Digital camera
E-reader
Wearable device (Apple Watch,Fitbit, etc.)
2014
2015
Wearable device Wearable device

24 Copyright © 2015 Deloitte Development LLC. All rights reserved.
Sources of college shopping advice for parents and
children this back-to-college season
“In general, where are you [parent] and your children most likely to get back-to-
college shopping advice?”
Sorted in order of parents; options below 9% for parents not presented
55% 54%
46%
39%
24% 22%
14% 13% 13%
10% 9%
53%
42%
74%
38%
17%
51%
26%
4% 8%
11% 8%
0%
10%
20%
30%
40%
50%
60%
70%
80%
From thecollege/university
itself
Online (i.e.,blogs, onlinereviews, etc.)
Friends Family members In-store productdisplays
Social media Mobile phone Newspapers Catalogs Television Magazines
Parent
Children

25 Copyright © 2015 Deloitte Development LLC. All rights reserved.
2 in 5 (43%) families plan to use social media sites in
their back-to-college shopping
“Doyou or your children plan to use social media sites to assist in your
back-to-college shopping?”
42% 44% 43%
0%
5%
10%
15%
20%
25%
30%
35%
40%
45%
50% 2013
2014
2015
Trend for the use of social media remains the same compared to last two years

26 Copyright © 2015 Deloitte Development LLC. All rights reserved.
Almost half (47%) of respondents indicated that their
college-going child owns at least one credit card
“How many credit cards do your college-going children own?”
63%
32%
4%
1%
59%
37%
4%
0%
52%
38%
7%
2%
0% 10% 20% 30% 40% 50% 60% 70%
0
1
2
3 or more
2013
2014
2015

27 Copyright © 2015 Deloitte Development LLC. All rights reserved.
Shopping time has shifted to “lateAugust”insmall
proportion as compared with last two years
“Whenareyoulikelytodothemajority of your back-to-college shopping?”
19%
60%
19%
2%
0%
19%
62%
17%
2%
0%
18%
55%
24%
2%
1%
0% 10% 20% 30% 40% 50% 60% 70%
July
Early August
Late August
September
October
2013
2014
2015
51% of parents will complete their college shopping less than a month before the college year starts

This publication contains general information only and is based on the experiences and research of Deloitte practitioners. Deloitte is not, by means of this publication, rendering business, financial, investment, or
other professional advice or services. This publication is not a substitute for such professional advice or services, nor should it be used as a basis for any decision or action that may affect your business. Before
making any decision or taking any action that may affect your business, you should consult a qualified professional advisor. Deloitte, its affiliates, and related entities shall not be responsible for any loss sustained
by any person who relies on this publication.
Copyright © 2015 Deloitte Development LLC. All rights reserved.
Member of Deloitte Touche Tohmatsu Limited
www.deloitte.com/us/2015Back2School
Follow @DeloitteCB
#Back2School15