2015 3q colliers asia pacific office market
TRANSCRIPT

Economic Overview After a series of easing monetary policy moves, the slowdown in China’s economy seems to be starting to stabilize in the first half of 2015. However, downside risks such as the heightened volatility in the stock markets, strong capital outflows and overcapacity in some sectors have put pressure on the economic growth, derailing authorities’ efforts to rebalance the Chinese economy towards consumption and services. As a consequence, the World Banks has trimmed China’s growth forecast to 6.9% this year, below the government’s target of 7%. Meanwhile, in the US, the Federal Reserve had decided not to raise its key interest rate at its October meeting. This decision has been seen as to ease pressure on financial markets across emerging markets on the short term, but at the same time, it has been prolonging uncertainty regarding the timing of the Fed’s first rate hike.
Leasing Market Hiring environment turned slightly more conservative than the first half of this year with the majority of employers in China, Hong Kong and Singapore intending to keep headcount steady in the second half of 2015. According to the latest Hudson report, technology and IT sectors continues to be the most active tenant sector in the region. Other notable sectors include professional services and manufacturing while financial corporates are also expanding selectively with most multinational corporates still cautious. Of the major markets, Hong Kong achieved the strongest quarter-on-quarter (QoQ) growth of 3.9% supported by demand from mainland Chinese financial firms for office premises in Central. This is being followed by Bangkok (2.2% QoQ) and Bengaluru (1.8% QoQ). Rents fell by in Yangon (-2.5% QoQ), Chengdu (-2.2% QoQ) and Shenzhen (-2.0% QoQ) as landlords started lowering rents in view of the large impending supply. Grade A office completions are expected to grow around 100 million sq ft in 2016, with around 70% of the total in China and India.
Sales Market Despite the slower economic growth in China, office real estate investment in Asia came in at US$4.4 billion in 3Q 2015, up 54.3% year-on-year (YoY) from US$2.9 billion the same times last year. Sentiment is improving for core assets in China’s first-tier cities with Shanghai most in demand accounting for 51% of transactions including a couple of en-bloc transactions with the focus primarily on office properties. Investors who previously ventured into the secondary and tertiary markets have focused their radar back to Shanghai as the market tends to be the most liquid and transparent in China. In addition the market offer more stock for sale compared to Beijing with more than 600,000 sq m office supply coming on stream in 2015 and another 790 million sq m by the end of 2016. Cross-border investors continue to be very active with outbound investors showing an unwavering preference for Grade A offices in the core business districts of gateway cities, such as New York, London, Sydney and Melbourne.
Market Outlook While remaining the world’s growth leader in terms of economic growth, Asia Pacific is expected to grow slightly less in 2016. According to the International Monetary Fund, growth in the Asia Pacific markets is expected to hold steady at 5.6% for the full year and to ease slightly to 5.5% in 2016. While growth in India picked up being supported by a healthy monsoon and new investments assuming concrete progress on reform, slowing growth in several large economies, including China, Indonesia and Japan was a counterweight. Going forward, domestic demand and ongoing low oil prices should continue to drive growth in the region over the medium term. However, economic dynamics in Asia will mostly be determined by developments in China. At the same time, we may see increased market turbulence before year end should the US Fed decide to finally move on interest rates.
Asia Pacific
Office Market
Asia Pacific | Office
3Q 2015
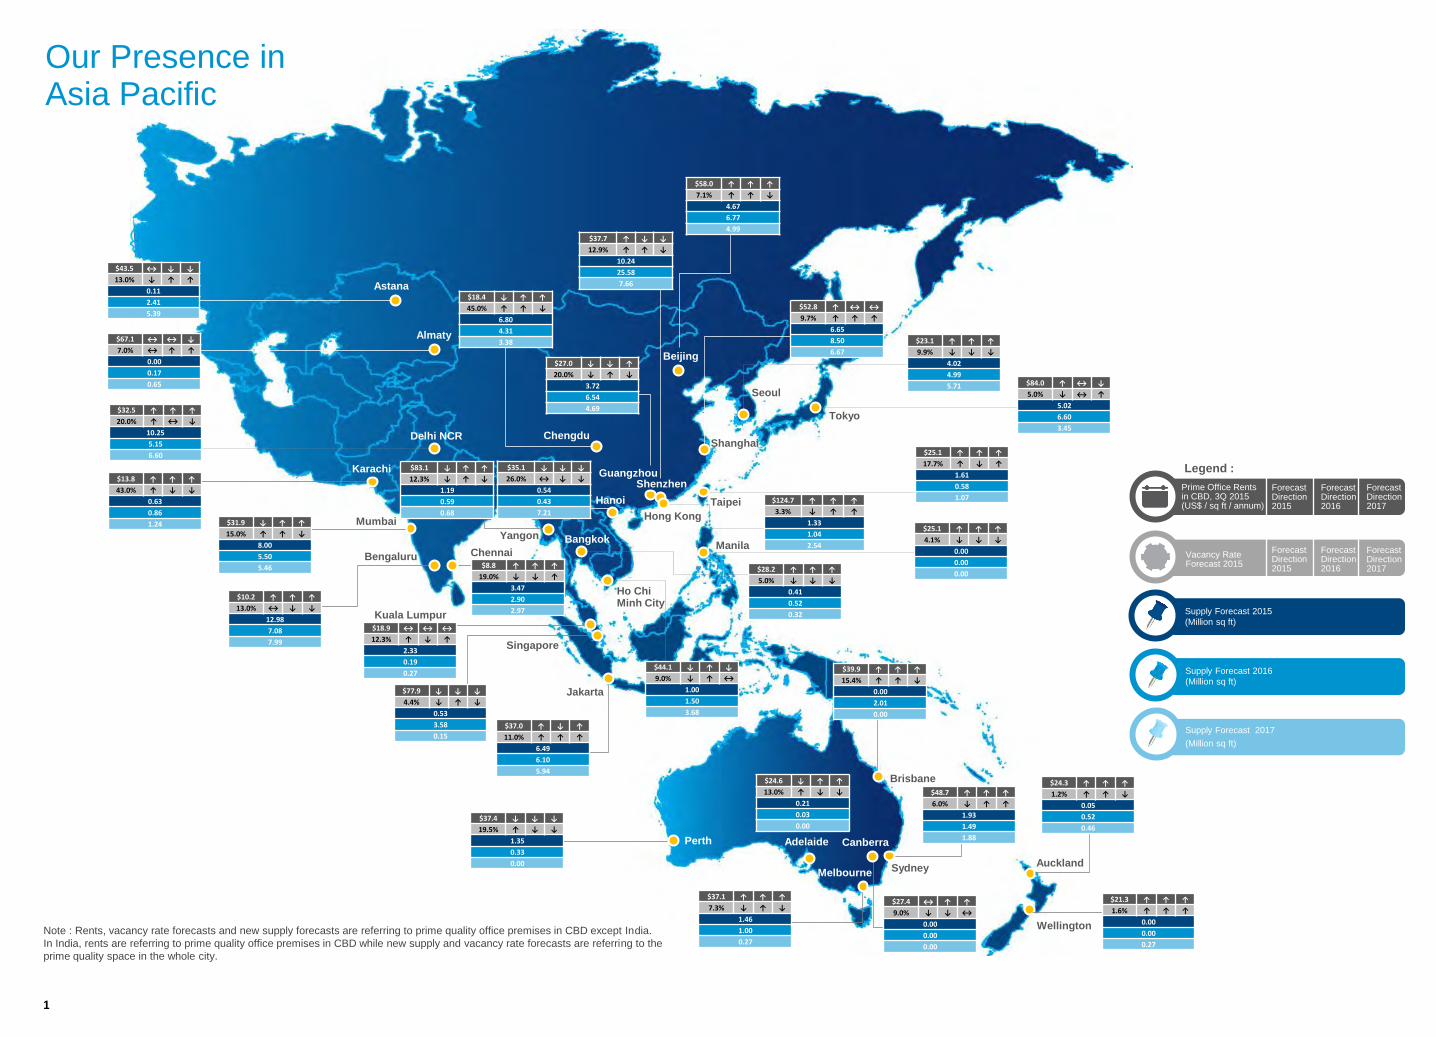
Our Presence in Asia Pacific
1
Mumbai
Bengaluru
Karachi
Kuala Lumpur
Singapore
Ho Chi Minh City
Yangon
Chennai
Wellington
Auckland Sydney
Brisbane
Canberra Perth Adelaide
Melbourne
Almaty
Jakarta
Delhi NCR
Manila
Taipei
Tokyo
Seoul
Beijing
Hong Kong
Shanghai Chengdu
Hanoi
Bangkok
Note : Rents, vacancy rate forecasts and new supply forecasts are referring to prime quality office premises in CBD except India.
In India, rents are referring to prime quality office premises in CBD while new supply and vacancy rate forecasts are referring to the
prime quality space in the whole city.
Supply Forecast 2015
(Million sq ft)
Legend :
Supply Forecast 2016
(Million sq ft)
Prime Office Rents in CBD, 3Q 2015 (US$ / sq ft / annum)
Forecast Direction 2015
Vacancy Rate Forecast 2015
Forecast Direction 2015
Forecast Direction 2016
Forecast Direction 2016
Astana
Supply Forecast 2017
(Million sq ft)
$67.1 ↔ ↔ ↓
7.0% ↔ ↑ ↑
0.00
0.17
0.65
$13.8 ↑ ↑ ↑
43.0% ↑ ↓ ↓
0.63
0.86
1.24 $31.9 ↓ ↑ ↑
15.0% ↑ ↑ ↓
8.00
5.50
5.46
$10.2 ↑ ↑ ↑
13.0% ↔ ↓ ↓
12.98
7.08
7.99
$8.8 ↑ ↑ ↑
19.0% ↓ ↓ ↑
3.47
2.90
2.97
$77.9 ↓ ↓ ↓
4.4% ↓ ↑ ↓
0.53
3.58
0.15
$37.0 ↑ ↓ ↑
11.0% ↑ ↑ ↑
6.49
6.10
5.94
$58.0 ↑ ↑ ↑
7.1% ↑ ↑ ↓
4.67
6.77
4.99
$27.0 ↓ ↓ ↑
20.0% ↓ ↑ ↓
3.72
6.54
4.69
$18.4 ↓ ↑ ↑
45.0% ↑ ↑ ↓
6.80
4.31
3.38
$52.8 ↑ ↔ ↔
9.7% ↑ ↑ ↑
6.65
8.50
6.67
$23.1 ↑ ↑ ↑
9.9% ↓ ↓ ↓
4.02
4.99
5.71 $84.0 ↑ ↔ ↓
5.0% ↓ ↔ ↑
5.02
6.60
3.45
$25.1 ↑ ↑ ↑
17.7% ↑ ↓ ↑
1.61
0.58
1.07
$28.2 ↑ ↑ ↑
5.0% ↓ ↓ ↓
0.41
0.52
0.32
$39.9 ↑ ↑ ↑
15.4% ↑ ↑ ↓
0.00
2.01
0.00
$37.4 ↓ ↓ ↓
19.5% ↑ ↓ ↓
1.35
0.33
0.00
$37.1 ↑ ↑ ↑
7.3% ↓ ↑ ↓
1.46
1.00
0.27
$24.3 ↑ ↑ ↑
1.2% ↑ ↑ ↓
0.05
0.52
0.46
$48.7 ↑ ↑ ↑
6.0% ↓ ↑ ↑
1.93
1.49
1.88
$24.6 ↓ ↑ ↑
13.0% ↑ ↓ ↓
0.21
0.03
0.00
$18.9 ↔ ↔ ↔
12.3% ↑ ↓ ↑
2.33
0.19
0.27
Forecast Direction 2017
Forecast Direction 2017
$27.4 ↔ ↑ ↑
9.0% ↓ ↓ ↔
0.00
0.00
0.00
$83.1 ↓ ↑ ↑
12.3% ↓ ↑ ↓
1.19
0.59
0.68
$25.1 ↑ ↑ ↑
4.1% ↓ ↓ ↓
0.00
0.00
0.00
Guangzhou Shenzhen
$37.7 ↑ ↓ ↓
12.9% ↑ ↑ ↓
10.24
25.58
7.66
$124.7 ↑ ↑ ↑
3.3% ↓ ↑ ↑
1.33
1.04
2.54
$21.3 ↑ ↑ ↑
1.6% ↑ ↑ ↑
0.00
0.00
0.27
$35.1 ↓ ↓ ↓
26.0% ↔ ↓ ↓
0.54
0.43
7.21
$44.1 ↓ ↑ ↓
9.0% ↓ ↑ ↔
1.00
1.50
3.68
$32.5 ↑ ↑ ↑
20.0% ↑ ↔ ↓
10.25
5.15
6.60
$43.5 ↔ ↓ ↓
13.0% ↓ ↑ ↑
0.11
2.41
5.39
Copyright © 2015 Colliers International.
The information contained herein has been obtained from sources deemed reliable. While every reasonable effort has been made to
ensure its accuracy, we cannot guarantee it. No responsibility is assumed for any inaccuracies. Readers are encouraged to consult
their professional advisors prior to acting on any of the material contained in this report.
$2.3 billion in
annual revenue
502 offices in 67 countries on 6 continents
United States:
Canada:
Latin America:
Asia:
ANZ:
EMEA:
Authors:
Simon Lo
Executive Director | Asia
+852 2822 0511
Jessy Chung
Assistant Manager
+852 2822 0643
140
31
24
39
160
108
$1.70 billion square feet
under management
16,300 Professional
and staff
ASIA
Sam Harvey-Jones
+852 2822 0509
NORTH ASIA
Mainland China
Beijing
Kelvin Chow
+86 10 8518 1633 ext.113
Shanghai
Michael Wu
+86 21 6141 3638
Guangzhou
Eric Lam
+86 20 3819 3988
Shenzhen
Ken Kan
+86 755 8825 8648
Chengdu
Bonnie Chiu
+86 28 8658 6288 ext.810
Hong Kong, HKSAR
Hong Kong
Wendy Lau
+852 2822 0550
(E-141423)
Kowloon
Fiona Ngan
+852 2117 3301
(E-197789)
Japan
Tokyo
Katsuji Tokita
+81 3 5563 2117
South Korea
Seoul
Jay Yun
+82 2 3775 7351
Taiwan
Taipei
Amanda Yang
+886 2 8101 1120
SOUTH EAST ASIA
Indonesia
Jakarta
Bagus Adikusumo
+62 21 521 1400 ext.506
Malaysia
Sam Harvey-Jones
+852 2822 0509
*Based in Hong Kong
Kuala Lumpur
Research data provided by
C H Williams Talhar & Wong
Sdn Bhd
URL : http://www.wtw.com.my
Foo Gee Jen
+603 2616 8888
Philippines
Manila
Jie Espinosa
+632 888 9988 ext.4016
Singapore
Singapore
Calvin Yeo
+65 6531 8671
Thailand
Bangkok
Nattawan Radomyos
+66 2 656 7000
Vietnam
Ho Chi Minh City
Nhung Quan
+84 8 3827 5665
Hanoi
Tri Nhan Nguyen
+84 8 3827 5665
Myanmar
Yangon
Tony Picon
+95 931 491 678
SOUTH ASIA
India
George McKay
+91 22 4050 4553
Vikas Kalia
+91 12 4456 7531
Bengaluru
Goutam Chakraborty
+91 80 4079 5500
Chennai
Shaju Thomas
+91 44 2836 1064
Gurgaon
Vikas Kalia
+91 12 4456 7531
Kolkata
Swapan Dutta
+91 12 4437 5807
Mumbai
Nishith Agarwal
+91 22 4050 4556
New Delhi
Vikas Kalia
+91 12 4456 7531
Pune
Rishav Vij
+91 20 4120 6438
Pakistan
Karachi
S. Fazal Ahmad
+92 21 3561 2550 2
Lahore, Faisalabad
Naveed Khan
+92 42 3662 3312 8 (Lahore)
+92 41 2540 501 4 (Faisalabad)
Kazakhstan
Almaty
Bayan Kuatova
+7 727 311 54 43
AUSTRALIA
Melbourne
Simon Hunt
+61 3 9612 8818
NEW ZEALAND
Auckland
Rob Bird
+64 9 356 8803
Wellington
Jim Pinson
+64 4 470 3917
For further details, please contact: