©2014 lean analytics associationlean-analytics.org/wp-content/uploads/2016/09/laa... · ©2014...
TRANSCRIPT
©2014 LEAN ANALYTICS ASSOCIATION
©2014 LEAN ANALYTICS ASSOCIATION
2
Lean Product Development for competitive innovation Lean thinking is a continuous improvement philosophy which has been applied to manufacturing and has proved to provide significant benefits to companies around the world. It aims at doing more with less: less human effort, less equipment, less time, and less space while coming closer to providing customers with what they really want.
The main objective of lean thinking is to eliminate waste and create value for the customer
In recent years there has been an increasing interest in applying lean thinking to product development. Companies face diverse challenges in order to be more competitive in their innovation cycles. The highly competitive business environment requires them to:
- Reduce cycle times to improve time-to-market; - Offer a wider variety of innovative products to satisfy different market needs; - Increase the success rate of product innovations to be more competitive.
Hence, implementing lean thinking related tools and principles is a promising way to overcome these latter challenges. As a result, several companies have started to implement lean principles. However, they face another critical challenge: To understand how much progress have they achieved by implementing lean thinking in product development? Designing and adopting a performance measurement system for lean thinking implementation in any organisation, and particularly in the new product development area, is more complex that what it seems. Some frameworks have been proposed but there is still no assessment tool available in the market which can be easily used by companies to: 1. Obtain their readiness level for lean product development process; 2. Identify the progress achieved after carrying out implementation efforts over a certain
period and discover the gaps; 3. Use the outcomes to prioritise needs according to the business strategy and develop a
roadmap. The following sections provide the insights of the SMART Self Assessment tool that enables firms to understand their current maturity level and to track their progress during their lean product transformation journey.
©2014 LEAN ANALYTICS ASSOCIATION
3
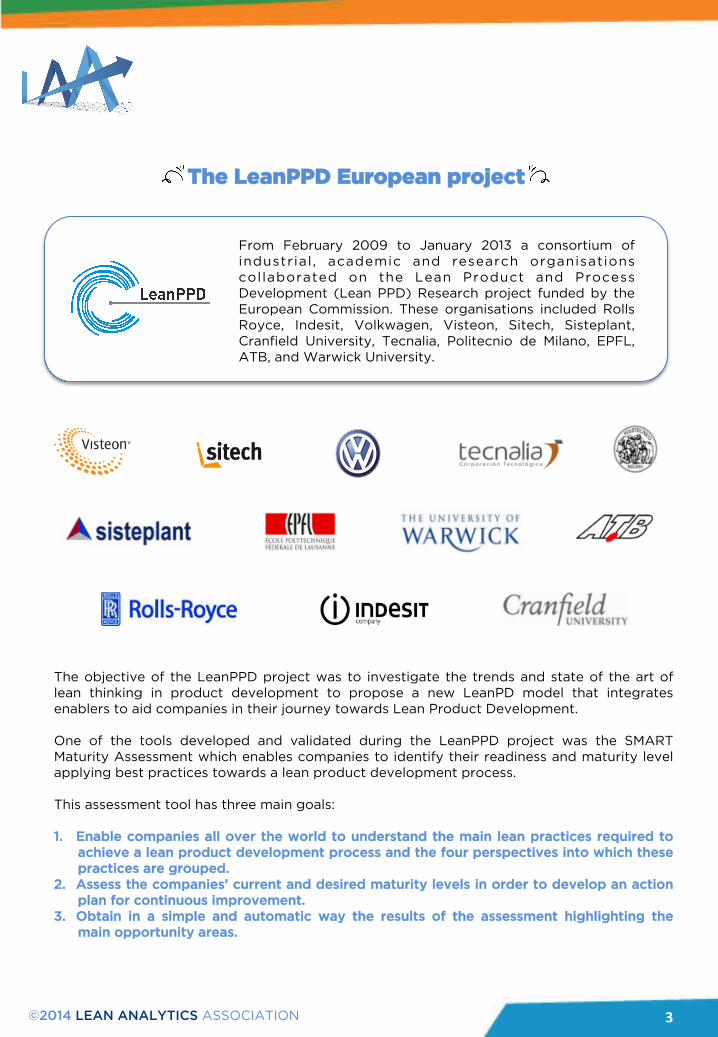
The LeanPPD European project
From February 2009 to January 2013 a consortium of industrial , academic and research organisations collaborated on the Lean Product and Process Development (Lean PPD) Research project funded by the European Commission. These organisations included Rolls Royce, Indesit, Volkwagen, Visteon, Sitech, Sisteplant, Cranfield University, Tecnalia, Politecnio de Milano, EPFL, ATB, and Warwick University.
The objective of the LeanPPD project was to investigate the trends and state of the art of lean thinking in product development to propose a new LeanPD model that integrates enablers to aid companies in their journey towards Lean Product Development. One of the tools developed and validated during the LeanPPD project was the SMART Maturity Assessment which enables companies to identify their readiness and maturity level applying best practices towards a lean product development process. This assessment tool has three main goals: 1. Enable companies all over the world to understand the main lean practices required to
achieve a lean product development process and the four perspectives into which these practices are grouped.
2. Assess the companies’ current and desired maturity levels in order to develop an action plan for continuous improvement.
3. Obtain in a simple and automatic way the results of the assessment highlighting the main opportunity areas.
©2014 LEAN ANALYTICS ASSOCIATION
4
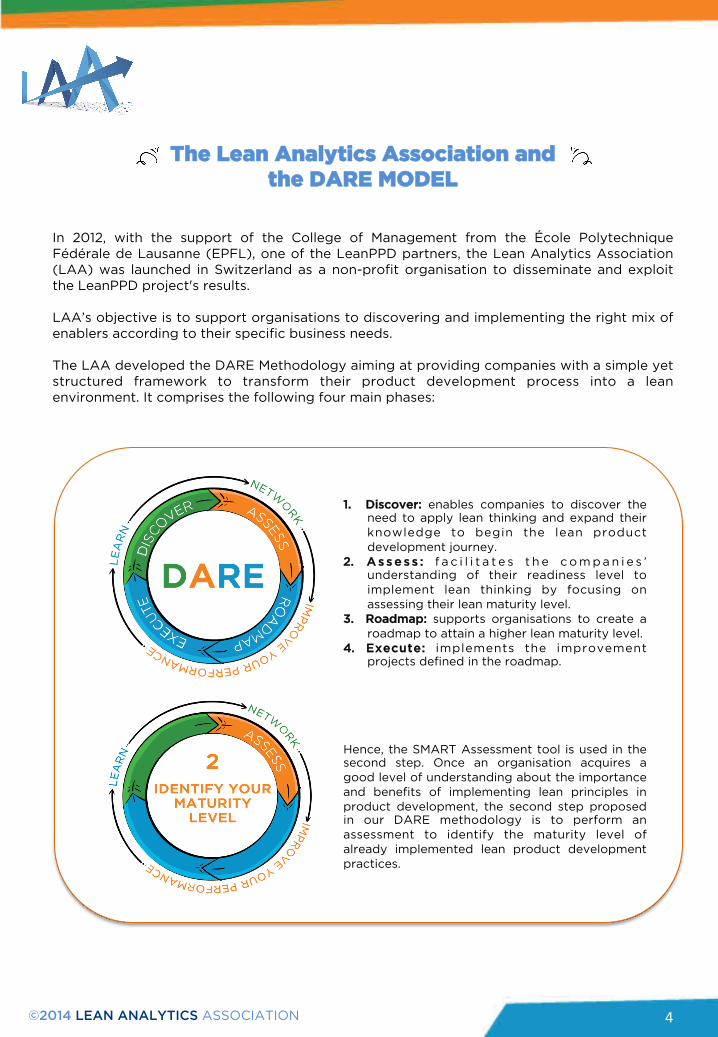
The Lean Analytics Association and the DARE MODEL
In 2012, with the support of the College of Management from the École Polytechnique Fédérale de Lausanne (EPFL), one of the LeanPPD partners, the Lean Analytics Association (LAA) was launched in Switzerland as a non-profit organisation to disseminate and exploit the LeanPPD project's results. LAA’s objective is to support organisations to discovering and implementing the right mix of enablers according to their specific business needs. The LAA developed the DARE Methodology aiming at providing companies with a simple yet structured framework to transform their product development process into a lean environment. It comprises the following four main phases:
1. Discover: enables companies to discover the need to apply lean thinking and expand their knowledge to begin the lean product development journey.
2. A s s e s s : f a c i l i t a t e s t h e c o m p a n i e s ’ understanding of their readiness level to implement lean thinking by focusing on assessing their lean maturity level.
3. Roadmap: supports organisations to create a roadmap to attain a higher lean maturity level.
4. Execute: implements the improvement projects defined in the roadmap.
Hence, the SMART Assessment tool is used in the second step. Once an organisation acquires a good level of understanding about the importance and benefits of implementing lean principles in product development, the second step proposed in our DARE methodology is to perform an assessment to identify the maturity level of already implemented lean product development practices.
©2014 LEAN ANALYTICS ASSOCIATION
5
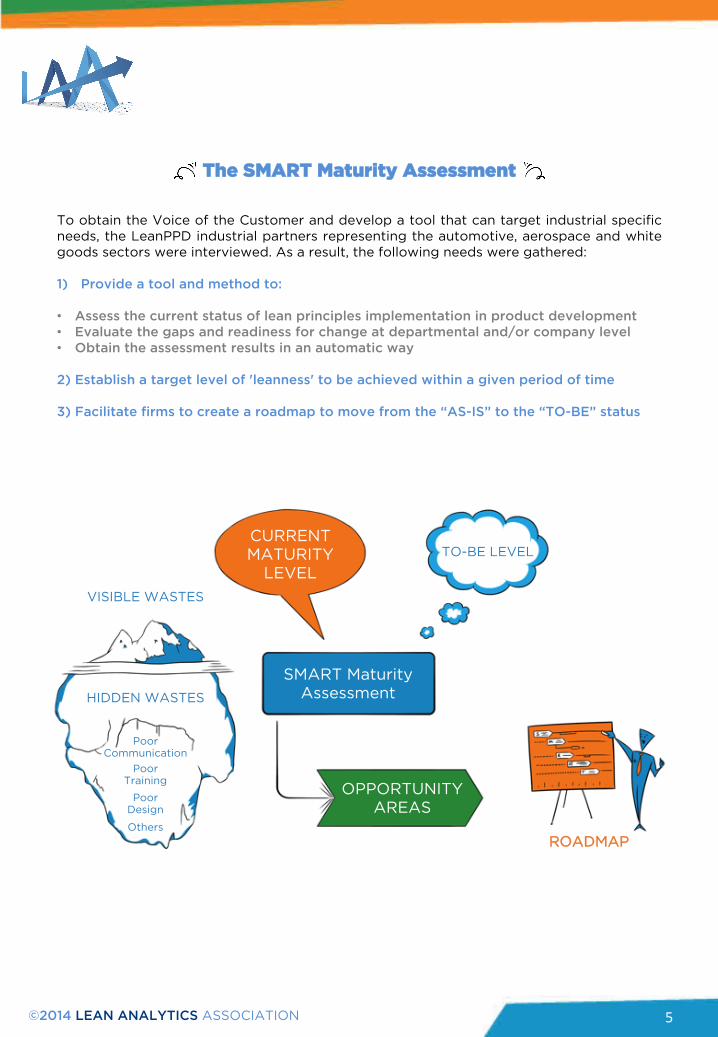
The SMART Maturity Assessment To obtain the Voice of the Customer and develop a tool that can target industrial specific needs, the LeanPPD industrial partners representing the automotive, aerospace and white goods sectors were interviewed. As a result, the following needs were gathered: 1) Provide a tool and method to: • Assess the current status of lean principles implementation in product development • Evaluate the gaps and readiness for change at departmental and/or company level • Obtain the assessment results in an automatic way 2) Establish a target level of 'leanness' to be achieved within a given period of time 3) Facilitate firms to create a roadmap to move from the “AS-IS” to the “TO-BE” status
VISIBLE WASTES
HIDDEN WASTES
CURRENT MATURITY
LEVEL
SMART Maturity Assessment
OPPORTUNITY AREAS
TO-BE LEVEL
ROADMAP
Poor Communication
Poor Training
Poor Design
Others
©2014 LEAN ANALYTICS ASSOCIATION
6
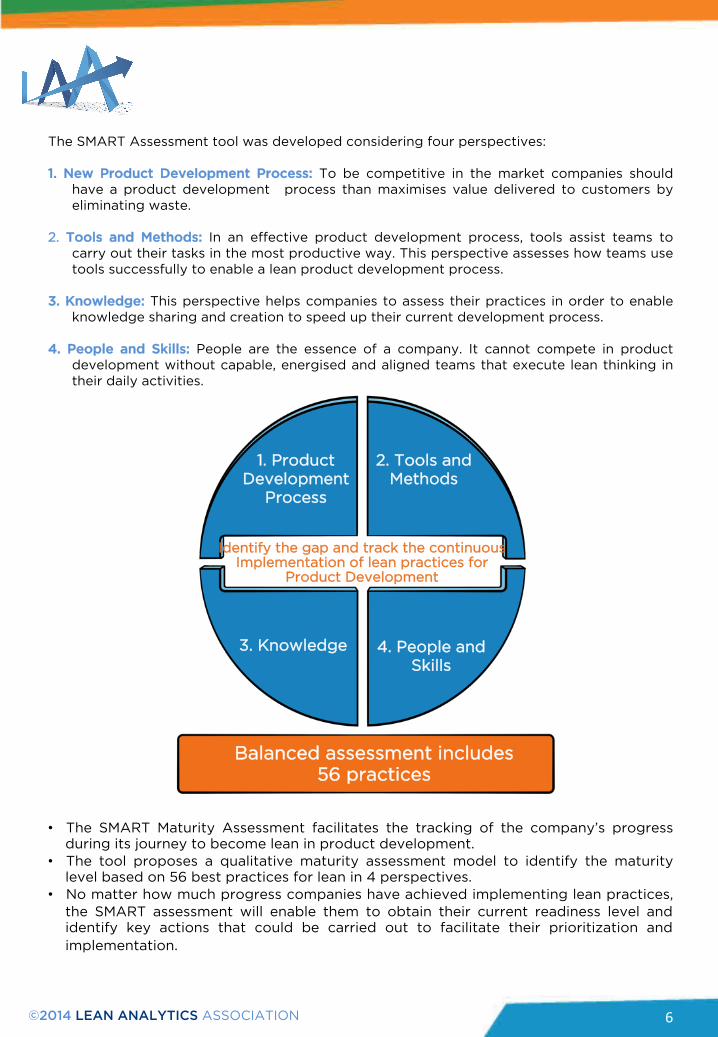
The SMART Assessment tool was developed considering four perspectives: 1. New Product Development Process: To be competitive in the market companies should
have a product development process than maximises value delivered to customers by eliminating waste.
2. Tools and Methods: In an effective product development process, tools assist teams to
carry out their tasks in the most productive way. This perspective assesses how teams use tools successfully to enable a lean product development process.
3. Knowledge: This perspective helps companies to assess their practices in order to enable
knowledge sharing and creation to speed up their current development process.
4. People and Skills: People are the essence of a company. It cannot compete in product development without capable, energised and aligned teams that execute lean thinking in their daily activities.
• The SMART Maturity Assessment facilitates the tracking of the company’s progress during its journey to become lean in product development.
• The tool proposes a qualitative maturity assessment model to identify the maturity level based on 56 best practices for lean in 4 perspectives.
• No matter how much progress companies have achieved implementing lean practices, the SMART assessment will enable them to obtain their current readiness level and identify key actions that could be carried out to facilitate their prioritization and implementation.
Balanced assessment includes 56 practices
1. Product Development
Process
2. Tools and Methods
3. Knowledge 4. People and Skills
Identify the gap and track the continuous Implementation of lean practices for
Product Development
©2014 LEAN ANALYTICS ASSOCIATION
7
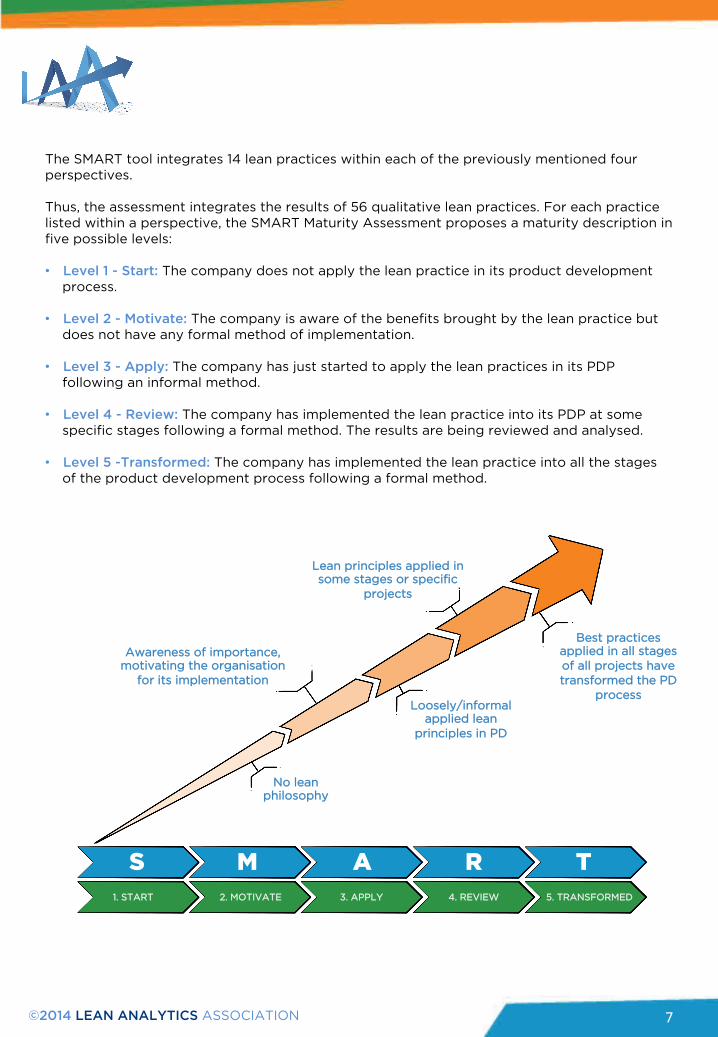
The SMART tool integrates 14 lean practices within each of the previously mentioned four perspectives. Thus, the assessment integrates the results of 56 qualitative lean practices. For each practice listed within a perspective, the SMART Maturity Assessment proposes a maturity description in five possible levels: • Level 1 - Start: The company does not apply the lean practice in its product development
process.
• Level 2 - Motivate: The company is aware of the benefits brought by the lean practice but does not have any formal method of implementation.
• Level 3 - Apply: The company has just started to apply the lean practices in its PDP following an informal method.
• Level 4 - Review: The company has implemented the lean practice into its PDP at some specific stages following a formal method. The results are being reviewed and analysed.
• Level 5 -Transformed: The company has implemented the lean practice into all the stages of the product development process following a formal method.
S M A R T1. START 2. MOTIVATE 3. APPLY 4. REVIEW 5. TRANSFORMED
No lean philosophy
Loosely/informal applied lean
principles in PD
Best practices applied in all stages of all projects have transformed the PD
process
Lean principles applied in some stages or specific
projects
Awareness of importance, motivating the organisation
for its implementation
©2014 LEAN ANALYTICS ASSOCIATION
8
Performing a SMART Maturity Assessment for Lean Product Development
To perform the assessment of each of the 56 practices, a score from 1 to 5 will be assigned for each of the following: 1. Current maturity level (AS-IS level) 2. Desired maturity level in the near future (TO-BE level) based on the plans to become lean
for product and process development. 3. Relevance level based on the importance that the practice has for the organisation. The
relevance must be provided in a scale from 1 to 5, depending on the company’s specific strategy. The scale to be used is:
1 = Not at all relevant 2 = Somehow relevant 3 = Relevant 4 = Considerably relevant 5 = Critical
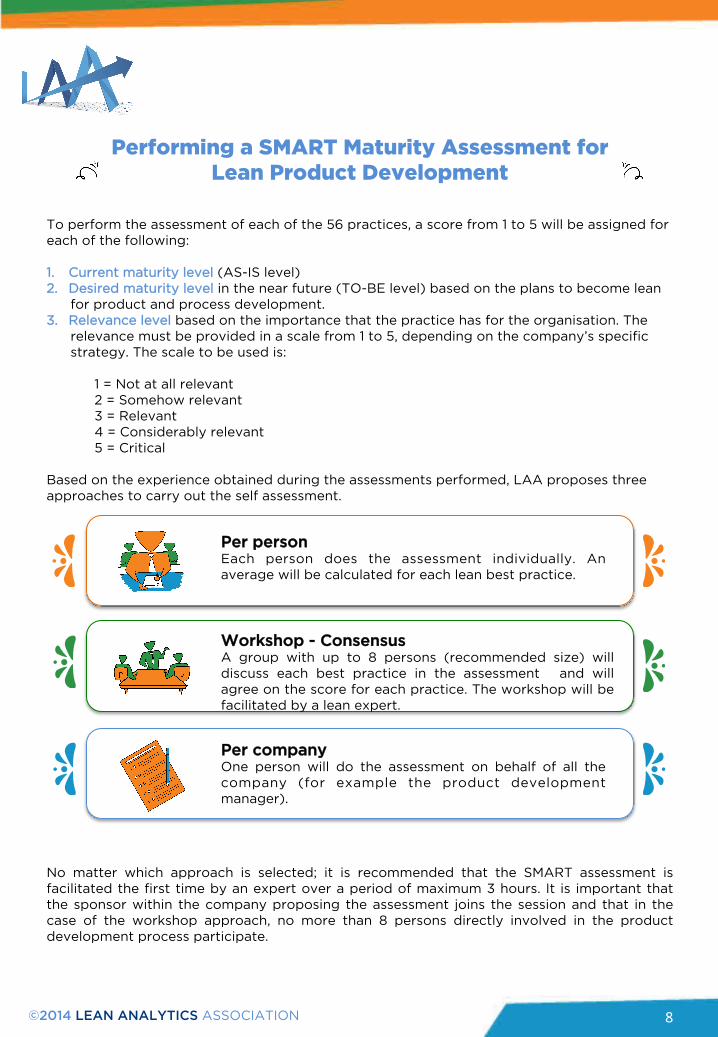
Based on the experience obtained during the assessments performed, LAA proposes three approaches to carry out the self assessment.
Per person Each person does the assessment individually. An average will be calculated for each lean best practice.
Workshop - Consensus A group with up to 8 persons (recommended size) will discuss each best practice in the assessment and will agree on the score for each practice. The workshop will be facilitated by a lean expert.
Per company One person will do the assessment on behalf of all the company (for example the product development manager).
No matter which approach is selected; it is recommended that the SMART assessment is facilitated the first time by an expert over a period of maximum 3 hours. It is important that the sponsor within the company proposing the assessment joins the session and that in the case of the workshop approach, no more than 8 persons directly involved in the product development process participate.
©2014 LEAN ANALYTICS ASSOCIATION
9
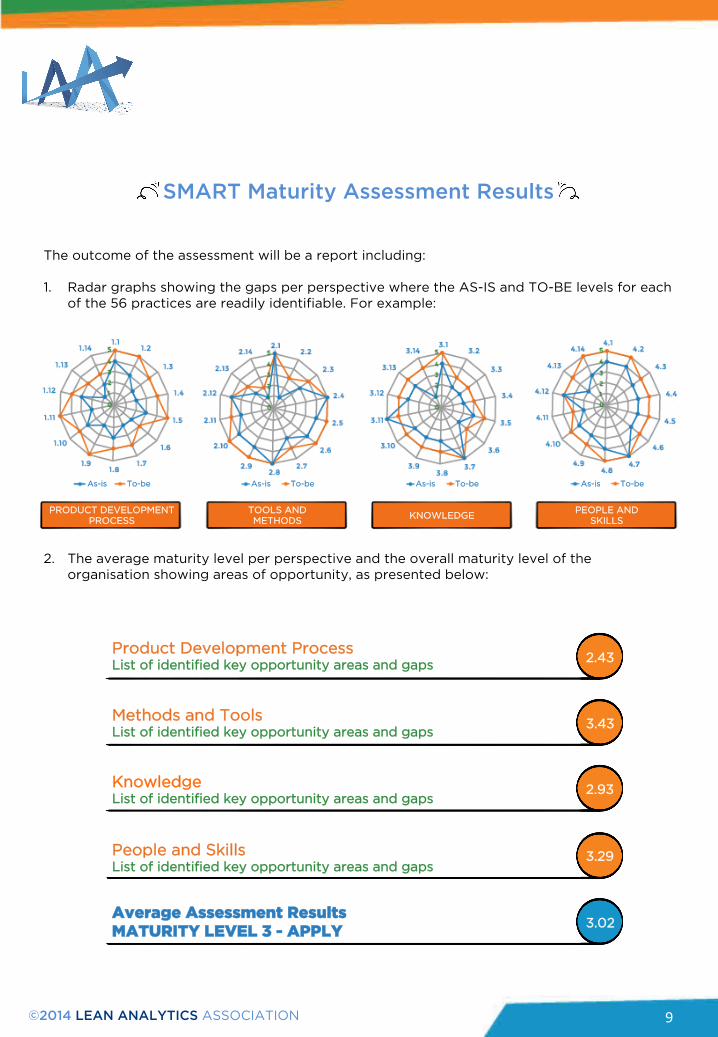
SMART Maturity Assessment Results The outcome of the assessment will be a report including: 1. Radar graphs showing the gaps per perspective where the AS-IS and TO-BE levels for each
of the 56 practices are readily identifiable. For example:
2. The average maturity level per perspective and the overall maturity level of the organisation showing areas of opportunity, as presented below:
Product Development Process List of identified key opportunity areas and gaps
2.43
Methods and Tools List of identified key opportunity areas and gaps
Knowledge List of identified key opportunity areas and gaps
People and Skills List of identified key opportunity areas and gaps
Average Assessment Results MATURITY LEVEL 3 - APPLY
3.43
2.93
3.29
3.02
PRODUCT DEVELOPMENT PROCESS
TOOLS AND METHODS
KNOWLEDGE PEOPLE AND
SKILLS
As-is To-be As-is To-be As-is To-be As-is To-be
©2014 LEAN ANALYTICS ASSOCIATION
10
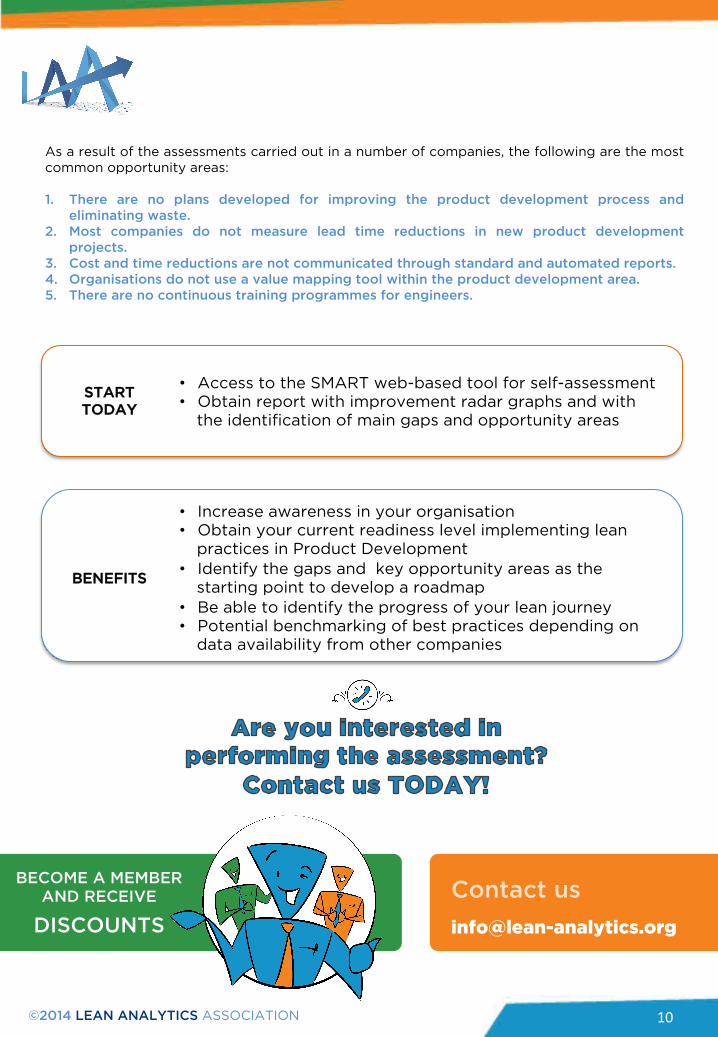
As a result of the assessments carried out in a number of companies, the following are the most common opportunity areas: 1. There are no plans developed for improving the product development process and
eliminating waste. 2. Most companies do not measure lead time reductions in new product development
projects. 3. Cost and time reductions are not communicated through standard and automated reports. 4. Organisations do not use a value mapping tool within the product development area. 5. There are no continuous training programmes for engineers.
• Access to the SMART web-based tool for self-assessment • Obtain report with improvement radar graphs and with
the identification of main gaps and opportunity areas
• Increase awareness in your organisation • Obtain your current readiness level implementing lean
practices in Product Development • Identify the gaps and key opportunity areas as the
starting point to develop a roadmap • Be able to identify the progress of your lean journey • Potential benchmarking of best practices depending on
data availability from other companies
BENEFITS
START TODAY
BECOME A MEMBER AND RECEIVE
DISCOUNTS
Contact us
+41 76 574 94 20 info@lean-‐analy6cs.org
Via Colombei #22 6914 Carona Switzerland
www.lean-‐analy6cs.org
The Lean Analy-cs Associa-on is a non-‐profit organisa-on that
connects product and process innova-on challenges to lean solu-ons through a network of interna-onal experts