2014 annual report - fenicia · pdf fileannual report 2014. ... several gcc universities in...
TRANSCRIPT

ANNU
AL R
EPO
RT 2
014
FENICIA BANK S.A.L.ANNUAL REPORT 2014
TABLE OF CONTENTS
Chairman’s Letter
Group Structure
Corporate Governance
Highlights, Charts & Performance Review
Financial Statements & Notes
Correspondent Banks & Addresses
06
08
16
30
44
122

INTRODUCTION

IT IS OUR FIRM BELIEF THAT BEHIND EVERY GREAT COMPANY IS A GREAT TEAM. IT’S THE BOND THAT PAVES THE WAY OF STRONG DECISIONS. IT’S THE TRANSPARENCY AND TRUST THAT RESULT FROM COMPLIANCE. IT’S THE PEOPLE WHO, WHEN WORKING TOGETHER, PUSH ONE ANOTHER TOWARDS GRAND ACHIEVEMENTS. AND MOST OF ALL, IT’S THE UNFAILING LEADERSHIP, ALONG WITH EFFICIENT CORPORATE GOVERNANCE, THAT TAKE THAT STRENGTH AND TURN IT INTO SUCCESS FOR EVERYONE.THAT’S WHAT MAKES US STAND STRONG YEAR AFTER YEAR.THAT’S THE POWER BEHIND FENICIA BANK.

CH
AIRM
AN’S
LET
TER Dear Stakeholders,
The year 2014, similar to its precedents, was marked with successful business and financial performance for Fenicia Bank S.A.L.
Amid the economic stagnation in the country and the prevalent turmoil in the region, the Lebanese banking sector has again demonstrated strong resilience, thus achieving sound growth and solid standing. Nevertheless, the sector’s latent capabilities and growth potentials are still beyond the realized performance.
Fenicia Bank achieved notable growth in all financial figures; some of which grew in harmony with those of
the sector and many others outperformed the sector. By the end of 2014, the Bank’s assets increased to USD 1.5 billion growing by around 9%, compared to a sector growth of 6.6%.
The customer deposit base, the main trigger of the balance sheet growth, rose by 6.8%, close to the sector growth of 6.1%, thus approaching USD 1.3 billion and constituting 90% of liabilities. On the asset side, the Bank achieved a momentous growth of 17.4% in its portfolio of loans and advances to customers, fueled mainly by the Central Bank incentive packages aimed at stimulating the economy by extending loans to different sectors. This significant upsurge in the loan portfolio outperformed both the sector’s growth of 7.4% in 2014 and the Bank’s 2013 growth of 14.5%. It also boosted the Loans to Deposits ratio to a record of 35%. The loan portfolio was diversified across several sectors.
The vigorous efforts of the Bank’s management in achieving the growth in the loan portfolio went hand in hand with a strong commitment to maintain the portfolio’s quality. The non-performing loans constituted around 7% of total loans. Provisions approached 54% and reached as high as 98% after accounting for cash collaterals and real estate guarantees. Moreover, the Bank carried on with the accumulation of the collective provision within its loan portfolio and was among the few banks that applied the Central Bank Intermediate Circular No. 376 regarding classifying and allocating specific provisions against retail loans with specific default indicators. By the end of 2014, the percentages of collective provision against corporate/SME portfolio and retail portfolio of 0.8% and 1.14% respectively stood higher than the benchmarks set by the Central Bank.
In terms of profitability, the Bank’s net profits for the year remained stable at around USD 14 million. This result is perceived as acceptable and is aligned with the Bank’s general strategy of achieving a steady and firm growth while maintaining convenient
6
risk appetite and an adequate capital structure. Within this framework, the Bank sustained a capital adequacy ratio of 16.25% distinguished by its 100% CET1 component and a leverage ratio of 7.4%. In parallel, the Bank maintained solid liquidity standards. Its primary liquidity placed with the Central Bank and other banks stood at around USD 291 million (around 24% of customer deposits) over and beyond the Bank’s highly liquid investment portfolio in TBs and CDs. Moreover, the Bank liquidity coverage ratio (LCR) reached 323% at end of 2014.
Promoting and reinforcing the best governance practices has always been a key pillar of the Bank’s objectives. In 2014, the Bank approved a comprehensive Remuneration Policy that sets forth the remuneration structure, principles, and standards aiming at upgrading the performance assessment and remuneration systems at the Bank and pertaining to all employees and the members of the Board.
In parallel, the Bank entered into an agreement with Financial Integrity Network, FIN, a leading international firm that provides strategic and technical advisory services in relation to combating and preventing illicit financing. The agreement will enable the Bank to undergo a comprehensive baseline assessment of its AML/CFT and financial sanctions compliance practices, in accordance with evolving global standards and expectations. Accordingly, the Bank aims at promoting such practices to assure stakeholders of its leading role in adopting global standards that counter all aspects of financial crime.
Internally, the Bank’s continuous advancement and growth couldn’t have been possible without the coordination and synergy among the Bank’s different support functions, production functions, and top management. During 2014, employees of all functions attended numerous training sessions, courses, and workshops aiming at broadening and deepening their knowledge and expertise and upgrading their communication skills and capabilities.
In 2014, we reiterated our commitment to corporate social responsibility. It has become part of our culture to participate in several events and support multiple organizations that seek to flourish social and cultural interaction, educational and academic incentives, and athletic spirit.
In closing, we extend our gratitude to all those who contributed to the Bank’s growth and progress. Our ambitions for the Bank are immense and we commit to work incessantly to achieve them.
Cordially,
Abdul Razzak AchourChairman & General Manager
7

GRO
UP
STRU
CTU
RE
� Lebanese, born in 1965. � Chairman of the Board of Directors and General Manager of Fenicia Bank s.a.l. since 1994. � Chairman of several committees namely: Assets and Liabilities (ALCO), Anti Money Laundry, Credit Rating, and Credit.
� Chairman of the Board and General Manager of Bellevue Company s.a.l (Real Estate Company). � Board member of Trust Construction Company s.a.l. (Construction Company). � Board member in Achour Group (Trade, Manufacturing, Transportation and Construction). � Member of World Union of Arab Bankers. � Board member of the Lebanese Banking Association for more than 15 years. � Committed to the civil society and to social responsibility, Mr. Achour serves as a Board Member in the Children Cancer Center – Lebanon (CCCL).
� Through his career in the banking and non banking sector, Mr. Achour is recognized for his strategic vision, leadership skills, and innovative way of doing business.
� Holder of Bachelor Degree in Business Administration and Accounting from Lucien Coormans Institute - Brussels and a degree in International Commerce Studies from ICAD – Paris.
� Lebanese, born in 1958. � Major shareholder at Fenicia Bank s.a.l. � Non Executive Board Member of Fenicia Bank s.a.l. � Board Member at Bellevue Co. s.a.l. (Real Estate Company). Also a Board Member in Achour Group, managing and co-managing several affiliated companies dealing with different lines of business with international trade exposure.
� Serves as a Board Member in different organizations specifically in sports field. He is currently the president of “Al Sadaka” sporting club (Beirut-Lebanon) and the president of The Handball Federation in Lebanon.
MR. ABDUL RAZZAK MAHMOUD ACHOUR
MR. ABDALLAH MAHMOUD ACHOUR
BOARD OF DIRECTORS
8

� Lebanese, born in 1938. � Non Executive Board Member at Fenicia Bank s.a.l. and member of the Audit Committee and Corporate Governance and Remuneration Committee.
� Board Member of Bellevue Company s.a.l. (Real Estate Company). � Driven by ambition and entrepreneurship, he is the owner of a recognizable company chain in Africa (DRC), (Manufacturing, Electronic Devices, Clothes, and Shoes).
� Pioneer investor in the Lebanese real estate sector through financing the construction of a variety of big projects all across Lebanon.
MR. YOUSSEF ABBAS MERHI
� Lebanese, born in 1940. � Non Executive Board Member at Fenicia Bank s.a.l. and member of the Audit Committee and Corporate Governance and Remuneration Committee.
� Board Member of Bellevue Company s.a.l. (Real Estate Company). � Being an ambitious businessman and bold entrepreneur, he owns a Farm and Real Estate agency in the region of Bekaa – Lebanon. Also, Owner of Dada Company in DRC, and owner of a recognizable company chain in Africa (DRC), (Manufacturing, Electronic Devices, Clothes, Shoes).
� Holder of several rewards including the highest reward in DRC: “Chevalier de l’ordre National du Leopard” as an appreciation of his achievements in the commerce and industry sectors.
MR. AZIZ NADRA MACARON
� Lebanese born in 1938. � Independent Board Member at Fenicia Bank s.a.l. � Chairman of Audit Committee. � Chairman & General Manager of Intra Investment Co s.a.l. � Member of the Board of Directors of Jammal Trust Bank s.a.l., Byblos Bank DRC and Casino du Liban. � Member of World Union of Arab Bankers. � Fifty-three years of experience in several banking and financial institutions, where he served as the general manager or director in the board.
� Professor at the Lebanese University, Faculty of Economics and Business Administration. � Holder of PHD in Business and Economics from Aix-En Provence – France.
DR. MOHAMED ABDUL HASSAN CHEAIB
9

� Lebanese, born in 1948. � Independent Board Member of Fenicia Bank s.a.l. since 2012. � Chairman of Risk Committee. � He currently holds several senior positions in different Academic institutions namely: Provost for Faculty Affairs at the Lebanese American University, Professor of strategic Management, Advisor to the President of AACSB (The US-based Business School Accreditation Body) in the Middle East and Africa. Also, member of the Board of trustees of several GCC universities in Bahrain, UAE and Oman.
� Member of the Board of the National Bank of Kuwait (Lebanon). � Holder of PHD in General Management from the University of Southern California, MBA Degree from the American University of Beirut.
� Holder of John Fernandes Strategic leadership award by the academy of Strategic and Entrepreneurial Leadership in the US for the year 2012.
� Lebanese, born in 1953. � Assistant General Manager of Fenicia Bank since 2002, executive member of its Board of Directors since 2012, and member of several committees mainly: Risk, ALCO, AML and Credit Rating Committee.
� Held leading positions in different local and international banks: Al Ahli Bank of Qatar- Doha, Mashreq Bank - Doha, Mashreq Bank – Dubai. Also in the non banking sector: Geonex International Incorporated, Florida, USA, and Middle East Banking Company, Beirut, Lebanon.
� Professor in different universities: Lebanese University, Islamic University of Lebanon and Lebanese International University.
� Holder of PHD in Economics from the American University of London, MBA from University of New Hampshire, BA in Accounting & Finance and BA in Marketing & Administration from the Lebanese University, and Diploma in Banking studies and Central Bank Regulations from Saint Joseph University.
DR. GEORGE KHALIL NAJJAR
DR. ASAAD ABDEL HASSAN KOSHAISH
10

� Lebanese born in 1949. � Independent Board Member of Fenicia Bank s.a.l. since 2012. � Member of the Risk and Audit Committees.Chairman of Corporate Governance and Remuneration Committee. � Chairman and General Manager of the Société Financière du Liban (Group of 40 Banks). Also a Board member of Intra Investment Company, Casino Du Liban, Jammal Trust Bank s.a.l., VITAS s.a.l., Société Financière et Immobilière du Port de Beyrouth, and Société Foncière Franco-Libanaise.
� Had an extensive financial consulting experience for many years at Merrill Lynch in Lebanon and France. � Holder of Bachelor Degree in Business Administration from the American University of Beirut.
MR. MICHEL FOUAD FERNEINI
� Lebanese, born in 1946. � Assistant General Manager of Fenicia Bank since 2002, executive member of its Board of Directors since 2012. � Member of several committees mainly: Risk, ALCO, AML and Credit Rating Committee. � Joined Fenicia Bank s.a.l. in July 1992 and held the position of Branches and Organization Manager. � Held many senior positions in different banks: Jammal Trust Bank s.a.l., Bank of Beirut s.a.l., Societe Nouvelle de la Banque de Syrie et du Liban.
� Holder a Bachelor Degree in Chemistry from the Lebanese University.
MR. MOHSEN CHAFIC NAAMANI
11

LEAD
ERSH
IP

LEAD
ERSH
IP

WHEN THE WINDS ARE SHIFTING AND THE TIDES ARE HIGH, ONLY TRUE LEADERS KNOW HOW TO SUCCESSFULLY GUIDE THEIR TEAM TO THE HARBOR.

CO
RPO
RATE
GO
VERN
ANC
E I. Corporate Governance Initiatives in 2014In 2014, Fenicia Bank S.A.L. reinforced its commitment to adopt leading corporate governance practices. Within this framework, the Bank carried on the implementation of the governance restructuring program it embarked on in 2013, adopted measures to ensure compliance by the governance code, various policies, and practices, and brought forward a number of initiatives that aim at instituting sound practices. The major initiatives focused on:
- Finalizing and approving the updates on the Bank’s Policies and Procedures Guide initiated in 2013 and putting the new Guide into practice;
- Approving amendments to the Bank credit committees in relation to their structures and composition, authority limits, and control mechanisms in a way to facilitate the processing of credit files while maintaining proper risk assessments;
- Restructuring the Governance and Remuneration Committee of the Board of Directors and approving and adopting its updated charter;
- Carrying on the Board Training Program initiated in 2013 and delivering workshops covering the topics of Corporate Governance, Basel and Risk Appetite, and Stress Testing and Strategic Risks;
- Setting the Remuneration Policy of the Bank by the Governance and Remuneration Committee and approving it by the Board of Directors;
- Ensuring that the Compliance Department established in 2013 is fully functional and equipping it with adequate staff and other resources, including access to continuous training, in a way that facilitates the proper exercise of its compliance monitoring functions.
16
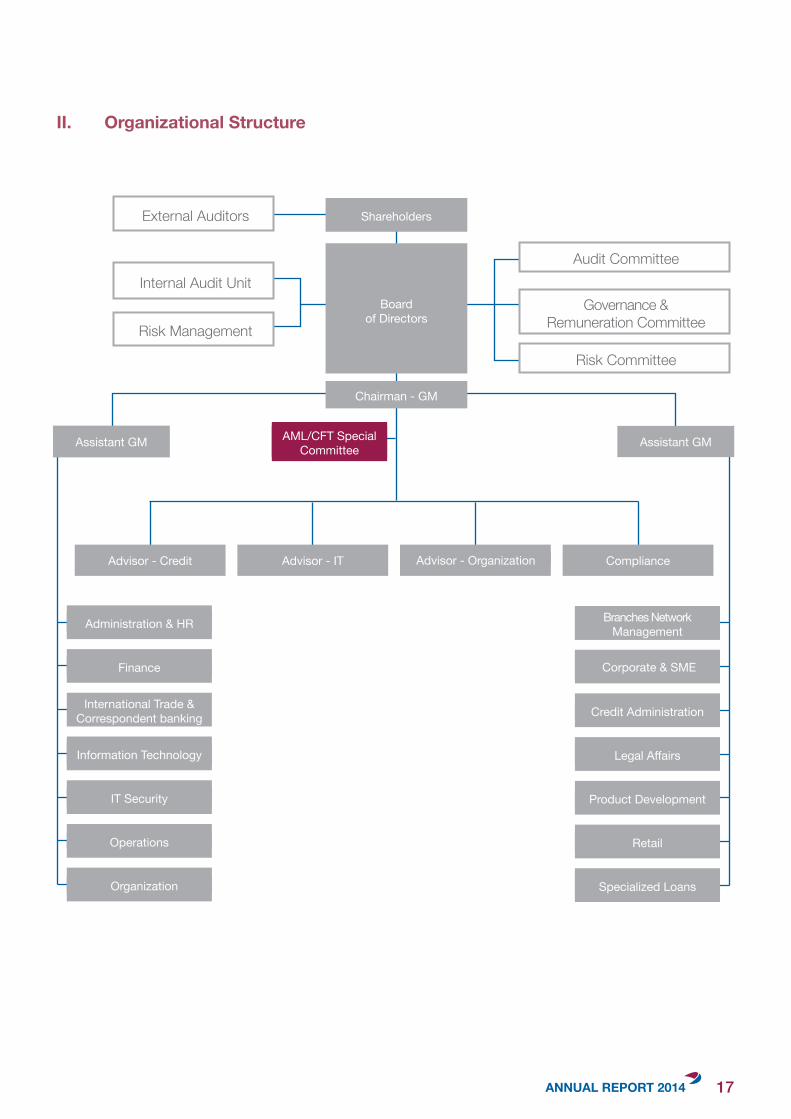
II. Organizational Structure
Audit Committee
Risk Committee
Governance & Remuneration Committee
Internal Audit Unit
External Auditors
Risk Management
Chairman - GM
Shareholders
Boardof Directors
Assistant GM
Advisor - Credit Advisor - OrganizationAdvisor - IT Compliance
Assistant GM
Branches Network Management
Product Development
Credit Administration
Specialized Loans
Corporate & SME
Retail
Legal Affairs
Administration & HR
International Trade & Correspondent banking
Operations
Finance
IT Security
Information Technology
Organization
AML/CFT Special Committee
17
III. Bank Committees
• Board Committees:
- Audit Committee
- Governance and Remuneration Committee
- Risk Committee
• Management Committees:
- AML / CFT Special Committee
- Assets & Liabilities Committee
- Credit Committees (3 sub-committees)
- Credit Rating Committee
- FATCA Committee
- Financial & Estate Placements Committee
- Information Security Committee
- Procedures & Internal Control Committee
- Training Committee
- Archiving Committee
IV. Fenicia Bank Board Governance
IV.1 Board of Directors’ Roles and Responsibilities
Fenicia Bank’s Board of Directors has wide authorities to implement the decisions of the General Assembly and to exercise the non day-to-day activities required to run the business normally. The Board of Directors supervises the setting of the Bank’s strategy and its implementation, oversees the performance of the Bank’s management and its execution of the strategy and objectives, and sets standards for evaluations and remunerations.
The Board ensures proper care of the legitimate interests of the shareholders, depositors, and stakeholders and the building of trust in the Bank and ensures that proper governance procedures are in place and abided by. The Board ensures the proper implementation of the required control procedures and oversees the financial reporting and audit systems and follows up on the work of the internal audit unit and the external auditors.
The Board of Directors sets the general policy of risk management at the Bank and ensures its efficiency and proper implementation. It is responsible for the transparency in relation to the Bank’s activities and results and for its abidance by the applicable laws and regulations.
IV.2 Responsibilities of the Chairman
The Chairman of the Board of Directors represents the Bank to third parties and executes the Board’s decisions and facilitates the daily operations of the Bank, as stated by the bylaws, and under the supervision and control of the Board of Directors. The Chair provides leadership to the Board and is responsible for the Board’s effective overall functioning.
18
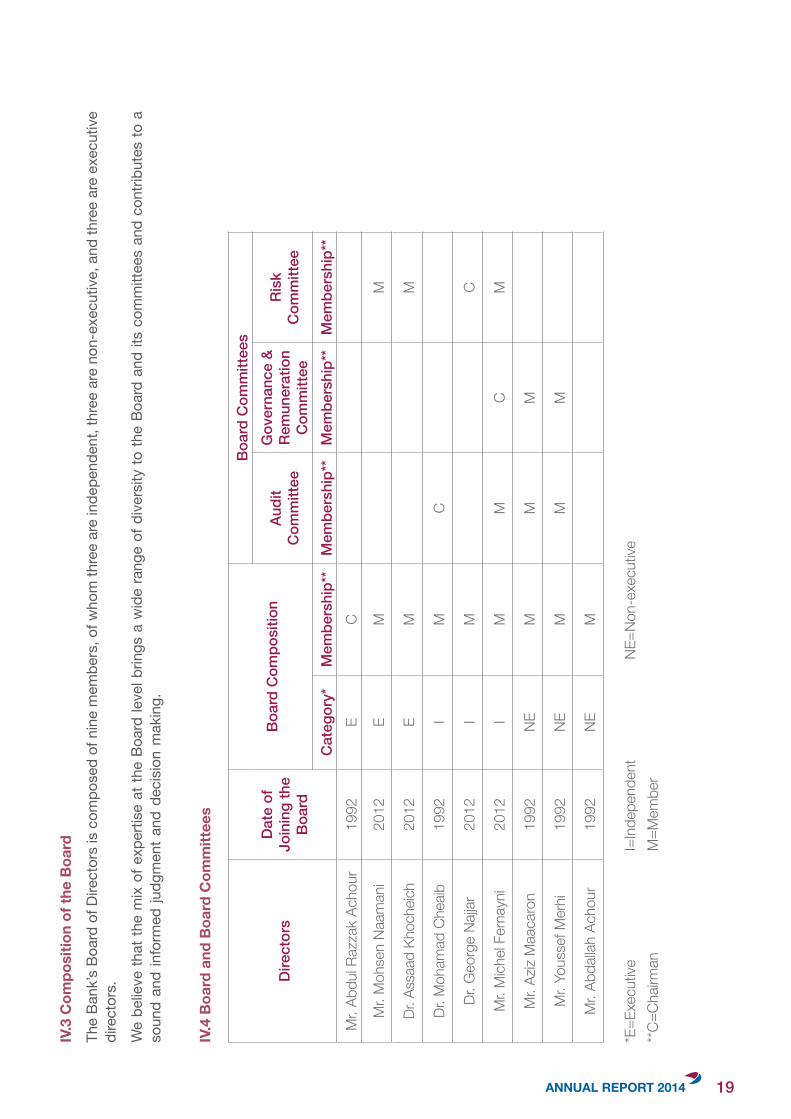
IV.3
Com
posi
tion
of th
e Bo
ard
The
Bank
’s Bo
ard
of D
irect
ors
is c
ompo
sed
of n
ine
mem
bers
, of w
hom
thre
e ar
e in
depe
nden
t, th
ree
are
non-
exec
utiv
e, a
nd th
ree
are
exec
utiv
e di
rect
ors.
We
belie
ve th
at th
e m
ix o
f exp
ertis
e at
the
Boar
d le
vel b
rings
a w
ide
rang
e of
div
ersi
ty to
the
Boar
d an
d its
com
mitt
ees
and
cont
ribut
es to
a
soun
d an
d in
form
ed ju
dgm
ent a
nd d
ecis
ion
mak
ing.
Dire
ctor
sD
ate
of
Join
ing
the
Boar
d
Boar
d C
ompo
sitio
n
Boar
d C
omm
ittee
s
Audi
t C
omm
ittee
Gov
erna
nce
& Re
mun
erat
ion
Com
mitt
ee
Risk
C
omm
ittee
Cat
egor
y*M
embe
rshi
p**
Mem
bers
hip*
*M
embe
rshi
p**
Mem
bers
hip*
*M
r. Ab
dul R
azza
k Ac
hour
1992
EC
Mr.
Moh
sen
Naam
ani
2012
EM
M
Dr. A
ssaa
d Kh
oche
ich20
12E
MM
Dr. M
oham
ad C
heaib
1992
IM
C
Dr. G
eorg
e Na
jjar
2012
IM
C
Mr.
Mich
el Fe
rnay
ni20
12I
MM
CM
Mr.
Aziz
Maa
caro
n19
92NE
MM
M
Mr.
Yous
sef M
erhi
1992
NEM
MM
Mr.
Abda
llah
Acho
ur19
92NE
M
*E=E
xecu
tive
I=In
depe
nden
t
NE=N
on-e
xecu
tive
**C=C
hairm
an
M
=Mem
ber
IV.4
Boa
rd a
nd B
oard
Com
mitt
ees
19
IV.5 Board Committees
The Board delegates some of its responsibilities to its committees and maintains the duty to follow up on the actions, findings, and recommendations of these committees, and takes the actions deemed appropriate.
IV.5.1 Audit Committee
IV.5.1.1 Membership
The Audit Committee consists of four non-executive directors, two of whom are independent. The Chairman of the Committee is considered by the Board to be independent.
The Board has determined that the Committee Chair, Dr. Mohamad Cheaib, possesses relevant financial and audit experience required for the Audit Committee to fulfill its tasks.
IV.5.1.2 Roles and Responsibilities
The main mission of the Audit Committee is to assist the board in fulfilling its supervisory role and responsibilities mainly related to:• The independence and qualifications of the External Auditors and the Internal Audit Unit.• Oversight of the financial reporting process and accounting policies, control of financial statements’
soundness, and review of the disclosure standards adopted by the Bank.• The adequacy and effectiveness of the audit systems and the internal control policies and procedures.• The follow up on any observations, violations, or recommendations highlighted by the External
Auditors, supervisory authorities, the Internal Audit Unit, or the Compliance Department and follow-up on the implementation of the remedial measures.
• The assurance of proper oversight over the compliance systems and the procedures to address any reported non-compliance.
• The abidance by the Central Bank circulars and the Banking Control Commission circulars and reports and all other applicable regulations.
IV.5.2 Governance and Remuneration Committee
IV.5.2.1 Membership
The Governance and Remuneration Committee consists of three non-executive directors, one of whom is independent. The Chairman of the Committee is considered by the Board to be independent.
The Board has determined that the Committee Chair, Mr. Michel Fernayni, possesses the experience required for the Governance and Remuneration Committee to fulfill its tasks.
IV.5.2.2 Roles and Responsibilities
The main roles of the Governance and Remuneration Committee are as follows:• Assisting in setting the various corporate governance policies, recommending them to the Board for
approval, and following-up on their implementation.• Clarifying the roles and responsibilities of the Board of Directors and its committees and ensuring
their proper exercise.• Verifying that the Bank is operating within the frame of the corporate governance principles.• Regularly reviewing and updating the corporate governance code and principles in compliance
with the guidelines issued by the Basel Committee and the supervisory authorities and in line with international best practices.
20
• Developing the Remuneration Policy and Remuneration System at the Bank and presenting them to the Board for approval, reviewing them on regular basis, and overseeing their implementation.
• Recommending the remuneration of senior executives to the Board of Directors.
IV.5.3 Risk Committee
IV.5.3.1 Membership
The Board Risk Committee consists of two independent members and two executive members. The Chairman of the Committee is considered by the Board to be independent.
The Board has determined that the Committee’s Chair, Dr. George Khalil Najjar, possesses the experience required for the Board Risk Committee to fulfill its tasks.
IV.5.3.2 Roles and Responsibilities
The main roles of the Risk Committee are as follows:• Assisting the Board in setting the risk strategy and policies and in determining, measuring, monitoring,
and managing all the risks that the Bank is exposed to.• Advising the Board on the Bank’s overall current and future risk tolerance. • Verifying that the Bank operations and goals stay within its risk appetite.• Supervising the sound adoption of the risk management principles in abidance by the regulations of
the Central Bank, the Banking Control Commission, and the Basel Committee.• Ensuring the independence and competence of the risk management unit and overseeing its activities. • Verifying that the risk management implementation is aligned with the Bank’s risk strategy.
V. External AuditorsThe External Auditors of Fenicia Bank S.A.L. are Grant Thornton and PricewaterhouseCoopers. The External Auditors were appointed by the Board of Directors upon a recommendation by the Audit Committee. The External Auditors are independent from the Bank and its directors. The Audit Committee is responsible for ensuring that the External Auditors remain independent.
VI. ConflictofInterestandRelatedPartyTransactionsThe Bank has developed a Conflict of Interest Policy that promotes transparency, fairness and disclosure in issues underlying a conflict of interest or related party transactions. The Policy delineates the procedures for avoiding conflicts of interest to the extent possible with the appropriate disclosure mechanisms, and for identifying and dealing with actual, potential, or perceived conflicts of interest, and disclosing them where un-prevented.
VII. RemunerationPolicyIn 2014, Fenicia Bank S.A.L. adopted a Remuneration Policy that was set forth by the Governance and Remuneration Committee and approved by the Board of Directors. The Governance and Remuneration Committee oversees the implementation of the Policy and reviews it on a regular basis to ensure its ongoing effectiveness.
21
VII.1 Objectives and Principles
The Remuneration Policy applies to all employee levels and aims at having in place a remuneration structure that:
• Facilitates the attraction and retention of talented and highly qualified employees
• Incentivizes employees and increases their motivation, productivity, and overall performance
• Ensures the alignment of employees’ efforts and performance with value creation in light of the Bank’s risk appetite.
In achieving these objectives, the Bank’s Remuneration Policy and its practices rest upon a set of guiding and regulatory principles, among which:
• Remuneration structures and procedures are fair and transparent throughout the Bank’s departments and branches and consistent across each function level or category in line with the competency based approach.
• High performance is observed and fairly rewarded and the employee’s potential and career path are duly considered.
• Remunerations are aligned with the Bank’s strategy and long-term objectives and payments are scheduled over a consistent horizon.
• Performance targets and expectations are clearly communicated to all employees.
• The remuneration system is aligned with the Bank’s risk appetite as well as its governance principles and does not reward excessive risk taking.
• Remuneration levels do not undermine the Bank’s financial performance.
VII.2 The Remuneration Components
The Bank seeks to offer its employees balanced remuneration packages comprising of:
VII.2.1 Fixed Remunerations, which consist of the employee’s salary. They are determined based on several factors including the employee’s grade and level at the Bank; the job function, its complexity, underlying responsibilities, and a set of required skills; the employee’s performance review; and other individual factors such as the educational and professional advancement and the ethical conduct. Salaries are benchmarked against internal and peer group salary scales to ensure fairness and consistency.
VII.2.2 Variable Remunerations, which are performance based and are granted in the form of cash bonuses. Within each unit or branch, variable remunerations are determined based on indicators of the individual, unit/ branch, and Bank overall performance and take due consideration of risk and compliance indicators, the employee’s function and its complexity, and his/her behavior and ethical conduct, among other criteria.
VII.2.3 Other benefits, which are granted to employees and are subject to specific criteria and conditions as determined by internal policies and procedures in alignment with the applicable laws and regulations. Examples of these benefits include transportation and food allowances; hospitalization and medical care benefits; family, marriage, maternity, education, and death allowances, and other function-related allowances such as cashier, representation, and responsibility allowances.
VII.2.4 End of Service Indemnities, which are granted in accordance with the relevant legal requirements.
The levels of fixed and variable remunerations are duly considered at the Bank’s aggregate level in a way to ensure their alignment with the Bank’s performance and market conditions and analyze their likely impact on indicators of future Bank performance.
22
VII.3 The Remuneration of Control Functions and Senior Executives
The performance evaluation and remunerations of control functions at the Bank are determined based on their responsibilities and the objectives of their units and are dissociated from the targets of the units they monitor in order to ensure their continued independence and objectivity and achievement of their control objectives. Their remunerations are recommended by the relevant Board committees and approved by the Board.
The remunerations of senior executives are recommended by the Governance and Remuneration Committee to the Board. The remunerations aim at incentivizing management to achieve the strategic objectives of the Bank and create long-term value while acting within the Bank’s risk profile and appetite.
VII.4 The Remuneration of Directors
The procedures for setting the remunerations of the Chairperson and the members of the Board of Directors are based on the best practices adopted in the banking sector and particularly among the Bank’s comparable banking institutions. All directors receive an annual fixed fee in return for their board membership. Independent directors receive as well a fixed fee for each committee meeting they attend as part of their committee(s) membership and a fixed fee for each committee meeting they chair. In their capacity as board members, directors do not receive performance based remunerations.
VIII. Professional Conduct RulesFenicia Bank S.A.L. ensures that the Bank at all employee levels abides by the highest standards of legal and ethical conduct. The Bank has developed a Code of Conduct and established mechanisms for monitoring compliance by it and all applicable laws and regulations. It has developed procedures for employees to confidentially report any violations and for the Bank to act upon and resolve the faced issues.
Fenicia Bank S.A.L. is strongly committed to the following values that frame the scheme of its activities within and outside the work environment:
Fast Service (We satisfy customer needs at the time they need the service)
Efficiency (We execute operations within a small margin of error)
Neutrality (We show no favors and engage in no discriminatory behavior)
Integrity (We act ethically and honestly towards our organization and stakeholders)
Consistency (We maintain uniformity across our products and services to ensure customer satisfaction)
Innovation (We propose new ideas and/or ways of doing things)
Accountability (We hold the responsibility for and consequences of our actions)
23
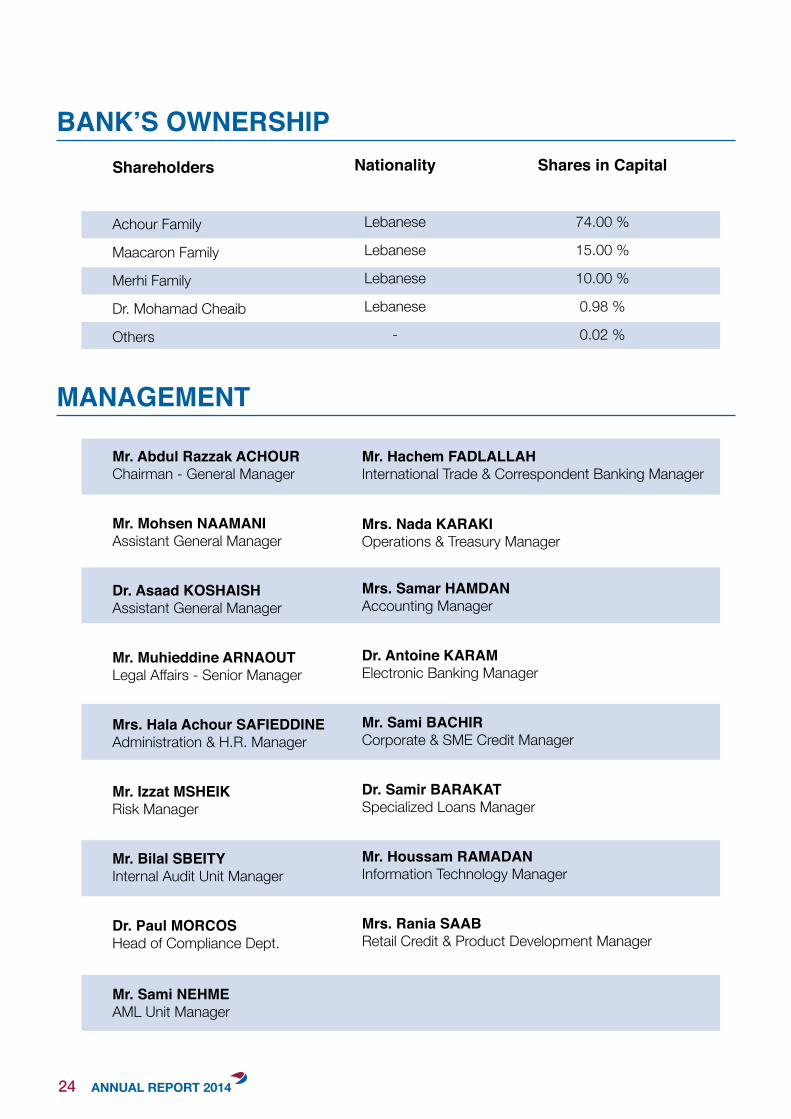
Shareholders
Achour Family
Maacaron Family
Merhi Family
Dr. Mohamad Cheaib
Others
Shares in Capital
74.00 %
15.00 %
10.00 %
0.98 %
0.02 %
Nationality
Lebanese
Lebanese
Lebanese
Lebanese
-
Mr. Abdul Razzak ACHOURChairman - General Manager
Mr. Mohsen NAAMANIAssistant General Manager
Dr. Asaad KOSHAISHAssistant General Manager
Mr. Muhieddine ARNAOUTLegal Affairs - Senior Manager
Mrs. Hala Achour SAFIEDDINEAdministration & H.R. Manager
Mr. Izzat MSHEIKRisk Manager
Mr. Bilal SBEITYInternal Audit Unit Manager
Dr. Paul MORCOSHead of Compliance Dept.
Mr. Sami NEHMEAML Unit Manager
Mr. Hachem FADLALLAHInternational Trade & Correspondent Banking Manager
Mrs. Nada KARAKIOperations & Treasury Manager
Mrs. Samar HAMDANAccounting Manager
Dr. Antoine KARAMElectronic Banking Manager
Mr. Sami BACHIRCorporate & SME Credit Manager
Dr. Samir BARAKATSpecialized Loans Manager
Mr. Houssam RAMADANInformation Technology Manager
Mrs. Rania SAABRetail Credit & Product Development Manager
BANK’S OWNERSHIP
MANAGEMENT
24

Dr. Ibrahim HAMMOUDCredit
Dr. Habib KOBEISSYInformation Technology
Mr. Ali BADRANBranches NetworkManager
Me. Charles GHAFARI
Grant Thornton
Me. Waddah EL-CHAER
PricewaterhouseCoopers
Mr. Mohamad HAMADEHRegional Manager |South|
ADVISORS TO THE CHAIRMAN
BRANCHES NETWORK
LEGAL ADVISORS
AUDITORS
25

CO
NSI
STEN
CY

CO
NSI
STEN
CY

WHEN STRONG LEADERSHIP IS BACKED BY SOLID TEAMWORK, NOTHING CAN STAND IN THE WAY OF CONSISTENT GROWTH.

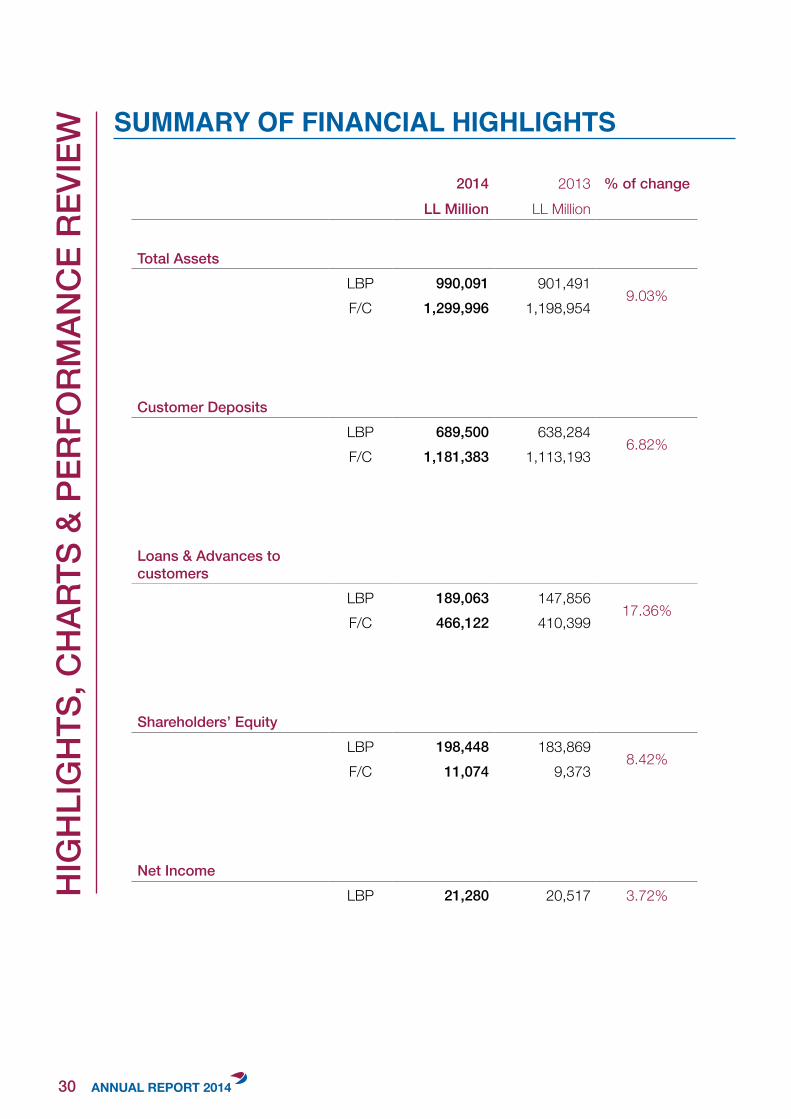
SUMMARY OF FINANCIAL HIGHLIGHTS
HIG
HLI
GH
TS, C
HAR
TS &
PER
FORM
ANC
E RE
VIEW
2014 2013 % of changeLL Million LL Million
Total AssetsLBP 990,091 901,491
9.03%F/C 1,299,996 1,198,954
Customer DepositsLBP 689,500 638,284
6.82%F/C 1,181,383 1,113,193
Loans & Advances to customers
LBP 189,063 147,85617.36%
F/C 466,122 410,399
Shareholders’ EquityLBP 198,448 183,869
8.42%F/C 11,074 9,373
Net IncomeLBP 21,280 20,517 3.72%
30
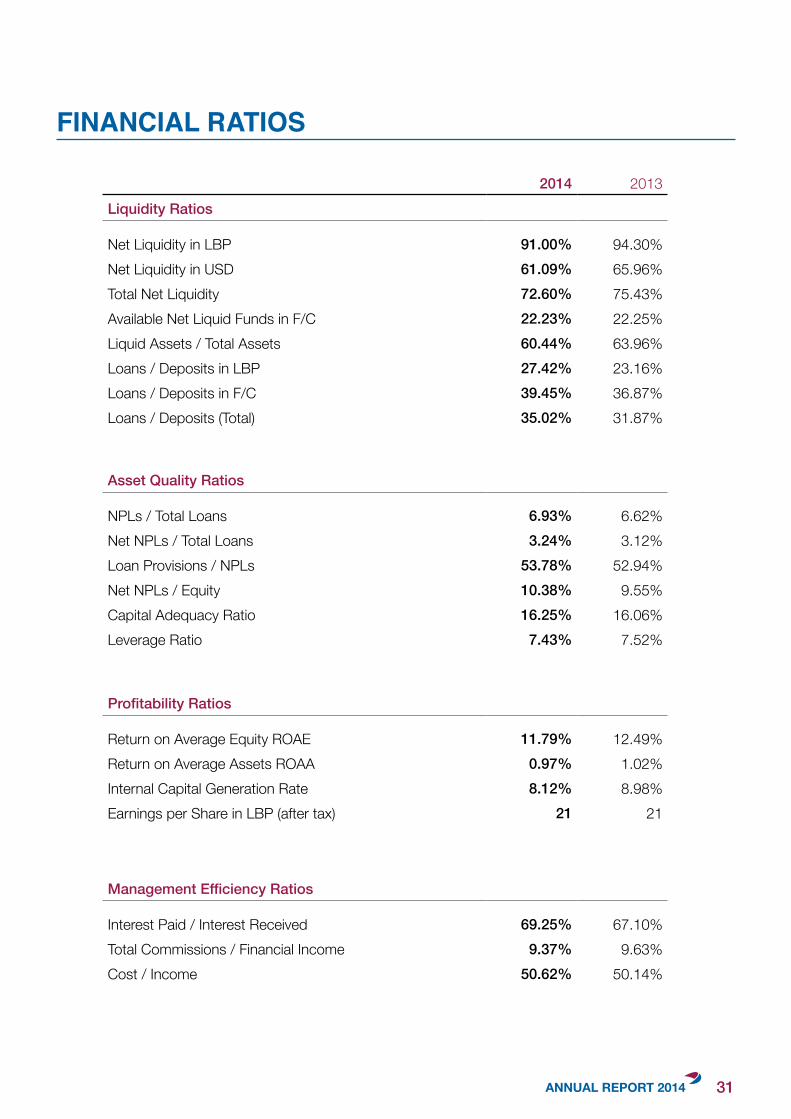
FINANCIAL RATIOS
2014 2013Liquidity Ratios
Net Liquidity in LBP 91.00% 94.30%Net Liquidity in USD 61.09% 65.96%Total Net Liquidity 72.60% 75.43%Available Net Liquid Funds in F/C 22.23% 22.25%Liquid Assets / Total Assets 60.44% 63.96%Loans / Deposits in LBP 27.42% 23.16%Loans / Deposits in F/C 39.45% 36.87%Loans / Deposits (Total) 35.02% 31.87%
Asset Quality Ratios
NPLs / Total Loans 6.93% 6.62%Net NPLs / Total Loans 3.24% 3.12%Loan Provisions / NPLs 53.78% 52.94%Net NPLs / Equity 10.38% 9.55%Capital Adequacy Ratio 16.25% 16.06%Leverage Ratio 7.43% 7.52%
Profitability Ratios
Return on Average Equity ROAE 11.79% 12.49%Return on Average Assets ROAA 0.97% 1.02%Internal Capital Generation Rate 8.12% 8.98%Earnings per Share in LBP (after tax) 21 21
Management Efficiency Ratios
Interest Paid / Interest Received 69.25% 67.10%Total Commissions / Financial Income 9.37% 9.63%Cost / Income 50.62% 50.14%
31
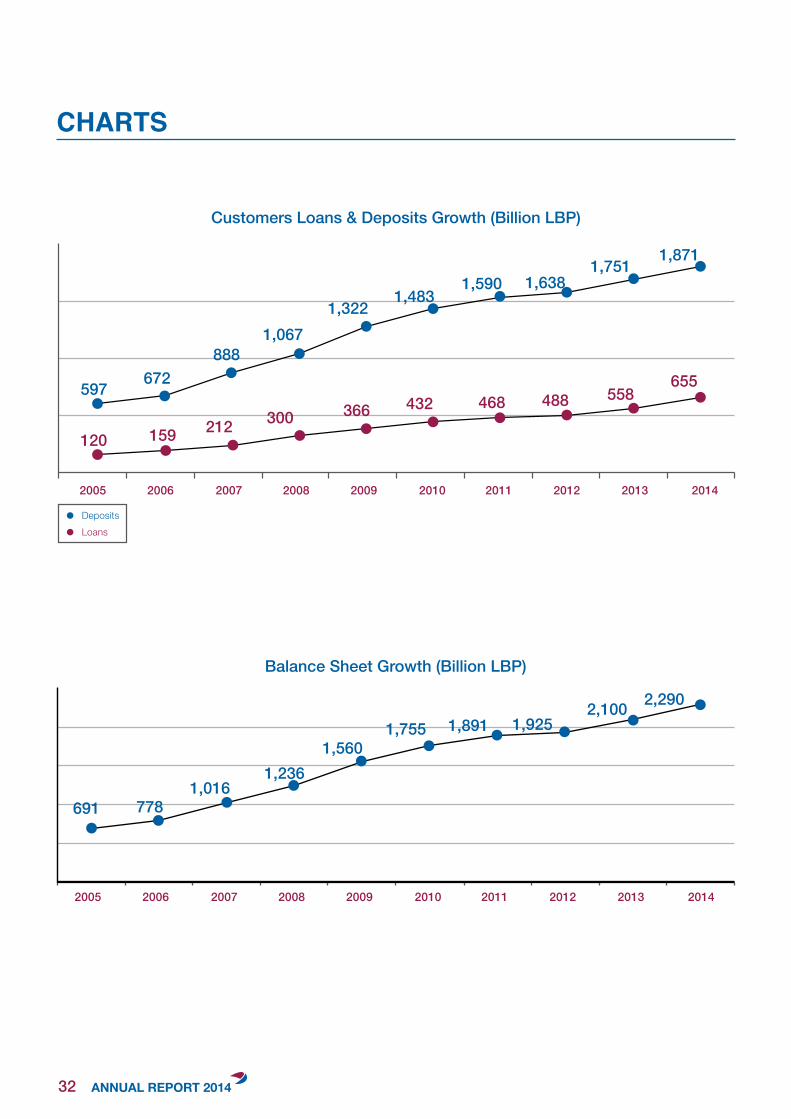
CHARTS
32
33
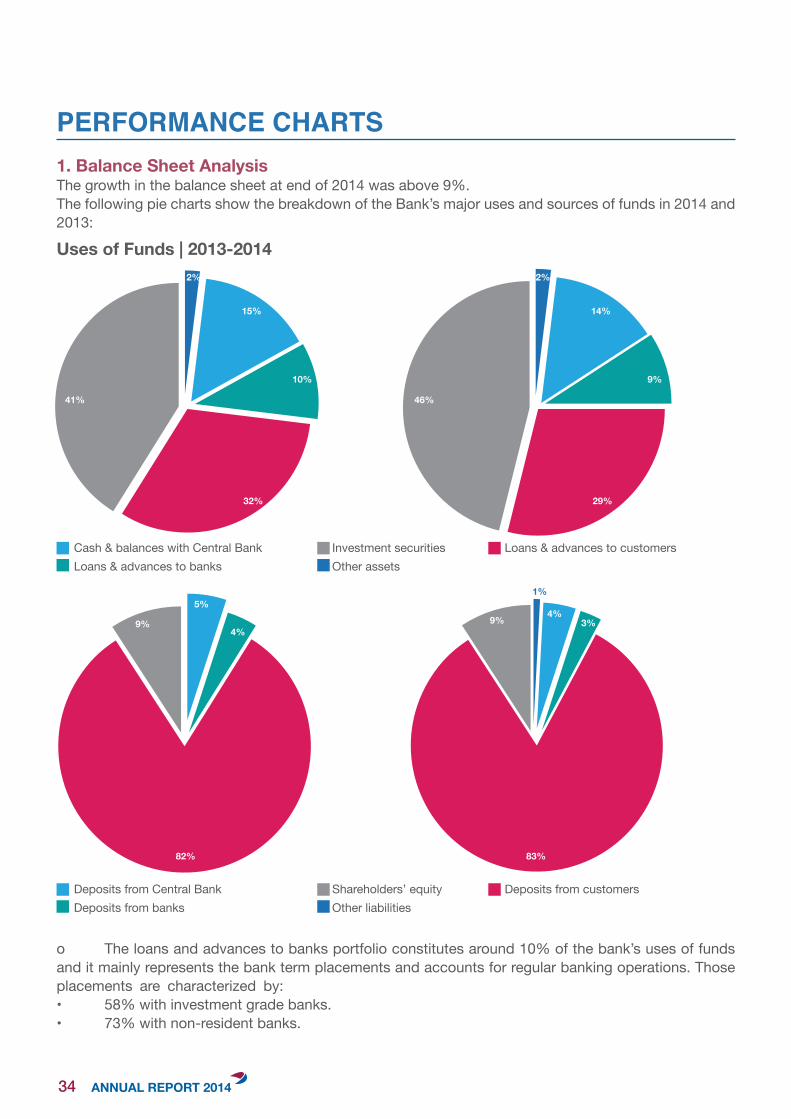
PERFORMANCE CHARTS1.BalanceSheetAnalysisThe growth in the balance sheet at end of 2014 was above 9%.The following pie charts show the breakdown of the Bank’s major uses and sources of funds in 2014 and 2013:
o The loans and advances to banks portfolio constitutes around 10% of the bank’s uses of funds and it mainly represents the bank term placements and accounts for regular banking operations. Those placements are characterized by:• 58% with investment grade banks.• 73% with non-resident banks.
Uses of Funds | 2013-2014
82%
9%
5%
4%
83%
9% 4%
1%
3%
2%
14%
9%
29%
46%
2%
15%
10%
32%
41%
Cash & balances with Central BankLoans & advances to banks
Deposits from Central BankDeposits from banks
Investment securitiesOther assets
Shareholders’ equityOther liabilities
Loans & advances to customers
Deposits from customers
34
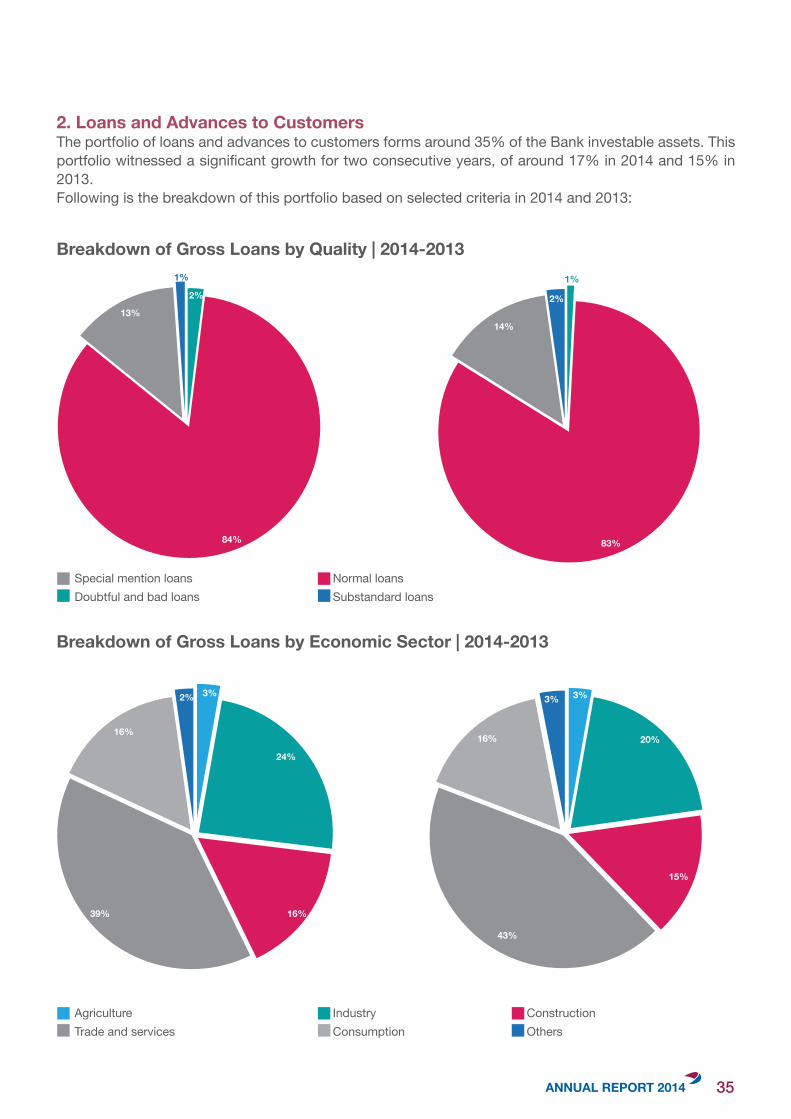
2. Loans and Advances to CustomersThe portfolio of loans and advances to customers forms around 35% of the Bank investable assets. This portfolio witnessed a significant growth for two consecutive years, of around 17% in 2014 and 15% in 2013. Following is the breakdown of this portfolio based on selected criteria in 2014 and 2013:
BreakdownofGrossLoansbyQuality|2014-2013
BreakdownofGrossLoansbyEconomicSector|2014-2013
14%
2%2%
84%
13%
83%
43%
15%
16%
2% 3%
24%
16%39%
20%
3%3%
16%
1%1%
Special mention loansDoubtful and bad loans
AgricultureTrade and services
Normal loansSubstandard loans
IndustryConsumption
ConstructionOthers
35
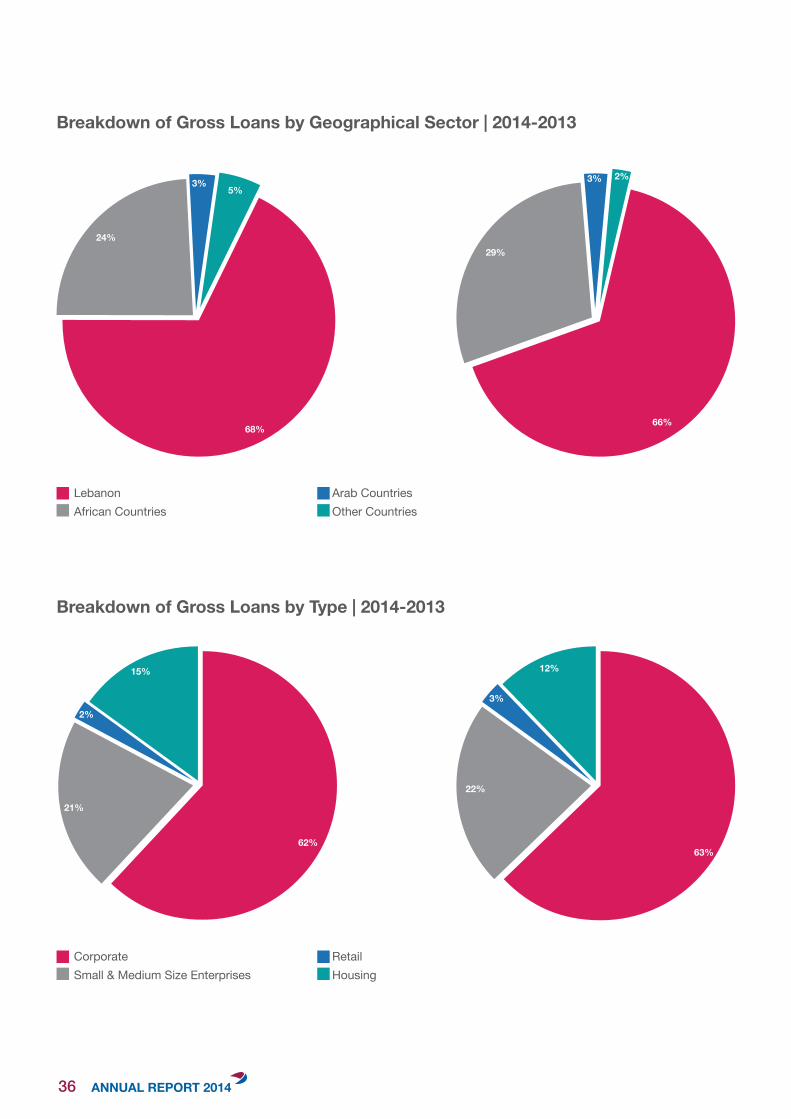
BreakdownofGrossLoansbyGeographicalSector|2014-2013
BreakdownofGrossLoansbyType|2014-2013
24%
3%5%
68%
15%
62%
21%
2%
22%
3%
12%
63%
29%
3% 2%
66%
LebanonAfrican Countries
CorporateSmall & Medium Size Enterprises
Arab CountriesOther Countries
RetailHousing
36
Customer Deposits | 2014-2013
59%
16%
6%13%
3%
1%1%
1%
60%
13%
3%
7%
14%
1%1%
1%
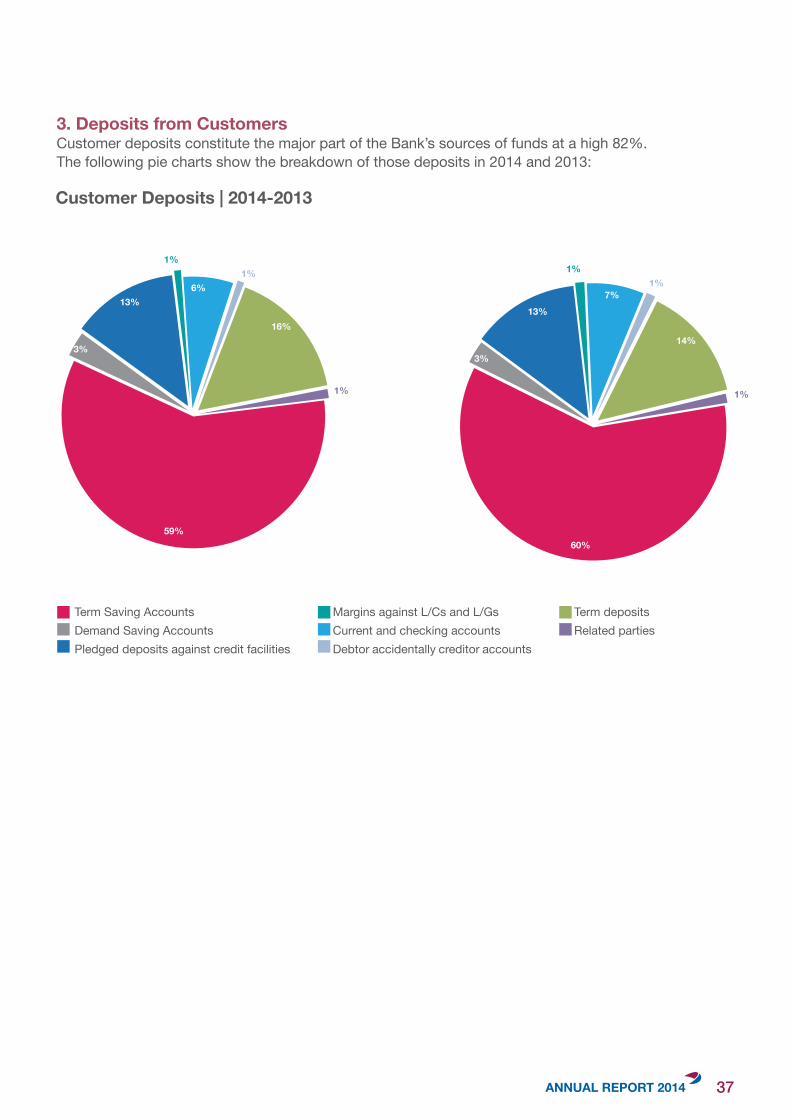
3. Deposits from CustomersCustomer deposits constitute the major part of the Bank’s sources of funds at a high 82%.The following pie charts show the breakdown of those deposits in 2014 and 2013:
Term Saving AccountsDemand Saving AccountsPledged deposits against credit facilities
Margins against L/Cs and L/GsCurrent and checking accountsDebtor accidentally creditor accounts
Term depositsRelated parties
37
Total Income | 2014-2013
Total Expenses | 2014-2013
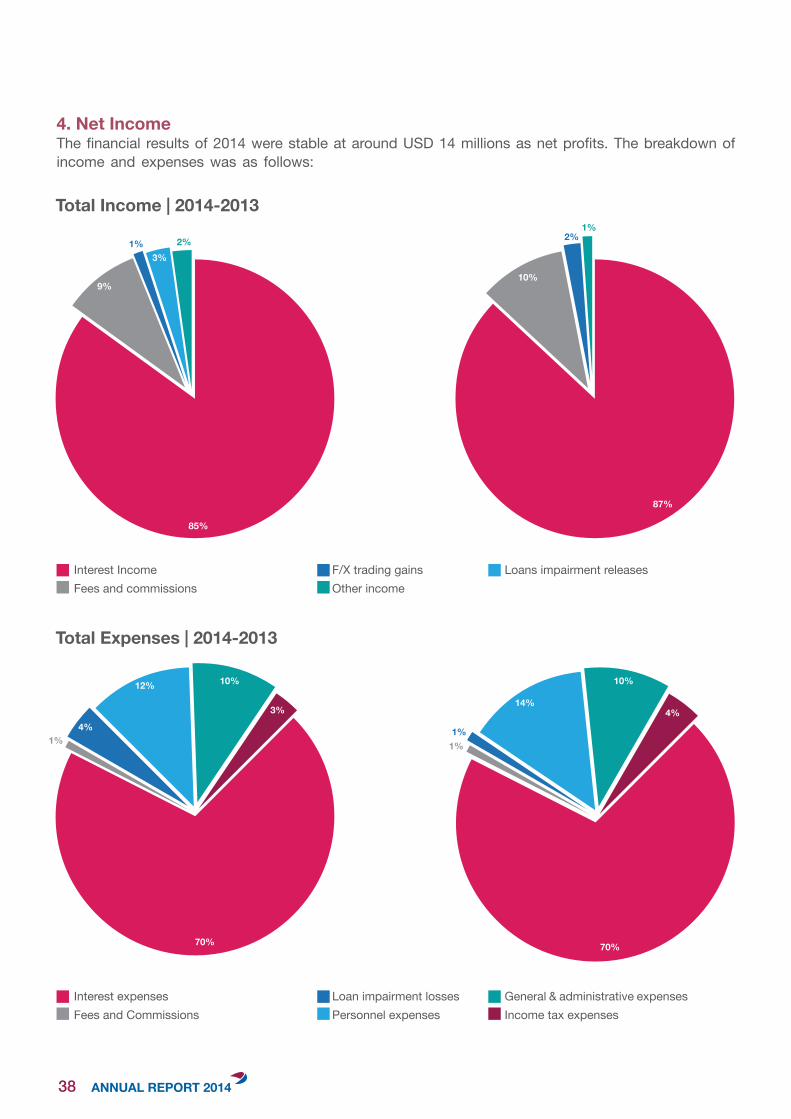
4. Net IncomeThe financial results of 2014 were stable at around USD 14 millions as net profits. The breakdown of income and expenses was as follows:
85%
9%
3%
10%
87%
2%1%2%
1%
Interest IncomeFees and commissions
Interest expensesFees and Commissions
F/X trading gainsOther income
Loan impairment lossesPersonnel expenses
Loans impairment releases
General & administrative expensesIncome tax expenses
70%
4%
14%
10%
4%
70%
12% 10%
3%
1% 1%1%
38
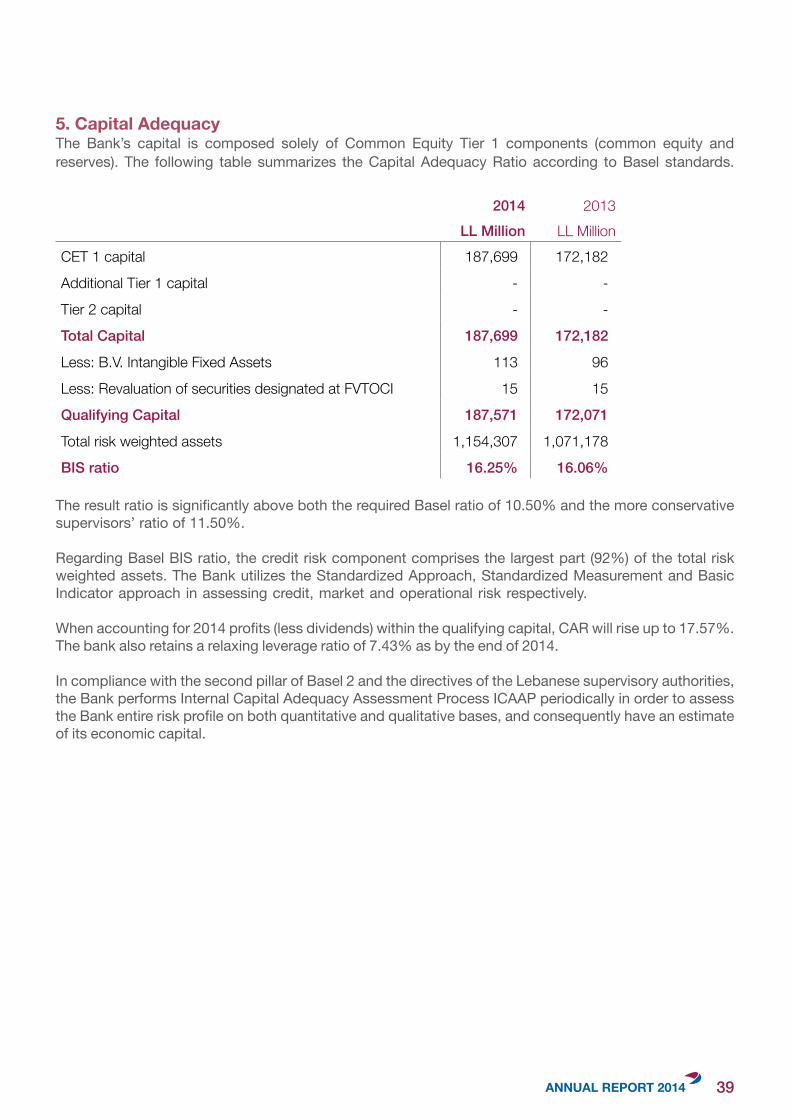
5.CapitalAdequacyThe Bank’s capital is composed solely of Common Equity Tier 1 components (common equity and reserves). The following table summarizes the Capital Adequacy Ratio according to Basel standards.
2014 2013LL Million LL Million
CET 1 capital 187,699 172,182
Additional Tier 1 capital - -
Tier 2 capital - -
Total Capital 187,699 172,182
Less: B.V. Intangible Fixed Assets 113 96
Less: Revaluation of securities designated at FVTOCI 15 15
Qualifying Capital 187,571 172,071
Total risk weighted assets 1,154,307 1,071,178
BIS ratio 16.25% 16.06%
The result ratio is significantly above both the required Basel ratio of 10.50% and the more conservative supervisors’ ratio of 11.50%.
Regarding Basel BIS ratio, the credit risk component comprises the largest part (92%) of the total risk weighted assets. The Bank utilizes the Standardized Approach, Standardized Measurement and Basic Indicator approach in assessing credit, market and operational risk respectively.
When accounting for 2014 profits (less dividends) within the qualifying capital, CAR will rise up to 17.57%. The bank also retains a relaxing leverage ratio of 7.43% as by the end of 2014.
In compliance with the second pillar of Basel 2 and the directives of the Lebanese supervisory authorities, the Bank performs Internal Capital Adequacy Assessment Process ICAAP periodically in order to assess the Bank entire risk profile on both quantitative and qualitative bases, and consequently have an estimate of its economic capital.
39

TEA
MW
OR
K

TEA
MW
OR
K

TEAMWORKIS ABOUT MORE THAN GREATINDIVIDUALS BROUGHT TOGETHER.IT’S ABOUT GREAT INDIVIDUALS WORKING AS ONE.

INDEPENDENT AUDITORS’ REPORT
Independent Auditors’ Reportto the shareholders of Fenicia Bank S.A.L.
Reportonthefinancialstatements
We have audited the accompanying financial statements of Fenicia Bank S.A.L. (“the Bank”) which comprise the balance sheet as of 31 December 2014 and the statements of comprehensive income, changes in equity and cash flows for the year then ended, and a summary of significant accounting policies and other explanatory notes.
Management’sresponsibilityforthefinancialstatements
Management is responsible for the preparation and fair presentation of these financial statements in accordance with International Financial Reporting Standards (IFRSs), and for such internal control as management determines is necessary to enable the preparation of financial statements that are free from material misstatement, whether due to fraud or error.
Auditors’responsibility
Our responsibility is to express an opinion on these financial statements based on our audit. We conducted our audit in accordance with International Standards on Auditing. Those standards require that we comply with ethical requirements and plan and perform the audit to obtain reasonable assurance about whether the financial statements are free from material misstatement.
An audit involves performing procedures to obtain audit evidence about the amounts and disclosures in the financial statements. The procedures selected depend on the auditors’ judgment, including the assessment of the risks of material misstatement of the financial statements, whether due to fraud or error. In making those risk assessments, the auditor considers internal control relevant to the entity’s preparation and fair presentation of the financial statements in order to design audit procedures that are appropriate in the circumstances, but not for the purpose of expressing an opinion on the effectiveness of the entity’s internal control. An audit also includes evaluating the appropriateness of accounting policies used and the reasonableness of accounting estimates made by management, as well as evaluating the overall presentation of the financial statements.
FIN
ANC
IAL
STAT
EMEN
TS &
NO
TES
44

We believe that the audit evidence we have obtained is sufficient and appropriate to provide a basis for our audit opinion.
Opinion
In our opinion, the accompanying financial statements present fairly, in all material respects, the financial position of Fenicia Bank S.A.L. as at 31 December 2014, and its financial performance and its cash flows for the year then ended in accordance with International Financial Reporting Standards (IFRSs).
PricewaterhouseCoopers Grant Thornton
Beirut, Lebanon30 April 2015
45
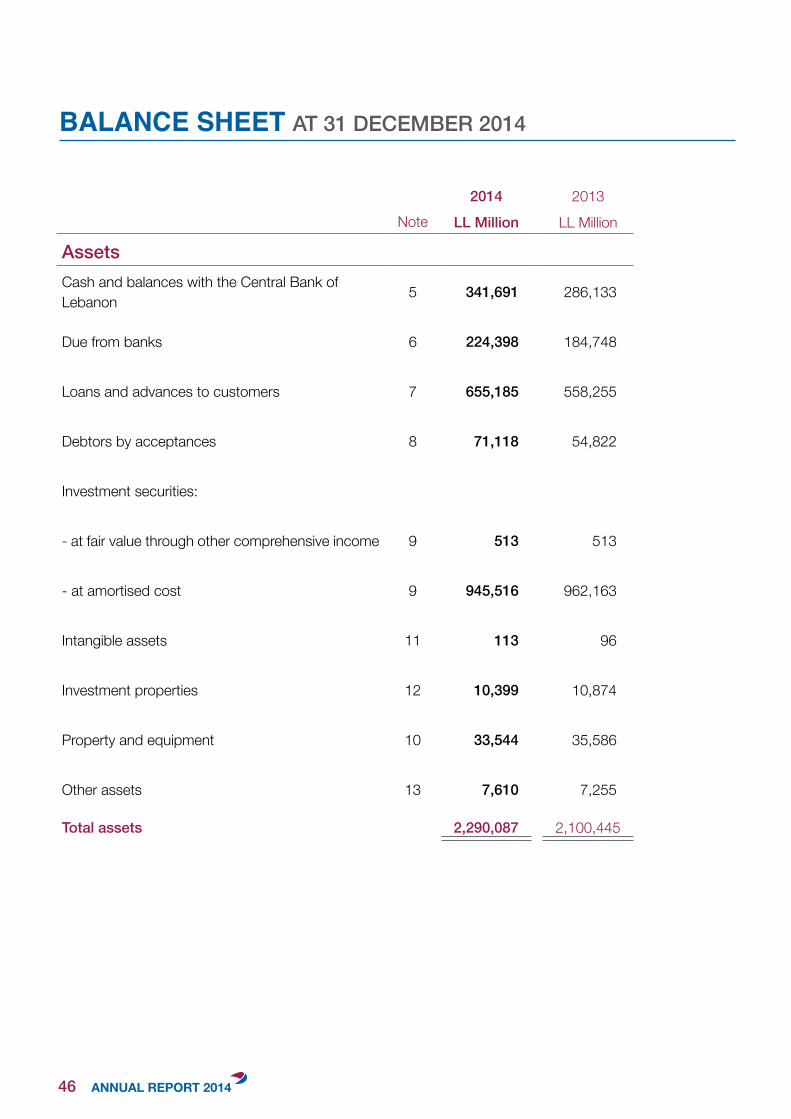
BALANCE SHEET AT 31 DECEMBER 2014
2014 2013Note LL Million LL Million
AssetsCash and balances with the Central Bank of Lebanon 5 341,691 286,133
Due from banks 6 224,398 184,748
Loans and advances to customers 7 655,185 558,255
Debtors by acceptances 8 71,118 54,822
Investment securities:
- at fair value through other comprehensive income 9 513 513
- at amortised cost 9 945,516 962,163
Intangible assets 11 113 96
Investment properties 12 10,399 10,874
Property and equipment 10 33,544 35,586
Other assets 13 7,610 7,255
Total assets 2,290,087 2,100,445
46
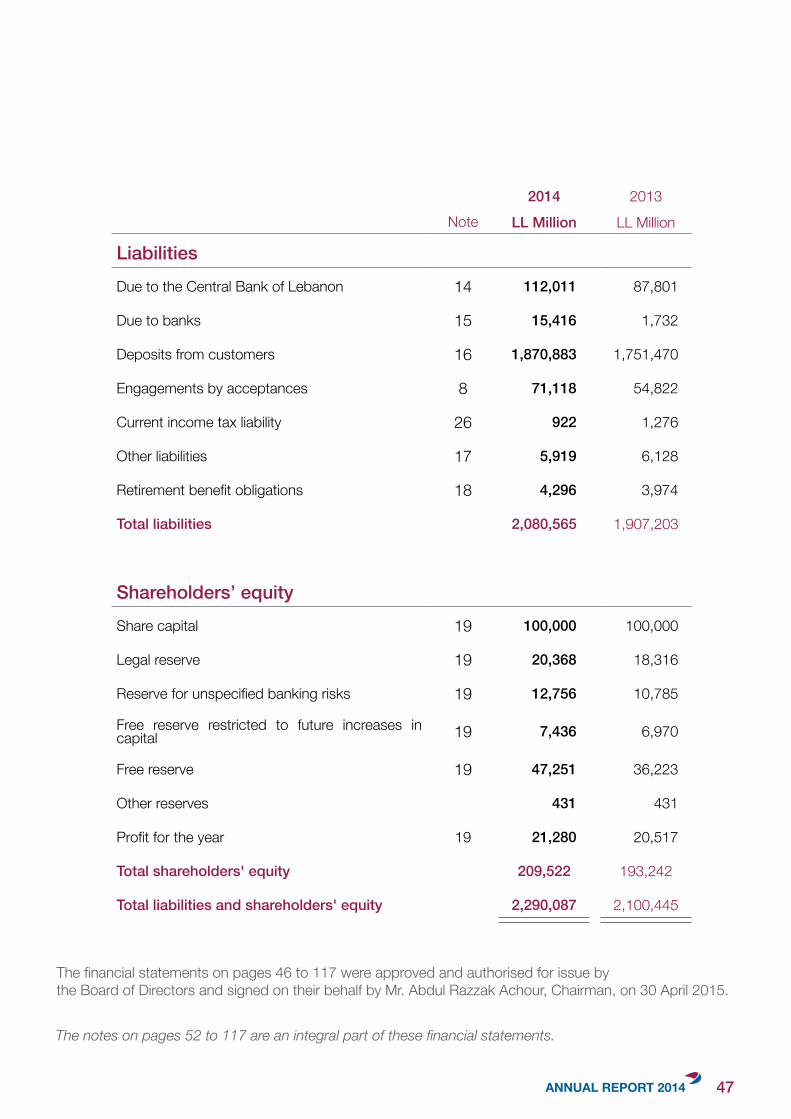
2014 2013Note LL Million LL Million
LiabilitiesDue to the Central Bank of Lebanon 14 112,011 87,801
Due to banks 15 15,416 1,732
Deposits from customers 16 1,870,883 1,751,470
Engagements by acceptances 8 71,118 54,822
Current income tax liability 26 922 1,276
Other liabilities 17 5,919 6,128
Retirement benefit obligations 18 4,296 3,974
Total liabilities 2,080,565 1,907,203
Shareholders’ equityShare capital 19 100,000 100,000
Legal reserve 19 20,368 18,316
Reserve for unspecified banking risks 19 12,756 10,785
Free reserve restricted to future increases in capital 19 7,436 6,970
Free reserve 19 47,251 36,223
Other reserves 431 431
Profit for the year 19 21,280 20,517
Total shareholders' equity 209,522 193,242
Total liabilities and shareholders' equity 2,290,087 2,100,445
The financial statements on pages 46 to 117 were approved and authorised for issue by the Board of Directors and signed on their behalf by Mr. Abdul Razzak Achour, Chairman, on 30 April 2015.
The notes on pages 52 to 117 are an integral part of these financial statements.
47
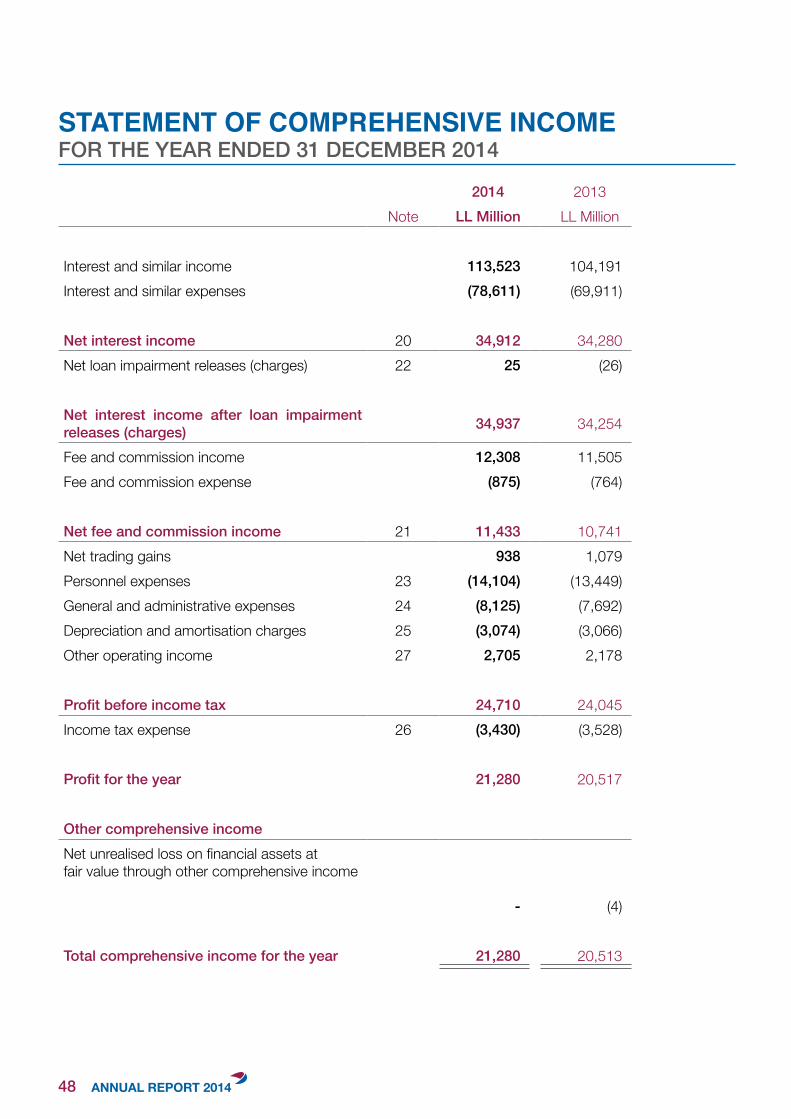
STATEMENT OF COMPREHENSIVE INCOMEFOR THE YEAR ENDED 31 DECEMBER 2014
2014 2013Note LL Million LL Million
Interest and similar income 113,523 104,191Interest and similar expenses (78,611) (69,911)
Net interest income 20 34,912 34,280Net loan impairment releases (charges) 22 25 (26)
Net interest income after loan impairment releases (charges) 34,937 34,254
Fee and commission income 12,308 11,505Fee and commission expense (875) (764)
Net fee and commission income 21 11,433 10,741Net trading gains 938 1,079Personnel expenses 23 (14,104) (13,449)General and administrative expenses 24 (8,125) (7,692)Depreciation and amortisation charges 25 (3,074) (3,066)Other operating income 27 2,705 2,178
Profit before income tax 24,710 24,045Income tax expense 26 (3,430) (3,528)
Profit for the year 21,280 20,517
Other comprehensive incomeNet unrealised loss on financial assets atfair value through other comprehensive income
- (4)
Total comprehensive income for the year 21,280 20,513
48
STAT
EMEN
T O
F C
HA
NG
ES IN
EQ
UIT
YFO
R TH
E YE
AR E
ND
ED 3
1 D
ECEM
BER
2014
Shar
e C
apita
lLe
gal
rese
rve
Rese
rve
for
unsp
ecifi
ed
bank
ing
risks
Free
re
serv
e fo
r cap
ital
incr
ease
Appr
opria
tion
of p
rofit
for
the
year
Free
re
serv
eO
ther
re
serv
esTo
tal
LL M
illion
LL M
illion
LL M
illion
LL M
illion
LL M
illion
LL M
illion
LL M
illion
LL M
illion
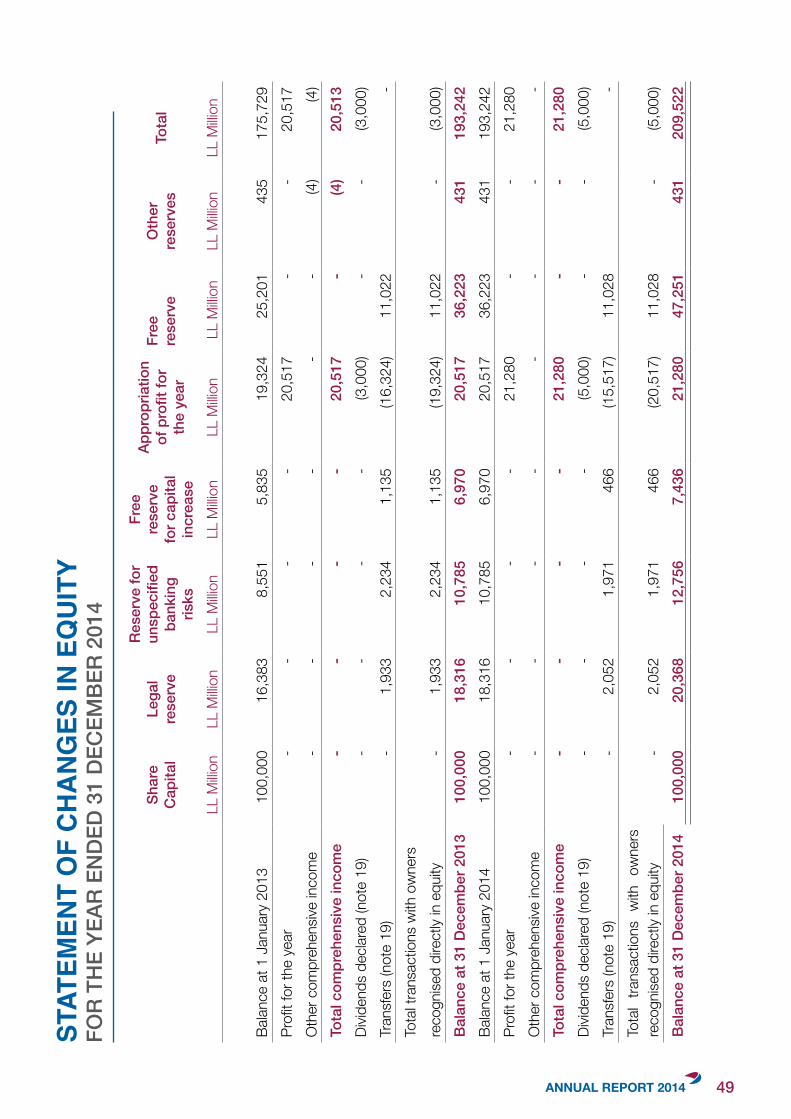
Balan
ce a
t 1 J
anua
ry 2
013
100,
000
16,3
83
8,55
1 5
,835
19
,324
2
5,20
1 43
517
5,72
9Pr
ofit f
or th
e ye
ar-
- -
- 2
0,51
7 -
- 2
0,51
7O
ther
com
preh
ensiv
e in
com
e -
--
--
-(4
) (4
)To
tal c
ompr
ehen
sive
inco
me
--
--
20,5
17 -
(4)
20,
513
Divid
ends
dec
lared
(not
e 19
) -
--
- (3
,000
)-
-(3
,000
)Tr
ansf
ers
(not
e 19
) -
1,93
3 2,
234
1,1
35
(16,
324)
11,0
22
-To
tal t
rans
actio
ns w
ith o
wne
rs
reco
gnise
d di
rect
ly in
equ
ity
-1,
933
2,23
41,
135
(19,
324)
11,0
22-
(3,0
00)
Bala
nce
at 3
1 D
ecem
ber 2
013
100,
000
18,3
16
10,
785
6,9
70
20,
517
36,2
23
431
193
,242
Balan
ce a
t 1 J
anua
ry 2
014
100,
000
18,3
16
10,
785
6,9
70
20,
517
36,2
23
431
193
,242
Profi
t for
the
year
-
--
-21
,280
- -
21,2
80O
ther
com
preh
ensiv
e in
com
e -
--
--
--
-To
tal c
ompr
ehen
sive
inco
me
--
--
21,2
80 -
-21
,280
Divid
ends
dec
lared
(not
e 19
) -
--
- (5
,000
) -
- (5
,000
)Tr
ansf
ers
(not
e 19
) -
2,05
2 1
,971
4
66
(15,
517)
11,
028
-To
tal
trans
actio
ns w
ith o
wne
rs
reco
gnise
d di
rect
ly in
equ
ity
-2,
052
1,97
146
6(2
0,51
7)11
,028
-(5
,000
)Ba
lanc
e at
31
Dec
embe
r 201
410
0,00
020
,368
12,7
567,
436
21,2
8047
,251
431
209,
522
49
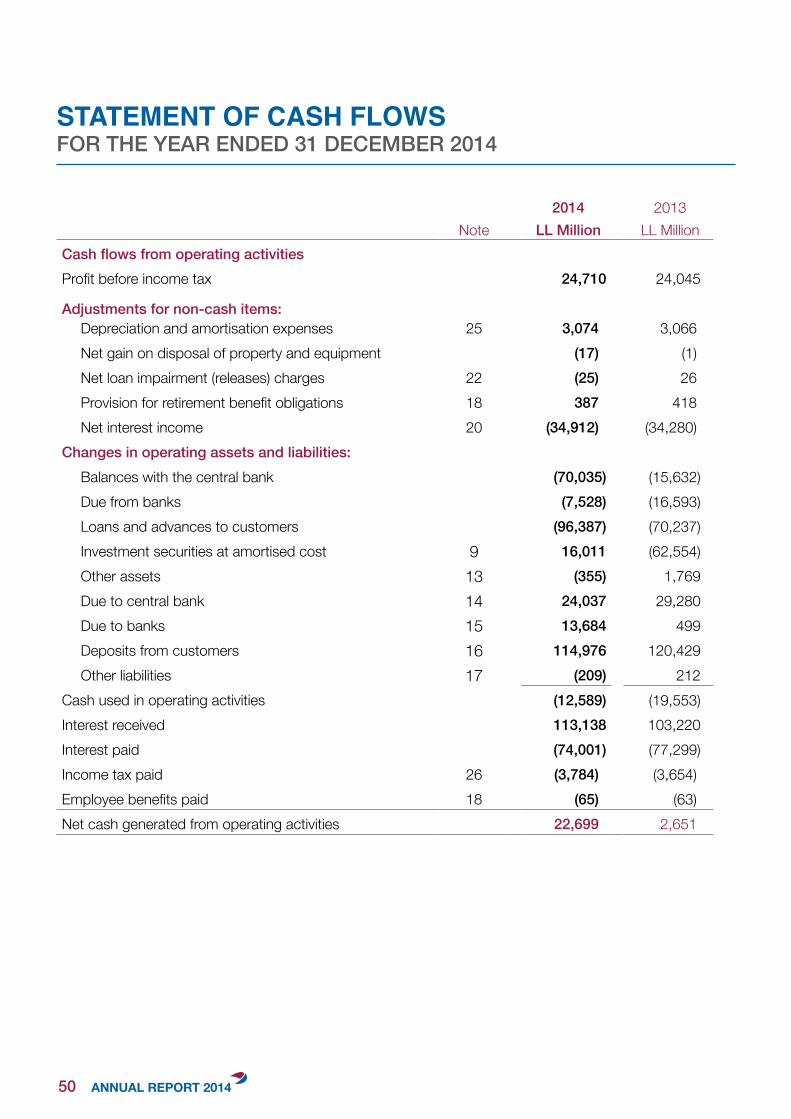
STATEMENT OF CASH FLOWSFOR THE YEAR ENDED 31 DECEMBER 2014
2014 2013Note LL Million LL Million
Cash flows from operating activities Profit before income tax 24,710 24,045
Adjustments for non-cash items: Depreciation and amortisation expenses 25 3,074 3,066Net gain on disposal of property and equipment (17) (1)Net loan impairment (releases) charges 22 (25) 26Provision for retirement benefit obligations 18 387 418Net interest income 20 (34,912) (34,280)
Changes in operating assets and liabilities: Balances with the central bank (70,035) (15,632)Due from banks (7,528) (16,593)Loans and advances to customers (96,387) (70,237)Investment securities at amortised cost 9 16,011 (62,554)Other assets 13 (355) 1,769Due to central bank 14 24,037 29,280Due to banks 15 13,684 499Deposits from customers 16 114,976 120,429Other liabilities 17 (209) 212
Cash used in operating activities (12,589) (19,553)Interest received 113,138 103,220Interest paid (74,001) (77,299)Income tax paid 26 (3,784) (3,654)Employee benefits paid 18 (65) (63)Net cash generated from operating activities 22,699 2,651
50
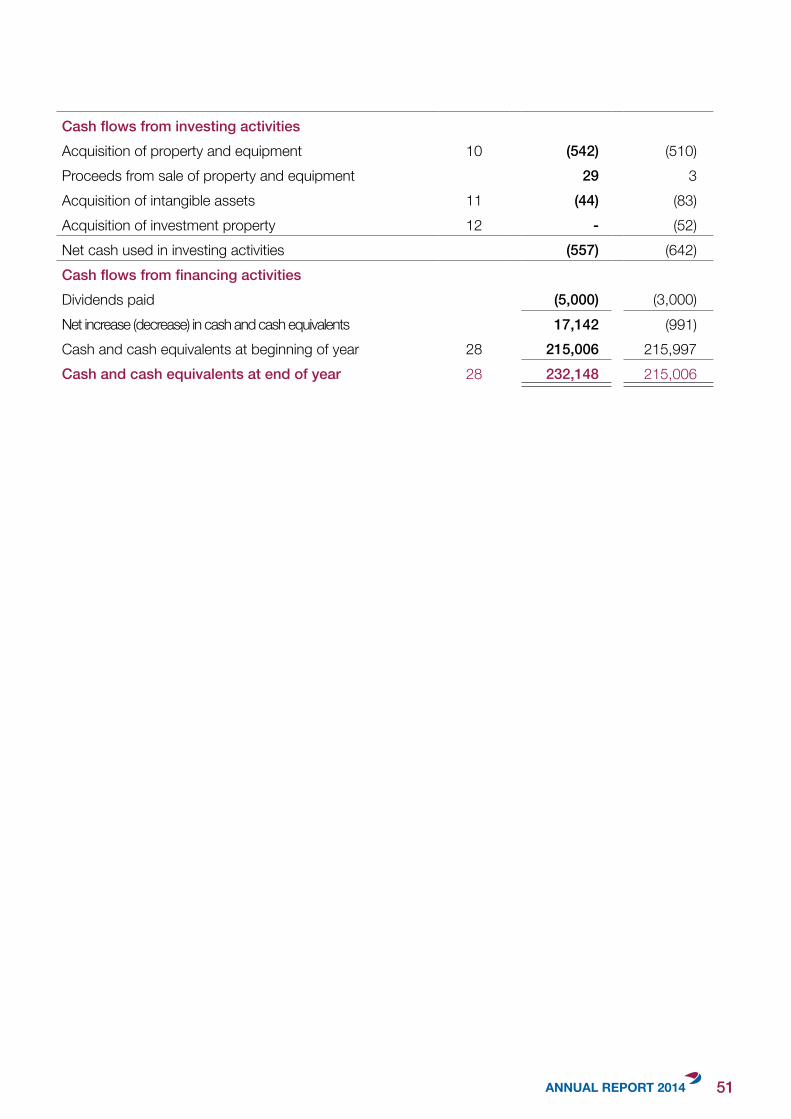
Cash flows from investing activitiesAcquisition of property and equipment 10 (542) (510)Proceeds from sale of property and equipment 29 3Acquisition of intangible assets 11 (44) (83)Acquisition of investment property 12 - (52)Net cash used in investing activities (557) (642)Cash flows from financing activitiesDividends paid (5,000) (3,000)Net increase (decrease) in cash and cash equivalents 17,142 (991)Cash and cash equivalents at beginning of year 28 215,006 215,997Cash and cash equivalents at end of year 28 232,148 215,006
51
NOTES TO THE FINANCIAL STATEMENTSFOR THE YEAR ENDED 31 DECEMBER 2014
1 | General information
Fenicia Bank S.A.L. (the “Bank”) is a Lebanese joint stock company registered since 1962 at the Lebanese Commercial Register in Beirut under No. 11923 in the name of Bank of Kuwait and the Arab World S.A.L. It is listed under number 58 in the list of Lebanese banks regulated by the Central Bank of Lebanon (“BDL”). The address of its registered office is as follows: P.O. Box: 113–6248, Beirut Central District, Beirut – Lebanon. The Bank has changed its name to Fenicia Bank S.A.L. on 20 December 2010.
The Bank offers a full range of retail, private and commercial banking activities to its customers. The Bank’s operations cover all districts in Lebanon.
2|SummaryofsignificantaccountingpoliciesThe principal accounting policies applied in the preparation of these financial statements are set out below. These policies have been consistently applied to all the years presented, unless otherwise stated.
2.1 | Basis of preparationThe financial statements have been prepared in accordance with International Financial Reporting Standards (“IFRS”) and IFRS Interpretation Committee (“IFRS IC”) interpretations as issued by the International Accounting Standards Board (“IASB”). The financial statements have been prepared under the historical cost convention, as modified by the revaluation of financial assets at fair value through other comprehensive income.
The preparation of financial statements in conformity with IFRS requires the use of certain critical accounting estimates. It also requires management to exercise its judgement in the process of applying the Bank’s accounting policies. The areas involving a higher degree of judgement or complexity, or areas where assumptions and estimates are significant to the financial statements are disclosed in note 4.
2.1.1 | Changes in accounting policies and disclosures
a.NewandamendedstandardsadoptedbytheBank
The following standards have been adopted by the Bank for the first time for the financial year beginning on or after 1 January 2014 and do not have a material impact on the Bank:
- Amendment to IAS 32, ‘Financial instruments: Presentation’, on asset and liability offsetting. These amendments are to the application guidance in IAS 32, ‘Financial instruments: Presentation’, and clarify some of the requirements for offsetting financial assets and financial liabilities on the balance sheet.
- Amendment to IAS 36, ‘Impairment of assets’ on recoverable amounts disclosures for non-financial assets. This amendment removed certain disclosures of the recoverable amount of impaired assets if that amount is based on fair value less costs of disposal.
52
b.Newstandards,amendmentsandinterpretationsissuedbutnoteffectiveforthefinancialyearbeginningonorafter1January2014butnotearlyadoptedbytheBank
- Amendment to IAS 19, ‘Employee benefits’ regarding employee or third party contributions to defined benefit plans. The objective of the amendment is to simplify the accounting for contributions that are independent of the number of years of employee service, for example employee contributions that are calculated according to a fixed percentage of salary. The impact of this amendment is not expected to be significant on the Bank’s financial statements.
- IFRS 13, ‘Fair value’ amended the basis of conclusions to clarify that it did not intend to remove the ability to measure short term receivables and payables at invoice amounts where the effect of discounting is immaterial. The impact of this amendment is not expected to be significant on the Bank’s financial statements.
- In July 2014, the IASB issued the final version of IFRS 9 Financial Instruments (IFRS 9 (2014)) which reflects all phases of the financial instruments project and replaces IAS 39 Financial Instruments: Recognition and Measurement and all previous versions of IFRS 9. The standard introduces new requirements for classification and measurement, impairment, and hedge accounting. In prior years the Bank has early adopted IFRS 9 (2011) which includes the requirements for the classification and measurement. IFRS 9 (2014) is effective for annual periods beginning on or after 1 January 2018, with early application permitted. Retrospective application is required, but comparative information is not compulsory. IFRS 9 (2014) relaxes the requirements for hedge effectiveness by replacing the bright line hedge effectiveness tests. It requires an economic relationship between the hedged item and hedging instrument and for the ‘hedged ratio’ to be the same as the one management actually use for risk management purposes. Contemporaneous documentation is still required but is different to that currently prepared under IAS 39. The adoption of IFRS 9 (2014) will have an effect on measuring impairment allowances based on a new expected credit loss model and on the classification and measurement of the Bank’s financial assets, but no impact on the classification and measurement of the Bank’s financial liabilities. The Bank is currently assessing the impact of IFRS 9 (2014) and plans to adopt the new standard on the required effective date.
2.2|Foreigncurrencytranslation
a.Functionalandpresentationcurrency
Items included in the financial statements of the Bank are measured using the currency of the primary economic environment in which the Bank operates (‘the functional currency’). The financial statements are presented in Lebanese Pounds (“LL”), which is the Bank’s functional and presentation currency. All figures are presented in LL million, unless specifically otherewise stated.
b. Transactions and balances
Foreign currency transactions are translated into the functional currency using the exchange rates prevailing at the dates of the transactions. Monetary items denominated in foreign currency are translated with the closing rate as at the reporting date. Non-monetary items measured at historical cost denominated in a foreign currency are translated with the exchange rate as at the date of initial recognition; non-monetary items in a foreign currency that are measured at fair value are translated using the exchange rates at the date when the fair value was determined. Foreign exchange gains and losses resulting from the settlement of such transactions and from the translation at year-end exchange rates of monetary assets and liabilities denominated in foreign currencies are recognised in the statement of comprehensive income.
53
Changes in the fair value of monetary securities denominated in foreign currency are analysed between translation differences resulting from changes in amortised cost of the security and other changes in the carrying amount of the security. Translation differences related to changes in amortised cost are recognised in profit or loss.
Translation differences on non-monetary financial assets and liabilities are recognised in the profit or loss as part of the fair value gain or loss. Translation differences on non-monetary financial instruments such as equities measured at fair value through other comprehensive income are included in other comprehensive income.
2.3 | Financial assets and liabilities
In accordance with IFRS 9 (as issued in 2011), all financial assets and liabilities have to be recognised in the balance sheet and measured in accordance with their assigned category.
2.3.1 | Date of recognition
All financial assets and liabilities are initially recognised on the trade date, i.e. the date that the Bank becomes a party to the contractual provisions of the instrument. This includes purchases or sales of financial assets that require delivery of assets within the time frame generally established by regulation or convention in the market place.
2.3.2|Classificationandmeasurement
a. Financial assets
The Bank classifies its financial assets as measured at fair value or at amortised cost. The classification depends on the purpose for which the financial assets were acquired. Management determines the classification of its financial assets at initial recognition.
(i) Financial assets at amortised cost
Debt instruments are subsequently measured at amortised cost less any impairment loss (except for debt instruments that are designated at fair value through profit or loss upon initial recognition) if they meet the following two conditions: - The asset is held within a business model whose objective is to hold assets in order to collect
contractual cash flows; and- The contractual terms of the instrument give rise on specified dates to cash flows that are solely
payments of principal and interest on the principal amount outstanding.
These financial assets are initially recognised at cost, being the fair value of the consideration paid for the acquisition of the investment. All transaction costs directly attributed to the acquisition are also included in the cost of investment. After initial measurement, these financial assets are measured at amortised cost using the effective interest rate method (EIR), less allowance for impairment. Amortised cost is calculated by taking into account any discount of premium on acquisition and fees and costs that are an integral part of the effective interest rate. The amortisation is included in “Interest and similar income” in the statement of comprehensive income. The losses arising from impairment are recognised in the statement of comprehensive income in “Net gains (losses) on financial assets at amortised cost”.
54
Gains and losses arising from the derecognition of financial assets measured at amortised cost are reflected under “Net gains (losses) from sale of financial assets at amortised cost” in the statement of comprehensive income.
(ii) Financial assets at fair value
Included in this category are those debt instruments that do not meet the conditions in “Financial assets at amortised cost” above, debt instruments designated at fair value through profit or loss upon initial recognition, and equity instruments at fair value through profit or loss.
Debt instruments at fair value through profit or loss
The Bank has not designated any debt instruments as measured at fair value through profit or loss to eliminate or significantly reduce an accounting mismatch. Equity instruments at fair value through profit or loss
Investments in equity instruments are classified at fair value through profit or loss, unless the Bank designates irrevocably at initial recognition an investment that is not held for trading as at fair value through other comprehensive income.
b. Financial liabilities
Liabilities are initially measured at fair value plus, in the case of a financial liability not at fair value through profit or loss, particular transaction costs. Liabilities are subsequently measured at amortised cost or fair value.
The Bank classifies all financial liabilities as subsequently measured at amortised cost using the effective interest method, except for:
- financial liabilities at fair value through profit or loss (including derivatives); - financial liabilities that arise when a transfer of a financial asset does not qualify for derecognition or
when the continuing involvement approach applies;- financial guarantee contracts and commitments to provide a loan at a below-market interest rate
which after initial recognition are subsequently measured at the higher of the amount determined in accordance with IAS 37 “Provisions, Contingent Liabilities and Contingent Assets” and the amount initially recognised less, when appropriate, cumulative amortisation recognised in accordance with IAS 18 “Revenue”.
After initial measurement, due to Central Bank of Lebanon, due to banks and deposits from customers are measured at amortised cost less amounts repaid using the effective interest rate method. Amortised cost is calculated by taking into account any discount or premium on the issue and costs that are an integral part of the effective interest rate method.
55
2.3.3|Derecognitionoffinancialassetsandfinancialliabilities
(i) Financial assets
A financial asset (or, where applicable, a part of a financial asset or part of a group of similar financial assets) is derecognised when:
- the rights to receive cash flows from the asset have expired;- the Bank has transferred its rights to receive cash flows from the asset or has assumed an obligation
to pay the received cash flows in full without material delay to a third party under a ‘pass-through’ arrangement; and either:a. the Bank has transferred substantially all the risks and rewards of the asset, or b. the Bank has neither transferred nor retained substantially all the risks and rewards of the asset,
but has transferred control of the asset.
When the Bank has transferred its rights to receive cash flows from an asset or has entered into a pass-through arrangement, and has neither transferred nor retained substantially all the risks and rewards of the asset nor transferred control of the asset, the asset is recognised to the extent of the Bank’s continuing involvement in the asset. In that case, the Bank also recognises an associated liability. The transferred asset and the associated liability are measured on a basis that reflects rights and obligations that the Bank has retained.
Continuing involvement that takes the form of a guarantee over the transferred asset is measured at the lower of the original carrying amount of the asset and the maximum amount of consideration that the Bank could be required to repay.
(ii) Financial liabilities
A financial liability is derecognised when the obligation under the liability is discharged or cancelled or expires. Where an existing financial liability is replaced by another from the same lender on substantially different terms, or the terms of an existing liability are substantially modified, such an exchange or modification is treated as a derecognition of the original liability and the recognition of a new liability. The difference between the carrying value of the original financial liability and the consideration paid is recognized in the statement of comprehensive income.
2.4|Offsettingfinancialinstruments
Financial assets and liabilities are offset and the net amount is reported in the balance sheet when there is a legally enforceable right to offset the recognised amounts or there is an intention to settle on a net basis, or realise the asset and settle the liability simultaneously.
Income and expenses are presented on a net basis only when permitted under IFRS, or for gains and losses arising from a group of similar transactions such as in the Bank’s trading activity.
2.5 | Fair value measurement
The Bank measures financial instruments and non-financial assets, at fair value at each statement of financial position date. Also, fair values of financial instruments measured at amortised cost are disclosed in the notes.
Fair value is the price that would be received to sell an asset or paid to transfer a liability in an orderly
56
transaction between market participants at the measurement date. The fair value measurement is based on the presumption that the transaction to sell the asset or transfer the liability takes place either:
- In the principal market for the asset or liability, or- In the absence of a principal market, in the most advantageous market for the asset or liability
The principal or the most advantageous market must be accessible by the Bank. The fair value of an asset or a liability is measured using the assumptions that market participants would use when pricing the asset or liability, assuming that market participants act in their economic best interest.
A fair value measurement of a non-financial asset takes into account a market participant’s ability to generate economic benefits by using the asset in its highest and best use or by selling it to another market participant that would use the asset in its highest and best use.
The Bank uses valuation techniques that are appropriate in the circumstances and for which sufficient data are available to measure fair value, maximising the use of relevant observable inputs and minimising the use of unobservable inputs.
All assets and liabilities for which fair value is measured or disclosed in the financial statements are categorised within the fair value hierarchy, described as follows, based on the lowest level input that is significant to the fair value measurement as a whole:
- Level 1 – Quoted (unadjusted) market prices in active markets for identical assets or liabilities- Level 2 – Valuation techniques for which the lowest level input that is significant to the fair value
measurement is directly or indirectly observable- Level 3 – Valuation techniques for which the lowest level input that is significant to the fair value
measurement is unobservable
For assets and liabilities that are recognised in the financial statements on a recurring basis, the Bank determines whether transfers have occurred between levels in the hierarchy by re-assessing categorisation (based on the lowest level input that is significant to the fair value measurement as a whole) at the end of each reporting period.
Management determines the policies and procedures for both recurring fair value measurement, such as investment properties and unquoted financial assets, and for non-recurring measurement.
At each reporting date, the management analyses the movements in the values of assets and liabilities which are required to be re-measured or re-assessed as per the Bank’s accounting policies. For this analysis, the management verifies the major inputs applied in the latest valuation by agreeing the information in the valuation computation to contracts and other relevant documents.
For the purpose of fair value disclosures, the Bank has determined classes of assets and liabilities on the basis of the nature, characteristics and risks of the asset or liability and the level of the fair value hierarchy as explained above.
57
2.6|Impairmentoffinancialassets
The Bank assesses at the end of each reporting period date whether there is any objective evidence that a financial asset or group of financial assets is impaired. A financial asset or a group of financial assets is impaired and impairment losses are incurred only if, and only if, there is objective evidence of impairment as a result of one or more events that has occurred after the initial recognition of the asset (a ‘loss event’) and that loss event (or events) has an impact on the estimated future cash flows of the financial asset or the group of financial assets that can be reliably estimated.
Evidence of impairment may include indications that the borrower or a group of borrowers is experiencing significant financial difficulty, the probability that they will enter bankruptcy or other financial reorganisation, default or delinquency in interest or principal payments, and where observable data indicates that there is a measurable decrease in the estimated future cash flows, such as changes in arrears or economic conditions that correlate with defaults.
Financial assets carried at amortised cost
For financial assets carried at amortised cost, the Bank first assesses individually whether objective evidence of impairment exists for financial assets that are individually significant, or collectively for financial assets that are not individually significant. If the Bank determines that no objective evidence of impairment exists for an individually assessed financial asset, it includes the asset in a group of financial assets with similar credit risk characteristics and collectively assesses them for impairment. Assets that are individually assessed for impairment and for which an impairment loss is, or continues to be, recognised are not included in a collective assessment of impairment.
If there is objective evidence that an impairment loss has been incurred, the amount of the loss is measured as the difference between the asset’s carrying amount and the present value of estimated future cash flows (excluding future expected credit losses that have not yet been incurred). The carrying amount of the asset is reduced through the use of an allowance account and the amount of the loss is recognized in the statement of comprehensive income.
Loans together with the associated allowance are written off when there is no realistic prospect of future recovery and all collateral has been realised or has been transferred to the Bank. If, in a subsequent year, the amount of the estimated impairment loss increases or decreases because of an event occurring after the impairment was recognised, the previously recognized impairment loss is increased or reduced by adjusting the allowance account. If a future write-off is later recovered, the recovery is credited to the ‘Net loan impairment charges’ in the statement of comprehensive income.
The present value of the estimated future cash flows is discounted at the financial asset’s original effective interest rate. If a loan has a variable interest rate, the discount rate for measuring any impairment loss is the current effective interest rate. The calculation of the present value of the estimated future cash flows of a collateralised financial asset reflects the cash flows that may result from foreclosure less costs of obtaining and selling the collateral, whether or not the foreclosure is probable.
For the purpose of a collective evaluation of impairment, financial assets are grouped on the basis of the Bank’s internal credit grading system, that considers credit risk characteristics such as asset type, industry, geographical location, collateral type, past-due status and other relevant factors.
Future cash flows on a group of financial assets that are collectively evaluated for impairment are estimated on the basis of historical loss experience for assets with credit risk characteristics similar to those in
58
the Bank. Historical loss experience is adjusted on the basis of current observable data to reflect the effects of current conditions on which the historical loss experience is based and to remove the effects of conditions in the historical period that do not exist currently.
Estimates of changes in future cash flows reflect, and are directionally consistent with, changes in related observable data from year to year (such as changes in unemployment rates, property prices, commodity prices, payment status, or other factors that are indicative of incurred losses in the Bank and their magnitude). The methodology and assumptions used for estimating future cash flows are reviewed regularly to reduce any differences between loss estimates and actual loss experience.
Renegotiated loansLoans that are either subject to collective impairment assessment or individually significant and whose terms have been renegotiated are no longer considered to be past due but are treated as new loans. In subsequent years, the asset is considered to be past due and disclosed only if renegotiated again.
2.7 | Leases
The determination of whether an arrangement is a lease or contains a lease, is based on the substance of the arrangement is dependent on the use of a specific asset or assets and the arrangement conveys a right to use the asset.
Banks as a lessee
Leases which do not transfer to the Bank substantially all the risks and benefits identical to ownership of the leased items are operating leases. Operating lease payments are recognised as an expense in the statement of comprehensive income on a straight line basis over the lease term. Contingent rental payable are recognised as an expense in the period in which they are incurred.
Banks as a lessor
Leases where the Bank does not transfer substantially all the risks and benefits of ownership of the asset are classified as operating leases. Initial direct costs incurred in negotiating operating leases are added to the carrying amount of the leased asset and recognized over the lease term on the same basis as rental income. Contingent assets are recognized as revenue in the period in which they are earned.
2.8 | Recognition of income and expenses
Revenue is recognised to the extent that it is probable that the economic benefits will flow to the Bank and the revenue can be reliably measured. The following specific recognition criteria must also be met before revenue is recognised.
(i) Interest and similar income and expenses
For all financial instruments measured at amortised cost, and financial instruments designated at fair value through profit or loss, interest income or expense is recorded using the effective interest rate, which is the rate that exactly discounts estimated future cash payments or receipts through the expected life of the financial instrument or a shorter period, where appropriate, to the net carrying amount of the financial asset or financial liability. The calculation takes into account all contractual terms of the financial instrument and includes any fees or incremental costs that are directly attributable to the instrument and are an integral part of the effective interest rate, but not future credit losses.
59
The carrying amount of the financial asset or financial liability is adjusted if the Bank revises its estimates of payments or receipts. The adjusted carrying amount is calculated based on the original effective interest rate and the change in the carrying amount is recorded as “Interest and similar income” for financial assets and “Interest and similar expense” for financial liabilities.
Once the recorded value of a financial asset or a group of similar financial assets has been reduced due to an impairment loss, interest income continues to be recognised using the rate of interest used to discount the future cash flows for the purpose of measuring the impairment loss.
(ii) Fee and commission income
The Bank earns fee and commission income from a diverse range of services it provides to its customers.
Fees earned for the provision of services over a period of time are accrued over that period. These fees include private banking, custody and other management and advisory fees.
Loan commitment fees for loans that are likely to be drawn down and other credit related fees are deferred (together with any incremental costs) and recognised as an adjustment to the effective interest rate on the loan. When it is unlikely that a loan be drawn down, the loan commitment fees are recognised over the commitment period on a straight line basis.
(iii) Dividend income
Dividend income is recognised when the right to receive income is established. Usually, this is the ex-dividend date for quoted equity securities. Dividends are presented in net trading income, net of income from other financial instruments at fair value through profit or loss or other revenue based on the underlying classification of the equity investment.
2.9 | Cash and cash equivalents
Cash and cash equivalents comprise balances with less than three months’ maturity from the date of acquisition, including cash in hand, deposits held at call with banks and other short-term highly liquid investments with original maturities of three months or less.
2.10|Propertyandequipment
Land and buildings comprise mainly branches and offices. All property and equipment is stated at historical cost less depreciation. Historical cost includes expenditure that is directly attributable to the acquisition of the items.
Subsequent expenditures are included in the asset’s carrying amount or are recognised as a separate asset, as appropriate, only when it is probable that future economic benefits associated with the item will flow to the Bank and the cost of the item can be measured reliably. The carrying amount of the replaced part is derecognised. All other repair and maintenance costs are charged to other operating expenses during the financial period in which they are incurred.
Land is not depreciated. Depreciation of other assets is calculated using the straight-line method to
60
allocate their cost to their residual values over their estimated useful lives, as follows: Years
Buildings 50Leaseholds improvements 7Office and computer equipment 7-5Furniture and fixtures 13Vehicles 17
The assets’ residual values and useful lives are reviewed, and adjusted if appropriate, at each date of the balance sheet. Assets are reviewed for impairment whenever events or changes in circumstances indicate that the carrying amount may not be recoverable.
An asset’s carrying amount is written down immediately to its recoverable amount if the asset’s carrying amount is greater than its estimated recoverable amount. The recoverable amount is the higher of the asset’s fair value less costs to sell and value in use.
Gains and losses on disposals are determined by comparing proceeds with carrying amount. These are included in other operating income in the statement of comprehensive income.
2.11 | Intangible assets
Intangible assets comprise mainly computer software licences. Intangible assets are stated at cost. Intangible assets with a definite useful life are amortised using the straight-line method over their estimated useful economic life. Intangible assets with an indefinite useful life are not amortised. At each date of the balance sheet, intangible assets are reviewed for indications of impairment or changes in estimated future economic benefits. If such indications exist, the intangible assets are analysed to assess whether their carrying amount is fully recoverable. An impairment loss is recognised if the carrying amount exceeds the recoverable amount.
Computer software licences
Acquired computer software licences are capitalised on the basis of the costs incurred to acquire and bring to use the specific software. These costs are amortised on the basis of the expected useful lives. Software has a maximum expected useful life of 5 years.
2.12 | Investment properties
Properties that are held for long-term rental yields or for capital appreciation or both, and that are not occupied by the Bank, are classified as investment properties. Investment properties comprise office buildings leased out under operating lease agreements.
Some properties may be partially occupied by the Bank, with the remainder being held for rental income or capital appreciation. If that part of the property occupied by the Bank can be sold separately, the Bank accounts for the portions separately. The portion that is owner-occupied is accounted for as property and equipment, and the portion that is held for rental income or capital appreciation or both is treated as investment property. When the portions cannot be sold separately, the whole property is treated as investment property only if an insignificant portion is owner-occupied. In order to determine the percentage of the portions, the Bank uses the size of the property measured in square meter. Investment properties are measured initially at cost, including transaction costs. The carrying amount
61
includes the cost of replacing parts of an existing investment property at the time the cost has incurred if the recognition criteria are met; and excludes the costs of day-to-day servicing of an investment property. Subsequent to initial recognition, investment properties are stated at cost less accumulated depreciation and impairment, if any. Subsequent expenditure is included in the asset’s carrying amount only when it is probable that future economic benefits associated with the item will flow to the Bank and the cost of the item can be measured reliably. All other repairs and maintenance costs are charged to the statement of comprehensive income during the financial period in which they are incurred.
Depreciation is calculated using the straight-line method to allocate their cost to their residual values over their estimated useful lives of 50 years.
The assets’ residual values and useful lives are reviewed, and adjusted if appropriate, at each date of the balance sheet. Assets are reviewed for impairment whenever events or changes in circumstances indicate that the carrying amount may not be recoverable.
An asset’s carrying amount is written down immediately to its recoverable amount if the asset’s carrying amount is greater than its estimated recoverable amount. The recoverable amount is the higher of the asset’s fair value less costs to sell and value in use.
Gains and losses on disposals are determined by comparing proceeds with carrying amount. These are included in other operating income in the statement of comprehensive income.
2.13|Impairmentofnon-financialassets
The Bank assesses at each reporting date whether there is an indication that an asset may be impaired. If any indication exists, or when annual impairment testing for an asset is required, the Bank estimates the asset’s recoverable amount. An asset’s recoverable amount is the higher of an asset’s or cash-generating unit’s fair value less costs to sell and its value in use. Where the carrying amount of an asset or cash-generating unit exceeds its recoverable amount, the asset is considered impaired and is written down to its recoverable amount. In assessing the value in use, the estimated future cash flows are discounted to their present value using a pre-tax discount rate that reflects current market assessments of the time value of money and the risks specific to the asset.
In determining fair value less costs to sell, an appropriate valuation model is used. These calculations are corroborated by valuation multiples, quoted share prices for publicly traded subsidiaries or other available fair value indicators.
For assets excluding goodwill, an assessment is made at each reporting date as to whether there is any indication that previously recognized impairment losses may no longer exist or may have decreased. If such indication exists, the recoverable amount is estimated. A previously recognised impairment loss is reversed only if there has been a change in the assumptions used to determine the asset’s recoverable amount since the last impairment loss was recognised.
The reversal is limited so that the carrying amount of the asset does not exceed its recoverable amount, nor exceeds the carrying amount that would have been determined, net of depreciation, had no impairment loss been recognized for the asset in prior years. Such reversal is recognised in the statement of comprehensive income.
Impairment losses relating to goodwill cannot be reversed in future periods.
62
2.14 | Financial guarantee contracts
Financial guarantee contracts are contracts that require the issuer to make specified payments to reimburse the holder for a loss it incurs because a specified debtor fails to make payments when due, in accordance with the terms of a debt instrument. Such financial guarantees are given to banks, financial institutions and other bodies on behalf of customers to secure loans, overdrafts and other banking facilities.
Financial guarantees are initially recognised in the financial statements at fair value on the date the guarantee was given. The fair value of a financial guarantee at the time of signature is zero because all guarantees are agreed on arm’s length terms and the value of the premium agreed corresponds to the value of the guarantee obligation. No receivable for the future premiums is recognised.
Subsequent to initial recognition, the Bank’s liabilities under such guarantees are measured at the higher of the initial amount, less amortisation of fees recognised in accordance with IAS 18, and the best estimate of the amount required to settle the guarantee. These estimates are determined based on experience of similar transactions and history of past losses, supplemented by the judgement of management. The fee income earned is recognised on a straight-line basis over the life of the guarantee. Any increase in the liability relating to guarantees is reported in the statement of comprehensive income within other operating expenses.
2.15|Retirementbenefitobligations
The Bank is subscribed to the compulsory defined benefit plan of the national social security fund.
IAS 19 ‘Employee benefits’ requirements:
A defined benefit plan is a pension plan that defines an amount of pension benefit that an employee will receive on retirement, usually dependent on one or more factors such as age, years of service or compensation. The liability recognised in the balance sheet in respect of the defined benefit plan is the present value of the defined benefit obligation at the balance sheet date less contributions to the fund. The present value of the defined benefit obligation is determined by discounting the estimated future cash outflows using interest rates of government securities that have terms to maturity approximating the terms of the related pension liability.
Local requirements:
The compulsory defined benefit plan varies according to each employee’s final salary and length of service, subject to the completion of a minimum service period. The provision is calculated based on the difference between total indemnities due and total monthly contributions paid to National Social Security Fund (‘‘NSSF’’), End-of-Service Indemnity contributions paid to NSSF represents 8.5 percent of employee benefits.
The difference between the carrying amount of the provision and its value in accordance with IAS 19 is not significant.
63
2.16 | Taxation
Taxation is provided for in accordance with the fiscal regulations applicable in Lebanon.
a. Current income tax
Current tax assets and liabilities for the current and prior years are measured at the amount expected to be recovered from or paid to the taxation authorities. The tax rates and tax laws used to compute the amount are those that are enacted or substantively enacted by the reporting date.
In accordance with article 51 of the law number 497/2003, the Bank is subject to tax withheld on interest income as well as corporate income tax. In case the tax on interest income exceeds the corporate income tax, the excess constitutes an additional tax charge and is not refundable to the Bank. The Bank’s tax charge is determined as the higher of the corporate tax and tax on interest income during the year.
The Bank is also subject to distribution tax of 10% on declared dividends.
b. Deferred income tax
Deferred tax is provided on temporary differences at the reporting date between the tax bases of assets and liabilities and their carrying amounts for financial reporting purposes. Deferred tax liabilities are recognized for all taxable temporary differences, except:
- Where the deferred tax liability arises from the initial recognition of goodwill or of an asset or liability in a transaction that is not a business combination and, at the time of the transaction, affects neither the accounting profit nor taxable profit or loss.
- In respect of taxable temporary differences associated with investments in subsidiaries, where the timing of the reversal of the temporary differences can be controlled and it is probable that the temporary differences will not reverse in the foreseeable future.
Deferred tax assets are recognised for all deductible temporary differences, carry forward of unused tax credits and unused tax losses, to the extent that it is probable that taxable profit will be available against which the deductible temporary differences, and the carry forward of unused tax credits and unused tax losses can be utilised except:
- Where the deferred tax asset relating to the deductible temporary difference arises from the initial recognition of an asset or liability in a transaction that is not a business combination and, at the time of the transaction, affects neither the accounting profit nor taxable profit or loss.
- In respect of deductible temporary differences associated with investments in subsidiaries, deferred tax assets are recognised only to the extent that it is probable that the temporary differences will reverse in the foreseeable future and taxable profit will be available against which the temporary differences can be utilised.
The carrying amount of deferred tax assets is reviewed at each statement of financial position date and reduced to the extent that it is no longer probable that sufficient taxable profit will be available to allow all or part of the deferred tax asset to be utilised. Unrecognised deferred tax assets are reassessed at each statement of financial position date and are recognised to the extent that it has become probable that future taxable profit will allow the deferred tax asset to be recovered.
64
Deferred tax assets and liabilities are measured at the tax rates that are expected to apply in the year when the asset is realised or the liability is settled, based on tax rates (and tax laws) that have been enacted or substantively enacted at the statement of financial position date.
Current tax and deferred tax relating to items recognised directly in equity are also recognised in equity and not in the statement of comprehensive income.
Deferred tax assets and deferred tax liabilities are offset if a legally enforceable right exists to set off current tax assets against current tax liabilities and the deferred taxes relate to the same taxable entity and the same taxation authority.
2.17 | Provisions
Provisions are recognised when the Bank has a present obligation (legal or constructive) as a result of past events; it is probable that an outflow of resources will be required to settle the obligation; and the amount has been reliably estimated. Provisions are not recognised for future operating losses.
Where there are a number of similar obligations, the likelihood that an outflow will be required in settlement is determined by considering the class of obligations as a whole. A provision is recognised even if the likelihood of an outflow with respect to any one item included in the same class of obligations may be small.
Provisions are measured at the present value of the expenditures expected to be required to settle the obligation using a pre-tax rate that reflects current market assessments of the time value of money and the risks specific to the obligation. The increase in the provision due to passage of time is recognised as interest expense.
2.18 | Share capital
Ordinary shares are classified as equity. Incremental costs directly attributable to the issue of new shares are shown in equity as a deduction, net of tax, from the proceeds.
2.19 | Dividend distribution
Dividend distribution to the Bank’s shareholders is recognised as a liability in the period in which the dividends are approved by the Bank’s shareholders.
3 | Financial risk management
The Bank’s business involves taking on risks in a targeted manner and managing them professionally. The core functions of the Bank’s risk management are to identify all key risks for the Bank, measure these risks, manage the risk positions and determine the capital allocations. The Bank regularly reviews its risk management policies and systems to reflect changes in markets, products, and best market practice.
The Bank’s aim is to achieve an appropriate balance between risk and return to minimise potential adverse effects on the Bank’s financial performance.
The Bank defines risk as the possibility of losses incurred or profits foregone, which may be caused by internal or external factors.
65
Risk management is carried out by the Bank’s risk management department under policies approved by the Board of Directors. The risk management department evaluates and hedges financial risks in close co-operation with the Bank’s operating units. The Board provides principles for overall risk management, as well as policies covering specific areas, such as foreign exchange risk, interest rate risk, credit risk, use of derivative financial instruments and non-derivative financial instruments The Bank’s Audit committee is responsible for monitoring compliance with the Bank’s risk management policies and procedures, and for reviewing the adequacy of the risk management framework in relation to the risks faced by the Bank. The Bank’s Audit committee is assisted in these functions by the internal audit department. Internal audit undertakes both regular and ad-hoc reviews for risk management controls and procedures, the results of which are reported to the Bank’s Audit committee.
The risks arising from financial instruments to which the Bank is exposed are financial risks, which include credit risk, market risk, liquidity risk and operational risk (which are discussed below).
3.1 | Credit risk
Credit risk is the risk of suffering financial loss, should any of the Bank’s customers, clients or market counterparties fail to fulfill their contractual obligations to the Bank. Credit risk arises mainly from commercial and retail loans and advances, and undrawn credit facilities arising from such lending activities, but can also arise from credit enhancement provided, such as financial guarantees, letters of credit, and acceptances.
The Bank is also exposed to other credit risks arising from investments in debt securities and balances with banks.
Credit risk is the largest risk for the Bank’s business; management therefore carefully manages its exposure to credit risk.
3.1.1 | Credit risk measurement
The estimation of credit exposure is complex and requires the use of models, as the value of a product varies with the changes in market variables, expected cash flows and the passage of time.
66
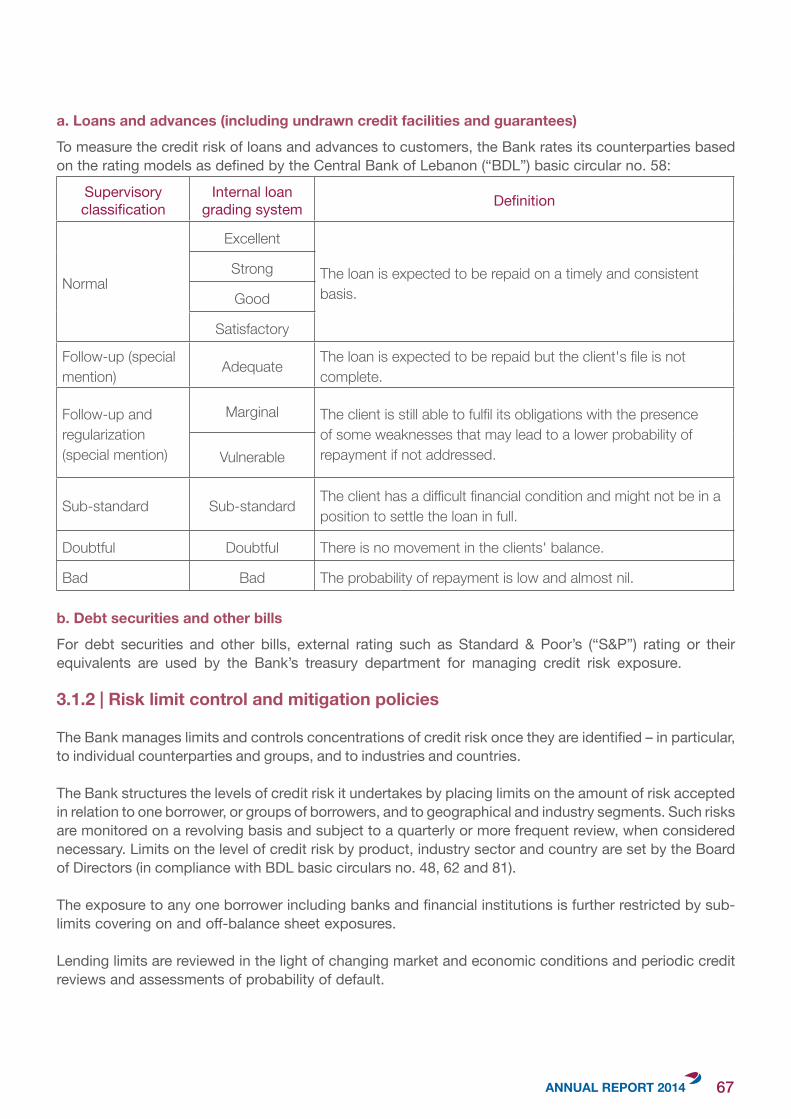
a. Loans and advances (including undrawn credit facilities and guarantees)
To measure the credit risk of loans and advances to customers, the Bank rates its counterparties based on the rating models as defined by the Central Bank of Lebanon (“BDL”) basic circular no. 58:
Supervisory classification
Internal loan grading system Definition
Normal
Excellent
The loan is expected to be repaid on a timely and consistent basis.
Strong
Good
Satisfactory
Follow-up (special mention) Adequate The loan is expected to be repaid but the client's file is not
complete.
Follow-up and regularization (special mention)
Marginal The client is still able to fulfil its obligations with the presence of some weaknesses that may lead to a lower probability of repayment if not addressed.Vulnerable
Sub-standard Sub-standard The client has a difficult financial condition and might not be in a position to settle the loan in full.
Doubtful Doubtful There is no movement in the clients' balance.
Bad Bad The probability of repayment is low and almost nil.
b. Debt securities and other bills
For debt securities and other bills, external rating such as Standard & Poor’s (“S&P”) rating or their equivalents are used by the Bank’s treasury department for managing credit risk exposure.
3.1.2 | Risk limit control and mitigation policies
The Bank manages limits and controls concentrations of credit risk once they are identified – in particular, to individual counterparties and groups, and to industries and countries.
The Bank structures the levels of credit risk it undertakes by placing limits on the amount of risk accepted in relation to one borrower, or groups of borrowers, and to geographical and industry segments. Such risks are monitored on a revolving basis and subject to a quarterly or more frequent review, when considered necessary. Limits on the level of credit risk by product, industry sector and country are set by the Board of Directors (in compliance with BDL basic circulars no. 48, 62 and 81).
The exposure to any one borrower including banks and financial institutions is further restricted by sub-limits covering on and off-balance sheet exposures.
Lending limits are reviewed in the light of changing market and economic conditions and periodic credit reviews and assessments of probability of default.
67
Some other specific control and mitigation measures are outlined below:
a. Collateral
The Bank employs a range of policies and practices to mitigate credit risk. The most traditional of these is the taking of security for funds advances, which is common practice. The Bank implements guidelines on the acceptability of specific classes of collateral or credit risk mitigation. The principal collateral types for loans and advances are:
- Real estate mortgages over residential properties against housing loans;- Real estate mortgages over commercial properties against commercial lending;- Charges over business assets such as premises, inventory, machinery and vehicles;- Personal, bank and public sector guarantees;- Salary domiciliation;- Letters of Credit and documentary collections; and- Cash collaterals.
Longer-term finance and lending to corporate entities are generally secured; revolving individual credit facilities are generally unsecured. In addition, in order to minimise the credit loss, the Bank will seek additional collateral from the counterparty as soon as impairment indicators are identified for the relevant individual loans and advances.
Collateral held as security for financial assets other than loans and advances is determined by the nature of the instrument. Debt securities, treasury and other eligible bills are generally unsecured.
b. Financial covenants (credit-related commitments)
The primary purpose of these instruments is to ensure that funds are available to a customer as required. Guarantees and standby letters of credit carry the same credit risk as loans. Documentary and commercial letters of credit – which are written undertakings by the Bank on behalf of a customer authorising a third party to draw drafts on the Bank up to a stipulated amount under specific terms and conditions – are collateralised by the underlying shipments of goods to which they relate in addition to a required credit margin set by the credit committee based on the credit rating of each customer and therefore carry less risk than a direct loan.
c. Financial covenants (credit-related commitments)
The primary purpose of these instruments is to ensure that funds are available to a customer as required. Guarantees and standby letters of credit carry the same credit risk as loans. Documentary and commercial letters of credit – which are written undertakings by the Bank on behalf of a customer authorising a third party to draw drafts on the Bank up to a stipulated amount under specific terms and conditions – are collateralised by the underlying shipments of goods to which they relate in addition to a required cash margin set by the credit committee based on the credit rating of each customer (usually a margin of 15% is blocked in compliance with BDL basic circular number 52) and therefore carry less risk than a direct loan.
Commitments to extend credit represent unused portions of authorisations to extend credit in the form of loans, guarantees or letters of credit. With respect to credit risk on commitments to extend credit, the Bank is potentially exposed to loss in an amount equal to the total unused commitments. However, the likely amount of loss is less than the total unused commitments, as most commitments to extend credit are contingent upon customers maintaining specific credit standards.
68
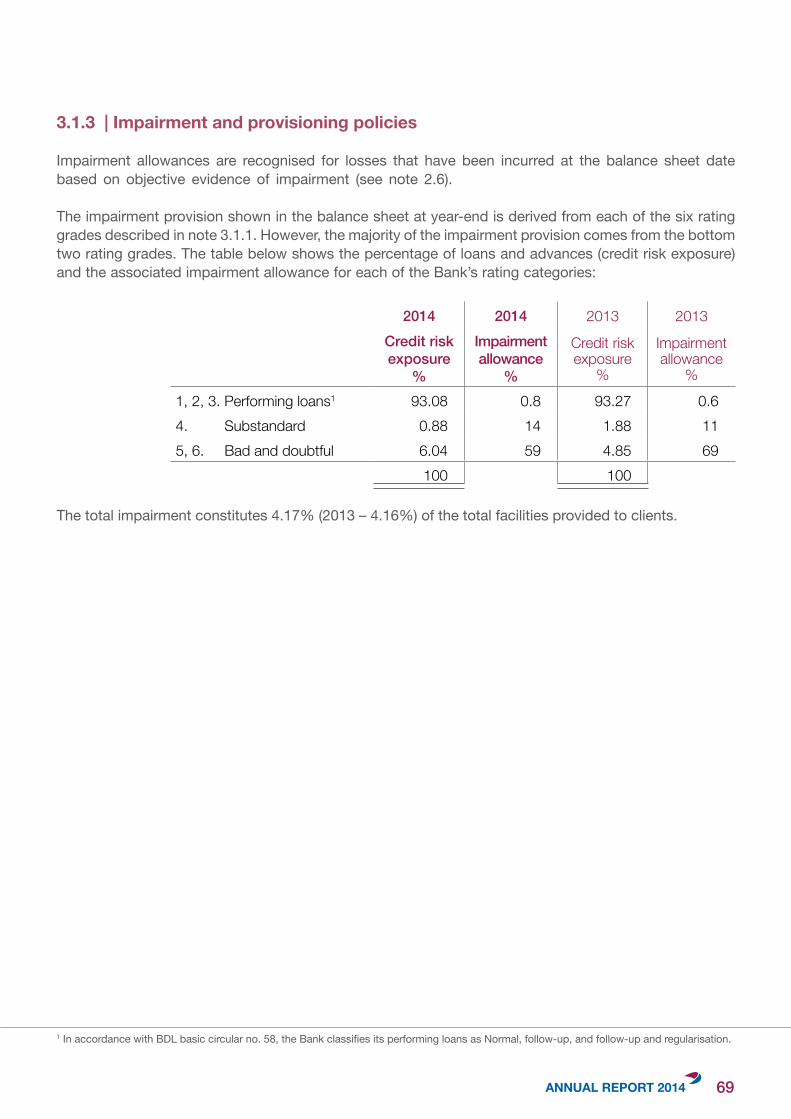
3.1.3 | Impairment and provisioning policies
Impairment allowances are recognised for losses that have been incurred at the balance sheet date based on objective evidence of impairment (see note 2.6).
The impairment provision shown in the balance sheet at year-end is derived from each of the six rating grades described in note 3.1.1. However, the majority of the impairment provision comes from the bottom two rating grades. The table below shows the percentage of loans and advances (credit risk exposure) and the associated impairment allowance for each of the Bank’s rating categories:
2014 2014 2013 2013Credit risk exposure
%
Impairment allowance
%
Credit risk exposure
%
Impairment allowance
%
1, 2, 3. Performing loans1 93.08 0.8 93.27 0.64. Substandard 0.88 14 1.88 115, 6. Bad and doubtful 6.04 59 4.85 69
100 100
The total impairment constitutes 4.17% (2013 – 4.16%) of the total facilities provided to clients.
1 In accordance with BDL basic circular no. 58, the Bank classifies its performing loans as Normal, follow-up, and follow-up and regularisation.
69
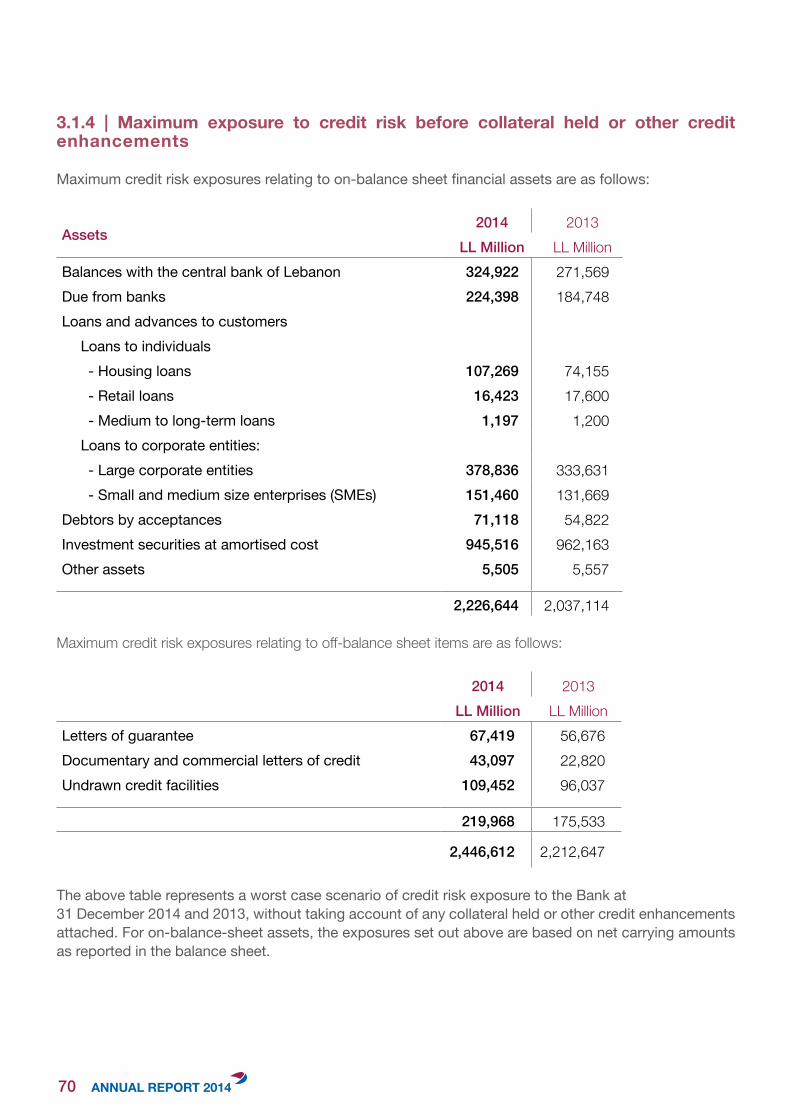
3.1.4 | Maximum exposure to credit risk before collateral held or other credit enhancements
Maximum credit risk exposures relating to on-balance sheet financial assets are as follows:
Assets2014 2013
LL Million LL MillionBalances with the central bank of Lebanon 324,922 271,569Due from banks 224,398 184,748Loans and advances to customers
Loans to individuals- Housing loans 107,269 74,155- Retail loans 16,423 17,600- Medium to long-term loans 1,197 1,200
Loans to corporate entities:- Large corporate entities 378,836 333,631- Small and medium size enterprises (SMEs) 151,460 131,669
Debtors by acceptances 71,118 54,822Investment securities at amortised cost 945,516 962,163Other assets 5,505 5,557
2,226,644 2,037,114
Maximum credit risk exposures relating to off-balance sheet items are as follows:
2014 2013LL Million LL Million
Letters of guarantee 67,419 56,676Documentary and commercial letters of credit 43,097 22,820Undrawn credit facilities 109,452 96,037
219,968 175,533
2,446,612 2,212,647
The above table represents a worst case scenario of credit risk exposure to the Bank at 31 December 2014 and 2013, without taking account of any collateral held or other credit enhancements attached. For on-balance-sheet assets, the exposures set out above are based on net carrying amounts as reported in the balance sheet.
70
As shown above, 39% of the total maximum exposure is derived from investment securities (2013 – 43%), 22% is derived from loans and advances to banks and balances with the Central Bank of Lebanon (2013 – 21%) and 27% is derived from loans and advances to customers (2013 – 25%).
Management is confident in its ability to continue to control and sustain minimal exposure of credit risk to the Bank resulting from its investments in Lebanese debt securities and placements at the Central Bank of Lebanon, from its investment in other banks and from its loans and advances to customers based on the following:
- 93.1% of the loans and advances portfolio is categorised in the top three grades of the internal rating system (2013 – 93.3%);
- 80.5% of the loans and advances portfolio are considered to be neither past due nor impaired (2013 – 79.8%);
- Investments in other banks are placed in highly rated banks;- The Bank has introduced a more stringent selection process upon granting loans and advances; - 99% of investments securities are Lebanese government securities: Treasury bills, Eurobonds and
certificates of deposit (2013 – 99%); and- None of the investment securities at amortised cost totaling LL 945.5 billion- (2013 – LL 962.2 billion) were either past due or impaired.
71
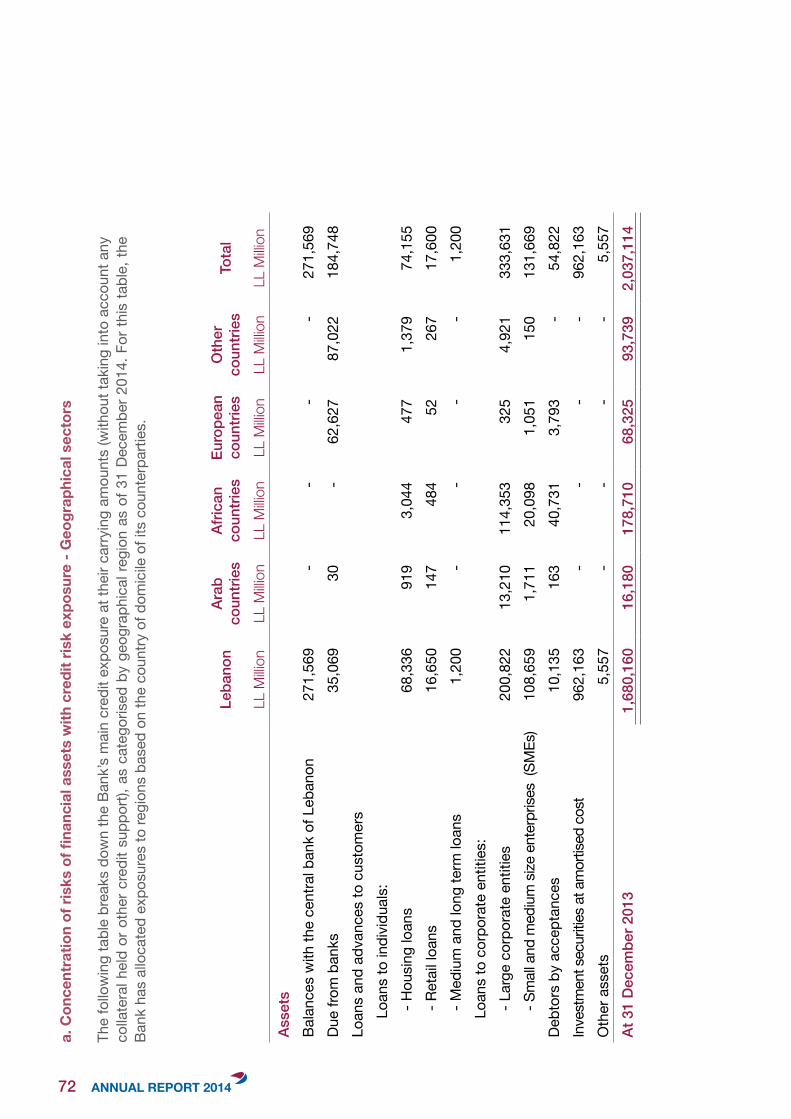
a.Con
centratio
nofrisksoffina
ncialassetswith
creditriskexpo
sure-Geo
grap
hica
lsec
tors
The
follo
win
g ta
ble
brea
ks d
own
the
Bank
’s m
ain
cred
it ex
posu
re a
t the
ir ca
rryin
g am
ount
s (w
ithou
t tak
ing
into
acc
ount
any
co
llate
ral h
eld
or o
ther
cre
dit s
uppo
rt), a
s ca
tego
rised
by
geog
raph
ical
regi
on a
s of
31
Dece
mbe
r 201
4. F
or th
is ta
ble,
the
Bank
has
allo
cate
d ex
posu
res
to re
gion
s ba
sed
on th
e co
untry
of d
omic
ile o
f its
cou
nter
parti
es.
Leba
non
Arab
coun
tries
Afric
anco
untri
esEu
rope
anco
untri
esO
ther
coun
tries
Tota
l
LL M
illion
LL M
illion
LL M
illion
LL M
illion
LL M
illion
LL M
illion
Asse
tsBa
lanc
es w
ith th
e ce
ntra
l ban
k of
Leb
anon
271,
569
--
--
271,
569
Due
from
ban
ks
35,0
6930
-62
,627
87,0
2218
4,74
8Lo
ans
and
adva
nces
to c
usto
mer
s Lo
ans
to in
divi
dual
s:
- Hou
sing
loan
s 68
,336
919
3,04
447
71,
379
74,1
55- R
etai
l loa
ns
16,6
5014
748
452
267
17,6
00- M
ediu
m a
nd lo
ng te
rm lo
ans
1,20
0 -
--
-1,
200
Loan
s to
cor
pora
te e
ntiti
es:
- Lar
ge c
orpo
rate
ent
ities
20
0,82
213
,210
114,
353
325
4,92
133
3,63
1- S
mal
l and
med
ium
size
ent
erpr
ises
(SM
Es)
108,
659
1,71
120
,098
1,05
115
013
1,66
9De
btor
s by
acc
epta
nces
10
,135
163
40,7
313,
793
-54
,822
Inve
stm
ent s
ecur
ities
at a
mor
tised
cos
t 96
2,16
3-
--
-96
2,16
3O
ther
ass
ets
5,55
7 -
--
-5,
557
At 3
1 D
ecem
ber 2
013
1,68
0,16
016
,180
178,
710
68,3
2593
,739
2,03
7,11
4
72
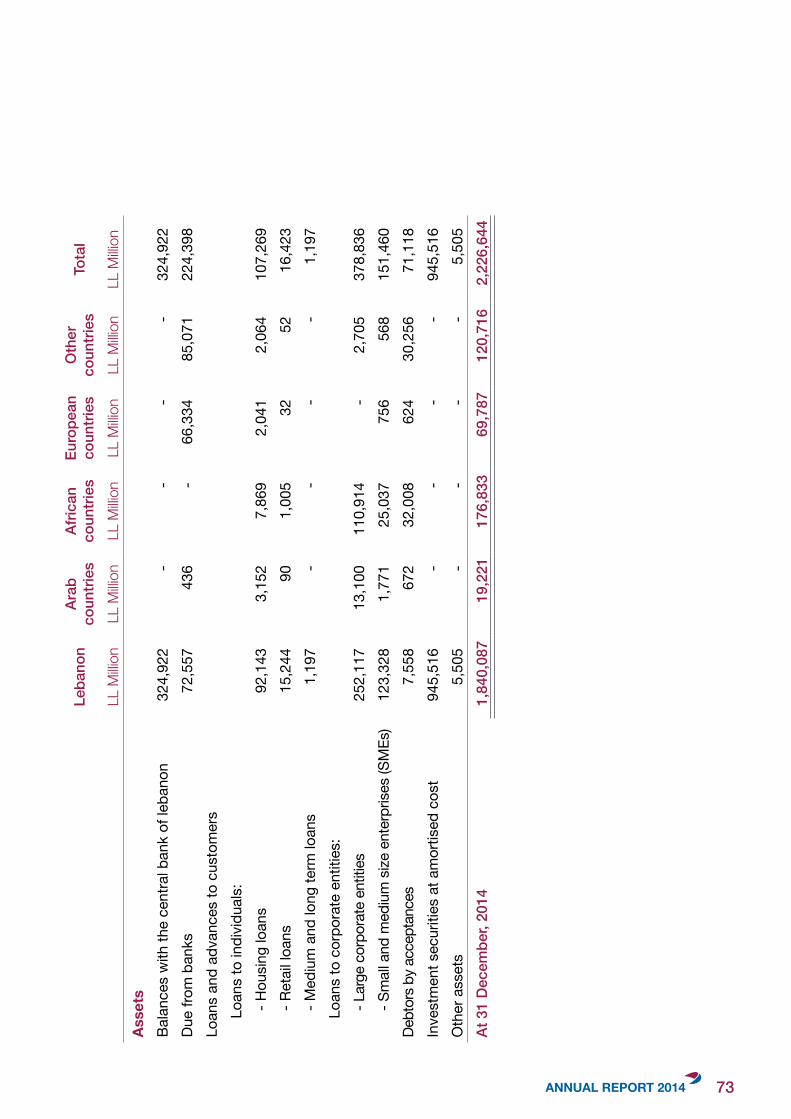
Leba
non
Arab
coun
tries
Afric
anco
untri
esEu
rope
anco
untri
esO
ther
coun
tries
Tota
l
LL M
illion
LL M
illion
LL M
illion
LL M
illion
LL M
illion
LL M
illion
Asse
tsBa
lanc
es w
ith th
e ce
ntra
l ban
k of
leba
non
324,
922
- -
- -
324
,922
Due
from
ban
ks72
,557
4
36
- 6
6,33
4 8
5,07
1 2
24,3
98Lo
ans
and
adva
nces
to c
usto
mer
sLo
ans
to in
divi
dual
s:- H
ousi
ng lo
ans
92,1
43
3,1
52
7,8
69
2,0
41
2,0
64
107
,269
- Ret
ail l
oans
15,2
44
90
1,0
05
32
52
16,
423
- Med
ium
and
long
term
loan
s
1,19
7 -
- -
- 1
,197
Loan
s to
cor
pora
te e
ntiti
es:
- Lar
ge c
orpo
rate
ent
ities
252,
117
13,
100
110
,914
-
2,7
05
378
,836
- Sm
all a
nd m
ediu
m s
ize e
nter
prise
s (S
MEs
)12
3,32
8 1
,771
2
5,03
7 7
56
568
1
51,4
60De
btor
s by
acc
epta
nces
7,55
8 6
72
32,
008
624
3
0,25
6 7
1,11
8In
vest
men
t sec
uriti
es a
t am
ortis
ed c
ost
945,
516
- -
- -
945
,516
Oth
er a
sset
s5,
505
- -
- -
5,5
05At
31
Dec
embe
r, 20
141,
840,
087
19,
221
176
,833
6
9,78
7 1
20,7
16
2,2
26,6
44
73
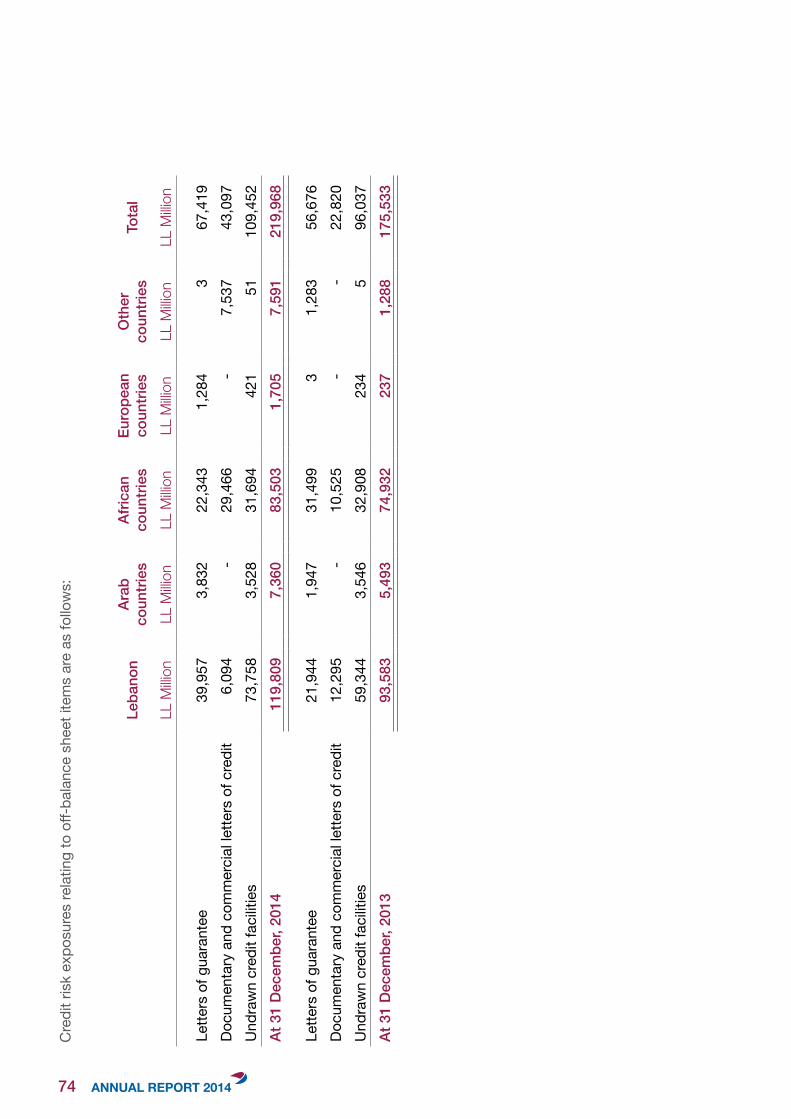
Cre
dit r
isk
expo
sure
s re
latin
g to
off-
bala
nce
shee
t ite
ms
are
as fo
llow
s:
Leba
non
Arab
coun
tries
Afric
anco
untri
esEu
rope
anco
untri
esO
ther
coun
tries
Tota
l
LL M
illion
LL M
illion
LL M
illion
LL M
illion
LL M
illion
LL M
illion
Lette
rs o
f gua
rant
ee39
,957
3,83
222
,343
1
,284
3
67,
419
Docu
men
tary
and
com
mer
cial
lette
rs o
f cre
dit
6,09
4 -
29,4
66
-7,
537
43,0
97U
ndra
wn
cred
it fa
cilit
ies
73,7
58
3,5
28
31,
694
421
5110
9,45
2At
31
Dec
embe
r, 20
1411
9,80
9 7,
360
83,
503
1,70
5 7
,591
2
19,9
68
Lette
rs o
f gua
rant
ee21
,944
1,
947
31,4
99
31,
283
56,6
76
Docu
men
tary
and
com
mer
cial
lette
rs o
f cre
dit
12,2
95
-10
,525
-
-22
,820
U
ndra
wn
cred
it fa
cilit
ies
59,3
44
3,54
632
,908
23
45
96,0
37
At 3
1 D
ecem
ber,
2013
93,5
83
5,49
3 74
,932
23
71,
288
175,
533
74
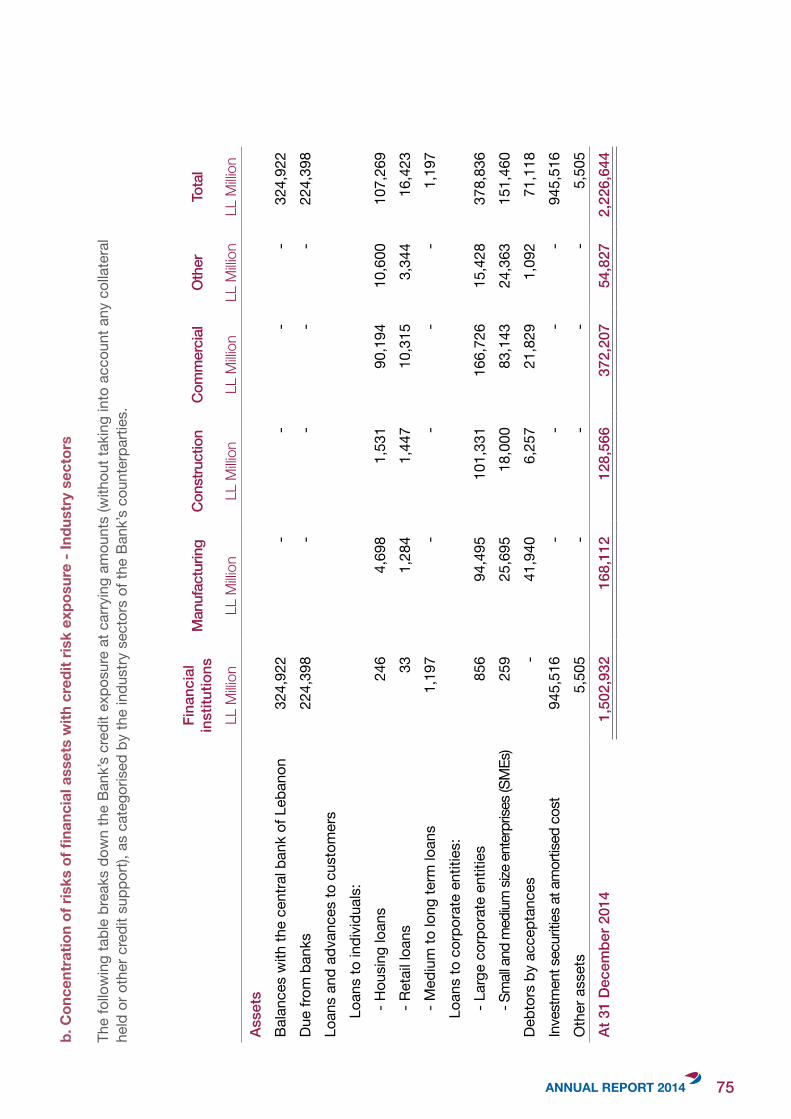
b.Con
centratio
nofrisksoffina
ncialassetswith
creditriskexpo
sure-Indu
strysec
tors
The
follo
win
g ta
ble
brea
ks d
own
the
Bank
’s cr
edit
expo
sure
at c
arry
ing
amou
nts
(with
out t
akin
g in
to a
ccou
nt a
ny c
olla
tera
l he
ld o
r oth
er c
redi
t sup
port)
, as
cate
goris
ed b
y th
e in
dust
ry s
ecto
rs o
f the
Ban
k’s
coun
terp
artie
s.
Fina
ncia
lin
stitu
tions
Man
ufac
turin
gCo
nstru
ctio
nCo
mm
erci
alO
ther
Tota
l
LL M
illion
LL M
illion
LL M
illion
LL M
illion
LL M
illion
LL M
illion
Asse
tsBa
lanc
es w
ith th
e ce
ntra
l ban
k of
Leb
anon
324,
922
--
--
324,
922
Due
from
ban
ks
224,
398
--
--
224,
398
Loan
s an
d ad
vanc
es to
cus
tom
ers
Loan
s to
indi
vidu
als:
- Hou
sing
loan
s24
6 4
,698
1
,531
90
,194
10
,600
10
7,26
9- R
etai
l loa
ns33
1,2
84
1,4
47
10,3
15
3,3
44
16,4
23- M
ediu
m to
long
term
loan
s
1,19
7 -
--
-1,
197
Loan
s to
cor
pora
te e
ntiti
es:
- Lar
ge c
orpo
rate
ent
ities
856
94,4
95
101
,331
166
,726
1
5,42
8 37
8,83
6- S
mall
and
med
ium si
ze e
nter
prise
s (SM
Es)
259
25,6
95
18,
000
83,
143
24,3
63
151
,460
Debt
ors
by a
ccep
tanc
es-
41,9
40
6,2
57
21,8
29
1,0
92
71,
118
Inve
stm
ent s
ecur
ities
at a
mor
tised
cos
t94
5,51
6 -
--
- 9
45,5
16O
ther
ass
ets
5,50
5 -
--
-5,
505
At 3
1 D
ecem
ber 2
014
1,50
2,93
2 1
68,1
12
128,
566
372
,207
5
4,82
7 2
,226
,644
75
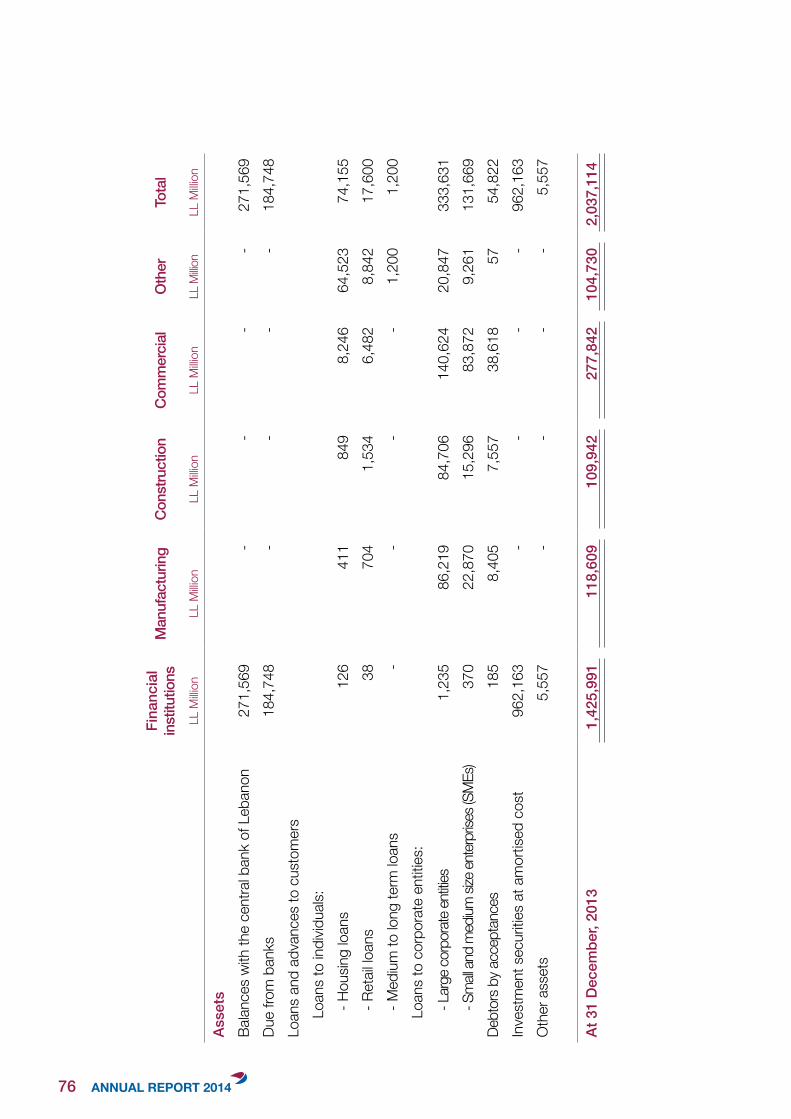
Fina
ncia
lin
stitu
tions
Man
ufac
turin
gCo
nstru
ctio
nCo
mm
erci
alO
ther
Tota
l
LL M
illion
LL M
illion
LL M
illion
LL M
illion
LL M
illion
LL M
illion
Asse
tsBa
lance
s w
ith th
e ce
ntra
l ban
k of
Leb
anon
271,
569
--
--
271,
569
Due
from
ban
ks18
4,74
8-
--
-18
4,74
8Lo
ans
and
adva
nces
to c
usto
mer
sLo
ans
to in
divid
uals:
- Hou
sing
loan
s12
6 4
11
849
8
,246
64,5
23 7
4,15
5- R
etail
loan
s38
7
04
1,5
34
6,4
828,
842
17,
600
- Med
ium
to lo
ng te
rm lo
ans
-
--
-1,
200
1,20
0 Lo
ans
to c
orpo
rate
ent
ities:
- L
arge
corp
orat
e ent
ities
1,23
5 8
6,21
9 8
4,70
6 14
0,62
420
,847
33
3,63
1- S
mall
and
med
ium si
ze en
terp
rises
(SM
Es)
370
22,
870
15,
296
83,
872
9,26
1 1
31,6
69De
btor
s by a
ccep
tanc
es18
5 8
,405
7
,557
3
8,61
857
5
4,82
2In
vest
men
t sec
uritie
s at
am
ortis
ed c
ost
962,
163
--
--
962,
163
Oth
er a
sset
s5,
557
--
--
5,55
7
At 3
1 D
ecem
ber,
2013
1,42
5,99
111
8,60
910
9,94
227
7,84
210
4,73
02,
037,
114
76
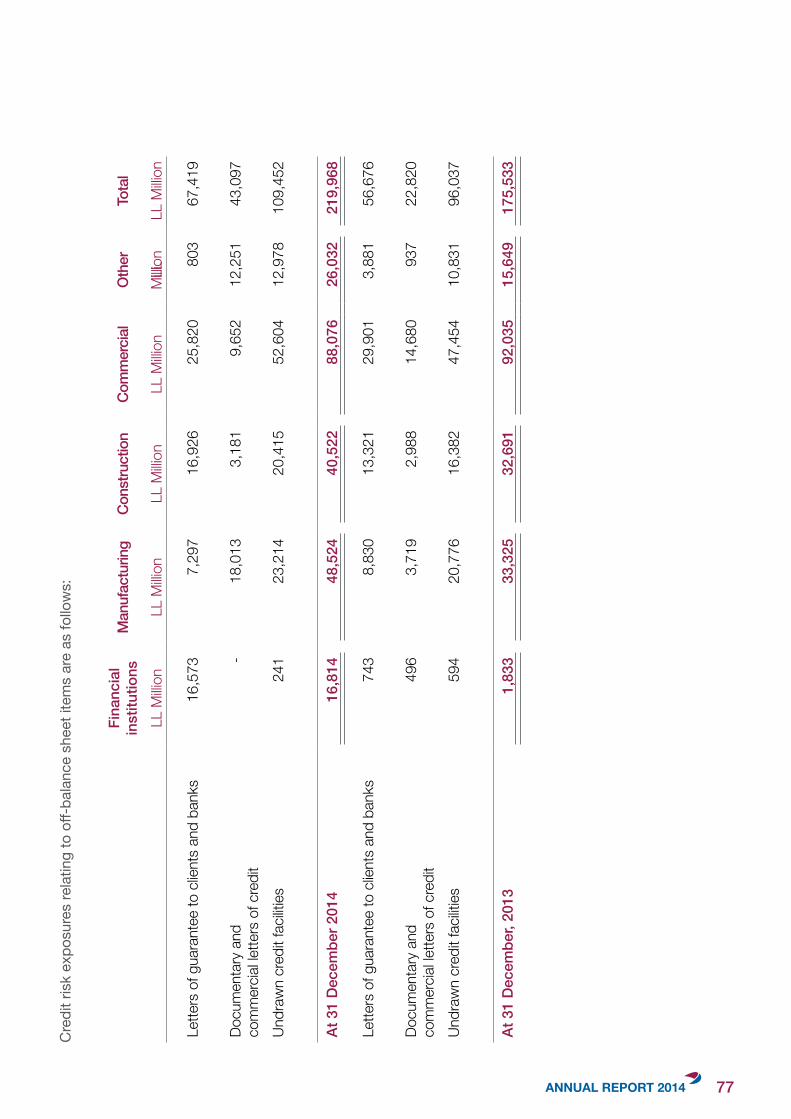
Cre
dit r
isk
expo
sure
s re
latin
g to
off-
bala
nce
shee
t ite
ms
are
as fo
llow
s:
Fina
ncia
lin
stitu
tions
Man
ufac
turin
gCo
nstru
ctio
nCo
mm
erci
alO
ther
Tota
l
LL M
illion
LL M
illion
LL M
illion
LL M
illion
LL
Milli
onLL
Milli
on
Lette
rs o
f gua
rant
ee to
clie
nts
and
bank
s16
,573
7,
297
16,9
26
25,
820
803
6
7,41
9
Docu
men
tary
and
com
mer
cial le
tters
of c
redi
t-
18,
013
3,1
81
9,6
52
12,
251
43,
097
Undr
awn
cred
it fa
cilitie
s24
123
,214
2
0,41
5 52
,604
1
2,97
8 1
09,4
52
At 3
1 D
ecem
ber 2
014
16,8
14
48,5
24
40,
522
88,
076
26,
032
219,
968
Lette
rs o
f gua
rant
ee to
clie
nts
and
bank
s74
38,
830
13,3
2129
,901
3,88
156
,676
Docu
men
tary
and
com
mer
cial le
tters
of c
redi
t49
63,
719
2,98
814
,680
937
22,8
20
Undr
awn
cred
it fa
cilitie
s59
420
,776
16,3
8247
,454
10,8
3196
,037
At 3
1 D
ecem
ber,
2013
1,83
333
,325
32,6
91 9
2,03
5 15
,649
175,
533
77
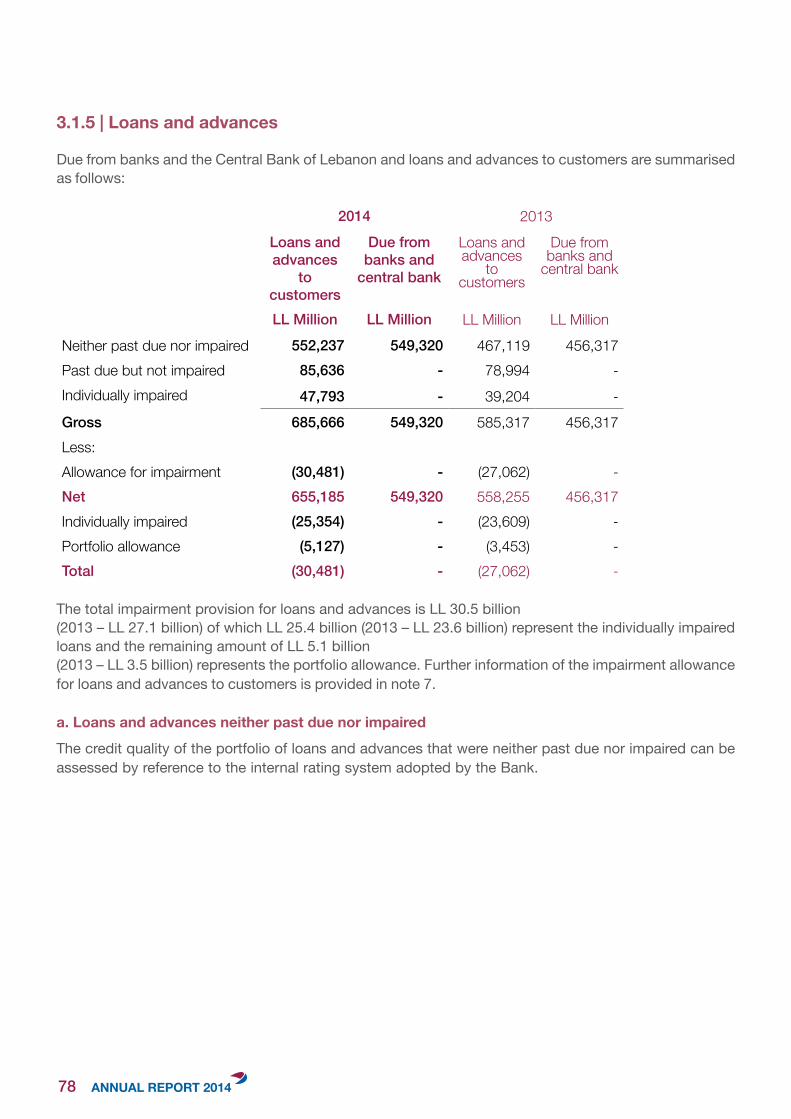
2014 2013Loans and advances
to customers
Due from banks and
central bank
Loans and advances
to customers
Due from banks and
central bank
LL Million LL Million LL Million LL MillionNeither past due nor impaired 552,237 549,320 467,119 456,317Past due but not impaired 85,636 - 78,994 -Individually impaired 47,793 - 39,204 -Gross 685,666 549,320 585,317 456,317Less:Allowance for impairment (30,481) - (27,062) -Net 655,185 549,320 558,255 456,317Individually impaired (25,354) - (23,609) -Portfolio allowance (5,127) - (3,453) -Total (30,481) - (27,062) -
The total impairment provision for loans and advances is LL 30.5 billion (2013 – LL 27.1 billion) of which LL 25.4 billion (2013 – LL 23.6 billion) represent the individually impaired loans and the remaining amount of LL 5.1 billion (2013 – LL 3.5 billion) represents the portfolio allowance. Further information of the impairment allowance for loans and advances to customers is provided in note 7.
a. Loans and advances neither past due nor impaired
The credit quality of the portfolio of loans and advances that were neither past due nor impaired can be assessed by reference to the internal rating system adopted by the Bank.
3.1.5 | Loans and advances
Due from banks and the Central Bank of Lebanon and loans and advances to customers are summarised as follows:
78
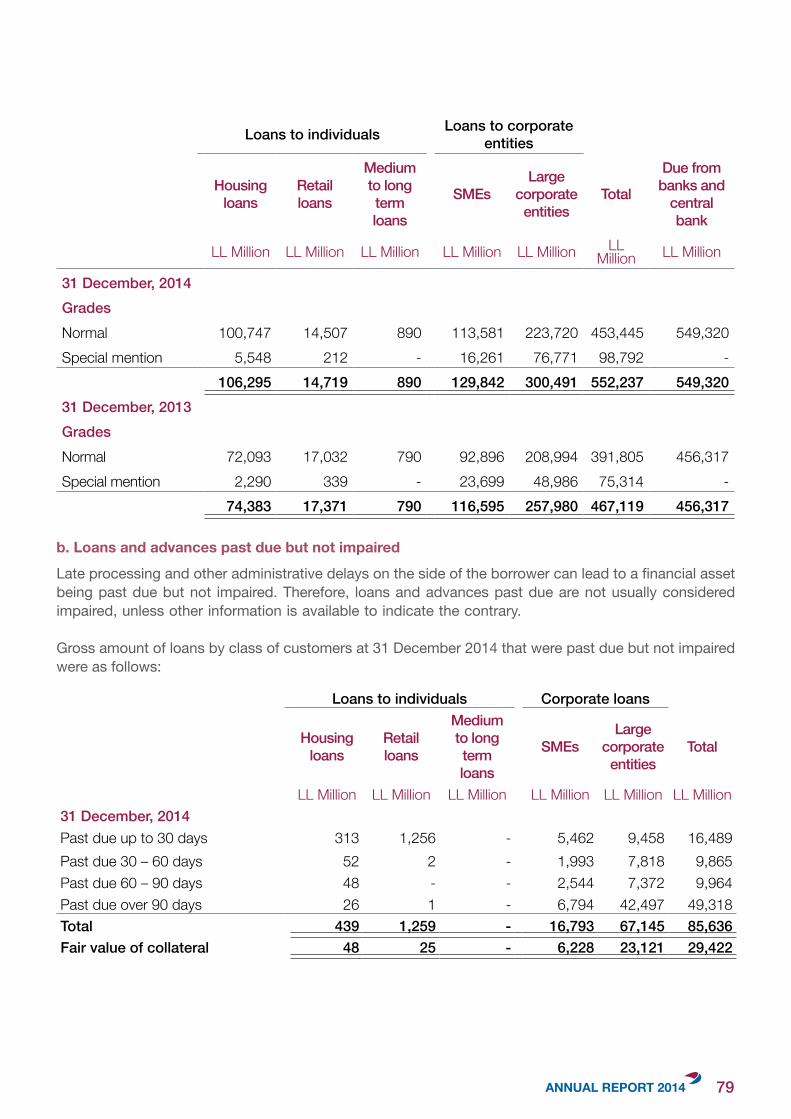
Loans to individuals Loans to corporate entities
Housingloans
Retailloans
Medium to long termloans
SMEsLarge
corporate entities
Total
Due from banks and
central bank
LL Million LL Million LL Million LL Million LL Million LL Million LL Million
31 December, 2014GradesNormal 100,747 14,507 890 113,581 223,720 453,445 549,320Special mention 5,548 212 - 16,261 76,771 98,792 -
106,295 14,719 890 129,842 300,491 552,237 549,32031 December, 2013GradesNormal 72,093 17,032 790 92,896 208,994 391,805 456,317Special mention 2,290 339 - 23,699 48,986 75,314 -
74,383 17,371 790 116,595 257,980 467,119 456,317
b. Loans and advances past due but not impaired
Late processing and other administrative delays on the side of the borrower can lead to a financial asset being past due but not impaired. Therefore, loans and advances past due are not usually considered impaired, unless other information is available to indicate the contrary.
Gross amount of loans by class of customers at 31 December 2014 that were past due but not impaired were as follows:
Loans to individuals Corporate loans
Housingloans
Retailloans
Medium to long termloans
SMEsLarge
corporate entities
Total
LL Million LL Million LL Million LL Million LL Million LL Million31 December, 2014Past due up to 30 days 313 1,256 - 5,462 9,458 16,489Past due 30 – 60 days 52 2 - 1,993 7,818 9,865Past due 60 – 90 days 48 - - 2,544 7,372 9,964Past due over 90 days 26 1 - 6,794 42,497 49,318Total 439 1,259 - 16,793 67,145 85,636Fair value of collateral 48 25 - 6,228 23,121 29,422
79
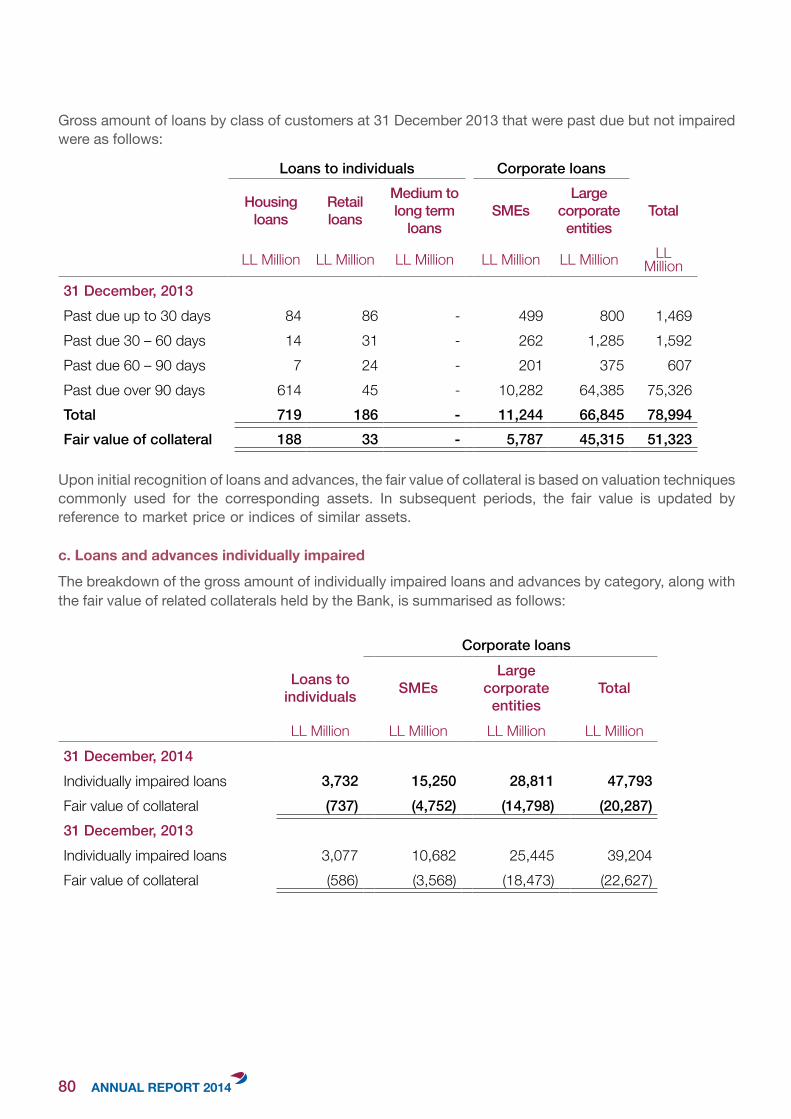
Gross amount of loans by class of customers at 31 December 2013 that were past due but not impaired were as follows:
Loans to individuals Corporate loans
Housingloans
Retailloans
Medium to long term
loansSMEs
Large corporate
entitiesTotal
LL Million LL Million LL Million LL Million LL Million LL Million
31 December, 2013Past due up to 30 days 84 86 - 499 800 1,469Past due 30 – 60 days 14 31 - 262 1,285 1,592Past due 60 – 90 days 7 24 - 201 375 607Past due over 90 days 614 45 - 10,282 64,385 75,326Total 719 186 - 11,244 66,845 78,994Fair value of collateral 188 33 - 5,787 45,315 51,323
Upon initial recognition of loans and advances, the fair value of collateral is based on valuation techniques commonly used for the corresponding assets. In subsequent periods, the fair value is updated by reference to market price or indices of similar assets.
c.Loansandadvancesindividuallyimpaired
The breakdown of the gross amount of individually impaired loans and advances by category, along with the fair value of related collaterals held by the Bank, is summarised as follows:
Corporate loans
Loans to individuals SMEs
Large corporate
entitiesTotal
LL Million LL Million LL Million LL Million31 December, 2014Individually impaired loans 3,732 15,250 28,811 47,793Fair value of collateral (737) (4,752) (14,798) (20,287)31 December, 2013Individually impaired loans 3,077 10,682 25,445 39,204 Fair value of collateral (586) (3,568) (18,473) (22,627)
80
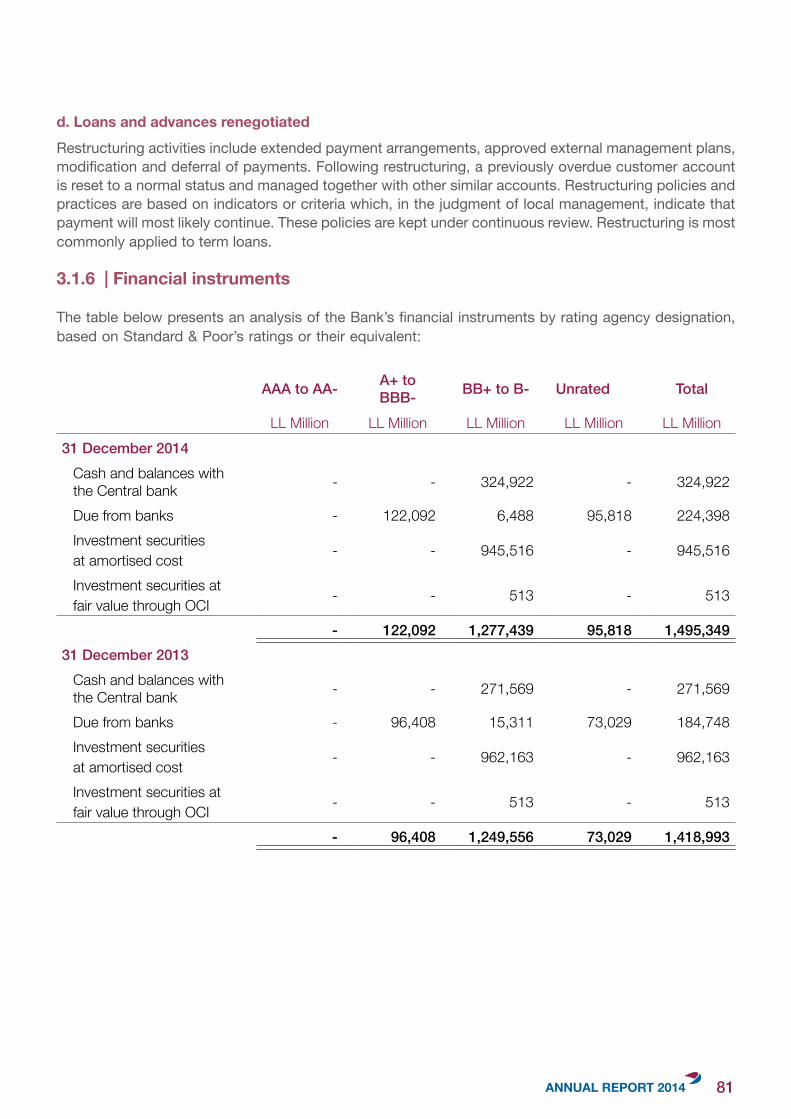
d. Loans and advances renegotiated
Restructuring activities include extended payment arrangements, approved external management plans, modification and deferral of payments. Following restructuring, a previously overdue customer account is reset to a normal status and managed together with other similar accounts. Restructuring policies and practices are based on indicators or criteria which, in the judgment of local management, indicate that payment will most likely continue. These policies are kept under continuous review. Restructuring is most commonly applied to term loans.
3.1.6 | Financial instruments
The table below presents an analysis of the Bank’s financial instruments by rating agency designation, based on Standard & Poor’s ratings or their equivalent:
AAA to AA- A+ to BBB- BB+ to B- Unrated Total
LL Million LL Million LL Million LL Million LL Million31 December 2014
Cash and balances withthe Central bank - - 324,922 - 324,922
Due from banks - 122,092 6,488 95,818 224,398Investment securitiesat amortised cost - - 945,516 - 945,516
Investment securities atfair value through OCI - - 513 - 513
- 122,092 1,277,439 95,818 1,495,34931 December 2013
Cash and balances withthe Central bank - - 271,569 - 271,569
Due from banks - 96,408 15,311 73,029 184,748Investment securitiesat amortised cost - - 962,163 - 962,163
Investment securities atfair value through OCI - - 513 - 513
- 96,408 1,249,556 73,029 1,418,993
81
3.2 | Market risk
The Bank takes on exposure to market risks, which is the risk that the fair value or future cash flows of a financial instrument will fluctuate because of changes market prices. Market risks arise from open positions in interest rate, currency and equity products, all of which are exposed to general and specific market movements and changes in the level of volatility of market rates or prices such as interest rates, foreign exchange rates and equity prices.
Banking portfolios primarily arise from the interest rate management of the Bank’s retail and commercial banking assets and liabilities.
3.2.1 | Market risk management techniques
Effective identification and monitoring of market risk is essential for maintaining stable profit. This is carried out by the Bank’s risk management department. The Bank’s treasury is responsible for managing the market exposure within the limits as approved by ALCO and as stipulated by the circulars of Central Bank of Lebanon no. 32 and 81. The major measurement technique used to measure and control market risk is outlined below.
Sensitivity analysis
A technique used to determine how different values of an independent variable will impact a particular dependent variable under a given set of assumptions. This technique is used within specific boundaries that will depend on one or more input variables, such as the effect that changes in interest rates will have on a bond’s price. Sensitivity analysis is a way to predict the outcome of a decision if a situation turns out to be different compared to the key predictions.
The Bank performs this analysis for each type of market risk to which the Bank is exposed at each reporting date, showing how profit or loss and equity would have been affected by changes in the relevant risk variable that were reasonably possible at that date.
The table below summarises the Bank’s exposure to foreign currency exchange rate risk at 31 December 2014 and 31 December 2013.
82
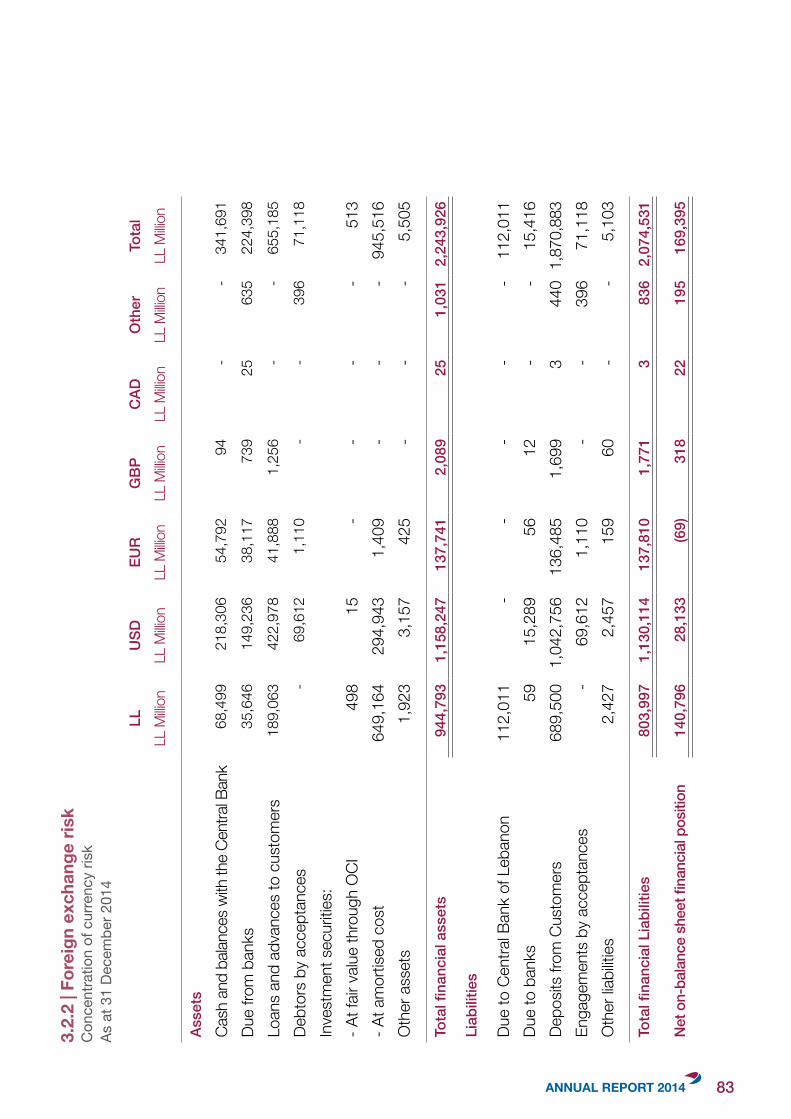
3.2.
2 | F
orei
gn e
xcha
nge
risk
Con
cent
ratio
n of
cur
renc
y ris
kAs
at 3
1 De
cem
ber 2
014
LLU
SDEU
RG
BPC
ADO
ther
Tota
lLL
Millio
nLL
Millio
nLL
Millio
nLL
Millio
nLL
Millio
nLL
Millio
nLL
Millio
n
Asse
ts
Cash
and
bala
nces
with
the
Cent
ral B
ank
68,4
99
218
,306
5
4,79
2 9
4 -
- 3
41,6
91
Due
from
ban
ks35
,646
1
49,2
36
38,
117
739
2
5 6
35
224
,398
Loan
s an
d ad
vanc
es to
cus
tom
ers
189,
063
422
,978
4
1,88
8 1
,256
-
- 6
55,1
85
Debt
ors
by a
ccep
tanc
es-
69,
612
1,1
10
- -
396
7
1,11
8
Inve
stm
ent s
ecur
ities:
- At f
air v
alue
thro
ugh
OCI
498
15
- -
- -
513
- At a
mor
tised
cos
t64
9,16
4 2
94,9
43
1,4
09
- -
- 9
45,5
16O
ther
ass
ets
1,92
3 3
,157
4
25
- -
- 5
,505
Tota
l fina
ncia
l ass
ets
944,
793
1,15
8,24
7 1
37,7
41
2,0
89
25
1,0
31
2,2
43,9
26
Liab
ilitie
s
Due
to C
entra
l Ban
k of
Leb
anon
112,
011
- -
- -
- 1
12,0
11Du
e to
ban
ks59
1
5,28
9 5
6 1
2 -
- 1
5,41
6De
posit
s fro
m C
usto
mer
s68
9,50
0 1,
042,
756
136,
485
1,6
99
3
440
1,8
70,8
83En
gage
men
ts b
y ac
cept
ance
s-
69,
612
1,1
10
- -
396
7
1,11
8O
ther
liabi
lities
2,42
7 2
,457
1
59
60
- -
5,1
03
Tota
l fina
ncia
l Lia
bilit
ies
803,
997
1,1
30,1
14
137
,810
1
,771
3
8
36
2,0
74,5
31
Net o
n-ba
lanc
e sh
eet fi
nanc
ial p
ositi
on14
0,79
6 2
8,13
3 (
69)
318
2
2 1
95
169
,395
83
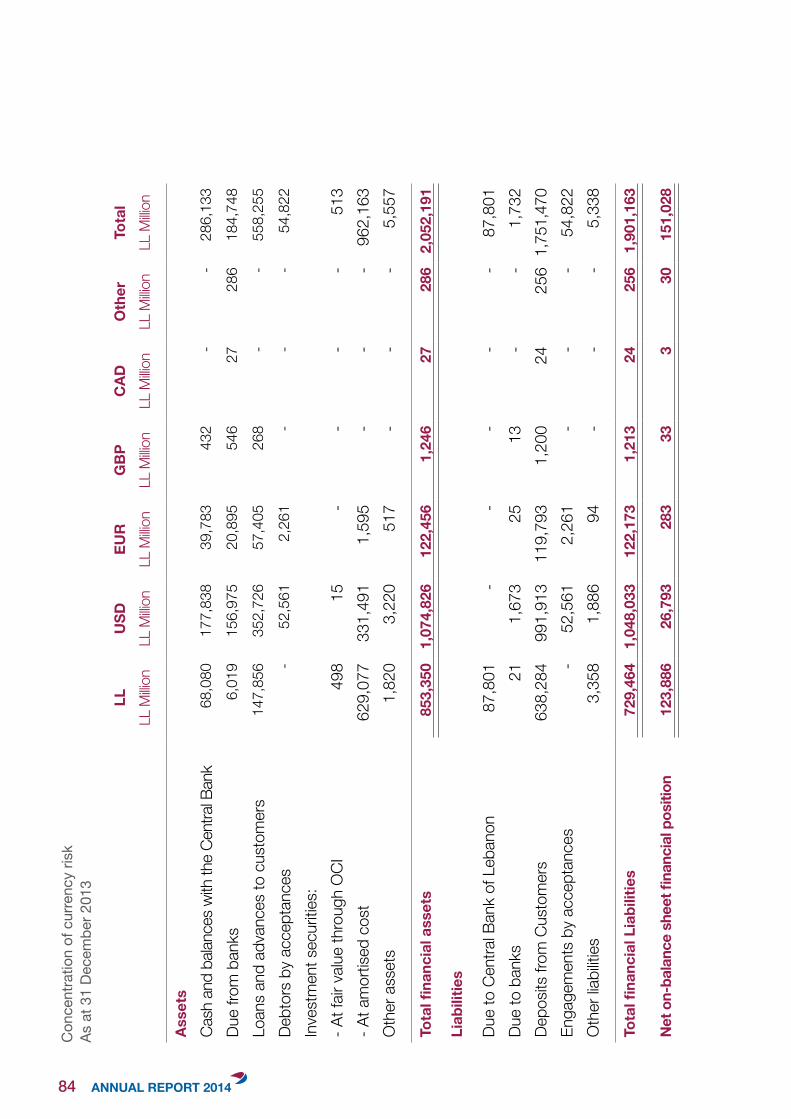
Con
cent
ratio
n of
cur
renc
y ris
kAs
at 3
1 De
cem
ber 2
013
LLU
SDEU
RG
BPC
ADO
ther
Tota
lLL
Millio
nLL
Millio
nLL
Millio
nLL
Millio
nLL
Millio
nLL
Millio
nLL
Millio
n
Asse
tsCa
sh a
nd b
alanc
es w
ith th
e Ce
ntra
l Ban
k68
,080
177,
838
39,7
8343
2-
-28
6,13
3
Due
from
ban
ks6,
019
156,
975
20,8
9554
627
286
1
84,7
48
Loan
s an
d ad
vanc
es to
cus
tom
ers
147,
856
352
,726
57,
405
268
-
- 5
58,2
55
Debt
ors
by a
ccep
tanc
es-
52,
561
2,2
61
--
- 5
4,82
2
Inve
stm
ent s
ecur
ities:
- At f
air v
alue
thro
ugh
OCI
498
15
--
--
513
- At a
mor
tised
cos
t62
9,07
7 33
1,49
1 1
,595
--
- 9
62,1
63O
ther
ass
ets
1,82
0 3
,220
5
17
--
- 5
,557
Totalfi
nanc
ialassets
853,
350
1,07
4,82
6 1
22,4
56 1
,246
27
286
2
,052
,191
Liab
ilitie
s
Due
to C
entra
l Ban
k of
Leb
anon
87,8
01
--
--
- 8
7,80
1Du
e to
ban
ks21
1
,673
2
5 1
3-
- 1
,732
Depo
sits
from
Cus
tom
ers
638,
284
991
,913
11
9,79
3 1
,200
24
256
1,7
51,4
70En
gage
men
ts b
y ac
cept
ance
s-
52,
561
2,2
61
--
- 5
4,82
2O
ther
liabi
lities
3,35
8 1
,886
9
4 -
--
5,3
38
Totalfi
nanc
ialL
iabilities
729,
464
1,04
8,03
3 1
22,1
73
1,2
13 2
4 2
56
1,9
01,1
63
Neton-ba
lanc
esheetfi
nanc
ialposition
123,
886
26,
793
283
33
3 3
0 1
51,0
28
84

3.2.3 | Interest rate risk
Cash flow interest rate risk is the risk that the future cash flows of a financial instrument will fluctuate because of changes in market interest rates. Fair value interest rate risk is the risk that the value of a financial instrument will fluctuate because of changes in market interest rates. The Bank takes on exposure to the effects of fluctuations in the prevailing levels of market interest rates on both its fair value and cash flow risks. Interest margins may increase as a result of such changes but may reduce losses in the event that unexpected movements arise. Management sets limits on the level of mismatch of interest rate re-pricing that may be undertaken, which is monitored daily by the Treasury Department.
The table below summarises the Bank’s exposure to interest rate risks. It includes the Bank›s financial instruments at carrying amounts, categorised by the earlier of contractual re-pricing or maturity dates.
85
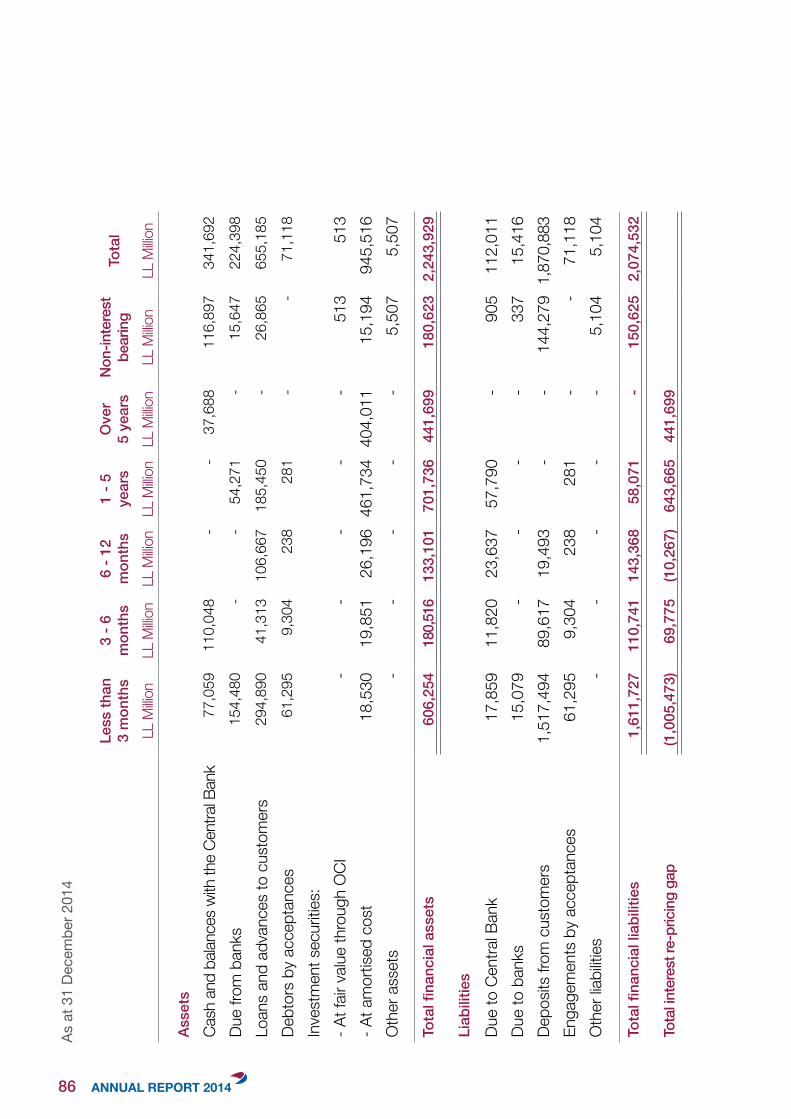
As a
t 31
Dece
mbe
r 201
4
Less
than
3 m
onth
s 3
- 6m
onth
s6
- 12
mon
ths
1 - 5
year
sO
ver
5 ye
ars
Non-
inte
rest
be
arin
gTo
tal
LL M
illion
LL M
illion
LL M
illion
LL M
illion
LL M
illion
LL M
illion
LL M
illion
Asse
ts
Cash
and
bala
nces
with
the
Cent
ral B
ank
77,0
59
110
,048
-
- 3
7,68
8 1
16,8
97
341
,692
Due
from
ban
ks15
4,48
0 -
- 5
4,27
1 -
15,
647
224
,398
Loan
s an
d ad
vanc
es to
cus
tom
ers
294,
890
41,
313
106
,667
1
85,4
50
- 2
6,86
5 6
55,1
85
Debt
ors
by a
ccep
tanc
es61
,295
9
,304
2
38
281
-
- 7
1,11
8
Inve
stm
ent s
ecur
ities:
- At f
air v
alue
thro
ugh
OCI
- -
- -
- 5
13
513
- At a
mor
tised
cos
t18
,530
1
9,85
1 2
6,19
6 46
1,73
4 40
4,01
1 1
5,19
4 9
45,5
16O
ther
ass
ets
--
--
- 5
,507
5
,507
Tota
l fina
ncia
l ass
ets
606,
254
180
,516
1
33,1
01
701
,736
4
41,6
99
180
,623
2
,243
,929
Liab
ilitie
s
Due
to C
entra
l Ban
k17
,859
1
1,82
0 2
3,63
7 5
7,79
0 -
905
1
12,0
11Du
e to
ban
ks
15,0
79
- -
- -
337
1
5,41
6De
posit
s fro
m c
usto
mer
s1,
517,
494
89,
617
19,
493
- -
144
,279
1,8
70,8
83En
gage
men
ts b
y ac
cept
ance
s61
,295
9
,304
2
38
281
-
- 7
1,11
8O
ther
liabi
lities
--
--
- 5
,104
5
,104
Tota
l fina
ncia
l lia
bilit
ies
1,61
1,72
7 1
10,7
41
143
,368
5
8,07
1 -
150
,625
2
,074
,532
Tota
l inte
rest
re-p
ricin
g ga
p(1
,005
,473
) 6
9,77
5 (1
0,26
7) 6
43,6
65
441
,699
86
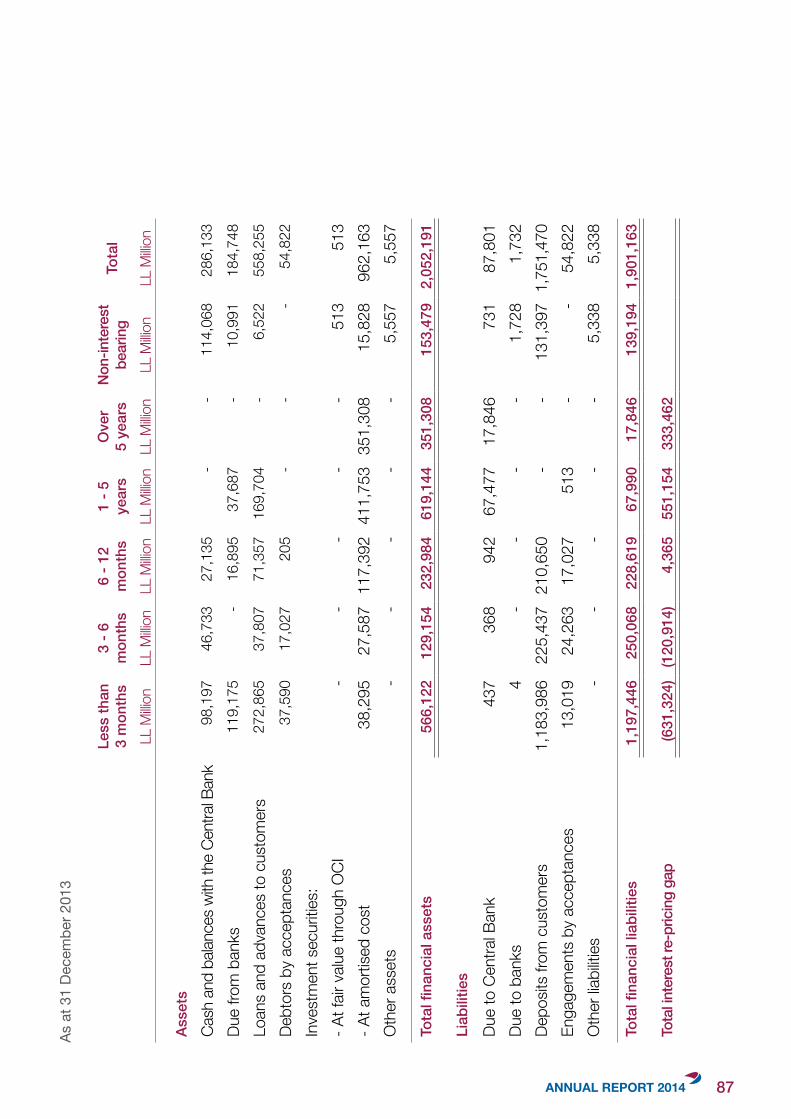
As a
t 31
Dece
mbe
r 201
3
Less
than
3 m
onth
s 3
- 6m
onth
s6
- 12
mon
ths
1 - 5
year
sO
ver
5 ye
ars
Non-
inte
rest
be
arin
gTo
tal
LL M
illion
LL M
illion
LL M
illion
LL M
illion
LL M
illion
LL M
illion
LL M
illion
Asse
ts
Cash
and
bala
nces
with
the
Cent
ral B
ank
98,1
97
46,7
33
27,1
35
--
114,
068
286,
133
Due
from
ban
ks11
9,17
5 -
16,8
95
37,6
87
-10
,991
18
4,74
8
Loan
s an
d ad
vanc
es to
cus
tom
ers
272,
865
37,8
07
71,3
57
169,
704
-6,
522
558,
255
Debt
ors
by a
ccep
tanc
es37
,590
17
,027
20
5 -
--
54,8
22
Inve
stm
ent s
ecur
ities:
- At f
air v
alue
thro
ugh
OCI
--
--
- 5
13
513
- At a
mor
tised
cos
t38
,295
27
,587
11
7,39
2 41
1,75
3 35
1,30
8 15
,828
962
,163
Oth
er a
sset
s-
--
--
5,55
7 5,
557
Tota
l fina
ncia
l ass
ets
566,
122
129,
154
232,
984
619,
144
351,
308
153,
479
2,05
2,19
1
Liab
ilitie
s
Due
to C
entra
l Ban
k43
7 36
8 94
2 67
,477
17
,846
73
1 87
,801
Du
e to
ban
ks
4 -
--
-1,
728
1,73
2 De
posit
s fro
m c
usto
mer
s1,
183,
986
225,
437
210,
650
--
131,
397
1,75
1,47
0 En
gage
men
ts b
y ac
cept
ance
s13
,019
24
,263
17
,027
51
3 -
-54
,822
O
ther
liabi
lities
--
--
-5,
338
5,33
8
Tota
l fina
ncia
l lia
bilit
ies
1,19
7,44
6 25
0,06
8 22
8,61
9 67
,990
17
,846
13
9,19
4 1,
901,
163
Tota
l inte
rest
re-p
ricin
g ga
p(6
31,3
24)
(120
,914
) 4,
365
551,
154
333,
462
87
3.3|Liquidityrisk
Liquidity risk is the risk that the Bank is unable to meet its obligations associated with its financial liabilities when they fall due as a result of customer deposits being withdrawn, cash requirements from contractual commitments, or other cash outflows, such as debt maturities. Such outflows would deplete available cash resources for client lending, trading activities and investments. In extreme circumstances, lack of liquidity could result in reductions in balance sheet and sales of assets, or potentially an inability to fulfil lending commitments. The risk that the Bank will be unable to do so is inherent in all banking operations and can be affected by a range of institution-specific and market-wide events including, but not limited to merger and acquisition activity, systemic shocks and natural disasters.
3.3.1|Liquidityriskmanagementprocess
The Bank’s liquidity management process as carried out within the Bank and monitored by a separate team in the Bank’s treasury includes:
- Day-to-day funding, managed by monitoring future cash flows to ensure that requirements can be met. This includes replenishment of funds as they mature or are borrowed by customers;
- Maintaining a portfolio of highly marketable assets that can easily be liquidated as protection against any unforeseen interruption to cash flow;
- Monitoring balance sheet liquidity ratios against internal and regulatory requirements; and- Managing the concentration and profile of debt maturities.
Monitoring and reporting take the form of cash flow measurement and projections for the next day, week and month, respectively, as these are key periods for liquidity management. The starting point for those projections is an analysis of the contractual maturity of the financial liabilities and the expected collection date of the financial assets.
3.3.2 | Funding approach
Sources of liquidity are regularly set by the Treasury department, while the risk management department and the Assets and Liabilities Committee monitors those sources to maintain a wide diversification by currency, geography, provider, product and term.
3.3.3|Maturityanalysisoffinancialassetsandliabilities
The table below summarizes the maturity profile of the Bank’s financial assets and liabilities. The contractual maturities of assets and liabilities have been determined on the basis of the remaining period at the statement of financial position date to the contractual maturity date and do not take account of the effective maturities as indicated by the Bank’s deposit retention history and the availability of liquid funds. The maturity profile is monitored by management to ensure adequate liquidity is maintained.
88
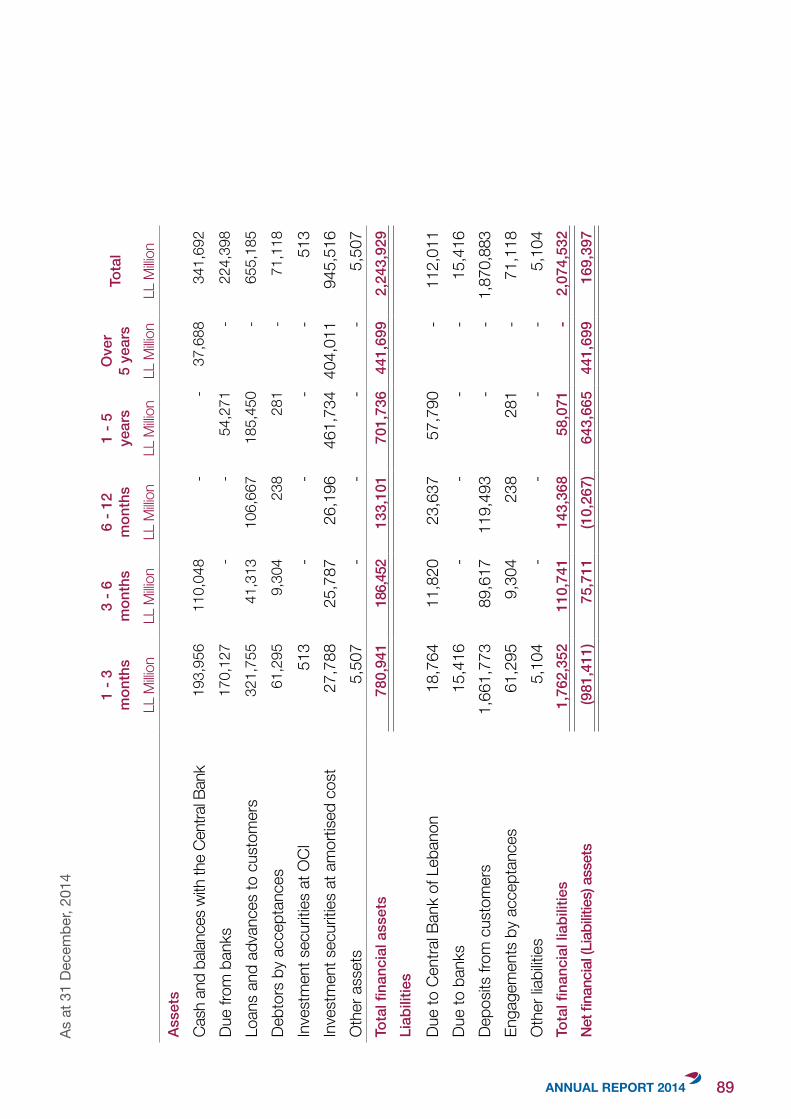
1 - 3
m
onth
s3
- 6m
onth
s6
- 12
mon
ths
1 - 5
year
sO
ver
5 ye
ars
Tota
l
LL M
illion
LL M
illion
LL M
illion
LL M
illion
LL M
illion
LL M
illion
Asse
ts
Cash
and
bala
nces
with
the
Cent
ral B
ank
193,
956
110
,048
-
- 3
7,68
8 3
41,6
92
Due
from
ban
ks17
0,12
7 -
- 5
4,27
1 -
224
,398
Loan
s an
d ad
vanc
es to
cus
tom
ers
321,
755
41,
313
106
,667
1
85,4
50
- 6
55,1
85
Debt
ors
by a
ccep
tanc
es61
,295
9
,304
2
38
281
-
71,
118
Inve
stm
ent s
ecur
ities
at O
CI51
3 -
- -
- 5
13In
vest
men
t sec
uritie
s at
am
ortis
ed c
ost
27,7
88
25,
787
26,
196
461,
734
404,
011
945
,516
Oth
er a
sset
s5,
507
- -
- -
5,5
07To
tal fi
nanc
ial a
sset
s78
0,94
1 1
86,4
52
133
,101
7
01,7
36
441
,699
2
,243
,929
Liab
ilitie
s
Due
to C
entra
l Ban
k of
Leb
anon
18,7
64
11,
820
23,
637
57,
790
- 1
12,0
11Du
e to
ban
ks
15,4
16
--
--
15,4
16
Depo
sits
from
cus
tom
ers
1,66
1,77
3 8
9,61
7 11
9,49
3 -
- 1,
870,
883
Enga
gem
ents
by
acce
ptan
ces
61,2
95
9,3
04
238
2
81
- 7
1,11
8O
ther
liabi
lities
5,10
4 -
--
-5,
104
Tota
l fina
ncia
l lia
bilit
ies
1,76
2,35
2 1
10,7
41
143
,368
5
8,07
1 -
2,0
74,5
32Ne
t fina
ncia
l (Lia
bilit
ies)
ass
ets
(981
,411
) 7
5,71
1 (1
0,26
7) 6
43,6
65
441
,699
1
69,3
97
As
at 3
1 De
cem
ber,
2014
89
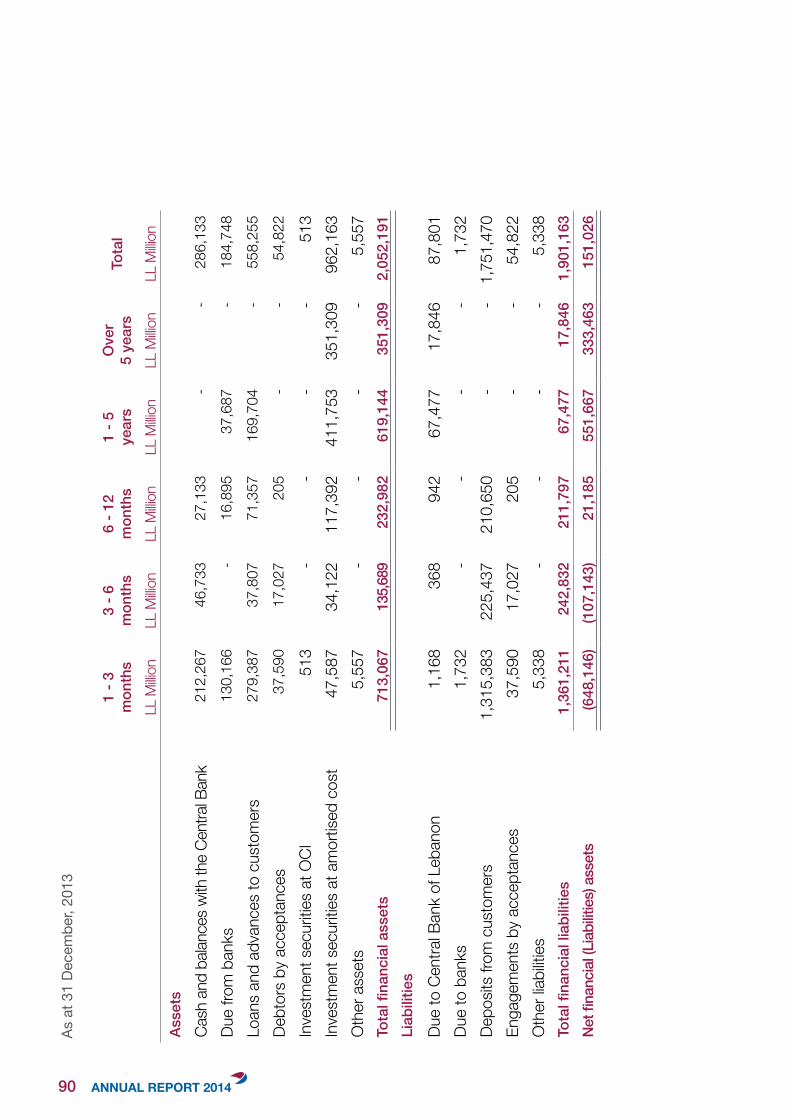
As
at 3
1 De
cem
ber,
2013
1 - 3
m
onth
s3
- 6m
onth
s6
- 12
mon
ths
1 - 5
year
sO
ver
5 ye
ars
Tota
l
LL M
illion
LL M
illion
LL M
illion
LL M
illion
LL M
illion
LL M
illion
Asse
ts
Cash
and
bala
nces
with
the
Cent
ral B
ank
212,
267
46,7
33
27,1
33-
-28
6,13
3
Due
from
ban
ks13
0,16
6 -
16,8
95
37,6
87
-18
4,74
8
Loan
s an
d ad
vanc
es to
cus
tom
ers
279,
387
37,8
07
71,3
57
169,
704
-55
8,25
5
Debt
ors
by a
ccep
tanc
es37
,590
17
,027
20
5 -
-54
,822
Inve
stm
ent s
ecur
ities
at O
CI51
3 -
--
-51
3 In
vest
men
t sec
uritie
s at
am
ortis
ed c
ost
47,5
87
34,1
22
117,
392
411,
753
351,
309
962,
163
Oth
er a
sset
s5,
557
--
--
5,55
7 To
tal fi
nanc
ial a
sset
s71
3,06
713
5,68
9 23
2,98
2 61
9,14
4 35
1,30
92,
052,
191
Liab
ilitie
s
Due
to C
entra
l Ban
k of
Leb
anon
1,16
8 36
8 94
2 67
,477
17
,846
87
,801
Du
e to
ban
ks
1,73
2 -
--
-1,
732
Depo
sits
from
cus
tom
ers
1,31
5,38
3 22
5,43
7 21
0,65
0 -
-1,
751,
470
Enga
gem
ents
by
acce
ptan
ces
37,5
90
17,0
27
205
- -
54,8
22
Oth
er lia
biliti
es5,
338
--
--
5,33
8 To
tal fi
nanc
ial l
iabi
litie
s1,
361,
211
242,
832
211,
797
67,4
7717
,846
1,
901,
163
Net fi
nanc
ial (L
iabi
litie
s) a
sset
s(6
48,1
46)
(107
,143
) 21
,185
551,
667
333,
463
151,
026
90
3.4|Fairvaluesoffinancialassetsandliabilities
The fair values of financial assets and financial liabilities that are traded in active markets are based on quoted market prices or dealer price quotations.
a. Valuation models
The Bank measures fair values using the following fair value hierarchy, which reflects the significance of the inputs used in making the measurement.
Quotedmarketprices–Level1
Financial instruments are classified as Level 1 if their value is observable in an active market. Such instruments are valued by reference to unadjusted quoted prices for identical assets or liabilities in active markets where the quoted price is readily available, and the price represents actual and regularly occurring market transactions on an arm’s length basis. An active market is one in which transactions occur with sufficient volume and frequency to provide pricing information on an ongoing basis. This category includes liquid government and corporate bonds actively traded through an exchange or clearing house, and actively traded listed equities.
Valuationtechniqueusingobservableinputs–Level2
Financial instruments classified as Level 2 have been valued using models whose most significant inputs are observable in an active market. Such valuation techniques and models incorporate assumptions about factors observable in an active market, which other market participants would use in their valuations, including interest rate yield curve, exchange rates, volatilities, and prepayment and defaults rates. This category includes liquid government and corporate bonds and certificates of deposit, less actively traded through an exchange or clearing house, non-listed equities and foreign exchange swaps and forwards.
Valuationtechniqueusingsignificantunobservableinputs–Level3
Financial instruments are classified as Level 3 if their valuation incorporates significant inputs that are not based on observable market data (unobservable inputs). A valuation input is considered observable if it can be directly observed from transactions in an active market, or if there is compelling external evidence demonstrating an executable exit price. An input is deemed significant if it is shown to contribute more than 10% to the valuation of a financial instrument.
Unobservable input levels are generally determined based on observable inputs of a similar nature, historical observations or other analytical techniques.
91
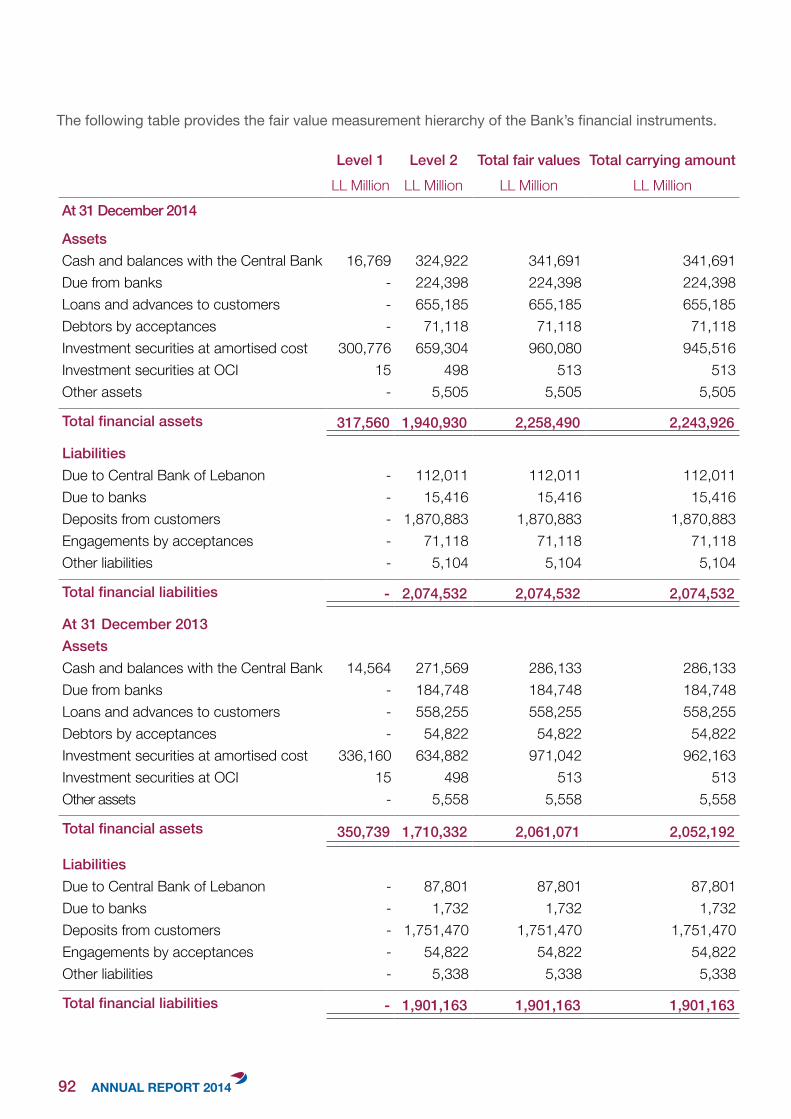
The following table provides the fair value measurement hierarchy of the Bank’s financial instruments.
Level 1 Level 2 Total fair values Total carrying amountLL Million LL Million LL Million LL Million
At 31 December 2014
AssetsCash and balances with the Central Bank 16,769 324,922 341,691 341,691Due from banks - 224,398 224,398 224,398Loans and advances to customers - 655,185 655,185 655,185Debtors by acceptances - 71,118 71,118 71,118Investment securities at amortised cost 300,776 659,304 960,080 945,516Investment securities at OCI 15 498 513 513Other assets - 5,505 5,505 5,505
Total financial assets 317,560 1,940,930 2,258,490 2,243,926
Liabilities Due to Central Bank of Lebanon - 112,011 112,011 112,011Due to banks - 15,416 15,416 15,416Deposits from customers - 1,870,883 1,870,883 1,870,883Engagements by acceptances - 71,118 71,118 71,118Other liabilities - 5,104 5,104 5,104
Total financial liabilities - 2,074,532 2,074,532 2,074,532
At 31 December 2013 AssetsCash and balances with the Central Bank 14,564 271,569 286,133 286,133Due from banks - 184,748 184,748 184,748Loans and advances to customers - 558,255 558,255 558,255Debtors by acceptances - 54,822 54,822 54,822Investment securities at amortised cost 336,160 634,882 971,042 962,163Investment securities at OCI 15 498 513 513Other assets - 5,558 5,558 5,558
Total financial assets 350,739 1,710,332 2,061,071 2,052,192
Liabilities Due to Central Bank of Lebanon - 87,801 87,801 87,801Due to banks - 1,732 1,732 1,732Deposits from customers - 1,751,470 1,751,470 1,751,470Engagements by acceptances - 54,822 54,822 54,822Other liabilities - 5,338 5,338 5,338
Total financial liabilities - 1,901,163 1,901,163 1,901,163
92
There were no transfers between levels during 2014 (2013 – no transfer).
The fair value of financial assets and liabilities is included at the amount at which the instrument could be exchanged in a current transaction between willing parties, other than in a forced or liquidation sale. Financial assets and liabilities are classified according to a hierarchy that reflects the significance of observable market inputs.
(i) Due from banks and balances with the Central Bank of Lebanon
The estimated fair value of fixed interest-bearing deposits not quoted in an active market is based on discounted cash flows using interest rates for new loans with similar remaining maturity. The estimated fair value of the accounts that have a maturity of less than 1 year is their carrying amount.
(ii) Loans and advances to customers
Loans and advances are net of provisions for impairment. The estimated fair value of loans and advances represents the discounted amount of estimated future cash flows expected to be received. Expected cash flows are discounted at current market rates to determine fair value.
(iii) Investment securities
The fair value of investment securities at amortised cost is based on market prices or broker/dealer price quotations. Where quoted market prices are not available, a discounted cash flow model is used based on a current yield curve appropriate for the remaining term to maturity. Expected cash flows are discounted at current market rates issued by the Central Bank of Lebanon to determine the fair value.
(iv) Debtors by acceptances and other assets
The estimated fair value of the above accounts is their carrying amount given that their maturity is less than 1 year.
(v) Due to banks and due to the Central Bank of Lebanon
The estimated fair value of deposits with no stated maturity, which includes non-interest bearing deposits, is the amount repayable on demand. The estimated fair value of fixed interest-bearing deposits not quoted in an active market is based on discounted cash flows using interest rates for new deposits with similar remaining maturity.
(vi) Deposits from customers
The estimated fair value of the deposits from customers is their carrying amount given that their maturity is less than 1 year.
(vii) Other liabilities
The estimated fair value of other liabilities is their carrying amount given that their maturity is within 12 months from balance sheet date.
93
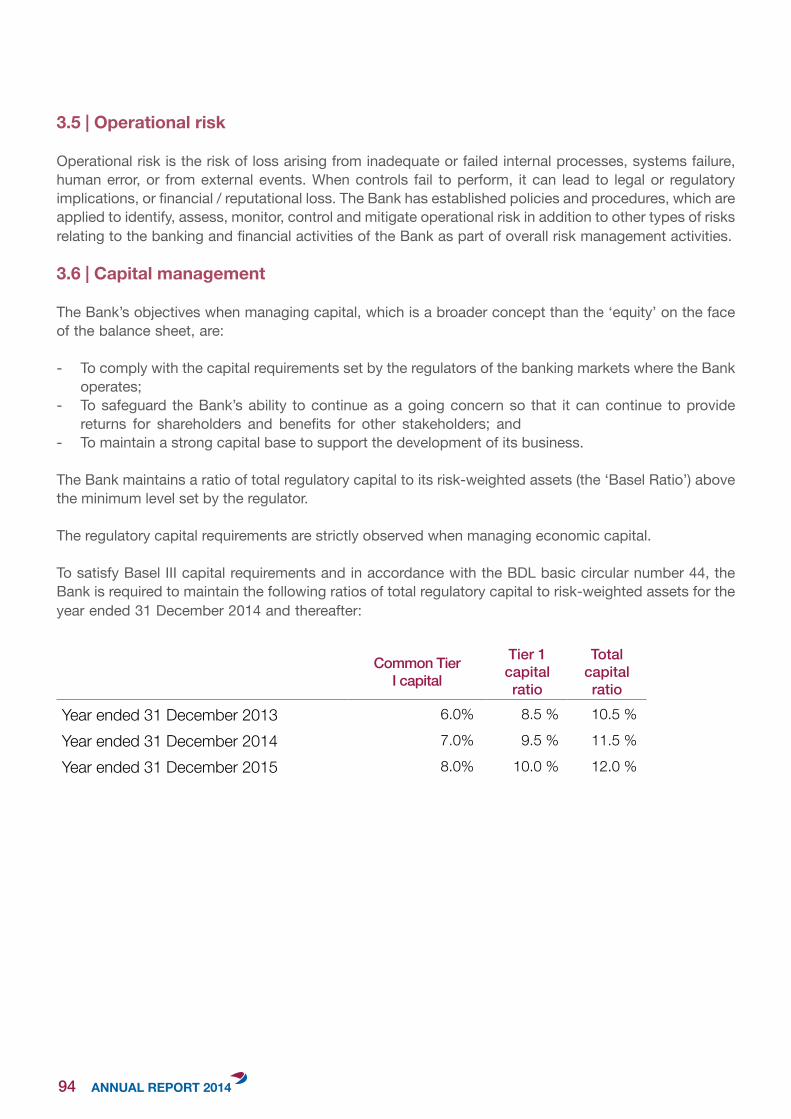
3.5 | Operational risk
Operational risk is the risk of loss arising from inadequate or failed internal processes, systems failure, human error, or from external events. When controls fail to perform, it can lead to legal or regulatory implications, or financial / reputational loss. The Bank has established policies and procedures, which are applied to identify, assess, monitor, control and mitigate operational risk in addition to other types of risks relating to the banking and financial activities of the Bank as part of overall risk management activities.
3.6 | Capital management
The Bank’s objectives when managing capital, which is a broader concept than the ‘equity’ on the face of the balance sheet, are:
- To comply with the capital requirements set by the regulators of the banking markets where the Bank operates;
- To safeguard the Bank’s ability to continue as a going concern so that it can continue to provide returns for shareholders and benefits for other stakeholders; and
- To maintain a strong capital base to support the development of its business.
The Bank maintains a ratio of total regulatory capital to its risk-weighted assets (the ‘Basel Ratio’) above the minimum level set by the regulator.
The regulatory capital requirements are strictly observed when managing economic capital.
To satisfy Basel III capital requirements and in accordance with the BDL basic circular number 44, the Bank is required to maintain the following ratios of total regulatory capital to risk-weighted assets for the year ended 31 December 2014 and thereafter:
Common TierI capital
Tier 1 capital ratio
Total capital ratio
Year ended 31 December 2013 6.0% 8.5 % 10.5 %
Year ended 31 December 2014 7.0% 9.5 % 11.5 %
Year ended 31 December 2015 8.0% 10.0 % 12.0 %
94
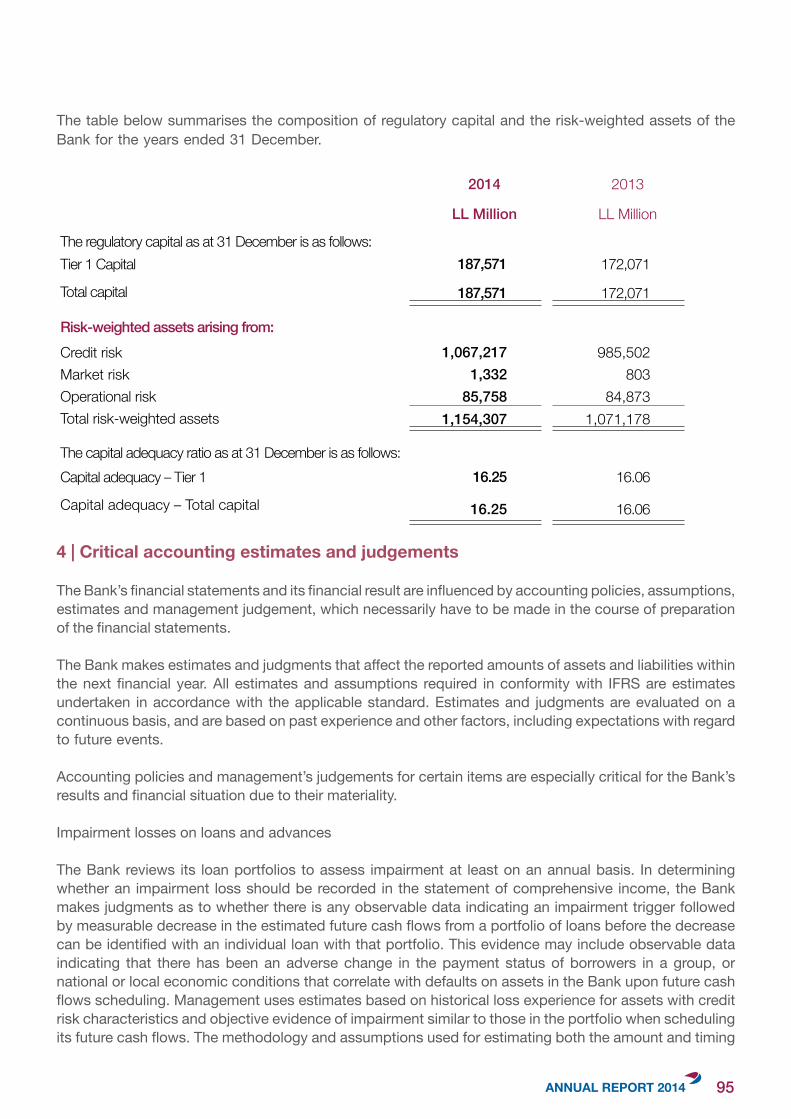
The table below summarises the composition of regulatory capital and the risk-weighted assets of the Bank for the years ended 31 December.
2014 2013
LL Million LL Million
The regulatory capital as at 31 December is as follows:Tier 1 Capital 187,571 172,071
Total capital 187,571 172,071
Risk-weighted assets arising from: Credit risk 1,067,217 985,502Market risk 1,332 803Operational risk 85,758 84,873Total risk-weighted assets 1,154,307 1,071,178
The capital adequacy ratio as at 31 December is as follows:Capital adequacy – Tier 1 16.25 16.06
Capital adequacy – Total capital 16.25 16.06
4 | Critical accounting estimates and judgements
The Bank’s financial statements and its financial result are influenced by accounting policies, assumptions, estimates and management judgement, which necessarily have to be made in the course of preparation of the financial statements.
The Bank makes estimates and judgments that affect the reported amounts of assets and liabilities within the next financial year. All estimates and assumptions required in conformity with IFRS are estimates undertaken in accordance with the applicable standard. Estimates and judgments are evaluated on a continuous basis, and are based on past experience and other factors, including expectations with regard to future events.
Accounting policies and management’s judgements for certain items are especially critical for the Bank’s results and financial situation due to their materiality.
Impairment losses on loans and advances
The Bank reviews its loan portfolios to assess impairment at least on an annual basis. In determining whether an impairment loss should be recorded in the statement of comprehensive income, the Bank makes judgments as to whether there is any observable data indicating an impairment trigger followed by measurable decrease in the estimated future cash flows from a portfolio of loans before the decrease can be identified with an individual loan with that portfolio. This evidence may include observable data indicating that there has been an adverse change in the payment status of borrowers in a group, or national or local economic conditions that correlate with defaults on assets in the Bank upon future cash flows scheduling. Management uses estimates based on historical loss experience for assets with credit risk characteristics and objective evidence of impairment similar to those in the portfolio when scheduling its future cash flows. The methodology and assumptions used for estimating both the amount and timing
95
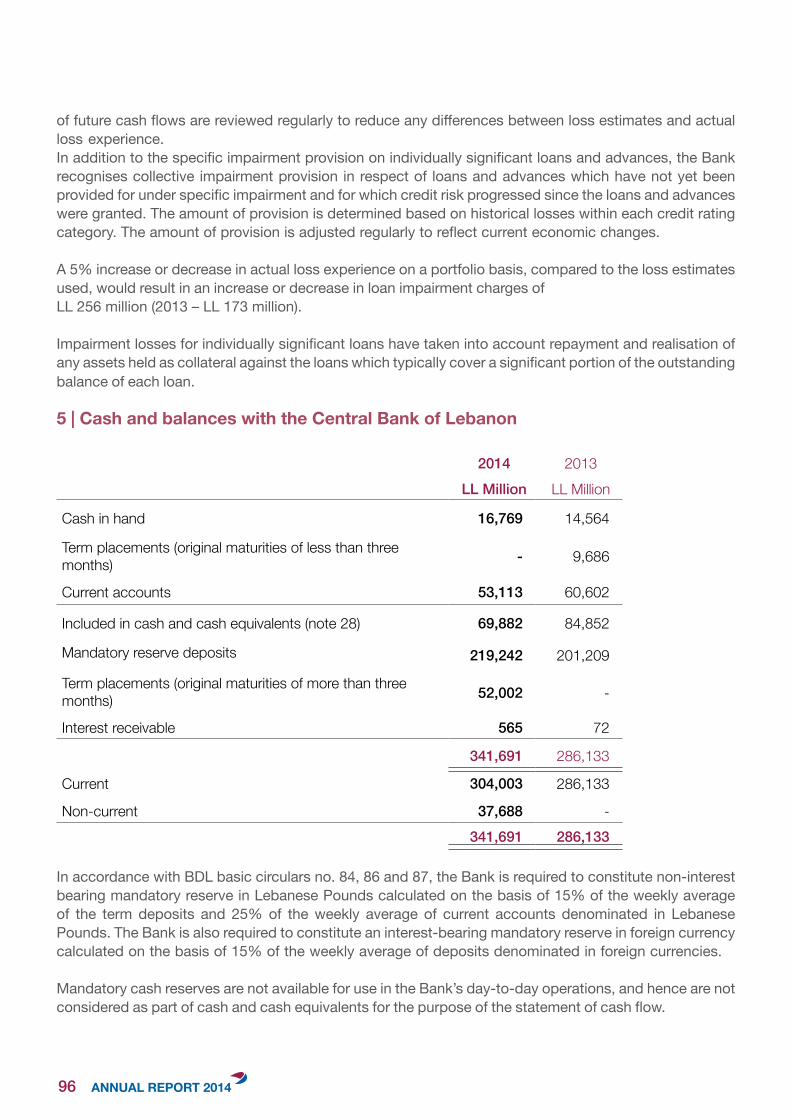
of future cash flows are reviewed regularly to reduce any differences between loss estimates and actual loss experience.In addition to the specific impairment provision on individually significant loans and advances, the Bank recognises collective impairment provision in respect of loans and advances which have not yet been provided for under specific impairment and for which credit risk progressed since the loans and advances were granted. The amount of provision is determined based on historical losses within each credit rating category. The amount of provision is adjusted regularly to reflect current economic changes.
A 5% increase or decrease in actual loss experience on a portfolio basis, compared to the loss estimates used, would result in an increase or decrease in loan impairment charges ofLL 256 million (2013 – LL 173 million).
Impairment losses for individually significant loans have taken into account repayment and realisation of any assets held as collateral against the loans which typically cover a significant portion of the outstanding balance of each loan.
5 | Cash and balances with the Central Bank of Lebanon
2014 2013LL Million LL Million
Cash in hand 16,769 14,564
Term placements (original maturities of less than three months) - 9,686
Current accounts 53,113 60,602
Included in cash and cash equivalents (note 28) 69,882 84,852
Mandatory reserve deposits 219,242 201,209
Term placements (original maturities of more than three months) 52,002 -
Interest receivable 565 72
341,691 286,133
Current 304,003 286,133
Non-current 37,688 -341,691 286,133
In accordance with BDL basic circulars no. 84, 86 and 87, the Bank is required to constitute non-interest bearing mandatory reserve in Lebanese Pounds calculated on the basis of 15% of the weekly average of the term deposits and 25% of the weekly average of current accounts denominated in Lebanese Pounds. The Bank is also required to constitute an interest-bearing mandatory reserve in foreign currency calculated on the basis of 15% of the weekly average of deposits denominated in foreign currencies.
Mandatory cash reserves are not available for use in the Bank’s day-to-day operations, and hence are not considered as part of cash and cash equivalents for the purpose of the statement of cash flow.
96
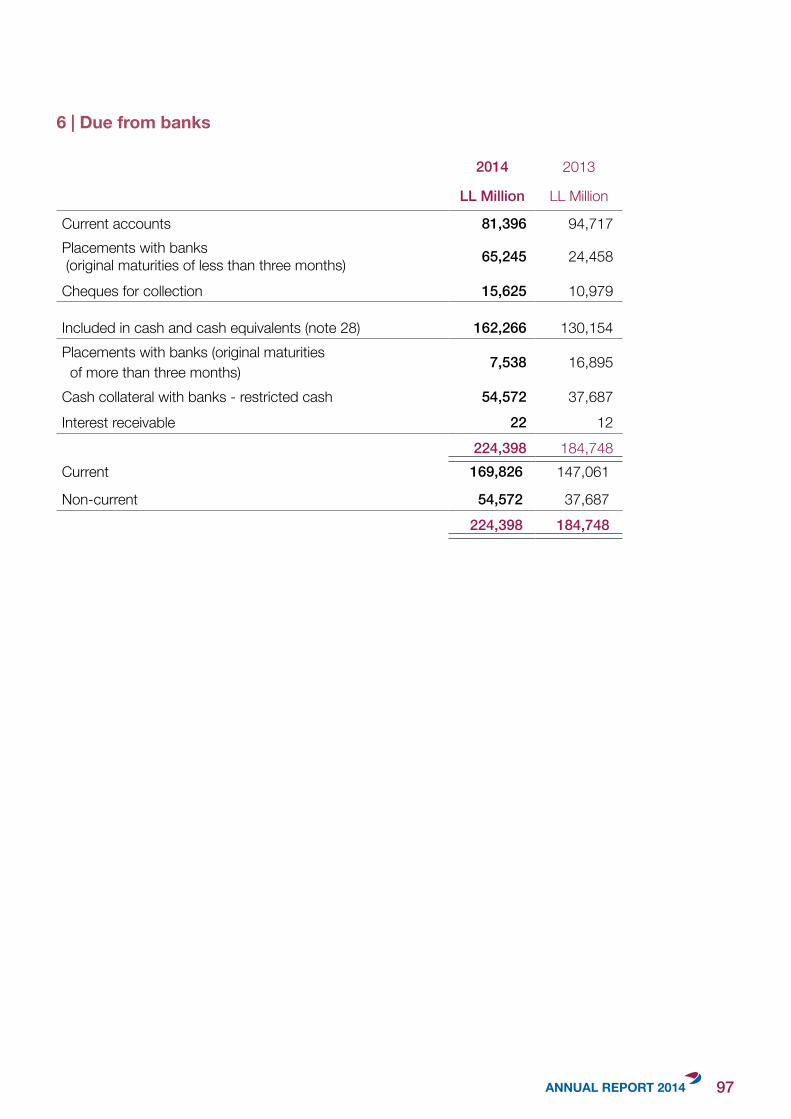
6 | Due from banks
2014 2013
LL Million LL Million
Current accounts 81,396 94,717Placements with banks (original maturities of less than three months) 65,245 24,458
Cheques for collection 15,625 10,979
Included in cash and cash equivalents (note 28) 162,266 130,154Placements with banks (original maturities of more than three months) 7,538 16,895
Cash collateral with banks - restricted cash 54,572 37,687Interest receivable 22 12
224,398 184,748Current 169,826 147,061
Non-current 54,572 37,687224,398 184,748
97
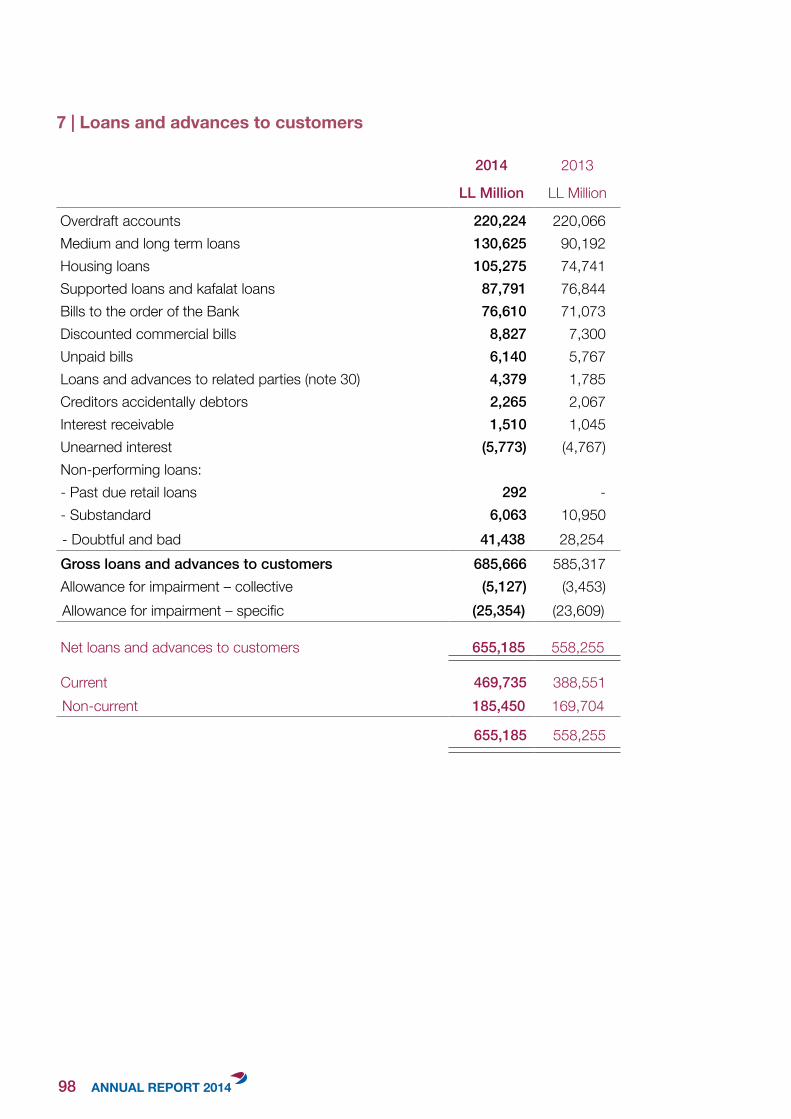
7 | Loans and advances to customers
2014 2013
LL Million LL Million
Overdraft accounts 220,224 220,066Medium and long term loans 130,625 90,192Housing loans 105,275 74,741Supported loans and kafalat loans 87,791 76,844Bills to the order of the Bank 76,610 71,073Discounted commercial bills 8,827 7,300Unpaid bills 6,140 5,767Loans and advances to related parties (note 30) 4,379 1,785Creditors accidentally debtors 2,265 2,067Interest receivable 1,510 1,045Unearned interest (5,773) (4,767)Non-performing loans:- Past due retail loans 292 -- Substandard 6,063 10,950- Doubtful and bad 41,438 28,254Gross loans and advances to customers 685,666 585,317Allowance for impairment – collective (5,127) (3,453)Allowance for impairment – specific (25,354) (23,609)
Net loans and advances to customers 655,185 558,255
Current 469,735 388,551Non-current 185,450 169,704
655,185 558,255
98
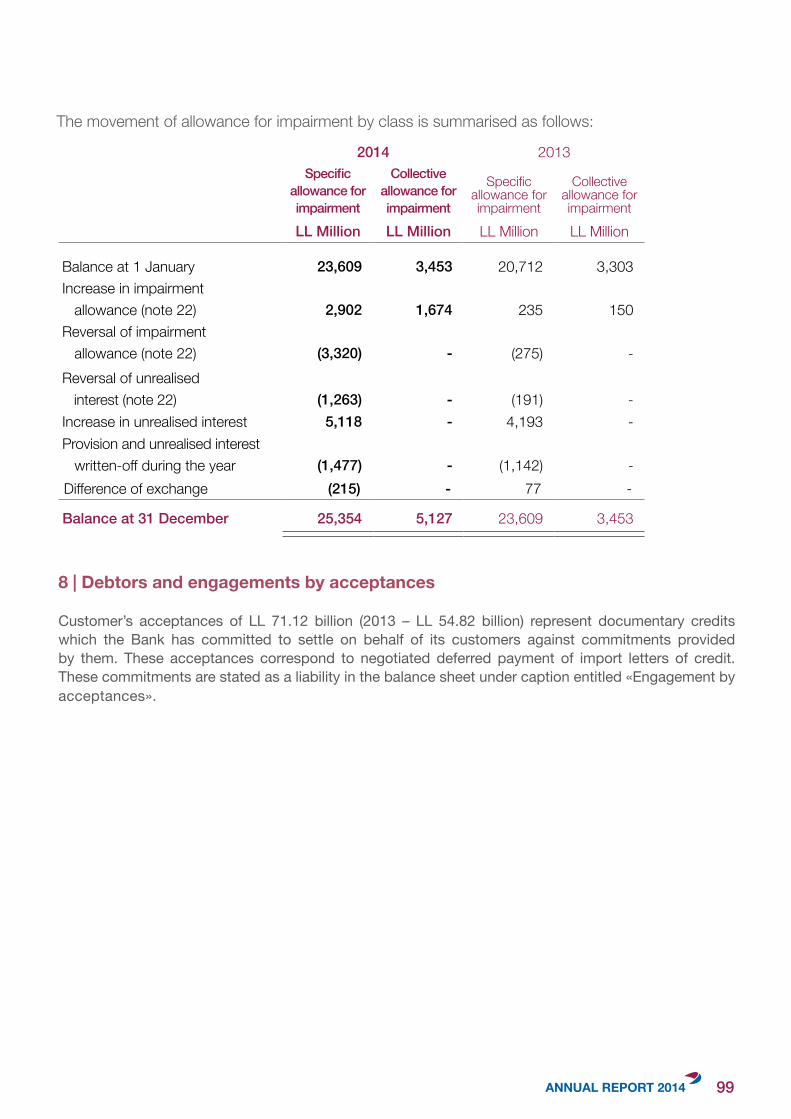
The movement of allowance for impairment by class is summarised as follows:
2014 2013Specific
allowance for impairment
Collective allowance for impairment
Specific allowance for impairment
Collective allowance for impairment
LL Million LL Million LL Million LL Million
Balance at 1 January 23,609 3,453 20,712 3,303Increase in impairment allowance (note 22) 2,902 1,674 235 150Reversal of impairment allowance (note 22) (3,320) - (275) -Reversal of unrealised interest (note 22) (1,263) - (191) -Increase in unrealised interest 5,118 - 4,193 -Provision and unrealised interest written-off during the year (1,477) - (1,142) -Difference of exchange (215) - 77 -
Balance at 31 December 25,354 5,127 23,609 3,453
8|Debtorsandengagementsbyacceptances
Customer’s acceptances of LL 71.12 billion (2013 – LL 54.82 billion) represent documentary credits which the Bank has committed to settle on behalf of its customers against commitments provided by them. These acceptances correspond to negotiated deferred payment of import letters of credit. These commitments are stated as a liability in the balance sheet under caption entitled «Engagement by acceptances».
99
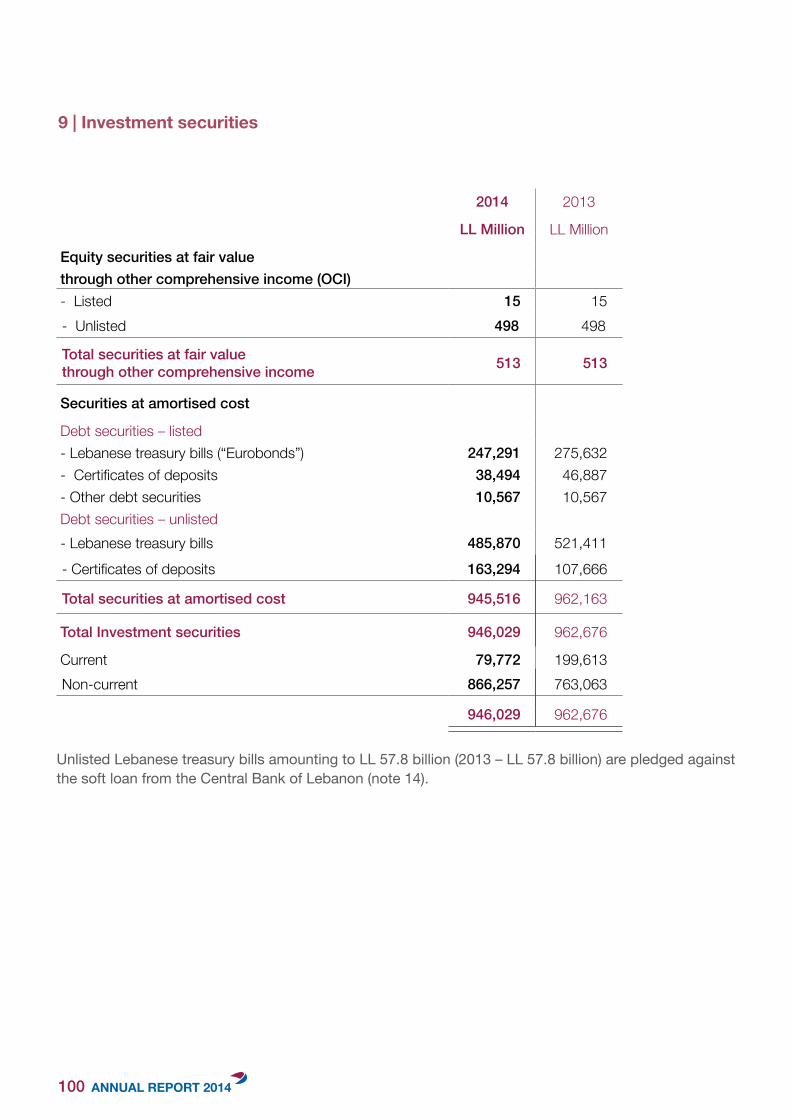
9 | Investment securities
2014 2013
LL Million LL Million
Equity securities at fair valuethrough other comprehensive income (OCI)- Listed 15 15- Unlisted 498 498
Total securities at fair valuethrough other comprehensive income 513 513
Securities at amortised cost
Debt securities – listed- Lebanese treasury bills (“Eurobonds”) 247,291 275,632- Certificates of deposits 38,494 46,887- Other debt securities 10,567 10,567Debt securities – unlisted- Lebanese treasury bills 485,870 521,411- Certificates of deposits 163,294 107,666
Total securities at amortised cost 945,516 962,163
Total Investment securities 946,029 962,676
Current 79,772 199,613Non-current 866,257 763,063
946,029 962,676
Unlisted Lebanese treasury bills amounting to LL 57.8 billion (2013 – LL 57.8 billion) are pledged against the soft loan from the Central Bank of Lebanon (note 14).
100
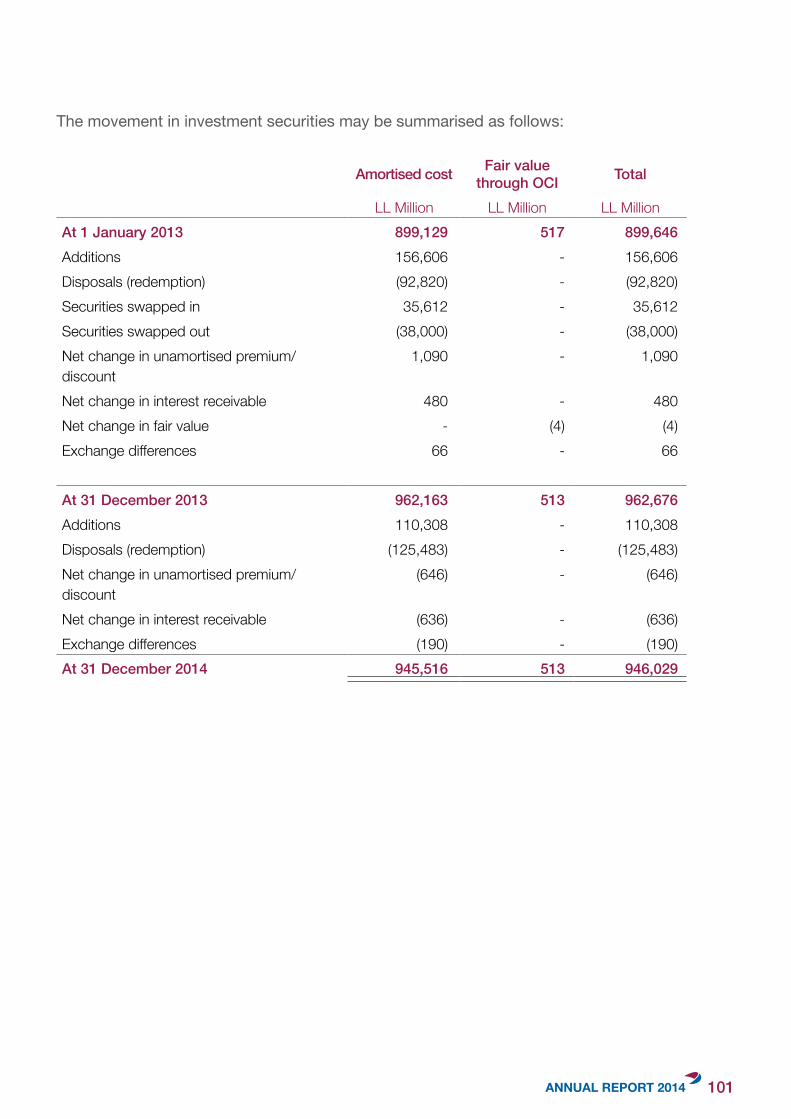
The movement in investment securities may be summarised as follows:
Amortised cost Fair value through OCI Total
LL Million LL Million LL MillionAt 1 January 2013 899,129 517 899,646Additions 156,606 - 156,606Disposals (redemption) (92,820) - (92,820)Securities swapped in 35,612 - 35,612Securities swapped out (38,000) - (38,000)Net change in unamortised premium/discount
1,090 - 1,090
Net change in interest receivable 480 - 480Net change in fair value - (4) (4)Exchange differences 66 - 66
At 31 December 2013 962,163 513 962,676Additions 110,308 - 110,308Disposals (redemption) (125,483) - (125,483)Net change in unamortised premium/discount
(646) - (646)
Net change in interest receivable (636) - (636)Exchange differences (190) - (190)At 31 December 2014 945,516 513 946,029
101
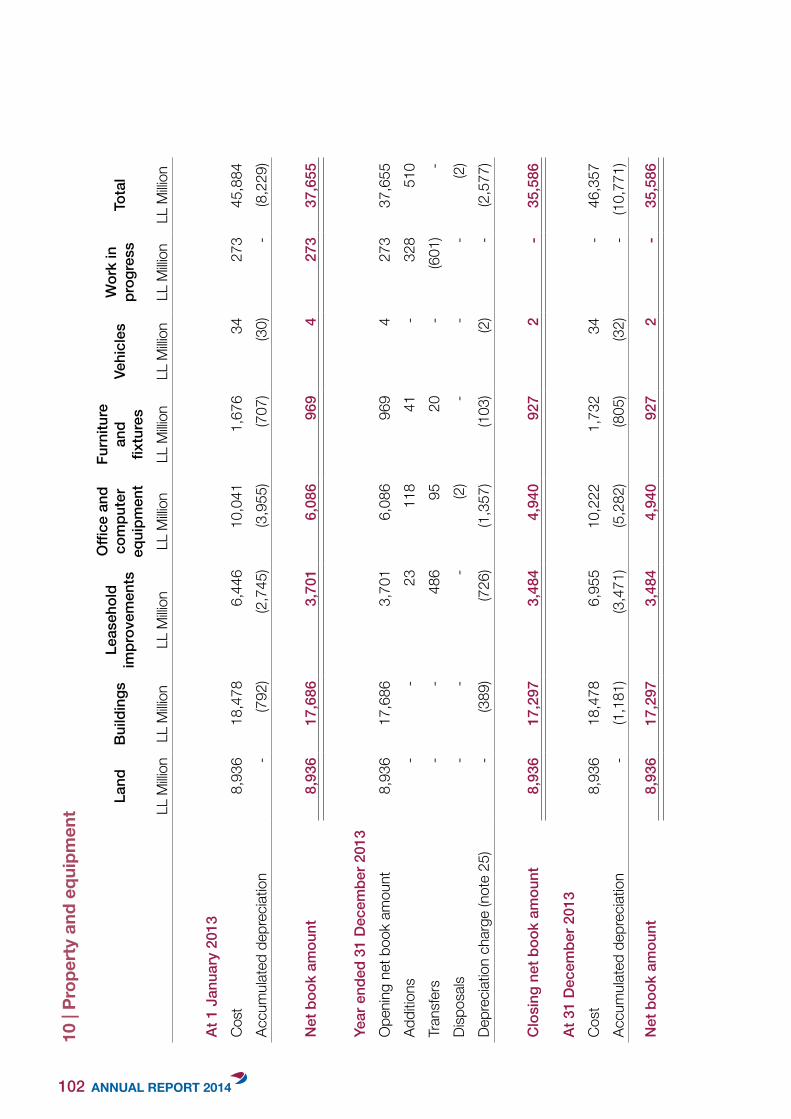
10|Prop
ertyand
equ
ipmen
t
Land
Build
ings
Leas
ehol
dim
prov
emen
ts
Offi
ce a
nd
com
pute
r eq
uipm
ent
Furn
iture
an
dfix
ture
sVe
hicl
esW
ork
in
prog
ress
Tota
l
LL M
illion
LL M
illion
LL M
illion
LL M
illion
LL M
illion
LL M
illion
LL M
illion
LL M
illion
At 1
Jan
uary
201
3Co
st8,
936
18,
478
6,4
46
10,
041
1,6
76
34
273
4
5,88
4Ac
cum
ulat
ed d
epre
ciatio
n-
(792
) (2
,745
) (3
,955
) (7
07)
(30)
- (8
,229
)
Net
boo
k am
ount
8,93
6 1
7,68
6 3
,701
6
,086
9
69
4
273
3
7,65
5
Year
end
ed 3
1 D
ecem
ber 2
013
O
peni
ng n
et b
ook
amou
nt8,
936
17,
686
3,7
01
6,0
86
969
4
2
73
37,
655
Addi
tions
--
23
118
4
1 -
328
5
10Tr
ansf
ers
- -
486
9
5 2
0 -
(601
) -
Disp
osals
- -
- (2
) -
- -
(2)
Depr
eciat
ion
char
ge (n
ote
25)
- (3
89)
(726
) (1
,357
) (1
03)
(2)
- (2
,577
)
Clo
sing
net
boo
k am
ount
8,93
6 1
7,29
7 3
,484
4
,940
9
27
2
- 3
5,58
6
At 3
1 D
ecem
ber 2
013
Cost
8,93
6 1
8,47
8 6
,955
1
0,22
2 1
,732
3
4 -
46,
357
Accu
mul
ated
dep
recia
tion
- (1
,181
) (3
,471
) (5
,282
) (8
05)
(32)
- (1
0,77
1)
Net
boo
k am
ount
8,93
6 1
7,29
7 3
,484
4
,940
9
27
2
- 3
5,58
6
102
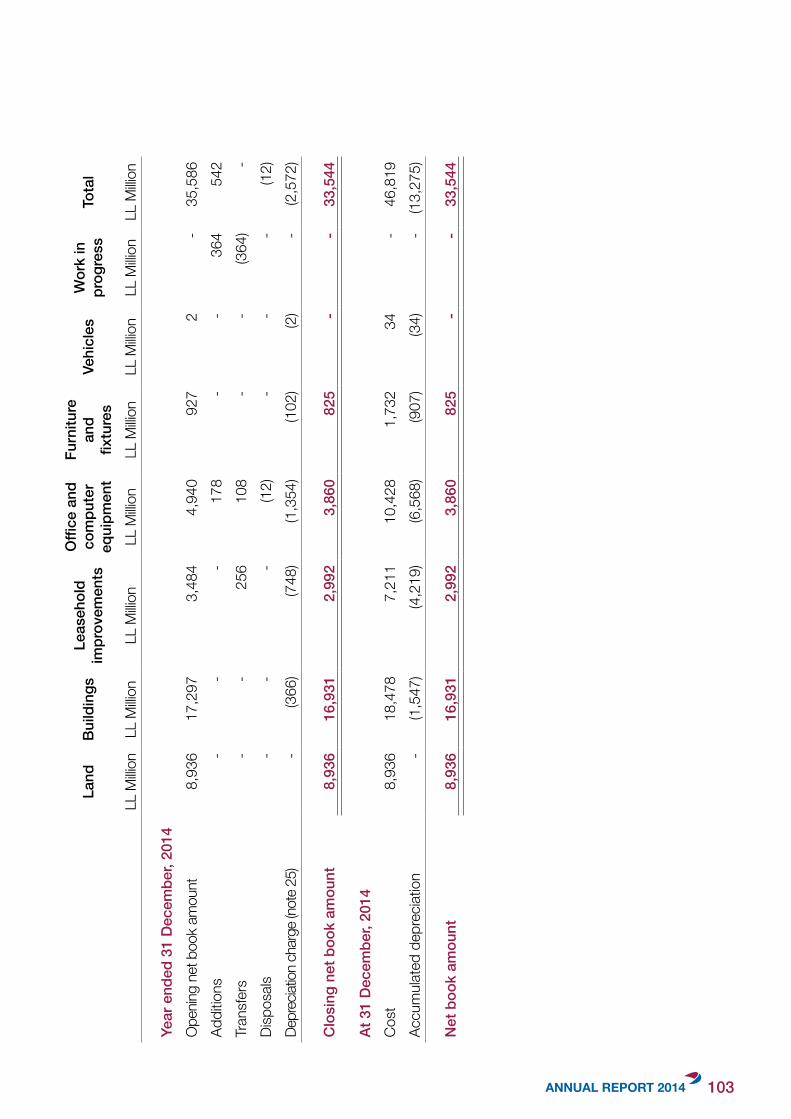
Land
Build
ings
Leas
ehol
dim
prov
emen
ts
Offi
ce a
nd
com
pute
r eq
uipm
ent
Furn
iture
an
dfix
ture
sVe
hicl
esW
ork
in
prog
ress
Tota
l
LL M
illion
LL M
illion
LL M
illion
LL M
illion
LL M
illion
LL M
illion
LL M
illion
LL M
illion
Year
end
ed 3
1 D
ecem
ber,
2014
Ope
ning
net b
ook
amou
nt8,
936
17,
297
3,4
84 4
,940
927
2 -
35,
586
Addi
tions
- -
- 1
78 -
- 3
64 5
42Tr
ansf
ers
- -
256
108
- -
(364
) -
Disp
osals
- -
- (1
2) -
- -
(12)
Depr
eciat
ion c
harg
e (no
te 2
5)-
(366
) (7
48)
(1,3
54)
(102
) (2
) -
(2,5
72)
Clo
sing
net
boo
k am
ount
8,93
6 1
6,93
1 2
,992
3,8
60 8
25 -
- 3
3,54
4
At 3
1 D
ecem
ber,
2014
Co
st8,
936
18,
478
7,2
11 1
0,42
8 1
,732
34
- 4
6,81
9Ac
cum
ulat
ed d
epre
ciatio
n-
(1,5
47)
(4,2
19)
(6,5
68)
(907
) (3
4) -
(13,
275)
Net
boo
k am
ount
8,93
6 1
6,93
1 2
,992
3,8
60 8
25 -
- 3
3,54
4
103
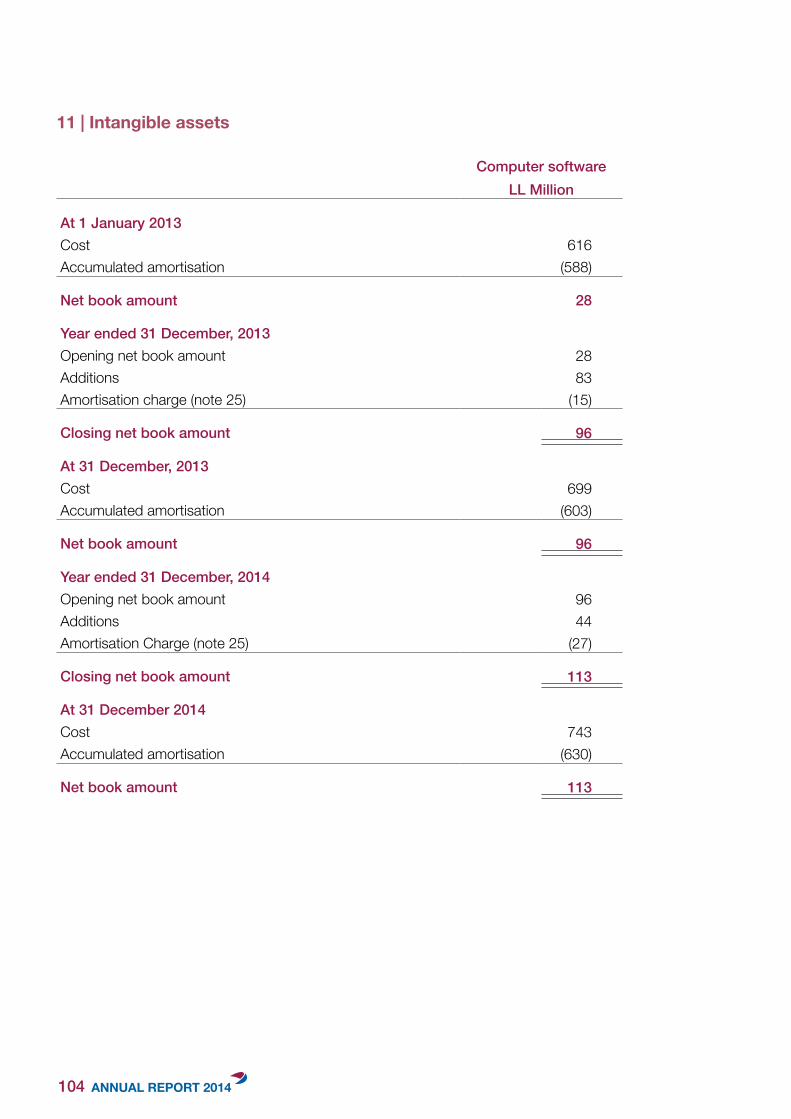
11 | Intangible assets
Computer softwareLL Million
At 1 January 2013Cost 616Accumulated amortisation (588)
Net book amount 28
Year ended 31 December, 2013Opening net book amount 28Additions 83Amortisation charge (note 25) (15)
Closing net book amount 96
At 31 December, 2013Cost 699Accumulated amortisation (603)
Net book amount 96
Year ended 31 December, 2014Opening net book amount 96Additions 44Amortisation Charge (note 25) (27)
Closing net book amount 113
At 31 December 2014Cost 743Accumulated amortisation (630)
Net book amount 113
104
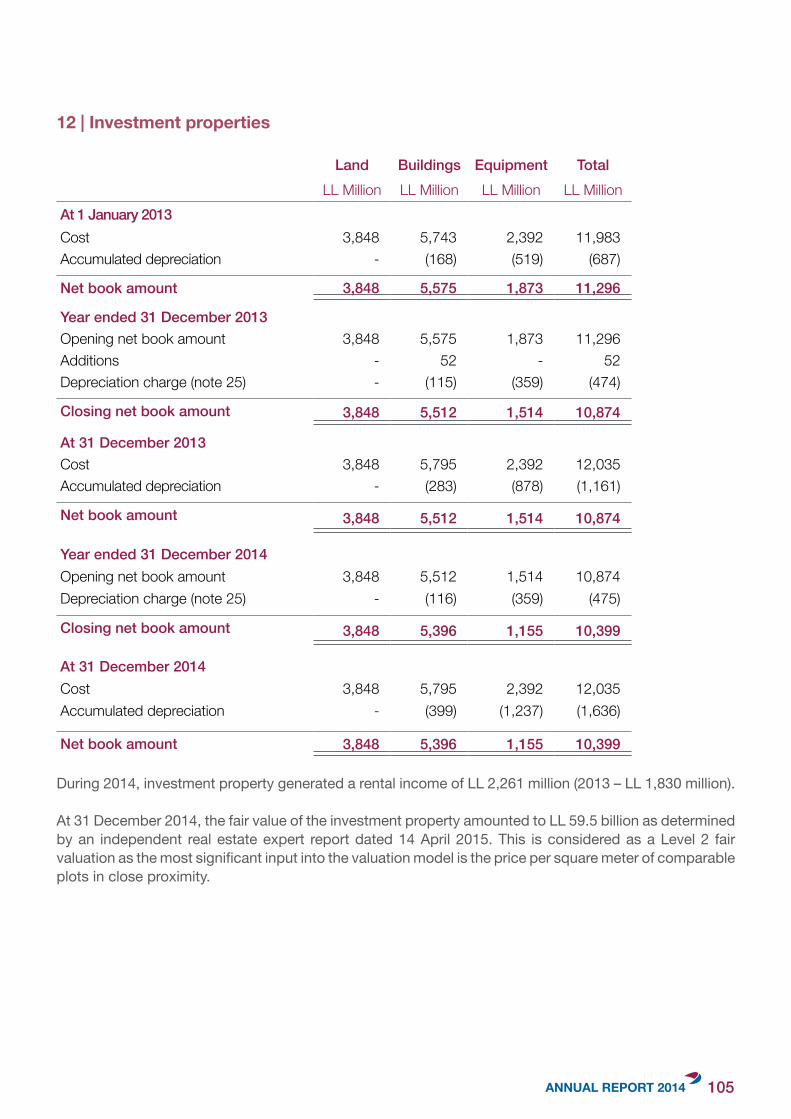
12 | Investment properties
Land Buildings Equipment TotalLL Million LL Million LL Million LL Million
At 1 January 2013 Cost 3,848 5,743 2,392 11,983Accumulated depreciation - (168) (519) (687)
Net book amount 3,848 5,575 1,873 11,296
Year ended 31 December 2013Opening net book amount 3,848 5,575 1,873 11,296Additions - 52 - 52Depreciation charge (note 25) - (115) (359) (474)
Closing net book amount 3,848 5,512 1,514 10,874
At 31 December 2013Cost 3,848 5,795 2,392 12,035Accumulated depreciation - (283) (878) (1,161)
Net book amount 3,848 5,512 1,514 10,874
Year ended 31 December 2014Opening net book amount 3,848 5,512 1,514 10,874Depreciation charge (note 25) - (116) (359) (475)
Closing net book amount 3,848 5,396 1,155 10,399
At 31 December 2014Cost 3,848 5,795 2,392 12,035Accumulated depreciation - (399) (1,237) (1,636)
Net book amount 3,848 5,396 1,155 10,399
During 2014, investment property generated a rental income of LL 2,261 million (2013 – LL 1,830 million).
At 31 December 2014, the fair value of the investment property amounted to LL 59.5 billion as determined by an independent real estate expert report dated 14 April 2015. This is considered as a Level 2 fair valuation as the most significant input into the valuation model is the price per square meter of comparable plots in close proximity.
105
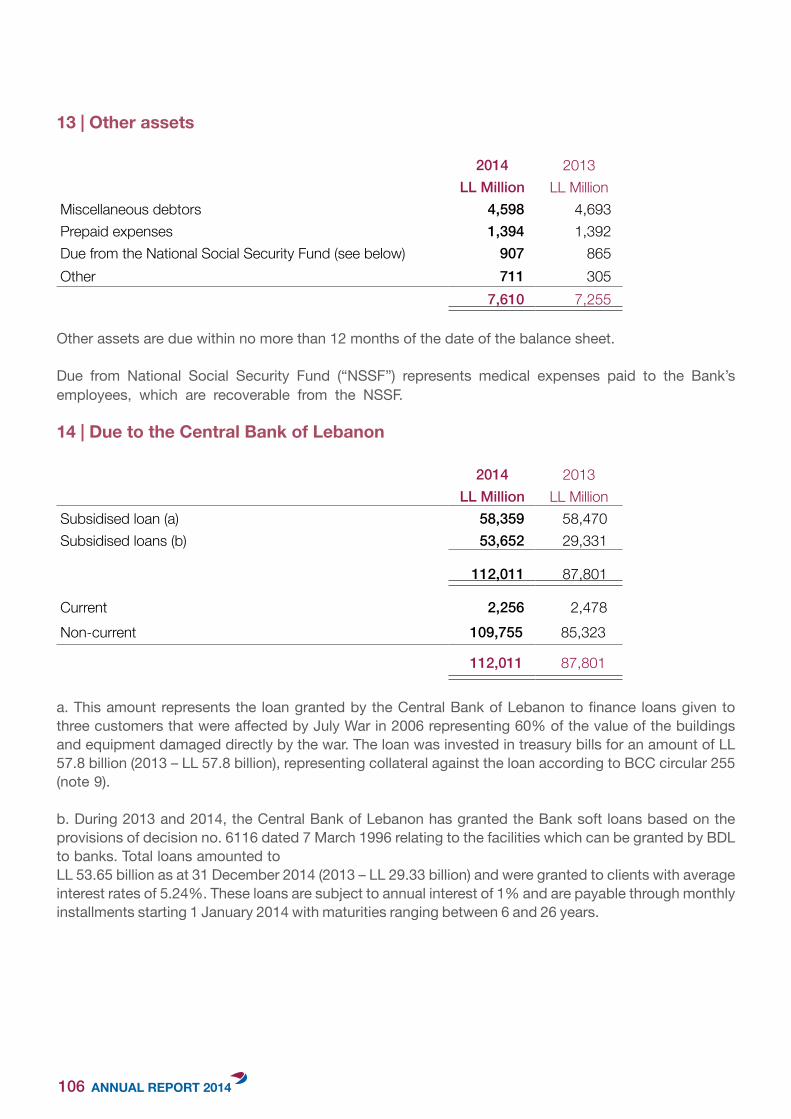
13 | Other assets
2014 2013LL Million LL Million
Miscellaneous debtors 4,598 4,693Prepaid expenses 1,394 1,392Due from the National Social Security Fund (see below) 907 865Other 711 305
7,610 7,255
Other assets are due within no more than 12 months of the date of the balance sheet.
Due from National Social Security Fund (“NSSF”) represents medical expenses paid to the Bank’s employees, which are recoverable from the NSSF.
14 | Due to the Central Bank of Lebanon
2014 2013LL Million LL Million
Subsidised loan (a) 58,359 58,470Subsidised loans (b) 53,652 29,331
112,011 87,801
Current 2,256 2,478Non-current 109,755 85,323
112,011 87,801
a. This amount represents the loan granted by the Central Bank of Lebanon to finance loans given to three customers that were affected by July War in 2006 representing 60% of the value of the buildings and equipment damaged directly by the war. The loan was invested in treasury bills for an amount of LL 57.8 billion (2013 – LL 57.8 billion), representing collateral against the loan according to BCC circular 255 (note 9).
b. During 2013 and 2014, the Central Bank of Lebanon has granted the Bank soft loans based on the provisions of decision no. 6116 dated 7 March 1996 relating to the facilities which can be granted by BDL to banks. Total loans amounted toLL 53.65 billion as at 31 December 2014 (2013 – LL 29.33 billion) and were granted to clients with average interest rates of 5.24%. These loans are subject to annual interest of 1% and are payable through monthly installments starting 1 January 2014 with maturities ranging between 6 and 26 years.
106
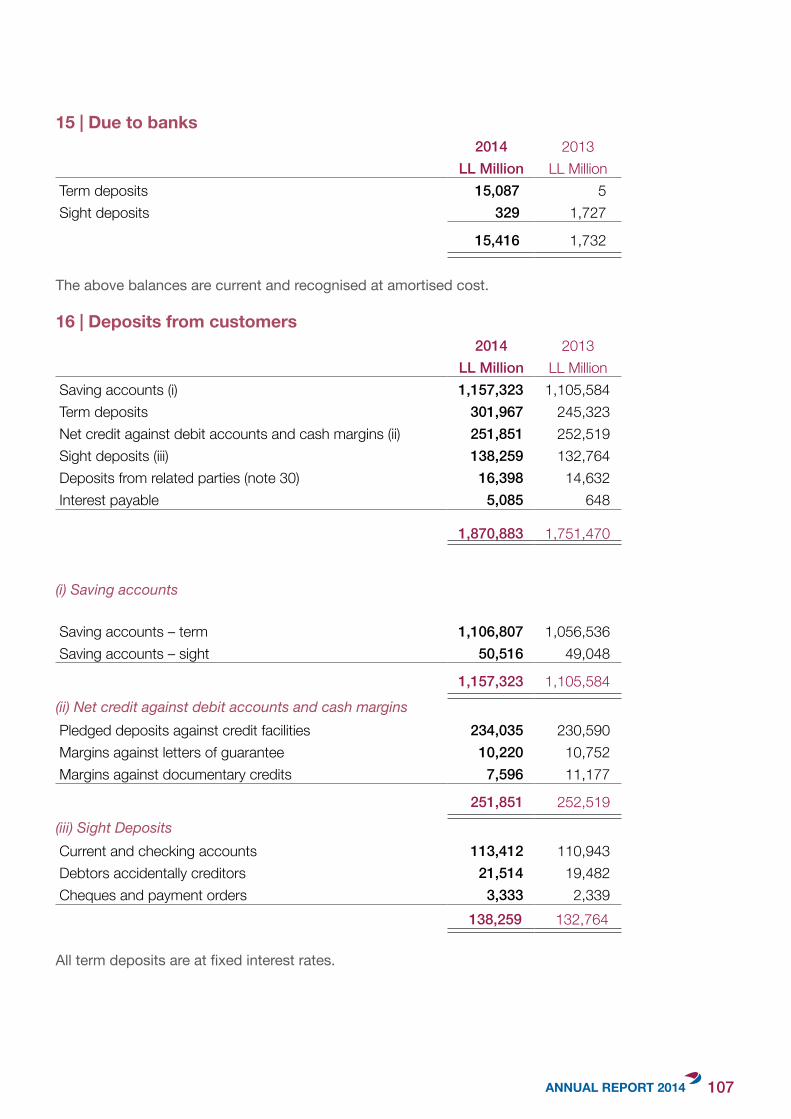
15 | Due to banks2014 2013
LL Million LL MillionTerm deposits 15,087 5Sight deposits 329 1,727
15,416 1,732
The above balances are current and recognised at amortised cost.
16 | Deposits from customers2014 2013
LL Million LL MillionSaving accounts (i) 1,157,323 1,105,584Term deposits 301,967 245,323Net credit against debit accounts and cash margins (ii) 251,851 252,519Sight deposits (iii) 138,259 132,764Deposits from related parties (note 30) 16,398 14,632Interest payable 5,085 648
1,870,883 1,751,470
(i) Saving accounts
Saving accounts – term 1,106,807 1,056,536Saving accounts – sight 50,516 49,048
1,157,323 1,105,584(ii) Net credit against debit accounts and cash marginsPledged deposits against credit facilities 234,035 230,590Margins against letters of guarantee 10,220 10,752Margins against documentary credits 7,596 11,177
251,851 252,519(iii) Sight DepositsCurrent and checking accounts 113,412 110,943Debtors accidentally creditors 21,514 19,482Cheques and payment orders 3,333 2,339
138,259 132,764
All term deposits are at fixed interest rates.
107
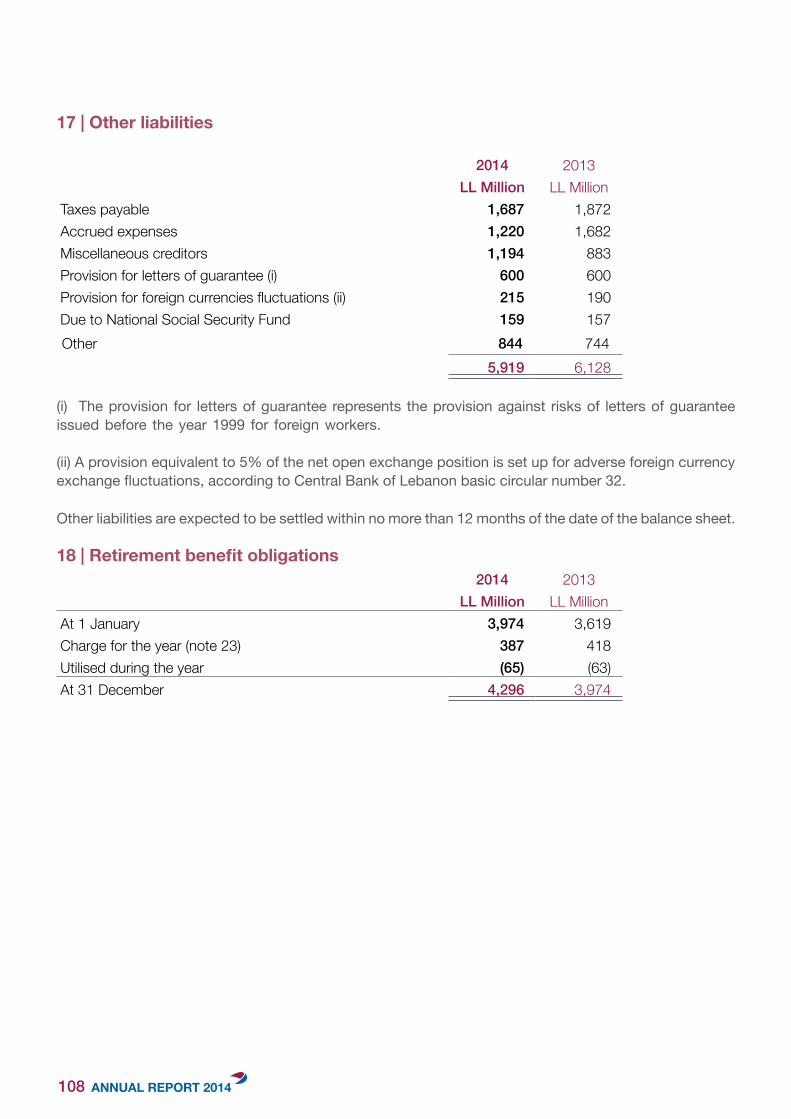
17 | Other liabilities
2014 2013LL Million LL Million
Taxes payable 1,687 1,872Accrued expenses 1,220 1,682Miscellaneous creditors 1,194 883Provision for letters of guarantee (i) 600 600Provision for foreign currencies fluctuations (ii) 215 190Due to National Social Security Fund 159 157Other 844 744
5,919 6,128
(i) The provision for letters of guarantee represents the provision against risks of letters of guarantee issued before the year 1999 for foreign workers.
(ii) A provision equivalent to 5% of the net open exchange position is set up for adverse foreign currency exchange fluctuations, according to Central Bank of Lebanon basic circular number 32.
Other liabilities are expected to be settled within no more than 12 months of the date of the balance sheet.
18|Retirementbenefitobligations2014 2013
LL Million LL MillionAt 1 January 3,974 3,619Charge for the year (note 23) 387 418Utilised during the year (65) (63)At 31 December 4,296 3,974
108
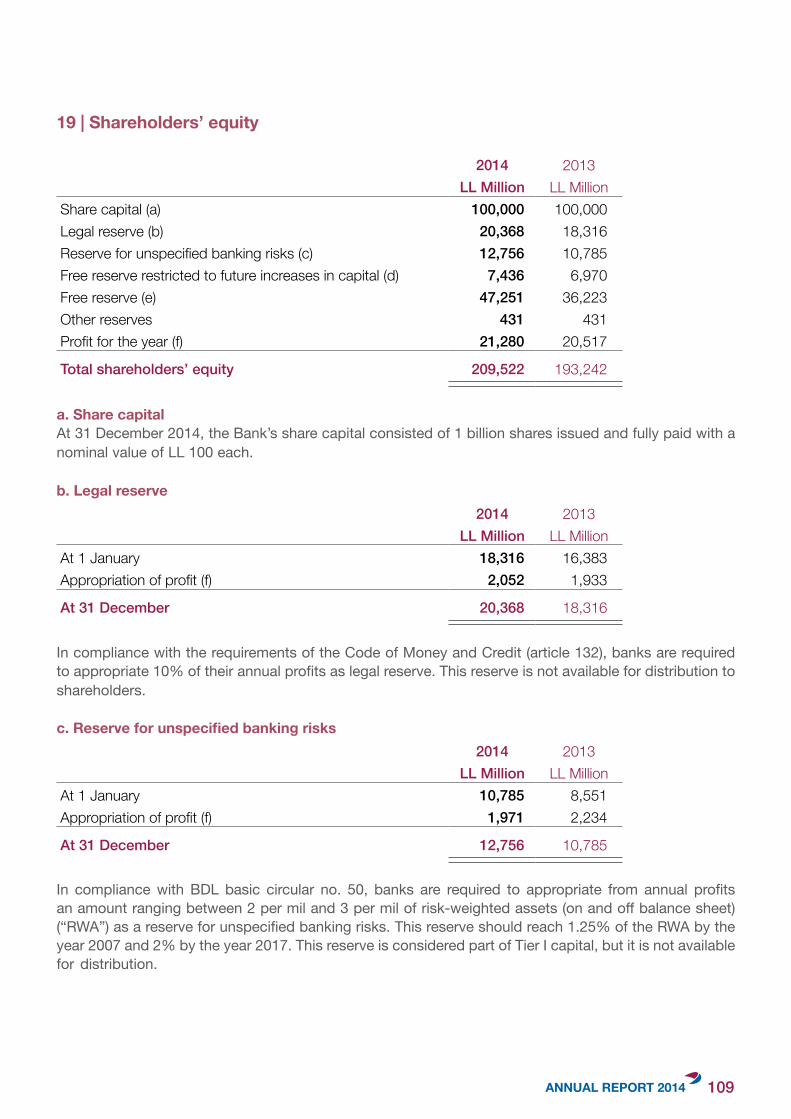
19|Shareholders’equity
2014 2013LL Million LL Million
Share capital (a) 100,000 100,000Legal reserve (b) 20,368 18,316Reserve for unspecified banking risks (c) 12,756 10,785Free reserve restricted to future increases in capital (d) 7,436 6,970Free reserve (e) 47,251 36,223Other reserves 431 431Profit for the year (f) 21,280 20,517
Total shareholders’ equity 209,522 193,242
a. Share capitalAt 31 December 2014, the Bank’s share capital consisted of 1 billion shares issued and fully paid with a nominal value of LL 100 each.
b. Legal reserve2014 2013
LL Million LL MillionAt 1 January 18,316 16,383Appropriation of profit (f) 2,052 1,933
At 31 December 20,368 18,316
In compliance with the requirements of the Code of Money and Credit (article 132), banks are required to appropriate 10% of their annual profits as legal reserve. This reserve is not available for distribution to shareholders.
c.Reserveforunspecifiedbankingrisks2014 2013
LL Million LL MillionAt 1 January 10,785 8,551Appropriation of profit (f) 1,971 2,234
At 31 December 12,756 10,785
In compliance with BDL basic circular no. 50, banks are required to appropriate from annual profits an amount ranging between 2 per mil and 3 per mil of risk-weighted assets (on and off balance sheet) (“RWA”) as a reserve for unspecified banking risks. This reserve should reach 1.25% of the RWA by the year 2007 and 2% by the year 2017. This reserve is considered part of Tier I capital, but it is not available for distribution.
109
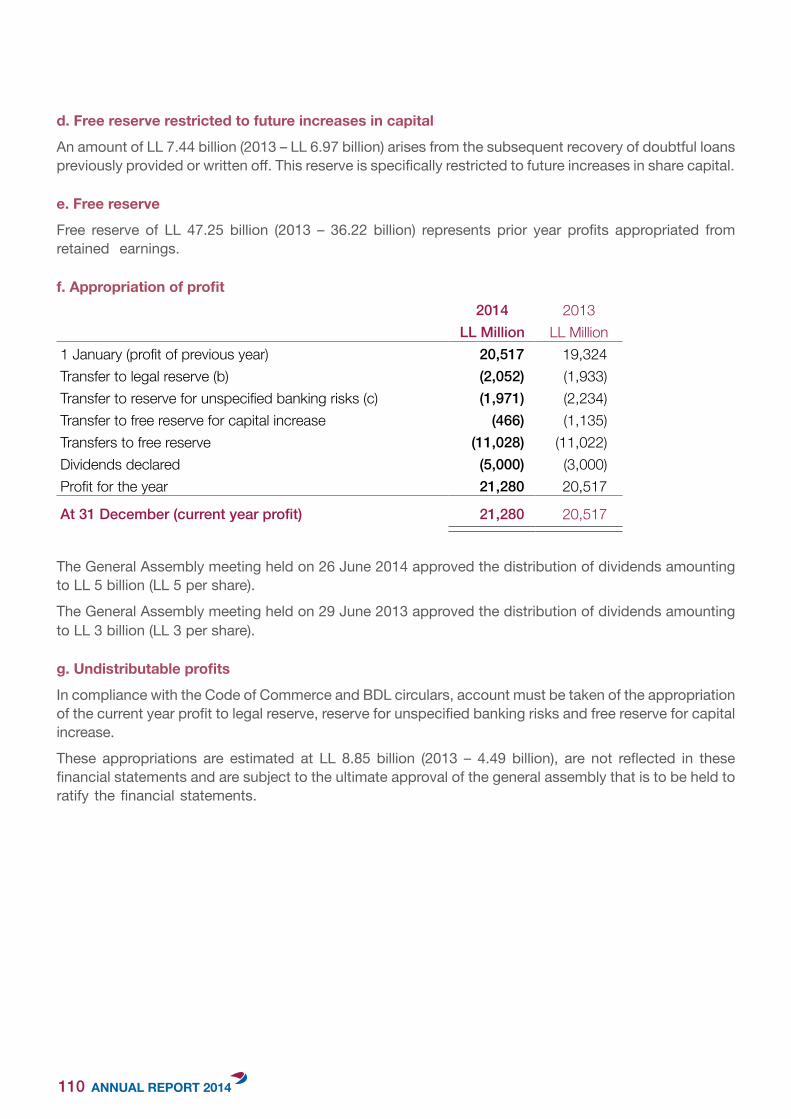
d. Free reserve restricted to future increases in capital
An amount of LL 7.44 billion (2013 – LL 6.97 billion) arises from the subsequent recovery of doubtful loans previously provided or written off. This reserve is specifically restricted to future increases in share capital.
e. Free reserve
Free reserve of LL 47.25 billion (2013 – 36.22 billion) represents prior year profits appropriated from retained earnings.
f.Appropriationofprofit2014 2013
LL Million LL Million1 January (profit of previous year) 20,517 19,324Transfer to legal reserve (b) (2,052) (1,933)Transfer to reserve for unspecified banking risks (c) (1,971) (2,234)Transfer to free reserve for capital increase (466) (1,135)Transfers to free reserve (11,028) (11,022)Dividends declared (5,000) (3,000)Profit for the year 21,280 20,517
At 31 December (current year profit) 21,280 20,517
The General Assembly meeting held on 26 June 2014 approved the distribution of dividends amounting to LL 5 billion (LL 5 per share).
The General Assembly meeting held on 29 June 2013 approved the distribution of dividends amounting to LL 3 billion (LL 3 per share).
g.Undistributableprofits
In compliance with the Code of Commerce and BDL circulars, account must be taken of the appropriation of the current year profit to legal reserve, reserve for unspecified banking risks and free reserve for capital increase.
These appropriations are estimated at LL 8.85 billion (2013 – 4.49 billion), are not reflected in these financial statements and are subject to the ultimate approval of the general assembly that is to be held to ratify the financial statements.
110
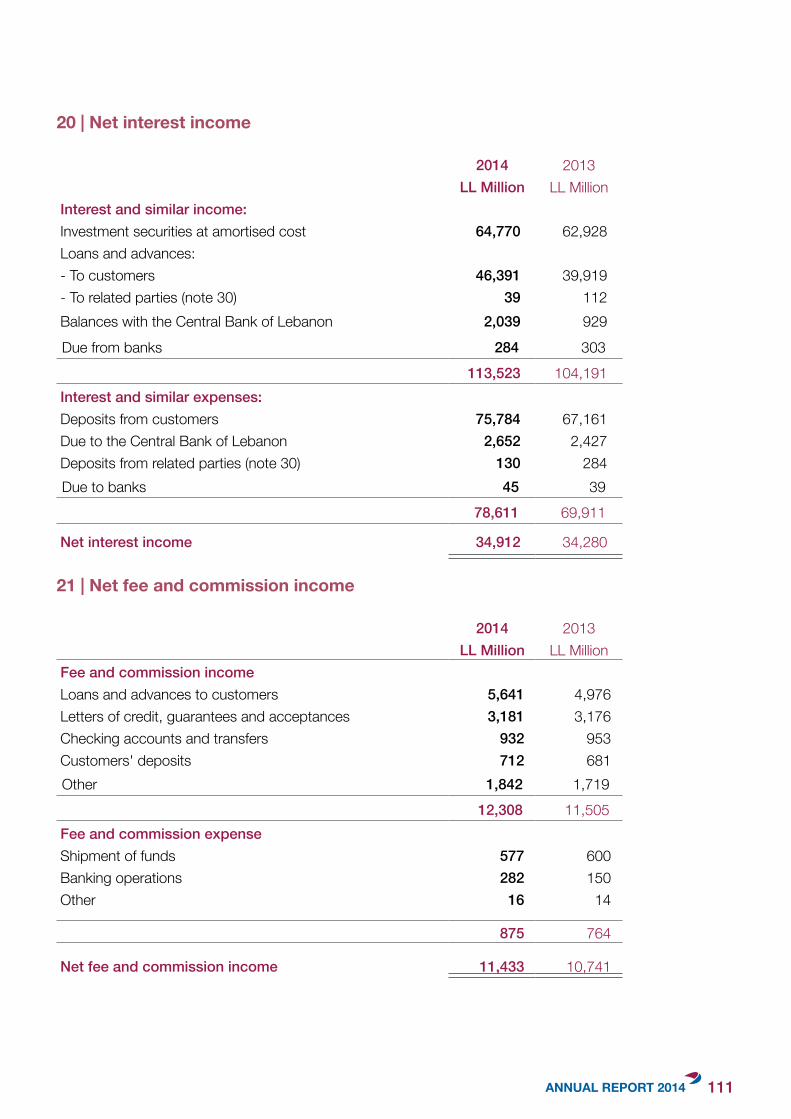
20 | Net interest income
2014 2013LL Million LL Million
Interest and similar income:Investment securities at amortised cost 64,770 62,928Loans and advances:- To customers 46,391 39,919- To related parties (note 30) 39 112Balances with the Central Bank of Lebanon 2,039 929Due from banks 284 303
113,523 104,191Interest and similar expenses:Deposits from customers 75,784 67,161Due to the Central Bank of Lebanon 2,652 2,427Deposits from related parties (note 30) 130 284Due to banks 45 39
78,611 69,911
Net interest income 34,912 34,280
21 | Net fee and commission income
2014 2013LL Million LL Million
Fee and commission incomeLoans and advances to customers 5,641 4,976Letters of credit, guarantees and acceptances 3,181 3,176Checking accounts and transfers 932 953Customers' deposits 712 681Other 1,842 1,719
12,308 11,505Fee and commission expenseShipment of funds 577 600Banking operations 282 150Other 16 14
875 764
Net fee and commission income 11,433 10,741
111
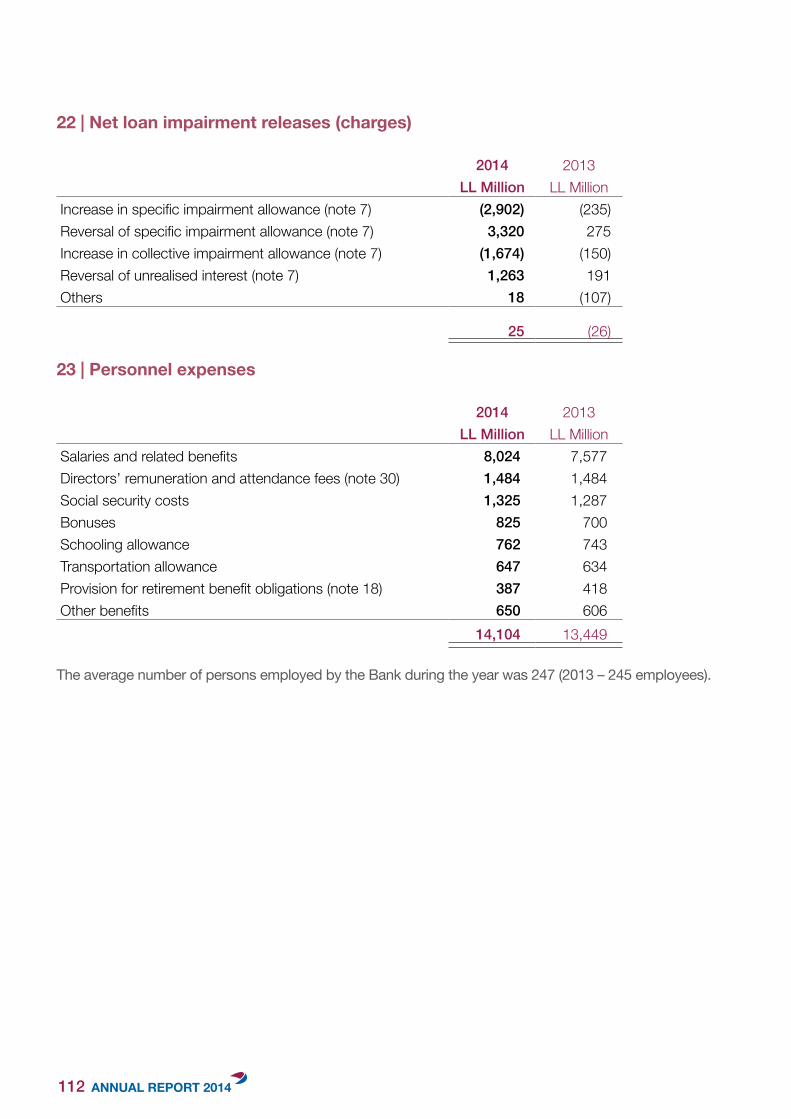
22 | Net loan impairment releases (charges)
2014 2013LL Million LL Million
Increase in specific impairment allowance (note 7) (2,902) (235)Reversal of specific impairment allowance (note 7) 3,320 275Increase in collective impairment allowance (note 7) (1,674) (150)Reversal of unrealised interest (note 7) 1,263 191Others 18 (107)
25 (26)
23 | Personnel expenses
2014 2013LL Million LL Million
Salaries and related benefits 8,024 7,577Directors’ remuneration and attendance fees (note 30) 1,484 1,484Social security costs 1,325 1,287Bonuses 825 700Schooling allowance 762 743Transportation allowance 647 634Provision for retirement benefit obligations (note 18) 387 418Other benefits 650 606
14,104 13,449
The average number of persons employed by the Bank during the year was 247 (2013 – 245 employees).
112
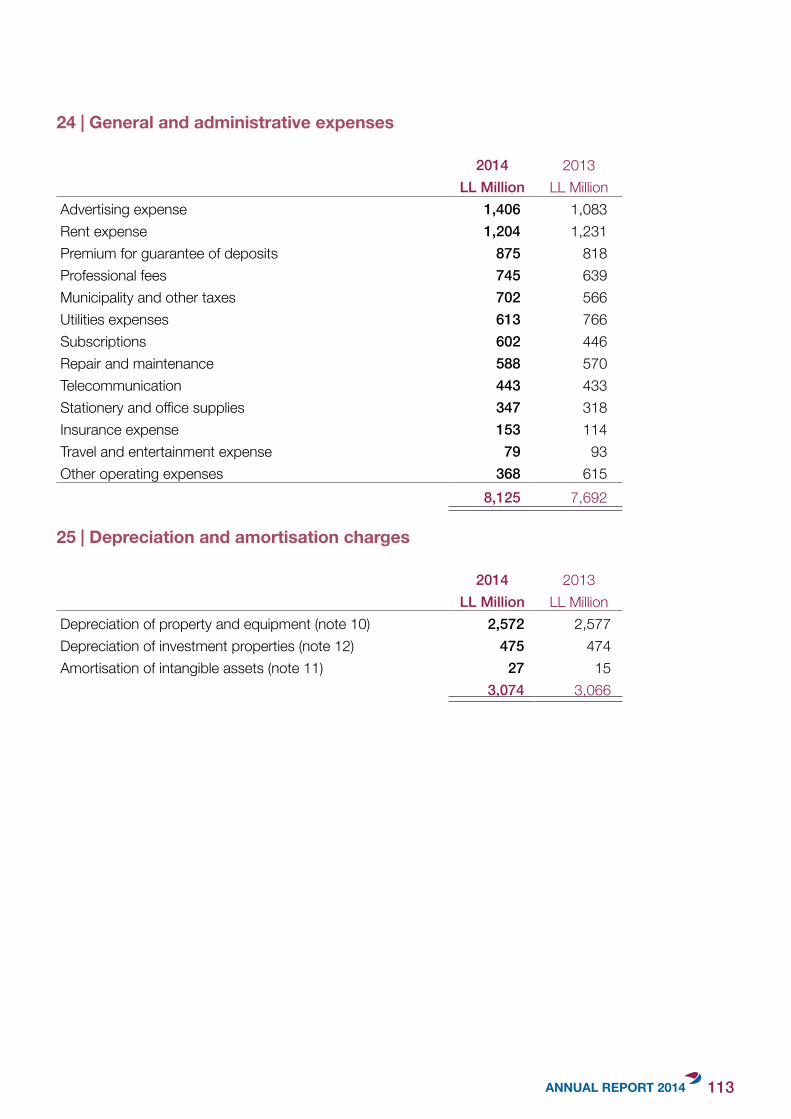
24 | General and administrative expenses
2014 2013LL Million LL Million
Advertising expense 1,406 1,083Rent expense 1,204 1,231Premium for guarantee of deposits 875 818Professional fees 745 639Municipality and other taxes 702 566Utilities expenses 613 766Subscriptions 602 446Repair and maintenance 588 570Telecommunication 443 433Stationery and office supplies 347 318Insurance expense 153 114Travel and entertainment expense 79 93Other operating expenses 368 615
8,125 7,692
25 | Depreciation and amortisation charges
2014 2013LL Million LL Million
Depreciation of property and equipment (note 10) 2,572 2,577Depreciation of investment properties (note 12) 475 474Amortisation of intangible assets (note 11) 27 15
3,074 3,066
113
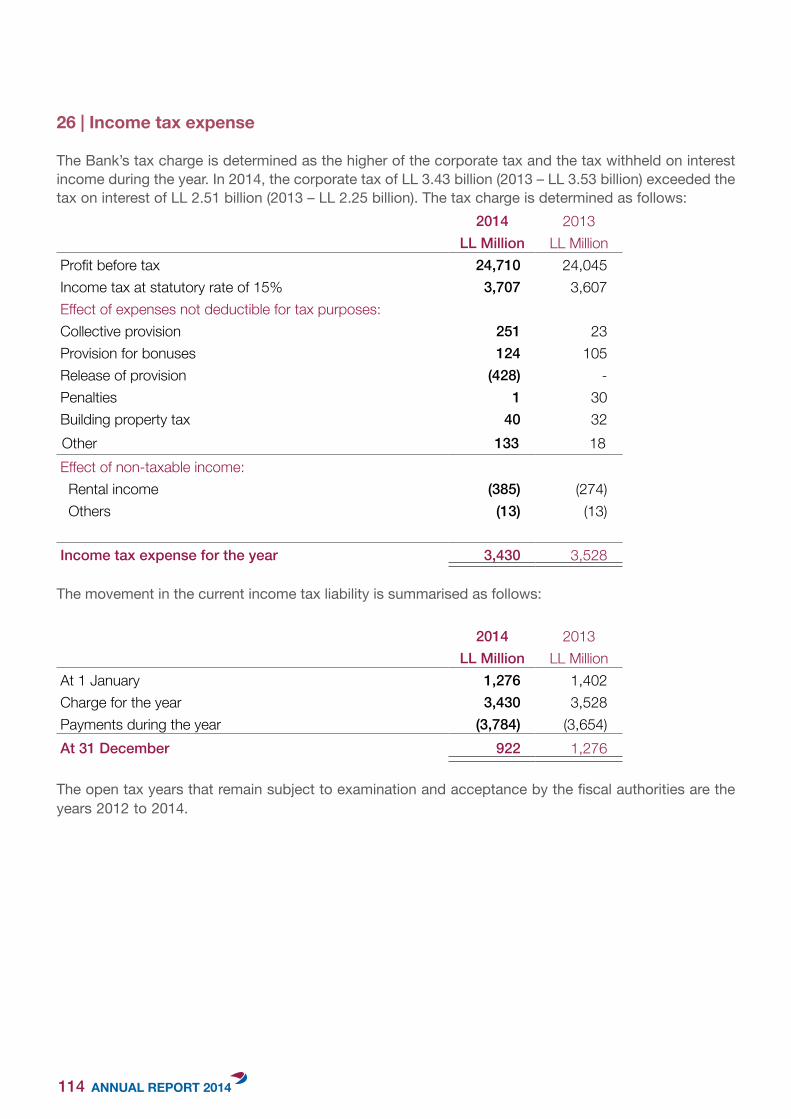
26 | Income tax expense
The Bank’s tax charge is determined as the higher of the corporate tax and the tax withheld on interest income during the year. In 2014, the corporate tax of LL 3.43 billion (2013 – LL 3.53 billion) exceeded the tax on interest of LL 2.51 billion (2013 – LL 2.25 billion). The tax charge is determined as follows:
2014 2013LL Million LL Million
Profit before tax 24,710 24,045Income tax at statutory rate of 15% 3,707 3,607Effect of expenses not deductible for tax purposes:Collective provision 251 23Provision for bonuses 124 105Release of provision (428) -Penalties 1 30Building property tax 40 32Other 133 18Effect of non-taxable income: Rental income (385) (274) Others (13) (13)
Income tax expense for the year 3,430 3,528
The movement in the current income tax liability is summarised as follows:
2014 2013LL Million LL Million
At 1 January 1,276 1,402Charge for the year 3,430 3,528Payments during the year (3,784) (3,654)At 31 December 922 1,276
The open tax years that remain subject to examination and acceptance by the fiscal authorities are the years 2012 to 2014.
114
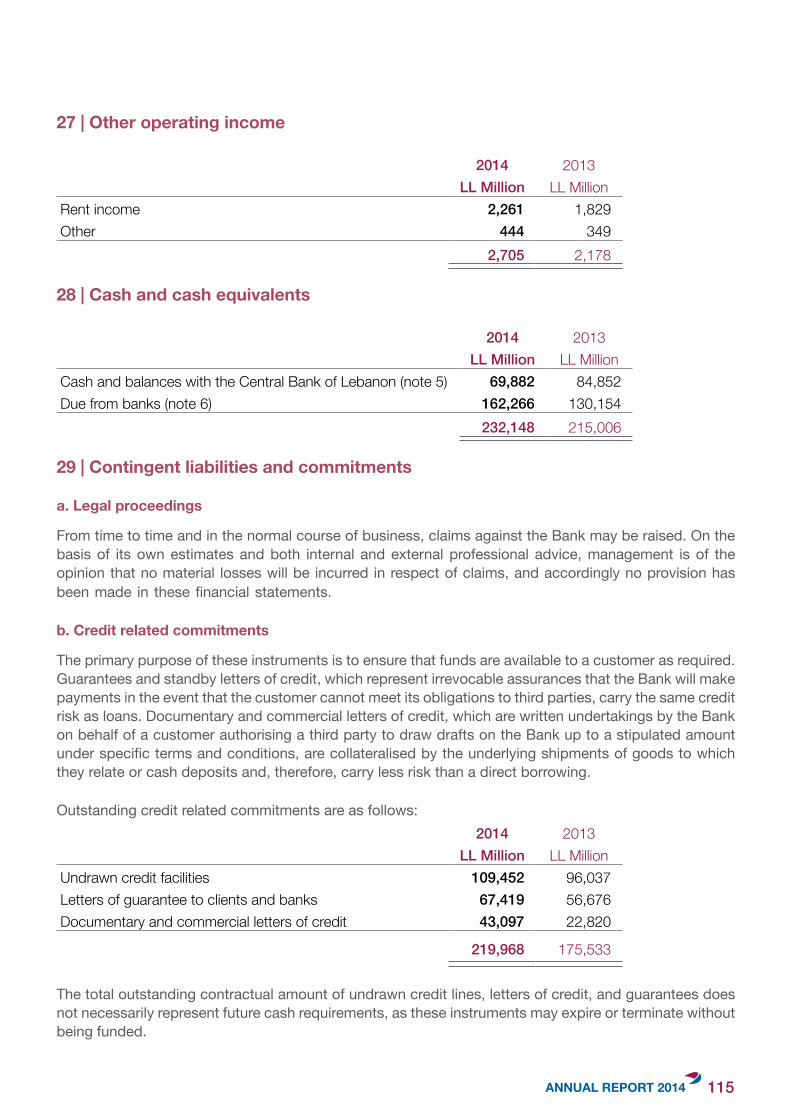
27 | Other operating income
2014 2013LL Million LL Million
Rent income 2,261 1,829Other 444 349
2,705 2,178
28 | Cash and cash equivalents
2014 2013LL Million LL Million
Cash and balances with the Central Bank of Lebanon (note 5) 69,882 84,852Due from banks (note 6) 162,266 130,154
232,148 215,006
29 | Contingent liabilities and commitments
a. Legal proceedings
From time to time and in the normal course of business, claims against the Bank may be raised. On the basis of its own estimates and both internal and external professional advice, management is of the opinion that no material losses will be incurred in respect of claims, and accordingly no provision has been made in these financial statements.
b. Credit related commitments
The primary purpose of these instruments is to ensure that funds are available to a customer as required. Guarantees and standby letters of credit, which represent irrevocable assurances that the Bank will make payments in the event that the customer cannot meet its obligations to third parties, carry the same credit risk as loans. Documentary and commercial letters of credit, which are written undertakings by the Bank on behalf of a customer authorising a third party to draw drafts on the Bank up to a stipulated amount under specific terms and conditions, are collateralised by the underlying shipments of goods to which they relate or cash deposits and, therefore, carry less risk than a direct borrowing.
Outstanding credit related commitments are as follows:2014 2013
LL Million LL MillionUndrawn credit facilities 109,452 96,037Letters of guarantee to clients and banks 67,419 56,676Documentary and commercial letters of credit 43,097 22,820
219,968 175,533
The total outstanding contractual amount of undrawn credit lines, letters of credit, and guarantees does not necessarily represent future cash requirements, as these instruments may expire or terminate without being funded.
115
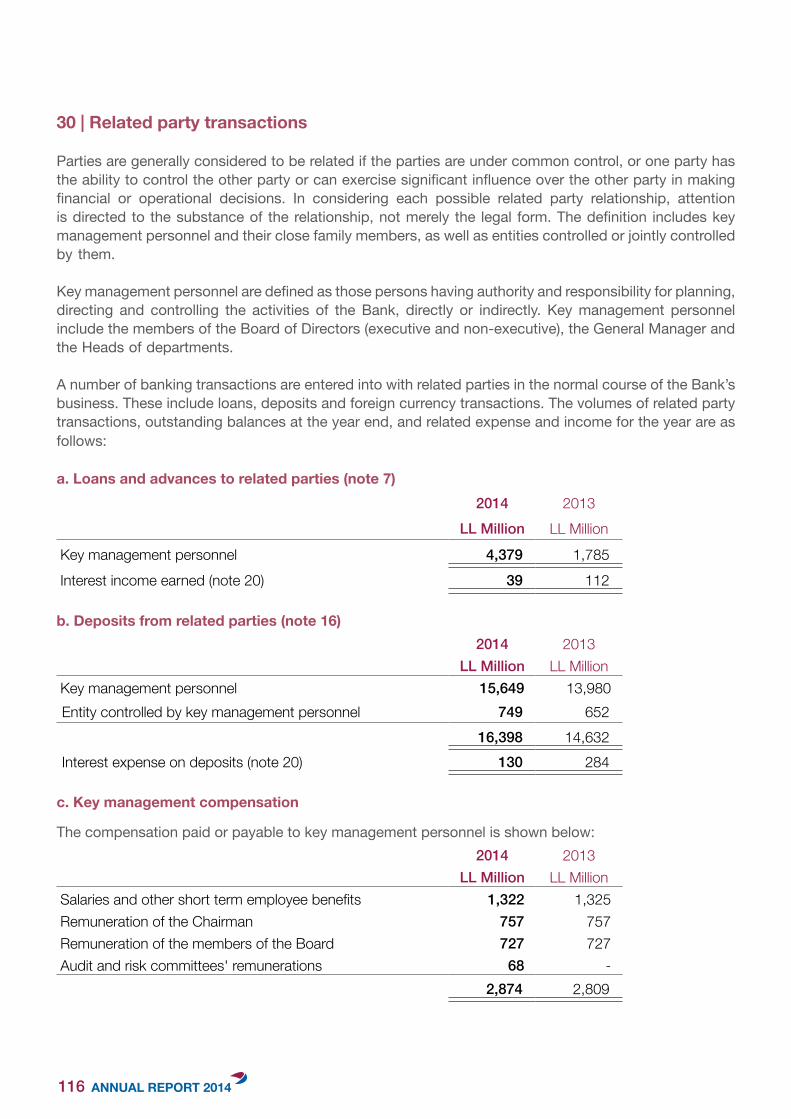
30|Relatedpartytransactions
Parties are generally considered to be related if the parties are under common control, or one party has the ability to control the other party or can exercise significant influence over the other party in making financial or operational decisions. In considering each possible related party relationship, attention is directed to the substance of the relationship, not merely the legal form. The definition includes key management personnel and their close family members, as well as entities controlled or jointly controlled by them.
Key management personnel are defined as those persons having authority and responsibility for planning, directing and controlling the activities of the Bank, directly or indirectly. Key management personnel include the members of the Board of Directors (executive and non-executive), the General Manager and the Heads of departments.
A number of banking transactions are entered into with related parties in the normal course of the Bank’s business. These include loans, deposits and foreign currency transactions. The volumes of related party transactions, outstanding balances at the year end, and related expense and income for the year are as follows:
a. Loans and advances to related parties (note 7)2014 2013
LL Million LL MillionKey management personnel 4,379 1,785Interest income earned (note 20) 39 112
b. Deposits from related parties (note 16)2014 2013
LL Million LL MillionKey management personnel 15,649 13,980Entity controlled by key management personnel 749 652
16,398 14,632Interest expense on deposits (note 20) 130 284
c.Keymanagementcompensation
The compensation paid or payable to key management personnel is shown below:2014 2013
LL Million LL MillionSalaries and other short term employee benefits 1,322 1,325Remuneration of the Chairman 757 757Remuneration of the members of the Board 727 727Audit and risk committees' remunerations 68 -
2,874 2,809
116

d. Other
2014 2013LL Million LL Million
Rent expense paid to an entity under common control 618 618Advertising expenses paid to an entity under common control 227 239
117

CO
RPO
RAT
E SO
CIA
LR
ESPO
NSI
BILI
TY

CO
RPO
RAT
E SO
CIA
LR
ESPO
NSI
BILI
TY

THE WELLBEING OF THE COMMUNITY WE LIVE IN IS WHAT MAKES IT THRIVE. WITH CONTINUOUS INVOLVEMENT IN ASSOCIATIONS AND UNIVERSITIES, WE DO OUR BEST TO PAVE THE WAY TO A BETTER TOMORROW, TODAY.

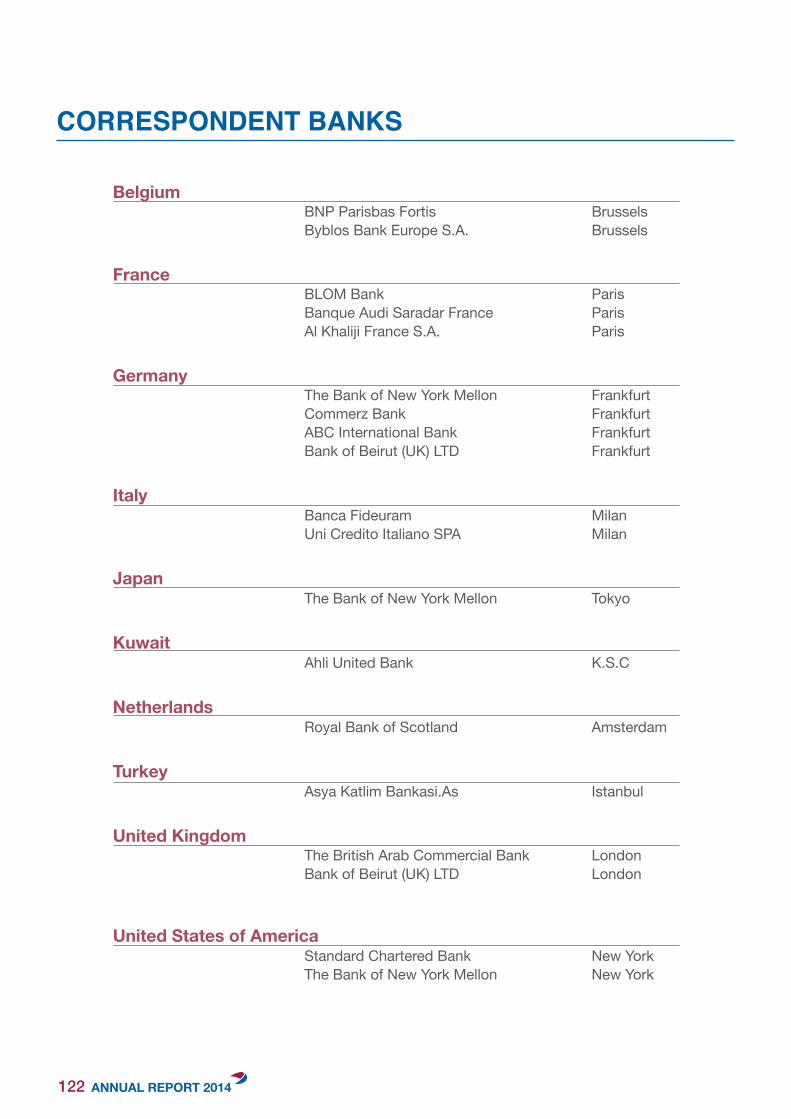
Belgium BNP Parisbas Fortis Brussels Byblos Bank Europe S.A. Brussels
France
BLOM Bank Paris Banque Audi Saradar France Paris Al Khaliji France S.A. Paris
Germany The Bank of New York Mellon Frankfurt Commerz Bank Frankfurt ABC International Bank Frankfurt Bank of Beirut (UK) LTD Frankfurt
Italy Banca Fideuram Milan Uni Credito Italiano SPA Milan
Japan The Bank of New York Mellon Tokyo
Kuwait Ahli United Bank K.S.C
Netherlands Royal Bank of Scotland Amsterdam
Turkey Asya Katlim Bankasi.As Istanbul
United Kingdom The British Arab Commercial Bank London Bank of Beirut (UK) LTD London
United States of America Standard Chartered Bank New York The Bank of New York Mellon New York
CORRESPONDENT BANKS
122

BRANCHES
HEAD OFFICE Beirut Central District, Foch Street, Fenicia Bank Bldg.P.O.Box: 113-6248Telefax: (00 961 1) 957857 Zip Code: 1103-2110 Beirut LebanonFax: (00 961 1)957858Swift: BKAWLBBEE-mail: [email protected]
ABBASSIEH BRANCH
Jal Albaher, Main Road, Belle Vue Bldg. P.O.Box: 113-6248Telefax: (00 961 7) 742710 - 742722 - 741722 Zip Code: 1103-2110 Beirut LebanonE-mail: [email protected] Outdoor
ACHRAFIEH BRANCH
Sassine Square, Dr. Maalouf Bldg. P.O.Box: 113-6248Telefax: (00 961 1) 338635 - 219030 Zip Code: 1103-2110 Beirut LebanonE-mail: [email protected] Outdoor
BIKFAYA BRANCHBikfaya Highway, Massoud Bldg. P.O.Box: 113-6248Telefax: (00 961 4) 983221 - 982320 982322 Zip Code: 1103-2110 Beirut LebanonE-mail: [email protected] Outdoor
BIR HASSAN BRANCHWay Down Sultan Ibrahim, Rafic Hariri University Hospital district, Al-Mays(1) Bldg. P.O.Box: 113-6248Telefax: (00 961 1) 843611 - 843612 Zip Code: 1103-2110 Beirut LebanonSwift: BKAWLBBEE-mail: [email protected] Outdoor
BINT JBEIL BRANCHMain Road, Al Shamy Bldg. P.O.Box: 113-6248Telefax: (00 961 7) 450051 - 452454Zip Code: 1103-2110 Beirut LebanonE-mail: [email protected] Outdoor
CHTOURA BRANCHJdeita Main road, P.O.Box: 113-6248Telefax: (00 961 8) 546630 - 546631 Zip Code: 1103-2110 Beirut LebanonE-mail: [email protected] Outdoor
FOCH BRANCH Beirut Central District, Foch Street,Fenicia Bank Bldg. P.O.Box: 113-6248Telefax: (00 961 1) 957800 Zip Code: 1103-2110 Beirut LebanonFax: (00 961 1)957801E-mail: [email protected] Outdoor
123

GHAZIEH BRANCHGHAZIEH Main Road, Ghaddar Bldg. P.O.Box: 113-6248Telefax: (00 961 7) 221958- 244958 Zip Code: 1103-2110 Beirut LebanonE-mail: [email protected] Outdoor
HAMRA BRANCHMakdessi Str., Chouman Bldg. P.O.Box: 113-6248Telefax: (00 961 1) 346348 Zip Code: 1103-2110 Beirut LebanonE-mail: [email protected]
HARET HREIK BRANCH
Bir El Abed, Al-Arid Str., Itani Bldg. P.O.Box: 113-6248Telefax : (00 961 1) 559928 – 543510 Zip Code: 1103-2110 Beirut LebanonE-mail: [email protected] Outdoor
KHALDEH BRANCH
Khaldeh Highway, Zebian Bldg. P.O.Box: 113-6248Telefax: (00 961 5) 801241 – 811147 Zip Code: 1103-2110 Beirut LebanonE-mail: [email protected] ATM Outdoor
MOAWAD BRANCH
Chiah, Mouawad Str., Sheaito Center P.O.Box: 113-6248Telefax: (00 961 1) 549700-549701 Zip Code: 1103-2110 Beirut LebanonE-mail: [email protected] Outdoor
NABATIEH BRANCHMahmoud Fakih Road, Fenicia Bank Bldg. P.O.Box: 113-6248Telefax: (00 961 7) 762546-769546, Zip Code: 1103-2110 Beirut LebanonE-mail: [email protected] Outdoor
TRIPOLI BRANCHRiad el Solh Street, Missaykeh Bldg. P.O.Box: 113-6248Telefax: (00 961 6) 203160 – 203161 Zip Code: 1103-2110 Beirut LebanonE-mail: [email protected] I: OutdoorATM II: Palma Resort – Al-Bohsas
TYRE BRANCH Roundabout Rachid Karameh, Al-Athar str.-Daoud Abou-Saleh Bldg. P.O.Box: 113-6248Telefax: (00 961 7) 740522 Zip Code: 1103-2110 Beirut LebanonE-mail: [email protected] Outdoor
VERDUN BRANCHAin El Tineh - Verdun Bellevue Bldg.P.O.Box: 113-6248Telefax: (00 961 1) 866306 Fax: (00 961 1) 865299Zip Code: 1103-2110 Beirut LebanonE-mail: [email protected] Outdoor
ZALKA BRANCHZalka Main road, Elysee Center P.O.Box: 113-6248Telefax: (00 961 1) 884450 - 884451- 896650 - 896651 Zip Code: 1103-2110 Beirut LebanonE-mail: [email protected]
124


www.feniciabank.comwww.feniciabank.com