2013 global top50 hr service providers ranking and whitepaper by hroot
TRANSCRIPT
2012, a year of weak global economic recovery
Makes Move Against ChangesOn the global human resources services market of 2013-2013
The year 2012 saw a bumpy ride of the recovery of world economic
Fiscal tightening, financial turmoil, market vulnerability have made investment,
employment, manufacturing, and many other economic indicators show no signs
of improvement. In its “World Economic Situation and Prospects 2013-Update
as of Mid-2013", the United Nations points out that, as the world economy is still
facing the euro zone debt crisis, the U.S. Is facing fiscal cliff and some developing
countries are slated for hard landings, and may of them are continuing to be affected
by quantitative easing measures of developed countries. Therefore, although the
overall scenario has improved, no significant improvement has been seen economic
growth; the economic growths show significant gaps between different regions
and countries,. Meanwhile, the world gross production (WGP) is expected to
pose a growth rate of 2.3% in 2013, 0.1% lower than expected at the beginning
of the year. Over the past few years, the lingering, synchronized global economic
slowdown has been replaced by measurable growth, yet recovery remain weak and
is characterized by it diversity."
In line with the weak global economic recovery, the performances of the
global human resources markets are also uneven, while the ranking list of "HRoot
Global 50 Human Resources Services Providers" reflects the vicissitudes. Similar
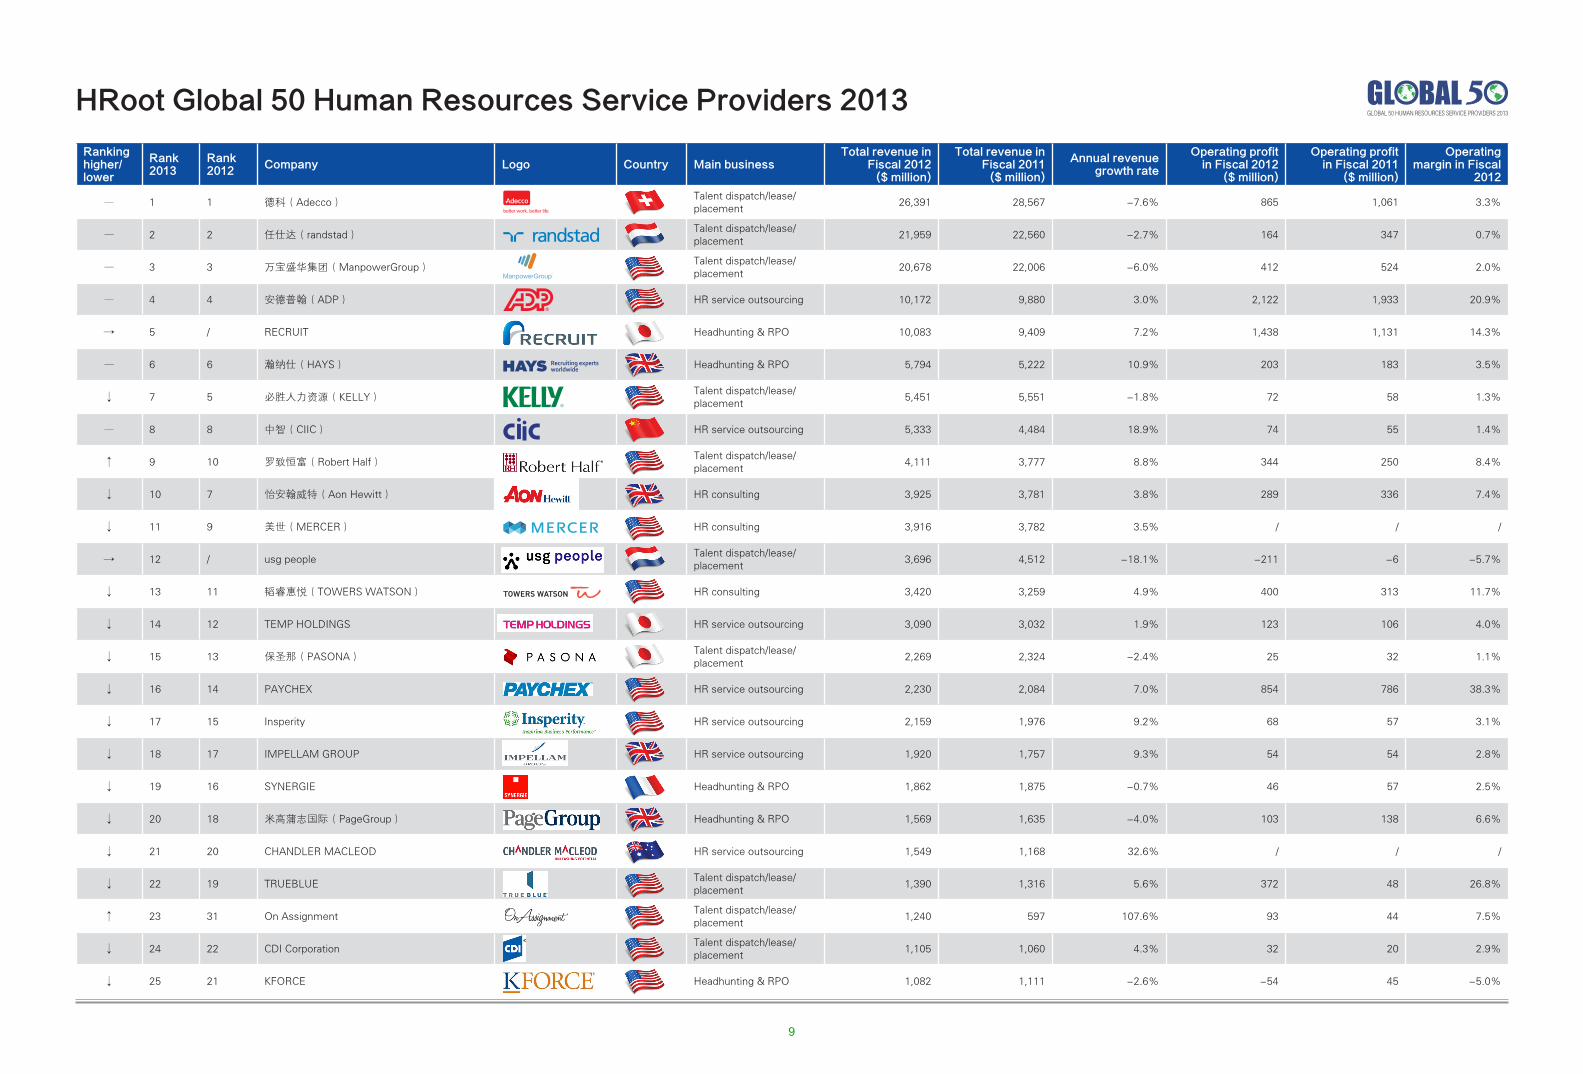
to the cases in 2012, all the 50 companies on this year's list have posted growth in
revenue in fiscal 2012. Among them, On Assignment, focusing on talent placement,
and Workday, a human resources software company, respectively post 107.6%
and 104.2% in revenue growth, making them most eye-catching two companies.
In addition, it is worth mentioning that, despite the complex economic environment,
CIIC still achieved a revenue growth of 18.9%, ranking the eighth in the list, and
making it an indisputable leader in China's human resources services. Judging from
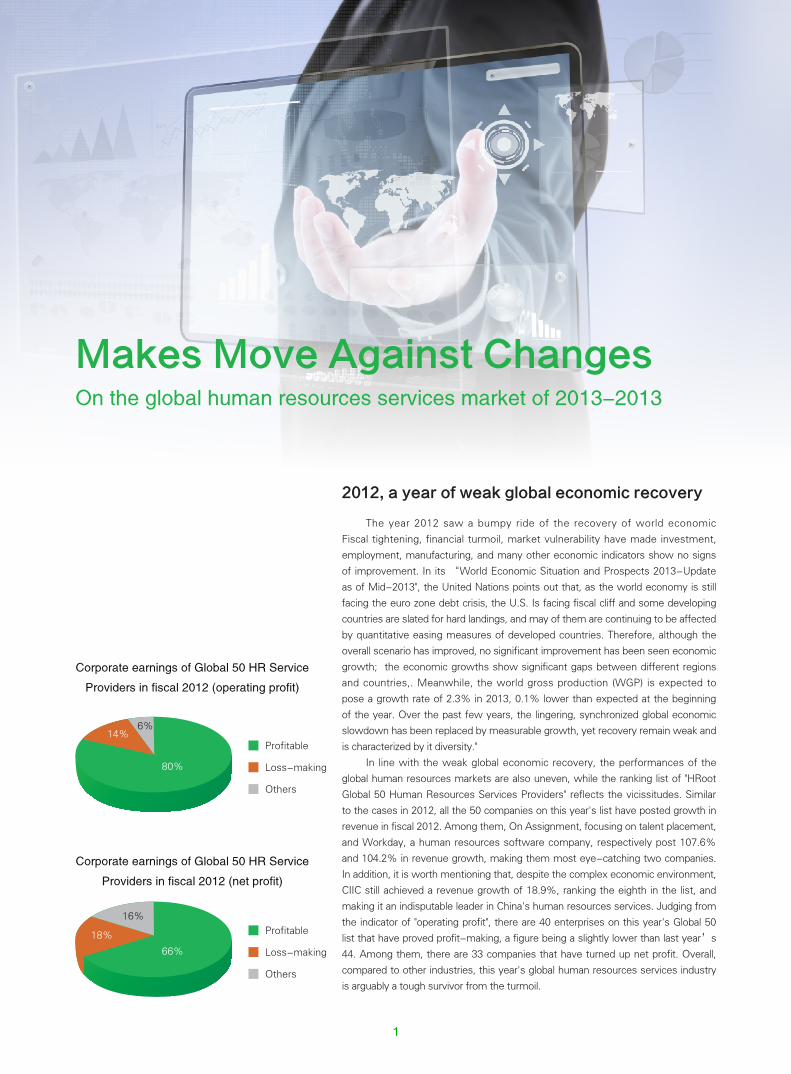
the indicator of "operating profit", there are 40 enterprises on this year's Global 50
list that have proved profit-making, a figure being a slightly lower than last year’s
44. Among them, there are 33 companies that have turned up net profit. Overall,
compared to other industries, this year's global human resources services industry
is arguably a tough survivor from the turmoil.
Corporate earnings of Global 50 HR Service
Providers in fiscal 2012 (operating profit)
Corporate earnings of Global 50 HR Service
Providers in fiscal 2012 (net profit)
1
Acquisitions in the industry: a trajectory
In line with the volatile global economy, the "HRoot Global 50 Global Human Resources Services Providers” list telegraphs the tears and cheers of related companies: A total of four companies have made their debut on the list, while four other companies on last year's list have been flunked out, including Talent2, the largest human resources business process outsourcing and management service organizations in Australia (the 39th on the "HRoot Global 50 Global Human Resources Service Providers 2012”), announced on September 13, 2012 to form joint venture with Allegis Group , the third largest staffing company in the U.S., in an effort to enhance the ability to provide worldwide customers with recruitment and human resources outsourcing services. In addition, the integrated human resources services provider Kenexa was acquired by IBM in August 2012 at $1.3 billion, a move that increased IBM’s competitiveness in the field of social media.
Among the companies making debut on the list, the human resource software developer Workday is arguably a subversive one to the tradition. Workday is an American online human resources software developer, co-founded in 2005 by Aneel Bhusri and Dave Duffield, mainly relly on cloud-based software deployment model to help companies manage human resources and finance.
Workday has deep-rooted connections with Oracle, and it staged a living scene of counter-attack in dire straits. The two co-founders were once at the helm of PeopleSoft, corporate applications software. After Oracle made hostile acquisition of PeopleSoft, the two people left PeopleSoft; meanwhile, they predicted that within a decade, the great migration from the personal computer to the clouds would take place in the software industry. Basing on this concept, the duo formed Workday in 2005. Facts have proved that the foresight of the two. The rapid development of Workday has translated into a staggering operating income that has reached billions of dollars, and the company has turned profit-making several times.
On October 12, 2012, Workday went public through initial public offering. It sold nearly 2,800 million shares at the price of $28 per share, raising nearly $637 million dollars. The deal leads to the estimation of market value of Workday to hit 4.5 billion U.S. dollars. Analysts said that since the Facebook IPO on May 18, this has been the largest IPO in the technology industry. Currently, Workday is serving nearly 300 enterprises, and its user base poses an annual growth rate close to 100%, of which about half are from the companies’ competitors such as Oracle or SAP. In Fiscal 2012, Workday's revenue hit $274 million; among them, its revenue underwent "explosive growth" in the fourth-quarter, reaching $81.5 million, an increase of 89% over its revenue in the same period in the previous year. This has made Workday the fastest growing human resources software company, and has secured the company’s position on the Global 50 list, ranked as No. 44.
In addition, it is worth mentioning that Recruit, a company that makes its debut in the Global 50 ranking list, is Japan's largest human resources and consumer internet. It is also the largest shareholder of 51job, China’s largest online recruiting agency. According to public information, as of the first quarter of 2011, Recruit held 41.2% of the shares of 51job. Recruit reports an annual revenue exceeding 800 billion yen, and it is also the parent company of Indeed, a representative of the search -recruitment model, which it acquired in September 2012. In fiscal 2012, Recruit ‘s revenue reached 10.083 billion U.S. dollars, an increase of 7.2% in year-on-year profit, while its profit has grown by 14.3% over that of the previous year, and is ranked No. 5 on this year’s Global 50 list.
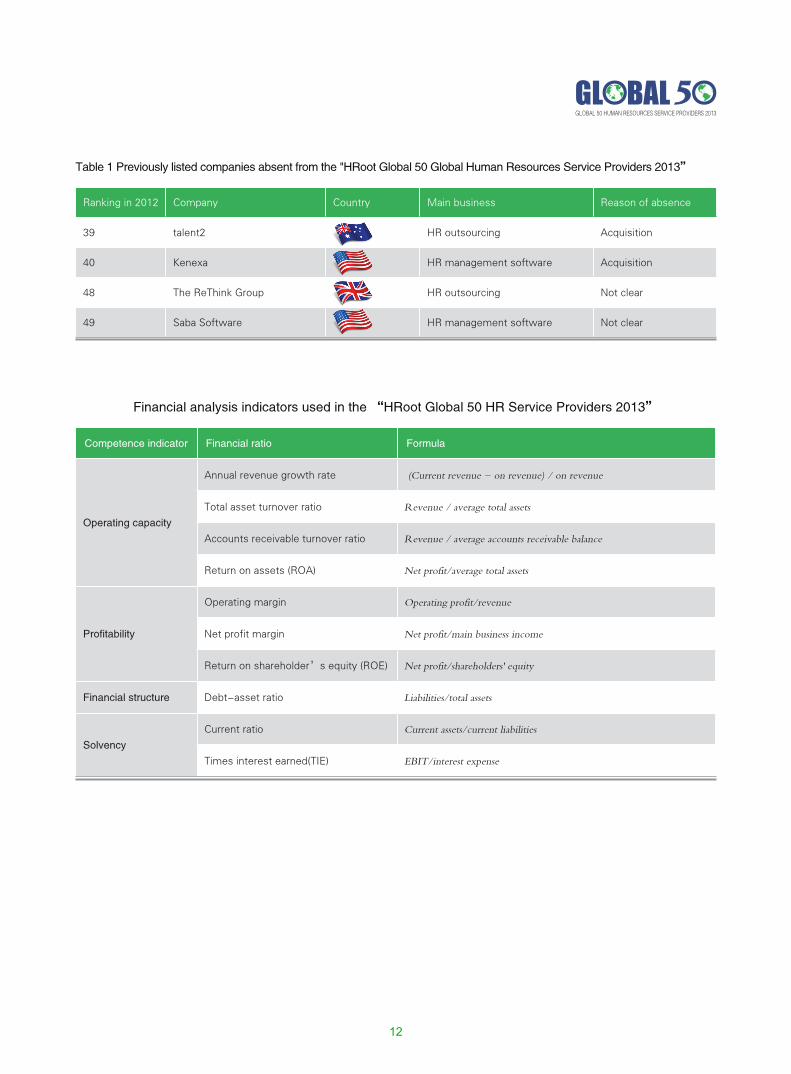
Ranking in 2012 Company Country Main business Reason of absence
39 talent2 Australia HR outsourcing Acquisition
40 Kenexa US HR management software Acquisition
48 The ReThink Group US HR outsourcing Not clear
49 Saba Software US HR management software Not clear
Table 1 Previously listed companies absent from the "HRoot Global 50 Global Human Resources Service Providers 2013”
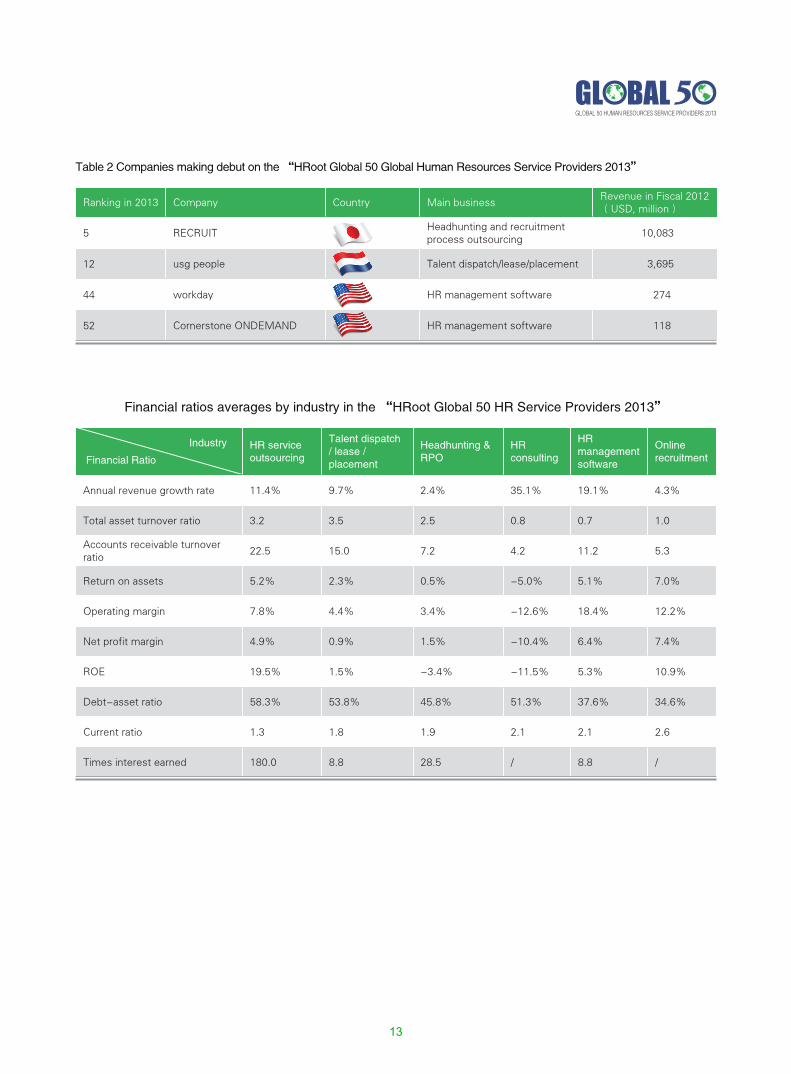
Table 2 Companies making debut on the “HRoot Global 50 Global Human Resources Service Providers 2013”
Ranking in 2013 Company Country Main businessRevenue in Fiscal 2012(USD, million)
5 RECRUIT JapanHeadhunting and recruitment process outsourcing
10,083
12 usg people The Netherlands Talent dispatch/lease/placement 3,695
44 workday US HR management software 274
52 Cornerstone ONDEMAND US HR management software 118
GLOBAL 50 HUMAN RESOURCES SERVICE PROVIDERS 2013
Executive Summary
2
In the "2013 Global 50 Human Resource Services Providers” ranking list, Adecco, Randstad , ManpowerGroup, and ADP firmly occupy the positions of top four. Affected by the global economic downturn, in fiscal year 2012 the operating incomes of Adecco, Randstad, ManpowerGroup are lower than the figures in fiscal 2011. However, the three companies have achieved positive growth in operating profit. In contrast, ADP’s performance is particularly rosy. In fiscal 2012, ADP achieved positive growth in both revenue and operating profit, securing its ranking as the fourth on the list; as of March 31, 2012, ADP's market capitalization was registered $30.96 billion, outnumbering all other human resource service providers in the world, testifying to the strong growth of human resources outsourcing.
In contrast, the performances of human resources consulting firms in fiscal year 2012 performance faired less perfect. In the 2013 Global 50 list, Aon Hewitt and Mercer regrettably fell out of the top ten, while the ranking of Towers Watson (No. 13) is lower than it was last year. It is worth mentioning that, Resources Global Professionals, boasting its 12.8% growth rate of its operating profit, has muscled its way into the top ten companies in profit growth in Fiscal 2012, becoming the fastest growing human resources consulting company.
With the rise of social networking recruitment, traditional online recruitment model in the form of job board is showing signs of declining. But in China, due to the strong market demand, companies of the job board online recruitment are still able to maintain a certain growth mode for quite a long time. Among them, the financial performance of 51job continues to maintain a steady upward trend. In Fiscal 2012, the revenue of 51job reached $240 million, a year-on-year increase of 9.9%, while its operating profit increased by 32.1%, making its rate of profit increase the second on the Global 50 ranking list, only behind that of Paychex. After the acquisition of ChinaHR, its market share was taken over by 51job and Zhaopin. Consequently, in January 2013, its parent company, the Australian recruitment service provider Seek Limited, spent $105 million to increase its stake in Zhaopin, to increase its stake from 55.5% to 72.3%. In addition, Seek Limited is also the parent company of JobDB, another Chinese online recruitment agency.
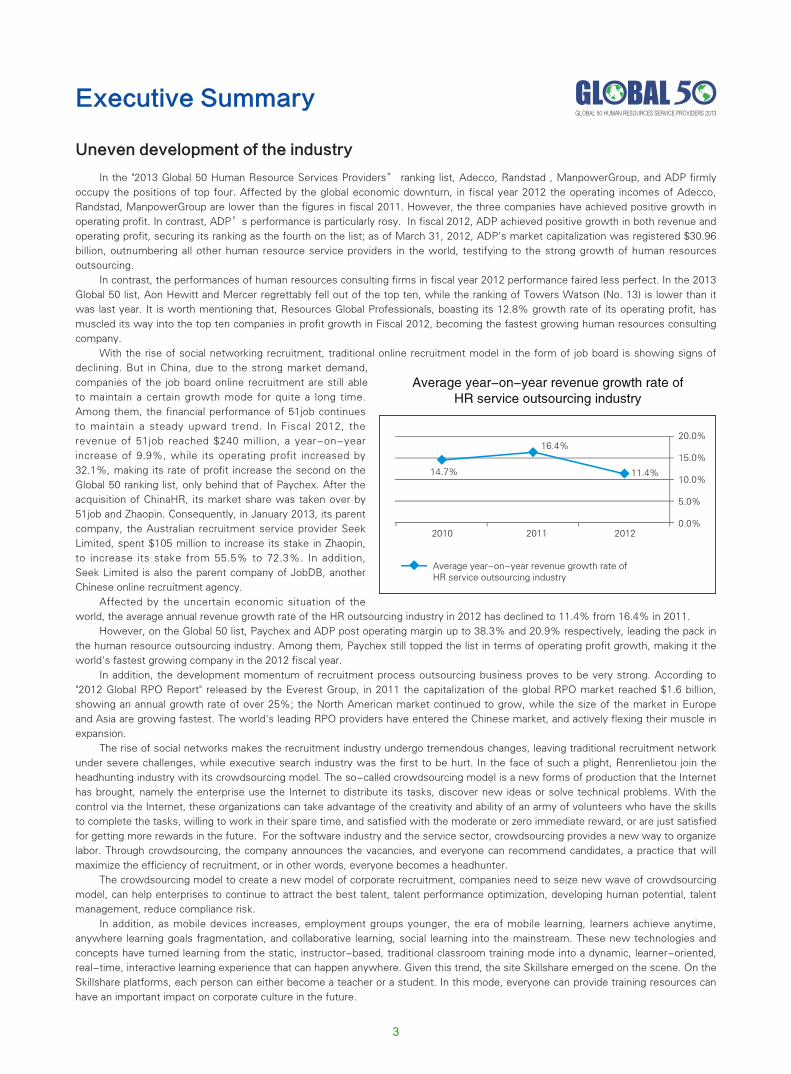
Affected by the uncertain economic situation of the world, the average annual revenue growth rate of the HR outsourcing industry in 2012 has declined to 11.4% from 16.4% in 2011.
However, on the Global 50 list, Paychex and ADP post operating margin up to 38.3% and 20.9% respectively, leading the pack in the human resource outsourcing industry. Among them, Paychex still topped the list in terms of operating profit growth, making it the world's fastest growing company in the 2012 fiscal year.
In addition, the development momentum of recruitment process outsourcing business proves to be very strong. According to "2012 Global RPO Report" released by the Everest Group, in 2011 the capitalization of the global RPO market reached $1.6 billion, showing an annual growth rate of over 25%; the North American market continued to grow, while the size of the market in Europe and Asia are growing fastest. The world's leading RPO providers have entered the Chinese market, and actively flexing their muscle in expansion.
The rise of social networks makes the recruitment industry undergo tremendous changes, leaving traditional recruitment network under severe challenges, while executive search industry was the first to be hurt. In the face of such a plight, Renrenlietou join the headhunting industry with its crowdsourcing model. The so-called crowdsourcing model is a new forms of production that the Internet has brought, namely the enterprise use the Internet to distribute its tasks, discover new ideas or solve technical problems. With the control via the Internet, these organizations can take advantage of the creativity and ability of an army of volunteers who have the skills to complete the tasks, willing to work in their spare time, and satisfied with the moderate or zero immediate reward, or are just satisfied for getting more rewards in the future. For the software industry and the service sector, crowdsourcing provides a new way to organize labor. Through crowdsourcing, the company announces the vacancies, and everyone can recommend candidates, a practice that will maximize the efficiency of recruitment, or in other words, everyone becomes a headhunter.
The crowdsourcing model to create a new model of corporate recruitment, companies need to seize new wave of crowdsourcing model, can help enterprises to continue to attract the best talent, talent performance optimization, developing human potential, talent management, reduce compliance risk.
In addition, as mobile devices increases, employment groups younger, the era of mobile learning, learners achieve anytime, anywhere learning goals fragmentation, and collaborative learning, social learning into the mainstream. These new technologies and concepts have turned learning from the static, instructor-based, traditional classroom training mode into a dynamic, learner-oriented, real-time, interactive learning experience that can happen anywhere. Given this trend, the site Skillshare emerged on the scene. On the Skillshare platforms, each person can either become a teacher or a student. In this mode, everyone can provide training resources can have an important impact on corporate culture in the future.
Uneven development of the industry
Average year-on-year revenue growth rate of HR service outsourcing industry
GLOBAL 50 HUMAN RESOURCES SERVICE PROVIDERS 2013
Executive Summary
3
2011 2012 Year-on-year increase
Gross operating income 522.1 972.3 86.3%
Income of HR solutions 260.8 523.6 101%
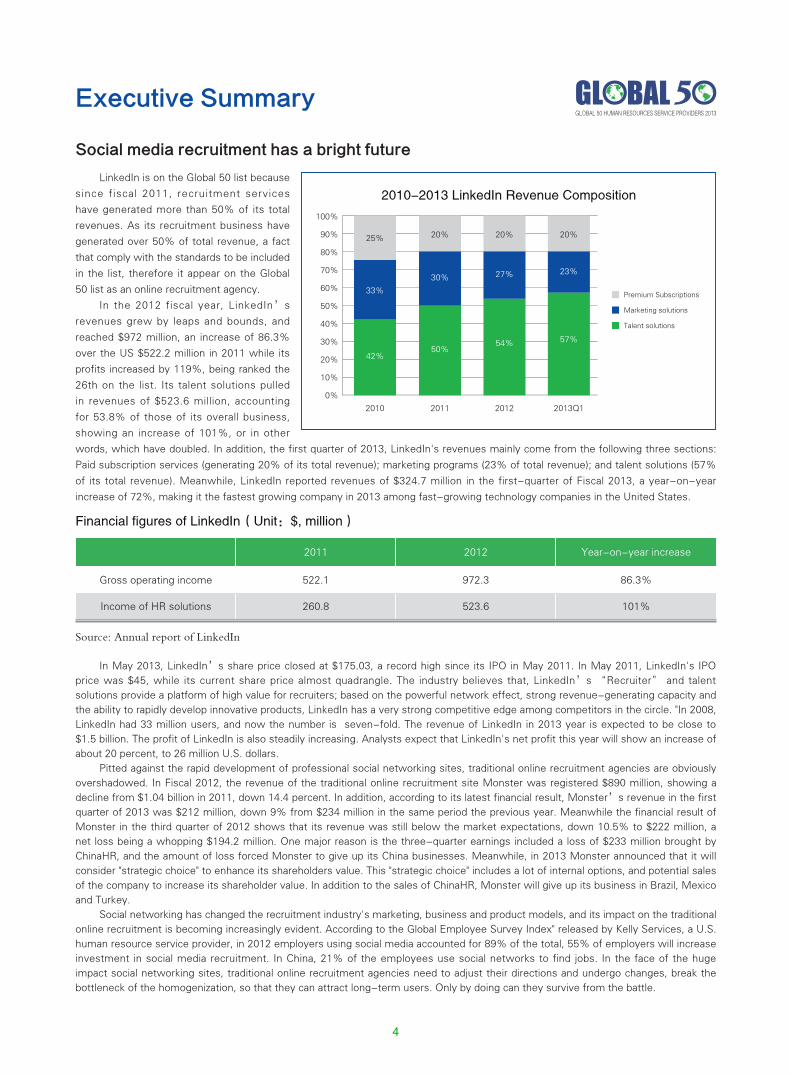
Social media recruitment has a bright future
LinkedIn is on the Global 50 list because
since fiscal 2011, recruitment services
have generated more than 50% of its total
revenues. As its recruitment business have
generated over 50% of total revenue, a fact
that comply with the standards to be included
in the list, therefore it appear on the Global
50 list as an online recruitment agency.
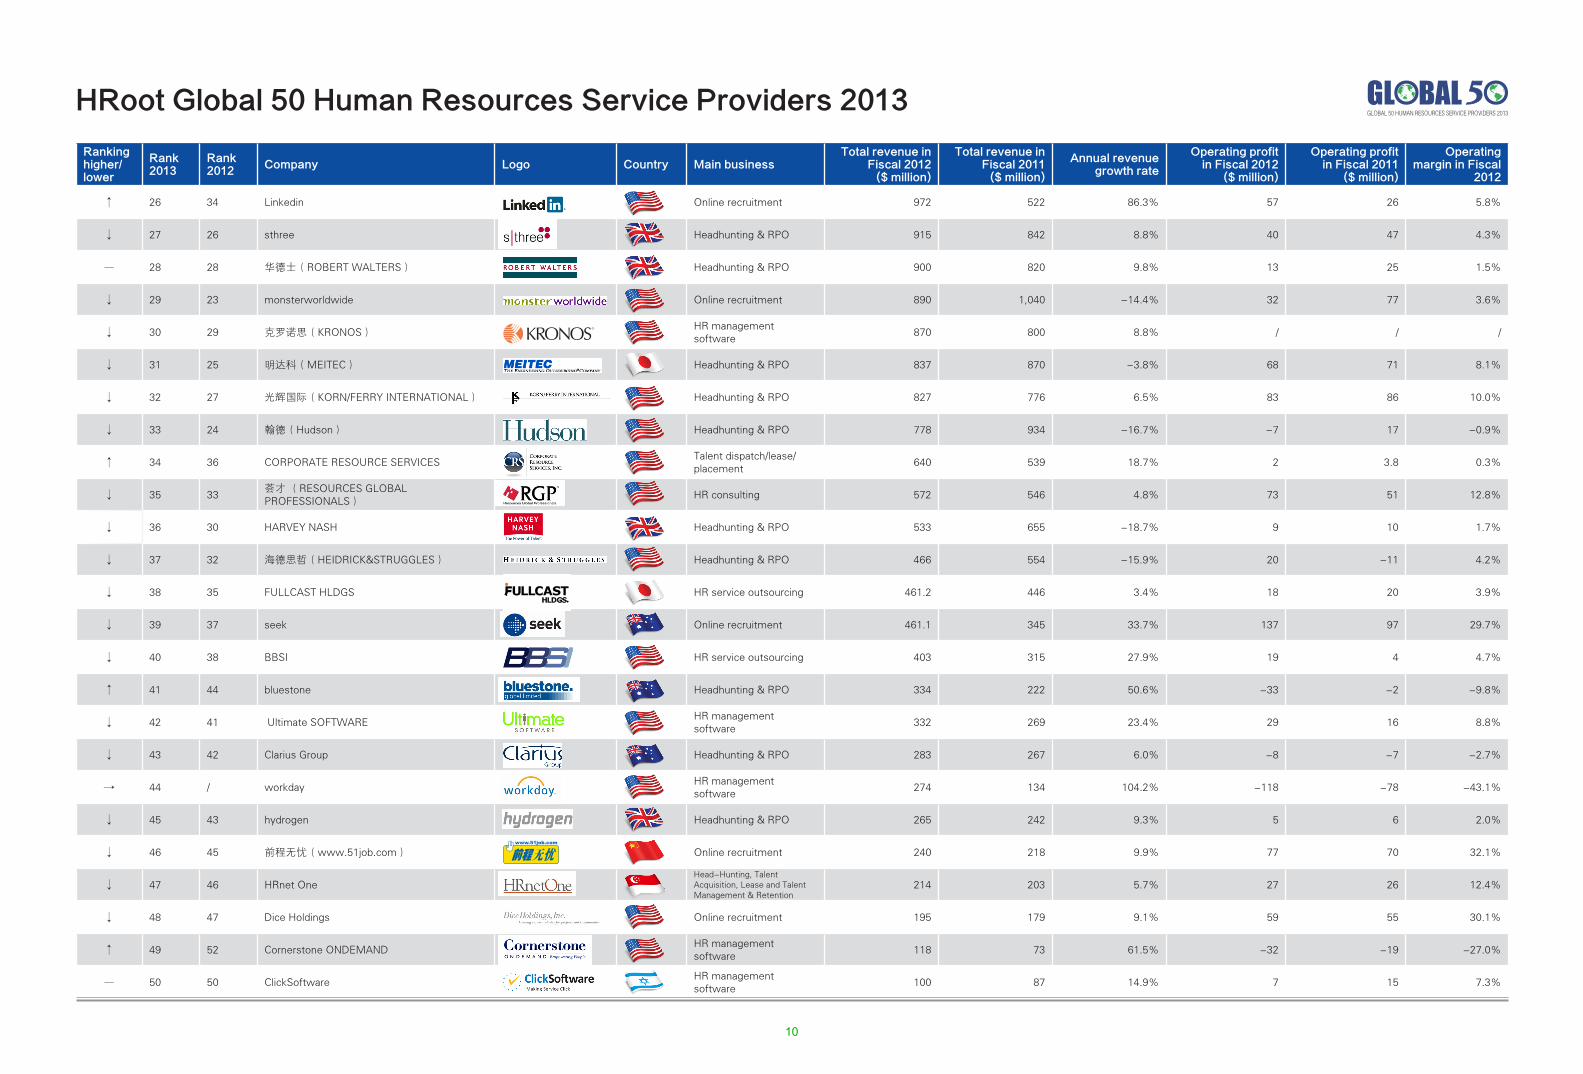
In the 2012 fiscal year, LinkedIn’s
revenues grew by leaps and bounds, and
reached $972 million, an increase of 86.3%
over the US $522.2 million in 2011 while its
profits increased by 119%, being ranked the
26th on the list. Its talent solutions pulled
in revenues of $523.6 million, accounting
for 53.8% of those of its overall business,
showing an increase of 101%, or in other
words, which have doubled. In addition, the first quarter of 2013, LinkedIn's revenues mainly come from the following three sections:
Paid subscription services (generating 20% of its total revenue); marketing programs (23% of total revenue); and talent solutions (57%
of its total revenue). Meanwhile, LinkedIn reported revenues of $324.7 million in the first-quarter of Fiscal 2013, a year-on-year
increase of 72%, making it the fastest growing company in 2013 among fast-growing technology companies in the United States.
In May 2013, LinkedIn’s share price closed at $175.03, a record high since its IPO in May 2011. In May 2011, LinkedIn's IPO price was $45, while its current share price almost quadrangle. The industry believes that, LinkedIn’s “Recruiter” and talent solutions provide a platform of high value for recruiters; based on the powerful network effect, strong revenue-generating capacity and the ability to rapidly develop innovative products, LinkedIn has a very strong competitive edge among competitors in the circle. "In 2008, LinkedIn had 33 million users, and now the number is seven-fold. The revenue of LinkedIn in 2013 year is expected to be close to $1.5 billion. The profit of LinkedIn is also steadily increasing. Analysts expect that LinkedIn's net profit this year will show an increase of about 20 percent, to 26 million U.S. dollars.
Pitted against the rapid development of professional social networking sites, traditional online recruitment agencies are obviously overshadowed. In Fiscal 2012, the revenue of the traditional online recruitment site Monster was registered $890 million, showing a decline from $1.04 billion in 2011, down 14.4 percent. In addition, according to its latest financial result, Monster’s revenue in the first quarter of 2013 was $212 million, down 9% from $234 million in the same period the previous year. Meanwhile the financial result of Monster in the third quarter of 2012 shows that its revenue was still below the market expectations, down 10.5% to $222 million, a net loss being a whopping $194.2 million. One major reason is the three-quarter earnings included a loss of $233 million brought by ChinaHR, and the amount of loss forced Monster to give up its China businesses. Meanwhile, in 2013 Monster announced that it will consider "strategic choice" to enhance its shareholders value. This "strategic choice" includes a lot of internal options, and potential sales of the company to increase its shareholder value. In addition to the sales of ChinaHR, Monster will give up its business in Brazil, Mexico and Turkey.
Social networking has changed the recruitment industry's marketing, business and product models, and its impact on the traditional online recruitment is becoming increasingly evident. According to the Global Employee Survey Index" released by Kelly Services, a U.S. human resource service provider, in 2012 employers using social media accounted for 89% of the total, 55% of employers will increase investment in social media recruitment. In China, 21% of the employees use social networks to find jobs. In the face of the huge impact social networking sites, traditional online recruitment agencies need to adjust their directions and undergo changes, break the bottleneck of the homogenization, so that they can attract long-term users. Only by doing can they survive from the battle.
2010-2013 LinkedIn Revenue Composition
Source: Annual report of LinkedIn
Financial figures of LinkedIn(Unit:$, million)
GLOBAL 50 HUMAN RESOURCES SERVICE PROVIDERS 2013
Executive Summary
4
In response to the threat posed by SaaS providers, in recent years, traditional software giants have also tried to catch up, even
shelled big money into acquisitions. In December 2011, SAP spent $3.4 billion on the acquisition of the cloud-based human capital
management solutions leader SuccessFactors. SuccessFactors is the human resources software industry pioneer of the SaaS model,
and it has 40 years experience in intellectual innovation, customer successes and experience in on-demand solutions and prefabricated
solutions. In February 2012, Oracle will talent management cloud service provider Taleo bag, purchase price of $1.9 billion. Oracle's
acquisition of Taleo is intended for business users to establish a more comprehensive talent management cloud solutions to help
companies retain talent, improve operational efficiency, through social media and other ways to help employees in the process and
teamwork more good to grow. In August 2012, IBM spent $1.3 billion on the acquisition of Kenexa, a cloud-based HR software provider
committed to helping customers improve recruitment efficiency, improve employee productivity and retention rates, and improve
managerial decision-making. In the human resources software market, SuccessFactors, Taleo, Kenexa, Workday, etc., have adopted
the cloud-based SaaS platform to achieve corporate talent management, which has make them become subjects of acquisition by SAP,
Oracle, IBM and other software giants.
In addition, customer relationship management solutions leader Salesforce.com also jointed in the competition in the field of
human resources software by acquiring performance management software provider Rypple, a provider of cloud-based software that
relies on using a social model of human resources. It is able to provide a range of features, from goal setting, giving feedback to striking
up dialogues between employees and their directors.
In addition, on the Global 50 list, Cornerstone ONDEMAND, Ultimate SOFTWARE, ClickSoftware also boast commendable
performances. Cornerstone is an American company that provides cloud-based talent management software solutions for leading
enterprises. In Fiscal 2012 it reported revenues of $118 million, an increase of 61.5% from $73 million in 2011, justifying for its position
in the Global 50 (ranked No. 49). In March 2013, Gartner Inc.’s Talent Management Suite Magic Quadrant report featured Cornerstone
in the "leader quadrant." In addition, in the “Forrester Wave: Talent Management" report of First Quarter 2013 released in March 2013,
Cornerstone also has appeared in the "leader" column. Ultimate Software is an American cloud-based SaaS (Software as a Service)
company, whose main application area is human resources, from recruitment to retirement offers a range of human resource solutions.
Fiscal 2012 revenues of $332 million, with $269 million in 2011 compared to revenue growth of 23.4%, in the Global 50 2013 list,
ranked No. 42. ClickSoftware is Israel a service-oriented industry, human resource management and optimization software products
and solutions provider, the company through licensing its software products and provide consulting and support services for revenue.
Fiscal 2012 revenues of $100 million, with $087 million in 2011 compared to revenue growth of 14.9%, in the Global 50 2013 list (ranked
No. 50).
From Cornerstone to Clicksoftware then Ultimate Software, cloud-based SaaS companies already dominate the field of human
resource services, the era of the cloud lifted from the fundamental transformation of human resources of the big screen. Cloud
computing and SaaS software can help human resource managers focus on core business, improve flexibility and effective cost control
strategies to maximize the value of play. According to Forrester estimates that the cloud computing market will grow from 2011's $40.7
billion in 2020 to grow to 2,410 billion U.S. dollars, embrace cloud computing and SaaS is becoming a trend. It is foreseeable that the
future of cloud computing, mobile devices aggregation, social networking and other new technologies in the field of human resources
will lead the new wave of change.
Given the uncertainty in the global macroeconomic environment, the global M & A activities slowed down in 2012. Under the
global economic downturn pressure, China's economic growth rate fell slightly. Meanwhile, the European debt crisis, the global real
economy is facing downward pressure, increasing the uncertainty of economic recovery, which become an obstacle to corporate
mergers and acquisitions. However, in stark contrast, in the human resources market M & A is still the key word. In 2012, global HR
industry M & A activities were very active, and many human resources companies are looking to enter a new geographic and suitable
business to accelerate growth.
Among them, the online recruitment industry mergers and acquisitions can be described as turbulent. September 2012, Japan's
human resources and information services company acquired the famous North American Recruit career site Indeed.com. October
2012, online recruitment firm Dice Holdings invested U.S. $20 million purchase of Geeknet's online media business, including Slashdot
and SourceForge website. February 2013, the Irish online recruitment company is still Dragon Group (Saongroup) announced a
partnership with the United States signed a purchase agreement, Monster, Monster's acquisition of ChinaHR 90% of the shares. For
these companies, seize the opportunity, contrarian merger is the best way for business expansion.
New technologies reign supreme
Mergers and acquisitions gain momentum
GLOBAL 50 HUMAN RESOURCES SERVICE PROVIDERS 2013
Executive Summary
5
On the Top 50 list, in addition to the list of 50 companies, there are some industry giants could not be included in the list due to various reasons. However, the performances of these human resources service providers are no mean feat, and they are driving forces of the global human resources industry nonetheless.
Allegis Group is ranked first among human capital management companies in the United States, and it is the world's largest IT staffing and human capital management company. In addition, it is also the world's fifth largest human capital management company; in 2011 its total revenue was $8 billion. Over 50% customers of ALLEGIS come from FTSE100 companies and 90% of them are Fortune 500 companies.
Indeed is the world's largest recruitment search engine. In 2010, according to the market research firm comScore, Indeed outflanked Monster for the first time, and became the largest job search site in the United States. Currently, it boasts traffic of visits that is equivalent to that of Monster and CareerBuilder combined. In January 2013, Indeed announced its monthly visitor reached 100 million. In 2012 it was acquired by the Japanese company Recruit; its profit-making model is similar to those of Google.
Glassdoor is a professional community site that mainly provides reviews, compares salaries and posts jobs and other services. Glassdoor transforms recruitment sites into community-based job sites that communicate among users to solve the problem of information asymmetry in the recruitment process. In 2012, the growth rate of Glassdoor's revenue hit 175%, mainly driven by display advertising, providing accurate delivery of jobs information, tailoring special page for employers, competitor analysis, and other tools.
The Global 50 ranking list still uses the DuPont analysis, considering enterprise ROE as the product of a number of financial ratios, which is helpful with in-depth analysis and comparison of business performances. By a number of ratio that evaluate the business efficiency and financial condition which intrinsically linked organically combined to form a complete index system, and ultimately through the consolidated ROE to reflect. In this ranking, the four dimensions of the 10 indicators selected for comparison, in-depth analysis of the human resources services operating conditions.
Time Particular
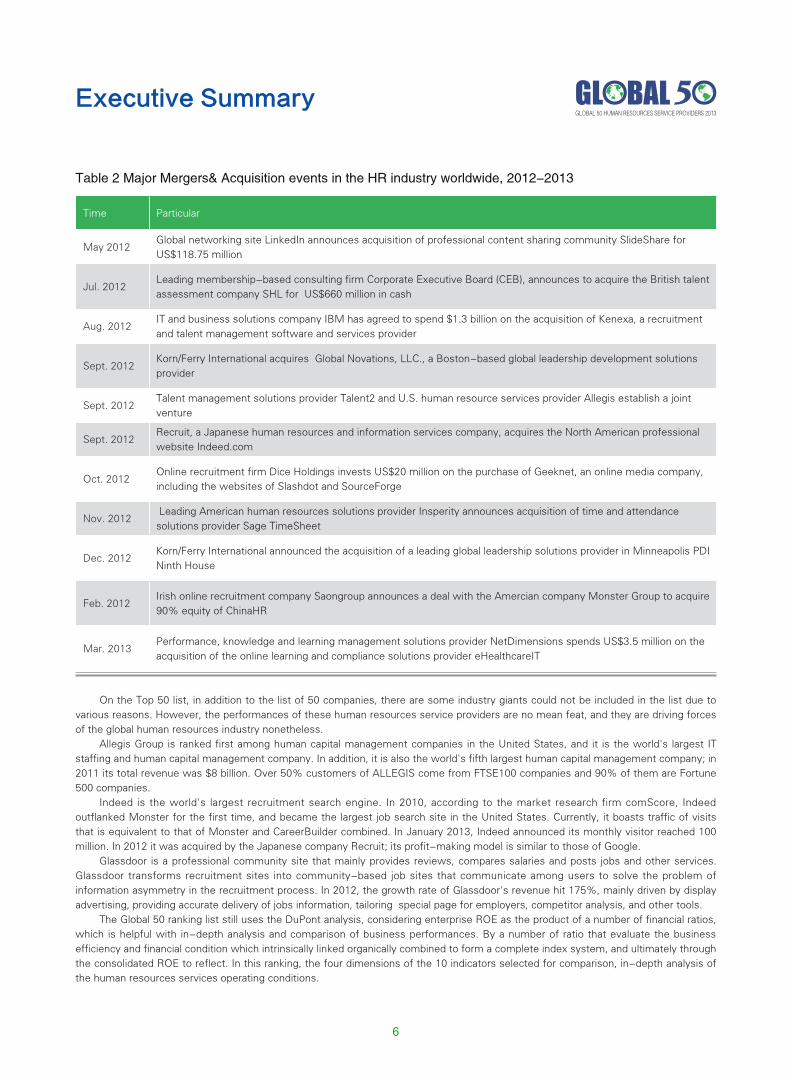
May 2012Global networking site LinkedIn announces acquisition of professional content sharing community SlideShare for US$118.75 million
Jul. 2012Leading membership-based consulting firm Corporate Executive Board (CEB), announces to acquire the British talent assessment company SHL for US$660 million in cash
Aug. 2012IT and business solutions company IBM has agreed to spend $1.3 billion on the acquisition of Kenexa, a recruitment and talent management software and services provider
Sept. 2012Korn/Ferry International acquires Global Novations, LLC., a Boston-based global leadership development solutions provider
Sept. 2012Talent management solutions provider Talent2 and U.S. human resource services provider Allegis establish a joint venture
Sept. 2012Recruit, a Japanese human resources and information services company, acquires the North American professional website Indeed.com
Oct. 2012Online recruitment firm Dice Holdings invests US$20 million on the purchase of Geeknet, an online media company, including the websites of Slashdot and SourceForge
Nov. 2012 Leading American human resources solutions provider Insperity announces acquisition of time and attendance solutions provider Sage TimeSheet
Dec. 2012Korn/Ferry International announced the acquisition of a leading global leadership solutions provider in Minneapolis PDI Ninth House
Feb. 2012Irish online recruitment company Saongroup announces a deal with the Amercian company Monster Group to acquire 90% equity of ChinaHR
Mar. 2013Performance, knowledge and learning management solutions provider NetDimensions spends US$3.5 million on the acquisition of the online learning and compliance solutions provider eHealthcareIT
Table 2 Major Mergers& Acquisition events in the HR industry worldwide, 2012-2013
GLOBAL 50 HUMAN RESOURCES SERVICE PROVIDERS 2013
Executive Summary
6
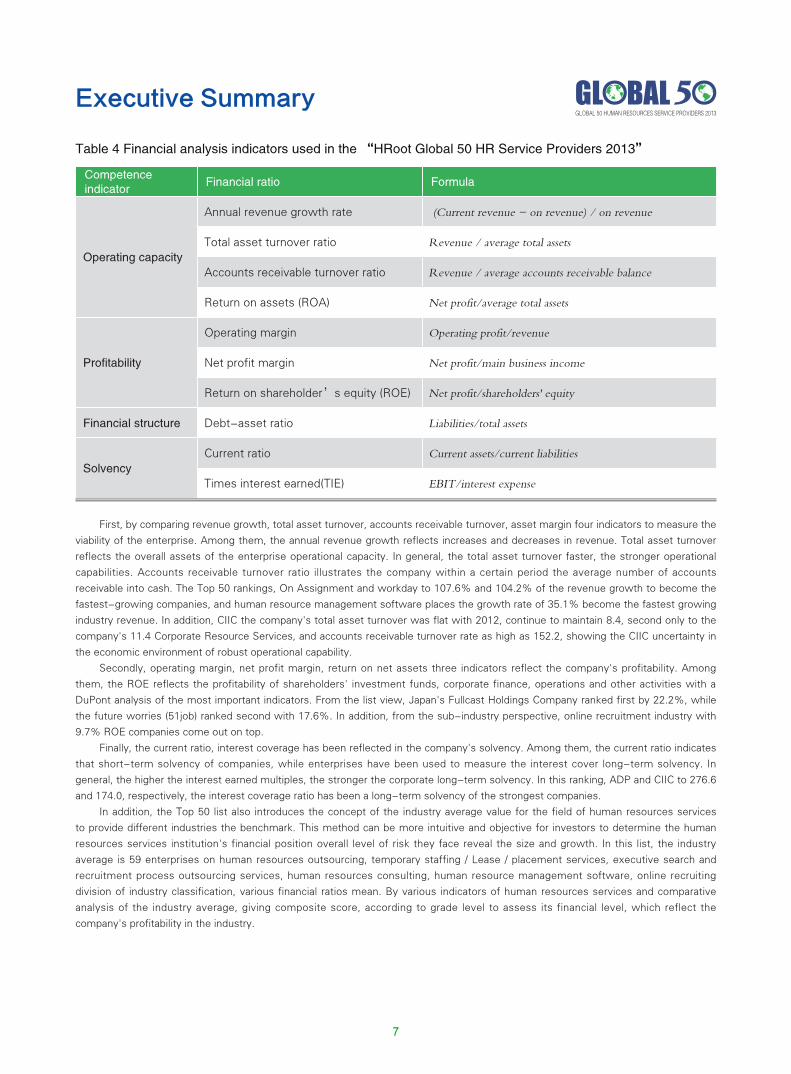
Table 4 Financial analysis indicators used in the “HRoot Global 50 HR Service Providers 2013”
Competence indicator
Financial ratio Formula
Operating capacity
Annual revenue growth rate (Current revenue - on revenue) / on revenue
Total asset turnover ratio Revenue / average total assets
Accounts receivable turnover ratio Revenue / average accounts receivable balance
Return on assets (ROA) Net profit/average total assets
Profitability
Operating margin Operating profit/revenue
Net profit margin Net profit/main business income
Return on shareholder’s equity (ROE) Net profit/shareholders' equity
Financial structure Debt-asset ratio Liabilities/total assets
SolvencyCurrent ratio Current assets/current liabilities
Times interest earned(TIE) EBIT/interest expense
First, by comparing revenue growth, total asset turnover, accounts receivable turnover, asset margin four indicators to measure the
viability of the enterprise. Among them, the annual revenue growth reflects increases and decreases in revenue. Total asset turnover
reflects the overall assets of the enterprise operational capacity. In general, the total asset turnover faster, the stronger operational
capabilities. Accounts receivable turnover ratio illustrates the company within a certain period the average number of accounts
receivable into cash. The Top 50 rankings, On Assignment and workday to 107.6% and 104.2% of the revenue growth to become the
fastest-growing companies, and human resource management software places the growth rate of 35.1% become the fastest growing
industry revenue. In addition, CIIC the company's total asset turnover was flat with 2012, continue to maintain 8.4, second only to the
company's 11.4 Corporate Resource Services, and accounts receivable turnover rate as high as 152.2, showing the CIIC uncertainty in
the economic environment of robust operational capability.
Secondly, operating margin, net profit margin, return on net assets three indicators reflect the company's profitability. Among
them, the ROE reflects the profitability of shareholders' investment funds, corporate finance, operations and other activities with a
DuPont analysis of the most important indicators. From the list view, Japan's Fullcast Holdings Company ranked first by 22.2%, while
the future worries (51job) ranked second with 17.6%. In addition, from the sub-industry perspective, online recruitment industry with
9.7% ROE companies come out on top.
Finally, the current ratio, interest coverage has been reflected in the company's solvency. Among them, the current ratio indicates
that short-term solvency of companies, while enterprises have been used to measure the interest cover long-term solvency. In
general, the higher the interest earned multiples, the stronger the corporate long-term solvency. In this ranking, ADP and CIIC to 276.6
and 174.0, respectively, the interest coverage ratio has been a long-term solvency of the strongest companies.
In addition, the Top 50 list also introduces the concept of the industry average value for the field of human resources services
to provide different industries the benchmark. This method can be more intuitive and objective for investors to determine the human
resources services institution's financial position overall level of risk they face reveal the size and growth. In this list, the industry
average is 59 enterprises on human resources outsourcing, temporary staffing / Lease / placement services, executive search and
recruitment process outsourcing services, human resources consulting, human resource management software, online recruiting
division of industry classification, various financial ratios mean. By various indicators of human resources services and comparative
analysis of the industry average, giving composite score, according to grade level to assess its financial level, which reflect the
company's profitability in the industry.
GLOBAL 50 HUMAN RESOURCES SERVICE PROVIDERS 2013
Executive Summary
7
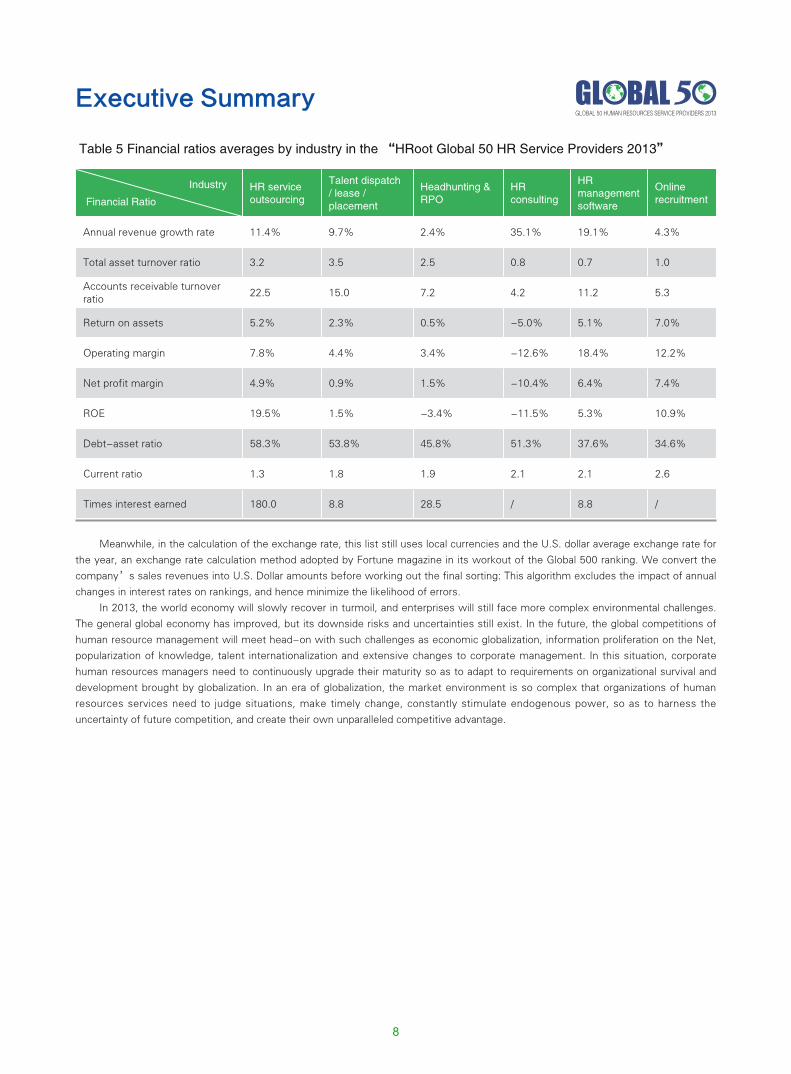
Meanwhile, in the calculation of the exchange rate, this list still uses local currencies and the U.S. dollar average exchange rate for
the year, an exchange rate calculation method adopted by Fortune magazine in its workout of the Global 500 ranking. We convert the
company’s sales revenues into U.S. Dollar amounts before working out the final sorting: This algorithm excludes the impact of annual
changes in interest rates on rankings, and hence minimize the likelihood of errors.
In 2013, the world economy will slowly recover in turmoil, and enterprises will still face more complex environmental challenges.
The general global economy has improved, but its downside risks and uncertainties still exist. In the future, the global competitions of
human resource management will meet head-on with such challenges as economic globalization, information proliferation on the Net,
popularization of knowledge, talent internationalization and extensive changes to corporate management. In this situation, corporate
human resources managers need to continuously upgrade their maturity so as to adapt to requirements on organizational survival and
development brought by globalization. In an era of globalization, the market environment is so complex that organizations of human
resources services need to judge situations, make timely change, constantly stimulate endogenous power, so as to harness the
uncertainty of future competition, and create their own unparalleled competitive advantage.
Table 5 Financial ratios averages by industry in the “HRoot Global 50 HR Service Providers 2013”
Industry
Financial Ratio
HR service outsourcing
Talent dispatch / lease / placement
Headhunting & RPO
HR consulting
HR management software
Online recruitment
Annual revenue growth rate 11.4% 9.7% 2.4% 35.1% 19.1% 4.3%
Total asset turnover ratio 3.2 3.5 2.5 0.8 0.7 1.0
Accounts receivable turnover ratio
22.5 15.0 7.2 4.2 11.2 5.3
Return on assets 5.2% 2.3% 0.5% -5.0% 5.1% 7.0%
Operating margin 7.8% 4.4% 3.4% -12.6% 18.4% 12.2%
Net profit margin 4.9% 0.9% 1.5% -10.4% 6.4% 7.4%
ROE 19.5% 1.5% -3.4% -11.5% 5.3% 10.9%
Debt-asset ratio 58.3% 53.8% 45.8% 51.3% 37.6% 34.6%
Current ratio 1.3 1.8 1.9 2.1 2.1 2.6
Times interest earned 180.0 8.8 28.5 / 8.8 /
GLOBAL 50 HUMAN RESOURCES SERVICE PROVIDERS 2013
Executive Summary
8
GLOBAL 50 HUMAN RESOURCES SERVICE PROVIDERS 2013
Ranking higher/lower
Rank 2013
Rank 2012
Company Logo Country Main businessTotal revenue in
Fiscal 2012 ($ million)
Total revenue in Fiscal 2011
($ million)
Annual revenue growth rate
Operating profit in Fiscal 2012
($ million)
Operating profit in Fiscal 2011
($ million)
Operating margin in Fiscal
2012
― 1 1 德科(Adecco)Talent dispatch/lease/placement
26,391 28,567 -7.6% 865 1,061 3.3%
― 2 2 任仕达(randstad)Talent dispatch/lease/placement
21,959 22,560 -2.7% 164 347 0.7%
― 3 3 万宝盛华集团(ManpowerGroup)Talent dispatch/lease/placement
20,678 22,006 -6.0% 412 524 2.0%
― 4 4 安德普翰(ADP) HR service outsourcing 10,172 9,880 3.0% 2,122 1,933 20.9%
→ 5 / RECRUIT Headhunting & RPO 10,083 9,409 7.2% 1,438 1,131 14.3%
― 6 6 瀚纳仕(HAYS) Headhunting & RPO 5,794 5,222 10.9% 203 183 3.5%
↓ 7 5 必胜人力资源(KELLY)Talent dispatch/lease/placement
5,451 5,551 -1.8% 72 58 1.3%
― 8 8 中智(CIIC) HR service outsourcing 5,333 4,484 18.9% 74 55 1.4%
↑ 9 10 罗致恒富(Robert Half)Talent dispatch/lease/placement
4,111 3,777 8.8% 344 250 8.4%
↓ 10 7 怡安翰威特(Aon Hewitt) HR consulting 3,925 3,781 3.8% 289 336 7.4%
↓ 11 9 美世(MERCER) HR consulting 3,916 3,782 3.5% / / /
→ 12 / usg peopleTalent dispatch/lease/placement
3,696 4,512 -18.1% -211 -6 -5.7%
↓ 13 11 韬睿惠悦(TOWERS WATSON) HR consulting 3,420 3,259 4.9% 400 313 11.7%
↓ 14 12 TEMP HOLDINGS HR service outsourcing 3,090 3,032 1.9% 123 106 4.0%
↓ 15 13 保圣那(PASONA)Talent dispatch/lease/placement
2,269 2,324 -2.4% 25 32 1.1%
↓ 16 14 PAYCHEX HR service outsourcing 2,230 2,084 7.0% 854 786 38.3%
↓ 17 15 Insperity HR service outsourcing 2,159 1,976 9.2% 68 57 3.1%
↓ 18 17 IMPELLAM GROUP HR service outsourcing 1,920 1,757 9.3% 54 54 2.8%
↓ 19 16 SYNERGIE Headhunting & RPO 1,862 1,875 -0.7% 46 57 2.5%
↓ 20 18 米高蒲志国际(PageGroup) Headhunting & RPO 1,569 1,635 -4.0% 103 138 6.6%
↓ 21 20 CHANDLER MACLEOD HR service outsourcing 1,549 1,168 32.6% / / /
↓ 22 19 TRUEBLUETalent dispatch/lease/placement
1,390 1,316 5.6% 372 48 26.8%
↑ 23 31 On AssignmentTalent dispatch/lease/placement
1,240 597 107.6% 93 44 7.5%
↓ 24 22 CDI CorporationTalent dispatch/lease/placement
1,105 1,060 4.3% 32 20 2.9%
↓ 25 21 KFORCE Headhunting & RPO 1,082 1,111 -2.6% -54 45 -5.0%
HRoot Global 50 Human Resources Service Providers 2013
9
GLOBAL 50 HUMAN RESOURCES SERVICE PROVIDERS 2013
Ranking higher/lower
Rank 2013
Rank 2012
Company Logo Country Main businessTotal revenue in
Fiscal 2012 ($ million)
Total revenue in Fiscal 2011
($ million)
Annual revenue growth rate
Operating profit in Fiscal 2012
($ million)
Operating profit in Fiscal 2011
($ million)
Operating margin in Fiscal
2012
↑ 26 34 Linkedin Online recruitment 972 522 86.3% 57 26 5.8%
↓ 27 26 sthree Headhunting & RPO 915 842 8.8% 40 47 4.3%
― 28 28 华德士(ROBERT WALTERS) Headhunting & RPO 900 820 9.8% 13 25 1.5%
↓ 29 23 monsterworldwide Online recruitment 890 1,040 -14.4% 32 77 3.6%
↓ 30 29 克罗诺思(KRONOS)HR management software
870 800 8.8% / / /
↓ 31 25 明达科(MEITEC) Headhunting & RPO 837 870 -3.8% 68 71 8.1%
↓ 32 27 光辉国际(KORN/FERRY INTERNATIONAL) Headhunting & RPO 827 776 6.5% 83 86 10.0%
↓ 33 24 翰德(Hudson) Headhunting & RPO 778 934 -16.7% -7 17 -0.9%
↑ 34 36 CORPORATE RESOURCE SERVICESTalent dispatch/lease/placement
640 539 18.7% 2 3.8 0.3%
↓ 35 33荟才 (RESOURCES GLOBAL PROFESSIONALS)
HR consulting 572 546 4.8% 73 51 12.8%
↓ 36 30 HARVEY NASH Headhunting & RPO 533 655 -18.7% 9 10 1.7%
↓ 37 32 海德思哲(HEIDRICK&STRUGGLES) Headhunting & RPO 466 554 -15.9% 20 -11 4.2%
↓ 38 35 FULLCAST HLDGS HR service outsourcing 461.2 446 3.4% 18 20 3.9%
↓ 39 37 seek Online recruitment 461.1 345 33.7% 137 97 29.7%
↓ 40 38 BBSI HR service outsourcing 403 315 27.9% 19 4 4.7%
↑ 41 44 bluestone Headhunting & RPO 334 222 50.6% -33 -2 -9.8%
↓ 42 41 Ultimate SOFTWAREHR management software
332 269 23.4% 29 16 8.8%
↓ 43 42 Clarius Group Headhunting & RPO 283 267 6.0% -8 -7 -2.7%
→ 44 / workdayHR management software
274 134 104.2% -118 -78 -43.1%
↓ 45 43 hydrogen Headhunting & RPO 265 242 9.3% 5 6 2.0%
↓ 46 45 前程无忧(www.51job.com) Online recruitment 240 218 9.9% 77 70 32.1%
↓ 47 46 HRnet OneHead-Hunting, Talent Acquisition, Lease and Talent Management & Retention
214 203 5.7% 27 26 12.4%
↓ 48 47 Dice Holdings Online recruitment 195 179 9.1% 59 55 30.1%
↑ 49 52 Cornerstone ONDEMANDHR management software
118 73 61.5% -32 -19 -27.0%
― 50 50 ClickSoftwareHR management software
100 87 14.9% 7 15 7.3%
HRoot Global 50 Human Resources Service Providers 2013
10
GLOBAL 50 HUMAN RESOURCES SERVICE PROVIDERS 2013
Ranking higher/lower
Rank 2013
Rank 2012
Company Logo Country Main businessTotal revenue in
Fiscal 2012 ($ million)
Total revenue in Fiscal 2011
($ million)
Annual revenue growth rate
Operating profit in Fiscal 2012
($ million)
Operating profit in Fiscal 2011
($ million)
Operating margin in
Fiscal 2012
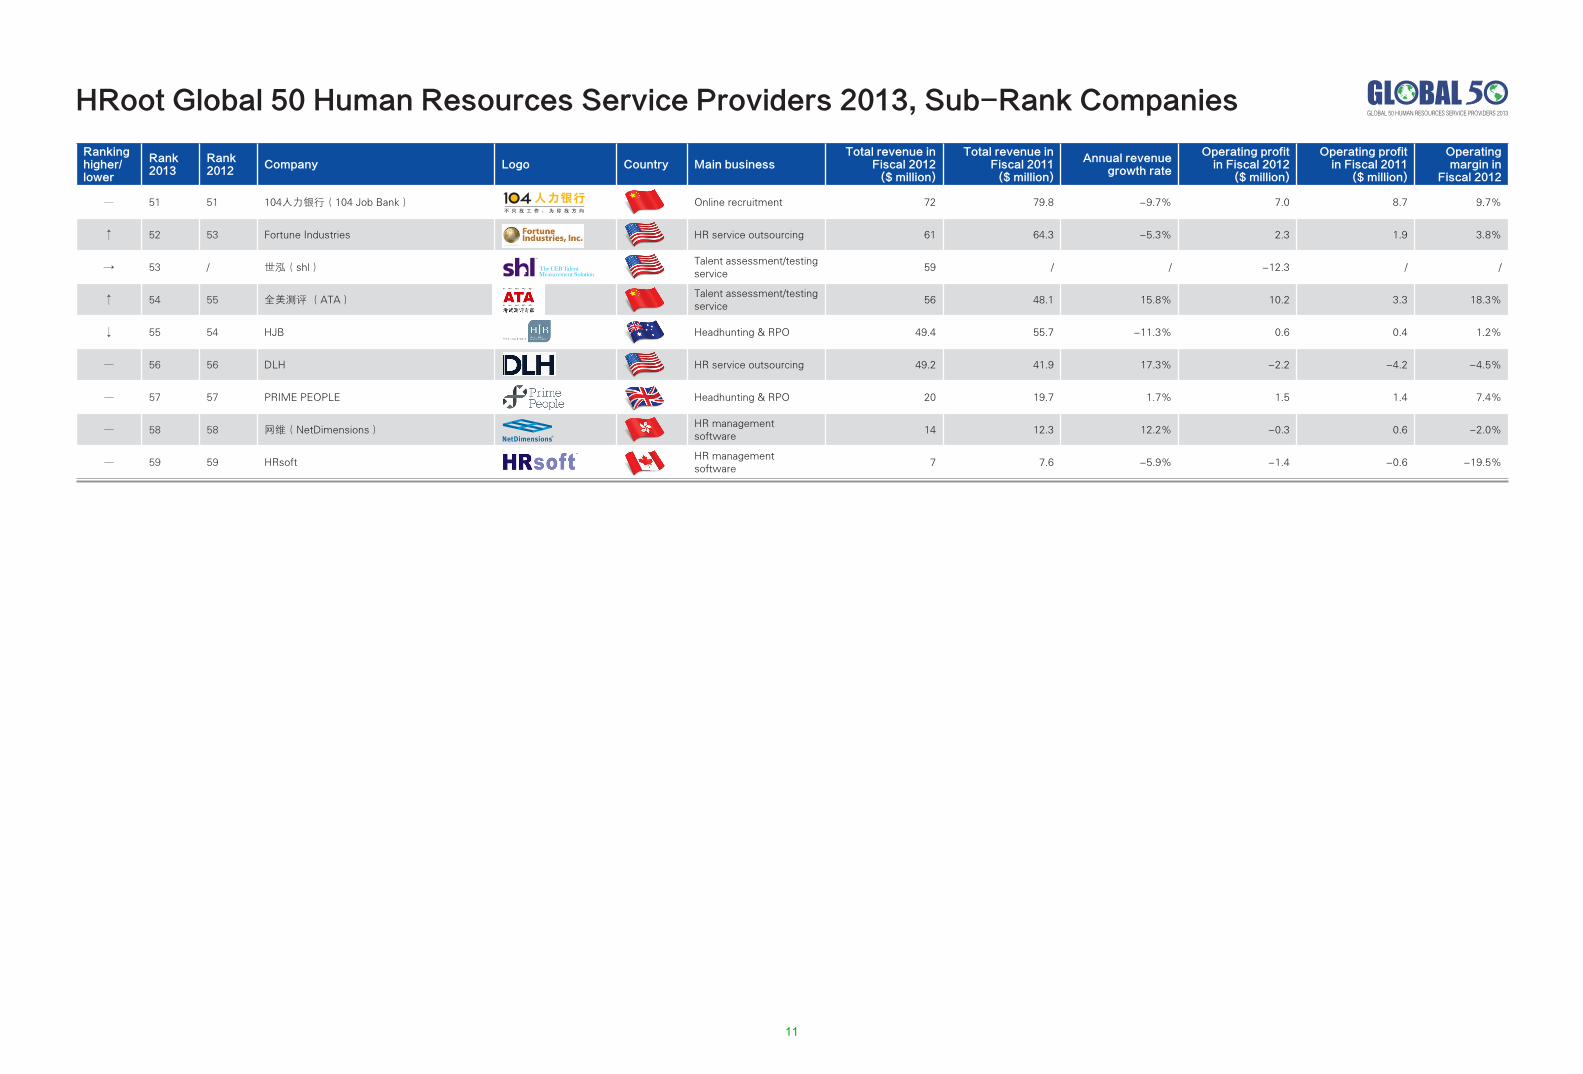
― 51 51 104人力银行(104 Job Bank) Online recruitment 72 79.8 -9.7% 7.0 8.7 9.7%
↑ 52 53 Fortune Industries HR service outsourcing 61 64.3 -5.3% 2.3 1.9 3.8%
→ 53 / 世泓(shl)Talent assessment/testing service
59 / / -12.3 / /
↑ 54 55 全美测评 (ATA)Talent assessment/testing service
56 48.1 15.8% 10.2 3.3 18.3%
↓ 55 54 HJB Headhunting & RPO 49.4 55.7 -11.3% 0.6 0.4 1.2%
― 56 56 DLH HR service outsourcing 49.2 41.9 17.3% -2.2 -4.2 -4.5%
― 57 57 PRIME PEOPLE Headhunting & RPO 20 19.7 1.7% 1.5 1.4 7.4%
― 58 58 网维(NetDimensions)HR management software
14 12.3 12.2% -0.3 0.6 -2.0%
― 59 59 HRsoftHR management software
7 7.6 -5.9% -1.4 -0.6 -19.5%
HRoot Global 50 Human Resources Service Providers 2013, Sub-Rank Companies
11
Ranking in 2012 Company Country Main business Reason of absence
39 talent2 HR outsourcing Acquisition
40 Kenexa HR management software Acquisition
48 The ReThink Group HR outsourcing Not clear
49 Saba Software HR management software Not clear
Financial analysis indicators used in the “HRoot Global 50 HR Service Providers 2013”
Competence indicator Financial ratio Formula
Operating capacity
Annual revenue growth rate (Current revenue - on revenue) / on revenue
Total asset turnover ratio Revenue / average total assets
Accounts receivable turnover ratio Revenue / average accounts receivable balance
Return on assets (ROA) Net profit/average total assets
Profitability
Operating margin Operating profit/revenue
Net profit margin Net profit/main business income
Return on shareholder’s equity (ROE) Net profit/shareholders' equity
Financial structure Debt-asset ratio Liabilities/total assets
Solvency
Current ratio Current assets/current liabilities
Times interest earned(TIE) EBIT/interest expense
Table 1 Previously listed companies absent from the "HRoot Global 50 Global Human Resources Service Providers 2013”
GLOBAL 50 HUMAN RESOURCES SERVICE PROVIDERS 2013
12
Industry
Financial Ratio
HR service outsourcing
Talent dispatch / lease / placement
Headhunting & RPO
HR consulting
HR management software
Online recruitment
Annual revenue growth rate 11.4% 9.7% 2.4% 35.1% 19.1% 4.3%
Total asset turnover ratio 3.2 3.5 2.5 0.8 0.7 1.0
Accounts receivable turnover ratio
22.5 15.0 7.2 4.2 11.2 5.3
Return on assets 5.2% 2.3% 0.5% -5.0% 5.1% 7.0%
Operating margin 7.8% 4.4% 3.4% -12.6% 18.4% 12.2%
Net profit margin 4.9% 0.9% 1.5% -10.4% 6.4% 7.4%
ROE 19.5% 1.5% -3.4% -11.5% 5.3% 10.9%
Debt-asset ratio 58.3% 53.8% 45.8% 51.3% 37.6% 34.6%
Current ratio 1.3 1.8 1.9 2.1 2.1 2.6
Times interest earned 180.0 8.8 28.5 / 8.8 /
Table 2 Companies making debut on the “HRoot Global 50 Global Human Resources Service Providers 2013”
Ranking in 2013 Company Country Main businessRevenue in Fiscal 2012(USD, million)
5 RECRUIT Headhunting and recruitment process outsourcing
10,083
12 usg people Talent dispatch/lease/placement 3,695
44 workday HR management software 274
52 Cornerstone ONDEMAND HR management software 118
Financial ratios averages by industry in the “HRoot Global 50 HR Service Providers 2013”
GLOBAL 50 HUMAN RESOURCES SERVICE PROVIDERS 2013
13
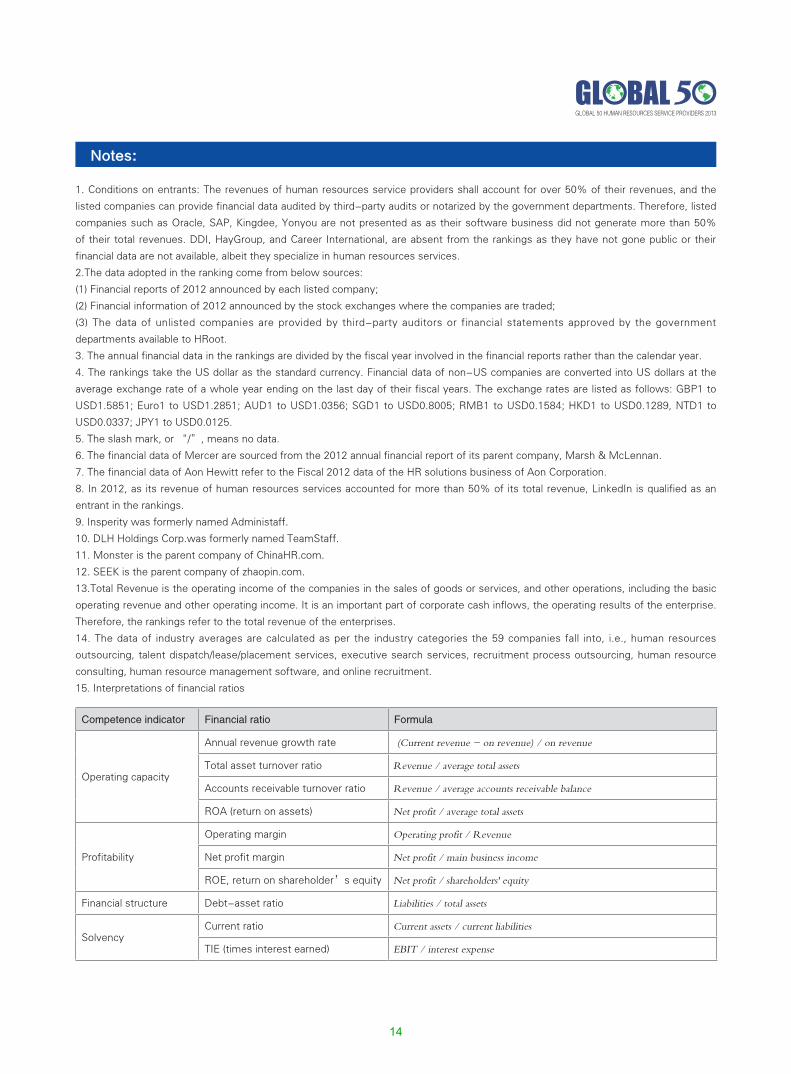
1. Conditions on entrants: The revenues of human resources service providers shall account for over 50% of their revenues, and the
listed companies can provide financial data audited by third-party audits or notarized by the government departments. Therefore, listed
companies such as Oracle, SAP, Kingdee, Yonyou are not presented as as their software business did not generate more than 50%
of their total revenues. DDI, HayGroup, and Career International, are absent from the rankings as they have not gone public or their
financial data are not available, albeit they specialize in human resources services.
2.The data adopted in the ranking come from below sources:
(1) Financial reports of 2012 announced by each listed company;
(2) Financial information of 2012 announced by the stock exchanges where the companies are traded;
(3) The data of unlisted companies are provided by third-party auditors or financial statements approved by the government
departments available to HRoot.
3. The annual financial data in the rankings are divided by the fiscal year involved in the financial reports rather than the calendar year.
4. The rankings take the US dollar as the standard currency. Financial data of non-US companies are converted into US dollars at the
average exchange rate of a whole year ending on the last day of their fiscal years. The exchange rates are listed as follows: GBP1 to
USD1.5851; Euro1 to USD1.2851; AUD1 to USD1.0356; SGD1 to USD0.8005; RMB1 to USD0.1584; HKD1 to USD0.1289, NTD1 to
USD0.0337; JPY1 to USD0.0125.
5. The slash mark, or “/”, means no data.
6. The financial data of Mercer are sourced from the 2012 annual financial report of its parent company, Marsh & McLennan.
7. The financial data of Aon Hewitt refer to the Fiscal 2012 data of the HR solutions business of Aon Corporation.
8. In 2012, as its revenue of human resources services accounted for more than 50% of its total revenue, LinkedIn is qualified as an
entrant in the rankings.
9. Insperity was formerly named Administaff.
10. DLH Holdings Corp.was formerly named TeamStaff.
11. Monster is the parent company of ChinaHR.com.
12. SEEK is the parent company of zhaopin.com.
13.Total Revenue is the operating income of the companies in the sales of goods or services, and other operations, including the basic
operating revenue and other operating income. It is an important part of corporate cash inflows, the operating results of the enterprise.
Therefore, the rankings refer to the total revenue of the enterprises.
14. The data of industry averages are calculated as per the industry categories the 59 companies fall into, i.e., human resources
outsourcing, talent dispatch/lease/placement services, executive search services, recruitment process outsourcing, human resource
consulting, human resource management software, and online recruitment.
15. Interpretations of financial ratios
Notes:
Competence indicator Financial ratio Formula
Operating capacity
Annual revenue growth rate (Current revenue - on revenue) / on revenue
Total asset turnover ratio Revenue / average total assets
Accounts receivable turnover ratio Revenue / average accounts receivable balance
ROA (return on assets) Net profit / average total assets
Profitability
Operating margin Operating profit / Revenue
Net profit margin Net profit / main business income
ROE, return on shareholder’s equity Net profit / shareholders' equity
Financial structure Debt-asset ratio Liabilities / total assets
SolvencyCurrent ratio Current assets / current liabilities
TIE (times interest earned) EBIT / interest expense
GLOBAL 50 HUMAN RESOURCES SERVICE PROVIDERS 2013
14
(1) Annual revenue growth rate gauges the ratio of the difference between the revenues of Fiscal 2012 and Fiscal 2011 to the latter. It
illustrates how fast the revenue is changing.
(2) The total asset turnover ratio measures the ability of a company to use its assets to efficiently generate sales. This ratio considers all
assets, current and fixed. Those assets include fixed assets, like plant and equipment, as well as inventory, accounts receivable, as well
as any other current assets. The fast the turnover of a company, the stronger its operating capacity is.
(3) Accounts receivable turnover ratio refers to the number of times that accounts receivable amount is collected throughout the year.
The average accounts receivable looks at the accounts receivable balance at the beginning of the year as well as the end of the year.
A high accounts receivable turnover ratio indicates a tight credit policy. A low or declining accounts receivable turnover ratio indicates a
collection problem, part of which may be due to bad debts. Yet an extremely high ratio can mean that the company is under the heavy
debts that may curb the increase of its sales amount and profit.
(4) ROA, or return on assets, is an indicator of how profitable a company is relative to its total assets. ROA gives an idea as to how
efficient management is at using its assets to generate earnings. Calculated by dividing a company's annual earnings by its total assets,
ROA is displayed as a percentage.
(5) Operating margin is a measure of profitability that indicates how much of each dollar of revenues is left over after both costs of
goods sold and operating expenses are considered.
(6) Net profit margin tells how much profit a company makes for every one dollar. The higher a company's profit margin compared to its
competitors, the better.
(7) ROE, or Return on shareholder’s equity, is the amount of net income returned as a percentage of shareholders equity. Return on
equity measures a corporation's profitability by revealing how much profit a company generates with the money shareholders have
invested.
(8) Debt-asset ratio is total liabilities divided by total assets. The debt asset ratio shows the proportion of a company'sassets which are
financed through debt. Companies with high debt/asset ratios are said to be "highly leveraged," and could be in danger if creditors start
to demand repayment of debt.
(9) Current ratio suggests the company's ability to pay back its short-term liabilities (debt and payables) with its short-term assets (cash,
inventory, receivables). The higher the current ratio, the more capable the company is of paying its obligations.
(10) Multiples of interest earned is a metric used to measure a company's ability to meet its debt obligations. It is calculated by taking
a company's earnings before interest and taxes (EBIT) and dividing it by the total interest payable on bonds and other contractual debt.
It is usually quoted as a ratio and indicates how many times a company can cover its interest charges on a pretax basis. The higher the
TIE, the more ability the company has to pay its long-term debts.
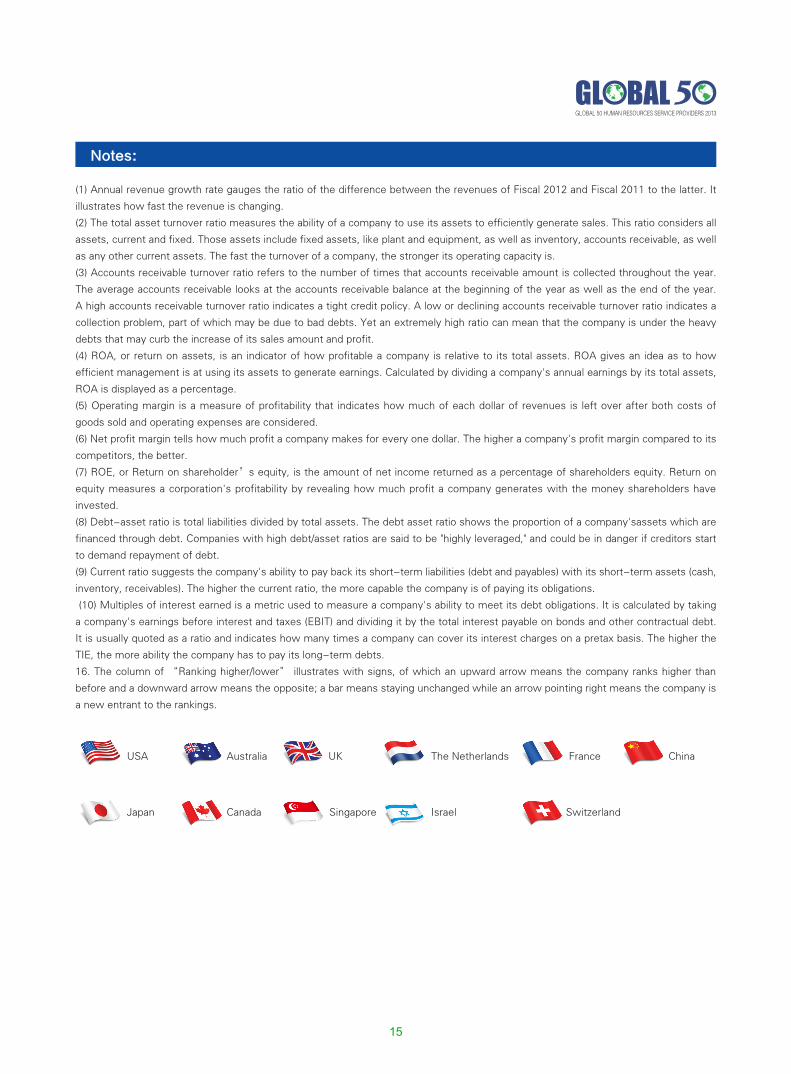
16. The column of “Ranking higher/lower” illustrates with signs, of which an upward arrow means the company ranks higher than
before and a downward arrow means the opposite; a bar means staying unchanged while an arrow pointing right means the company is
a new entrant to the rankings.
Notes:
USA
Japan
Australia
Canada
UK
Singapore
France
Switzerland
ChinaThe Netherlands
Israel
GLOBAL 50 HUMAN RESOURCES SERVICE PROVIDERS 2013
15
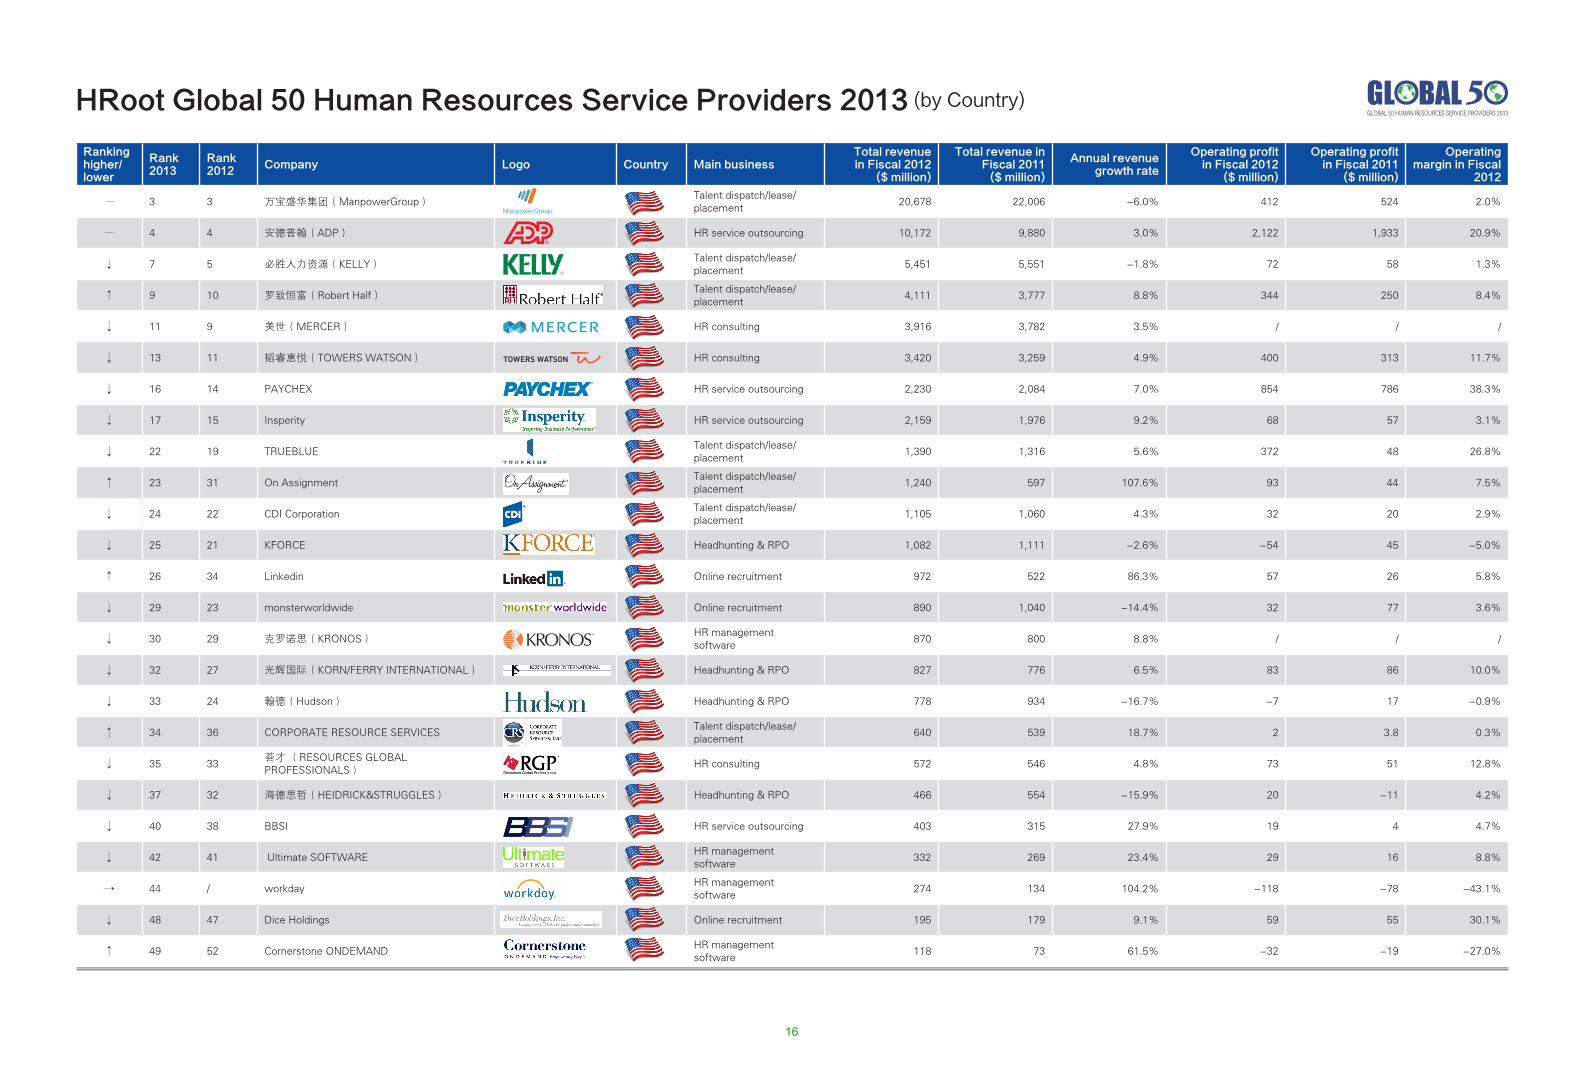
GLOBAL 50 HUMAN RESOURCES SERVICE PROVIDERS 2013
Ranking higher/lower
Rank 2013
Rank 2012
Company Logo Country Main businessTotal revenue in Fiscal 2012
($ million)
Total revenue in Fiscal 2011
($ million)
Annual revenue growth rate
Operating profit in Fiscal 2012
($ million)
Operating profit in Fiscal 2011
($ million)
Operating margin in Fiscal
2012
― 3 3 万宝盛华集团(ManpowerGroup)Talent dispatch/lease/placement
20,678 22,006 -6.0% 412 524 2.0%
― 4 4 安德普翰(ADP) HR service outsourcing 10,172 9,880 3.0% 2,122 1,933 20.9%
↓ 7 5 必胜人力资源(KELLY)Talent dispatch/lease/placement
5,451 5,551 -1.8% 72 58 1.3%
↑ 9 10 罗致恒富(Robert Half)Talent dispatch/lease/placement
4,111 3,777 8.8% 344 250 8.4%
↓ 11 9 美世(MERCER) HR consulting 3,916 3,782 3.5% / / /
↓ 13 11 韬睿惠悦(TOWERS WATSON) HR consulting 3,420 3,259 4.9% 400 313 11.7%
↓ 16 14 PAYCHEX HR service outsourcing 2,230 2,084 7.0% 854 786 38.3%
↓ 17 15 Insperity HR service outsourcing 2,159 1,976 9.2% 68 57 3.1%
↓ 22 19 TRUEBLUETalent dispatch/lease/placement
1,390 1,316 5.6% 372 48 26.8%
↑ 23 31 On AssignmentTalent dispatch/lease/placement
1,240 597 107.6% 93 44 7.5%
↓ 24 22 CDI CorporationTalent dispatch/lease/placement
1,105 1,060 4.3% 32 20 2.9%
↓ 25 21 KFORCE Headhunting & RPO 1,082 1,111 -2.6% -54 45 -5.0%
↑ 26 34 Linkedin Online recruitment 972 522 86.3% 57 26 5.8%
↓ 29 23 monsterworldwide Online recruitment 890 1,040 -14.4% 32 77 3.6%
↓ 30 29 克罗诺思(KRONOS)HR management software
870 800 8.8% / / /
↓ 32 27 光辉国际(KORN/FERRY INTERNATIONAL) Headhunting & RPO 827 776 6.5% 83 86 10.0%
↓ 33 24 翰德(Hudson) Headhunting & RPO 778 934 -16.7% -7 17 -0.9%
↑ 34 36 CORPORATE RESOURCE SERVICESTalent dispatch/lease/placement
640 539 18.7% 2 3.8 0.3%
↓ 35 33荟才 (RESOURCES GLOBAL PROFESSIONALS)
HR consulting 572 546 4.8% 73 51 12.8%
↓ 37 32 海德思哲(HEIDRICK&STRUGGLES) Headhunting & RPO 466 554 -15.9% 20 -11 4.2%
↓ 40 38 BBSI HR service outsourcing 403 315 27.9% 19 4 4.7%
↓ 42 41 Ultimate SOFTWAREHR management software
332 269 23.4% 29 16 8.8%
→ 44 / workdayHR management software
274 134 104.2% -118 -78 -43.1%
↓ 48 47 Dice Holdings Online recruitment 195 179 9.1% 59 55 30.1%
↑ 49 52 Cornerstone ONDEMANDHR management software
118 73 61.5% -32 -19 -27.0%
HRoot Global 50 Human Resources Service Providers 2013 (by Country)
16
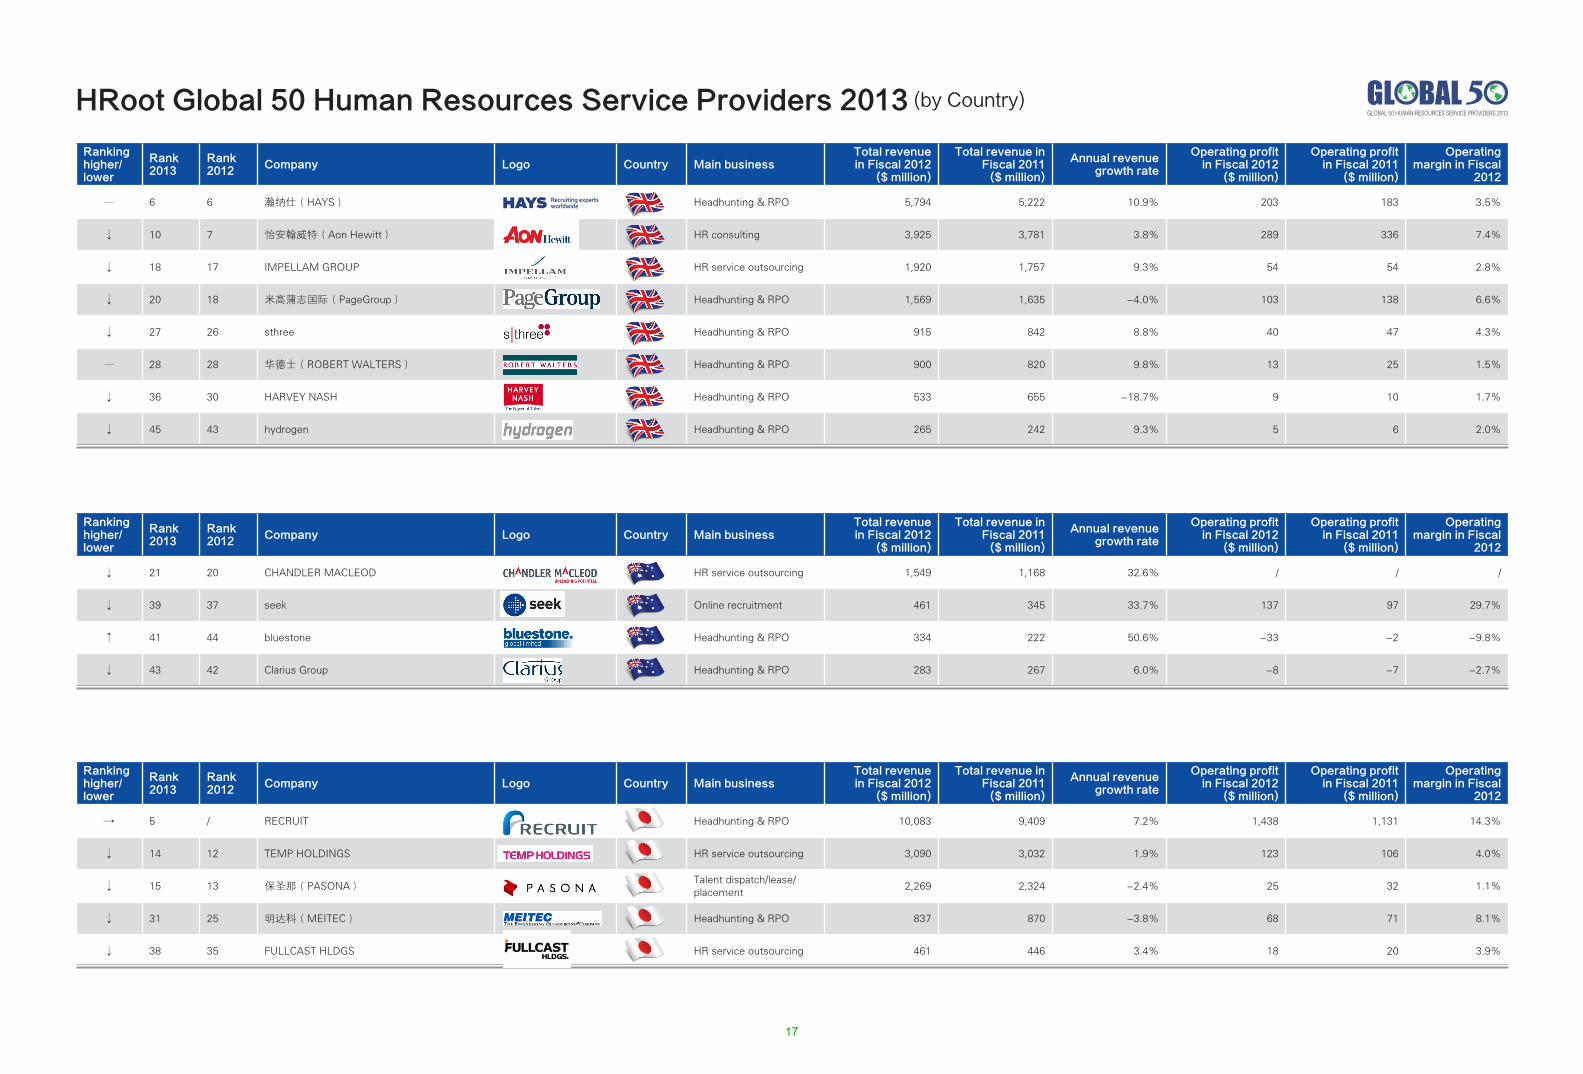
GLOBAL 50 HUMAN RESOURCES SERVICE PROVIDERS 2013
Ranking higher/lower
Rank 2013
Rank 2012
Company Logo Country Main businessTotal revenue in Fiscal 2012
($ million)
Total revenue in Fiscal 2011
($ million)
Annual revenue growth rate
Operating profit in Fiscal 2012
($ million)
Operating profit in Fiscal 2011
($ million)
Operating margin in Fiscal
2012
→ 5 / RECRUIT Headhunting & RPO 10,083 9,409 7.2% 1,438 1,131 14.3%
↓ 14 12 TEMP HOLDINGS HR service outsourcing 3,090 3,032 1.9% 123 106 4.0%
↓ 15 13 保圣那(PASONA)Talent dispatch/lease/placement
2,269 2,324 -2.4% 25 32 1.1%
↓ 31 25 明达科(MEITEC) Headhunting & RPO 837 870 -3.8% 68 71 8.1%
↓ 38 35 FULLCAST HLDGS HR service outsourcing 461 446 3.4% 18 20 3.9%
Ranking higher/lower
Rank 2013
Rank 2012
Company Logo Country Main businessTotal revenue in Fiscal 2012
($ million)
Total revenue in Fiscal 2011
($ million)
Annual revenue growth rate
Operating profit in Fiscal 2012
($ million)
Operating profit in Fiscal 2011
($ million)
Operating margin in Fiscal
2012
↓ 21 20 CHANDLER MACLEOD HR service outsourcing 1,549 1,168 32.6% / / /
↓ 39 37 seek Online recruitment 461 345 33.7% 137 97 29.7%
↑ 41 44 bluestone Headhunting & RPO 334 222 50.6% -33 -2 -9.8%
↓ 43 42 Clarius Group Headhunting & RPO 283 267 6.0% -8 -7 -2.7%
Ranking higher/lower
Rank 2013
Rank 2012
Company Logo Country Main businessTotal revenue in Fiscal 2012
($ million)
Total revenue in Fiscal 2011
($ million)
Annual revenue growth rate
Operating profit in Fiscal 2012
($ million)
Operating profit in Fiscal 2011
($ million)
Operating margin in Fiscal
2012
― 6 6 瀚纳仕(HAYS) Headhunting & RPO 5,794 5,222 10.9% 203 183 3.5%
↓ 10 7 怡安翰威特(Aon Hewitt) HR consulting 3,925 3,781 3.8% 289 336 7.4%
↓ 18 17 IMPELLAM GROUP HR service outsourcing 1,920 1,757 9.3% 54 54 2.8%
↓ 20 18 米高蒲志国际(PageGroup) Headhunting & RPO 1,569 1,635 -4.0% 103 138 6.6%
↓ 27 26 sthree Headhunting & RPO 915 842 8.8% 40 47 4.3%
― 28 28 华德士(ROBERT WALTERS) Headhunting & RPO 900 820 9.8% 13 25 1.5%
↓ 36 30 HARVEY NASH Headhunting & RPO 533 655 -18.7% 9 10 1.7%
↓ 45 43 hydrogen Headhunting & RPO 265 242 9.3% 5 6 2.0%
HRoot Global 50 Human Resources Service Providers 2013 (by Country)
17
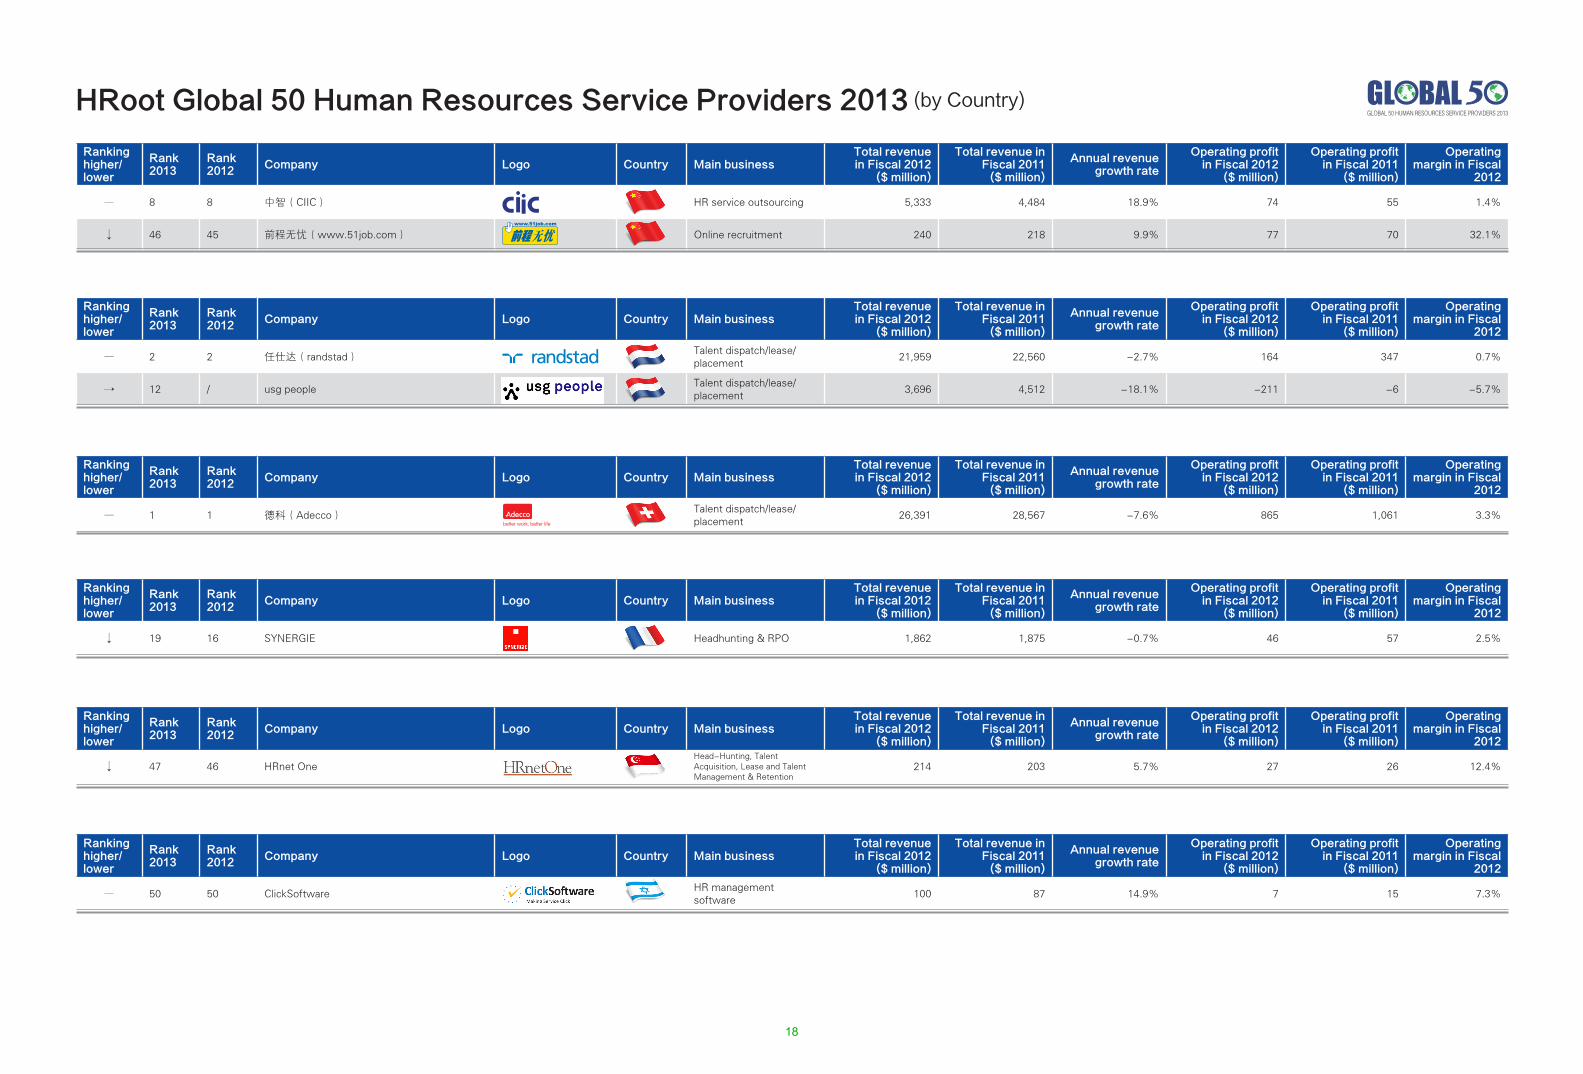
GLOBAL 50 HUMAN RESOURCES SERVICE PROVIDERS 2013
Ranking higher/lower
Rank 2013
Rank 2012
Company Logo Country Main businessTotal revenue in Fiscal 2012
($ million)
Total revenue in Fiscal 2011
($ million)
Annual revenue growth rate
Operating profit in Fiscal 2012
($ million)
Operating profit in Fiscal 2011
($ million)
Operating margin in Fiscal
2012
― 50 50 ClickSoftwareHR management software
100 87 14.9% 7 15 7.3%
Ranking higher/lower
Rank 2013
Rank 2012
Company Logo Country Main businessTotal revenue in Fiscal 2012
($ million)
Total revenue in Fiscal 2011
($ million)
Annual revenue growth rate
Operating profit in Fiscal 2012
($ million)
Operating profit in Fiscal 2011
($ million)
Operating margin in Fiscal
2012
↓ 47 46 HRnet OneHead-Hunting, Talent Acquisition, Lease and Talent Management & Retention
214 203 5.7% 27 26 12.4%
Ranking higher/lower
Rank 2013
Rank 2012
Company Logo Country Main businessTotal revenue in Fiscal 2012
($ million)
Total revenue in Fiscal 2011
($ million)
Annual revenue growth rate
Operating profit in Fiscal 2012
($ million)
Operating profit in Fiscal 2011
($ million)
Operating margin in Fiscal
2012
↓ 19 16 SYNERGIE Headhunting & RPO 1,862 1,875 -0.7% 46 57 2.5%
Ranking higher/lower
Rank 2013
Rank 2012
Company Logo Country Main businessTotal revenue in Fiscal 2012
($ million)
Total revenue in Fiscal 2011
($ million)
Annual revenue growth rate
Operating profit in Fiscal 2012
($ million)
Operating profit in Fiscal 2011
($ million)
Operating margin in Fiscal
2012
― 1 1 德科(Adecco)Talent dispatch/lease/placement
26,391 28,567 -7.6% 865 1,061 3.3%
Ranking higher/lower
Rank 2013
Rank 2012
Company Logo Country Main businessTotal revenue in Fiscal 2012
($ million)
Total revenue in Fiscal 2011
($ million)
Annual revenue growth rate
Operating profit in Fiscal 2012
($ million)
Operating profit in Fiscal 2011
($ million)
Operating margin in Fiscal
2012
― 2 2 任仕达(randstad)Talent dispatch/lease/placement
21,959 22,560 -2.7% 164 347 0.7%
→ 12 / usg peopleTalent dispatch/lease/placement
3,696 4,512 -18.1% -211 -6 -5.7%
Ranking higher/lower
Rank 2013
Rank 2012
Company Logo Country Main businessTotal revenue in Fiscal 2012
($ million)
Total revenue in Fiscal 2011
($ million)
Annual revenue growth rate
Operating profit in Fiscal 2012
($ million)
Operating profit in Fiscal 2011
($ million)
Operating margin in Fiscal
2012
― 8 8 中智(CIIC) HR service outsourcing 5,333 4,484 18.9% 74 55 1.4%
↓ 46 45 前程无忧(www.51job.com) Online recruitment 240 218 9.9% 77 70 32.1%
HRoot Global 50 Human Resources Service Providers 2013 (by Country)
18
GLOBAL 50 HUMAN RESOURCES SERVICE PROVIDERS 2013
Ranking higher/lower
Rank 2013
Rank 2012
Company Logo Country Main businessTotal revenue in
Fiscal 2012($ million)
Total revenue in Fiscal 2011
($ million)
Annual revenue growth rate
Operating profit in Fiscal 2012
($ million)
Operating profit in Fiscal 2011
($ million)
Operating margin in
Fiscal 2012
― 1 1 德科(Adecco)Talent dispatch/lease/placement
26,391 28,567 -7.6% 865 1,061 3.3%
― 2 2 任仕达(randstad)Talent dispatch/lease/placement
21,959 22,560 -2.7% 164 347 0.7%
― 3 3 万宝盛华集团(ManpowerGroup)Talent dispatch/lease/placement
20,678 22,006 -6.0% 412 524 2.0%
↓ 7 5 必胜人力资源(KELLY)Talent dispatch/lease/placement
5,451 5,551 -1.8% 72 58 1.3%
↑ 9 10 罗致恒富(Robert Half)Talent dispatch/lease/placement
4,111 3,777 8.8% 344 250 8.4%
→ 12 / usg peopleTalent dispatch/lease/placement
3,696 4,512 -18.1% -211 -6 -5.7%
↓ 15 13 保圣那(PASONA)Talent dispatch/lease/placement
2,269 2,324 -2.4% 25 32 1.1%
↓ 22 19 TRUEBLUETalent dispatch/lease/placement
1,390 1,316 5.6% 372 48 26.8%
↑ 23 31 On AssignmentTalent dispatch/lease/placement
1,240 597 107.6% 93 44 7.5%
↓ 24 22 CDI CorporationTalent dispatch/lease/placement
1,105 1,060 4.3% 32 20 2.9%
↑ 34 36 CORPORATE RESOURCE SERVICESTalent dispatch/lease/placement
640 539 18.7% 2 3.8 0.3%
Ranking higher/lower
Rank 2013
Rank 2012
Company Logo Country Main businessTotal revenue in
Fiscal 2012($ million)
Total revenue in Fiscal 2011
($ million)
Annual revenue growth rate
Operating profit in Fiscal 2012
($ million)
Operating profit in Fiscal 2011
($ million)
Operating margin in
Fiscal 2012
― 4 4 安德普翰(ADP) HR service outsourcing 10,172 9,880 3.0% 2,122 1,933 20.9%
― 8 8 中智(CIIC) HR service outsourcing 5,333 4,484 18.9% 74 55 1.4%
↓ 14 12 TEMP HOLDINGS HR service outsourcing 3,090 3,032 1.9% 123 106 4.0%
↓ 16 14 PAYCHEX HR service outsourcing 2,230 2,084 7.0% 854 786 38.3%
↓ 17 15 Insperity HR service outsourcing 2,159 1,976 9.2% 68 57 3.1%
↓ 18 17 IMPELLAM GROUP HR service outsourcing 1,920 1,757 9.3% 54 54 2.8%
↓ 21 20 CHANDLER MACLEOD HR service outsourcing 1,549 1,168 32.6% / / /
↓ 38 35 FULLCAST HLDGS HR service outsourcing 461 446 3.4% 18 20 3.9%
↓ 40 38 BBSI HR service outsourcing 403 315 27.9% 19 4 4.7%
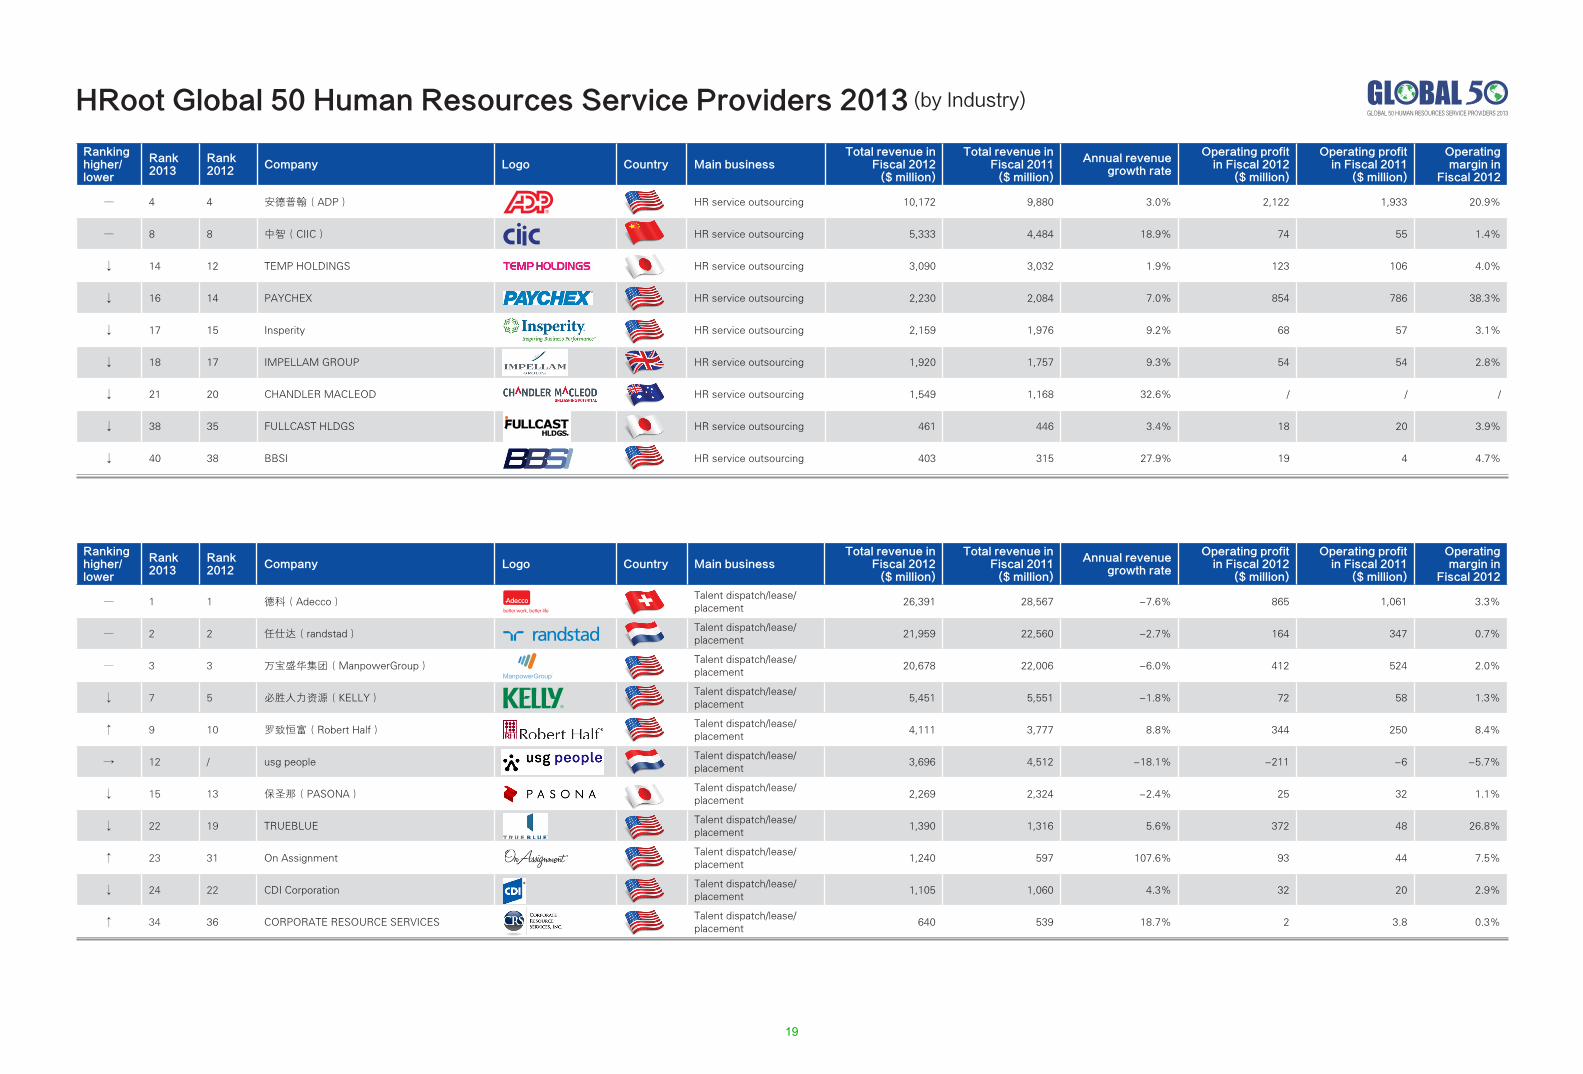
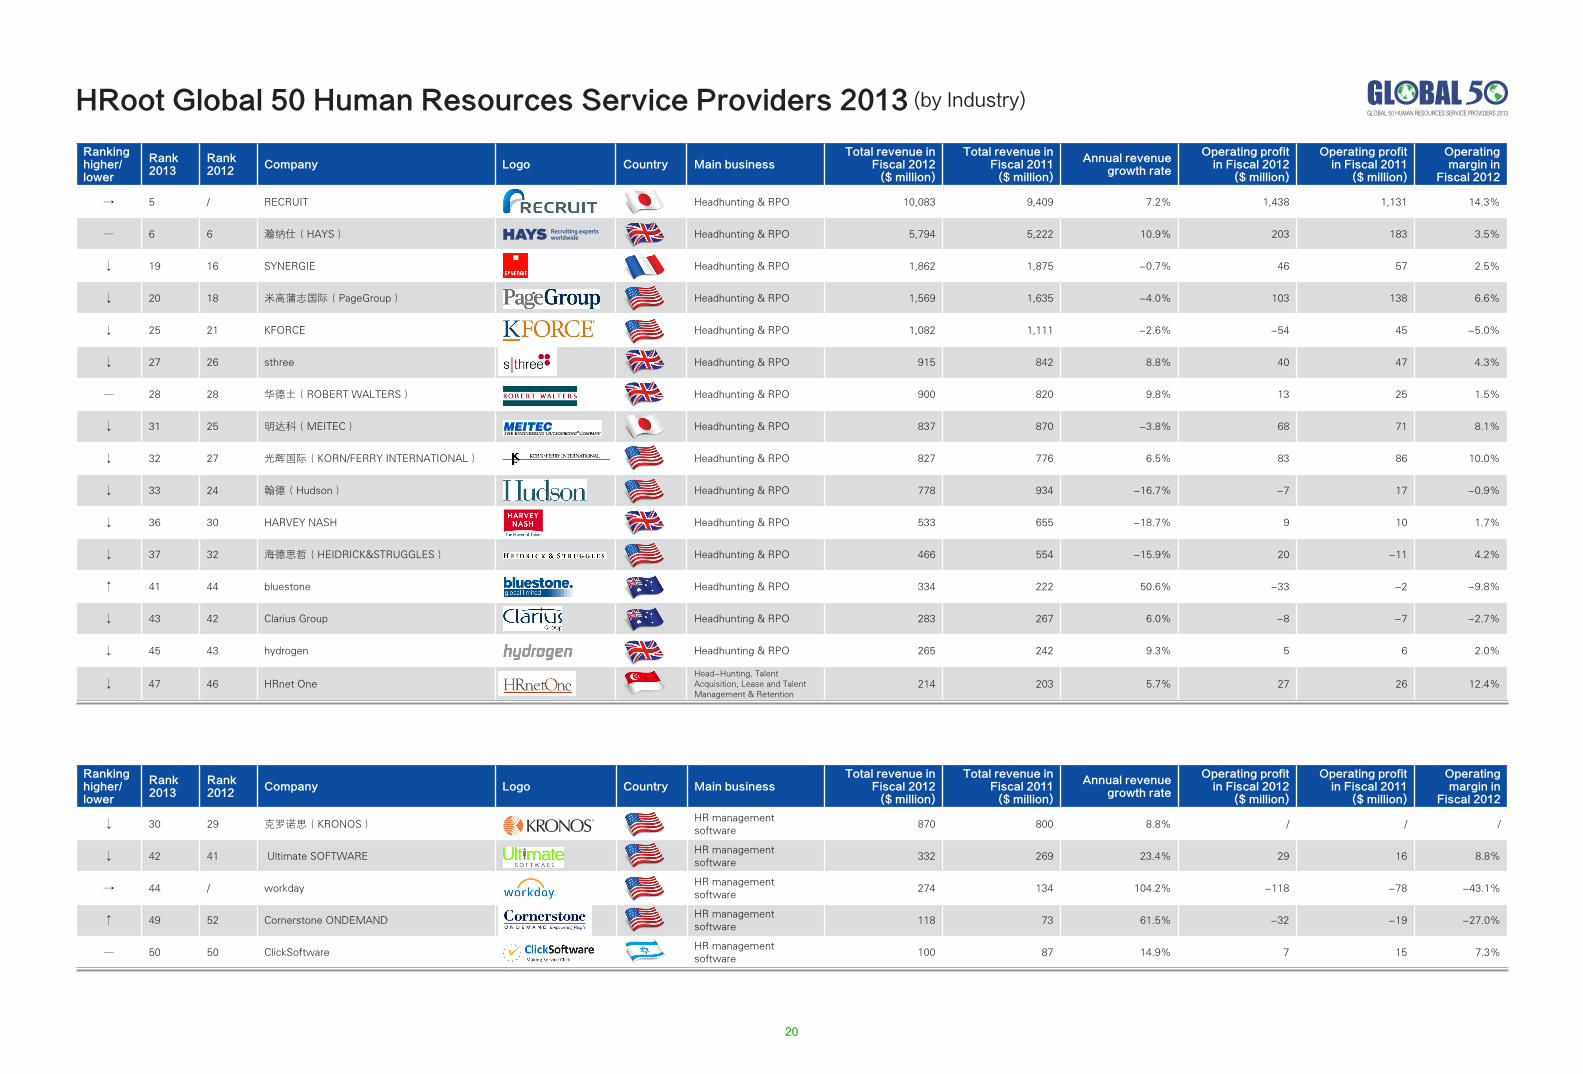
HRoot Global 50 Human Resources Service Providers 2013 (by Industry)
19
GLOBAL 50 HUMAN RESOURCES SERVICE PROVIDERS 2013
Ranking higher/lower
Rank 2013
Rank 2012
Company Logo Country Main businessTotal revenue in
Fiscal 2012($ million)
Total revenue in Fiscal 2011
($ million)
Annual revenue growth rate
Operating profit in Fiscal 2012
($ million)
Operating profit in Fiscal 2011
($ million)
Operating margin in
Fiscal 2012
↓ 30 29 克罗诺思(KRONOS)HR management software
870 800 8.8% / / /
↓ 42 41 Ultimate SOFTWAREHR management software
332 269 23.4% 29 16 8.8%
→ 44 / workdayHR management software
274 134 104.2% -118 -78 -43.1%
↑ 49 52 Cornerstone ONDEMANDHR management software
118 73 61.5% -32 -19 -27.0%
― 50 50 ClickSoftwareHR management software
100 87 14.9% 7 15 7.3%
Ranking higher/lower
Rank 2013
Rank 2012
Company Logo Country Main businessTotal revenue in
Fiscal 2012($ million)
Total revenue in Fiscal 2011
($ million)
Annual revenue growth rate
Operating profit in Fiscal 2012
($ million)
Operating profit in Fiscal 2011
($ million)
Operating margin in
Fiscal 2012
→ 5 / RECRUIT Headhunting & RPO 10,083 9,409 7.2% 1,438 1,131 14.3%
― 6 6 瀚纳仕(HAYS) Headhunting & RPO 5,794 5,222 10.9% 203 183 3.5%
↓ 19 16 SYNERGIE Headhunting & RPO 1,862 1,875 -0.7% 46 57 2.5%
↓ 20 18 米高蒲志国际(PageGroup) Headhunting & RPO 1,569 1,635 -4.0% 103 138 6.6%
↓ 25 21 KFORCE Headhunting & RPO 1,082 1,111 -2.6% -54 45 -5.0%
↓ 27 26 sthree Headhunting & RPO 915 842 8.8% 40 47 4.3%
― 28 28 华德士(ROBERT WALTERS) Headhunting & RPO 900 820 9.8% 13 25 1.5%
↓ 31 25 明达科(MEITEC) Headhunting & RPO 837 870 -3.8% 68 71 8.1%
↓ 32 27 光辉国际(KORN/FERRY INTERNATIONAL) Headhunting & RPO 827 776 6.5% 83 86 10.0%
↓ 33 24 翰德(Hudson) Headhunting & RPO 778 934 -16.7% -7 17 -0.9%
↓ 36 30 HARVEY NASH Headhunting & RPO 533 655 -18.7% 9 10 1.7%
↓ 37 32 海德思哲(HEIDRICK&STRUGGLES) Headhunting & RPO 466 554 -15.9% 20 -11 4.2%
↑ 41 44 bluestone Headhunting & RPO 334 222 50.6% -33 -2 -9.8%
↓ 43 42 Clarius Group Headhunting & RPO 283 267 6.0% -8 -7 -2.7%
↓ 45 43 hydrogen Headhunting & RPO 265 242 9.3% 5 6 2.0%
↓ 47 46 HRnet OneHead-Hunting, Talent Acquisition, Lease and Talent Management & Retention
214 203 5.7% 27 26 12.4%
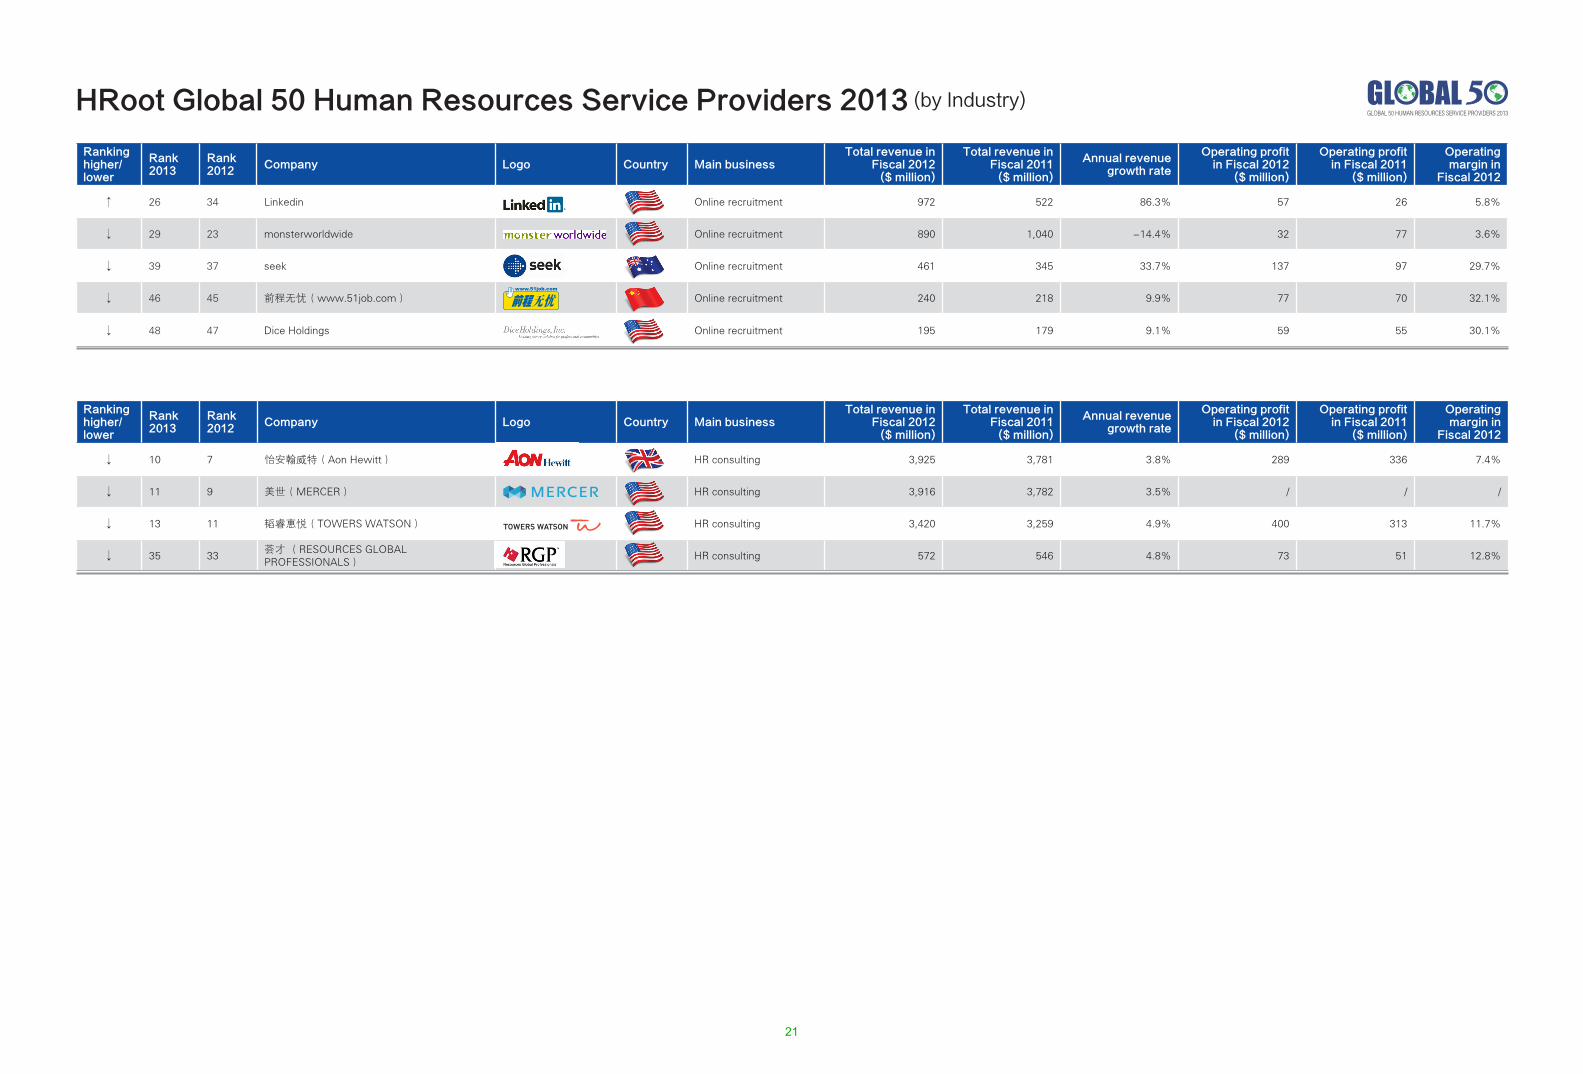
HRoot Global 50 Human Resources Service Providers 2013 (by Industry)
20
GLOBAL 50 HUMAN RESOURCES SERVICE PROVIDERS 2013
Ranking higher/lower
Rank 2013
Rank 2012
Company Logo Country Main businessTotal revenue in
Fiscal 2012($ million)
Total revenue in Fiscal 2011
($ million)
Annual revenue growth rate
Operating profit in Fiscal 2012
($ million)
Operating profit in Fiscal 2011
($ million)
Operating margin in
Fiscal 2012
↓ 10 7 怡安翰威特(Aon Hewitt) HR consulting 3,925 3,781 3.8% 289 336 7.4%
↓ 11 9 美世(MERCER) HR consulting 3,916 3,782 3.5% / / /
↓ 13 11 韬睿惠悦(TOWERS WATSON) HR consulting 3,420 3,259 4.9% 400 313 11.7%
↓ 35 33荟才 (RESOURCES GLOBAL PROFESSIONALS)
HR consulting 572 546 4.8% 73 51 12.8%
Ranking higher/lower
Rank 2013
Rank 2012
Company Logo Country Main businessTotal revenue in
Fiscal 2012($ million)
Total revenue in Fiscal 2011
($ million)
Annual revenue growth rate
Operating profit in Fiscal 2012
($ million)
Operating profit in Fiscal 2011
($ million)
Operating margin in
Fiscal 2012
↑ 26 34 Linkedin Online recruitment 972 522 86.3% 57 26 5.8%
↓ 29 23 monsterworldwide Online recruitment 890 1,040 -14.4% 32 77 3.6%
↓ 39 37 seek Online recruitment 461 345 33.7% 137 97 29.7%
↓ 46 45 前程无忧(www.51job.com) Online recruitment 240 218 9.9% 77 70 32.1%
↓ 48 47 Dice Holdings Online recruitment 195 179 9.1% 59 55 30.1%
HRoot Global 50 Human Resources Service Providers 2013 (by Industry)
21
GLOBAL 50 HUMAN RESOURCES SERVICE PROVIDERS 2013
Rank of annual revenue growth rate
Company Logo Country Main businessTotal revenue in Fiscal 2012
($ million)Total revenue in Fiscal 2011
($ million)Annual revenue growth rate
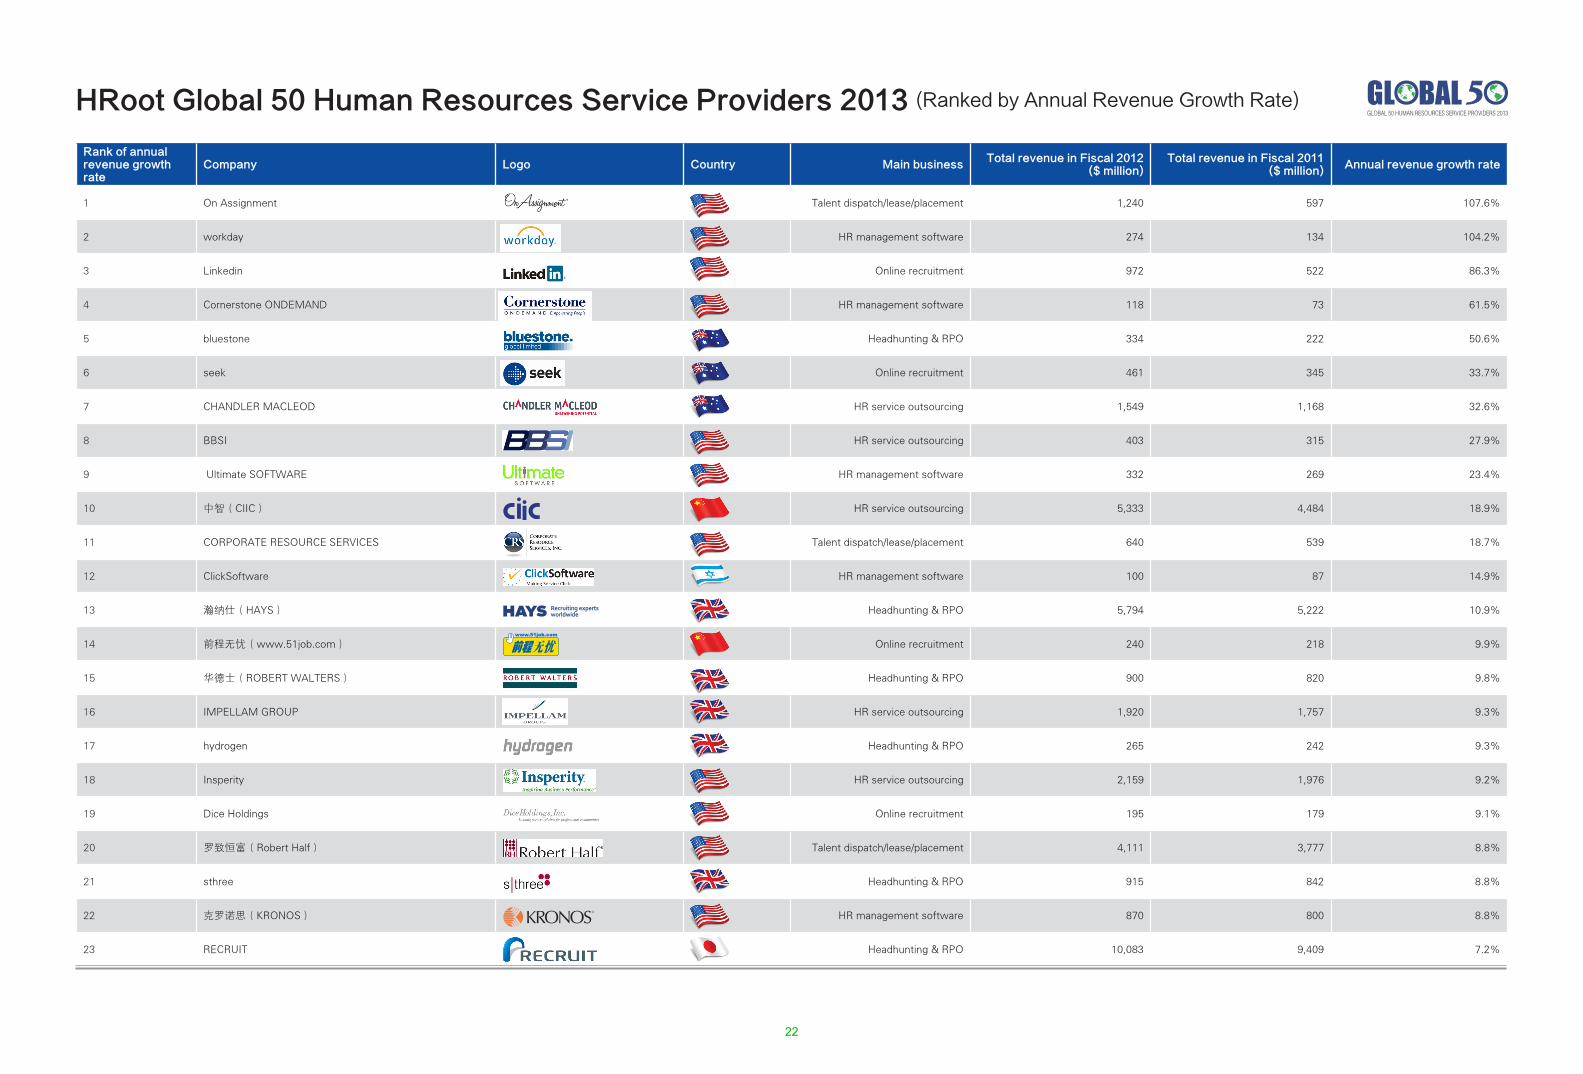
1 On Assignment Talent dispatch/lease/placement 1,240 597 107.6%
2 workday HR management software 274 134 104.2%
3 Linkedin Online recruitment 972 522 86.3%
4 Cornerstone ONDEMAND HR management software 118 73 61.5%
5 bluestone Headhunting & RPO 334 222 50.6%
6 seek Online recruitment 461 345 33.7%
7 CHANDLER MACLEOD HR service outsourcing 1,549 1,168 32.6%
8 BBSI HR service outsourcing 403 315 27.9%
9 Ultimate SOFTWARE HR management software 332 269 23.4%
10 中智(CIIC) HR service outsourcing 5,333 4,484 18.9%
11 CORPORATE RESOURCE SERVICES Talent dispatch/lease/placement 640 539 18.7%
12 ClickSoftware HR management software 100 87 14.9%
13 瀚纳仕(HAYS) Headhunting & RPO 5,794 5,222 10.9%
14 前程无忧(www.51job.com) Online recruitment 240 218 9.9%
15 华德士(ROBERT WALTERS) Headhunting & RPO 900 820 9.8%
16 IMPELLAM GROUP HR service outsourcing 1,920 1,757 9.3%
17 hydrogen Headhunting & RPO 265 242 9.3%
18 Insperity HR service outsourcing 2,159 1,976 9.2%
19 Dice Holdings Online recruitment 195 179 9.1%
20 罗致恒富(Robert Half) Talent dispatch/lease/placement 4,111 3,777 8.8%
21 sthree Headhunting & RPO 915 842 8.8%
22 克罗诺思(KRONOS) HR management software 870 800 8.8%
23 RECRUIT Headhunting & RPO 10,083 9,409 7.2%
HRoot Global 50 Human Resources Service Providers 2013 (Ranked by Annual Revenue Growth Rate)
22
GLOBAL 50 HUMAN RESOURCES SERVICE PROVIDERS 2013
Rank of annual revenue growth rate
Company Logo Country Main businessTotal revenue in Fiscal 2012
($ million)Total revenue in Fiscal 2011
($ million)Annual revenue growth rate
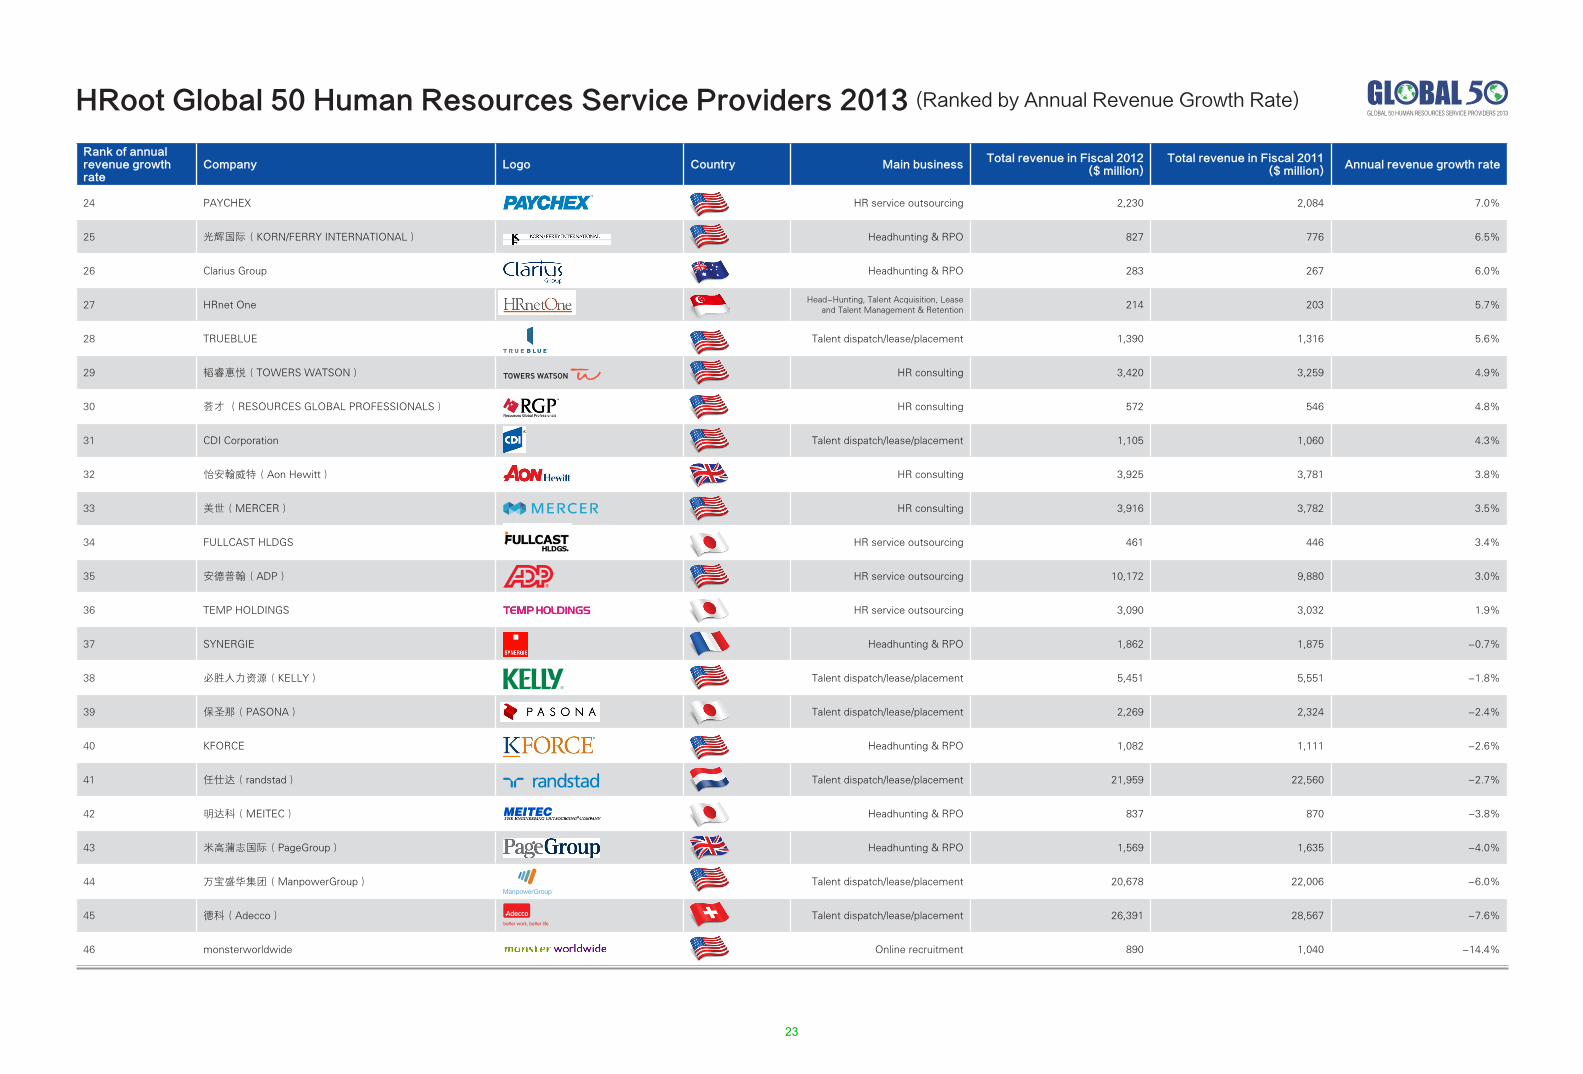
24 PAYCHEX HR service outsourcing 2,230 2,084 7.0%
25 光辉国际(KORN/FERRY INTERNATIONAL) Headhunting & RPO 827 776 6.5%
26 Clarius Group Headhunting & RPO 283 267 6.0%
27 HRnet One Head-Hunting, Talent Acquisition, Lease and Talent Management & Retention 214 203 5.7%
28 TRUEBLUE Talent dispatch/lease/placement 1,390 1,316 5.6%
29 韬睿惠悦(TOWERS WATSON) HR consulting 3,420 3,259 4.9%
30 荟才 (RESOURCES GLOBAL PROFESSIONALS) HR consulting 572 546 4.8%
31 CDI Corporation Talent dispatch/lease/placement 1,105 1,060 4.3%
32 怡安翰威特(Aon Hewitt) HR consulting 3,925 3,781 3.8%
33 美世(MERCER) HR consulting 3,916 3,782 3.5%
34 FULLCAST HLDGS HR service outsourcing 461 446 3.4%
35 安德普翰(ADP) HR service outsourcing 10,172 9,880 3.0%
36 TEMP HOLDINGS HR service outsourcing 3,090 3,032 1.9%
37 SYNERGIE Headhunting & RPO 1,862 1,875 -0.7%
38 必胜人力资源(KELLY) Talent dispatch/lease/placement 5,451 5,551 -1.8%
39 保圣那(PASONA) Talent dispatch/lease/placement 2,269 2,324 -2.4%
40 KFORCE Headhunting & RPO 1,082 1,111 -2.6%
41 任仕达(randstad) Talent dispatch/lease/placement 21,959 22,560 -2.7%
42 明达科(MEITEC) Headhunting & RPO 837 870 -3.8%
43 米高蒲志国际(PageGroup) Headhunting & RPO 1,569 1,635 -4.0%
44 万宝盛华集团(ManpowerGroup) Talent dispatch/lease/placement 20,678 22,006 -6.0%
45 德科(Adecco) Talent dispatch/lease/placement 26,391 28,567 -7.6%
46 monsterworldwide Online recruitment 890 1,040 -14.4%
HRoot Global 50 Human Resources Service Providers 2013 (Ranked by Annual Revenue Growth Rate)
23
GLOBAL 50 HUMAN RESOURCES SERVICE PROVIDERS 2013
Rank of annual revenue growth rate
Company Logo Country Main businessTotal revenue in Fiscal 2012
($ million)Total revenue in Fiscal 2011
($ million)Annual revenue growth rate
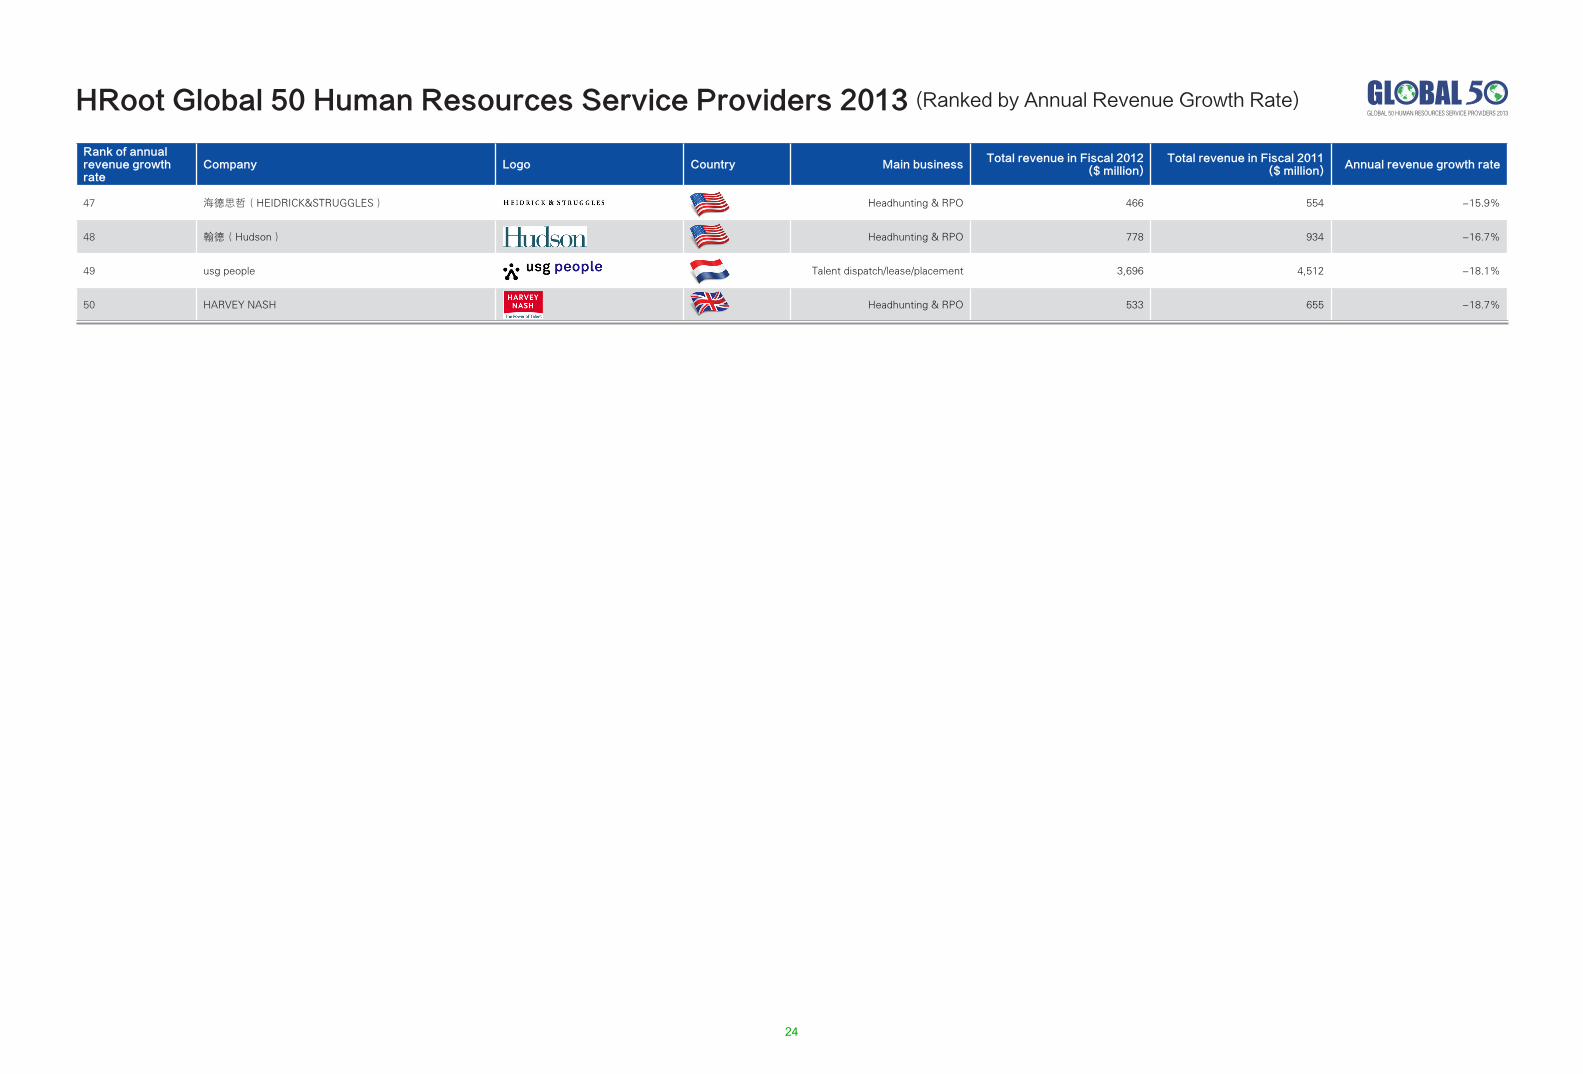
47 海德思哲(HEIDRICK&STRUGGLES) Headhunting & RPO 466 554 -15.9%
48 翰德(Hudson) Headhunting & RPO 778 934 -16.7%
49 usg people Talent dispatch/lease/placement 3,696 4,512 -18.1%
50 HARVEY NASH Headhunting & RPO 533 655 -18.7%
HRoot Global 50 Human Resources Service Providers 2013 (Ranked by Annual Revenue Growth Rate)
24
GLOBAL 50 HUMAN RESOURCES SERVICE PROVIDERS 2013
Rank of growth rate of annual revenue
Company Logo Country Main businessTotal revenue in Fiscal 2012
($ million)Total profit in Fiscal 2012
($ million)Operating margin
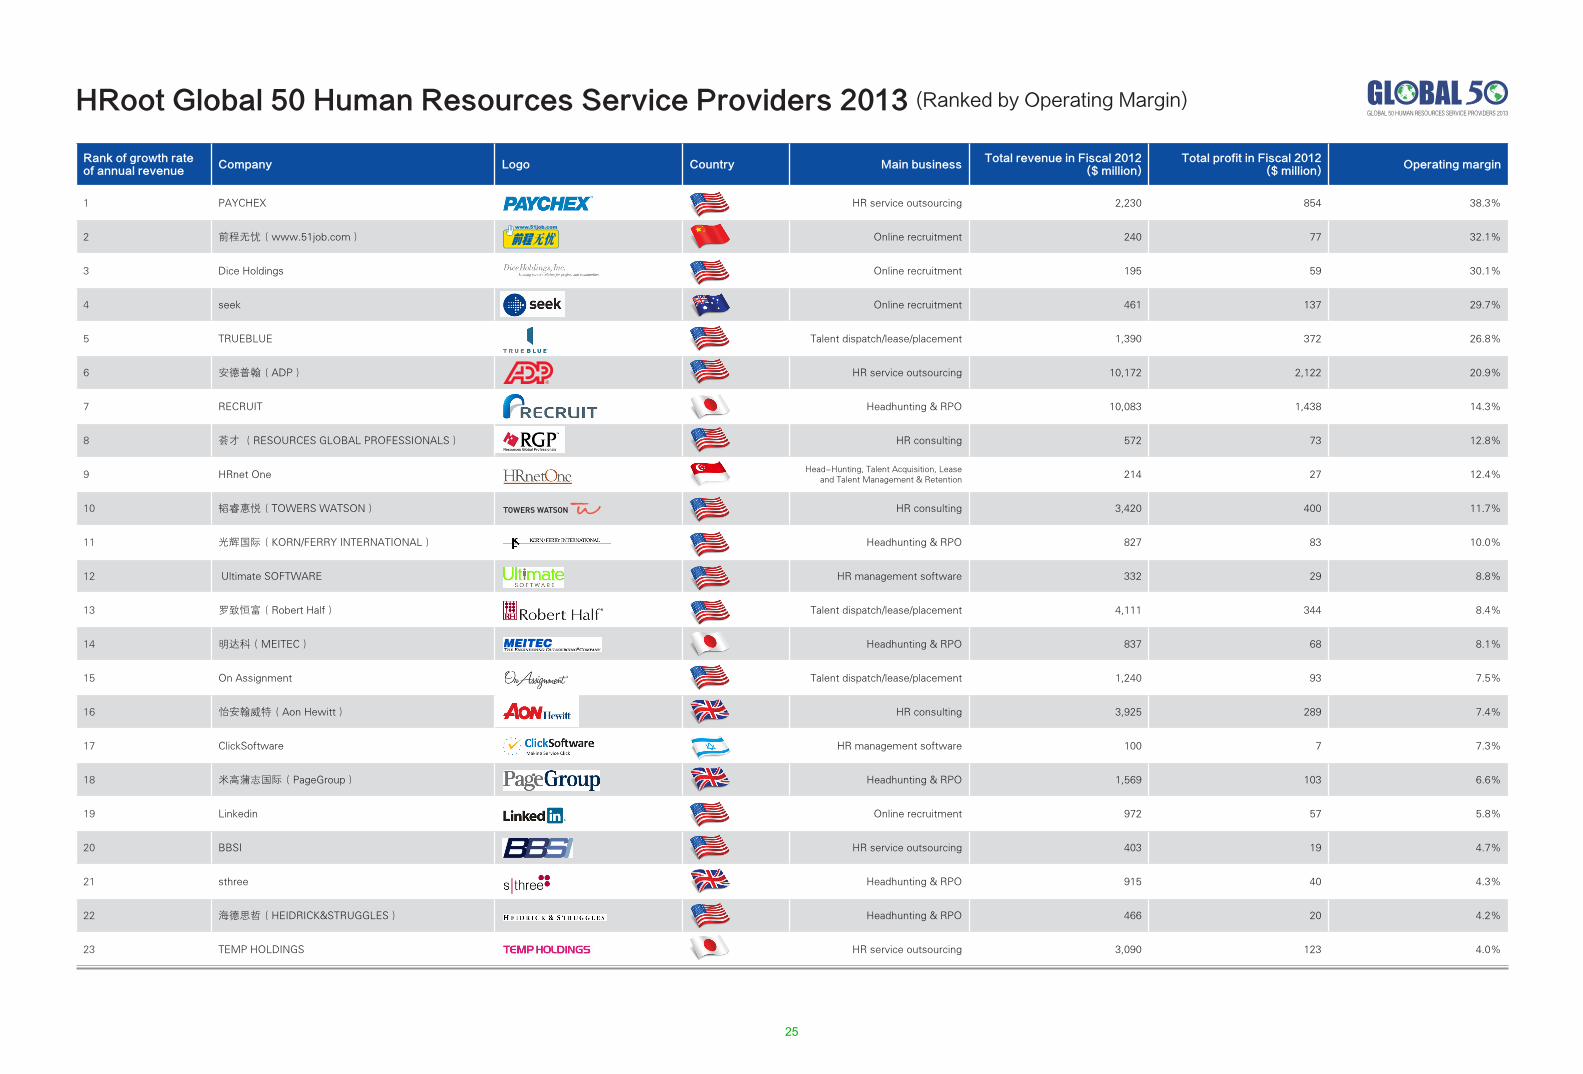
1 PAYCHEX HR service outsourcing 2,230 854 38.3%
2 前程无忧(www.51job.com) Online recruitment 240 77 32.1%
3 Dice Holdings Online recruitment 195 59 30.1%
4 seek Online recruitment 461 137 29.7%
5 TRUEBLUE Talent dispatch/lease/placement 1,390 372 26.8%
6 安德普翰(ADP) HR service outsourcing 10,172 2,122 20.9%
7 RECRUIT Headhunting & RPO 10,083 1,438 14.3%
8 荟才 (RESOURCES GLOBAL PROFESSIONALS) HR consulting 572 73 12.8%
9 HRnet One Head-Hunting, Talent Acquisition, Lease and Talent Management & Retention 214 27 12.4%
10 韬睿惠悦(TOWERS WATSON) HR consulting 3,420 400 11.7%
11 光辉国际(KORN/FERRY INTERNATIONAL) Headhunting & RPO 827 83 10.0%
12 Ultimate SOFTWARE HR management software 332 29 8.8%
13 罗致恒富(Robert Half) Talent dispatch/lease/placement 4,111 344 8.4%
14 明达科(MEITEC) Headhunting & RPO 837 68 8.1%
15 On Assignment Talent dispatch/lease/placement 1,240 93 7.5%
16 怡安翰威特(Aon Hewitt) HR consulting 3,925 289 7.4%
17 ClickSoftware HR management software 100 7 7.3%
18 米高蒲志国际(PageGroup) Headhunting & RPO 1,569 103 6.6%
19 Linkedin Online recruitment 972 57 5.8%
20 BBSI HR service outsourcing 403 19 4.7%
21 sthree Headhunting & RPO 915 40 4.3%
22 海德思哲(HEIDRICK&STRUGGLES) Headhunting & RPO 466 20 4.2%
23 TEMP HOLDINGS HR service outsourcing 3,090 123 4.0%
HRoot Global 50 Human Resources Service Providers 2013 (Ranked by Operating Margin)
25
GLOBAL 50 HUMAN RESOURCES SERVICE PROVIDERS 2013
2013年排名 公司名称 LOGO 国别 主营业务 2012财年总收入(百万美元) 2012财年营业利润(百万美元) 2012财年营业利润率
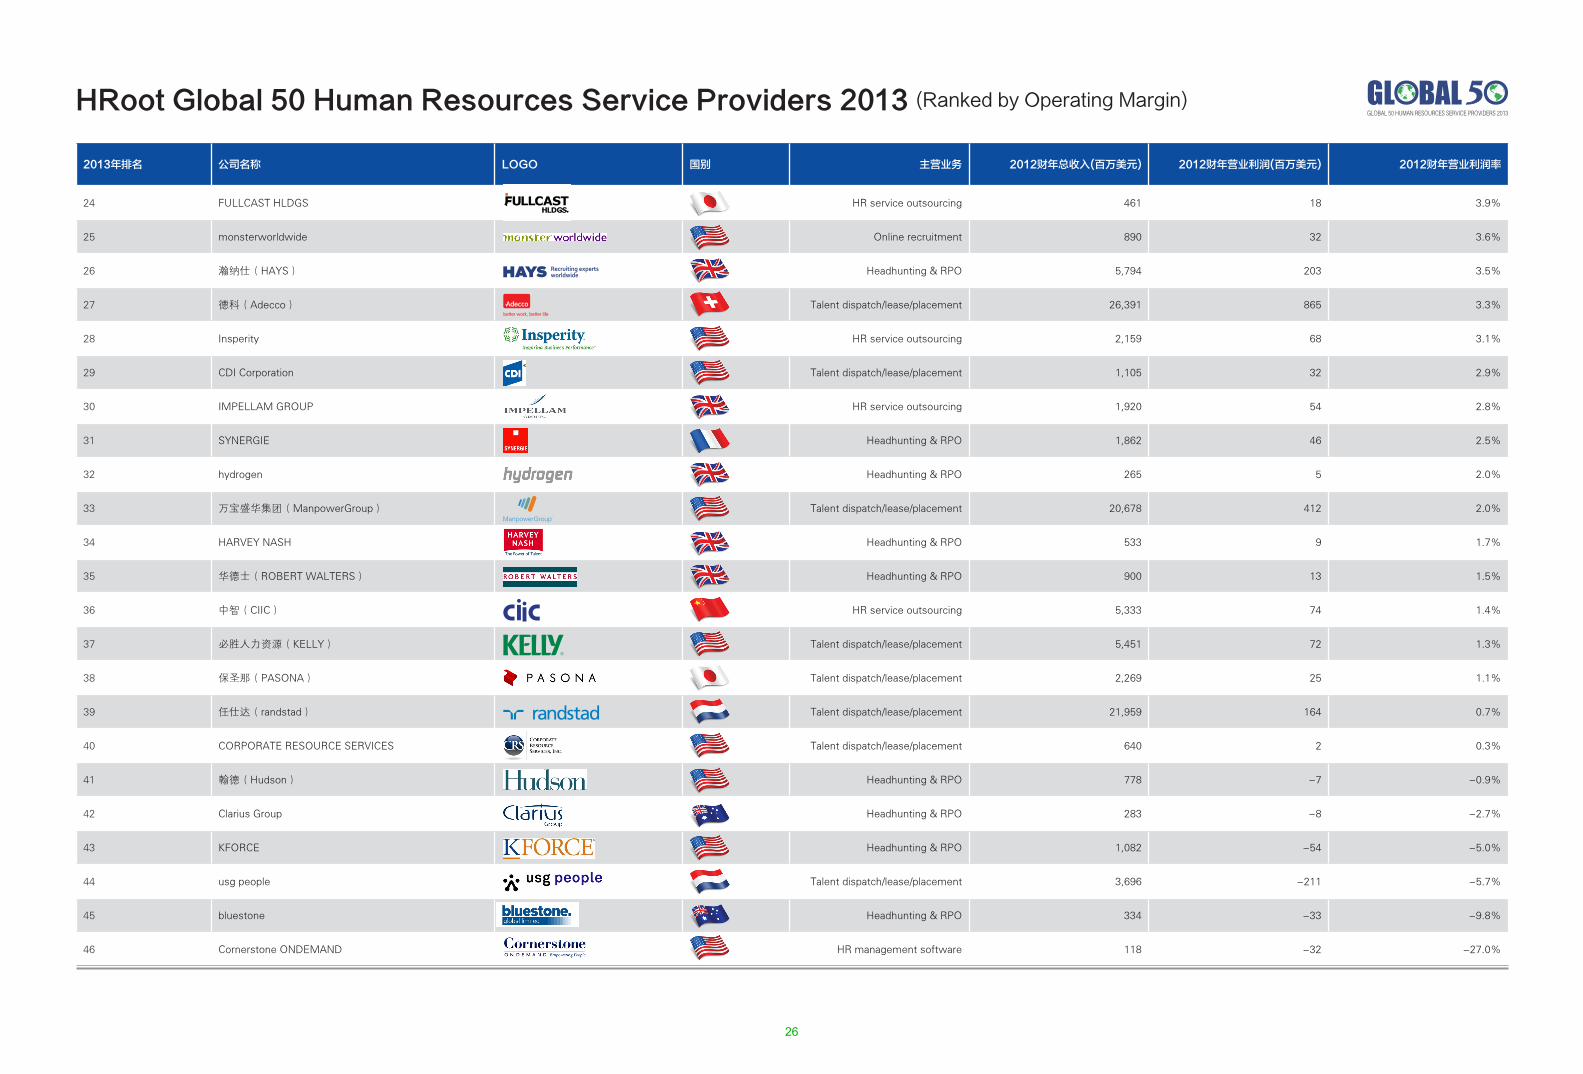
24 FULLCAST HLDGS HR service outsourcing 461 18 3.9%
25 monsterworldwide Online recruitment 890 32 3.6%
26 瀚纳仕(HAYS) Headhunting & RPO 5,794 203 3.5%
27 德科(Adecco) Talent dispatch/lease/placement 26,391 865 3.3%
28 Insperity HR service outsourcing 2,159 68 3.1%
29 CDI Corporation Talent dispatch/lease/placement 1,105 32 2.9%
30 IMPELLAM GROUP HR service outsourcing 1,920 54 2.8%
31 SYNERGIE Headhunting & RPO 1,862 46 2.5%
32 hydrogen Headhunting & RPO 265 5 2.0%
33 万宝盛华集团(ManpowerGroup) Talent dispatch/lease/placement 20,678 412 2.0%
34 HARVEY NASH Headhunting & RPO 533 9 1.7%
35 华德士(ROBERT WALTERS) Headhunting & RPO 900 13 1.5%
36 中智(CIIC) HR service outsourcing 5,333 74 1.4%
37 必胜人力资源(KELLY) Talent dispatch/lease/placement 5,451 72 1.3%
38 保圣那(PASONA) Talent dispatch/lease/placement 2,269 25 1.1%
39 任仕达(randstad) Talent dispatch/lease/placement 21,959 164 0.7%
40 CORPORATE RESOURCE SERVICES Talent dispatch/lease/placement 640 2 0.3%
41 翰德(Hudson) Headhunting & RPO 778 -7 -0.9%
42 Clarius Group Headhunting & RPO 283 -8 -2.7%
43 KFORCE Headhunting & RPO 1,082 -54 -5.0%
44 usg people Talent dispatch/lease/placement 3,696 -211 -5.7%
45 bluestone Headhunting & RPO 334 -33 -9.8%
46 Cornerstone ONDEMAND HR management software 118 -32 -27.0%
HRoot Global 50 Human Resources Service Providers 2013 (Ranked by Operating Margin)
26
GLOBAL 50 HUMAN RESOURCES SERVICE PROVIDERS 2013
2013年排名 公司名称 LOGO 国别 主营业务 2012财年总收入(百万美元) 2012财年营业利润(百万美元) 2012财年营业利润率
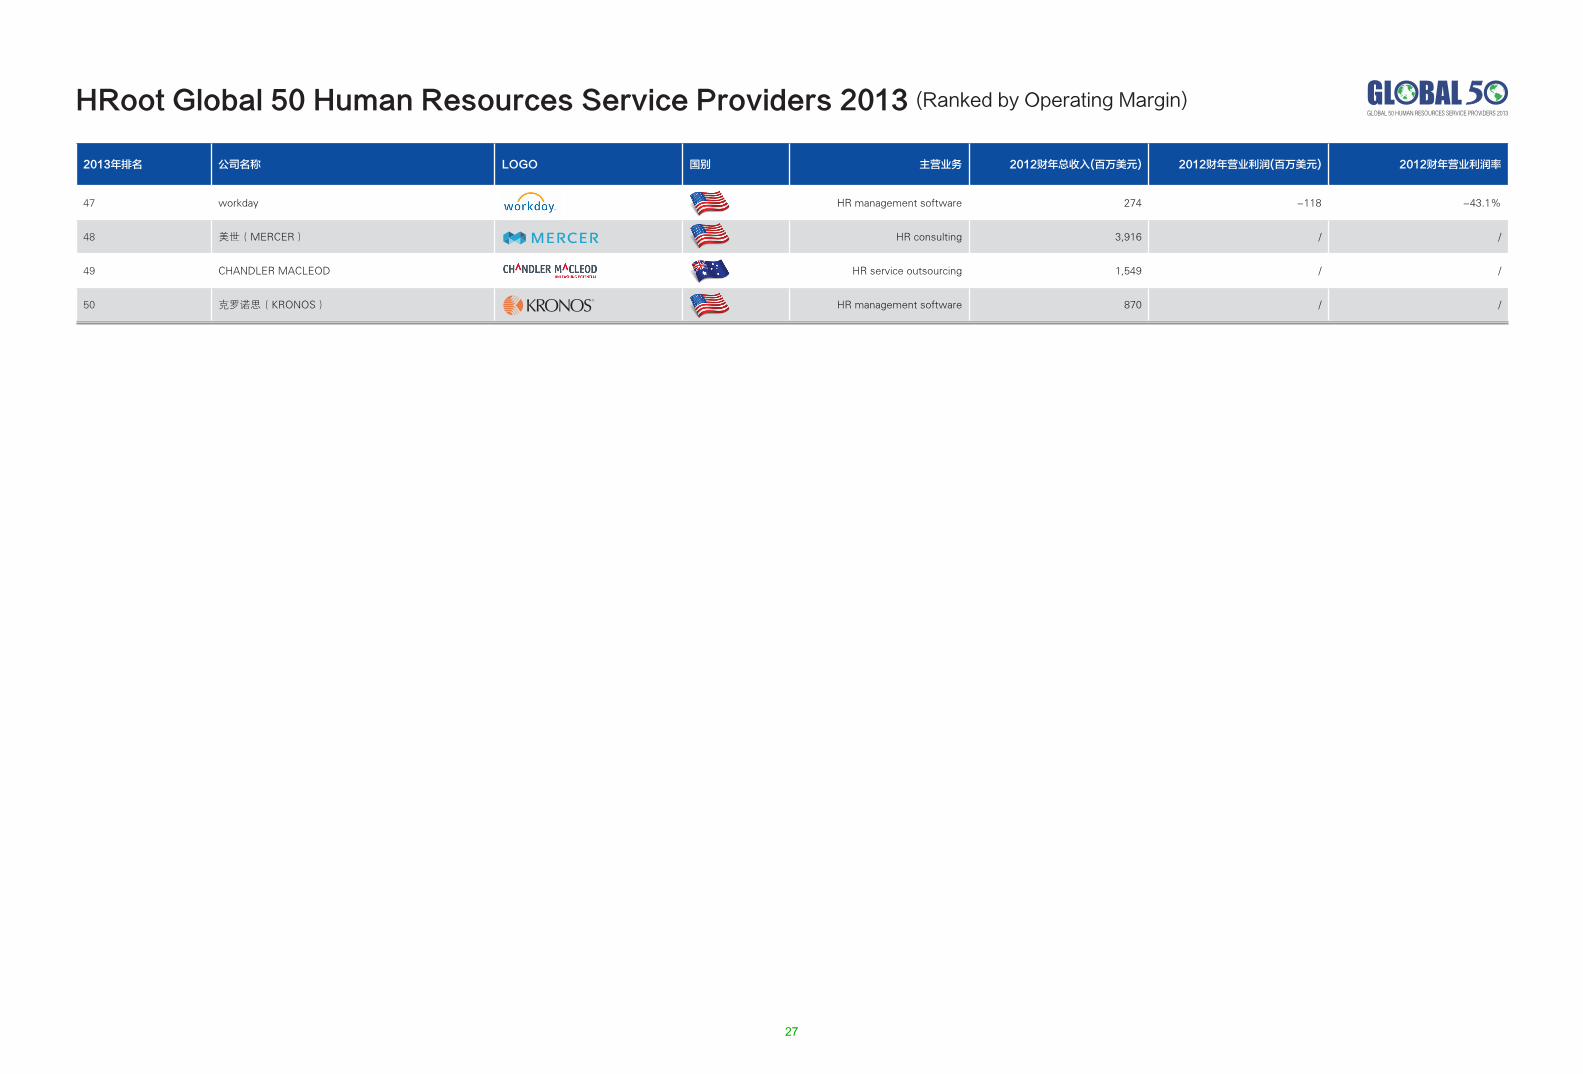
47 workday HR management software 274 -118 -43.1%
48 美世(MERCER) HR consulting 3,916 / /
49 CHANDLER MACLEOD HR service outsourcing 1,549 / /
50 克罗诺思(KRONOS) HR management software 870 / /
HRoot Global 50 Human Resources Service Providers 2013 (Ranked by Operating Margin)
27
GLOBAL 50 HUMAN RESOURCES SERVICE PROVIDERS 2013
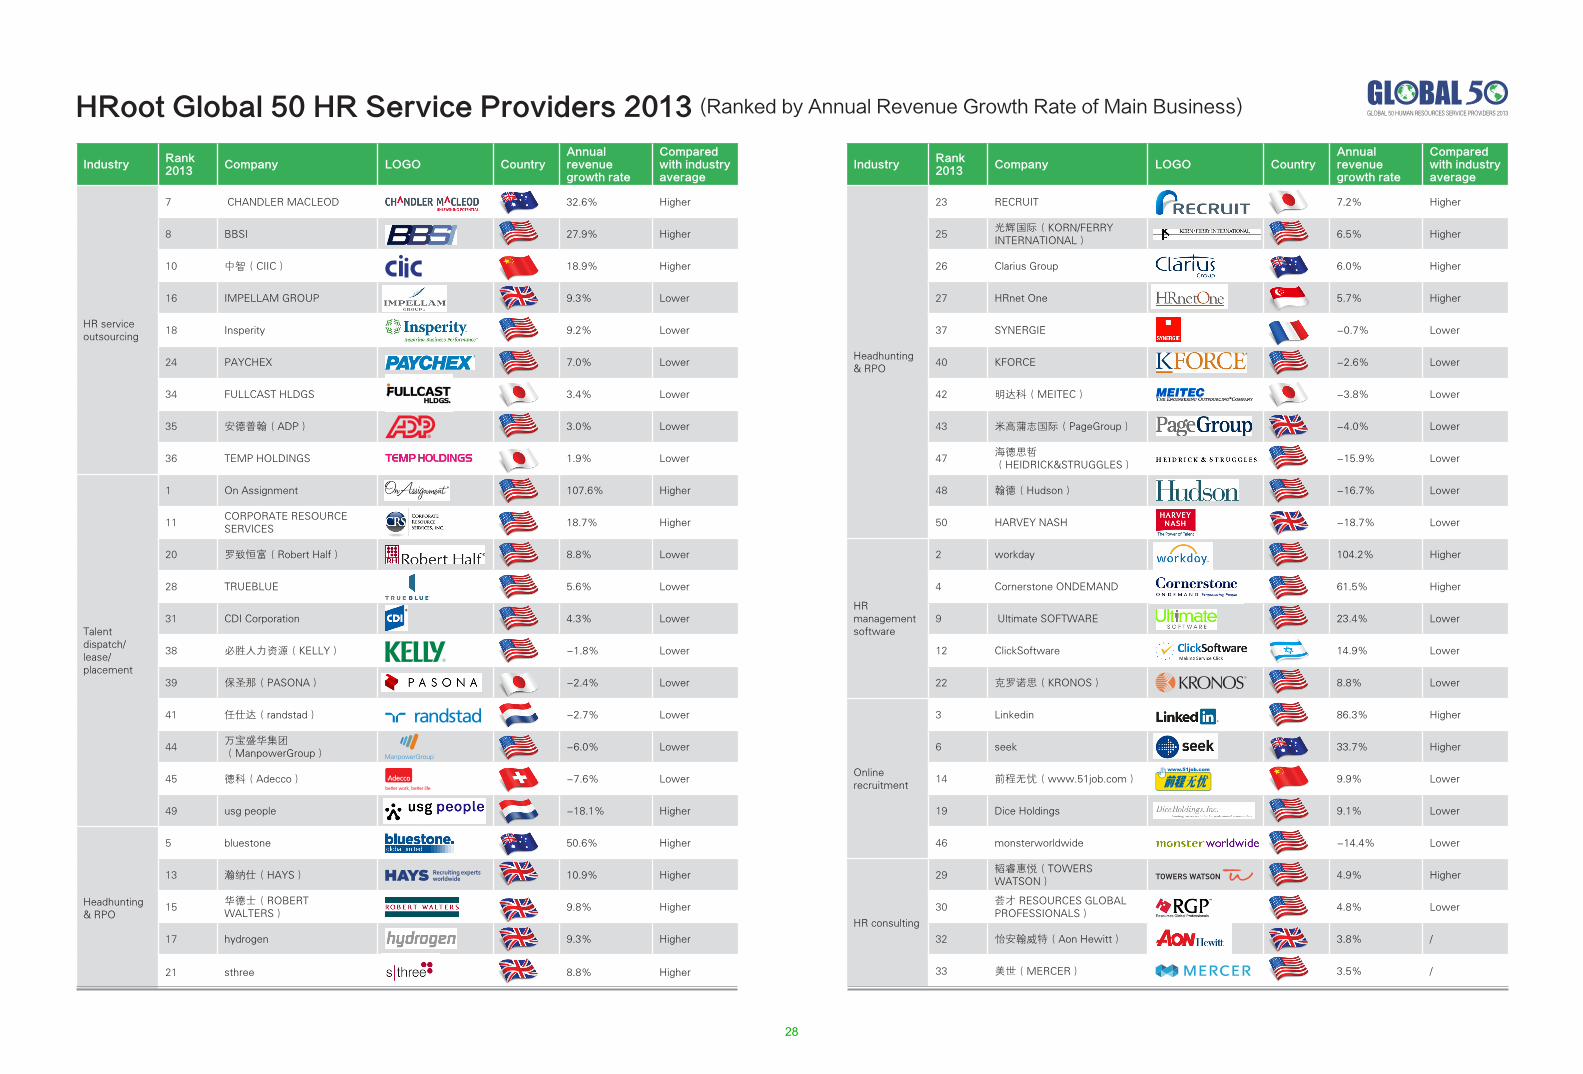
IndustryRank 2013
Company LOGO CountryAnnual revenue growth rate
Compared with industry average
Headhunting & RPO
23 RECRUIT 7.2% Higher
25光辉国际(KORN/FERRY INTERNATIONAL)
6.5% Higher
26 Clarius Group 6.0% Higher
27 HRnet One 5.7% Higher
37 SYNERGIE -0.7% Lower
40 KFORCE -2.6% Lower
42 明达科(MEITEC) -3.8% Lower
43 米高蒲志国际(PageGroup) -4.0% Lower
47海德思哲(HEIDRICK&STRUGGLES)
-15.9% Lower
48 翰德(Hudson) -16.7% Lower
50 HARVEY NASH -18.7% Lower
HR management software
2 workday 104.2% Higher
4 Cornerstone ONDEMAND 61.5% Higher
9 Ultimate SOFTWARE 23.4% Lower
12 ClickSoftware 14.9% Lower
22 克罗诺思(KRONOS) 8.8% Lower
Online recruitment
3 Linkedin 86.3% Higher
6 seek 33.7% Higher
14 前程无忧(www.51job.com) 9.9% Lower
19 Dice Holdings 9.1% Lower
46 monsterworldwide -14.4% Lower
HR consulting
29韬睿惠悦(TOWERS WATSON)
4.9% Higher
30荟才 RESOURCES GLOBAL PROFESSIONALS)
4.8% Lower
32 怡安翰威特(Aon Hewitt) 3.8% /
33 美世(MERCER) 3.5% /
IndustryRank 2013
Company LOGO CountryAnnual revenue growth rate
Compared with industry average
HR service outsourcing
7 CHANDLER MACLEOD 32.6% Higher
8 BBSI 27.9% Higher
10 中智(CIIC) 18.9% Higher
16 IMPELLAM GROUP 9.3% Lower
18 Insperity 9.2% Lower
24 PAYCHEX 7.0% Lower
34 FULLCAST HLDGS 3.4% Lower
35 安德普翰(ADP) 3.0% Lower
36 TEMP HOLDINGS 1.9% Lower
Talent dispatch/lease/placement
1 On Assignment 107.6% Higher
11CORPORATE RESOURCE SERVICES
18.7% Higher
20 罗致恒富(Robert Half) 8.8% Lower
28 TRUEBLUE 5.6% Lower
31 CDI Corporation 4.3% Lower
38 必胜人力资源(KELLY) -1.8% Lower
39 保圣那(PASONA) -2.4% Lower
41 任仕达(randstad) -2.7% Lower
44万宝盛华集团(ManpowerGroup)
-6.0% Lower
45 德科(Adecco) -7.6% Lower
49 usg people -18.1% Higher
Headhunting & RPO
5 bluestone 50.6% Higher
13 瀚纳仕(HAYS) 10.9% Higher
15华德士(ROBERT WALTERS)
9.8% Higher
17 hydrogen 9.3% Higher
21 sthree 8.8% Higher
HRoot Global 50 HR Service Providers 2013 (Ranked by Annual Revenue Growth Rate of Main Business)
28
GLOBAL 50 HUMAN RESOURCES SERVICE PROVIDERS 2013
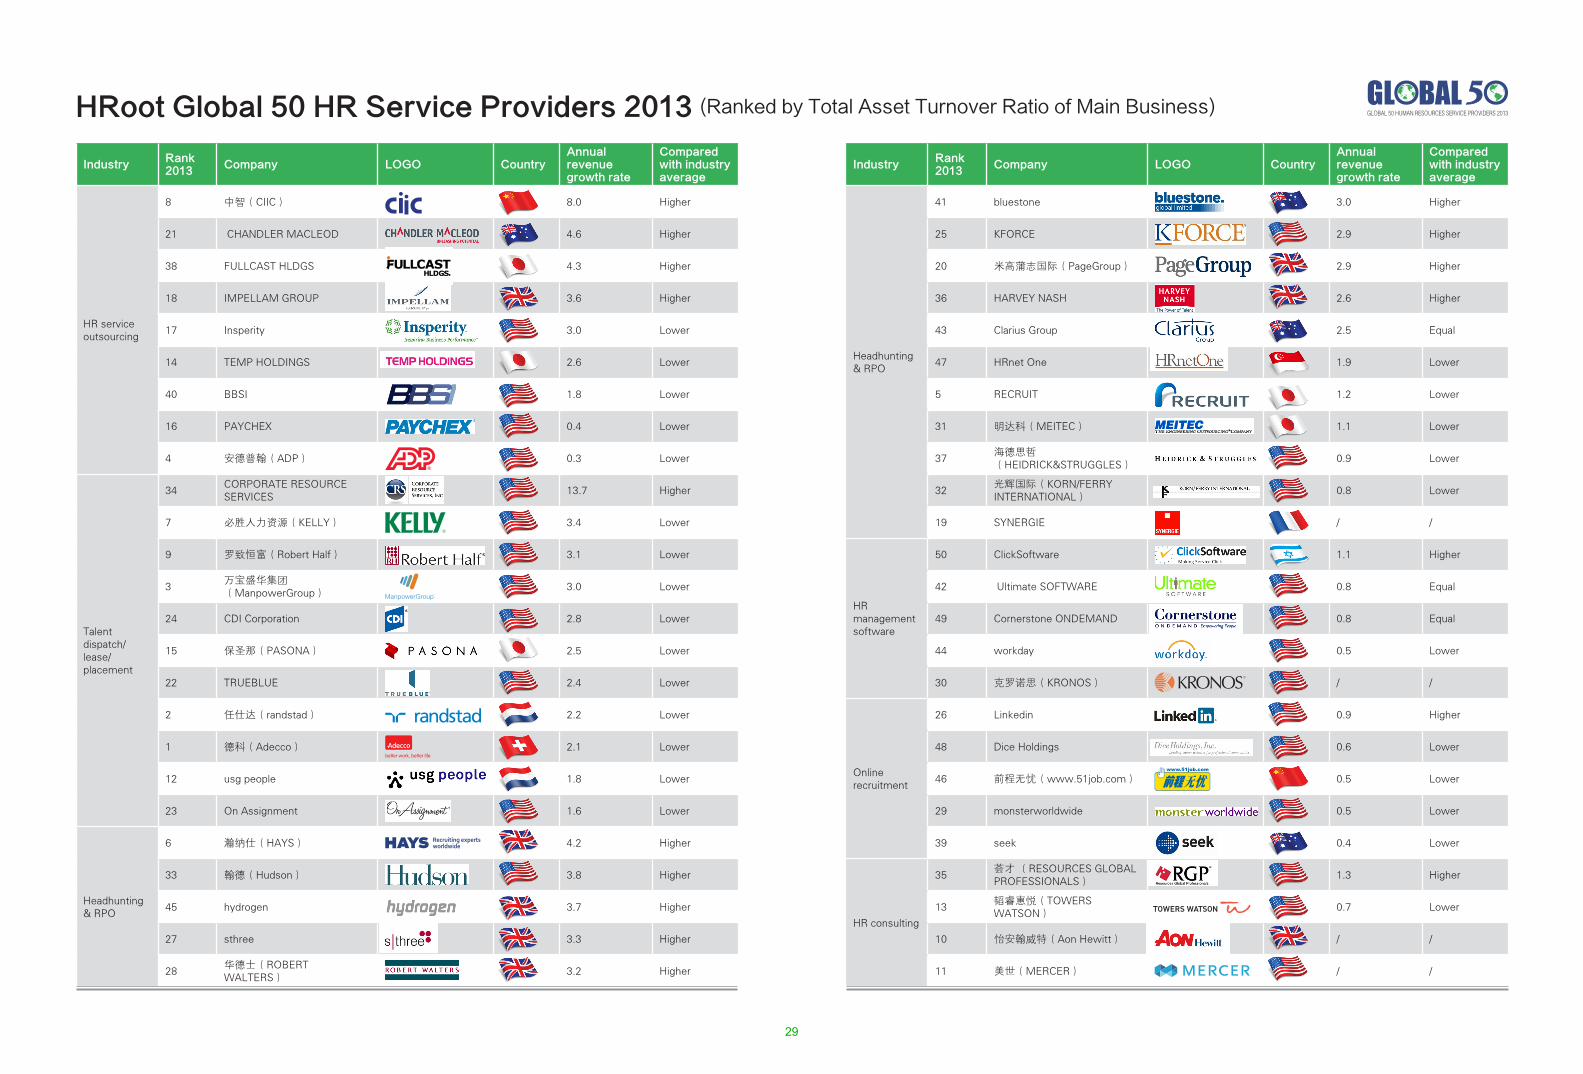
IndustryRank 2013
Company LOGO CountryAnnual revenue growth rate
Compared with industry average
Headhunting & RPO
41 bluestone 3.0 Higher
25 KFORCE 2.9 Higher
20 米高蒲志国际(PageGroup) 2.9 Higher
36 HARVEY NASH 2.6 Higher
43 Clarius Group 2.5 Equal
47 HRnet One 1.9 Lower
5 RECRUIT 1.2 Lower
31 明达科(MEITEC) 1.1 Lower
37海德思哲(HEIDRICK&STRUGGLES)
0.9 Lower
32光辉国际(KORN/FERRY INTERNATIONAL)
0.8 Lower
19 SYNERGIE / /
HR management software
50 ClickSoftware 1.1 Higher
42 Ultimate SOFTWARE 0.8 Equal
49 Cornerstone ONDEMAND 0.8 Equal
44 workday 0.5 Lower
30 克罗诺思(KRONOS) / /
Online recruitment
26 Linkedin 0.9 Higher
48 Dice Holdings 0.6 Lower
46 前程无忧(www.51job.com) 0.5 Lower
29 monsterworldwide 0.5 Lower
39 seek 0.4 Lower
HR consulting
35荟才 (RESOURCES GLOBAL PROFESSIONALS)
1.3 Higher
13韬睿惠悦(TOWERS WATSON)
0.7 Lower
10 怡安翰威特(Aon Hewitt) / /
11 美世(MERCER) / /
IndustryRank 2013
Company LOGO CountryAnnual revenue growth rate
Compared with industry average
HR service outsourcing
8 中智(CIIC) 8.0 Higher
21 CHANDLER MACLEOD 4.6 Higher
38 FULLCAST HLDGS 4.3 Higher
18 IMPELLAM GROUP 3.6 Higher
17 Insperity 3.0 Lower
14 TEMP HOLDINGS 2.6 Lower
40 BBSI 1.8 Lower
16 PAYCHEX 0.4 Lower
4 安德普翰(ADP) 0.3 Lower
Talent dispatch/lease/placement
34CORPORATE RESOURCE SERVICES
13.7 Higher
7 必胜人力资源(KELLY) 3.4 Lower
9 罗致恒富(Robert Half) 3.1 Lower
3万宝盛华集团(ManpowerGroup)
3.0 Lower
24 CDI Corporation 2.8 Lower
15 保圣那(PASONA) 2.5 Lower
22 TRUEBLUE 2.4 Lower
2 任仕达(randstad) 2.2 Lower
1 德科(Adecco) 2.1 Lower
12 usg people 1.8 Lower
23 On Assignment 1.6 Lower
Headhunting & RPO
6 瀚纳仕(HAYS) 4.2 Higher
33 翰德(Hudson) 3.8 Higher
45 hydrogen 3.7 Higher
27 sthree 3.3 Higher
28华德士(ROBERT WALTERS)
3.2 Higher
HRoot Global 50 HR Service Providers 2013 (Ranked by Total Asset Turnover Ratio of Main Business)
29
GLOBAL 50 HUMAN RESOURCES SERVICE PROVIDERS 2013
IndustryRank 2013
Company LOGO CountryAnnual revenue growth rate
Compared with industry average
Headhunting & RPO
33 翰德(Hudson) 6.5 Lower
45 hydrogen 6.2 Lower
31 明达科(MEITEC) 6.1 Lower
20 米高蒲志国际(PageGroup) 5.3 Lower
27 sthree 5.2 Lower
43 Clarius Group 5.0 Lower
28华德士(ROBERT WALTERS)
4.7 Lower
36 HARVEY NASH 4.7 Lower
5 RECRUIT 2.0 Lower
HRnet One / /
19 SYNERGIE / /
HR management software
42 Ultimate SOFTWARE 5.2 Higher
44 workday 4.5 Higher
50 ClickSoftware 4.2 Equal
49 Cornerstone ONDEMAND 2.9 Lower
30 克罗诺思(KRONOS) / /
Online recruitment
46 前程无忧(www.51job.com) 31.3 Higher
39 seek 8.2 Lower
48 Dice Holdings 7.9 Lower
26 Linkedin 6.2 Lower
29 monsterworldwide 2.6 Lower
HR consulting
35荟才(RESOURCES GLOBAL PROFESSIONALS)
6.5 Higher
13韬睿惠悦(TOWERS WATSON)
4.1 Lower
10 怡安翰威特(Aon Hewitt) / /
美世(MERCER) / /
IndustryRank 2013
Company LOGO CountryAnnual revenue growth rate
Compared with industry average
HR service outsourcing
8 中智(CIIC) 121.6 Higher
38 FULLCAST HLDGS 16.9 Lower
16 PAYCHEX 14.7 Lower
17 Insperity 11.9 Lower
21 CHANDLER MACLEOD 9.2 Lower
4 安德普翰(ADP) 7.4 Lower
40 BBSI 7.0 Lower
18 IMPELLAM GROUP 5.8 Lower
14 TEMP HOLDINGS / /
Talent dispatch/lease/placement
34CORPORATE RESOURCE SERVICES
93.5 Higher
22 TRUEBLUE 8.7 Lower
9 罗致恒富(Robert Half) 8.2 Lower
23 On Assignment 7.4 Lower
12 usg people 6.4 Lower
7 必胜人力资源(KELLY) 5.6 Lower
1 德科(Adecco) 5.5 Lower
2 任仕达(randstad) 5.4 Lower
24 CDI Corporation 4.9 Lower
3万宝盛华集团(ManpowerGroup)
4.9 Lower
15 保圣那(PASONA) / /
Headhunting & RPO
32光辉国际(KORN/FERRY INTERNATIONAL)
11.8 Higher
41 bluestone 9.1 Higher
37海德思哲(HEIDRICK&STRUGGLES)
8.9 Higher
6 瀚纳仕(HAYS) 6.8 Lower
25 KFORCE 6.6 Lower
HRoot Global 50 HR Service Providers 2013 (Ranked by Accounts Receivable Turnover Ratio of Main Business)
30
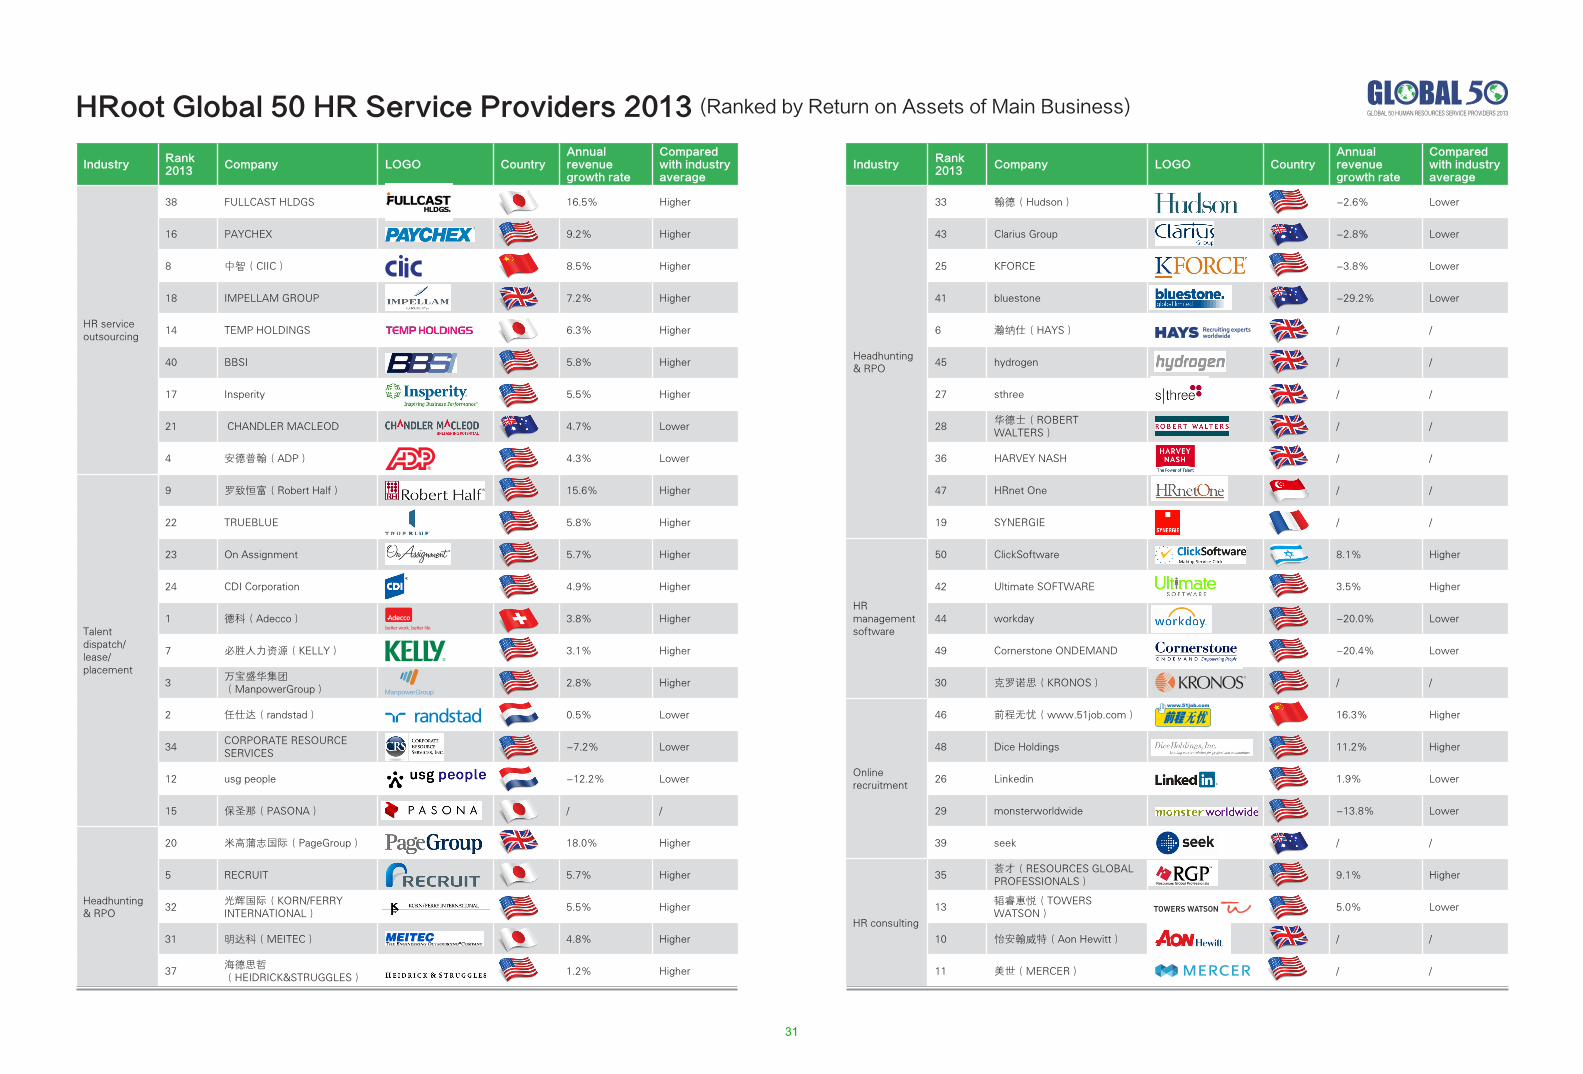
GLOBAL 50 HUMAN RESOURCES SERVICE PROVIDERS 2013
IndustryRank 2013
Company LOGO CountryAnnual revenue growth rate
Compared with industry average
Headhunting & RPO
33 翰德(Hudson) -2.6% Lower
43 Clarius Group -2.8% Lower
25 KFORCE -3.8% Lower
41 bluestone -29.2% Lower
6 瀚纳仕(HAYS) / /
45 hydrogen / /
27 sthree / /
28华德士(ROBERT WALTERS)
/ /
36 HARVEY NASH / /
47 HRnet One / /
19 SYNERGIE / /
HR management software
50 ClickSoftware 8.1% Higher
42 Ultimate SOFTWARE 3.5% Higher
44 workday -20.0% Lower
49 Cornerstone ONDEMAND -20.4% Lower
30 克罗诺思(KRONOS) / /
Online recruitment
46 前程无忧(www.51job.com) 16.3% Higher
48 Dice Holdings 11.2% Higher
26 Linkedin 1.9% Lower
29 monsterworldwide -13.8% Lower
39 seek / /
HR consulting
35荟才(RESOURCES GLOBAL PROFESSIONALS)
9.1% Higher
13韬睿惠悦(TOWERS WATSON)
5.0% Lower
10 怡安翰威特(Aon Hewitt) / /
11 美世(MERCER) / /
IndustryRank 2013
Company LOGO CountryAnnual revenue growth rate
Compared with industry average
HR service outsourcing
38 FULLCAST HLDGS 16.5% Higher
16 PAYCHEX 9.2% Higher
8 中智(CIIC) 8.5% Higher
18 IMPELLAM GROUP 7.2% Higher
14 TEMP HOLDINGS 6.3% Higher
40 BBSI 5.8% Higher
17 Insperity 5.5% Higher
21 CHANDLER MACLEOD 4.7% Lower
4 安德普翰(ADP) 4.3% Lower
Talent dispatch/lease/placement
9 罗致恒富(Robert Half) 15.6% Higher
22 TRUEBLUE 5.8% Higher
23 On Assignment 5.7% Higher
24 CDI Corporation 4.9% Higher
1 德科(Adecco) 3.8% Higher
7 必胜人力资源(KELLY) 3.1% Higher
3万宝盛华集团(ManpowerGroup)
2.8% Higher
2 任仕达(randstad) 0.5% Lower
34CORPORATE RESOURCE SERVICES
-7.2% Lower
12 usg people -12.2% Lower
15 保圣那(PASONA) / /
Headhunting & RPO
20 米高蒲志国际(PageGroup) 18.0% Higher
5 RECRUIT 5.7% Higher
32光辉国际(KORN/FERRY INTERNATIONAL)
5.5% Higher
31 明达科(MEITEC) 4.8% Higher
37海德思哲(HEIDRICK&STRUGGLES)
1.2% Higher
HRoot Global 50 HR Service Providers 2013 (Ranked by Return on Assets of Main Business)
31
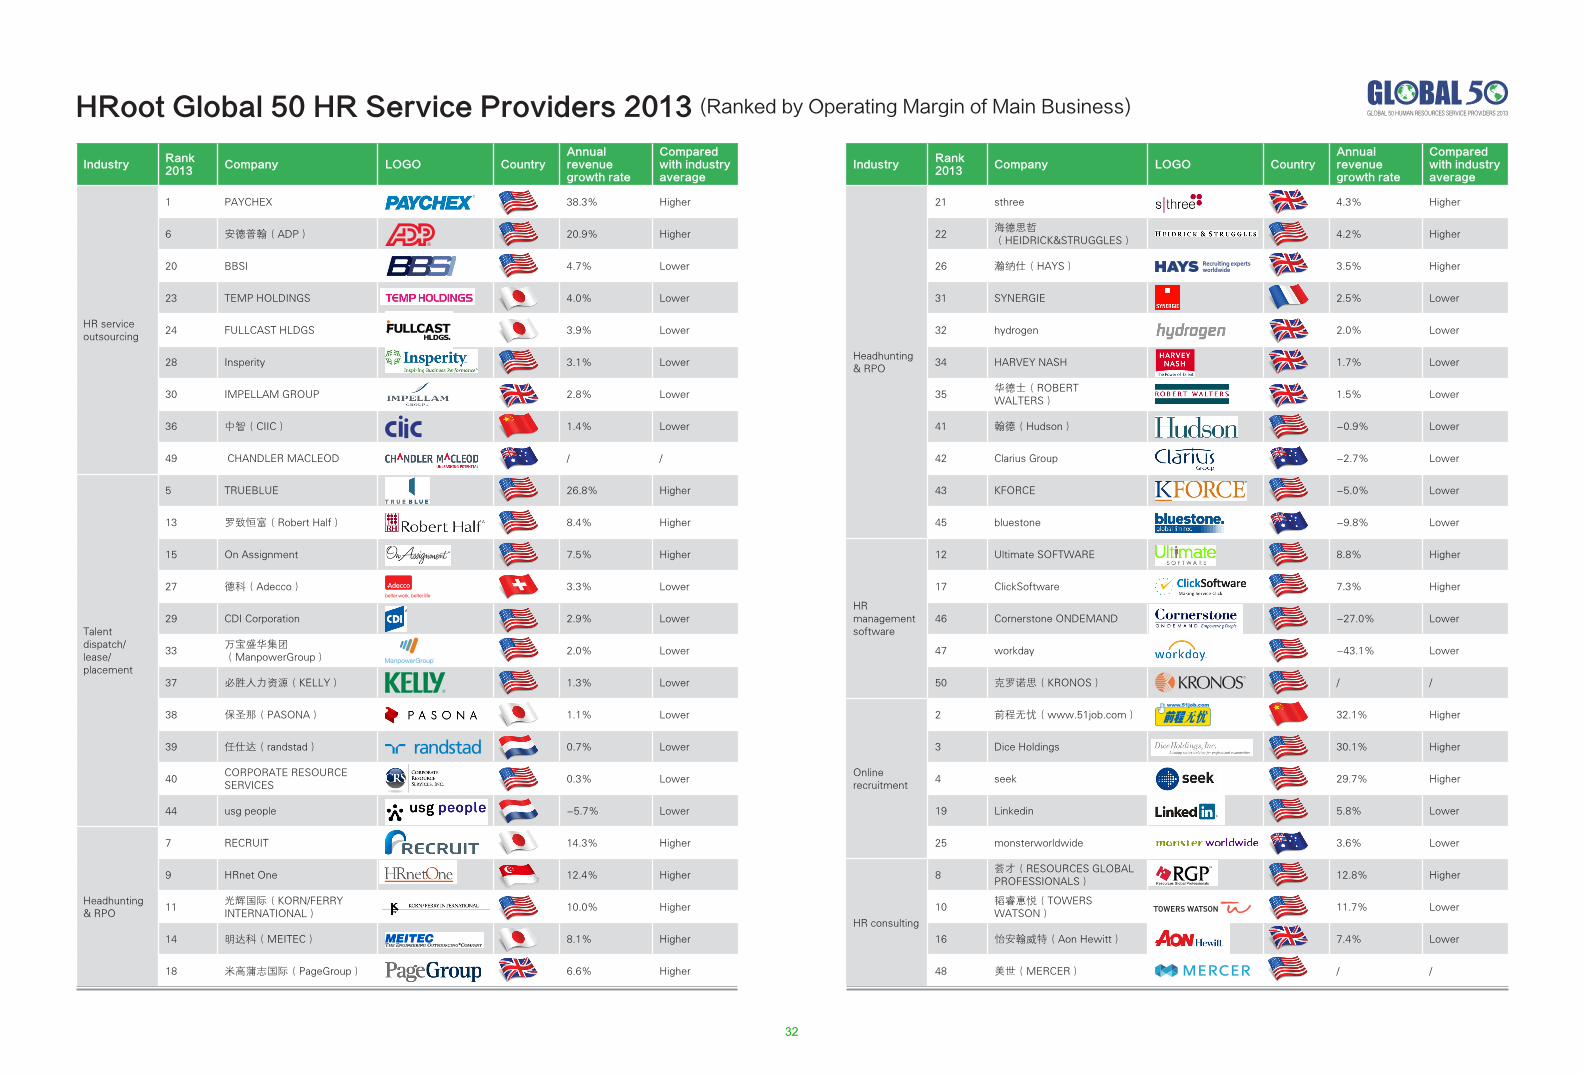
GLOBAL 50 HUMAN RESOURCES SERVICE PROVIDERS 2013
IndustryRank 2013
Company LOGO CountryAnnual revenue growth rate
Compared with industry average
Headhunting & RPO
21 sthree 4.3% Higher
22海德思哲(HEIDRICK&STRUGGLES)
4.2% Higher
26 瀚纳仕(HAYS) 3.5% Higher
31 SYNERGIE 2.5% Lower
32 hydrogen 2.0% Lower
34 HARVEY NASH 1.7% Lower
35华德士(ROBERT WALTERS)
1.5% Lower
41 翰德(Hudson) -0.9% Lower
42 Clarius Group -2.7% Lower
43 KFORCE -5.0% Lower
45 bluestone -9.8% Lower
HR management software
12 Ultimate SOFTWARE 8.8% Higher
17 ClickSoftware 7.3% Higher
46 Cornerstone ONDEMAND -27.0% Lower
47 workday -43.1% Lower
50 克罗诺思(KRONOS) / /
Online recruitment
2 前程无忧(www.51job.com) 32.1% Higher
3 Dice Holdings 30.1% Higher
4 seek 29.7% Higher
19 Linkedin 5.8% Lower
25 monsterworldwide 3.6% Lower
HR consulting
8荟才(RESOURCES GLOBAL PROFESSIONALS)
12.8% Higher
10韬睿惠悦(TOWERS WATSON)
11.7% Lower
16 怡安翰威特(Aon Hewitt) 7.4% Lower
48 美世(MERCER) / /
IndustryRank 2013
Company LOGO CountryAnnual revenue growth rate
Compared with industry average
HR service outsourcing
1 PAYCHEX 38.3% Higher
6 安德普翰(ADP) 20.9% Higher
20 BBSI 4.7% Lower
23 TEMP HOLDINGS 4.0% Lower
24 FULLCAST HLDGS 3.9% Lower
28 Insperity 3.1% Lower
30 IMPELLAM GROUP 2.8% Lower
36 中智(CIIC) 1.4% Lower
49 CHANDLER MACLEOD / /
Talent dispatch/lease/placement
5 TRUEBLUE 26.8% Higher
13 罗致恒富(Robert Half) 8.4% Higher
15 On Assignment 7.5% Higher
27 德科(Adecco) 3.3% Lower
29 CDI Corporation 2.9% Lower
33万宝盛华集团(ManpowerGroup)
2.0% Lower
37 必胜人力资源(KELLY) 1.3% Lower
38 保圣那(PASONA) 1.1% Lower
39 任仕达(randstad) 0.7% Lower
40CORPORATE RESOURCE SERVICES
0.3% Lower
44 usg people -5.7% Lower
Headhunting & RPO
7 RECRUIT 14.3% Higher
9 HRnet One 12.4% Higher
11光辉国际(KORN/FERRY INTERNATIONAL)
10.0% Higher
14 明达科(MEITEC) 8.1% Higher
18 米高蒲志国际(PageGroup) 6.6% Higher
HRoot Global 50 HR Service Providers 2013 (Ranked by Operating Margin of Main Business)
32
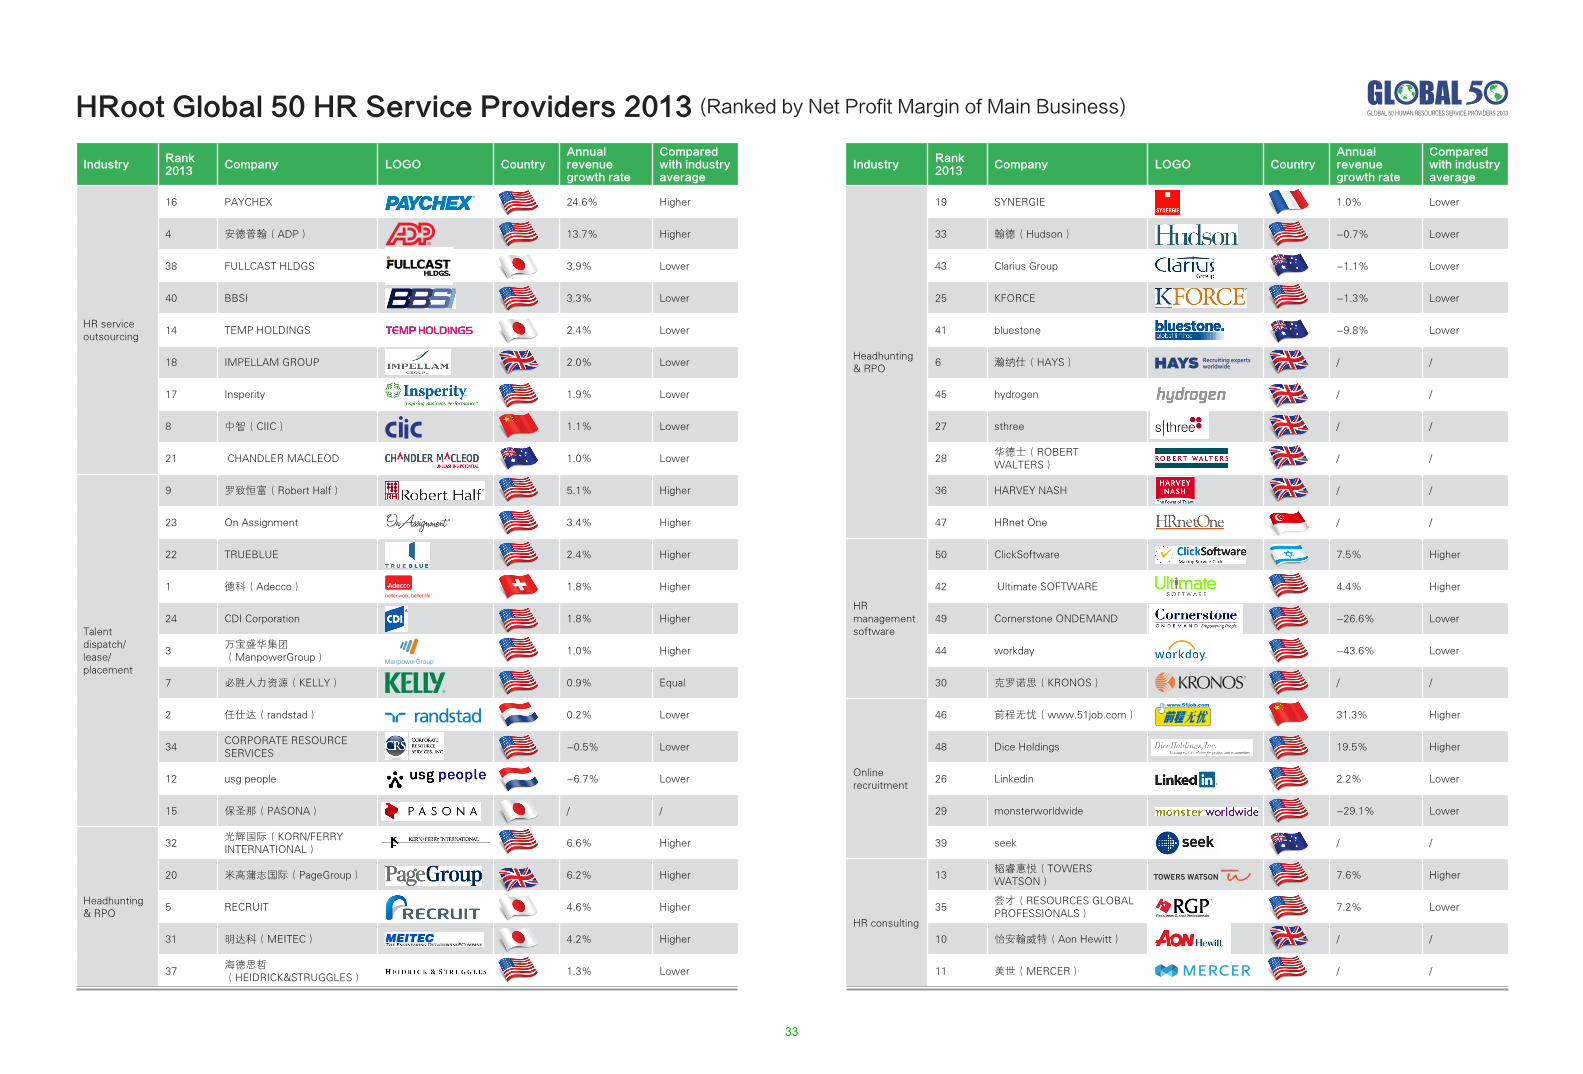
GLOBAL 50 HUMAN RESOURCES SERVICE PROVIDERS 2013
IndustryRank 2013
Company LOGO CountryAnnual revenue growth rate
Compared with industry average
Headhunting & RPO
19 SYNERGIE 1.0% Lower
33 翰德(Hudson) -0.7% Lower
43 Clarius Group -1.1% Lower
25 KFORCE -1.3% Lower
41 bluestone -9.8% Lower
6 瀚纳仕(HAYS) / /
45 hydrogen / /
27 sthree / /
28华德士(ROBERT WALTERS)
/ /
36 HARVEY NASH / /
47 HRnet One / /
HR management software
50 ClickSoftware 7.5% Higher
42 Ultimate SOFTWARE 4.4% Higher
49 Cornerstone ONDEMAND -26.6% Lower
44 workday -43.6% Lower
30 克罗诺思(KRONOS) / /
Online recruitment
46 前程无忧(www.51job.com) 31.3% Higher
48 Dice Holdings 19.5% Higher
26 Linkedin 2.2% Lower
29 monsterworldwide -29.1% Lower
39 seek / /
HR consulting
13韬睿惠悦(TOWERS WATSON)
7.6% Higher
35荟才(RESOURCES GLOBAL PROFESSIONALS)
7.2% Lower
10 怡安翰威特(Aon Hewitt) / /
11 美世(MERCER) / /
IndustryRank 2013
Company LOGO CountryAnnual revenue growth rate
Compared with industry average
HR service outsourcing
16 PAYCHEX 24.6% Higher
4 安德普翰(ADP) 13.7% Higher
38 FULLCAST HLDGS 3.9% Lower
40 BBSI 3.3% Lower
14 TEMP HOLDINGS 2.4% Lower
18 IMPELLAM GROUP 2.0% Lower
17 Insperity 1.9% Lower
8 中智(CIIC) 1.1% Lower
21 CHANDLER MACLEOD 1.0% Lower
Talent dispatch/lease/placement
9 罗致恒富(Robert Half) 5.1% Higher
23 On Assignment 3.4% Higher
22 TRUEBLUE 2.4% Higher
1 德科(Adecco) 1.8% Higher
24 CDI Corporation 1.8% Higher
3万宝盛华集团(ManpowerGroup)
1.0% Higher
7 必胜人力资源(KELLY) 0.9% Equal
2 任仕达(randstad) 0.2% Lower
34CORPORATE RESOURCE SERVICES
-0.5% Lower
12 usg people -6.7% Lower
15 保圣那(PASONA) / /
Headhunting & RPO
32光辉国际(KORN/FERRY INTERNATIONAL)
6.6% Higher
20 米高蒲志国际(PageGroup) 6.2% Higher
5 RECRUIT 4.6% Higher
31 明达科(MEITEC) 4.2% Higher
37海德思哲(HEIDRICK&STRUGGLES)
1.3% Lower
HRoot Global 50 HR Service Providers 2013 (Ranked by Net Profit Margin of Main Business)
33
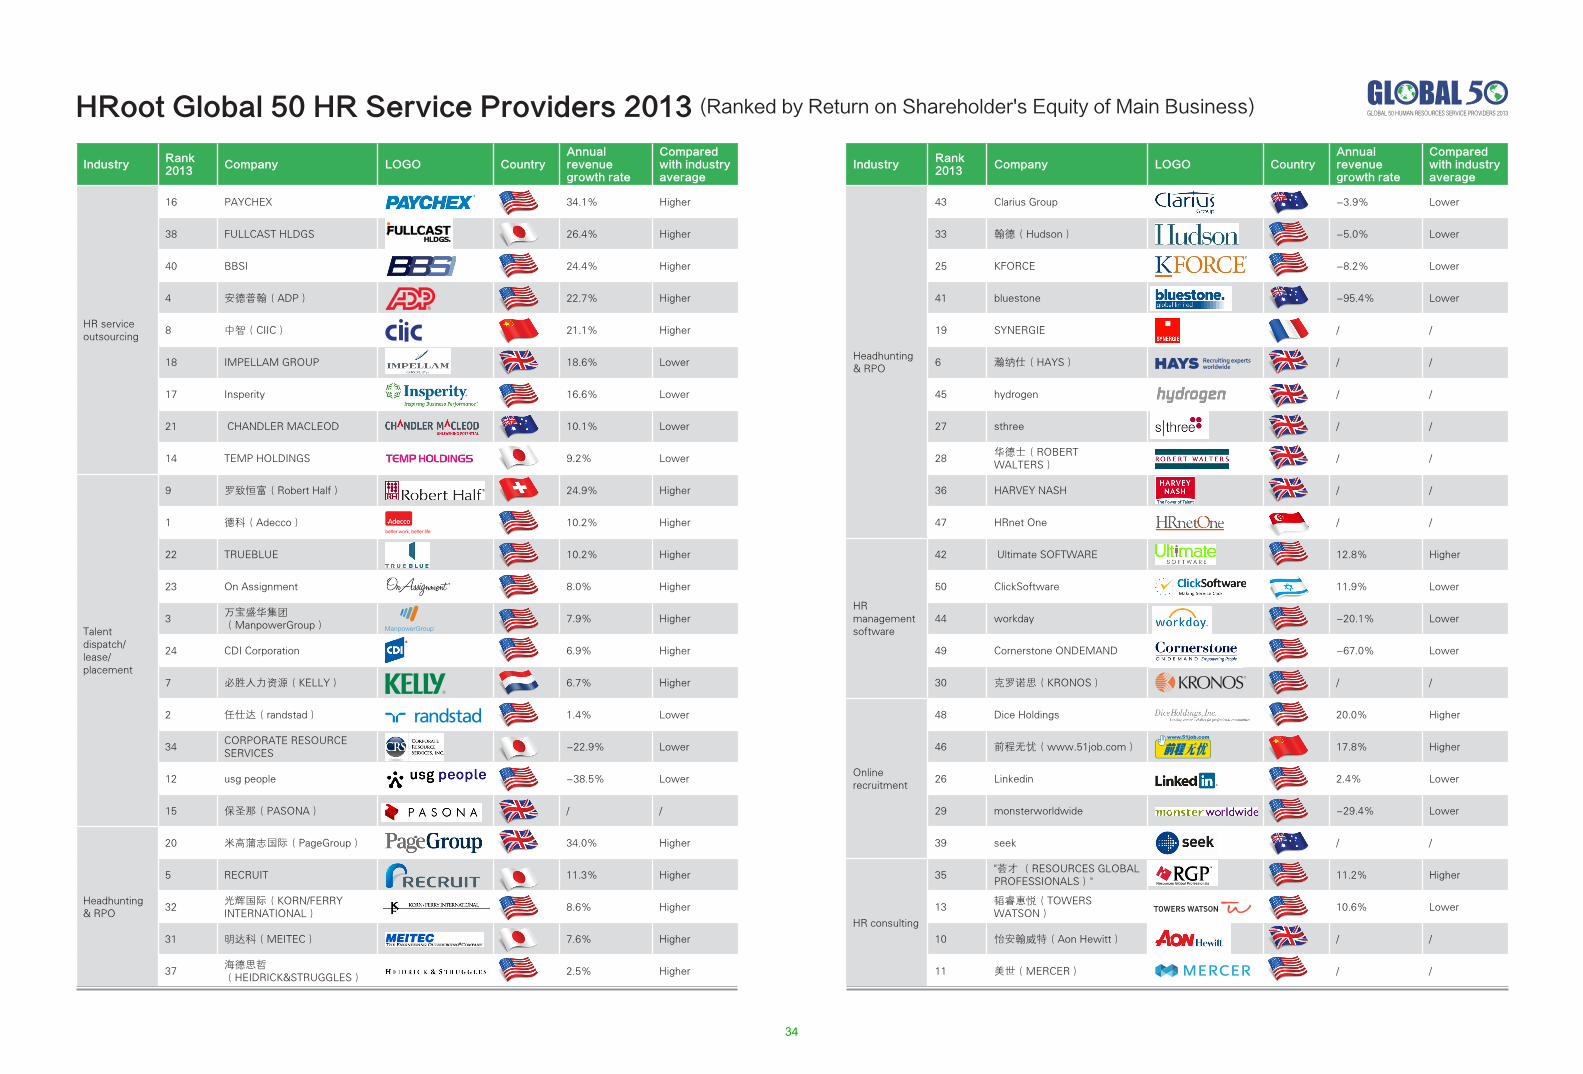
GLOBAL 50 HUMAN RESOURCES SERVICE PROVIDERS 2013
IndustryRank 2013
Company LOGO CountryAnnual revenue growth rate
Compared with industry average
Headhunting & RPO
43 Clarius Group -3.9% Lower
33 翰德(Hudson) -5.0% Lower
25 KFORCE -8.2% Lower
41 bluestone -95.4% Lower
19 SYNERGIE / /
6 瀚纳仕(HAYS) / /
45 hydrogen / /
27 sthree / /
28华德士(ROBERT WALTERS)
/ /
36 HARVEY NASH / /
47 HRnet One / /
HR management software
42 Ultimate SOFTWARE 12.8% Higher
50 ClickSoftware 11.9% Lower
44 workday -20.1% Lower
49 Cornerstone ONDEMAND -67.0% Lower
30 克罗诺思(KRONOS) / /
Online recruitment
48 Dice Holdings 20.0% Higher
46 前程无忧(www.51job.com) 17.8% Higher
26 Linkedin 2.4% Lower
29 monsterworldwide -29.4% Lower
39 seek / /
HR consulting
35"荟才 (RESOURCES GLOBAL PROFESSIONALS)"
11.2% Higher
13韬睿惠悦(TOWERS WATSON)
10.6% Lower
10 怡安翰威特(Aon Hewitt) / /
11 美世(MERCER) / /
IndustryRank 2013
Company LOGO CountryAnnual revenue growth rate
Compared with industry average
HR service outsourcing
16 PAYCHEX 34.1% Higher
38 FULLCAST HLDGS 26.4% Higher
40 BBSI 24.4% Higher
4 安德普翰(ADP) 22.7% Higher
8 中智(CIIC) 21.1% Higher
18 IMPELLAM GROUP 18.6% Lower
17 Insperity 16.6% Lower
21 CHANDLER MACLEOD 10.1% Lower
14 TEMP HOLDINGS 9.2% Lower
Talent dispatch/lease/placement
9 罗致恒富(Robert Half) 24.9% Higher
1 德科(Adecco) 10.2% Higher
22 TRUEBLUE 10.2% Higher
23 On Assignment 8.0% Higher
3万宝盛华集团(ManpowerGroup)
7.9% Higher
24 CDI Corporation 6.9% Higher
7 必胜人力资源(KELLY) 6.7% Higher
2 任仕达(randstad) 1.4% Lower
34CORPORATE RESOURCE SERVICES
-22.9% Lower
12 usg people -38.5% Lower
15 保圣那(PASONA) / /
Headhunting & RPO
20 米高蒲志国际(PageGroup) 34.0% Higher
5 RECRUIT 11.3% Higher
32光辉国际(KORN/FERRY INTERNATIONAL)
8.6% Higher
31 明达科(MEITEC) 7.6% Higher
37海德思哲(HEIDRICK&STRUGGLES)
2.5% Higher
HRoot Global 50 HR Service Providers 2013 (Ranked by Return on Shareholder's Equity of Main Business)
34
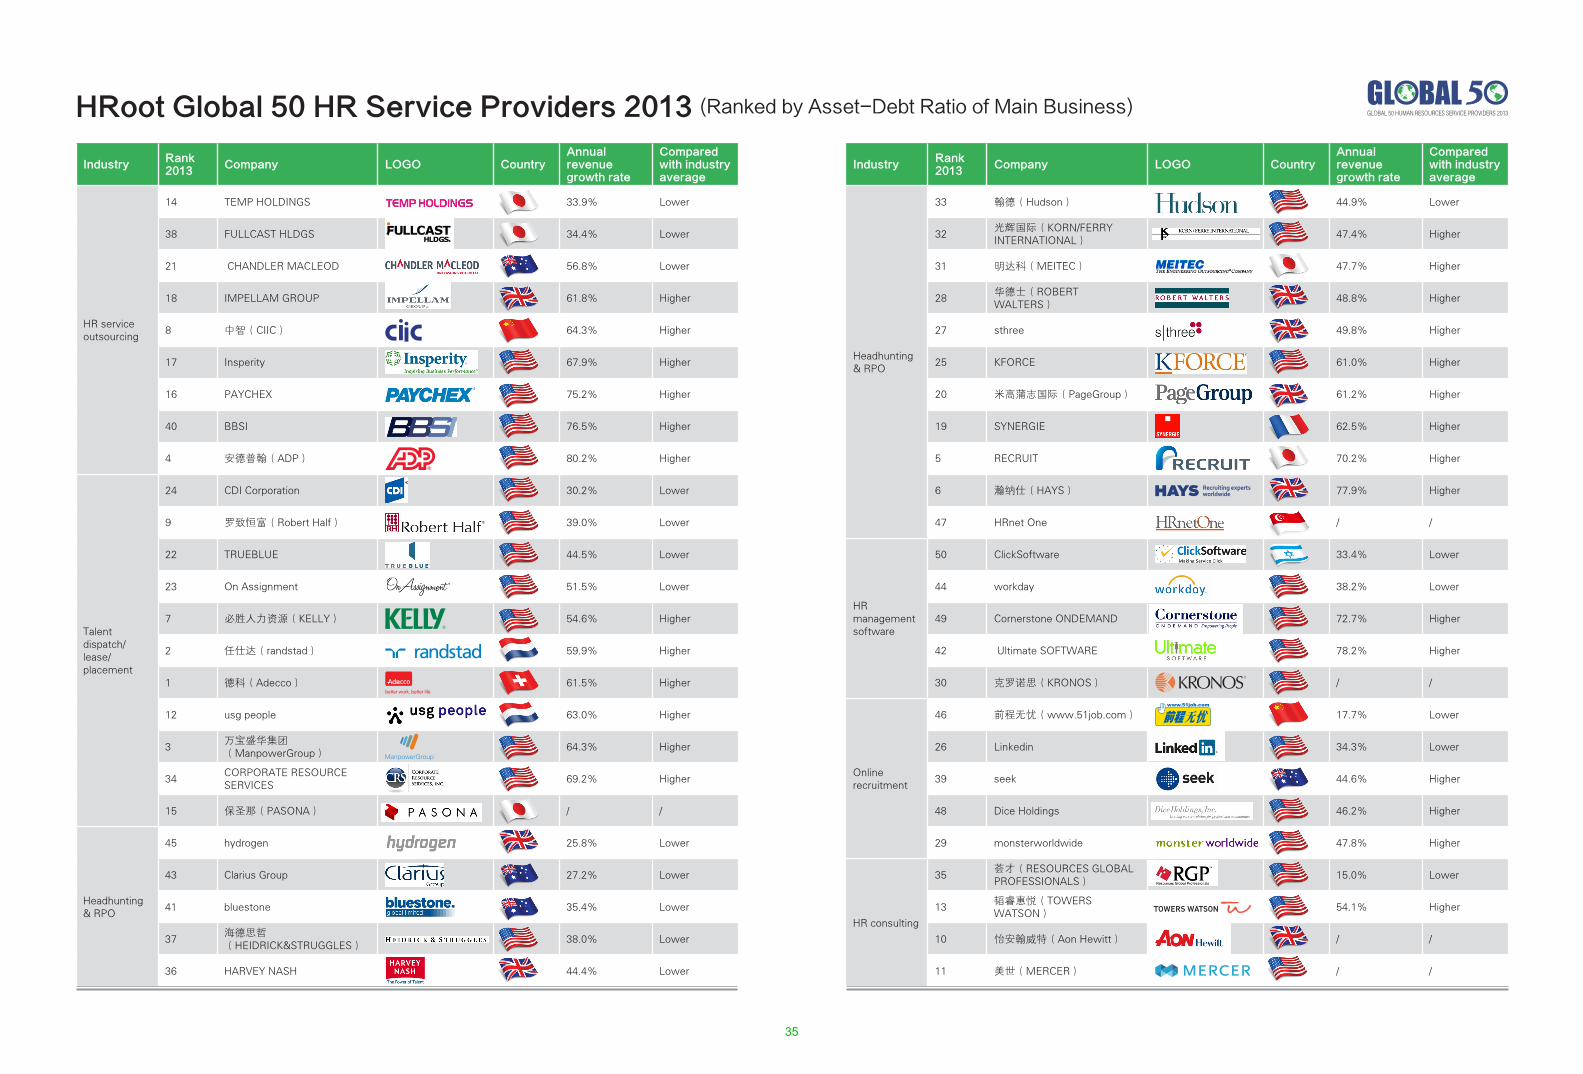
GLOBAL 50 HUMAN RESOURCES SERVICE PROVIDERS 2013
IndustryRank 2013
Company LOGO CountryAnnual revenue growth rate
Compared with industry average
Headhunting & RPO
33 翰德(Hudson) 44.9% Lower
32光辉国际(KORN/FERRY INTERNATIONAL)
47.4% Higher
31 明达科(MEITEC) 47.7% Higher
28华德士(ROBERT WALTERS)
48.8% Higher
27 sthree 49.8% Higher
25 KFORCE 61.0% Higher
20 米高蒲志国际(PageGroup) 61.2% Higher
19 SYNERGIE 62.5% Higher
5 RECRUIT 70.2% Higher
6 瀚纳仕(HAYS) 77.9% Higher
47 HRnet One / /
HR management software
50 ClickSoftware 33.4% Lower
44 workday 38.2% Lower
49 Cornerstone ONDEMAND 72.7% Higher
42 Ultimate SOFTWARE 78.2% Higher
30 克罗诺思(KRONOS) / /
Online recruitment
46 前程无忧(www.51job.com) 17.7% Lower
26 Linkedin 34.3% Lower
39 seek 44.6% Higher
48 Dice Holdings 46.2% Higher
29 monsterworldwide 47.8% Higher
HR consulting
35荟才(RESOURCES GLOBAL PROFESSIONALS)
15.0% Lower
13韬睿惠悦(TOWERS WATSON)
54.1% Higher
10 怡安翰威特(Aon Hewitt) / /
11 美世(MERCER) / /
IndustryRank 2013
Company LOGO CountryAnnual revenue growth rate
Compared with industry average
HR service outsourcing
14 TEMP HOLDINGS 33.9% Lower
38 FULLCAST HLDGS 34.4% Lower
21 CHANDLER MACLEOD 56.8% Lower
18 IMPELLAM GROUP 61.8% Higher
8 中智(CIIC) 64.3% Higher
17 Insperity 67.9% Higher
16 PAYCHEX 75.2% Higher
40 BBSI 76.5% Higher
4 安德普翰(ADP) 80.2% Higher
Talent dispatch/lease/placement
24 CDI Corporation 30.2% Lower
9 罗致恒富(Robert Half) 39.0% Lower
22 TRUEBLUE 44.5% Lower
23 On Assignment 51.5% Lower
7 必胜人力资源(KELLY) 54.6% Higher
2 任仕达(randstad) 59.9% Higher
1 德科(Adecco) 61.5% Higher
12 usg people 63.0% Higher
3万宝盛华集团(ManpowerGroup)
64.3% Higher
34CORPORATE RESOURCE SERVICES
69.2% Higher
15 保圣那(PASONA) / /
Headhunting & RPO
45 hydrogen 25.8% Lower
43 Clarius Group 27.2% Lower
41 bluestone 35.4% Lower
37海德思哲(HEIDRICK&STRUGGLES)
38.0% Lower
36 HARVEY NASH 44.4% Lower
HRoot Global 50 HR Service Providers 2013 (Ranked by Asset-Debt Ratio of Main Business)
35
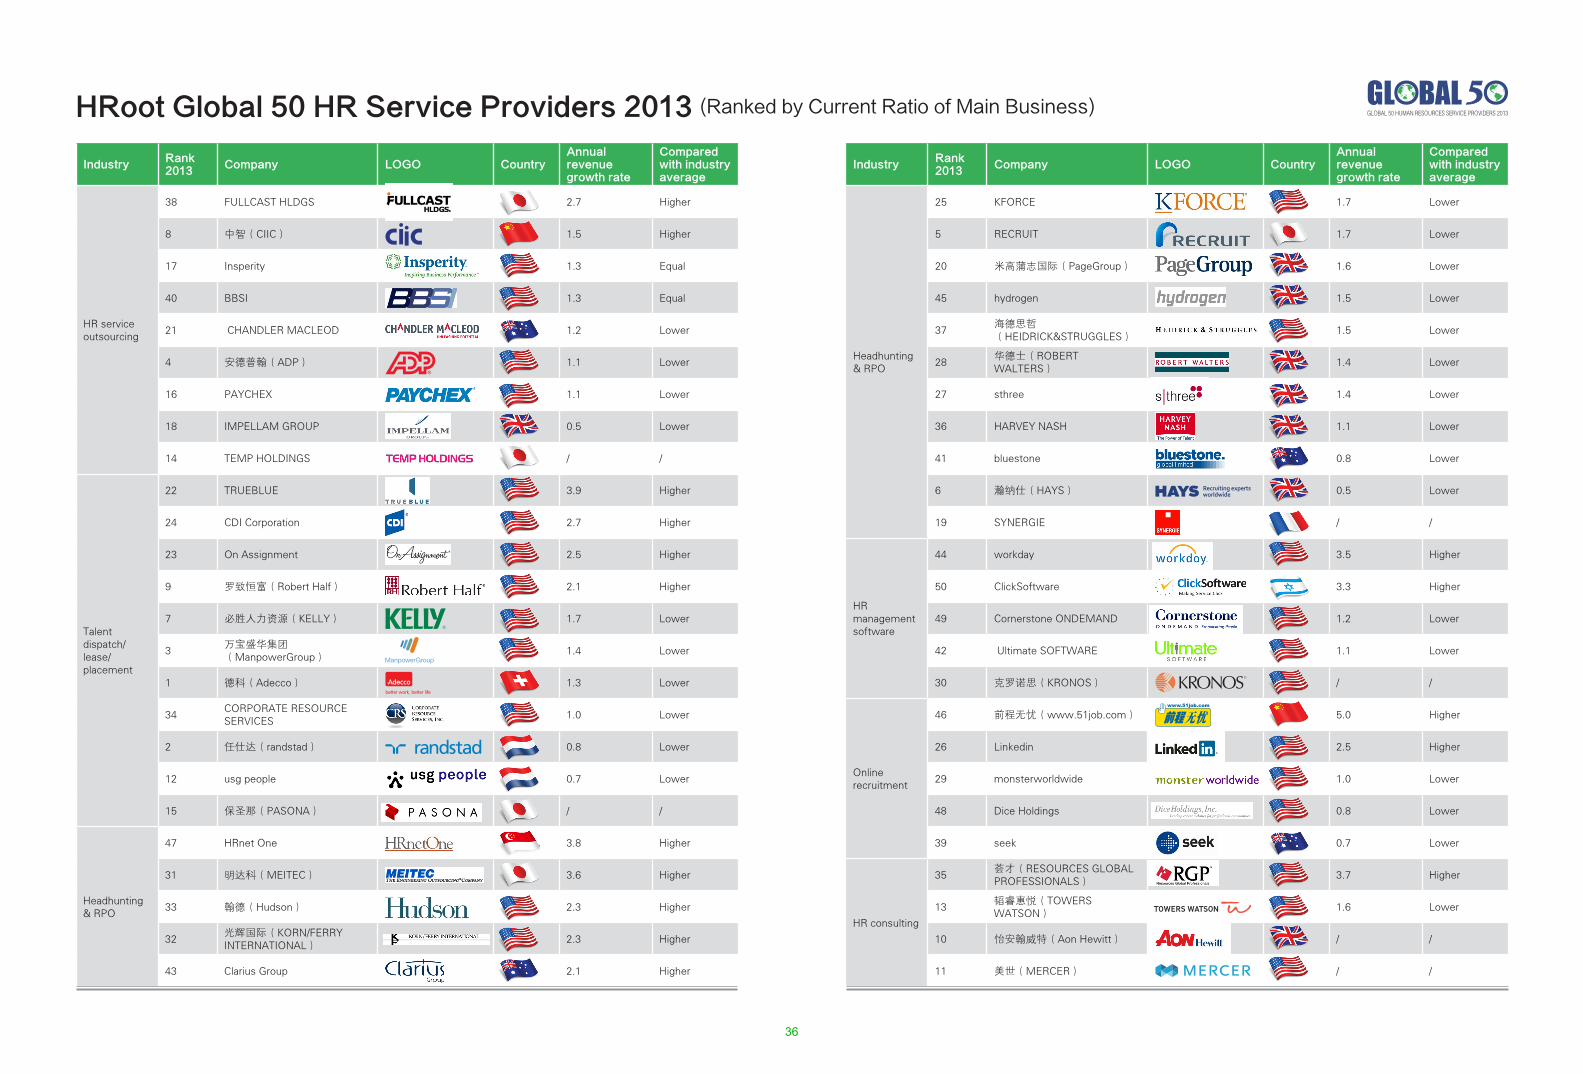
GLOBAL 50 HUMAN RESOURCES SERVICE PROVIDERS 2013
IndustryRank 2013
Company LOGO CountryAnnual revenue growth rate
Compared with industry average
Headhunting & RPO
25 KFORCE 1.7 Lower
5 RECRUIT 1.7 Lower
20 米高蒲志国际(PageGroup) 1.6 Lower
45 hydrogen 1.5 Lower
37海德思哲(HEIDRICK&STRUGGLES)
1.5 Lower
28华德士(ROBERT WALTERS)
1.4 Lower
27 sthree 1.4 Lower
36 HARVEY NASH 1.1 Lower
41 bluestone 0.8 Lower
6 瀚纳仕(HAYS) 0.5 Lower
19 SYNERGIE / /
HR management software
44 workday 3.5 Higher
50 ClickSoftware 3.3 Higher
49 Cornerstone ONDEMAND 1.2 Lower
42 Ultimate SOFTWARE 1.1 Lower
30 克罗诺思(KRONOS) / /
Online recruitment
46 前程无忧(www.51job.com) 5.0 Higher
26 Linkedin 2.5 Higher
29 monsterworldwide 1.0 Lower
48 Dice Holdings 0.8 Lower
39 seek 0.7 Lower
HR consulting
35荟才(RESOURCES GLOBAL PROFESSIONALS)
3.7 Higher
13韬睿惠悦(TOWERS WATSON)
1.6 Lower
10 怡安翰威特(Aon Hewitt) / /
11 美世(MERCER) / /
IndustryRank 2013
Company LOGO CountryAnnual revenue growth rate
Compared with industry average
HR service outsourcing
38 FULLCAST HLDGS 2.7 Higher
8 中智(CIIC) 1.5 Higher
17 Insperity 1.3 Equal
40 BBSI 1.3 Equal
21 CHANDLER MACLEOD 1.2 Lower
4 安德普翰(ADP) 1.1 Lower
16 PAYCHEX 1.1 Lower
18 IMPELLAM GROUP 0.5 Lower
14 TEMP HOLDINGS / /
Talent dispatch/lease/placement
22 TRUEBLUE 3.9 Higher
24 CDI Corporation 2.7 Higher
23 On Assignment 2.5 Higher
9 罗致恒富(Robert Half) 2.1 Higher
7 必胜人力资源(KELLY) 1.7 Lower
3万宝盛华集团(ManpowerGroup)
1.4 Lower
1 德科(Adecco) 1.3 Lower
34CORPORATE RESOURCE SERVICES
1.0 Lower
2 任仕达(randstad) 0.8 Lower
12 usg people 0.7 Lower
15 保圣那(PASONA) / /
Headhunting & RPO
47 HRnet One 3.8 Higher
31 明达科(MEITEC) 3.6 Higher
33 翰德(Hudson) 2.3 Higher
32光辉国际(KORN/FERRY INTERNATIONAL)
2.3 Higher
43 Clarius Group 2.1 Higher
HRoot Global 50 HR Service Providers 2013 (Ranked by Current Ratio of Main Business)
36
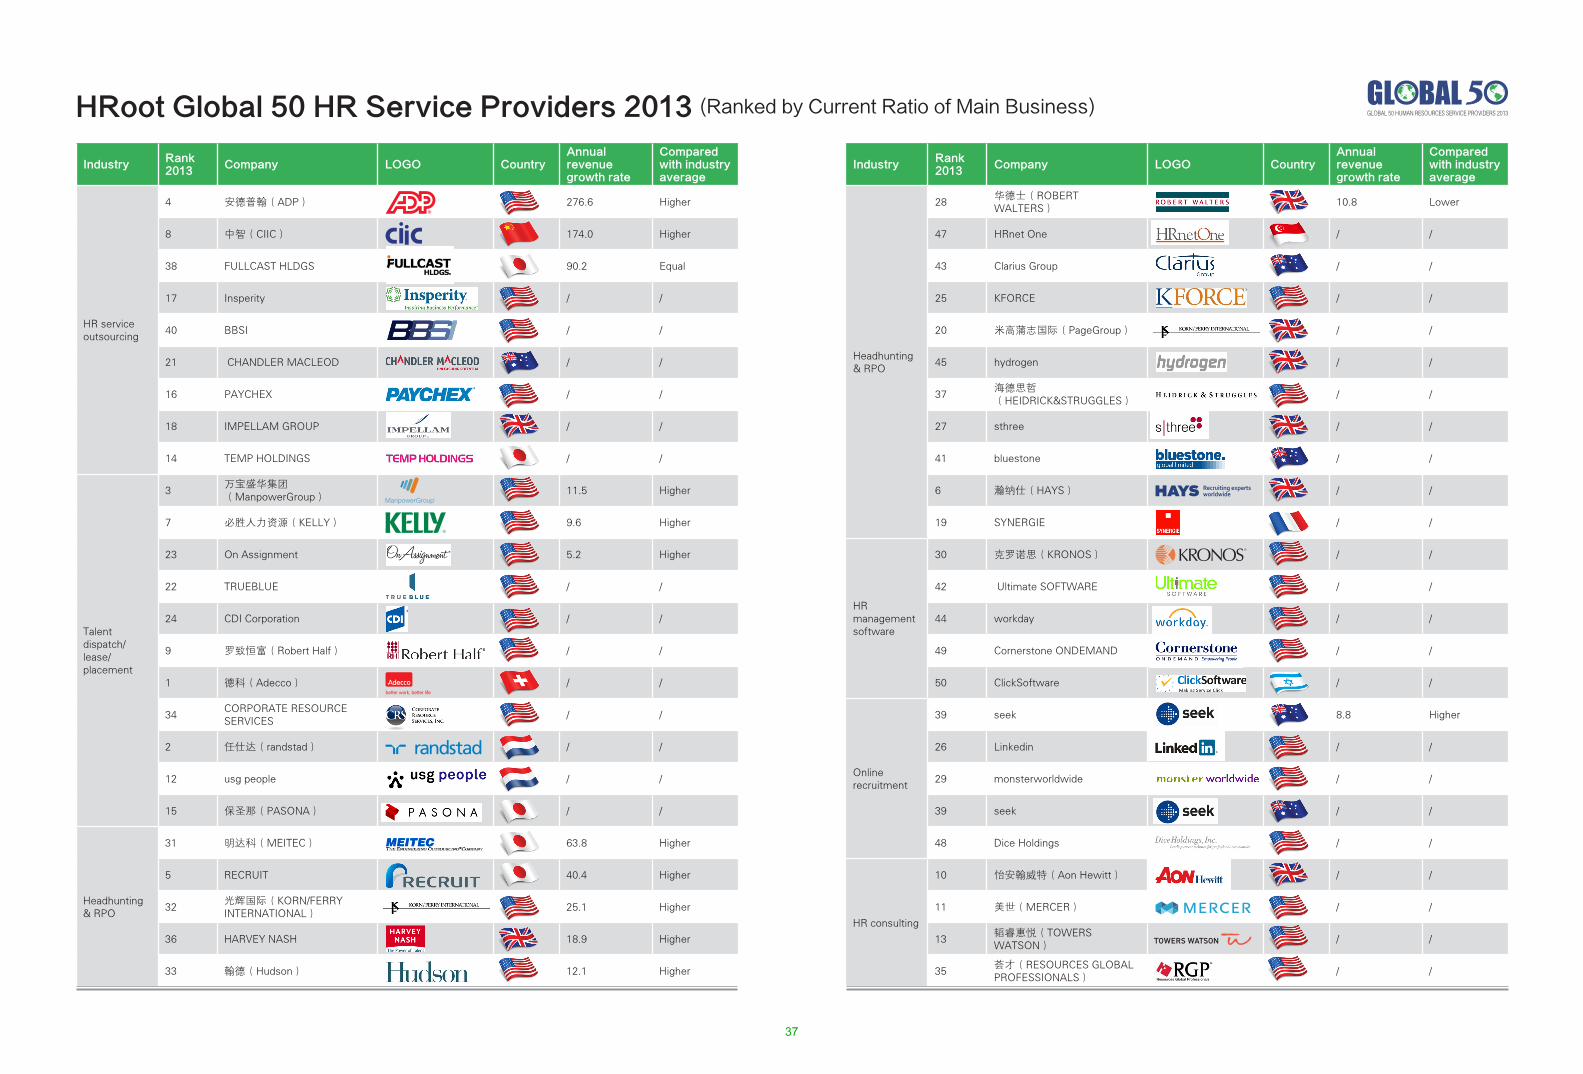
GLOBAL 50 HUMAN RESOURCES SERVICE PROVIDERS 2013
IndustryRank 2013
Company LOGO CountryAnnual revenue growth rate
Compared with industry average
Headhunting & RPO
28华德士(ROBERT WALTERS)
10.8 Lower
47 HRnet One / /
43 Clarius Group / /
25 KFORCE / /
20 米高蒲志国际(PageGroup) / /
45 hydrogen / /
37海德思哲(HEIDRICK&STRUGGLES)
/ /
27 sthree / /
41 bluestone / /
6 瀚纳仕(HAYS) / /
19 SYNERGIE / /
HR management software
30 克罗诺思(KRONOS) / /
42 Ultimate SOFTWARE / /
44 workday / /
49 Cornerstone ONDEMAND / /
50 ClickSoftware / /
Online recruitment
39 seek 8.8 Higher
26 Linkedin / /
29 monsterworldwide / /
39 seek / /
48 Dice Holdings / /
HR consulting
10 怡安翰威特(Aon Hewitt) / /
11 美世(MERCER) / /
13韬睿惠悦(TOWERS WATSON)
/ /
35荟才(RESOURCES GLOBAL PROFESSIONALS)
/ /
IndustryRank 2013
Company LOGO CountryAnnual revenue growth rate
Compared with industry average
HR service outsourcing
4 安德普翰(ADP) 276.6 Higher
8 中智(CIIC) 174.0 Higher
38 FULLCAST HLDGS 90.2 Equal
17 Insperity / /
40 BBSI / /
21 CHANDLER MACLEOD / /
16 PAYCHEX / /
18 IMPELLAM GROUP / /
14 TEMP HOLDINGS / /
Talent dispatch/lease/placement
3万宝盛华集团(ManpowerGroup)
11.5 Higher
7 必胜人力资源(KELLY) 9.6 Higher
23 On Assignment 5.2 Higher
22 TRUEBLUE / /
24 CDI Corporation / /
9 罗致恒富(Robert Half) / /
1 德科(Adecco) / /
34CORPORATE RESOURCE SERVICES
/ /
2 任仕达(randstad) / /
12 usg people / /
15 保圣那(PASONA) / /
Headhunting & RPO
31 明达科(MEITEC) 63.8 Higher
5 RECRUIT 40.4 Higher
32光辉国际(KORN/FERRY INTERNATIONAL)
25.1 Higher
36 HARVEY NASH 18.9 Higher
33 翰德(Hudson) 12.1 Higher
HRoot Global 50 HR Service Providers 2013 (Ranked by Current Ratio of Main Business)
37
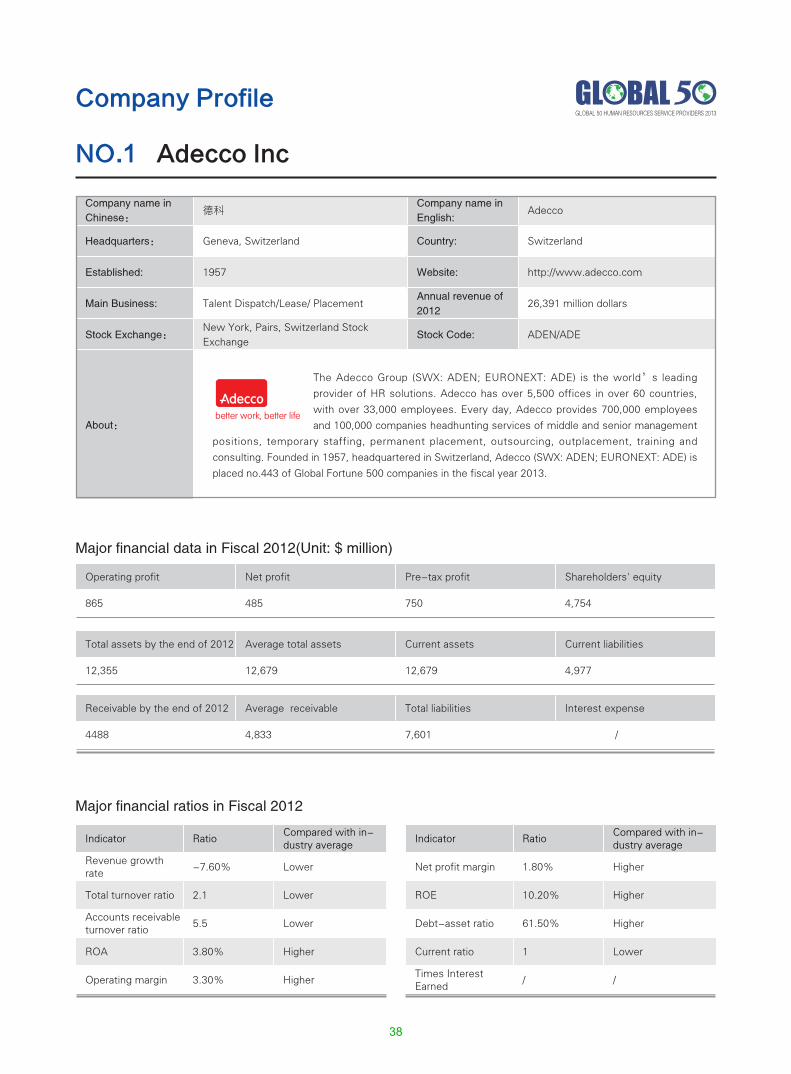
Company name in Chinese:
德科Company name in English:
Adecco
Headquarters: Geneva, Switzerland Country: Switzerland
Established: 1957 Website: http://www.adecco.com
Main Business: Talent Dispatch/Lease/ PlacementAnnual revenue of 2012
26,391 million dollars
Stock Exchange:New York, Pairs, Switzerland Stock Exchange
Stock Code: ADEN/ADE
About:
Operating profit Net profit Pre-tax profit Shareholders' equity
865 485 750 4,754
Major financial data in Fiscal 2012(Unit: $ million)
Major financial ratios in Fiscal 2012
The Adecco Group (SWX: ADEN; EURONEXT: ADE) is the world’s leading
provider of HR solutions. Adecco has over 5,500 offices in over 60 countries,
with over 33,000 employees. Every day, Adecco provides 700,000 employees
and 100,000 companies headhunting services of middle and senior management
positions, temporary staffing, permanent placement, outsourcing, outplacement, training and
consulting. Founded in 1957, headquartered in Switzerland, Adecco (SWX: ADEN; EURONEXT: ADE) is
placed no.443 of Global Fortune 500 companies in the fiscal year 2013.
Total assets by the end of 2012 Average total assets Current assets Current liabilities
12,355 12,679 12,679 4,977
Receivable by the end of 2012 Average receivable Total liabilities Interest expense
4488 4,833 7,601 /
Indicator RatioCompared with in-dustry average
Net profit margin 1.80% Higher
ROE 10.20% Higher
Debt-asset ratio 61.50% Higher
Current ratio 1 Lower
Times Interest Earned
/ /
Indicator RatioCompared with in-dustry average
Revenue growth rate
-7.60% Lower
Total turnover ratio 2.1 Lower
Accounts receivable turnover ratio
5.5 Lower
ROA 3.80% Higher
Operating margin 3.30% Higher
Company Profile
Adecco IncNO.1
GLOBAL 50 HUMAN RESOURCES SERVICE PROVIDERS 2013
38
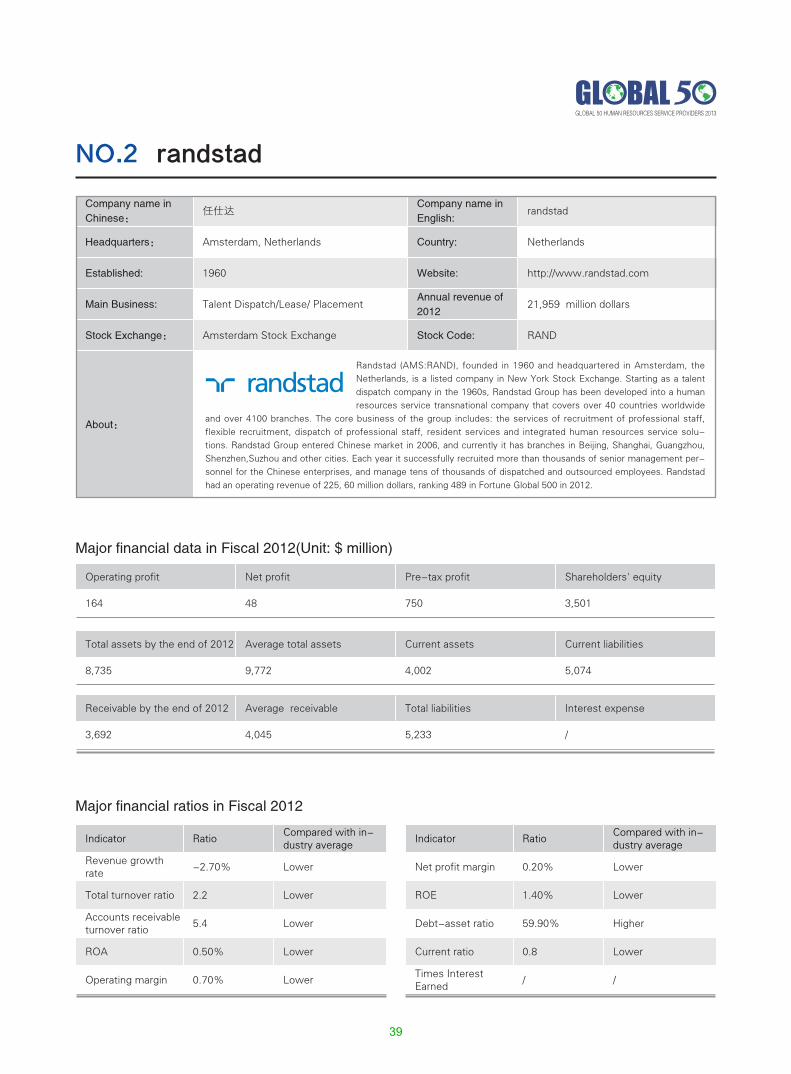
Operating profit Net profit Pre-tax profit Shareholders' equity
164 48 750 3,501
Major financial data in Fiscal 2012(Unit: $ million)
Major financial ratios in Fiscal 2012
Total assets by the end of 2012 Average total assets Current assets Current liabilities
8,735 9,772 4,002 5,074
Receivable by the end of 2012 Average receivable Total liabilities Interest expense
3,692 4,045 5,233 /
Indicator RatioCompared with in-dustry average
Net profit margin 0.20% Lower
ROE 1.40% Lower
Debt-asset ratio 59.90% Higher
Current ratio 0.8 Lower
Times Interest Earned
/ /
Indicator RatioCompared with in-dustry average
Revenue growth rate
-2.70% Lower
Total turnover ratio 2.2 Lower
Accounts receivable turnover ratio
5.4 Lower
ROA 0.50% Lower
Operating margin 0.70% Lower
Company name in Chinese:
任仕达Company name in English:
randstad
Headquarters: Amsterdam, Netherlands Country: Netherlands
Established: 1960 Website: http://www.randstad.com
Main Business: Talent Dispatch/Lease/ PlacementAnnual revenue of 2012
21,959 million dollars
Stock Exchange: Amsterdam Stock Exchange Stock Code: RAND
About:
randstadNO.2
Randstad (AMS:RAND), founded in 1960 and headquartered in Amsterdam, the Netherlands, is a listed company in New York Stock Exchange. Starting as a talent dispatch company in the 1960s, Randstad Group has been developed into a human resources service transnational company that covers over 40 countries worldwide
and over 4100 branches. The core business of the group includes: the services of recruitment of professional staff, flexible recruitment, dispatch of professional staff, resident services and integrated human resources service solu-tions. Randstad Group entered Chinese market in 2006, and currently it has branches in Beijing, Shanghai, Guangzhou, Shenzhen,Suzhou and other cities. Each year it successfully recruited more than thousands of senior management per-sonnel for the Chinese enterprises, and manage tens of thousands of dispatched and outsourced employees. Randstad had an operating revenue of 225, 60 million dollars, ranking 489 in Fortune Global 500 in 2012.
GLOBAL 50 HUMAN RESOURCES SERVICE PROVIDERS 2013
39
Company name in Chinese:
万宝盛华Company name in English:
ManpowerGroup
Headquarters: Wisconsin, United States of America Country: United States of America
Established: 1948 Website: http://www.manpowergroup.com
Main Business: Talent Dispatch/Lease/PlacementAnnual revenue of 2012
20,678 million dollars
Stock Exchange: New York Stock Exchange Stock Code: MAN
About:
ManpowerGroupNO.3
ManpowerGroup (NYSE:MAN), founded in 1948, is a world leader in global pioneering human re-sources solutions, creates and delivers services to help customers to achieve their goals on business and human resources objectives and meanwhile enhances customers’competitiveness. With an-nual turnover of 22 billion USD, Manpower provides a series of services covering the whole employ-ment life cycle and business cycle to employers, including talents searching and selecting, temporary
and contractual dispatch services, employee assessment and selection, training service, outplacement service, as well as outsourcing and consulting services. Manpower has the largest service network in global human resources service industry, and its worldwide network of nearly 3,900 offices in 80 countries and territories enables the company to meet the needs of its 400,000 clients per year. In 1994, for the first time Manpower developed its business to Great China, and presently it has over 500 professional recruiters in 22 main cities in Chinese Mainland. In Chinese mainland, it has customers of over 3500 transnational companies and local companies and has over 500,000 medium-and-high-level urgently-needed talents. It ranked 500 in Fortune Global 500 in 2012.
Operating profit Net profit Pre-tax profit Shareholders' equity
412 198 368 2,502
Major financial data in Fiscal 2012(Unit: $ million)
Major financial ratios in Fiscal 2012
Total assets by the end of 2012 Average total assets Current assets Current liabilities
7,013 6,956 5,061 3,677
Receivable by the end of 2012 Average receivable Total liabilities Interest expense
4,179 4,180 4,511 35
Indicator RatioCompared with in-dustry average
Net profit margin 1.00% Higher
ROE 7.90% Higher
Debt-asset ratio 64.30% Higher
Current ratio 1.4 Lower
Times Interest Earned
11.5 Higher
Indicator RatioCompared with in-dustry average
Revenue growth rate
-6.00% Lower
Total turnover ratio 3.0 Lower
Accounts receivable turnover ratio
4.9 Lower
ROA 2.80% Higher
Operating margin 2.00% Lower
GLOBAL 50 HUMAN RESOURCES SERVICE PROVIDERS 2013
40
Company name in Chinese:
安德普翰Company name in English:
ADP
Headquarters: New Jersey, United States of America Country: United States of America
Established: 1949 Website: http://www.adp.com
Main Business: Human Resource OutsourcingAnnual revenue of 2012
10,172 million dollars
Stock Exchange: NASDAQ Stock Market Stock Code: ADP
About:
ADP NO.4
ADP (NASDAQ:ADP), founded in 1949, with annual income of nearly 10 billion USD and 570, 000 customers all over the world, is one of the world largest outsourcing solution providers. With nearly 60 years’ senior experience in the industry, ADP provides the most comprehensive human resources, remuneration, taxes and
welfare management solutions in the industry. ADP also provides world’s leading integrated computer information solutions to global sedan, truck, motorcycle, ship and recreational vehicle dealers. In 2006, ADP entered Chinese market and began to provide world first-class human resources services and dealer services to companies in China through products of GlobalView® and Autoline®. In 2009, ADP successfully purchased China Link with an aim to bring more comprehensive localized human resources outsourcing solutions to Chinese market.
Operating profit Net profit Pre-tax profit Shareholders' equity
21 14 2,122 6,114
Major financial data in Fiscal 2012(Unit: $ million)
Major financial ratios in Fiscal 2012
Total assets by the end of 2012 Average total assets Current assets Current liabilities
30,816 32,527 25,156 23,239
Receivable by the end of 2012 Average receivable Total liabilities Interest expense
1,399 1,382 24,702 8
Indicator RatioCompared with in-dustry average
Net profit margin 13.70% Higher
ROE 22.70% Higher
Debt-asset ratio 80.20% Higher
Current ratio 1.1 Lower
Times Interest Earned
276.6 Higher
Indicator RatioCompared with in-dustry average
Revenue growth rate
3.00% Lower
Total turnover ratio 0.3 Lower
Accounts receivable turnover ratio
7.4 Lower
ROA 4.30% Lower
Operating margin 20.90% Higher
GLOBAL 50 HUMAN RESOURCES SERVICE PROVIDERS 2013
41
Company name in Chinese:
/Company name in English:
RECRUIT
Headquarters: Tokyo Country: Japan
Established: 1960 Website: http://www.recruit.co.jp/
Main Business: Headhunting&RPOAnnual revenue of 2012
10,083 million dollars
Stock Exchange: / Stock Code: /
About:
RECRUITNO.5
Founded on March 31, 1960, Recruit in Japan is known as RGF overseas.
Recruit Group delivers "Meet your opportunity." to the world. since 2009,
RECRUIT Group have developed under the corporate brand name "RGF".
Individual talent varies from person to person. Recruit is committed to helping create a world in which
everyone can live out their dreams and shine like a star.
Operating profit Net profit Pre-tax profit Shareholders' equity
1,438 468 838 4,134
Major financial data in Fiscal 2012(Unit: $ million)
Major financial ratios in Fiscal 2012
Total assets by the end of 2012 Average total assets Current assets Current liabilities
8,080 8,216 4,190 2,422
Receivable by the end of 2012 Average receivable Total liabilities Interest expense
1,717 5,035 3,946 21.3
Indicator RatioCompared with in-dustry average
Net profit margin 4.60% Higher
ROE 11.30% Higher
Debt-asset ratio 70.20% Higher
Current ratio 1.7 Lower
Times Interest Earned
40.4 Higher
Indicator RatioCompared with in-dustry average
Revenue growth rate
7.20% Higher
Total turnover ratio 1.2 Lower
Accounts receivable turnover ratio
2 Lower
ROA 5.70% Higher
Operating margin 14.30% Higher
GLOBAL 50 HUMAN RESOURCES SERVICE PROVIDERS 2013
42
Company name in Chinese:
瀚纳仕Company name in English:
HAYS
Headquarters: London, The United Kingdom Country: The United Kingdom
Established: 1867 Website: http://www.haysplc.com
Main Business: Headhunting&RPOAnnual revenue of 2012
5,794 million dollars
Stock Exchange: London Stock Exchange Stock Code: HAS
About:
HAYSNO.6
HAYS(LON:HAS)is a United Kingdom-based recruitment group engaged in the provision of specialist recruitment activities. As a professional human resources consulting service provider, Hays(LON:HAS), headquartered in Great Britain, is the largest headhunting company in Great Britain. Hays has
7,620 staff operating from 255 offices in 31 countries . Hays has market-leading positions in the UK, Asia Pacific, Con-tinental Europe and Latin America. Hays is the largest professional recruitment consulting company in Asia Pacific and it has set up 45 branches in Asia Pacific. In 2010, Hays declared the strategic measures of entering Chinese market which aims to become Chinese largest recruitment and consulting company, expects to rapidly expand its scale on the basis of its existing three subsidiaries in China in the next five years, and increase its headhunting consults to 300 from the cur-rent number of 80.
Operating profit Net profit Pre-tax profit Shareholders' equity
203 / 193 303
Major financial data in Fiscal 2012(Unit: $ million)
Major financial ratios in Fiscal 2012
Total assets by the end of 2012 Average total assets Current assets Current liabilities
1,368 1,388 854 1,813
Receivable by the end of 2012 Average receivable Total liabilities Interest expense
854 847 1.65 /
Indicator RatioCompared with in-dustry average
Net profit margin / /
ROE / /
Debt-asset ratio 77.90% Higher
Current ratio 0. 5 Lower
Times Interest Earned
/ /
Indicator RatioCompared with in-dustry average
Revenue growth rate
10.90% Higher
Total turnover ratio 4.2 Higher
Accounts receivable turnover ratio
6.8 Higher
ROA / /
Operating margin 3.50% Higher
GLOBAL 50 HUMAN RESOURCES SERVICE PROVIDERS 2013
43
Company name in Chinese:
上海必胜人力资源有限公司Company name in English:
KELLY
Headquarters: Michigan, United States of America Country: United States of America
Established: 1946 Website: http://www.kellyservices.com
Main Business: Talent Dispatch/Lease/ Placement Annual revenue of 2012
5,451 million dollars
Stock Exchange: NASDAQ Stock Market Stock Code: KELYA,KELYB
About:
Operating profit Net profit Pre-tax profit Shareholders' equity
72 50 69 742
Major financial data in Fiscal 2012(Unit: $ million)
Major financial ratios in Fiscal 2012
Total assets by the end of 2012 Average total assets Current assets Current liabilities
1,636 1,589 1,193 722
Receivable by the end of 2012 Average receivable Total liabilities Interest expense
1,014 979 894 8
Indicator RatioCompared with in-dustry average
Net profit margin 0.90% 等于
ROE 6.70% Higher
Debt-asset ratio 54.60% Higher
Current ratio 1.7 Lower
Times Interest Earned
9.6 Higher
Indicator RatioCompared with in-dustry average
Revenue growth rate
-1.80% Lower
Total turnover ratio 3.4 Lower
Accounts receivable turnover ratio
5.6 Lower
ROA 3.10% Higher
Operating margin 1.30% Lower
KELLYNO.7
KELLY (NASDAQ: KELYA) founded in 1946, headquartered in Michigan, the USA. As the
world’s leading HR solutions provider and workforce management service consulting firm,
Kelly Services can meet the wide range and cross-departmental HR management demands of
enterprises, including office management, marketing, finance, engineering, law, science, IT, education, and outsourcing
consulting. Kelly Services has 2,600 branches in 37 countries and provides job opportunities for over 550,000 people
every year. It provides services for over 90% of the Fortune Top 500 companies. It entered China since 2002. Its service
network covers Beijing, Shanghai, Guangzhou, Suzhou, Chengdu, Nanchang, Tianjin, Shenzhen and Hong Kong. Kelly
Services China provides all-rounded HR solutions, including middle- and senior-level talent selection, outsourcing, and
third-party management, for famous enterprises.
GLOBAL 50 HUMAN RESOURCES SERVICE PROVIDERS 2013
44
Company name in Chinese:
中国国际技术智力合作公司Company name in English:
CIIC
Headquarters: Beijing, China Country: China
Established: 1987 Website: http://www.ciic.com.cn
Main Business: Human Resource OutsourcingAnnual revenue of 2012
5,333 million dollars
Stock Exchange: / Stock Code: /
About:
Operating profit Net profit Pre-tax profit Shareholders' equity
74 57 80 270
Major financial data in Fiscal 2012(Unit: $ million)
Major financial ratios in Fiscal 2012
Total assets by the end of 2012 Average total assets Current assets Current liabilities
756 669 713 486
Receivable by the end of 2012 Average receivable Total liabilities Interest expense
57 44 486 0.5
Indicator RatioCompared with in-dustry average
Net profit margin 1.10% Lower
ROE 21.10% Higher
Debt-asset ratio 64.30% Higher
Current ratio 1. 5 Higher
Times Interest Earned
174 Higher
Indicator RatioCompared with in-dustry average
Revenue growth rate
18.90% Higher
Total turnover ratio 8 Lower
Accounts receivable turnover ratio
121.6 Higher
ROA 8.50% Higher
Operating margin 1.40% Lower
CIICNO.8
Founded in 1987, China International Intellectech Corporationis one of the state-owned backbone enterprises under the direct management of the Chinese Central Government. Headquartered in Beijing, it has 87 subsidiaries and branches focusing on international cooperation in the fields of economy, technology and talent in China and other 76 countries and regions around the world. Keeping abreast of the latest development of knowledge-powered productivity amid the global
economic integration, the mega trends of structural change and transfer of worldwide service sector as well as complete outsourcing especially offshore arrangements, and catering for China’s demands for restructuring of service industry and growing of new economic paradigms, CIIC has been building its core competence in the field of intellectual services, standing out as the leading HR service provider which demonstrates proven competitiveness and influence in talents, resources, networks, scale and experience. Furthermore, it is extending its expertise to new fields like investment and trading services. CIIC has becoming a newly exploring enterprise with its high competence and leading advantages. In 2011, CIIC’s operating income was 22.2 billion RMB and ranked the No.336 in top 500 enterprises in China in 2011.
GLOBAL 50 HUMAN RESOURCES SERVICE PROVIDERS 2013
45
Company name in Chinese:
罗致恒富Company name in English:
Robert Half
Headquarters: California, United States of America Country: United States of America
Established: 1948 Website: http://www.rhi.com
Main Business: Talent Dispatch/Lease/ PlacementAnnual revenue of 2012
4,111 million dollars
Stock Exchange: New York Stock Exchange Stock Code: RHI
About:
Operating profit Net profit Pre-tax profit Shareholders' equity
344 210 344 842
Major financial data in Fiscal 2012(Unit: $ million)
Major financial ratios in Fiscal 2012
Total assets by the end of 2012 Average total assets Current assets Current liabilities
1,381 1,346 1,065 502
Receivable by the end of 2012 Average receivable Total liabilities Interest expense
513 503 539 /
Indicator RatioCompared with in-dustry average
Net profit margin 5.10% Higher
ROE 24.90% Higher
Debt-asset ratio 39.00% Lower
Current ratio 2.1 Higher
Times Interest Earned
/ /
Indicator RatioCompared with in-dustry average
Revenue growth rate
8.80% Lower
Total turnover ratio 3.1 Lower
Accounts receivable turnover ratio
8.2 Lower
ROA 15.60% Higher
Operating margin 8.40% Higher
Robert Half (NYSE: RHI)provides specialized staffing and risk consulting services through such divisions as Accountemps, Robert Half Finance & Accounti ng, Offi ceTeam, Robert Half Technology, Robert Half Management Resources, Robert
Half Legal, The Creative Group, and Protiviti. Through its Accountemps, Robert Half Finance & Accounting, and Robert Half Management Resources divisions, is a provider of temporary, full-ti me, and project professionals in the fields of accounting and finance. Office Team specializes in temporary administrative support personnel. Robert Half Technology provides information technology professionals. Robert Half Legal provides temporary, project, and full-time staffing of attorneys and specialized support personnel within law firms and corporate legal departments. The Creati ve Group provides project staffing in the advertising, marketing, and Web design fields. Protiviti is a global business consulting and internal audit firm.
Robert HalfNO.9
GLOBAL 50 HUMAN RESOURCES SERVICE PROVIDERS 2013
46
Company name in Chinese:
怡安翰威特Company name in English:
AON Hewitt
Headquarters: London Country: Britain
Established: 1982 Website: http://www.aonhewitt.com/
Main Business: HR ConsultingAnnual revenue of 2012
3,925 million dollars
Stock Exchange: / Stock Code: /
About:
Operating profit Net profit Pre-tax profit Shareholders' equity
289 / / /
Major financial data in Fiscal 2012(Unit: $ million)
Major financial ratios in Fiscal 2012
Total assets by the end of 2012 Average total assets Current assets Current liabilities
/ / / /
Receivable by the end of 2012 Average receivable Total liabilities Interest expense
/ / / /
Indicator RatioCompared with in-dustry average
Net profit margin / /
ROE / /
Debt-asset ratio / /
Current ratio / /
Times Interest Earned
/ /
Indicator RatioCompared with in-dustry average
Revenue growth rate
3.80% Lower
Total turnover ratio / /
Accounts receivable turnover ratio
/ /
ROA / /
Operating margin 7.40% Lower
In 2010, Aon Consulting mergered with Hewitt Associates to establish Aon Hewitt. Aon Hewitt is the world largest comprehensive human resources outsourcing and human resources management consulting company, which carries out business
in 90 countries and territories with 29,000 employees and which had 4.3 billion joint income in 2010. Aon Hewitt provides consulting, remuneration and welfare management services to more than half of world top 500 companies. Aon Hewitt’s headquarter in China is located in Shanghai, and it has 6 offices and over 300 staff in Shanghai, Beijing, Guangzhou, Shenzhen, Chengdu, Nanjing,Taibei and Hongkong in Great China, which plays a leading role in human resources management consulting field in China.
AON HewittNO.10
GLOBAL 50 HUMAN RESOURCES SERVICE PROVIDERS 2013
47
Company name in Chinese:
美世Company name in English:
MERCER
Headquarters: New York, United States Country: United States
Established: 1937 Website: http://www.mercer.com
Main Business: HR ConsultingAnnual revenue of 2012
3,916 million dollars
Stock Exchange:New York, Chicago, London Stock Ex-
changeStock Code: MMC
About:
Operating profit Net profit Pre-tax profit Shareholders' equity
/ / / /
Major financial data in Fiscal 2012(Unit: $ million)
Major financial ratios in Fiscal 2012
Total assets by the end of 2012 Average total assets Current assets Current liabilities
/ / / /
Receivable by the end of 2012 Average receivable Total liabilities Interest expense
/ / / /
Indicator RatioCompared with in-dustry average
Net profit margin / /
ROE / /
Debt-asset ratio / /
Current ratio / /
Times Interest Earned
/ /
Indicator RatioCompared with in-dustry average
Revenue growth rate
3.50% /
Total turnover ratio / /
Accounts receivable turnover ratio
/ /
ROA / /
Operating margin / /
MERCER, founded in 1937 and headquartered in America, is a world leading con-sulting outsourcing and investment service provider, and is world largest human resources management consulting company and world largest benefits outsourcing
provider with 25,000 customers. Mercer helps its customers to maximally enhance performance of their staff’s health, benefits and retirement plan, and optimize labor force performance while managing costs. Mercer also provides custom-ized management, technical and overall benefits outsourcing solutions. The investment services of Mercer include world leading design and management of investment, consulting and retirement as well as investment management of multiple managers. Mercer has over 20,000 employees in over 40 countries. As a wholly-owned subsidiaries of MMC, Mercer together with Marsh, Kroll and Guy Carpenter provides overall services to customers. Mercer entered Chinese market in 1995, and currently it has 7 branches in Beijing, Shanghai, Guangzhou, Shenzhen, Dalian, Hong Kong and Taiwan with over 600 consultants and over 3,000 customers in China.
MERCERNO.11
GLOBAL 50 HUMAN RESOURCES SERVICE PROVIDERS 2013
48
Company name in Chinese:
/Company name in English:
usg people
Headquarters: Amsterdam Country: Netherlands
Established: 1979 Website: http://www.usgpeople.com
Main Business: Talent Dispatch/Lease/PlacementAnnual revenue of 2012
3,696 million dollars
Stock Exchange: AMS Stock Code: USG
About:
Operating profit Net profit Pre-tax profit Shareholders' equity
-211 -246 -227 641
Major financial data in Fiscal 2012(Unit: $ million)
Major financial ratios in Fiscal 2012
Total assets by the end of 2012 Average total assets Current assets Current liabilities
1,732 2,017 566 777
Receivable by the end of 2012 Average receivable Total liabilities Interest expense
512 580 1,092 /
Indicator RatioCompared with in-dustry average
Net profit margin -6.70% Lower
ROE -38.50% Lower
Debt-asset ratio 63.00% Higher
Current ratio 0.7 Lower
Times Interest Earned
/ /
Indicator RatioCompared with in-dustry average
Revenue growth rate
-18.10% Higher
Total turnover ratio 1.8 Lower
Accounts receivable turnover ratio
6.4 Lower
ROA -12.20% Lower
Operating margin -5.70% Lower
USG People(AMS:USG), is a specialized provider of employment services
in Europe, focusing on the market segments general and specialist tem-
porary employment, professional secondment and projects, HR services
and customer care. We provide this range of services through our independent operating companies. Our
companies are active in eight European countries: Austria, Belgium, France, Germany, Italy, Luxemburg,
the Netherlands and Switzerland. USG People shares are listed on the stock exchange NYSE Euronext
Amsterdam.
usg peopleNO.12
GLOBAL 50 HUMAN RESOURCES SERVICE PROVIDERS 2013
49
Company name in Chinese:
韬睿惠悦Company name in English:
TOWERS WATSON
Headquarters: NewYork, United States of America Country: United States of America
Established: 2010 Website: http://www.towerswatson.com
Main Business: HR ConsultingAnnual revenue of 2012
3,420 million dollars
Stock Exchange: New York Stock Exchange Stock Code: TW
About:
Operating profit Net profit Pre-tax profit Shareholders' equity
400 260 406 2,457
Major financial data in Fiscal 2012(Unit: $ million)
Major financial ratios in Fiscal 2012
Total assets by the end of 2012 Average total assets Current assets Current liabilities
5,357 5,228 1,759 1,103
Receivable by the end of 2012 Average receivable Total liabilities Interest expense
884 831 2,900 /
Indicator RatioCompared with in-dustry average
Net profit margin 7.60% Lower
ROE 10.60% Lower
Debt-asset ratio 54.10% Higher
Current ratio / Lower
Times Interest Earned
/ /
Indicator RatioCompared with in-dustry average
Revenue growth rate
4.90% Higher
Total turnover ratio 0.7 Lower
Accounts receivable turnover ratio
4.1 Lower
ROA 5.00% Lower
Operating margin 11.70% Lower
TOWERS WATSON (NYSE:TW) is a professional services firm focused on pro-viding consulting and other professional services related to employee benefits, human capital and risk and financial management. It provides advisory services
on critical human capital management issues to help its clients manage their costs, talent and risk. It offers clients ser-vices across three business segments: Benefits, Risk and Financial Services, and Talent and Rewards. Towers Watson was formed on January 1, 2010, from the merger of Towers, Perrin, Forster & Crosby, Inc. (Towers Perrin) and Watson Wyatt Worldwide, Inc. (Watson Wyatt). It helps its clients improve business performance by improving their ability to at-tract, retain and motivate employees and to manage and mitigate risk. It focuses on delivering consulting services and technology solutions to help organizations anticipate, identify and capitalize on emerging opportunities in benefits and human capital management.
TOWERS WATSONNO.13
GLOBAL 50 HUMAN RESOURCES SERVICE PROVIDERS 2013
50
Company name in Chinese:
/Company name in English:
TEMP HOLDINGS
Headquarters: Tokyo Country: Japan
Established: 2008 Website: http://www.temp-holdings.co.jp/
Main Business: Human Recourses OutsourcingAnnual revenue of 2012
3,090 million dollars
Stock Exchange: Tokyo Stock Exchange Stock Code: 2181
About:
Operating profit Net profit Pre-tax profit Shareholders' equity
123 74 / 806
Major financial data in Fiscal 2012(Unit: $ million)
Major financial ratios in Fiscal 2012
Total assets by the end of 2012 Average total assets Current assets Current liabilities
1,220 1,172 / /
Receivable by the end of 2012 Average receivable Total liabilities Interest expense
/ / 414 /
Indicator RatioCompared with in-dustry average
Net profit margin 2.40% Lower
ROE 9.20% Lower
Debt-asset ratio 33.90% Lower
Current ratio / /
Times Interest Earned
/ /
Indicator RatioCompared with in-dustry average
Revenue growth rate
1.90% Lower
Total turnover ratio 2.6 Lower
Accounts receivable turnover ratio
/ /
ROA 6.30% Higher
Operating margin 4.00% Lower
TEMP HOLDINGS (TYO: 2181) focused on Management planning,
administration, and operations related to subsidiary and group compa-
nies that handle temporary staffing and placement services. Founded in 2008, listed on the Tokyo Stock
Exchange, with total assets of 20 billion yen, 5,061 employees and 258 offices throughout Japan, also 13
offices in Los Angeles, Seattle, Shanghai, Suzhou, Guangzhou, Shenzhen, Hong Kong, Taiwan, South Ko-
rea, Singapore, Indonesia.
TEMP HOLDINGSNO.14
GLOBAL 50 HUMAN RESOURCES SERVICE PROVIDERS 2013
51
Company name in Chinese:
保圣那Company name in English:
PASONA
Headquarters: Tokyo Country: Japan
Established: 1976 Website: http://www.pasonagroup.co.jp/
Main Business: Talent Dispatch/Lease/PlacementAnnual revenue of 2012
2,269 million dollars
Stock Exchange: Tokyo Stock Exchange Stock Code: 2168
About:
Operating profit Net profit Pre-tax profit Shareholders' equity
25 / / /
Major financial data in Fiscal 2012(Unit: $ million)
Major financial ratios in Fiscal 2012
Total assets by the end of 2012 Average total assets Current assets Current liabilities
886 902 / /
Receivable by the end of 2012 Average receivable Total liabilities Interest expense
/ / / /
Indicator RatioCompared with in-dustry average
Net profit margin / Higher
ROE / Higher
Debt-asset ratio / Higher
Current ratio / Lower
Times Interest Earned
/ /
Indicator RatioCompared with in-dustry average
Revenue growth rate
-2.40% Lower
Total turnover ratio 2.5 Lower
Accounts receivable turnover ratio
/ /
ROA / /
Operating margin 1.10% Lower
PASONA (Tokyo Stock Exchange: 2168), founded in 1976, is a provider
of human resources solutions which provide temporary employees
dispatched, human resources consulting, corporate recruitment, job
outsourcing, employee life solutions, knowledge sharing service. Listed on the Tokyo Stock Exchange.
Currently, the Group’s total assets value 5 billion yen, and Pasona value 3 billion yen in assets.
PASONANO.15
GLOBAL 50 HUMAN RESOURCES SERVICE PROVIDERS 2013
52
Company name in Chinese:
/Company name in English:
PAYCHEX
Headquarters: New York, United States of America Country: United States of America
Established: 1971 Website: http://www.paychex.com
Main Business: Human Resource OutsourcingAnnual revenue of 2012
2,230 million dollars
Stock Exchange: NASDAQ Stock Market Stock Code: PAYX
About:
Operating profit Net profit Pre-tax profit Shareholders' equity
854 548 860 1,605
Major financial data in Fiscal 2012(Unit: $ million)
Major financial ratios in Fiscal 2012
Total assets by the end of 2012 Average total assets Current assets Current liabilities
6,480 5,937 5,076 4,746
Receivable by the end of 2012 Average receivable Total liabilities Interest expense
142 152 4,875 /
Indicator RatioCompared with in-dustry average
Net profit margin 24.60% Higher
ROE 34.10% Higher
Debt-asset ratio 75.20% Higher
Current ratio 1.1 Lower
Times Interest Earned
/ /
Indicator RatioCompared with in-dustry average
Revenue growth rate
7.00% Lower
Total turnover ratio 0.4 Lower
Accounts receivable turnover ratio
14.7 Lower
ROA 9.20% Higher
Operating margin 38.30% Higher
PAYCHEX (NASDAQ:PAYX) is a provider of payroll, human resource and ben-efits outsourcing solutions for small to medium-sized businesses. As of May 31, 2009, the Company serviced approximately 554,000 clients. As of May 31, 2009,
it serviced approximately 1,600 clients in Germany through its offices. It offers a portfolio of services and products that allow its clients to meet their diverse payroll and human resource needs. These include payroll processing, payroll tax administration services, employee payment services, regulatory compliance services (new-hire reporting and garnish-ment processing), human resource outsourcing services, retirement services administration, health and benefits ser-vices, workers’ compensation insurance services, time and attendance solutions and other human resource services and products. In October 2009, the Company announced the sale of Stromberg, a time and attendance company serving mid- to large-sized businesses, to Kronos Incorporated.
PAYCHEXNO.16
GLOBAL 50 HUMAN RESOURCES SERVICE PROVIDERS 2013
53
Company name in Chinese:
/Company name in English:
Insperity
Headquarters: Texas, United States of America Country: United States of America
Established: 1986 Website: http://www.administaff.com
Main Business: Human Resource OutsourcingAnnual revenue of 2012
2,159 million dollars
Stock Exchange: New York Stock Exchange Stock Code: NSP
About:
Operating profit Net profit Pre-tax profit Shareholders' equity
68 40 68 241
Major financial data in Fiscal 2012(Unit: $ million)
Major financial ratios in Fiscal 2012
Total assets by the end of 2012 Average total assets Current assets Current liabilities
750 731 552 436
Receivable by the end of 2012 Average receivable Total liabilities Interest expense
190 182 509 /
Indicator RatioCompared with in-dustry average
Net profit margin 1.90% Lower
ROE 16.60% Lower
Debt-asset ratio 67.90% Higher
Current ratio 1.3 等于
Times Interest Earned
/ /
Indicator RatioCompared with in-dustry average
Revenue growth rate
9.20% Lower
Total turnover ratio 3 Lower
Accounts receivable turnover ratio
11.9 Lower
ROA 5.50% Higher
Operating margin 3.10% Lower
InsperityNO.17
Insperity (NYSE: NSP), formerly Administaff, Inc., is a provider of human resources (HR) and business performance solutions for the United State’s businesses. The Compa-ny provides a range of human resource and business solutions. The Company’s pri-
mary services include workforce optimization, MidMarket solutions, performance management, expense man-agement, time and attendance, organizational planning, recruiting services, employment screening, retirement services, business insurance and technology services. The Company’s workforce optimization services include administrative services, employee benefits, worker’s compensation, payroll, HR support and compensation and Government compliance. Its recruiting services include recruiting and hiring, and employee retention. MidMarket solution includes administrative relief. The Company’s employment screening includes background checks and profile screening.
GLOBAL 50 HUMAN RESOURCES SERVICE PROVIDERS 2013
54
Company name in Chinese:
/Company name in English:
IMPELLAM GROUP
Headquarters: Luton, United Kingdom Country: United Kingdom
Established: / Website: http://www.impellam.com/
Main Business: Human Resource OutsourcingAnnual revenue of 2012
1,920 million dollars
Stock Exchange: London Stock Exchange Stock Code: IPEL
About:
Operating profit Net profit Pre-tax profit Shareholders' equity
54 38 25 204
Major financial data in Fiscal 2012(Unit: $ million)
Major financial ratios in Fiscal 2012
Total assets by the end of 2012 Average total assets Current assets Current liabilities
534 529 192 361
Receivable by the end of 2012 Average receivable Total liabilities Interest expense
361 331 330 /
Indicator RatioCompared with in-dustry average
Net profit margin 2.00% Lower
ROE 18.60% Lower
Debt-asset ratio 61.80% Higher
Current ratio 0.5 Lower
Times Interest Earned
/ /
Indicator RatioCompared with in-dustry average
Revenue growth rate
9.30% Lower
Total turnover ratio 3.6 Higher
Accounts receivable turnover ratio
5.8 Lower
ROA 7.20% Higher
Operating margin 2.80% Lower
IMPELLAM GROUPNO.18
IMPELLAM GROUP (LON:IPEL) is a leading provider of human capital services, including innovative solutions for
the workforce, business process outsourcing (BPO), expertise in technical, professional and medical talent, flexible
workforce consulting, staffing and recruitment. The Group, trading on AIM, conducts business primarily in the UK
and the US, with smaller operations in Australia, Ireland, New Zealand and mainland Europe. The Company has five
segments: Healthcare, UK Commercial, UK Professional & Technical, US Staffing and Support Services. The Company’s Healthcare Staffing
business includes brands like Medacs Healthcare and Chrysalis Homecare. The UK Commercial Staffing segment is a provider of specialised
temporary and permanent recruitment services to a portfolio of public and private sector clients. The UK Professional & Technical brands
provide permanent, temporary and contract recruitment services. The US Staffing brands provide recruitment services ranging from tem-
porary staffing to permanent placement. The category of Support Services brands includes facilities services, event support services, retail
merchandising services, shopfitting and procurement management. The Group employees nearly 6,000 people, including 2,200 managers
and consultants and more than 3,800 support services workers, across a network of 230 branch and regional offices.
GLOBAL 50 HUMAN RESOURCES SERVICE PROVIDERS 2013
55
Company name in Chinese:
/Company name in English:
SYNERGIE
Headquarters: / Country: France
Established: / Website:http://www.synergie.fr/group-uk-intro.
php
Main Business: Headhunting & RPOAnnual revenue of 2012
1,862 million dollars
Stock Exchange: EPA Stock Code: SDG
About:
Operating profit Net profit Pre-tax profit Shareholders' equity
46 19 45 /
Major financial data in Fiscal 2012(Unit: $ million)
Major financial ratios in Fiscal 2012
Total assets by the end of 2012 Average total assets Current assets Current liabilities
/ / / /
Receivable by the end of 2012 Average receivable Total liabilities Interest expense
/ / / /
Indicator RatioCompared with in-dustry average
Net profit margin 1.00% Lower
ROE / /
Debt-asset ratio 62.50% Higher
Current ratio / /
Times Interest Earned
/ /
Indicator RatioCompared with in-dustry average
Revenue growth rate
-0.70% Lower
Total turnover ratio / /
Accounts receivable turnover ratio
/ /
ROA / /
Operating margin 2.50% Lower
SYNERGIENO.19
Synergie SA is a France-based company that specializes in human resources manage-
ment. The Company’s activities include temporary employment, out-placement, social
engineering, recrutment and training services. Synergie SA operates in a range of eco-
nomic sectors, notably industry. The Company has over 500 agencies in several countries
across Europe and in Canada. Synergie SA has a number of subsidiaries, including Synergie Formation (in
France), Gestion Hunt (Canada), Synergie Human Resources (the Netherlands) and Synergie Temporary
Help (the Czech Republic), SA SYNERGIE BELGIUM (Belgium), GESTION HUNT INC (Canada), SYNERGIE
SUISSE SA (Switzerland), SARL SYNERGIE TRAVAIL TEMPORAIRE (Luxembourg), among others.
GLOBAL 50 HUMAN RESOURCES SERVICE PROVIDERS 2013
56
Company name in Chinese:
米高蒲志国际Company name in English:
PageGroup
Headquarters: London, The United Kingdom Country: The United Kingdom
Established: 1976 Website:http://www.michaelpageinternational.
com
Main Business: Headhunting & RPOAnnual revenue of 2012
1,569 million dollars
Stock Exchange: New York Stock Exchange Stock Code: MPI
About:
Operating profit Net profit Pre-tax profit Shareholders' equity
103 98 103 288
Major financial data in Fiscal 2012(Unit: $ million)
Major financial ratios in Fiscal 2012
Total assets by the end of 2012 Average total assets Current assets Current liabilities
548 545 412 254
Receivable by the end of 2012 Average receivable Total liabilities Interest expense
290 297 260 /
Indicator RatioCompared with in-dustry average
Net profit margin 6.20% Higher
ROE 34.00% Higher
Debt-asset ratio 61.20% Higher
Current ratio 1.6 Lower
Times Interest Earned
/ /
Indicator RatioCompared with in-dustry average
Revenue growth rate
-4.00% Lower
Total turnover ratio 2.9 Higher
Accounts receivable turnover ratio
5.3 Lower
ROA 18.00% Higher
Operating margin 6.60% Higher
PageGroupNO.20
PageGroup (LON:MPI) was established in London in 1976, and it is the
leading recruitment consulting institution to represent the high-end
employers to be engaged in the professional recruitment business for
long-term, contractual and temporary posts. Michael Page International
has 162 offices in 34 countries in the world. Michael Page International is listed on board of London Stock
Exchange, annual turnover is over 1 billion US Dollar. And it set up the first office in Shanghai, China in
2003. At present, Michael Page International has its offices in all main commercial centers of the world,
including Hong Kong, London, New York, Paris, Tokyo, Toronto, Singapore and Sydney.
GLOBAL 50 HUMAN RESOURCES SERVICE PROVIDERS 2013
57
Company name in Chinese:
/Company name in English:
CHANDLER MACLEOD
Headquarters: Sydney, Australia Country: Australia
Established: / Website: http://www.chandlermacleod.com
Main Business: OutsourcingAnnual revenue of 2012
1,549 million dollars
Stock Exchange: Australian Securities Exchange Stock Code: CMG
About:
Operating profit Net profit Pre-tax profit Shareholders' equity
/ 16 23 159
Major financial data in Fiscal 2012(Unit: $ million)
Major financial ratios in Fiscal 2012
Total assets by the end of 2012 Average total assets Current assets Current liabilities
368 340 146 124
Receivable by the end of 2012 Average receivable Total liabilities Interest expense
209 168 209 /
Indicator RatioCompared with in-dustry average
Net profit margin 1.00% Lower
ROE 10.10% Lower
Debt-asset ratio 56.80% Lower
Current ratio 1.2 Lower
Times Interest Earned
/ /
Indicator RatioCompared with in-dustry average
Revenue growth rate
32.60% Higher
Total turnover ratio 4.6 Higher
Accounts receivable turnover ratio
9.2 Lower
ROA 4.70% Lower
Operating margin / /
Chandler Macleod Group LimitedNO.21
CHANDLER MACLEOD(ASX:CMG) is engaged in the business of human re-source (HR) outsourcing, recruitment and consulting services. As of June 30, 2010, it offered complete and fully integrated recruitment and HR outsourcing services
across blue-collar, white-collar, executive and professional recruitment and contracting. It also offered consulting ser-vices encompassing psychometric assessment, management, organisational development, executive coaching, out-placement, career transition, talent management, and redeployment. Its segments consist of: Workforce, which includes ready workforce, for staff aviation, Chandler Macleod health, providing tradespeople, semi-skilled and unskilled labour recruitment for the industrial sector; Recruitment that provides permanent and temporary recruitment services; Consult-ing that provides HR consulting and training; OCG, which is a New Zealand-based white collar and information technol-ogy provider, and CMyPeople, which is a web enabled assessment tool.
GLOBAL 50 HUMAN RESOURCES SERVICE PROVIDERS 2013
58
Company name in Chinese:
/Company name in English:
TRUEBLUE
Headquarters: New York Country: America
Established: 1989 Website: http://www.trueblueinc.com
Main Business: Talent Dispatch/Lease/ PlacementAnnual revenue of 2012
1,390 million dollars
Stock Exchange: NYSE Stock Code: TBI
About:
Operating profit Net profit Pre-tax profit Shareholders' equity
372 34 55 334
Major financial data in Fiscal 2012(Unit: $ million)
Major financial ratios in Fiscal 2012
Total assets by the end of 2012 Average total assets Current assets Current liabilities
602 581 602 155
Receivable by the end of 2012 Average receivable Total liabilities Interest expense
167 160 268 /
Indicator RatioCompared with in-dustry average
Net profit margin 2.40% Higher
ROE 10.20% Higher
Debt-asset ratio 44.50% Lower
Current ratio 3.9 Higher
Times Interest Earned
/ /
Indicator RatioCompared with in-dustry average
Revenue growth rate
5.60% Lower
Total turnover ratio 2.4 Lower
Accounts receivable turnover ratio
8.7 Lower
ROA 5.80% Higher
Operating margin 26.80% Higher
TRUEBLUENO.22
TRUEBLUE is the leading provider of blue-collar staffing. In 2009, TRUEBLUE con-
nected approximately 300,000 people to work through the following brands: Labor
Ready, Spartan Staffing, CLP Resources, PlaneTechs, and Centerline, and served
approximately 175,000 businesses in the services, retail, wholesale, manufacturing,
transportation, and construction industries. The TRUEBLUE family of companies provides individuals with
opportunities for growth and customers with the help they need to succeed in today’s competitive en-
vironment.
GLOBAL 50 HUMAN RESOURCES SERVICE PROVIDERS 2013
59
Company name in Chinese:
/Company name in English:
On Assignment
Headquarters: California, the United States of America Country: the United States of America
Established: 1985 Website: http://www.onassignment.com
Main Business: Talent DispatchAnnual revenue of 2012
1,240 million dollars
Stock Exchange: NASDAQ Stock Market Stock Code: ASGN
About:
Operating profit Net profit Pre-tax profit Shareholders' equity
93 43 75 533
Major financial data in Fiscal 2012(Unit: $ million)
Major financial ratios in Fiscal 2012
Total assets by the end of 2012 Average total assets Current assets Current liabilities
1,098 754 294 119
Receivable by the end of 2012 Average receivable Total liabilities Interest expense
243 168 565 /
Indicator RatioCompared with in-dustry average
Net profit margin 3.40% Higher
ROE 8.00% Higher
Debt-asset ratio 51.50% Lower
Current ratio 2.5 Higher
Times Interest Earned
5.2 Higher
Indicator RatioCompared with in-dustry average
Revenue growth rate
107.60% Higher
Total turnover ratio 1.6 Lower
Accounts receivable turnover ratio
7.4 Lower
ROA 5.70% Higher
Operating margin 7.50% Higher
On AssignmentNO.23
On Assignment (NASDAQ:ASGN) is a diversified professional staffing firm providing flex-
ible and permanent staffing solutions in specialty skills, including laboratory/scientific,
healthcare/nursing/physician, medical financial, information technology (IT) and engineer-
ing. The Company provides clients in these markets with short-term or long-term as-
signments of contract professionals, contract-to-permanent placement and direct placement of these professionals.
The Company’s business consists of four operating segments: Life Sciences, Healthcare, Physician, and IT and Engi-
neering. On October 1, 2009, the Company acquired Fox Hill & Associates. In April 2010, the Company completed the
acquisition of The Cambridge Group Ltd., a provider of specialized staffing in Physician, Clinical/Scientific and IT. In July
2010, the Company acquired Sharpstream. In February 2011, the Company acquired Valesta.
GLOBAL 50 HUMAN RESOURCES SERVICE PROVIDERS 2013
60
Company name in Chinese:
/Company name in English:
CDI Corporation
Headquarters: Philadelphia, United States of America Country: United States of America
Established: 1950 Website: http://www.cdicorp.com/
Main Business: Talent DispatchAnnual revenue of 2012
1,105 million dollars
Stock Exchange: New York Stock Exchange Stock Code: CDI
About:
Operating profit Net profit Pre-tax profit Shareholders' equity
32 19 32 280
Major financial data in Fiscal 2012(Unit: $ million)
Major financial ratios in Fiscal 2012
Total assets by the end of 2012 Average total assets Current assets Current liabilities
401 396 282 104
Receivable by the end of 2012 Average receivable Total liabilities Interest expense
224 223 121 /
Indicator RatioCompared with in-dustry average
Net profit margin 1.80% Higher
ROE 6.90% Higher
Debt-asset ratio 30.20% Lower
Current ratio 2.7 Higher
Times Interest Earned
10.7 Lower
Indicator RatioCompared with in-dustry average
Revenue growth rate
4.30% Lower
Total turnover ratio 2.8 Lower
Accounts receivable turnover ratio
4.9 Lower
ROA 4.90% Higher
Operating margin 2.90% Lower
CDI CorporationNO.24
CDI Corp. (NYSE:CDI) provides engineering and information technology outsourcing and pro-
fessional staffing services to its customers. The Company provides project outsourcing services
for its customers’ engineering, information technology and project management needs, staffing
services to augment its customers’ workforces and a range of professional services to meet its
customers’ permanent placement needs. The Company operates through four reporting seg-
ments: Engineering Solutions (ES), Management Recruiters International (MRI), AndersElite (Anders) and Infor-
mation Technology Solutions (ITS). In June 2010, the Company acquired L. Robert Kimball & Associates, Inc. In
December 2010, the Company acquired the business of DSPCon, Inc.
GLOBAL 50 HUMAN RESOURCES SERVICE PROVIDERS 2013
61
Company name in Chinese:
/Company name in English:
KFORCE
Headquarters: Florida, United States of America Country: United States of America
Established: 1966 Website: http://www.kforce.com
Main Business: Recruiting/HeadhuntingAnnual revenue of 2012
1,082 million dollars
Stock Exchange: NASDAQ Stock Market Stock Code: KFRC
About:
Operating profit Net profit Pre-tax profit Shareholders' equity
-54 -14 -56 170
Major financial data in Fiscal 2012(Unit: $ million)
Major financial ratios in Fiscal 2012
Total assets by the end of 2012 Average total assets Current assets Current liabilities
325 367 172 99
Receivable by the end of 2012 Average receivable Total liabilities Interest expense
152 164 155 1
Indicator RatioCompared with in-dustry average
Net profit margin -1.30% Lower
ROE -8.20% Lower
Debt-asset ratio 61.10% Higher
Current ratio 1.7 Lower
Times Interest Earned
/ /
Indicator RatioCompared with in-dustry average
Revenue growth rate
-2.60% Lower
Total turnover ratio 2.9 Higher
Accounts receivable turnover ratio
6.6 Lower
ROA -3.80% Lower
Operating margin -5.00% Higher
KFORCENO.25
KFORCE (NASDAQ:KFRC) is a provider of professional and technical specialty staff-
ing services and solutions. The Company provides its clients staffing services and
solutions through four operating segments: Technology (Tech), Finance and Ac-
counting (FA), Health and Life Sciences (HLS) and Government Solutions (GS). KFORCE organizes and manages its FA
and Tech business units along regional market lines in Atlantic, North and Western markets. The HLS and GS segments
are organized and managed by specialty because of the operating characteristics of each business. KFORCE’s staffing
services consist of Flex and Search. In April 2009, KFORCEGovernment Solutions (KGS) and dNovus RDI merged to pro-
vide a spectrum of solutions and services to government enterprises.
GLOBAL 50 HUMAN RESOURCES SERVICE PROVIDERS 2013
62

Company name in Chinese:
/Company name in English:
Headquarters: California, USA Country: The USA
Established: 2002 Website: http://www.linkedin.com/
Main Business: Online RecruitmentAnnual revenue of 2012
972 million dollars
Stock Exchange: NASDAQ Stock Market Stock Code: LNKD
About:
Operating profit Net profit Pre-tax profit Shareholders' equity
57 22 57 908
Major financial data in Fiscal 2012(Unit: $ million)
Major financial ratios in Fiscal 2012
Total assets by the end of 2012 Average total assets Current assets Current liabilities
1,382 1,128 1,019 415
Receivable by the end of 2012 Average receivable Total liabilities Interest expense
204 157 474 /
Indicator RatioCompared with in-dustry average
Net profit margin 2.20% Lower
ROE 2.40% Lower
Debt-asset ratio 34.30% Lower
Current ratio 2.5 Higher
Times Interest Earned
/ Lower
Indicator RatioCompared with in-dustry average
Revenue growth rate
86.30% Higher
Total turnover ratio 0.9 Higher
Accounts receivable turnover ratio
6.2 Lower
ROA 1.90% Lower
Operating margin 5.80% Lower
LinkedinNO.26
Linkedin Corporation (NASDAQ: LNKD), established in December 2002 and
launched in 2003, headquartered in Mountain View, California (Mountain View).
On May 20, 2011, LinkedIn listed. Currently, LinkedIn has over 100 million users in
more than 200 countries and regions. On LinkedIn platform, users can produce, manage and share their
professional identity online, and establish or participate in professional networks. Users can access shared
knowledge and insights, looking for business opportunities, and improve their productivity and success.
GLOBAL 50 HUMAN RESOURCES SERVICE PROVIDERS 2013
63
Company name in Chinese:
/Company name in English:
sthree
Headquarters: London, United Kingdom Country: United Kingdom
Established: 1986 Website: http://www.sthree.com/
Main Business: Recruitment/headhuntingAnnual revenue of 2012
915 million dollars
Stock Exchange: London Stock Exchange Stock Code: STHR
About:
Operating profit Net profit Pre-tax profit Shareholders' equity
40 / 40 103
Major financial data in Fiscal 2012(Unit: $ million)
Major financial ratios in Fiscal 2012
Total assets by the end of 2012 Average total assets Current assets Current liabilities
266 278 227 164
Receivable by the end of 2012 Average receivable Total liabilities Interest expense
181 177 163 /
Indicator RatioCompared with in-dustry average
Net profit margin / /
ROE / /
Debt-asset ratio 49.80% Higher
Current ratio 1.4 Lower
Times Interest Earned
/ /
Indicator RatioCompared with in-dustry average
Revenue growth rate
8.80% Higher
Total turnover ratio 3.3 Higher
Accounts receivable turnover ratio
5.2 Lower
ROA / /
Operating margin 4.30% Higher
sthreeNO.27
sthree(LON:STHR) is a United Kingdom-based company engaged in the permanent and
contract staffing business. The Company’s recruitment areas include banking and finance, ac-
countancy, energy and natural resources, telecommunications, healthcare, engineering, pharma
and biotech, human resources, information technology, legal, procurement and supply chain,
sales, and marketing. It operates in four brands, including Computer Futures Solutions, Huxley Associates, Progres-
sive and Real Staffing Group. The Company operates in three geographical segments: the United Kingdom, Continental
Europe and the Rest of the World. During the fiscal year ended November 28, 2010 (fiscal 2010), the Company had 53
offices in 13 countries.
GLOBAL 50 HUMAN RESOURCES SERVICE PROVIDERS 2013
64
Company name in Chinese:
华德士Company name in English:
ROBERT WALTERS
Headquarters: London, The United Kingdom Country: The United Kingdom
Established: 1995 Website: http://www.robertwalters.com
Main Business: Recruiting/HeadhuntingAnnual revenue of 2012
900 million dollars
Stock Exchange: LON Stock Code: RWA
About:
Operating profit Net profit Pre-tax profit Shareholders' equity
13 / 12 113
Major financial data in Fiscal 2012(Unit: $ million)
Major financial ratios in Fiscal 2012
Total assets by the end of 2012 Average total assets Current assets Current liabilities
291 280 244 176
Receivable by the end of 2012 Average receivable Total liabilities Interest expense
203 191 177 1.2
Indicator RatioCompared with in-dustry average
Net profit margin / Higher
ROE / Higher
Debt-asset ratio 48.80% Higher
Current ratio 1.4 Lower
Times Interest Earned
/ /
Indicator RatioCompared with in-dustry average
Revenue growth rate
9.80% Higher
Total turnover ratio 3.2 Higher
Accounts receivable turnover ratio
4.7 Lower
ROA / /
Operating margin 1.50% Lower
ROBERT WALTERSNO.28
Robert Walters ,Established in 1985 and listed on the London Stock Exchange
(RWA) since 2000, is one of the world’s leading professional recruitment con-
sultancies. Robert Walters recruits across the accounting, finance, banking, IT,
human resources, legal, sales and marketing, supply chain and engineering and support fields. Robert
Walters has 47 offices in 23 countries and over 2,000 members of staff worldwide. Robert Walters in
China has four branches: Shanghai, Suzhou, Beijing and Nanjing for the demand of Chinese enterprises
recruitment and employees applying for jobs.
GLOBAL 50 HUMAN RESOURCES SERVICE PROVIDERS 2013
65
Company name in Chinese:
/Company name in English:
monsterworldwide
Headquarters: New York, United States of America Country: United States of America
Established: 1967 Website: http://www.monster.com
Main Business: Online RecruitmentAnnual revenue of 2012
890 million dollars
Stock Exchange: NASDAQ Stock Market Stock Code: MWW
About:
Operating profit Net profit Pre-tax profit Shareholders' equity
32 -259 26 880
Major financial data in Fiscal 2012(Unit: $ million)
Major financial ratios in Fiscal 2012
Total assets by the end of 2012 Average total assets Current assets Current liabilities
1,685 1,871 580 585
Receivable by the end of 2012 Average receivable Total liabilities Interest expense
336 340 805 /
Indicator RatioCompared with in-dustry average
Net profit margin -29.10% Lower
ROE -29.40% Lower
Debt-asset ratio 47.80% Higher
Current ratio 1 Lower
Times Interest Earned
/ /
Indicator RatioCompared with in-dustry average
Revenue growth rate
-14.40% Lower
Total turnover ratio 0.5 Lower
Accounts receivable turnover ratio
2.6 Lower
ROA -13.80% Lower
Operating margin 3.60% Lower
monsterworldwideNO.29
monsterworldwide (NASDAQ:MWW) provides global online employment
solution. With a presence in approximately 55 countries globally, including
key markets in North America, Europe, Asia and Latin America, Monster
offers online recruiting solutions. Through online media sites and services, Monster Worldwide delivers targeted audi-
ences to advertisers. The Company operates in three segments: Careers - North America, Careers - International and
Internet Advertising & Fees. During the year ended December 31, 2010, these operating segments represented approxi-
mately 46%, 40% and 14% of its consolidated revenue, respectively. On August 24, 2010, Monster completed the ac-
quisition of Yahoo! HotJobs from Yahoo!. On December 31, 2010, the Company completed the acquisition of JobBusan,
a business that provides online recruiting in Busan, South Korea.
GLOBAL 50 HUMAN RESOURCES SERVICE PROVIDERS 2013
66
Company name in Chinese:
克罗诺思Company name in English:
KRONOS
Headquarters: Massachusetts, United States of America Country: United States of America
Established: 1977 Website: www.kronos.com
Main Business: e-HRAnnual revenue of 2012
870 million dollars
Stock Exchange: / Stock Code: /
About:
Operating profit Net profit Pre-tax profit Shareholders' equity
/ / / /
Major financial data in Fiscal 2012(Unit: $ million)
Major financial ratios in Fiscal 2012
Total assets by the end of 2012 Average total assets Current assets Current liabilities
/ / / /
Receivable by the end of 2012 Average receivable Total liabilities Interest expense
/ / / /
Indicator RatioCompared with in-dustry average
Net profit margin / /
ROE / /
Debt-asset ratio / /
Current ratio / /
Times Interest Earned
/ /
Indicator RatioCompared with in-dustry average
Revenue growth rate
8.80% Lower
Total turnover ratio / /
Accounts receivable turnover ratio
/ /
ROA / /
Operating margin / /
KRONOSNO.30
KRONOS makes and implements workforce management software particularly
for organizations with large, complex workforces. With a goal of controlling la-
bor costs and improving employee productivity, its various software products
automatically collect time and attendance data, manage scheduling and absence, oversee administrative HR,
payroll, and hiring processes, and provide data analytics on cost and performance problems. KRONOSsells
directly and through partnerships. Serving more than half of the Fortune 1,000, it focuses on the education,
health care, hospitality, manufacturing, retail, and government markets, among others.
GLOBAL 50 HUMAN RESOURCES SERVICE PROVIDERS 2013
67
Company name in Chinese:
明达科Company name in English:
MEITEC
Headquarters: / Country: Japan
Established: Toy Website: http://www.meitec.co.jp
Main Business: Recruiting/HeadhuntingAnnual revenue of 2012
837 million dollars
Stock Exchange: Tokyo Stock Code: 9744
About:
Operating profit Net profit Pre-tax profit Shareholders' equity
68 35 69 465
Major financial data in Fiscal 2012(Unit: $ million)
Major financial ratios in Fiscal 2012
Total assets by the end of 2012 Average total assets Current assets Current liabilities
719 734 508 140
Receivable by the end of 2012 Average receivable Total liabilities Interest expense
133 136 254 1.1
Indicator RatioCompared with in-dustry average
Net profit margin 4.2% Higher
ROE 7.6% Higher
Debt-asset ratio 35.4% Higher
Current ratio 3.6 Higher
Times Interest Earned
63.8 Higher
Indicator RatioCompared with in-dustry average
Revenue growth rate
-3.8% Lower
Total turnover ratio 1.1 Lower
Accounts receivable turnover ratio
6.1 Lower
ROA 4.8% Higher
Operating margin 8.1% Higher
MEITECNO.31
A company engaged in the provision of staffing services, engineer-
ing solution services, global services and career support services.
The Staffing segment is engaged in the provision of technician
staffing service with a focus on engineer staffing. The Engineering Solution segment is engaged in the
provision of engineering solution services with a focus on printed circuit board design service. The Global
segment is engaged in the human resource cultivation, stuff agency and human resource consulting
businesses in China. The Referral segment is engaged in the provision of re-employment support ser-
vices, job agency services for engineers and Internet-based information services, as well as publications.
GLOBAL 50 HUMAN RESOURCES SERVICE PROVIDERS 2013
68
Company name in Chinese:
光辉国际Company name in English:
KORN/FERRY INTERNATIONAL
Headquarters: Los Angeles, United States of America Country: United States of America
Established: 1969 Website: http://www.kornferry.com
Main Business: Recruiting/HeadhuntingAnnual revenue of 2012
827 million dollars
Stock Exchange: NASDAQ Stock Exchange Stock Code: KFY
About:
Operating profit Net profit Pre-tax profit Shareholders' equity
83 54 81 629
Major financial data in Fiscal 2012(Unit: $ million)
Major financial ratios in Fiscal 2012
Total assets by the end of 2012 Average total assets Current assets Current liabilities
1,015 993 500 215
Receivable by the end of 2012 Average receivable Total liabilities Interest expense
11 70 385 3.3
Indicator RatioCompared with in-dustry average
Net profit margin 6.6% Higher
ROE 8.6% Higher
Debt-asset ratio 38.0% Higher
Current ratio 2.3 Higher
Times Interest Earned
25.1 Higher
Indicator RatioCompared with in-dustry average
Revenue growth rate
6.5% Higher
Total turnover ratio 0.8 Lower
Accounts receivable turnover ratio
11.8 Higher
ROA 5.5% Higher
Operating margin 10.0% Higher
KORN/FERRY INTERNATIONALNO.32
KORN/FERRY INTERNATIONAL (NYSE:KFY), founded in America in 1969 and headquartered in Los Angeles, America, has over 90 offices in 40 countries. Korn/Ferry International entered China in 1978, and it is the first
foreign human resources consulting company to carry out business in China after China joined in WTO. It has set up four subsidiaries in China, namely, Hong Kong, Beijing, Shanghai, Guangzhou, Taipei, and it has a consulting team that is composed of 300 Chinese local staff, overseas returnees and foreign staff. Besides, as one of the world largest talents management consulting companies, Korn/Ferry International’s five branches are approved to be wholly foreign owned company. Up to now, the service system of Korn/Kerry International has covered whole-package solutions including senior executives seeking, talents management and leadership consulting, and recruitment outsourcing, middle-level talents recruitment.
GLOBAL 50 HUMAN RESOURCES SERVICE PROVIDERS 2013
69
Company name in Chinese:
翰德Company name in English:
Hudson
Headquarters: New York, United States of America Country: United States of America
Established: 1967 Website: http://www.hudson.com
Main Business: Recruiting/HeadhuntingAnnual revenue of 2012
778million dollars
Stock Exchange: NASDAQ Stock Market Stock Code: HHGP
About:
Operating profit Net profit Pre-tax profit Shareholders' equity
-7 -5 7 107
Major financial data in Fiscal 2012(Unit: $ million)
Major financial ratios in Fiscal 2012
Total assets by the end of 2012 Average total assets Current assets Current liabilities
193 205 157 67
Receivable by the end of 2012 Average receivable Total liabilities Interest expense
107 119 87 0.6
Indicator RatioCompared with in-dustry average
Net profit margin -0.7% Lower
ROE -5.0% Lower
Debt-asset ratio 44.9% Lower
Current ratio 2.3 Higher
Times Interest Earned
12.1 Higher
Indicator RatioCompared with in-dustry average
Revenue growth rate
-16.7% Lower
Total turnover ratio 3.8 Higher
Accounts receivable turnover ratio
6.5 Lower
ROA -2.6% Lower
Operating margin -0.9% Lower
HudsonNO.33
Hudson Highland Group, Inc. (NASDAQ:HHGP) is specialized professional staffing
and talent management solutions providers. The Company provides professional staff-
ing services on a permanent and contract consulting basis and a range of talent man-
agement services to businesses operating in many industries. The Company helps its
clients in recruiting and developing employees for professional-level functional and managerial positions. The Company
operates in four reportable segments: Hudson Europe, Hudson Australia and New Zealand (ANZ), Hudson Americas and
Hudson Asia. During the year ended December 31, 2010, these segments constituted approximately 46%, 30%, 13%
and 11% of the Company’s gross margin, respectively.
GLOBAL 50 HUMAN RESOURCES SERVICE PROVIDERS 2013
70
Company name in Chinese:
/Company name in English:
CORPORATE RESOURCE SERVICES
Headquarters: The USA Country: The USA
Established: / Website: http://www.crsco.com/
Main Business: Talent Dispatch/Lease/ PlacementAnnual revenue of 2012
640 million dollars
Stock Exchange: OTC Stock Code: CRRS
About:
Operating profit Net profit Pre-tax profit Shareholders' equity
2 -3 / 15
Major financial data in Fiscal 2012(Unit: $ million)
Major financial ratios in Fiscal 2012
Total assets by the end of 2012 Average total assets Current assets Current liabilities
48 47 30 31
Receivable by the end of 2012 Average receivable Total liabilities Interest expense
5 7 33 4.1
Indicator RatioCompared with in-dustry average
Net profit margin -0.5% Lower
ROE -22.9% Lower
Debt-asset ratio 69.2% Higher
Current ratio 1.0 Lower
Times Interest Earned
/ /
Indicator RatioCompared with in-dustry average
Revenue growth rate
18.7% Higher
Total turnover ratio 13.7 Higher
Accounts receivable turnover ratio
93.5 Higher
ROA -7.2% Lower
Operating margin -0.3% Lower
CORPORATE RESOURCE SERVICESNO.34
CORPORATE RESOURCE SERVICES, formerly Accountabilities, Inc., is a provid-
er of diversified staffing, recruiting and consulting services, including temporary
staffing services, with a focus on light industrial services, clerical and administra-
tive support and insurance related staffing. On November 21, 2011, the Company
acquired TS Staffing Services, Inc.
GLOBAL 50 HUMAN RESOURCES SERVICE PROVIDERS 2013
71
Company name in Chinese:
荟才Company name in English:
RESOURCES GLOBAL PROFESSION-
ALS
Headquarters: United States of America Country: United States of America
Established: 1996 Website: http://www.resourcesglobal.com
Main Business: HR ConsultingAnnual revenue of 2012
572 million dollars
Stock Exchange: NASDAQ Stock Market Stock Code: RECN
About:
Operating profit Net profit Pre-tax profit Shareholders' equity
73 41 73 366
Major financial data in Fiscal 2012(Unit: $ million)
Major financial ratios in Fiscal 2012
Total assets by the end of 2012 Average total assets Current assets Current liabilities
431 454 228 62
Receivable by the end of 2012 Average receivable Total liabilities Interest expense
84 88 65 0.3
Indicator RatioCompared with in-dustry average
Net profit margin 7.2% Lower
ROE 11.2% Higher
Debt-asset ratio 15.0% Lower
Current ratio 3.7 Higher
Times Interest Earned
/ /
Indicator RatioCompared with in-dustry average
Revenue growth rate
4.8% Lower
Total turnover ratio 1.3 Higher
Accounts receivable turnover ratio
6.5 Higher
ROA 9.1% Higher
Operating margin 12.8% Higher
RESOURCES GLOBAL PROFESSIONALS NO.35
RESOURCES GLOBAL PROFESSIONALS , Inc. (NASDAQ:Resources) is a multinational pro-fessional services firm. Its operating entities provide services under the name Resources Global Professionals (Resources Global). The Company provides finance and accounting ser-vices, information management services, corporate advisory, strategic communications and restructuring services, risk management and internal audit services, supply chain manage-
ment services, acturial services, human capital services, and legal and regulatory services. On May 12, 2009, the Com-pany acquired certain intangible assets comprising the Ohio-based professional services business of Kenwood Cooper LLC operated under the name Xperianz (Xperianz). In November 2009, the Company acquired certain assets of Sitrick And Company, a communications firm and Brincko Associates, Inc., a corporate advisory and restructuring firm with op-erations primarily in the United States.
GLOBAL 50 HUMAN RESOURCES SERVICE PROVIDERS 2013
72
Company name in Chinese:
/Company name in English:
HARVEY NASH
Headquarters: London, The United Kingdom Country: The United Kingdom
Established: 1988 Website: http://www.harveynash.com
Main Business: Recruiting/HeadhuntingAnnual revenue of 2012
533 million dollars
Stock Exchange: London Stock Exchange Stock Code: HVN
About:
Operating profit Net profit Pre-tax profit Shareholders' equity
9 / 8 64
Major financial data in Fiscal 2012(Unit: $ million)
Major financial ratios in Fiscal 2012
Total assets by the end of 2012 Average total assets Current assets Current liabilities
169 204 116 105
Receivable by the end of 2012 Average receivable Total liabilities Interest expense
97 114 106 0.5
Indicator RatioCompared with in-dustry average
Net profit margin / /
ROE / /
Debt-asset ratio 62.5% Lower
Current ratio 1.1 Lower
Times Interest Earned
18.9 Higher
Indicator RatioCompared with in-dustry average
Revenue growth rate
-18.7% Lower
Total turnover ratio 2.6 Higher
Accounts receivable turnover ratio
4.7 Lower
ROA / /
Operating margin 1.7% Higher
HARVEY NASHNO.36
Harvey Nash Group plc (LON: HVN) is a United Kingdom-based professional
recruitment and outsourcing consultancy company. It is engaged in provid-
ing information technology professionals for permanent and contract positions
globally. The Company operates in three segments: permanent recruitment, contracting and
outsourcing.
GLOBAL 50 HUMAN RESOURCES SERVICE PROVIDERS 2013
73
Company name in Chinese:
海德思哲Company name in English:
HEIDRICK&STRUGGLES
Headquarters: Chicago, United States of America Country: United States of America
Established: 1953 Website: http://www.heidrick.com
Main Business: Recruiting/ HeadhuntingAnnual revenue of 2012
466 million dollars
Stock Exchange: NASDAQ Stock Exchange Stock Code: HSII
About:
Operating profit Net profit Pre-tax profit Shareholders' equity
20 6 20 248
Major financial data in Fiscal 2012(Unit: $ million)
Major financial ratios in Fiscal 2012
Total assets by the end of 2012 Average total assets Current assets Current liabilities
495 505 226 152
Receivable by the end of 2012 Average receivable Total liabilities Interest expense
6 52 247 /
Indicator RatioCompared with in-dustry average
Net profit margin 1.3% Lower
ROE 2.5% Higher
Debt-asset ratio 49.8% Lower
Current ratio 1.5 Higher
Times Interest Earned
/ /
Indicator RatioCompared with in-dustry average
Revenue growth rate
-15.9% Lower
Total turnover ratio 0.9 Lower
Accounts receivable turnover ratio
8.9 Higher
ROA 1.2% Higher
Operating margin 4.2% Higher
HEIDRICK&STRUGGLESNO.37
HEIDRICK&STRUGGLES, Inc. (NASDAQ:HSII) is a pro-vider of executive search and leadership consulting services. The Company helps its clients build leadership teams by
facilitating the recruitment, management and deployment of senior executives. In addition to executive search, Heidrick & Struggles provides a range of leadership consulting services to clients. These services include succession planning, executive assessment, talent retention management, executive develop-ment, transition consulting for newly appointed executives, and management and administration (M&A) human capital integration consulting. In February 2009, the Company acquired Ray & Berndtson Sp. z o. o, a retained executive search firm in Warsaw, Poland.
GLOBAL 50 HUMAN RESOURCES SERVICE PROVIDERS 2013
74
Company name in Chinese:
/Company name in English:
FULLCAST HLDGS
Headquarters: Tokyo Country: Japan
Established: 1990 Website: http://www.fullcast.co.jp/
Main Business: OutsourcingAnnual revenue of 2012
461.2 million dollars
Stock Exchange: TYO Stock Code: 4848
About:
Operating profit Net profit Pre-tax profit Shareholders' equity
18 18 22 68
Major financial data in Fiscal 2012(Unit: $ million)
Major financial ratios in Fiscal 2012
Total assets by the end of 2012 Average total assets Current assets Current liabilities
103 108 87 32
Receivable by the end of 2012 Average receivable Total liabilities Interest expense
6 27 35 0.3
Indicator RatioCompared with in-dustry average
Net profit margin 3.9% Lower
ROE 26.4% Higher
Debt-asset ratio 34.4% Lower
Current ratio 2.7 Higher
Times Interest Earned
90.2 等于
Indicator RatioCompared with in-dustry average
Revenue growth rate
3.4% Lower
Total turnover ratio 4.3 Higher
Accounts receivable turnover ratio
16.9 Lower
ROA 16.5% Higher
Operating margin 3.9% Lower
FULLCAST HLDGSNO.38
FULLCAST HLDGS is a Japan-based holding company principally engaged in
the human resource outsourcing business. The Company operates in two busi-
ness segments. The Short-term Business Support segment is engaged in the
provision of short-term and events-related human resource services. The Se-
curity segment is engaged in the security guard business for public facilities and general corporations. On
May 31, 2011, the Company sold its subsidiary Fullcast Technology. On April 27, 2012, the Company fully
acquired a Tokyo-based company engaged in the operation of adoption support service.
GLOBAL 50 HUMAN RESOURCES SERVICE PROVIDERS 2013
75
Company name in Chinese:
/Company name in English:
seek
Headquarters: Melbourne, Australia Country: Australia
Established: / Website: http://www.seek.com.au/
Main Business: Online RecruitmentAnnual revenue of 2012
461.1million dollars
Stock Exchange: Australian Securities Exchange Stock Code: SEK
About:
Operating profit Net profit Pre-tax profit Shareholders' equity
137 / 191 799
Major financial data in Fiscal 2012(Unit: $ million)
Major financial ratios in Fiscal 2012
Total assets by the end of 2012 Average total assets Current assets Current liabilities
1,441 1,206 168 231
Receivable by the end of 2012 Average receivable Total liabilities Interest expense
68 56 643 24.5
Indicator RatioCompared with in-dustry average
Net profit margin / /
ROE / /
Debt-asset ratio 44.6% Higher
Current ratio 0.7 Lower
Times Interest Earned
8.8 Higher
Indicator RatioCompared with in-dustry average
Revenue growth rate
33.7% Higher
Total turnover ratio 0.4 Lower
Accounts receivable turnover ratio
8.2 Lower
ROA / /
Operating margin 29.7% Higher
seekNO.39
seek(ASX:SEK) is an Australia-based company engaged in advertising employment clas-sifieds and related services on the Internet, and provision and distribution of vocational train-ing and higher education courses. The Company operates in two segments: online employ-ment classified advertising (Employment) and the provision and execution of training courses
(Education). The Employment business is considered as one reporting segment, which provides online employment classified advertising services through the SEEK Website. It sells these services in Australia, New Zealand and United Kingdom. The Education division comprises two segments: Learning and Think. The Learning business markets, sells and distributes (predominately through online channels) vocational training and education training courses in Australia. Think is a provider of vocational training and higher education courses, including classroom based and distance learning courses and operates in Australia.
GLOBAL 50 HUMAN RESOURCES SERVICE PROVIDERS 2013
76
Company name in Chinese:
/Company name in English:
Barrett Business Services, Inc.(BBSI)
Headquarters: Washington, United States of America Country: United States of America
Established: / Website: http://www.barrettbusiness.com
Main Business: HR OutsourcingAnnual revenue of 2012
403 million dollars
Stock Exchange: NASDAQ Stock Market Stock Code: BBSI
About:
Operating profit Net profit Pre-tax profit Shareholders' equity
19 13 19 54
Major financial data in Fiscal 2012(Unit: $ million)
Major financial ratios in Fiscal 2012
Total assets by the end of 2012 Average total assets Current assets Current liabilities
229 226 139 111
Receivable by the end of 2012 Average receivable Total liabilities Interest expense
64 57 175 /
Indicator RatioCompared with in-dustry average
Net profit margin 3.3% Lower
ROE 24.4% Lower
Debt-asset ratio 76.5% Lower
Current ratio 1.3 Lower
Times Interest Earned
/ /
Indicator RatioCompared with in-dustry average
Revenue growth rate
27.9% Higher
Total turnover ratio 1.8 Lower
Accounts receivable turnover ratio
7.0 Lower
ROA 5.8% Higher
Operating margin 4.7% Lower
Barrett Business Services(BBSI)NO.40
Barrett Business Services, Inc. (NASDAQ:BBSI) offers human resource management ser-
vices to assist small and medium-sized businesses to manage the costs and complexities
of employment-related issues. The Company’s principal services, Professional Employer
Organization (PEO) and staffing, assist its clients in leveraging their investment in human capital. In a PEO arrangement,
the Company enters into a contract to become a co-employer of the client’s existing workforce and assume responsi-
bility for some or all of the client’s human resource management responsibilities. Staffing services include on-demand
or short-term staffing assignments, long-term or indefinite-term contract staffing and on-site management. The
Company’s staffing services also include direct placement services, which involve fee-based search efforts for specific
employee candidates at the request of PEO clients, staffing customers or other companies.
GLOBAL 50 HUMAN RESOURCES SERVICE PROVIDERS 2013
77
Company name in Chinese:
/Company name in English:
bluestone
Headquarters: Melbourne, Australia Country: Australia
Established: 2009 Website: http://www.bglcorporate.com/
Main Business: Recruitment/headhuntingAnnual revenue of 2012
334million dollars
Stock Exchange: Australian Securities Exchange Stock Code: HUM
About:
Operating profit Net profit Pre-tax profit Shareholders' equity
-33 -33 -29 34
Major financial data in Fiscal 2012(Unit: $ million)
Major financial ratios in Fiscal 2012
Total assets by the end of 2012 Average total assets Current assets Current liabilities
115 112 60 79
Receivable by the end of 2012 Average receivable Total liabilities Interest expense
43 37 81 /
Indicator RatioCompared with in-dustry average
Net profit margin -9.8% Higher
ROE -95.4% Higher
Debt-asset ratio 70.2% Higher
Current ratio 0.8 Lower
Times Interest Earned
/ /
Indicator RatioCompared with in-dustry average
Revenue growth rate
50.6% Higher
Total turnover ratio 3.0 Higher
Accounts receivable turnover ratio
9.1 Higher
ROA -29.2% Lower
Operating margin -9.8% Lower
bluestoneNO.41
bluestone, formly Humanis Group, listed on the Australian Securities Exchange (ASX) in January 2008 as Total Staffing Solutions Limited (TSS) and later merged with Westhum Group Limited (owner of Westaff Australia and New
Zealand) in December 2009. The merged Group has a national and international footprint (over 35 offices across Australia) with core capabilities encompassing temporary, permanent and international recruitment in Australia, New Zealand and the Philippines. The company is an international recruitment, professional placement and labour hire specialist offering Australian businesses a unique solution to the sourcing and placement of skilled labour. We share a common goal of building relationships based on trust, this shared goal helps us to deliver our belief that great people make great companies.
GLOBAL 50 HUMAN RESOURCES SERVICE PROVIDERS 2013
78
Company name in Chinese:
/Company name in English:
Ultimate SOFTWARE
Headquarters: Florida, United States of America Country: United States of America
Established: 1990 Website: http://www.ultimatesoftware.com
Main Business: e-HRAnnual revenue of 2012
332 million dollars
Stock Exchange: NASDAQ Stock Market Stock Code: ULTI
About:
Operating profit Net profit Pre-tax profit Shareholders' equity
29 15 29 115
Major financial data in Fiscal 2012(Unit: $ million)
Major financial ratios in Fiscal 2012
Total assets by the end of 2012 Average total assets Current assets Current liabilities
525 422 447 400
Receivable by the end of 2012 Average receivable Total liabilities Interest expense
71 63 411 /
Indicator RatioCompared with in-dustry average
Net profit margin 4.4% Lower
ROE 12.8% Higher
Debt-asset ratio 78.2% Lower
Current ratio 1.1 Higher
Times Interest Earned
/ /
Indicator RatioCompared with in-dustry average
Revenue growth rate
23.4% Lower
Total turnover ratio 0.8 等于
Accounts receivable turnover ratio
5.2 Higher
ROA 3.5% Higher
Operating margin 8.8% Higher
Ultimate SOFTWARENO.42
Ultimate SOFTWARE (NASDAQ:ULTI) designs, markets, implements and supports hu-
man resources (HR), payroll and talent management solutions principally in the United States
and Canada. Ultimate’s UltiPro software (UltiPro) is an Internet-based solution delivered
primarily as an online service and designed to deliver the functionality businesses need to manage the employment life
cycle, including recruitment and retirement. The solution includes feature sets for talent acquisition and on boarding, HR
management and compliance, benefits management and online enrollment, payroll, performance management, learning
management, salary planning and budgeting for compensation management, reporting and analytical decision-making
tools, time and attendance, and a self-service Web portal for executives, managers, administrators, and employees.
GLOBAL 50 HUMAN RESOURCES SERVICE PROVIDERS 2013
79
Indicator RatioCompared with in-dustry average
Net profit margin -1.1% Lower
ROE -3.9% Lower
Debt-asset ratio 27.2% Lower
Current ratio 2.1 Lower
Times Interest Earned
/ /
Indicator RatioCompared with in-dustry average
Revenue growth rate
6.0% Higher
Total turnover ratio 2.5 等于
Accounts receivable turnover ratio
5.0 Lower
ROA -2.8% Lower
Operating margin -2.7% Lower
Company name in Chinese:
/Company name in English:
Clarius Group
Headquarters: Sydney, Australia Country: Australia
Established: 1984 Website: http://www.clarius.com.au
Main Business: Recruiting/HeadhuntingAnnual revenue of 2012
283 million dollars
Stock Exchange: Australian Securities Exchange Stock Code: CND
About:
Operating profit Net profit Pre-tax profit Shareholders' equity
-8 -3 -8 82
Major financial data in Fiscal 2012(Unit: $ million)
Major financial ratios in Fiscal 2012
Total assets by the end of 2012 Average total assets Current assets Current liabilities
112 114 64 30
Receivable by the end of 2012 Average receivable Total liabilities Interest expense
60 57 31 0.3
Clarius GroupNO.43
Clarius Group (ASX: CND) is an Australia-based company. The Company is a specialist in the
employment services market providing recruitment, contractor and staff services across the
Asia Pacific region. It has operations in Australia, New Zealand and Asia. Clarius Group em-
ploys over 320 staff through a network of offices located in Sydney, Melbourne, Brisbane,
Perth, Adelaide and Canberra in Australia; Auckland and Wellington in New Zealand; Hong Kong, Beijing and Shanghai, in
China. As on June 30, 2010, the Company operates through a number of specialist brands, which includes Candle Infor-
mation and Communications Technology, Alliance Recruitment Corporate Services and Financial Services, Lloyd Morgan
Accounting and Finance, The One Umbrella Library and Records Management, SouthTech Personnel Technical and En-
gineering and JAV IT Managed IT Services and Professional IT.
GLOBAL 50 HUMAN RESOURCES SERVICE PROVIDERS 2013
80
Indicator RatioCompared with in-dustry average
Net profit margin -43.6% Lower
ROE -20.1% Lower
Debt-asset ratio 38.2% Lower
Current ratio 3.5 Lower
Times Interest Earned
/ /
Indicator RatioCompared with in-dustry average
Revenue growth rate
104.2% Higher
Total turnover ratio 0.5 Lower
Accounts receivable turnover ratio
4.5 Higher
ROA -20.0% Lower
Operating margin -43.1% Lower
Company name in Chinese:
/Company name in English:
workday
Headquarters: Pleasanton, United States of America Country: United States of America
Established: 2005 Website: http://www.workday.com
Main Business: e-HRAnnual revenue of 2012
274 million dollars
Stock Exchange: NYSE Stock Code: WDAY
About:
Operating profit Net profit Pre-tax profit Shareholders' equity
-118 -119 -119 592
Major financial data in Fiscal 2012(Unit: $ million)
Major financial ratios in Fiscal 2012
Total assets by the end of 2012 Average total assets Current assets Current liabilities
959 596 884 255
Receivable by the end of 2012 Average receivable Total liabilities Interest expense
67 61 367 /
workdayNO.44
Workday, Inc. is a provider of enterprise cloud-based applications for human capital manage-ment (HCM), payroll, financial management, time tracking, procurement and employee expense management. It is focused on the consumer Internet experience and cloud delivery model. Its applications are designed for global enterprises to manage complex and dynamic operating envi-
ronments. The Company provides its customers the applications to manage critical business functions for their financial and human capital resources. The Company’s architecture enables customers to share the same version of its applica-tions while securely partitioning their respective application data. Because customers utilize its information technology (IT) resources and operational infrastructure, this framework reduces the costs of implementation, upgrades, and support. Its applications use objects to represent real-world entities such as employees, benefits, budgets, charts of accounts, and organizations.
GLOBAL 50 HUMAN RESOURCES SERVICE PROVIDERS 2013
81
Company name in Chinese:
/Company name in English:
hydrogen
Headquarters: London, The United Kingdom Country: The United Kingdom
Established: / Website: http://www.hydrogengroup.com
Main Business: Recruiting/HeadhuntingAnnual revenue of 2012
265million dollars
Stock Exchange: London Stock Exchange Stock Code: HYDG
About:
Operating profit Net profit Pre-tax profit Shareholders' equity
5 / 5 42
Major financial data in Fiscal 2012(Unit: $ million)
Major financial ratios in Fiscal 2012
Total assets by the end of 2012 Average total assets Current assets Current liabilities
75 72 49 33
Receivable by the end of 2012 Average receivable Total liabilities Interest expense
45 43 33 /
Indicator RatioCompared with in-dustry average
Net profit margin / /
ROE / /
Debt-asset ratio 17.7% Lower
Current ratio 5.0 Lower
Times Interest Earned
/ /
Indicator RatioCompared with in-dustry average
Revenue growth rate
9.3% Higher
Total turnover ratio 3.7 Higher
Accounts receivable turnover ratio
6.2 Lower
ROA / /
Operating margin 2.0% Lower
hydrogenNO.45
hydrogen(LON:HYDG) is a United Kingdom-based recruitment company. The Company is engaged in the provision of recruitment services for mid to senior level professional staff. It offers both permanent and contract specialist recruitment con-sultancy for large and medium-sized organizations. It operates primarily in the tech-
nology, finance, professional and engineering sectors. The Company operates in four segments: Technology, which places mid to senior information technology (IT) business technologists and change professionals; Finance, which places finance, accounting and audit professionals into mid to senior roles from part qualified Association of Chartered Accoun-tants (ACAs) and Chartered Institute of Management Accountants (CIMAs) to director level appointments; Professional, which places lawyers from qualified to director level, and mid to senior level HR professionals, and Engineering, which places engineers, and property and construction professionals.
GLOBAL 50 HUMAN RESOURCES SERVICE PROVIDERS 2013
82
Company name in Chinese:
前程无忧Company name in English:
www.51job.com
Headquarters: Shanghai, China Country: China
Established: 1999 Website: http://www.51job.com
Main Business: Online RecruitmentAnnual revenue of 2012
240 million dollars
Stock Exchange: NASDAQ Stock Market Stock Code: JOBS
About:
Operating profit Net profit Pre-tax profit Shareholders' equity
77 75 90 422
Major financial data in Fiscal 2012(Unit: $ million)
Major financial ratios in Fiscal 2012
Total assets by the end of 2012 Average total assets Current assets Current liabilities
513 460 457 91
Receivable by the end of 2012 Average receivable Total liabilities Interest expense
8 8 91 /
Indicator RatioCompared with in-dustry average
Net profit margin 31.3% Higher
ROE 17.8% Higher
Debt-asset ratio 17.7% Lower
Current ratio 5.0 Higher
Times Interest Earned
/ /
Indicator RatioCompared with in-dustry average
Revenue growth rate
9.9% Lower
Total turnover ratio 0.5 Lower
Accounts receivable turnover ratio
31.3 Higher
ROA 16.3% Higher
Operating margin 32.1% Higher
www.51job.comNO.46
51job, Inc. (NASDAQ:JOBS) is a holding company. The Company is a provider of integrated hu-
man resource services in China. As of December 31, 2010, the Company operated print pub-
lications across 15 major cities in China. In addition to recruitment advertising services, it also
provides other complementary human resource related services, consisting primarily of busi-
ness process outsourcing, training and executive search services. It receives a majority of its revenues in the form of
fees from employers for placing job advertisements on 51job Weekly and www.51job.com. It also receives fees from
employers for accessing its www.51job.com resume database, using its eHire product and engaging its other human
resource related services. 51job, Inc. provides a range of human resource services in categories, which includes recruit-
ment advertising services and other human resource related services.
GLOBAL 50 HUMAN RESOURCES SERVICE PROVIDERS 2013
83
Company name in Chinese:
/Company name in English:
HRnet One
Headquarters: Singapore Country: Singapore
Established: 1992 Website: www.hrnetone.com
Main Business:Head-Hunting, Talent Acquisition, Lease
and Talent Management & Retention
Annual revenue of 2012
214 million dollars
Stock Exchange: / Stock Code: /
About:
Operating profit Net profit Pre-tax profit Shareholders' equity
27 / 26 88
Major financial data in Fiscal 2012(Unit: $ million)
Major financial ratios in Fiscal 2012
Total assets by the end of 2012 Average total assets Current assets Current liabilities
118 111 116 31
Receivable by the end of 2012 Average receivable Total liabilities Interest expense
/ / 31 /
Indicator RatioCompared with in-dustry average
Net profit margin / /
ROE / /
Debt-asset ratio 25.8% Lower
Current ratio 3.8 Higher
Times Interest Earned
/ /
Indicator RatioCompared with in-dustry average
Revenue growth rate
5.7% Higher
Total turnover ratio 1.9 Lower
Accounts receivable turnover ratio
/ /
ROA / /
Operating margin 12.4% Higher
HRnet OneNO.47
The HRnet One consists of companies separately consolidated under 2 Singapore
incorporated and headquartered companies namely HRnet One Pte Ltd ( including
20 subsidiaries) and Recruit Express Pte Ltd (including 6 subsidiaries).
The Group was first established as HRnet One Pte Ltd in 1992. HRnet One’s business encompasses
Head-Hunting, Talent Acquisition, Lease and Talent Management & Retention. The Group has offices in
10 cities covering Beijing, Shanghai, Guangzhou, Taipei, Hong Kong, Seoul, Tokyo, Bangkok, Kuala Lum-
pur and Singapore. It employs some 850 consultants. The Group promotes the core values of Loyalty,
Gratitude, Integrity, Strive for Betterment, Adjustment and Assimilation and Harmony and Humilty.
GLOBAL 50 HUMAN RESOURCES SERVICE PROVIDERS 2013
84
Company name in Chinese:
/Company name in English:
Dice Holdings
Headquarters: New York, United States of America Country: United States of America
Established: 1990 Website: http://www.diceholdingsinc.com
Main Business: Online RecruitmentAnnual revenue of 2012
195 million dollars
Stock Exchange: New York Stock Exchange Stock Code: DHX
About:
Operating profit Net profit Pre-tax profit Shareholders' equity
59 38 57 191
Major financial data in Fiscal 2012(Unit: $ million)
Major financial ratios in Fiscal 2012
Total assets by the end of 2012 Average total assets Current assets Current liabilities
354 340 76 95
Receivable by the end of 2012 Average receivable Total liabilities Interest expense
29 25 164 /
Indicator RatioCompared with in-dustry average
Net profit margin 19.5% Higher
ROE 20.0% Higher
Debt-asset ratio 46.2% Higher
Current ratio 0.8 Higher
Times Interest Earned
/ /
Indicator RatioCompared with in-dustry average
Revenue growth rate
9.1% Lower
Total turnover ratio 0.6 Lower
Accounts receivable turnover ratio
7.9 Lower
ROA 11.2% Higher
Operating margin 30.1% Higher
Dice HoldingsNO.48
Dice Holdings (NYSE:DHX) is a provider of specialized career Websites for select pro-fessional communities. DHI focuses employment on categories, in which there is a scarcity of skilled, qualified professionals relative to market demand. The Company’s
career Websites serve as online marketplaces where employers and recruiters find and recruit prospective employ-ees, and where professionals find relevant job opportunities and information to further their careers. Each of its career Websites offers job postings, content, career development and recruiting services tailored to the specific needs of the professional community that it serves. The Websites operated by DHI includes Dice.com, eFinancialCareers.com, Clear-anceJobs.com and AllHealthcareJobs.com. DHI operates four segments: Tech & Clearance, Finance, Energy, and Other. On May 6, 2010, it acquired WorldwideWorker.com. On August 11, 2010, it acquired Rigzone.com, Inc. In June 2010, it shut down JobsintheMoney.com, Inc.
GLOBAL 50 HUMAN RESOURCES SERVICE PROVIDERS 2013
85
Company name in Chinese:
/Company name in English:
Cornerstone ONDEMAND
Headquarters: The USA Country: The USA
Established: 1996 Website:http://www.cornerstoneondemand.
com/
Main Business: e-HRAnnual revenue of 2012
118 million dollars
Stock Exchange: NASDAQ Stock Code: CSOD
About:
Operating profit Net profit Pre-tax profit Shareholders' equity
-32 -31 -32 47
Major financial data in Fiscal 2012(Unit: $ million)
Major financial ratios in Fiscal 2012
Total assets by the end of 2012 Average total assets Current assets Current liabilities
172 154 142 114
Receivable by the end of 2012 Average receivable Total liabilities Interest expense
48 41 125 /
Indicator RatioCompared with in-dustry average
Net profit margin -26.6% Lower
ROE -67.0% Lower
Debt-asset ratio 72.7% Higher
Current ratio 1.2 Lower
Times Interest Earned
/ /
Indicator RatioCompared with in-dustry average
Revenue growth rate
61.5% Higher
Total turnover ratio 0.8 等于
Accounts receivable turnover ratio
2.9 Lower
ROA -20.4% Lower
Operating margin -27.0% Lower
Cornerstone ONDEMANDNO.49
Cornerstone ONDEMAND (NASDAQ:CSOD) is a global provider of a learning and talent
management solution delivered as software-as-a-service (SaaS).Cornerstone offers
a learning and talent management solution that its clients uses to develop, connect,
evaluate and engage their employees, customers, vendors and distributors. The Company delivers its SaaS solution on-
demand to its clients who access it over the Internet. Cornerstone’s product offering consists of a collection of three
integrated clouds for learning management, performance management and extended enterprise. It also offers a number
of cross-cloud tools for analytics and reporting, employee profile management, employee on-boarding and e-learning
content aggregation. It also provides consulting services for configuration, integration and training for its solution. On
March 29, 2012, it launched Recruiting Cloud. In April 2012, it acquired Sonar Limited.
GLOBAL 50 HUMAN RESOURCES SERVICE PROVIDERS 2013
86

Company name in Chinese:
/Company name in English:
ClickSoftware
Headquarters: Petach Tikva Country: Israel
Established: / Website: http://www.clicksoftware.com/
Main Business: e-HRAnnual revenue of 2012
100 million dollars
Stock Exchange: NASDAQ Stock Exchange Stock Code: CKSW
About:
Operating profit Net profit Pre-tax profit Shareholders' equity
7 7 8 63
Major financial data in Fiscal 2012(Unit: $ million)
Major financial ratios in Fiscal 2012
Total assets by the end of 2012 Average total assets Current assets Current liabilities
94 93 84 26
Receivable by the end of 2012 Average receivable Total liabilities Interest expense
22 24 32 /
Indicator RatioCompared with in-dustry average
Net profit margin 7.5% Higher
ROE 11.9% Lower
Debt-asset ratio 33.4% Lower
Current ratio 3.3 Higher
Times Interest Earned
/ /
Indicator RatioCompared with in-dustry average
Revenue growth rate
14.9% Lower
Total turnover ratio 1.1 Higher
Accounts receivable turnover ratio
4.2 等于
ROA 8.1% Higher
Operating margin 7.3% Higher
ClickSoftware NO.50
ClickSoftware (NASDAQ: CKS) is a provider of software products and solutions for workforce management and optimization for the service sector. The Company derives revenues from the licensing of its software products and the provision of
consulting and support services. ClickSoftware’s solutions are grouped into four main suites which together comprise its Service Optimization Suite: Field Service Daily Suite, Mobility Suite, Roster (Shift Planning) Suite and Forecasting and Planning Suite. Additionally, it offers variations of its products for certain vertical markets, including Mid-Market Package - Installation, Maintenance and Repair Services (ClickIMRS) and Service Tycoon. In April 2009, it completed the acquisi-tion of the workforce management business of Manchitra Services Private Ltd. In August 2009, it completed the acqui-sition of the assets of AST Solutions Group 2009, Inc. In November 2009, the Company completed the acquisition of the assets of A.I. Point Ltd.
GLOBAL 50 HUMAN RESOURCES SERVICE PROVIDERS 2013
87
Company name in Chinese:
104人力银行Company name in English:
104 Job Bank
Headquarters: Taiwan, China Country: China
Established: 1996 Website: http://www.104.com.tw
Main Business: Online RecruitmentAnnual revenue of 2012
72 million dollars
Stock Exchange: Taiwan Stock Exchange Stock Code: 3130
About:
Operating profit Net profit Pre-tax profit Shareholders' equity
7 6 7 37
Major financial data in Fiscal 2012(Unit: $ million)
Major financial ratios in Fiscal 2012
Total assets by the end of 2012 Average total assets Current assets Current liabilities
57 59 49 20
Receivable by the end of 2012 Average receivable Total liabilities Interest expense
6 7 20 /
Indicator RatioCompared with in-dustry average
Net profit margin 8.1% Lower
ROE 15.5% Higher
Debt-asset ratio 34.9% Lower
Current ratio 2.5 Higher
Times Interest Earned
/ /
Indicator RatioCompared with in-dustry average
Revenue growth rate
-10.1% Lower
Total turnover ratio 1.2 Higher
Accounts receivable turnover ratio
11.0 Lower
ROA 9.8% Lower
Operating margin 9.1% Lower
104 Job BankNO.51
104 Job Bank (TPE:3130) is a Taiwan-based company primarily en-
gaged in operation of online recruitment Website. The Company operates
www.104.com.tw, providing online recruitment advertisements, online
business advertisements, senior executives hunting services, human resource management software,
human resource transfer services, science and technology job bank services, job map services and value-
added services, among others. During the year ended December 31, 2009, online advertisements con-
tributed approximately 86.8% of the Company’s total revenue. It operates its businesses principally in
Taiwan.
GLOBAL 50 HUMAN RESOURCES SERVICE PROVIDERS 2013
88
Company name in Chinese:
/Company name in English:
Fortune Industries
Headquarters: Indiana, United States of America Country: United States of America
Established: 1988 Website: http://www.ffi.net
Main Business: Human Resource OutsourcingAnnual revenue of 2012
61 million dollars
Stock Exchange: American Stock Exchange Stock Code: FFI
About:
Operating profit Net profit Pre-tax profit Shareholders' equity
2 2 2 19
Major financial data in Fiscal 2012(Unit: $ million)
Major financial ratios in Fiscal 2012
Total assets by the end of 2012 Average total assets Current assets Current liabilities
29 29 13 9
Receivable by the end of 2012 Average receivable Total liabilities Interest expense
3 3 9 /
Indicator RatioCompared with in-dustry average
Net profit margin 3.7% Higher
ROE 11.8% Lower
Debt-asset ratio 32.5% Lower
Current ratio 1.5 Higher
Times Interest Earned
/ /
Indicator RatioCompared with in-dustry average
Revenue growth rate
-5.3% Lower
Total turnover ratio 2.1 Lower
Accounts receivable turnover ratio
21.3 Higher
ROA 7.8% Lower
Operating margin 3.8% Lower
Fortune IndustriesNO.52
Fortune Industries(AMEX:FFI)is a holding company of providers of full service hu-
man resources outsourcing services through co-employment relationships with the
Company’s clients. The Business Solutions segment is consist of Professional Em-
ployer Organizations (PEOs), which provide full-service human resources outsourcing services through co-employment
relationships with their clients. Companies operating in the Business Solutions Segment include Professional Staff Man-
agement, Inc. and related entities (PSM); CSM, Inc. and related subsidiaries (CSM); Precision Employee Management,
LLC (PEM), and Employer Solutions Group, Inc. and related entities (ESG). The Companies in the Business Solutions
segment bill their clients under Professional Services Agreements as licensed PEOs. The billing includes amounts for the
client’s gross wages, payroll taxes, employee benefits, workers’ compensation insurance and an administration fee.
GLOBAL 50 HUMAN RESOURCES SERVICE PROVIDERS 2013
89
Company name in Chinese:
世泓Company name in English:
shl
Headquarters: Washington Country: United States of America
Established: 1977 Website: http://www.shl.com
Main Business: Talent assessmentAnnual revenue of 2012
59 million dollars
Stock Exchange: NYSE Stock Code: CEB
About:
Operating profit Net profit Pre-tax profit Shareholders' equity
/ / / /
Major financial data in Fiscal 2012(Unit: $ million)
Major financial ratios in Fiscal 2012
Total assets by the end of 2012 Average total assets Current assets Current liabilities
/ / / /
Receivable by the end of 2012 Average receivable Total liabilities Interest expense
/ / / /
Indicator RatioCompared with in-dustry average
Net profit margin / /
ROE / /
Debt-asset ratio / /
Current ratio / /
Times Interest Earned
/ /
Indicator RatioCompared with in-dustry average
Revenue growth rate
/ /
Total turnover ratio / /
Accounts receivable turnover ratio
/ /
ROA / /
Operating margin / /
shlNO.53
SHL is the leader in talent measurement solutions, driving better business results for clients through superior people intelligence and decisions - from hiring and recruiting, to employee development and succession planning. With a presence in over 50 coun-tries, SHL delivers more than 25 million assessments annually in over 30 languages -
allowing over 10,000 business customers to benefit from both global expertise and local insight. Along with its world-class consulting practices and 24-hour support center, SHL clients can access over 1,000 assessments through an easy-to-use technology platform. SHL was acquired in 2012 by CEB, the leading member-based advisory company. By combining the best practices of thousands of member companies with advanced research methodologies and human capital analytics, CEB equips senior leaders and their teams with insight and actionable solutions to transform operations.
GLOBAL 50 HUMAN RESOURCES SERVICE PROVIDERS 2013
90
Company name in Chinese:
/Company name in English:
ATA
Headquarters: Beijing, China Country: China
Established: 1999 Website: http://www.ata.net.cn
Main Business: Talent AssessmentAnnual revenue of 2012
56 million dollars
Stock Exchange: NASDAQ Stock Market Stock Code: ATAI
About:
Operating profit Net profit Pre-tax profit Shareholders' equity
10 9 / 58
Major financial data in Fiscal 2012(Unit: $ million)
Major financial ratios in Fiscal 2012
Total assets by the end of 2012 Average total assets Current assets Current liabilities
73 71 56 14
Receivable by the end of 2012 Average receivable Total liabilities Interest expense
13 13 15 /
Indicator RatioCompared with in-dustry average
Net profit margin 15.9% /
ROE 15.2% /
Debt-asset ratio 20.5% /
Current ratio 3.9 /
Times Interest Earned
/ /
Indicator RatioCompared with in-dustry average
Revenue growth rate
15.8% /
Total turnover ratio 0.8 /
Accounts receivable turnover ratio
4.3 /
ROA 12.5% /
Operating margin 18.3% /
ATA NO.54
ATA Inc. (NASDAQ:ATAI)is a provider of computer-based testing services. It offers services for the
creation and delivery of computer-based tests utilizing the test delivery platform, testing technologies
and providing testing services. The computer-based testing services are used for professional licensure
and certification tests in various industries, including information technology (IT) services, banking, secu-
rities, teaching and insurance. The computer-based testing services clients include professional associations, such as the
Securities Association of China, China Banking Association and China Futures Association, and governmental agencies. As
of March 31, 2010, the Company’s test network included 1,988 authorized test centers located throughout the People’s
Republic of China. In February 2009, the Company completed the acquisition of Beijing Jindixin Software Technology Com-
pany Limited (Beijing JDX) and JDX Holdings Limited (JDX BVI).
GLOBAL 50 HUMAN RESOURCES SERVICE PROVIDERS 2013
91
Company name in Chinese:
/Company name in English:
Hamilton James & Bruce (HJB)
Headquarters: Sydney, Australia Country: Australia
Established: 1979 Website: http://www.hjb.com.au
Main Business: Recruiting/HeadhuntingAnnual revenue of 2012
49.4 million dollars
Stock Exchange: Australian Securities Exchange Stock Code: HJB
About:
Operating profit Net profit Pre-tax profit Shareholders' equity
1 1 1 10
Major financial data in Fiscal 2012(Unit: $ million)
Major financial ratios in Fiscal 2012
Total assets by the end of 2012 Average total assets Current assets Current liabilities
14 15 5 2
Receivable by the end of 2012 Average receivable Total liabilities Interest expense
4 6 3 /
Indicator RatioCompared with in-dustry average
Net profit margin 1.2% Lower
ROE 5.9% Lower
Debt-asset ratio 25.0% Lower
Current ratio 2.3 Higher
Times Interest Earned
/ /
Indicator RatioCompared with in-dustry average
Revenue growth rate
-11.3% Lower
Total turnover ratio 3.2 Lower
Accounts receivable turnover ratio
9.0 Lower
ROA 3.9% Lower
Operating margin 1.2% Lower
Hamilton James & Bruce(HJB)NO.55
Hamilton James & Bruce Group Limited (ASX:HJB) is an Australia-based company. The Company is engaged in the provision of employee placement, temporary and contracting services. It permanent recruitment services include recruiting at the senior executive, man-agement, operational and support levels. Its temporary and contracting services recruiting specialists for both short and long term contract assignments, covering executive, manage-
ment, operational and support levels. Its clients operate in various sectors, including accounting, banking, finance and insurance, business support, contracting, government, human resources, legal, technology, and property, construction and engineering. On December 18, 2009, the Company discontinued its New PDH Ltd, which is engaged in provincial personnel business. Its subsidiaries include Hamilton James and Bruce Pty Limited, HJ&B Employee Pty Limited, HJ&B Employee Share Trust and HJB Share Plan Pty Limited.
GLOBAL 50 HUMAN RESOURCES SERVICE PROVIDERS 2013
92
Company name in Chinese:
/Company name in English:
DLH
Headquarters: Georgia, United States of America Country: United States of America
Established: 1969 Website: http://www.dlhcorp.com
Main Business: HR OutsourcingAnnual revenue of 2012
49.2 million dollars
Stock Exchange: / Stock Code: /
About:
Operating profit Net profit Pre-tax profit Shareholders' equity
-2 -2 / /
Major financial data in Fiscal 2012(Unit: $ million)
Major financial ratios in Fiscal 2012
Total assets by the end of 2012 Average total assets Current assets Current liabilities
/ / / /
Receivable by the end of 2012 Average receivable Total liabilities Interest expense
/ / / /
Indicator RatioCompared with in-dustry average
Net profit margin -4.1% Lower
ROE / /
Debt-asset ratio / /
Current ratio / /
Times Interest Earned
/ /
Indicator RatioCompared with in-dustry average
Revenue growth rate
17.3% Higher
Total turnover ratio 4.5 Higher
Accounts receivable turnover ratio
8.8 Lower
ROA -18.2% Lower
Operating margin -4.5% Lower
DLHNO.56
DLH is a service provider of logistics, healthcare support and technical services
to Federal Agencies and the Department of Defense. The Company focuses on
three business lines: Logistics & Technical Services, Healthcare Delivery Solu-
tions and Contingency/Staff Augmentation. The Company provides its services
to the United States Department of Veterans Affairs (DVA), the United States Department of Defense and
other United States governmental entities. DLH provides a suite of services and solutions offerings that
plan for, implement and controls the storage and flow of goods, services and information for government
agencies. Our tools and processes are key enablers for enhanced productivity & quality.
GLOBAL 50 HUMAN RESOURCES SERVICE PROVIDERS 2013
93
Company name in Chinese:
/Company name in English:
PRIME PEOPLE
Headquarters: London, The United Kingdom Country: The United Kingdom
Established: 1986 Website: http://www.prime-people.co.uk
Main Business: Recruiting/HeadhuntingAnnual revenue of 2012
20.1 million dollars
Stock Exchange: LON Stock Code: PRP
About:
Operating profit Net profit Pre-tax profit Shareholders' equity
1 1 2 22
Major financial data in Fiscal 2012(Unit: $ million)
Major financial ratios in Fiscal 2012
Total assets by the end of 2012 Average total assets Current assets Current liabilities
25 25 9 3
Receivable by the end of 2012 Average receivable Total liabilities Interest expense
5 5 3 /
Indicator RatioCompared with in-dustry average
Net profit margin 5.4% Lower
ROE 4.9% Higher
Debt-asset ratio 11.6% Lower
Current ratio 3.2 Higher
Times Interest Earned
/ /
Indicator RatioCompared with in-dustry average
Revenue growth rate
1.7% Lower
Total turnover ratio 0.8 Lower
Accounts receivable turnover ratio
4.4 Lower
ROA 4.4% Higher
Operating margin 7.4% Higher
PRIME PEOPLENO.57
PRIME PEOPLE is a global specialist recruitment business headquartered in
the UK. It has offices in London and Manchester, Hong Kong, Dubai, Johan-
nesburg and Singapore. The group’s current recruitment operations address
requirements for executive, professional and technical staff working in the
Real Estate & Built Environment, Energy & Environmental, Insight & Analytics and Pharmaceutical sec-
tors. The company has been trading since 1986 and in June 2004 moved to AiM having been on the main
London market since May 1995.
GLOBAL 50 HUMAN RESOURCES SERVICE PROVIDERS 2013
94
Company name in Chinese:
网维Company name in English:
NetDimensions
Headquarters: HongKong Country: China
Established: 1999 Website: http://www.netdimensions.com/
Main Business: e-HRAnnual revenue of 2012
14 million dollars
Stock Exchange: LON Stock Code: NETD
About:
Operating profit Net profit Pre-tax profit Shareholders' equity
-0.3 / -0.2 6
Major financial data in Fiscal 2012(Unit: $ million)
Major financial ratios in Fiscal 2012
Total assets by the end of 2012 Average total assets Current assets Current liabilities
14 14 13 8
Receivable by the end of 2012 Average receivable Total liabilities Interest expense
6 3 8 /
Indicator RatioCompared with in-dustry average
Net profit margin / /
ROE / /
Debt-asset ratio 56.6% Higher
Current ratio 1.7 Higher
Times Interest Earned
/ /
Indicator RatioCompared with in-dustry average
Revenue growth rate
12.2% Lower
Total turnover ratio 1.0 Higher
Accounts receivable turnover ratio
4.4 等于
ROA / /
Operating margin -2.0% 等于
NetDimensionsNO.58
Established in 1999, listed on the London Stock Exchange (AIM: NETD) and trad-
ing on OTCQX (OTCQX: NETDY), NetDimensions is committed to leadership in
performance, knowledge, and learning technology. Our global solutions help or-
ganizations achieve productivity & efficiency improvements, cost reduction, risk
management, and cultural & process innovation.Through our own offices worldwide, as well as through a
global reseller network that extends to over 40 countries, NetDimensions serves over 1,000 clients with
more than 9 million users.
GLOBAL 50 HUMAN RESOURCES SERVICE PROVIDERS 2013
95
Company name in Chinese:
/Company name in English:
HRsoft
Headquarters: Ottawa, Canada Country: Canada
Established: 1996 Website: http://www.hrsoft.com/
Main Business: e-HRAnnual revenue of 2012
7 million dollars
Stock Exchange: FINRA - OTC Stock Code: WSTM
About:
Operating profit Net profit Pre-tax profit Shareholders' equity
-1 0.5 -1 9
Major financial data in Fiscal 2012(Unit: $ million)
Major financial ratios in Fiscal 2012
Total assets by the end of 2012 Average total assets Current assets Current liabilities
13 12 3 1
Receivable by the end of 2012 Average receivable Total liabilities Interest expense
2 2 4 /
Indicator RatioCompared with in-dustry average
Net profit margin 6.3% Lower
ROE 5.0% Lower
Debt-asset ratio 28.4% Higher
Current ratio 2.1 Higher
Times Interest Earned
/ /
Indicator RatioCompared with in-dustry average
Revenue growth rate
-5.9% Lower
Total turnover ratio 0.6 Lower
Accounts receivable turnover ratio
4.2 Lower
ROA 3.6% Higher
Operating margin -19.5% Lower
HRsoftNO.59
HRsoft, formly Workstream, is a provider of software and services for human capital man-agement (HCM). HRsoft has two segments: Enterprise Workforce Services and Career Networks. The Enterprise Workforce Services segment offers a range of HCM software
solutions, which includes performance management, compensation management, development, recruitment, benefits administration and enrollment, succession planning, and employee awards and discounts programs. The Career Net-works segment offers recruitment research, resume management and career transition services. In addition, Career Networks provides services through a Website where job-seeking senior executives can search job databases and post their resumes, and companies and recruiters can post position openings and search for qualified senior executive candi-dates. HRsoft conducts its business primarily in the United States and Canada. In January 2011, the Company acquired Incentives Advisors, LLC.
GLOBAL 50 HUMAN RESOURCES SERVICE PROVIDERS 2013
96
HRoot is a leading human resources media and Internet company in China, with such
brands and services as HRoot.com, a world’s leading human resources management
website; Human Capital Management magazine, a leading industry journal in China;
Overclass, an elite club for HR professionals; Society for HR Executives (SHRE), the
only society of HR executives in China; the Annual Human Resources Awards in Greater
China, a top-notch industry event with utmost authority, scale and influence; the China
Human Capital Forum, the largest among such events in China, and the China Human
Resources Services Expo, the largest of its kind in the world, which may register over
20,000 visitors in 2014. In 2012, HRoot launched iPhone, iPad and Android apps of its
Human Capital Management magazine and its “Guide to Human Resources Services
Providers”, and the mobile app of “HRoot Forums and Expo.” HRoot releases the
annual reports of the “Top 100 Human Resources Services Brands in Greater China”
and the ”Global 50 Human Resources Services Providers”, and the monthly white
paper of MarketWatch of Global HR Service Industry, each being celebrated as a
guidepost of this industry.
The website of HRoot has some two million HR professionals as its registered users, who
pay more than 500 million visits in total each year; HRoot has more than 20,000 people
attending its off-line events each year and 30,000 readers of its publications; it serves
over 20,000 customers now, including more than 95% of the Fortune 500 companies in
China. It has more than 250 HR services providers, business schools, associations as its
ad clients and sponsors; including nine of the top ten global HR services providers.
Human Capital Management Magazine is the largest circulation of Human Resource
Management Journal in China and the number reached 30,000 readers. The magazine
dedicated to deliver HR-related information, viewpoints, methods, techniques and so on.
Our target readers are HR managers, HR directors, CEO, General Manager, departmental
managers, Human Resources experts and other decision-makers and from a wide
range of multinational companies. Human Capital Management Magazine is edited and
published by HRoot, the leading HR and an Internet media company in China.
About the publisher
GLOBAL 50 HUMAN RESOURCES SERVICE PROVIDERS 2013
97
For more information on Global 50 HR Service Providers Rankings and Whitepaper 2013, please visit: http://www.hroot.com/rankings/global50/2013/
86-21-58215127、58215197
http://www.hroot.com
86-21-5821 8663
Suite 511, North Building, 77 Eshan Road, Shanghai, China
http://t.sina.com.cn/hrootchina
http://linkedin.com/company/hroot
hrootchina
Contact us:
The information contained in this document represents the views of HRoot Corporation on the matters discussed as of the date of release. HRoot must respond to changing market conditions, hence such information cannot be interpreted as promises of HRoot. HRoot cannot guarantee the accuracy of any information after the release date. This document is for reference only. HRoot does not make any explicit or implicit warranty contained in this document. Users are held responsible for complying with all applicable copyright laws. Under the conditions of unrestricted rights of copyright license, no matter for what purpose, or in any form or by any means (including electronic, mechanical, photocopying, recording, or other forms, no part or all of this document, can be copied or disseminated, or stored in or introduced into any retrieval system without express written permissions of HRoot Corporation.
Disclaimer