2013 - deme group · pdf fileenterprises accounted for using the equity method 81,362 70,015...
TRANSCRIPT
financial statements 2013
Creating land for the future

f inancial statements 2013
1
Consolidatedfinancialstatements
financial statements
According to• International Financial Reporting Standards (IFRS) page 2• Belgian Generally Accepted Accounting Principles (Belgian GAAP) page 6
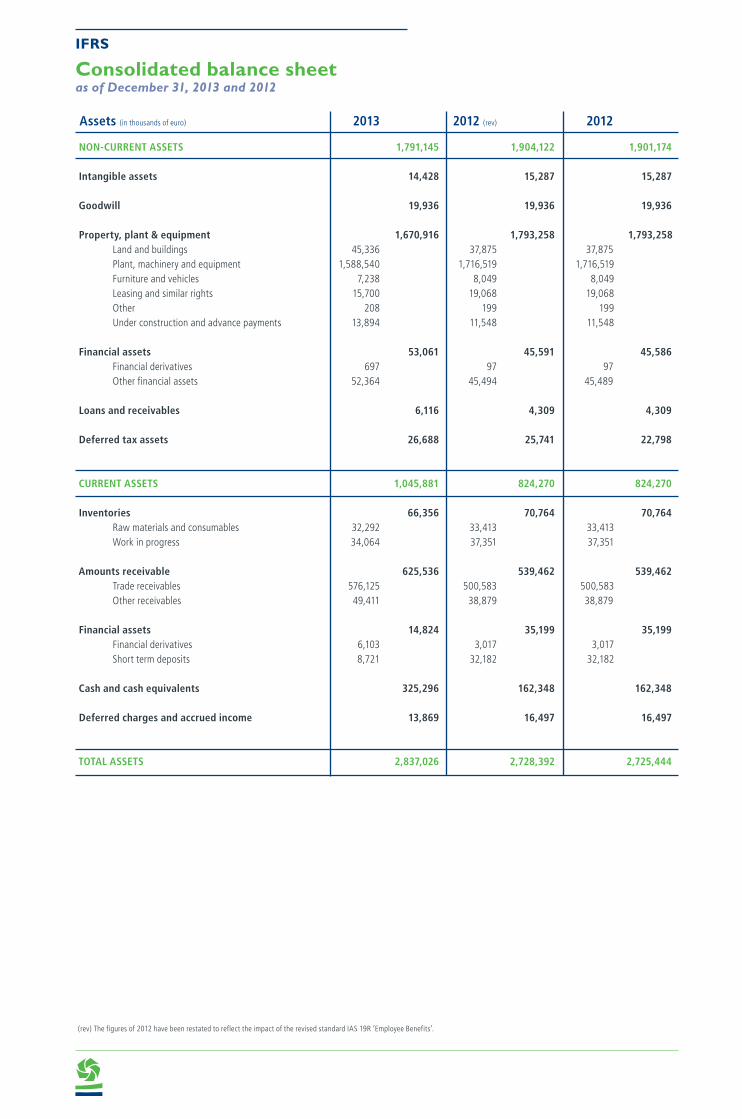
Assets (in thousands of euro) 2013 2012 (rev) 2012
NON-CURRENT ASSETS 1,791,145 1,904,122 1,901,174 Intangible assets 14,428 15,287 15,287
Goodwill 19,936 19,936 19,936
Property, plant & equipment 1,670,916 1,793,258 1,793,258 Land and buildings 45,336 37,875 37,875 Plant, machinery and equipment 1,588,540 1,716,519 1,716,519 Furniture and vehicles 7,238 8,049 8,049 Leasing and similar rights 15,700 19,068 19,068 Other 208 199 199 Under construction and advance payments 13,894 11,548 11,548
Financial assets 53,061 45,591 45,586 Financial derivatives 697 97 97 Other financial assets 52,364 45,494 45,489
Loans and receivables 6,116 4,309 4,309
Deferred tax assets 26,688 25,741 22,798
CURRENT ASSETS 1,045,881 824,270 824,270
Inventories 66,356 70,764 70,764 Raw materials and consumables 32,292 33,413 33,413 Work in progress 34,064 37,351 37,351 Amounts receivable 625,536 539,462 539,462
Trade receivables 576,125 500,583 500,583 Other receivables 49,411 38,879 38,879
Financial assets 14,824 35,199 35,199 Financial derivatives 6,103 3,017 3,017 Short term deposits 8,721 32,182 32,182
Cash and cash equivalents 325,296 162,348 162,348 Deferred charges and accrued income 13,869 16,497 16,497
TOTAL ASSETS 2,837,026 2,728,392 2,725,444
Consolidated balance sheetas of December 31, 2013 and 2012
IFRS
(rev) The figures of 2012 have been restated to reflect the impact of the revised standard IAS 19R ‘Employee Benefits’.
f inancial statements 2013
3
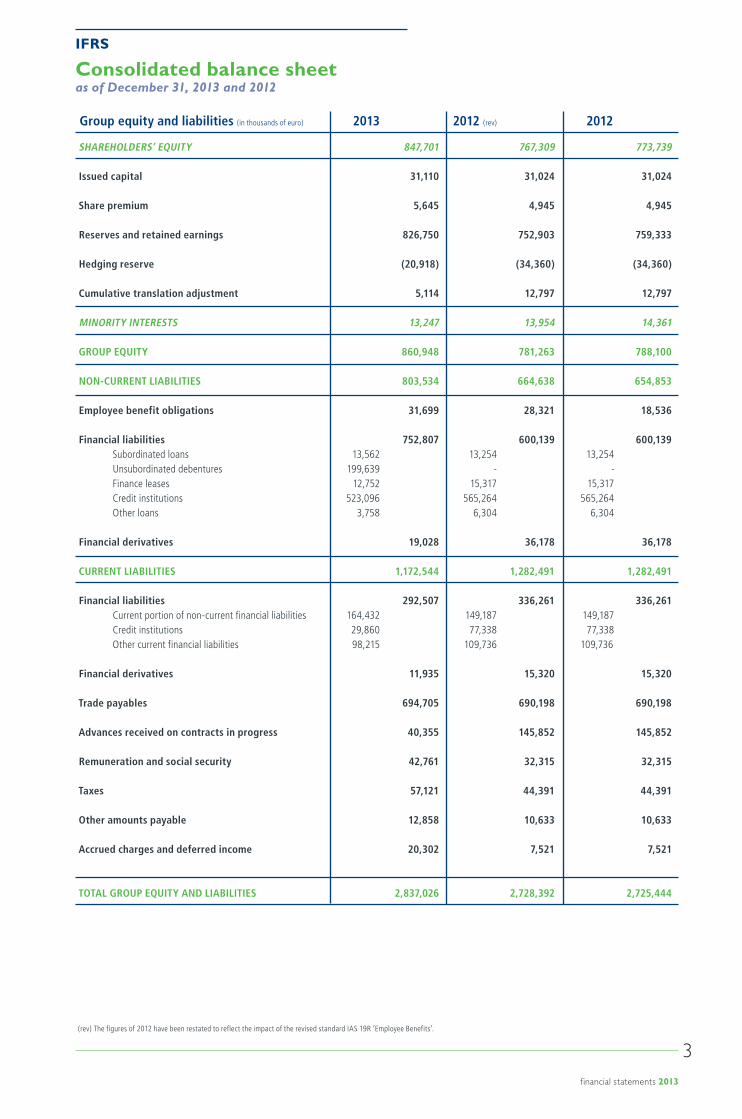
Consolidated balance sheetas of December 31, 2013 and 2012
Group equity and liabilities (in thousands of euro) 2013 2012 (rev) 2012
SHAREHOLDERS’ EQUITY 847,701 767,309 773,739 Issued capital 31,110 31,024 31,024
Share premium 5,645 4,945 4,945
Reserves and retained earnings 826,750 752,903 759,333
Hedging reserve (20,918) (34,360) (34,360)
Cumulative translation adjustment 5,114 12,797 12,797 MINORITY INTERESTS 13,247 13,954 14,361
GROUP EQUITY 860,948 781,263 788,100
NON-CURRENT LIABILITIES 803,534 664,638 654,853
Employee benefit obligations 31,699 28,321 18,536
Financial liabilities 752,807 600,139 600,139 Subordinated loans 13,562 13,254 13,254 Unsubordinated debentures 199,639 - - Finance leases 12,752 15,317 15,317 Credit institutions 523,096 565,264 565,264 Other loans 3,758 6,304 6,304
Financial derivatives 19,028 36,178 36,178
CURRENT LIABILITIES 1,172,544 1,282,491 1,282,491
Financial liabilities 292,507 336,261 336,261 Current portion of non-current financial liabilities 164,432 149,187 149,187 Credit institutions 29,860 77,338 77,338 Other current financial liabilities 98,215 109,736 109,736
Financial derivatives 11,935 15,320 15,320 Trade payables 694,705 690,198 690,198
Advances received on contracts in progress 40,355 145,852 145,852
Remuneration and social security 42,761 32,315 32,315
Taxes 57,121 44,391 44,391
Other amounts payable 12,858 10,633 10,633
Accrued charges and deferred income 20,302 7,521 7,521
TOTAL GROUP EQUITY AND LIABILITIES 2,837,026 2,728,392 2,725,444
IFRS
(rev) The figures of 2012 have been restated to reflect the impact of the revised standard IAS 19R ‘Employee Benefits’.
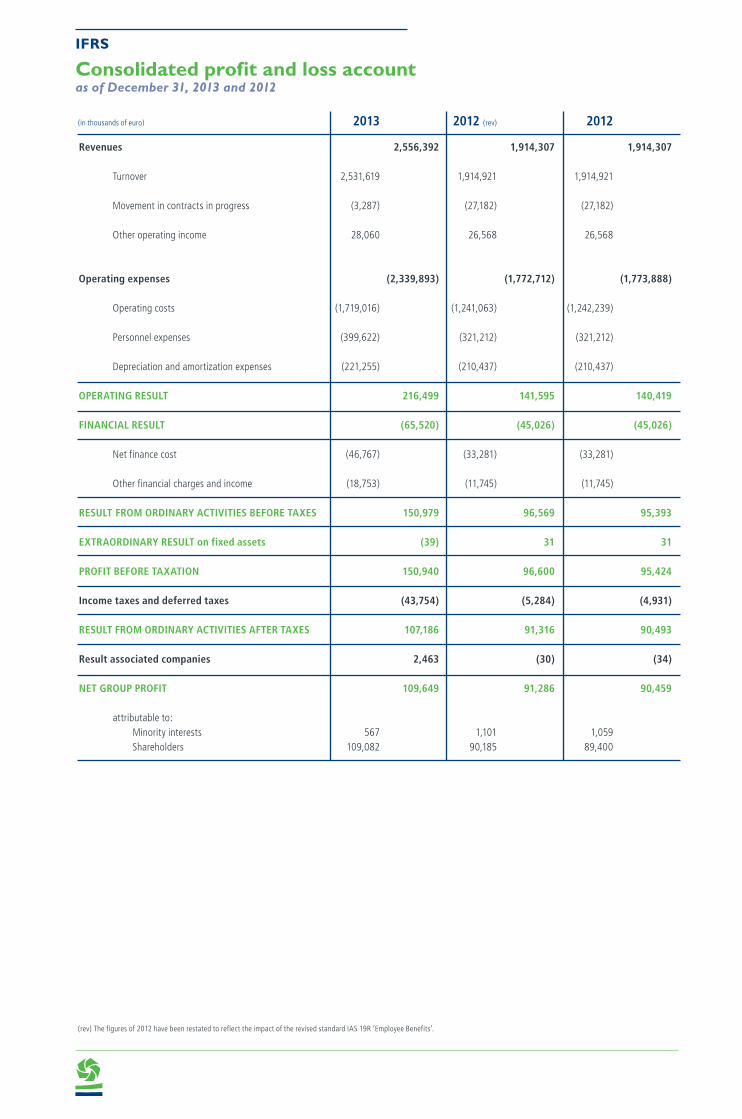
(in thousands of euro) 2013 2012 (rev) 2012
Revenues 2,556,392 1,914,307 1,914,307 Turnover 2,531,619 1,914,921 1,914,921
Movement in contracts in progress (3,287) (27,182) (27,182)
Other operating income 28,060 26,568 26,568
Operating expenses (2,339,893) (1,772,712) (1,773,888) Operating costs (1,719,016) (1,241,063) (1,242,239)
Personnel expenses (399,622) (321,212) (321,212)
Depreciation and amortization expenses (221,255) (210,437) (210,437)
OPERATING RESULT 216,499 141,595 140,419
FINANCIAL RESULT (65,520) (45,026) (45,026) Net finance cost (46,767) (33,281) (33,281)
Other financial charges and income (18,753) (11,745) (11,745)
RESULT FROM ORDINARY ACTIVITIES BEFORE TAXES 150,979 96,569 95,393
EXTRAORDINARY RESULT on fixed assets (39) 31 31
PROFIT BEFORE TAXATION 150,940 96,600 95,424
Income taxes and deferred taxes (43,754) (5,284) (4,931)
RESULT FROM ORDINARY ACTIVITIES AFTER TAXES 107,186 91,316 90,493
Result associated companies 2,463 (30) (34)
NET GROUP PROFIT 109,649 91,286 90,459 attributable to: Minority interests 567 1,101 1,059 Shareholders 109,082 90,185 89,400
Consolidated profit and loss accountas of December 31, 2013 and 2012
IFRS
(rev) The figures of 2012 have been restated to reflect the impact of the revised standard IAS 19R ‘Employee Benefits’.
f inancial statements 2013
5
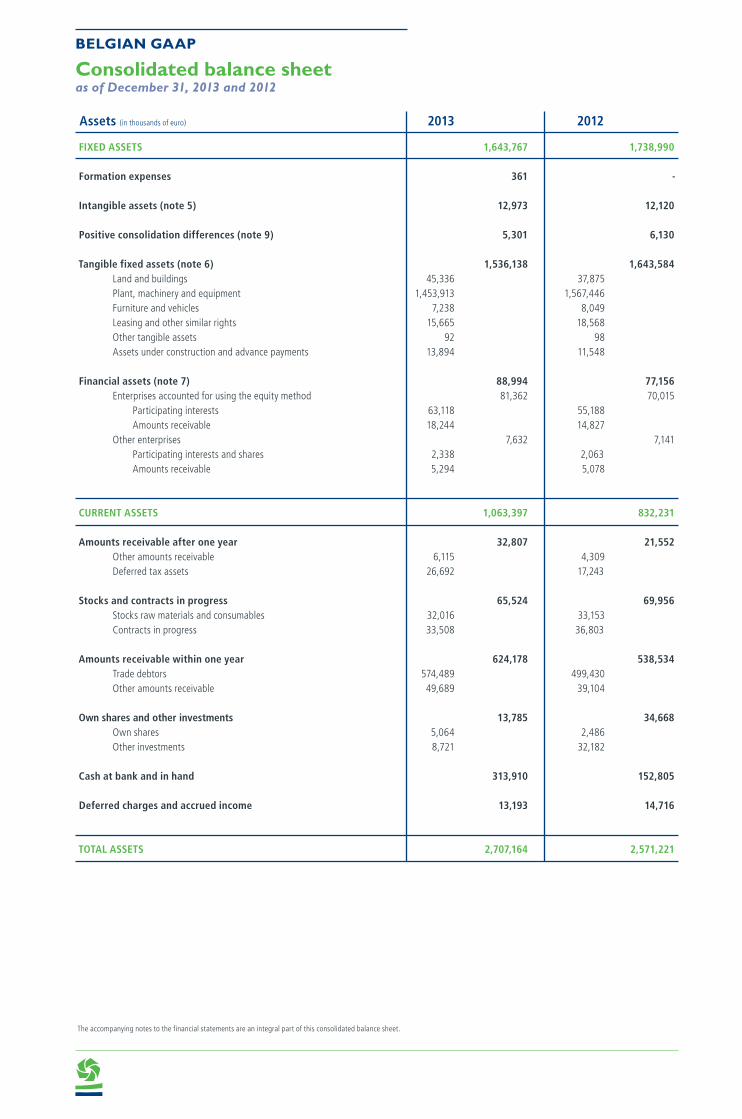
Assets (in thousands of euro) 2013 2012
FIXED ASSETS 1,643,767 1,738,990 Formation expenses 361 -
Intangible assets (note 5) 12,973 12,120
Positive consolidation differences (note 9) 5,301 6,130
Tangible fixed assets (note 6) 1,536,138 1,643,584 Land and buildings 45,336 37,875 Plant, machinery and equipment 1,453,913 1,567,446 Furniture and vehicles 7,238 8,049 Leasing and other similar rights 15,665 18,568 Other tangible assets 92 98 Assets under construction and advance payments 13,894 11,548
Financial assets (note 7) 88,994 77,156 Enterprises accounted for using the equity method 81,362 70,015 Participating interests 63,118 55,188 Amounts receivable 18,244 14,827 Other enterprises 7,632 7,141 Participating interests and shares 2,338 2,063 Amounts receivable 5,294 5,078
CURRENT ASSETS 1,063,397 832,231
Amounts receivable after one year 32,807 21,552 Other amounts receivable 6,115 4,309 Deferred tax assets 26,692 17,243
Stocks and contracts in progress 65,524 69,956 Stocks raw materials and consumables 32,016 33,153 Contracts in progress 33,508 36,803
Amounts receivable within one year 624,178 538,534 Trade debtors 574,489 499,430 Other amounts receivable 49,689 39,104
Own shares and other investments 13,785 34,668 Own shares 5,064 2,486 Other investments 8,721 32,182
Cash at bank and in hand 313,910 152,805 Deferred charges and accrued income 13,193 14,716
TOTAL ASSETS 2,707,164 2,571,221
The accompanying notes to the financial statements are an integral part of this consolidated balance sheet.
Consolidated balance sheetas of December 31, 2013 and 2012
BELGIAN GAAP
f inancial statements 2013
7The accompanying notes to the financial statements are an integral part of this consolidated balance sheet.
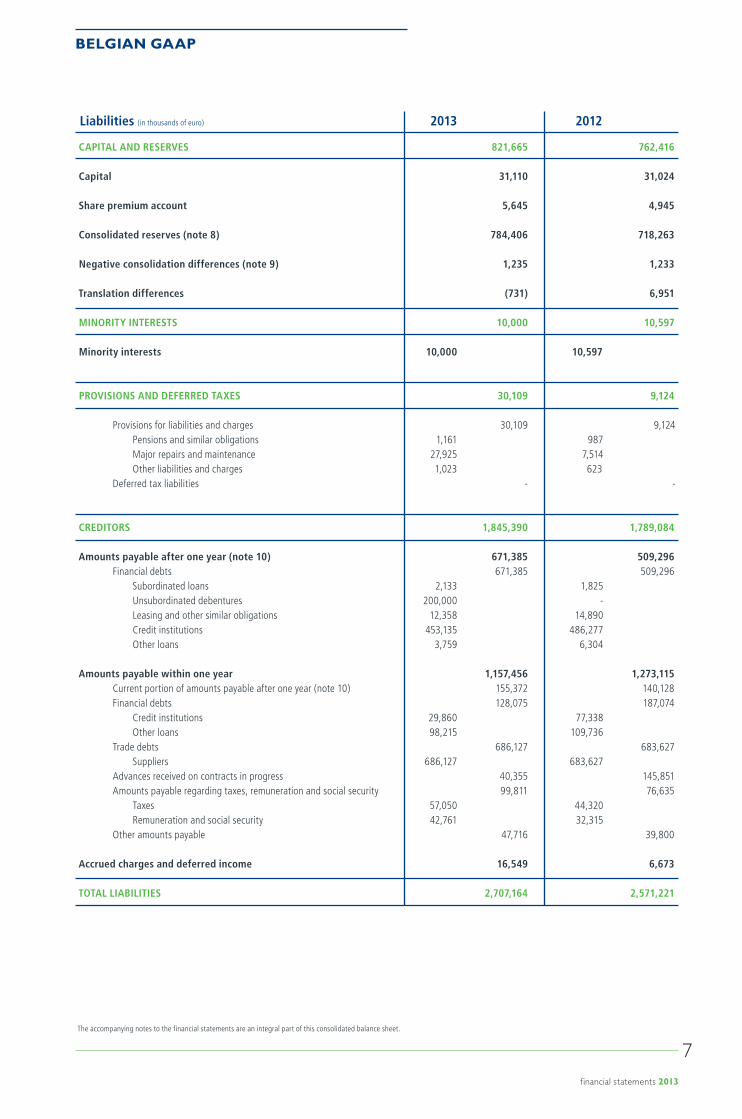
Liabilities (in thousands of euro) 2013 2012
CAPITAL AND RESERVES 821,665 762,416 Capital 31,110 31,024
Share premium account 5,645 4,945
Consolidated reserves (note 8) 784,406 718,263
Negative consolidation differences (note 9) 1,235 1,233
Translation differences (731) 6,951 MINORITY INTERESTS 10,000 10,597
Minority interests 10,000 10,597
PROVISIONS AND DEFERRED TAXES 30,109 9,124
Provisions for liabilities and charges 30,109 9,124 Pensions and similar obligations 1,161 987 Major repairs and maintenance 27,925 7,514 Other liabilities and charges 1,023 623 Deferred tax liabilities - -
CREDITORS 1,845,390 1,789,084
Amounts payable after one year (note 10) 671,385 509,296 Financial debts 671,385 509,296 Subordinated loans 2,133 1,825 Unsubordinated debentures 200,000 - Leasing and other similar obligations 12,358 14,890 Credit institutions 453,135 486,277 Other loans 3,759 6,304 Amounts payable within one year 1,157,456 1,273,115
Current portion of amounts payable after one year (note 10) 155,372 140,128 Financial debts 128,075 187,074 Credit institutions 29,860 77,338 Other loans 98,215 109,736 Trade debts 686,127 683,627 Suppliers 686,127 683,627 Advances received on contracts in progress 40,355 145,851 Amounts payable regarding taxes, remuneration and social security 99,811 76,635 Taxes 57,050 44,320 Remuneration and social security 42,761 32,315 Other amounts payable 47,716 39,800 Accrued charges and deferred income 16,549 6,673
TOTAL LIABILITIES 2,707,164 2,571,221
BELGIAN GAAP
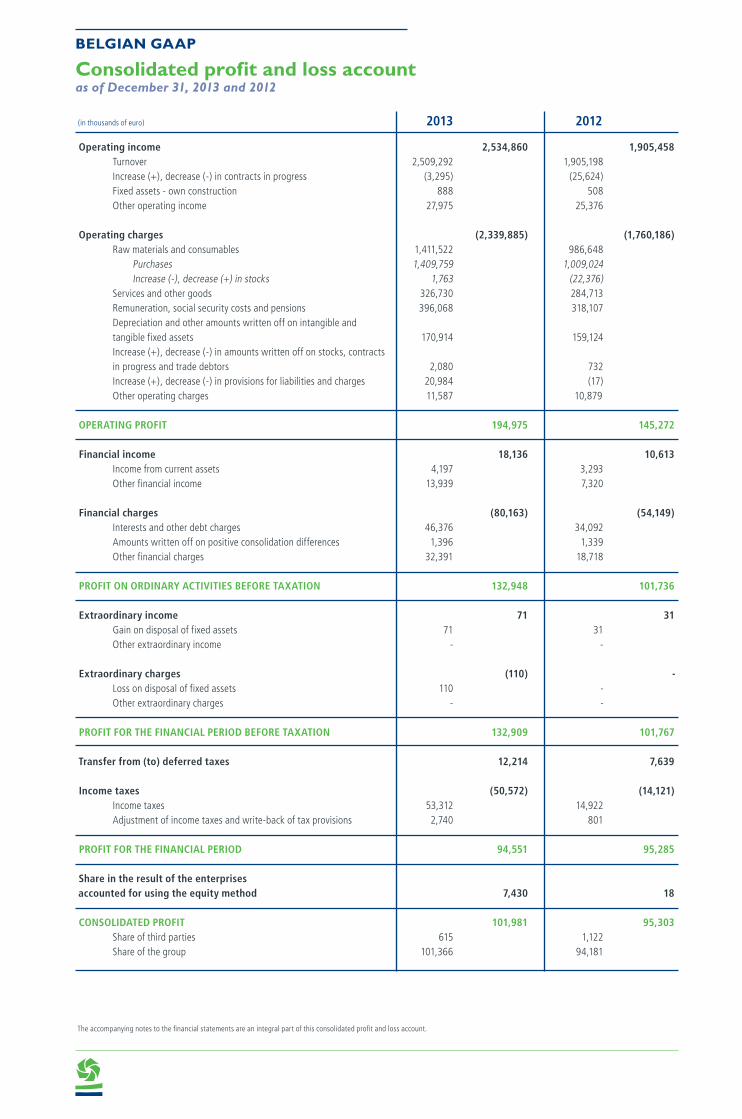
(in thousands of euro) 2013 2012
Operating income 2,534,860 1,905,458 Turnover 2,509,292 1,905,198 Increase (+), decrease (-) in contracts in progress (3,295) (25,624) Fixed assets - own construction 888 508 Other operating income 27,975 25,376
Operating charges (2,339,885) (1,760,186) Raw materials and consumables 1,411,522 986,648 Purchases 1,409,759 1,009,024 Increase (-), decrease (+) in stocks 1,763 (22,376) Services and other goods 326,730 284,713 Remuneration, social security costs and pensions 396,068 318,107 Depreciation and other amounts written off on intangible and tangible fixed assets 170,914 159,124 Increase (+), decrease (-) in amounts written off on stocks, contracts in progress and trade debtors 2,080 732 Increase (+), decrease (-) in provisions for liabilities and charges 20,984 (17) Other operating charges 11,587 10,879 OPERATING PROFIT 194,975 145,272
Financial income 18,136 10,613
Income from current assets 4,197 3,293 Other financial income 13,939 7,320
Financial charges (80,163) (54,149) Interests and other debt charges 46,376 34,092 Amounts written off on positive consolidation differences 1,396 1,339 Other financial charges 32,391 18,718
PROFIT ON ORDINARY ACTIVITIES BEFORE TAXATION 132,948 101,736
Extraordinary income 71 31 Gain on disposal of fixed assets 71 31 Other extraordinary income - -
Extraordinary charges (110) - Loss on disposal of fixed assets 110 - Other extraordinary charges - -
PROFIT FOR THE FINANCIAL PERIOD BEFORE TAXATION 132,909 101,767
Transfer from (to) deferred taxes 12,214 7,639 Income taxes (50,572) (14,121)
Income taxes 53,312 14,922 Adjustment of income taxes and write-back of tax provisions 2,740 801
PROFIT FOR THE FINANCIAL PERIOD 94,551 95,285
Share in the result of the enterprises accounted for using the equity method 7,430 18
CONSOLIDATED PROFIT 101,981 95,303 Share of third parties 615 1,122 Share of the group 101,366 94,181
The accompanying notes to the financial statements are an integral part of this consolidated profit and loss account.
Consolidated profit and loss accountas of December 31, 2013 and 2012
BELGIAN GAAP
f inancial statements 2013
9
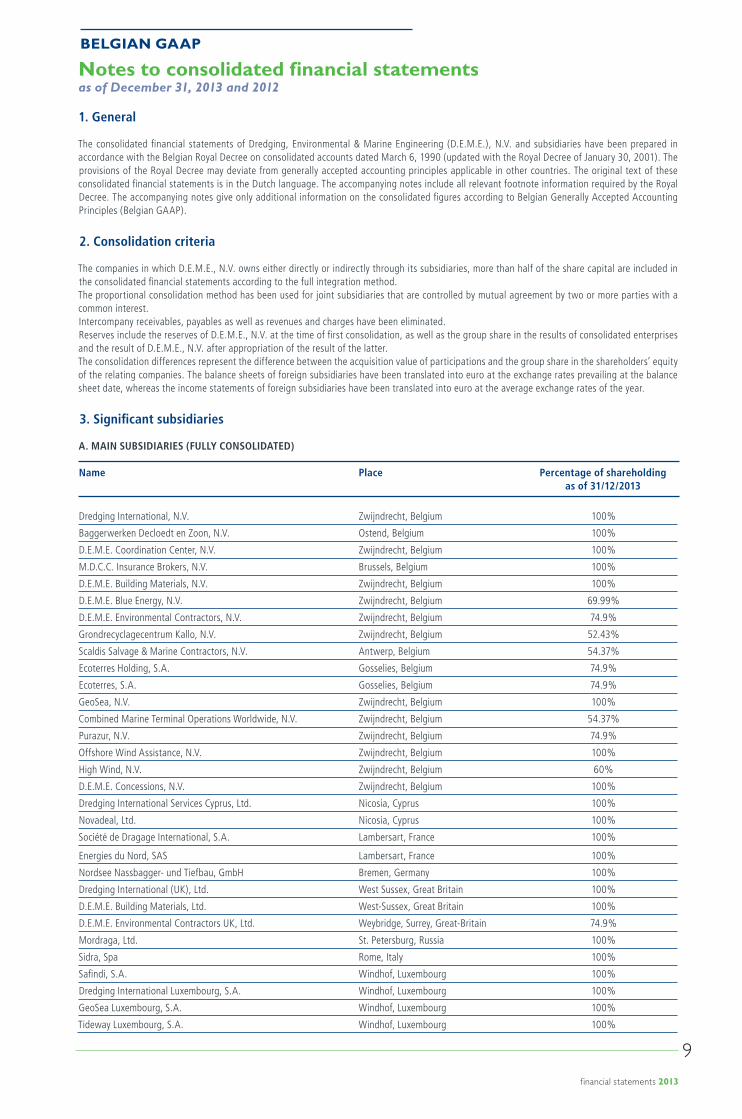
1. General
The consolidated financial statements of Dredging, Environmental & Marine Engineering (D.E.M.E.), N.V. and subsidiaries have been prepared in accordance with the Belgian Royal Decree on consolidated accounts dated March 6, 1990 (updated with the Royal Decree of January 30, 2001). The provisions of the Royal Decree may deviate from generally accepted accounting principles applicable in other countries. The original text of these consolidated financial statements is in the Dutch language. The accompanying notes include all relevant footnote information required by the Royal Decree. The accompanying notes give only additional information on the consolidated figures according to Belgian Generally Accepted Accounting Principles (Belgian GAAP).
2. Consolidation criteria
The companies in which D.E.M.E., N.V. owns either directly or indirectly through its subsidiaries, more than half of the share capital are included in the consolidated financial statements according to the full integration method.The proportional consolidation method has been used for joint subsidiaries that are controlled by mutual agreement by two or more parties with a common interest.Intercompany receivables, payables as well as revenues and charges have been eliminated.Reserves include the reserves of D.E.M.E., N.V. at the time of first consolidation, as well as the group share in the results of consolidated enterprises and the result of D.E.M.E., N.V. after appropriation of the result of the latter.The consolidation differences represent the difference between the acquisition value of participations and the group share in the shareholders’ equity of the relating companies. The balance sheets of foreign subsidiaries have been translated into euro at the exchange rates prevailing at the balance sheet date, whereas the income statements of foreign subsidiaries have been translated into euro at the average exchange rates of the year.
3. Significant subsidiaries
A. MAIN SUBSIDIARIES (FULLY CONSOLIDATED)
Name Place Percentage of shareholding as of 31/12/2013
Dredging International, N.V. Zwijndrecht, Belgium 100%
Baggerwerken Decloedt en Zoon, N.V. Ostend, Belgium 100%
D.E.M.E. Coordination Center, N.V. Zwijndrecht, Belgium 100%
M.D.C.C. Insurance Brokers, N.V. Brussels, Belgium 100%
D.E.M.E. Building Materials, N.V. Zwijndrecht, Belgium 100%
D.E.M.E. Blue Energy, N.V. Zwijndrecht, Belgium 69.99%
D.E.M.E. Environmental Contractors, N.V. Zwijndrecht, Belgium 74.9%
Grondrecyclagecentrum Kallo, N.V. Zwijndrecht, Belgium 52.43%
Scaldis Salvage & Marine Contractors, N.V. Antwerp, Belgium 54.37%
Ecoterres Holding, S.A. Gosselies, Belgium 74.9%
Ecoterres, S.A. Gosselies, Belgium 74.9%
GeoSea, N.V. Zwijndrecht, Belgium 100%
Combined Marine Terminal Operations Worldwide, N.V. Zwijndrecht, Belgium 54.37%
Purazur, N.V. Zwijndrecht, Belgium 74.9%
Offshore Wind Assistance, N.V. Zwijndrecht, Belgium 100%
High Wind, N.V. Zwijndrecht, Belgium 60%
D.E.M.E. Concessions, N.V. Zwijndrecht, Belgium 100%
Dredging International Services Cyprus, Ltd. Nicosia, Cyprus 100%
Novadeal, Ltd. Nicosia, Cyprus 100%
Société de Dragage International, S.A. Lambersart, France 100%
Energies du Nord, SAS Lambersart, France 100%
Nordsee Nassbagger- und Tiefbau, GmbH Bremen, Germany 100%
Dredging International (UK), Ltd. West Sussex, Great Britain 100%
D.E.M.E. Building Materials, Ltd. West-Sussex, Great Britain 100%
D.E.M.E. Environmental Contractors UK, Ltd. Weybridge, Surrey, Great-Britain 74.9%
Mordraga, Ltd. St. Petersburg, Russia 100%
Sidra, Spa Rome, Italy 100%
Safindi, S.A. Windhof, Luxembourg 100%
Dredging International Luxembourg, S.A. Windhof, Luxembourg 100%
GeoSea Luxembourg, S.A. Windhof, Luxembourg 100%
Tideway Luxembourg, S.A. Windhof, Luxembourg 100%
Notes to consolidated financial statementsas of December 31, 2013 and 2012
BELGIAN GAAP
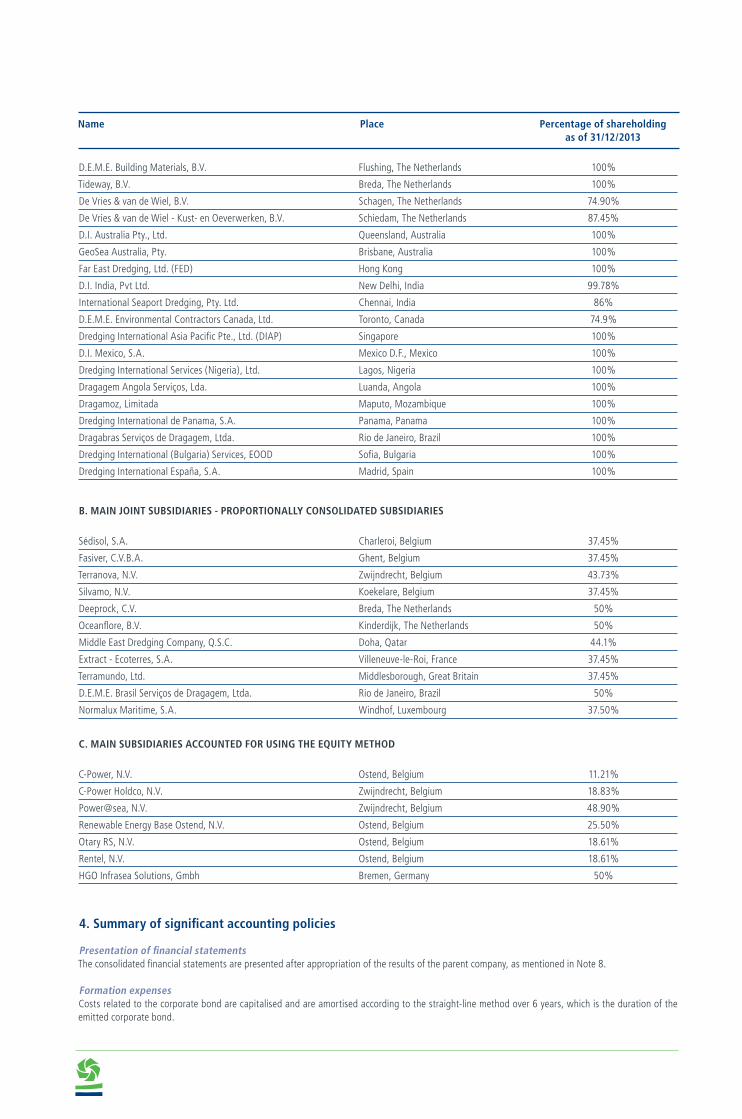
D.E.M.E. Building Materials, B.V. Flushing, The Netherlands 100%
Tideway, B.V. Breda, The Netherlands 100%
De Vries & van de Wiel, B.V. Schagen, The Netherlands 74.90%
De Vries & van de Wiel - Kust- en Oeverwerken, B.V. Schiedam, The Netherlands 87.45%
D.I. Australia Pty., Ltd. Queensland, Australia 100%
GeoSea Australia, Pty. Brisbane, Australia 100%
Far East Dredging, Ltd. (FED) Hong Kong 100%
D.I. India, Pvt Ltd. New Delhi, India 99.78%
International Seaport Dredging, Pty. Ltd. Chennai, India 86%
D.E.M.E. Environmental Contractors Canada, Ltd. Toronto, Canada 74.9%
Dredging International Asia Pacific Pte., Ltd. (DIAP) Singapore 100%
D.I. Mexico, S.A. Mexico D.F., Mexico 100%
Dredging International Services (Nigeria), Ltd. Lagos, Nigeria 100%
Dragagem Angola Serviços, Lda. Luanda, Angola 100%
Dragamoz, Limitada Maputo, Mozambique 100%
Dredging International de Panama, S.A. Panama, Panama 100%
Dragabras Serviços de Dragagem, Ltda. Rio de Janeiro, Brazil 100%
Dredging International (Bulgaria) Services, EOOD Sofia, Bulgaria 100%
Dredging International España, S.A. Madrid, Spain 100%
B. MAIN JOINT SUBSIDIARIES - PROPORTIONALLY CONSOLIDATED SUBSIDIARIES
Sédisol, S.A. Charleroi, Belgium 37.45%
Fasiver, C.V.B.A. Ghent, Belgium 37.45%
Terranova, N.V. Zwijndrecht, Belgium 43.73%
Silvamo, N.V. Koekelare, Belgium 37.45%
Deeprock, C.V. Breda, The Netherlands 50%
Oceanflore, B.V. Kinderdijk, The Netherlands 50%
Middle East Dredging Company, Q.S.C. Doha, Qatar 44.1%
Extract - Ecoterres, S.A. Villeneuve-le-Roi, France 37.45%
Terramundo, Ltd. Middlesborough, Great Britain 37.45%
D.E.M.E. Brasil Serviços de Dragagem, Ltda. Rio de Janeiro, Brazil 50%
Normalux Maritime, S.A. Windhof, Luxembourg 37.50%
C. MAIN SUBSIDIARIES ACCOUNTED FOR USING THE EQUITY METHOD
C-Power, N.V. Ostend, Belgium 11.21%
C-Power Holdco, N.V. Zwijndrecht, Belgium 18.83%
Power@sea, N.V. Zwijndrecht, Belgium 48.90%
Renewable Energy Base Ostend, N.V. Ostend, Belgium 25.50%
Otary RS, N.V. Ostend, Belgium 18.61%
Rentel, N.V. Ostend, Belgium 18.61%
HGO Infrasea Solutions, Gmbh Bremen, Germany 50%
4. Summary of significant accounting policies
Presentation of financial statementsThe consolidated financial statements are presented after appropriation of the results of the parent company, as mentioned in Note 8.
Formation expensesCosts related to the corporate bond are capitalised and are amortised according to the straight-line method over 6 years, which is the duration of the emitted corporate bond.
Name Place Percentage of shareholding as of 31/12/2013
f inancial statements 2013
11
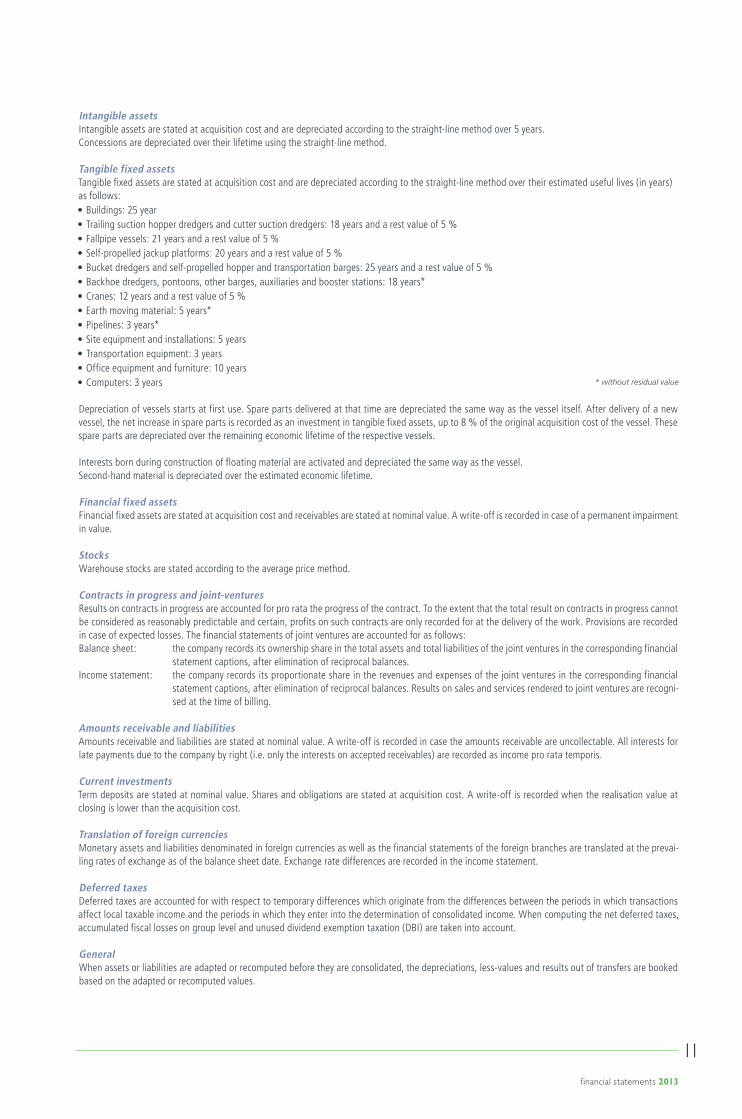
Intangible assetsIntangible assets are stated at acquisition cost and are depreciated according to the straight-line method over 5 years.Concessions are depreciated over their lifetime using the straight-line method.
Tangible fixed assetsTangible fixed assets are stated at acquisition cost and are depreciated according to the straight-line method over their estimated useful lives (in years)as follows:• Buildings: 25 year• Trailing suction hopper dredgers and cutter suction dredgers: 18 years and a rest value of 5 %• Fallpipe vessels: 21 years and a rest value of 5 %• Self-propelled jackup platforms: 20 years and a rest value of 5 %• Bucket dredgers and self-propelled hopper and transportation barges: 25 years and a rest value of 5 %• Backhoe dredgers, pontoons, other barges, auxiliaries and booster stations: 18 years*• Cranes: 12 years and a rest value of 5 %• Earth moving material: 5 years*• Pipelines: 3 years*• Site equipment and installations: 5 years• Transportation equipment: 3 years• Office equipment and furniture: 10 years• Computers: 3 years
Depreciation of vessels starts at first use. Spare parts delivered at that time are depreciated the same way as the vessel itself. After delivery of a new vessel, the net increase in spare parts is recorded as an investment in tangible fixed assets, up to 8 % of the original acquisition cost of the vessel. These spare parts are depreciated over the remaining economic lifetime of the respective vessels.
Interests born during construction of floating material are activated and depreciated the same way as the vessel.Second-hand material is depreciated over the estimated economic lifetime.
Financial fixed assetsFinancial fixed assets are stated at acquisition cost and receivables are stated at nominal value. A write-off is recorded in case of a permanent impairment in value.
StocksWarehouse stocks are stated according to the average price method.
Contracts in progress and joint-venturesResults on contracts in progress are accounted for pro rata the progress of the contract. To the extent that the total result on contracts in progress cannot be considered as reasonably predictable and certain, profits on such contracts are only recorded for at the delivery of the work. Provisions are recorded in case of expected losses. The financial statements of joint ventures are accounted for as follows:Balance sheet: the company records its ownership share in the total assets and total liabilities of the joint ventures in the corresponding financial
statement captions, after elimination of reciprocal balances.Income statement: the company records its proportionate share in the revenues and expenses of the joint ventures in the corresponding financial
statement captions, after elimination of reciprocal balances. Results on sales and services rendered to joint ventures are recogni-sed at the time of billing.
Amounts receivable and liabilitiesAmounts receivable and liabilities are stated at nominal value. A write-off is recorded in case the amounts receivable are uncollectable. All interests for late payments due to the company by right (i.e. only the interests on accepted receivables) are recorded as income pro rata temporis.
Current investmentsTerm deposits are stated at nominal value. Shares and obligations are stated at acquisition cost. A write-off is recorded when the realisation value at closing is lower than the acquisition cost.
Translation of foreign currenciesMonetary assets and liabilities denominated in foreign currencies as well as the financial statements of the foreign branches are translated at the prevai-ling rates of exchange as of the balance sheet date. Exchange rate differences are recorded in the income statement.
Deferred taxesDeferred taxes are accounted for with respect to temporary differences which originate from the differences between the periods in which transactions affect local taxable income and the periods in which they enter into the determination of consolidated income. When computing the net deferred taxes, accumulated fiscal losses on group level and unused dividend exemption taxation (DBI) are taken into account.
GeneralWhen assets or liabilities are adapted or recomputed before they are consolidated, the depreciations, less-values and results out of transfers are booked based on the adapted or recomputed values.
* without residual value
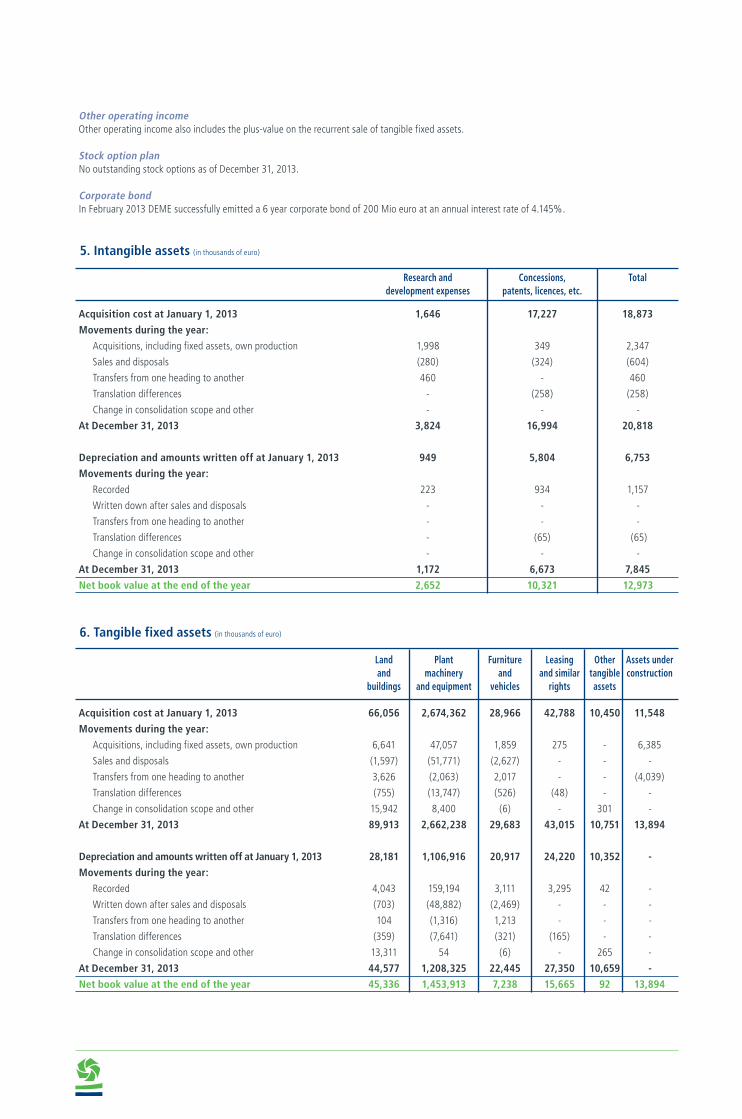
Other operating incomeOther operating income also includes the plus-value on the recurrent sale of tangible fixed assets.
Stock option planNo outstanding stock options as of December 31, 2013.
Corporate bondIn February 2013 DEME successfully emitted a 6 year corporate bond of 200 Mio euro at an annual interest rate of 4.145%.
5. Intangible assets (in thousands of euro)
Research and Concessions, Total development expenses patents, licences, etc.
Acquisition cost at January 1, 2013 1,646 17,227 18,873
Movements during the year:
Acquisitions, including fixed assets, own production 1,998 349 2,347
Sales and disposals (280) (324) (604)
Transfers from one heading to another 460 - 460
Translation differences - (258) (258)
Change in consolidation scope and other - - -
At December 31, 2013 3,824 16,994 20,818
Depreciation and amounts written off at January 1, 2013 949 5,804 6,753
Movements during the year:
Recorded 223 934 1,157
Written down after sales and disposals - - -
Transfers from one heading to another - - -
Translation differences - (65) (65)
Change in consolidation scope and other - - -
At December 31, 2013 1,172 6,673 7,845
Net book value at the end of the year 2,652 10,321 12,973
6. Tangible fixed assets (in thousands of euro) Land Plant Furniture Leasing Other Assets under and machinery and and similar tangible construction buildings and equipment vehicles rights assets
Acquisition cost at January 1, 2013 66,056 2,674,362 28,966 42,788 10,450 11,548
Movements during the year:
Acquisitions, including fixed assets, own production 6,641 47,057 1,859 275 - 6,385
Sales and disposals (1,597) (51,771) (2,627) - - -
Transfers from one heading to another 3,626 (2,063) 2,017 - - (4,039)
Translation differences (755) (13,747) (526) (48) - -
Change in consolidation scope and other 15,942 8,400 (6) - 301 -
At December 31, 2013 89,913 2,662,238 29,683 43,015 10,751 13,894
Depreciation and amounts written off at January 1, 2013 28,181 1,106,916 20,917 24,220 10,352 -
Movements during the year:
Recorded 4,043 159,194 3,111 3,295 42 -
Written down after sales and disposals (703) (48,882) (2,469) - - -
Transfers from one heading to another 104 (1,316) 1,213 - - -
Translation differences (359) (7,641) (321) (165) - -
Change in consolidation scope and other 13,311 54 (6) - 265 -
At December 31, 2013 44,577 1,208,325 22,445 27,350 10,659 -
Net book value at the end of the year 45,336 1,453,913 7,238 15,665 92 13,894
f inancial statements 2013
13
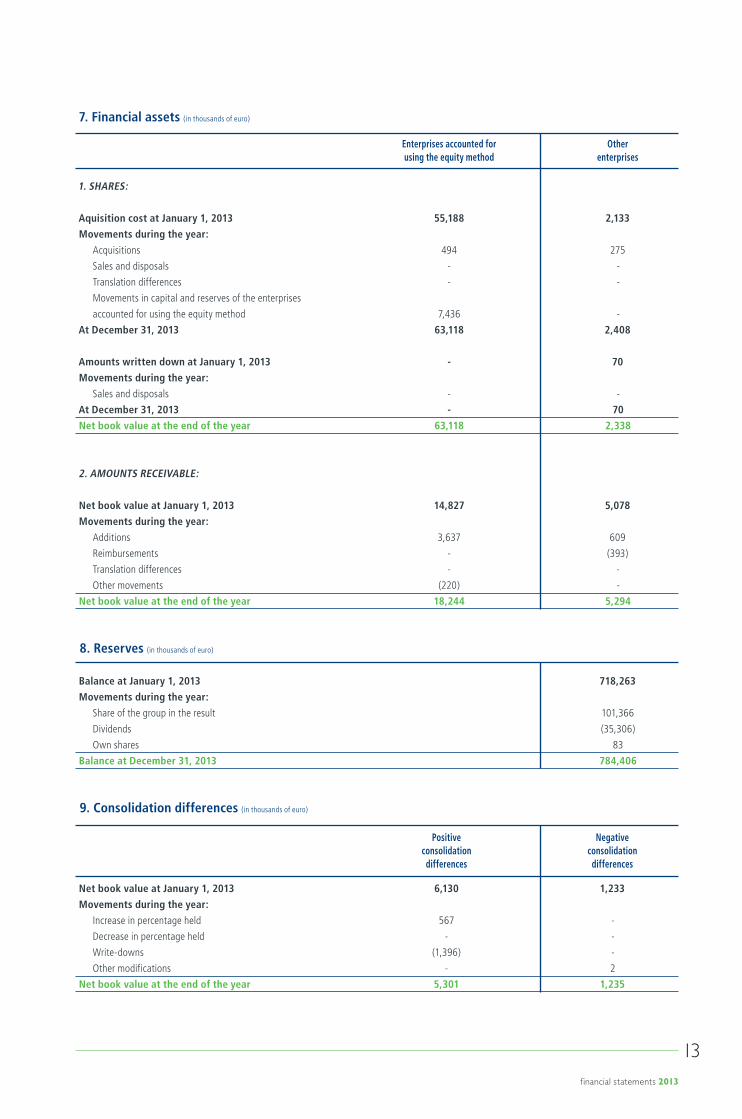
7. Financial assets (in thousands of euro)
Enterprises accounted for Other using the equity method enterprises
1. SHARES:
Aquisition cost at January 1, 2013 55,188 2,133
Movements during the year:
Acquisitions 494 275
Sales and disposals - -
Translation differences - -
Movements in capital and reserves of the enterprises
accounted for using the equity method 7,436 -
At December 31, 2013 63,118 2,408
Amounts written down at January 1, 2013 - 70
Movements during the year:
Sales and disposals - -
At December 31, 2013 - 70
Net book value at the end of the year 63,118 2,338
2. AMOUNTS RECEIVABLE:
Net book value at January 1, 2013 14,827 5,078
Movements during the year:
Additions 3,637 609
Reimbursements - (393)
Translation differences - -
Other movements (220) -
Net book value at the end of the year 18,244 5,294
8. Reserves (in thousands of euro)
Balance at January 1, 2013 718,263
Movements during the year:
Share of the group in the result 101,366
Dividends (35,306)
Own shares 83
Balance at December 31, 2013 784,406
9. Consolidation differences (in thousands of euro)
Positive Negative consolidation consolidation differences differences
Net book value at January 1, 2013 6,130 1,233
Movements during the year:
Increase in percentage held 567 -
Decrease in percentage held - -
Write-downs (1,396) -
Other modifications - 2
Net book value at the end of the year 5,301 1,235
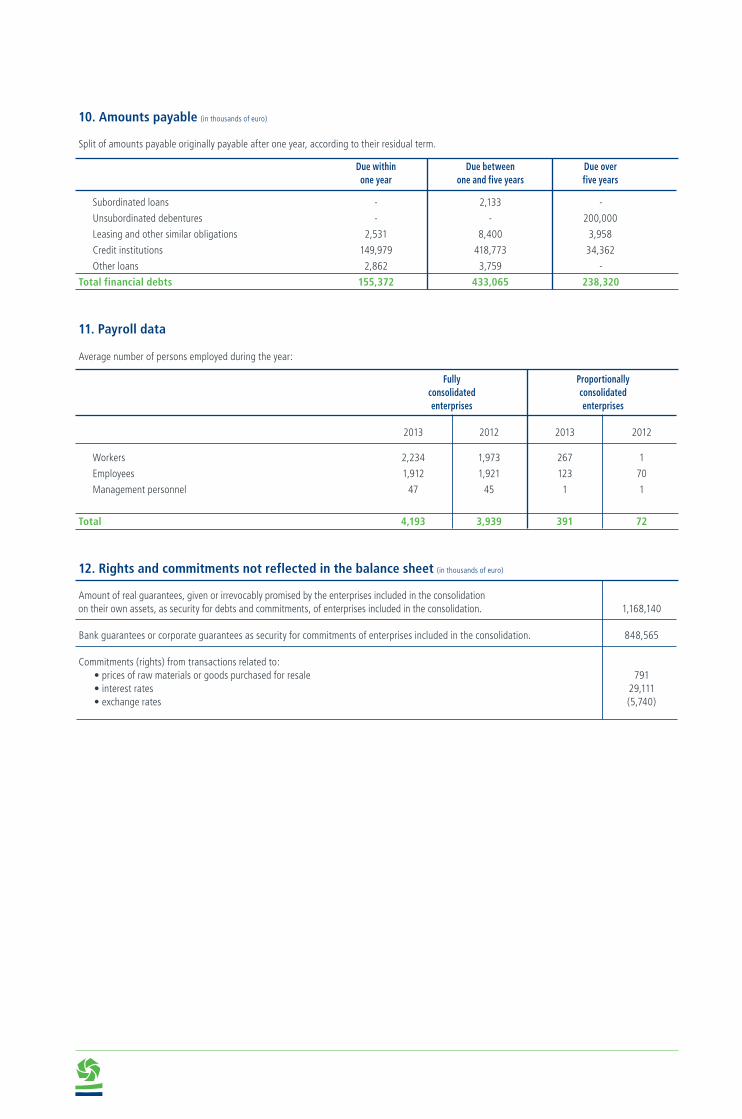
10. Amounts payable (in thousands of euro)
Split of amounts payable originally payable after one year, according to their residual term.
Due within Due between Due over one year one and five years five years
Subordinated loans - 2,133 -
Unsubordinated debentures - - 200,000
Leasing and other similar obligations 2,531 8,400 3,958
Credit institutions 149,979 418,773 34,362
Other loans 2,862 3,759 -
Total financial debts 155,372 433,065 238,320
11. Payroll data Average number of persons employed during the year:
Fully Proportionally consolidated consolidated enterprises enterprises
2013 2012 2013 2012
Workers 2,234 1,973 267 1
Employees 1,912 1,921 123 70
Management personnel 47 45 1 1
Total 4,193 3,939 391 72
12. Rights and commitments not reflected in the balance sheet (in thousands of euro)
Amount of real guarantees, given or irrevocably promised by the enterprises included in the consolidation on their own assets, as security for debts and commitments, of enterprises included in the consolidation. 1,168,140
Bank guarantees or corporate guarantees as security for commitments of enterprises included in the consolidation. 848,565
Commitments (rights) from transactions related to: • prices of raw materials or goods purchased for resale 791 • interest rates 29,111 • exchange rates (5,740)
f inancial statements 2013
15
To the Shareholders
As required by law and the company’s articles of association, we are pleased to report to you on the audit assignment which you have entrusted to us. This report includes our opinion on the consolidated financial statements together with the required additional comments and information.
Unqualified audit opinion on the consolidated financial statements
We have audited the accompanying consolidated financial statements of Dredging Environmental & Marine Engineering NV (“the company”) and its
subsidiaries (jointly “the group”) for the year ended 31 December 2013, prepared in accordance with accounting principles applicable in Belgium, which
show total consolidated assets of 2,707,164 (000) EUR and a consolidated profit (group share) for the year of 101,366 (000) EUR.
The board of directors of the company is responsible for the preparation of the consolidated financial statements. This responsibility includes among other things: designing, implementing and maintaining internal control relevant to the preparation and fair presentation of consolidated financial statements that are free from material misstatement, whether due to fraud or error, selecting and applying appropriate accounting policies, and making accounting estimates that are reasonable in the circumstances.
Our responsibility is to express an opinion on these consolidated financial statements based on our audit. We conducted our audit in accordance with legal requirements and auditing standards applicable in Belgium, as issued by the “Institut des Reviseurs d’Entreprises/Instituut van de Bedrijfsrevisoren”. Those standards require that we plan and perform the audit to obtain reasonable assurance whether the consolidated financial statements are free from material misstatement.
In accordance with these standards, we have performed procedures to obtain audit evidence about the amounts and disclosures in the consolidated financial statements. The procedures selected depend on our judgment, including the assessment of the risks of material misstatement of the consoli-dated financial statements, whether due to fraud or error. In making those risk assessments, we have considered internal control relevant to the group’s preparation and fair presentation of the consolidated financial statements in order to design audit procedures that are appropriate in the circumstances but not for the purpose of expressing an opinion on the effectiveness of the group’s internal control. We have assessed the basis of the accounting policies used, the reasonableness of accounting estimates made by the company and the presentation of the consolidated financial statements, taken as a whole.
Finally, the board of directors and responsible officers of the company have replied to all our requests for explanations and information. We believe that the audit evidence we have obtained provides a reasonable basis for our opinion.
In our opinion the consolidated financial statements as of 31 December 2013 give a true and fair view of the group’s assets, liabilities, financial position and results, in accordance with accounting principles applicable in Belgium.
Additional comments and information
The preparation and the assessment of the information that should be included in the directors’ report on the consolidated financial statements are the responsibility of the board of directors.
Our responsibility is to include in our report the following additional comments and information which do not change the scope of our audit opinion on the consolidated financial statements:
• The directors’ report on the consolidated financial statements includes the information required by law and is in agreement with the con-solidated financial statements. However, we are unable to express an opinion on the description of the principal risks and uncertainties confronting the group, or on the status, future evolution, or significant influence of certain factors on its future development. We can, nevertheless, confirm that the information given is not in obvious contradiction with any information obtained in the context of our ap-pointment.
• The consolidated balance sheet and income statement in this brochure also includes, for information purposes only, the consolidated figures according to International Financial Reporting Standards (IFRS). These figures have been prepared by the Board of Directors of DEME for consolidation purposes by DEME’s shareholders. We have reviewed these figures in this perspective and confirm that we have not identified any material adjustments that should have been recorded in the IFRS balance sheet and income statement included in this brochure. This brochure only includes the consolidated IFRS balance sheet and income statement and therefore is not to be considered as financial state-ments fully complying with IFRS.
26 March 2014
The Statutory Auditor,DELOITTE Reviseurs d’EntreprisesSC s.f.d. SCRLRepresented by Luc Van Coppenolle
Statutory auditor’s reportto the shareholders’ meeting on the consolidated financial statements for the year ended 31 December 2013
