2013 annual report · our labor-to-revenue ratio by 70 basis ... innovative project at lightfair...
TRANSCRIPT

2013 annual report

Dear Fellow Share- holDerS
I want to thank the entire Viad team for rising to the chal-lenge to deliver solid year-on-year improvement despite revenue headwinds from negative show rotation in the Marketing & Events Group and massive flooding in Alberta, Canada that temporarily hampered tourism in Banff and Jasper during late June and early July. I am proud to work with this team of dedicated professionals. I am also grate-ful to Viad’s valued customers and to our knowledgeable Board of Directors for their collective expertise and ongo-ing support.
Our management team and Board are committed to delivering enhanced value to our shareholders and to pru-dently managing capital. At December 31, 2013, the bal-ance sheet of the Company remained strong with cash and equivalents totaling $45.8 million and very little debt. Our strong balance sheet enabled us to return a total of $81.3 million to our shareholders through the form of special dividends that were paid in November 2013 and February 2014. We were pleased to reward our loyal shareholders with these significant payments.
Marketing & Events Group Highlights
Marketing & Events Group operating income increased 12.2 percent in 2013 despite a $64 million headwind as a result of negative show rotation and work performed in connection with the 2012 Summer Olympic Games. The 2013 full year operating margin increased to 2.4 percent from 2 percent in 2012. Throughout the year, we con-tinued to make progress in optimizing our U.S. service
I am pleased to report to you that 2013 was a year of many successes for Viad as we continued our focused initiatives to operate more efficiently, expand our client base and generate growth in profits. Income before other items increased by 15.6 percent to $1.26 per share and segment operating income increased 9.6 percent to $45.9 million on a revenue decline of 5.1 percent.

delivery network and we made measurable progress with our labor management initiative as we reduced our labor-to-revenue ratio by 70 basis points on U.S. base same-shows, which follows a 50 basis point reduction in 2012. Overall, U.S. segment operating income nearly doubled to $11 million in 2013 versus $5.6 million in 2012.
Our continued focus on business development also paid off in 2013, with a number of key contract renew-als with leading show organizers and corporate exhib-itors, including Advanstar, Penton Media, ICSC, Bristol-Myers Squibb, Novartis and Boehringer Ingelheim, to name a few. These are representative examples of the great work done by our sales, marketing, and service teams to extend our relationships with current cus-tomers and to win new business that bolsters our market share.
GES partnered with Philips Lighting on an award-win-ning, innovative project at LIGHTFAIR® International (LFI), North America’s largest annual architectural and commercial lighting trade show and conference. At LFI, Philips moved from an individual brand focus to a cus-tomer and integrated-solutions focus. To bring our cli-ent’s vision to life, GES designers, brand architects and marketers collaborated and helped Philips consolidate 40 brands with multiple exhibits into one, dynamic 3D experience that engaged each of their audiences. GES created a variety of market-specific environments where attendees experienced the products in settings that replicated real-world conditions. Philips became
the must-see exhibit at LFI and won Best of Show and GES’ work with Philips was also recognized by BtoB and other trade magazines.
The international team also generated strong sales momentum in 2013. Reinforcing our position as the leader in the U.K. market, we secured a new four-year contract with event organizer i2i Events Group that is likely to be the largest exhibition services contract ever signed in the U.K. Our office in Amsterdam con-tinued to gain measurable traction by winning and pro-ducing an extensive portfolio of events for UBM Live, a leading business-to-business events organizer. And PennWell Corporation, a leading international exhibi-tions organizer, awarded GES a contract to provide
For Lightfair 2013, Philips came to GES to design an exhibit that would mirror the direction of their new marketing approach and company positioning to a customer and integrated solutions oriented approach. This photo highlights the Hospitality Segment where spaces can be dramatically changed using Philips’ new color changing products.
Our management team and Board are committed to delivering enhanced value to our shareholders…
services for all of its events in the Middle East in 2014 and 2015. This relationship brings to 50 the number of shows that GES delivers in that high-growth market.
Travel & Recreation Group Highlights
Our Travel & Recreation Group delivered strong results in 2013 with revenue growth of 3.8 percent, a 7.7 percent increase in segment operating income

and a 70 basis point improvement in operating mar-gin. Brewster, Glacier Park and Alaska Denali Travel all posted higher revenue and operating income as com-pared to 2012. We experienced greater visitation to our attractions and higher occupancy at most of our lodges and hotels during 2013.
In addition to delivering strong results in 2013, we also crossed a significant milestone with the completion of the Glacier Skywalk. After several years of planning and construction, we are now preparing for its Grand Opening in May 2014. The Glacier Skywalk is a great example of the imagination and innovation put into action by the Travel & Recreation team.
Operated by Brewster, this new attraction starts with a cliff-edge walkway, offering an immersive, guided experi-ence focusing on the unique ecology, geology, glaciology and evolutionary history of the Columbia Icefield area. The walkway leads to a glass-floored platform extend-ing 30 meters over the Sunwapta Valley, with stunning views of the glacial valley 280 meters below.
From concept to completion, innovation was required in every aspect of this project. Because it was built alongside the Icefields Parkway, which is an extreme environment located within Jasper National Park, cre-ative solutions had to be developed to bring the project to life – from environmental preservation to construc-tion of the massive, cliff-side structure and cantilevered platform.
To complete the experience, Brewster enlisted the help of GES’ award-winning design and production team to design various interactive elements for the Skywalk. Brewster knew the GES team would be able to apply knowledge from working with both the attraction and theme park industries to deliver meaningful content in a unique and innovative way, and help create an edu-cational and exciting experience for guests of all ages.
The Skywalk has already won a number of architec-tural and engineering awards and we are see-
ing great interest from the media and travel industry. I firmly believe that the Skywalk
will become one of the must-see, iconic natural attrac-tions of North America. We are excited to unveil this amazing experience to our guests.
2014 Outlook
We expect another year of significant profit growth in 2014, with particularly strong growth in our Marketing & Events Group where we will benefit from positive show rotation and continued progress with margin improvement and business development initiatives. In addition, we continue to actively seek other opportuni-ties to enhance shareholder value through our review of strategic options for the business.
We are excited with the opportunities ahead and to make the most of these opportunities, we will continue our intense focus on innovation aimed toward:
• Enhancing our customer and guest experiences;
• Creating profitable new products and services; and
• Simplifying and becoming more efficient at how we deliver those products and services.
We firmly believe that innovation will help Viad drive consistent value and is a key to ensuring that we con-tinue to exceed customer expectations and win for our shareholders. And, we remain committed to our value of integrity and being “Always Honest” in everything we do.
As always, we thank you, our loyal shareholders, for your continued support as we work to enhance shareholder value in 2014 and the years to come.
Sincerely,
Paul B. Dykstra
Chairman, President and Chief Executive Officer

The Glacier Skywalk attraction includes an interactive walkway and a thrilling glass-floored observation platform positioned above the breathtaking Sunwapta
Valley in Jasper National Park. Opening May 1, 2014, the Glacier Skywalk will give visitors a whole new way to connect with the peaks and glaciers that sur-
round them, and the waterfalls and glacial valley nearly 1,000 feet below them!
”The Glacier Skywalk is a great example of the imagination and innovation put into action by the
Travel & Recreation team.

VIAD TEAM VALUESINTEGRITY
We do the right thing 100 percent of the time and are committed to being “Always Honest.”
TEAM ACHIEVEMENT
We are committed to winning as a team and to delivering strong value for our shareholders and customers.
INNOVATION and LEADERSHIP
We utilize our passion and creativity to find new ways to contribute to our suc-cess. We are all leaders. Each one of us is an example for someone else.
ENVIRONMENT
We respect our environment and conscientiously use our natural resources.
TRUST and MUTUAL RESPECT
We earn and sustain the trust of others through respect and accountability.
We believe that living these values will lead to … SUCCESS … and winning at all we do!
financial HigHligHts
‘13‘12‘11 ‘13‘12‘11 ‘13‘12‘11‘13‘12‘11
$942
.4 $1,0
25.2
$972
.8
$25.
4
$41
.9
$45
.9
$43
.3 $58.
2
$62.
8
0.8%
0.6%
3.2%
‘13‘12‘11 ‘13‘12‘11 ‘13‘12‘11‘13‘12‘11
$942
.4 $1,0
25.2
$972
.8
$25.
4
$41
.9
$45
.9
$43
.3 $58.
2
$62.
8
0.8%
0.6%
3.2%
‘13‘12‘11 ‘13‘12‘11 ‘13‘12‘11‘13‘12‘11
$942
.4 $1,0
25.2
$972
.8
$25.
4
$41
.9
$45
.9
$43
.3 $58.
2
$62.
8
0.8%
0.6%
3.2%
‘13‘12‘11 ‘13‘12‘11 ‘13‘12‘11‘13‘12‘11
$942
.4 $1,0
25.2
$972
.8
$25.
4
$41
.9
$45
.9
$43
.3 $58.
2
$62.
8
0.8%
0.6%
3.2%
Adjusted EBITDA1 (in millions)
Debt-to-Capital Ratio2
Revenues (in millions)
Segment Operating Income (in millions)
1 “Adjusted EBITDA” is defined by Viad as net income attributable to Viad before interest expense, income taxes, depreciation and amortization, impairment losses and recoveries, changes in accounting principles and the effects of discontinued operations. For further discussion and a reconciliation of Adjusted EBITDA to net income, refer to “Non-GAAP Measure” in Management’s Discussion and Analysis of Financial Condition and Results of Operations in the attached Form 10-K.
2 “Capital” is defined as total debt and capital lease obligations plus total stockholders’ equity.
As filed with the Securities and Exchange Commission on March 7, 2014
UNITED STATES SECURITIES AND EXCHANGE COMMISSION
Washington, D.C. 20549
FORM 10-K (Mark One) ANNUAL REPORT PURSUANT TO SECTION 13 OR 15(d) OF THE SECURITIES EXCHANGE ACT OF 1934
For the fiscal year ended December 31, 2013 or
TRANSITION REPORT PURSUANT TO SECTION 13 OR 15(d) OF THE SECURITIES EXCHANGE ACT OF 1934
For the transition period from to Commission file number: 001-11015
Viad Corp (Exact name of registrant as specified in its charter)
Delaware 36-1169950
State or other jurisdiction of incorporation or organization
(I.R.S. Employer Identification No.)
1850 North Central Avenue, Suite 1900Phoenix, Arizona 85004-4565
(Address of principal executive offices) (Zip Code)
Registrant’s telephone number, including area code: (602) 207-1000
Securities registered pursuant to Section 12(b) of the Act:
Title of each class Name of each exchange
on which registered Common Stock, $1.50 par value New York Stock Exchange
Securities registered pursuant to Section 12(g) of the Act: None
Indicate by check mark if the registrant is a well-known seasoned issuer, as defined by Rule 405 of the Securities Act. Yes No Indicate by check mark if the registrant is not required to file reports pursuant to Section 13 or 15(d) of the Act. Yes No Indicate by check mark whether the registrant (1) has filed all reports required to be filed by Section 13 or 15(d) of the Securities Exchange Act of 1934 during the preceding 12 months (or for such shorter period that the registrant was required to file such reports), and (2) has been subject to such filing requirements for the past 90 days. Yes No Indicate by check mark whether the registrant has submitted electronically and posted on its corporate Website, if any, every Interactive Data File required to be submitted and posted pursuant to Rule 405 of Regulation S-T (§ 232.405 of this chapter) during the preceding 12 months (or for such shorter period that the registrant was required to submit and post such files.) Yes No Indicate by check mark if disclosure of delinquent filers pursuant to Item 405 of Regulation S-K is not contained herein, and will not be contained, to the best of registrant’s knowledge, in definitive proxy or information statements incorporated by reference in Part III of this Form 10-K or any amendment to this Form 10-K. Indicate by check mark whether registrant is a large accelerated filer, an accelerated filer, a non-accelerated filer, or a smaller reporting company. See definition of “large accelerated filer,” “accelerated filer” and “smaller reporting company” in Rule 12b-2 of the Exchange Act. (Check One): Large accelerated filer Accelerated filer
Non-accelerated filer Smaller reporting company
Indicate by check mark whether the registrant is a shell company (as defined in Rule 12b-2 of the Act). Yes No The aggregate market value of the Common Stock (based on its closing price per share on such date) held by non-affiliates on the last business day of the registrant’s most recently completed second fiscal quarter (June 30, 2013) was approximately $480 million. Registrant had 20,324,136 shares of Common Stock ($1.50 par value) outstanding as of January 31, 2014.
Documents Incorporated by Reference A portion of the Proxy Statement for the Annual Meeting of Shareholders of Viad Corp to be held May 22, 2014 is incorporated by reference into Part III of this Annual Report.

INDEX Page
Part I Item 1. Business ............................................................................................................................................... 1Item 1A. Risk Factors ......................................................................................................................................... 8Item 1B. Unresolved Staff Comments ................................................................................................................ 12Item 2. Properties ............................................................................................................................................. 12Item 3. Legal Proceedings ................................................................................................................................ 13Item 4. Mine Safety Disclosures ...................................................................................................................... 13Other. Executive Officers of Registrant .......................................................................................................... 14
Part II Item 5. Market for Registrant’s Common Equity, Related Stockholder Matters and Issuer Purchases of
Equity Securities .................................................................................................................................. 15Item 6. Selected Financial Data ........................................................................................................................ 18Item 7. Management’s Discussion and Analysis of Financial Condition and Results of Operations ............... 19Item 7A. Quantitative and Qualitative Disclosures About Market Risk ............................................................. 36Item 8. Financial Statements and Supplementary Data .................................................................................... 37Item 9. Changes in and Disagreements With Accountants on Accounting and Financial Disclosure .............. 37Item 9A. Controls and Procedures ...................................................................................................................... 37Item 9B. Other Information ................................................................................................................................ 37
Part III Item 10. Directors, Executive Officers and Corporate Governance ................................................................... 38Item 11. Executive Compensation ...................................................................................................................... 38Item 12. Security Ownership of Certain Beneficial Owners and Management and Related Stockholder
Matters ................................................................................................................................................. 38Item 13. Certain Relationships and Related Transactions, and Director Independence ..................................... 38Item 14. Principal Accounting Fees and Services .............................................................................................. 38
Part IV
Item 15. Exhibits, Financial Statement Schedules............................................................................................. 38
1
PART I
Item 1. Business.
Viad Corp (together with its subsidiaries, “Viad” or the “Company”) derives its revenue from experiential services provided primarily within the exhibition and events industry and the travel and recreation industry. Viad occupies leading positions as a value-added service provider in many of the markets in which it competes. Viad serves clients predominantly in the United States, Canada, the United Kingdom, Germany and the United Arab Emirates.
Viad operates two business groups:
Marketing & Events Group. The Marketing & Events Group specializes in all aspects of the design, planning and production of face-to-face events, immersive environments and brand-based experiences for clients, including show organizers, corporate brand marketers and retail shopping centers. The mission of the Marketing & Events Group is to create the world’s most meaningful and memorable experiences for show organizers, brand marketers, event attendees and retail shopping centers. Show organizers include for-profit and not-for-profit show owners as well as show management companies. Corporate brand marketers include exhibitors and domestic and international corporations which want to promote their brands, feature new products, services and innovations and build business relationships. Viad’s retail shopping center customers include major developers, owners and management companies of shopping malls and lifestyle centers. In 2013, Viad derived approximately 87 percent of its consolidated revenue from products and services provided by the Marketing & Events Group.
Travel & Recreation Group. The Travel & Recreation Group generates its revenue from tourism products and experiential services, including world-class attractions, hotel operations, transportation services and package tour operations in and around Western Canada, Glacier National Park in Montana, Denali National Park and Preserve in Alaska and Waterton Lakes National Park in Alberta, Canada. In 2013, Viad derived approximately 13 percent of its consolidated revenue from services provided by the Travel & Recreation Group.
Viad’s two business groups are supported by Viad Corporate, which provides functional support in the areas of legal, finance and accounting, internal auditing, information technology, insurance, corporate development, real estate and tax.
Recent Business Developments
In connection with the Company’s strategic review of opportunities to enhance shareholder value, the Company paid a special cash dividend of $2.50 per share, or $50.8 million in the aggregate, on November 14, 2013. On February 14, 2014, the Company paid a second special cash dividend of $1.50 per share, or $30.5 million in the aggregate. Although the Company believes that the decision to pay the special dividends is an important step in the Company’s strategic review process, management continues to explore and evaluate further opportunities to maximize value to Viad’s shareholders, including a potential separation of its Travel & Recreation and Marketing & Events business groups. See “There can be no assurances that management’s current strategic evaluation of opportunities to enhance shareholder value will result in a transaction” and “Viad’s future payment of special dividends should not be relied upon as a way to realize any future gains on an investment” under “Item 1A - Risk Factors” for a discussion of the risks related to the payment of dividends and management’s evaluation of these strategic alternatives, which is incorporated herein by reference.
The Company continued to realize significant benefits and improved operating margins in 2013 through its Service Delivery Network initiative. The goals of the Service Delivery Network initiative are to improve the efficiency and performance of the Marketing & Events Group’s U.S. warehousing operations by lowering operating costs and invested capital by taking measures that include reducing the physical footprint and overhead associated with its warehousing facilities. In connection with this initiative, in August 2013, the Company sold the facility located in Teterboro, New Jersey and the land upon which it is situated for $12.7 million (net of selling costs) after determining that the facility no longer met the Company’s operational needs. The Company has reduced its U.S. facility footprint by approximately 1.2 million square feet since 2008, and has realized annualized cost savings of $7.7 million through the end of 2013.
The Company also generated cash flow in early 2014 as a result of the expiration of the Company’s concession contract with the U.S. National Park Service (the “Park Service”), under which Glacier Park operated lodging, tour and transportation and other hospitality services. The cash payments received in January 2014 by the Company consisted of payments totaling $25 million for the Company’s “possessory interest,” which generally means the value of the structures acquired or constructed, fixtures installed and improvements made to the concession property at Glacier National Park during

2
the term of the concession contract. The Company anticipates a cash payment of approximately $5 million for the personal property Glacier Park used at the facilities covered by the concession contract.
Over the past several years, Viad has made acquisitions and strategic investments to grow its business. Since 2011, the Travel & Recreation Group has acquired one property in Banff National Park (the Banff International Hotel), two properties near Glacier National Park (the St. Mary Lodge and Grouse Mountain Lodge), one property inside Denali National Park and Preserve (Denali Backcountry Lodge) and one property near the entrance to Denali National Park and Preserve (Denali Cabins).
On February 19, 2013, the Marketing & Events Group purchased the assets of Resource Creative Limited (“RCL”), a United Kingdom-based company specializing in providing creative graphic services to the exhibition, events and retail markets throughout the United Kingdom and continental Europe, for $647,000 (£420,000) in cash, subject to certain adjustments, plus a deferred payment of up to approximately $278,000 (£180,000) to the seller. The deferred payment is subject to achievement by RCL of certain net revenue targets between the acquisition date and December 31, 2014, and RCL exceeded the first net revenue target for the period ended December 31, 2013 by approximately 37 percent.
In 2013, the Company nearly completed the construction of the Glacier Skywalk, a fully accessible, cliff-edge walkway that leads to a glass-floored observation platform overlooking the Sunwapta Valley in close proximity to the Company’s Columbia Icefield attraction in Jasper National Park, Alberta, Canada. Construction of the Glacier Skywalk was essentially complete as of December 31, 2013, and Viad anticipates that the Glacier Skywalk will open in May 2014.
Reportable Segments
Within the two business groups, Viad’s organizational structure, operational decision-making authority, allocation of resources and internal reporting are aligned into the following reportable business segments:
• Marketing & Events U.S. segment; • Marketing & Events International segment and • Travel & Recreation Group segment.
No reportable segment has a client comprising more than 7.0 percent of that segment’s revenue, and no client comprises more than 4.5 percent of Viad’s revenue. See “The failure of a large client to renew its services contract or the loss of business from convention facilities could adversely impact revenue” under Item “1A - Risk Factors” for a discussion of the risks related to Viad’s client relationships which is incorporated herein by reference.
Viad’s reportable business segments are described below.
Marketing & Events U.S. Segment
The Marketing & Events U.S. segment (the “U.S. segment”) is comprised of the domestic operations of Global Experience Specialists, Inc. and affiliates (“GES”). During 2013, the U.S. segment provided services to over 1,300 exhibitions and events and more than 179,000 exhibitors. The U.S. segment has full-service operations in every major exhibition market in the United States, including: Las Vegas, Nevada; Chicago, Illinois; Orlando, Florida; New York, New York and Los Angeles, California. In each of these locations, the U.S. segment is a leading event marketing agency that produces exhibitions, events, exhibits and retail environments, and services some of the most visible and influential events in its industry.
This segment generates revenue from the following services:
Show Organizer Services. Under agreements with show organizers, the U.S. segment serves as the official services contractor of an exhibition, which is also referred to as a “trade show,” “convention” or “show.” As the official services contractor, the U.S. segment provides the following services to the show organizer: general event management; planning and consultation; concept design; exhibition layout and design; graphics and design; online management tools; show traffic analysis; marketing and strategy; carpeting and flooring; signage; decorating products and accessories; custom graphics; overhead rigging; booth rigging; cleaning and temporary electrical, lighting and plumbing.
Exclusive Services Provided to Exhibitors. As the official services contractor, the U.S. segment is designated by the show organizer as the exclusive provider of certain services offered to exhibitors participating in the exhibition. This designation provides exhibitors with a single point of contact to facilitate a timely, safe and efficient move-in and move-out

3
of the exhibition and to facilitate an organized, professional during-show experience. The exclusive services offered by the U.S. segment to exhibitors include: material handling services; overhead rigging; temporary electrical and plumbing and cleaning.
Discretionary Services Provided to Exhibitors. In addition to the exclusive services offered to exhibitors, the U.S. segment competes with other service providers to sell non-exclusive services to exhibitors, including: custom exhibit design and construction; portable and “modular” exhibits and design; integrated marketing, including pre- and post-event communications; multimedia services; event surveys; return on investment analysis; attendee and exhibit booth traffic analysis; staff training; online management tools; logistics and freight-forwarding; storage and refurbishment of exhibits; booth furnishings, carpeting and signage; in-house installation and dismantling and various other show services. The U.S. segment offers these services, combined with complete event program management and planning, to corporate brand marketers across all exhibitions and events in which they participate. The U.S. segment competes with other service providers to offer these discretionary services to exhibitors, regardless of whether or not the U.S. segment is the official services contractor of the exhibition.
Other Marketing Services. The U.S. segment also provides a variety of immersive, entertaining attractions and brand-based experiences, sponsored events, mobile marketing and other branded entertainment and face-to-face marketing solutions for clients and venues, including movie studios, leading consumer brand marketers, shopping malls and museums. In addition, the U.S. segment offers retail clients complete turnkey services, including design, engineering, graphic production, fabrication, warehousing, shipping and on-site installation of retail merchandising units, kiosks and holiday environments. The U.S. segment also provides construction and installation services for permanent installations, including museum exhibits, corporate lobbies, visitor centers, showrooms and retail interiors.
Competition. The U.S. segment generally competes in the exhibition and events industry on the basis of discernible differences, value, quality, price, convenience and service. The primary Viad competitor in the domestic official services contractor market is The Freeman Company (a private company); however, the U.S. segment encounters substantial competition from a large number of providers. No competitor has significant market share in the other categories of offerings of the U.S. segment. All known competitors of the U.S. segment are privately held companies which provide limited public information concerning their operations.
Marketing & Events International Segment
The Marketing & Events International segment (the “International segment”) includes all foreign operations of the Marketing & Events Group and consists of two operating segments: Canada and EMEA (Europe, Middle East and Asia). The International segment offers services that are similar to those provided by the U.S. segment. These services are delivered by Viad’s wholly-owned subsidiaries including: GES Exposition Services (Canada) Limited, Global Experience Specialists (GES) Limited and affiliates, SDD Exhibitions Limited and GES GmbH & Co. KG.
During 2013, the International segment provided services to over 1,100 exhibitions and events and more than 38,000 exhibitors. The International segment has full-service operations at many of the most active and popular exhibition and event destinations, including nine Canadian cities, six United Kingdom cities, one German city, two cities in the United Arab Emirates and one city in the Netherlands. In each of these locations, the International segment is a leading service provider, servicing some of the most visible and influential events in its industry.
On February 19, 2013, Viad acquired RCL. On April 4, 2013, the operations of RCL were relocated to GES’ existing London-based operation at ExCeL London, where GES was appointed in 2013 to supply graphics to ExCeL London’s in-house advertising sales agency, InVision.
Competition. The International segment generally competes on the basis of discernible differences, value, quality, price, convenience and service. The International segment is the largest provider of exhibition and event services in the countries in which it competes. The International segment encounters competition from a large number of providers of similar services. Most of the competitors are privately held companies which provide limited public information concerning their operations.
Travel & Recreation Group Segment
Travel and recreation services are provided by Brewster Inc. (“Brewster”), Glacier Park, Inc. (“Glacier Park”) and Alaskan Park Properties, Inc. (“Alaska Denali Travel”). Brewster and Alaska Denali Travel are wholly-owned subsidiaries of Viad and Glacier Park is an 80 percent owned subsidiary of Viad.

4
Brewster
Brewster is a major tourism service operator in Western Canada, delivering tourism products that include world-class hospitality services, attractions, inbound package tour operations and corporate and event management and transportation services.
Hospitality. Brewster operates three hotels in Alberta: the Mount Royal Hotel and the Banff International Hotel, both of which are located in the heart of Banff National Park in downtown Banff, Alberta, Canada, and the Glacier View Inn, which is located on the Columbia Icefield between Lake Louise and Jasper. The hotels cater principally to leisure travelers.
Attractions. Brewster’s attractions include the Banff Gondola, the Columbia Icefield Glacier Adventure and the Banff Lake Cruise operations. The Banff Gondola transports visitors to an elevation of over 7,000 feet above sea level to the top of Sulphur Mountain in Banff, Alberta, Canada, offering an unobstructed view of the Canadian Rockies and overlooking the town of Banff and the Bow Valley. The Columbia Icefield Glacier Adventure includes tours of the Athabasca Glacier on the Columbia Icefield, and provides customers with an opportunity to experience one of the largest accumulations of ice and snow south of the Arctic Circle. Icefield customers ride in an “Ice Explorer,” a unique vehicle specially designed for glacier travel. Brewster also offers boat tours, small boat rentals and charter fishing on Lake Minnewanka, which is situated outside of the town of Banff in the heart of the Canadian Rockies. In 2013, Viad continued construction of the Glacier Skywalk, a 1,312-foot guided interpretive walkway with a 98-foot glass-floored observation area overlooking the Sunwapta Valley in close proximity to the Company’s Columbia Icefield attraction in Jasper National Park, Alberta, Canada. The construction is now complete, and Viad anticipates that the Glacier Skywalk will open in May 2014.
Package Tour Operations and Corporate and Event Management. Brewster’s inbound package tour operations feature year-round package tours throughout Canada. These packages include motorcoach, rail, self-drive automobile, ski and winter touring and consist of both group and individual tours which may be custom designed at the time of booking. Brewster also offers a full suite of corporate and event management services for meetings, conferences, incentive travel, sports and special events. Event-related service offerings include staffing, off-site events, tours/activities, team building, housing, event management, theme development, production and audio visual services.
Transportation Operations. Brewster’s transportation operations include charter motorcoach services, sightseeing, scheduled services and airport shuttle service. Brewster operates a modern fleet of luxury motorcoaches, available for groups of any size, for travel throughout the Canadian provinces of Alberta and British Columbia. In addition, Brewster provides seasonal half- and full-day sightseeing tours from Calgary, Banff, Lake Louise and Jasper, Canada.
Brewster draws its customers from major markets including Canada, the United States, the United Kingdom, Australia/New Zealand and Asia. Brewster markets directly to consumers, as well as through distribution channels that include tour operators, tour wholesalers, destination management companies and retail travel agencies/organizations.
Brewster generated approximately 71 percent of the Travel & Recreation Group’s 2013 segment operating income.
Glacier Park
Glacier Park is an independent hotel owner and operator, with properties located in and around Waterton-Glacier International Peace Park, which encompasses Glacier National Park in Montana, one of the most visited national parks in the United States, and Waterton Lakes National Park in Alberta, Canada. Glacier Park provides lodging accommodations, food and beverage services, retail operations and transportation services in and around Glacier and Waterton Lakes National Parks.
The operations of Glacier Park are predominately seasonal, typically running from late May until the end of September. During the peak months of July and August, the occupancy level at Glacier Park’s lodges and motor inns typically exceeds 90 percent. During the “shoulder” months of June and September, occupancy typically exceeds 80 percent.
Individual travelers account for over 80 percent of Glacier Park’s customers, and the balance of its customers are tour groups. Demographically, Glacier Park draws over 90 percent of its customers from the United States, with approximately 60 percent of the U.S. customers coming from the Northwest and Midwest regions.
Historic Lodges and Hotel Accommodations. Glacier Park owns and operates five properties, with accommodation offerings varying from hikers’ cabins to hotel suites: St. Mary Lodge, a 115-room, full-service resort lodge located outside the east entrance to Glacier National Park in St. Mary, Montana; Glacier Park Lodge, an historic lodge in East Glacier, Montana; Grouse Mountain Lodge, a full-season lodge offering skiing in the winter and golf, hiking and other recreational activities, located near Glacier National Park in Whitefish, Montana; the Prince of Wales Hotel in Waterton Lakes National Park,

5
Alberta, Canada, which is situated on land for which the Company has a 42-year ground lease with the Canadian government running through January 31, 2052; and Motel Lake McDonald, an in-holding within Glacier National Park. In 2013, Glacier Park also operated five other properties inside Glacier National Park under a concession contract with the Park Service, which expired on December 31, 2013. See the “Concession Business” section below, and “Recent Business Developments” section above, of this Item 1.
Concession Business. On December 31, 2013, Glacier Park’s concession contract with the Park Service to operate lodging, tour and transportation and other hospitality services for Glacier National Park expired. Under the concession contract, Glacier Park provided food and beverage services to lodging guests and park visitors and had retail operations, including camp stores and retail shops, which catered to lodging guests and park visitors. Glacier Park also operated a fleet of touring buses, which were used to conduct tours within Glacier and Waterton Lakes National Parks. Glacier Park generated approximately 47 percent of its 2013 revenue through its concession contract for services provided within Glacier National Park.
As referenced above, Glacier Park continues to generate revenue from the five properties it owns: (1) St. Mary Lodge in St. Mary, Montana; (2) Glacier Park Lodge in East Glacier, Montana; (3) Grouse Mountain Lodge in Whitefish, Montana; (4) Prince of Wales Hotel in Waterton Lakes National Park, Alberta; and (5) Motel Lake McDonald, which is located inside Glacier National Park. Glacier Park also continues to operate the food and beverage services with respect to these five properties and the retail shops located near Glacier National Park.
As shown in the table below, the five properties Glacier Park currently owns contain more than one-half of the rooms that Glacier Park operated in 2013:
Number of
Rooms
Owned Properties: Glacier Park Lodge 161 Grouse Mountain Lodge 143 St. Mary Lodge 115 Prince of Wales Hotel 86 Motel Lake McDonald 30
Total 535Concession Contract Properties:
Many Glacier Hotel 214 Swift Current Motor Inn 88 Lake McDonald Lodge 82 Rising Sun Motor Inn 72 Village Inn Motel 36
Total 492
Glacier Park generated approximately 25 percent of the Travel & Recreation Group’s 2013 segment operating income.
Alaska Denali Travel
In September 2011, Alaska Denali Travel acquired Denali Backcountry Lodge, a property having 42 guest rooms on six acres inside Denali National Park and Preserve, and Denali Cabins, with 46 guest cabins on six acres near the entrance to Denali National Park and Preserve. Alaska Denali Travel provides food and beverage services with respect to these properties, and operates day trips to its day trip lodge via the scenic park road, a package tours sales and marketing program and daily motorcoach service between Anchorage and Denali National Park and Preserve. Alaska Denali Travel’s operating season runs from June until the end of September.
Competition. The Travel & Recreation Group generally competes on the basis of location, uniqueness of facilities, service, quality and price. Competition exists both locally and regionally in the package tour business, hotel and restaurant business and charter service business.

6
Intellectual Property
Viad and its subsidiaries own or have the right to use registered trademarks and trademarks pending registration, used in their businesses, including Global Experience Specialists & design®, GES®, GES Servicenter®, GES National Servicenter®, GES MarketWorks®, HANG:RZ®, Trade Show Rigging TSR®, TSE Trade Show Electrical & design®, ethnoMetrics®, eXPRESSO & design®, FIT®, DEXZ®, LUMA2 & design®, eco-sense and design®, and the trademarks in the 2012 Alaska Denali Travel rebranding program, including Alaska Denali Travel, Alaska Denali Escapes, Denali Backcountry AdventureSM Denali Backcountry LodgeSM and Denali CabinsSM. Viad and its subsidiaries also own or have the right to use many registered trademarks and trademarks pending registration outside of the United States, including the Melville lion image®, GES®, Maxim®, Showtech®, SDDRetail®, Brewster Travel Canada & design®, Brewster Attractions Explore & design®, Brewster Hospitality Refresh & design® and escape.connect.refresh.explore®. United States trademark registrations are for a term of 10 years and are renewable every 10 years as long as the trademarks are used in the regular course of business.
The Company owns patents that it believes provide competitive advantages in the marketplace for its exhibit and exhibition services. Its patented technology relating to a modular structure having a load-bearing surface provides efficiencies and cost savings in the design, manufacture, assembly, take down and maintenance of displays and exhibitions. Its patented invention relating to a surface-covering installation tool and method not only reduces direct labor costs, but provides improved worker safety. The Company also owns a number of design patents for its retail merchandising units. United States utility patents are currently granted for a term of 20 years from the date a patent application is filed and United States design patents are currently granted for a term of 14 years from the date granted. The Marketing & Events Group has extensive design libraries with copyright protections and owns copyright registrations for a number of the designs within its design libraries. Copyright protection for such work is 95 years from the date of publication or 120 years from creation, whichever is shorter.
Although Viad believes that certain of its patents, trademarks and copyrights have substantial value, it does not believe that the loss of any one of these patents, trademarks or copyrights would have a material adverse effect on its financial condition or results of operations.
Government Regulation and Compliance
Compliance with legal requirements and government regulations represents a normal cost of doing business. The principal regulations affecting the day-to-day businesses are rules and regulations relating to transportation (such as regulations promulgated by the U.S. Department of Transportation and its state counterparts), employees (such as regulations implemented by the Occupational Safety and Health Administration, equal employment opportunity laws, guidelines implemented pursuant to the Americans with Disabilities Act and general federal and state employment laws), unionized labor (such as guidelines imposed by the National Labor Relations Act) and U.S. and Canadian regulations relating to national parks (such as regulations established by the U.S. Department of the Interior and the Park Service).
Some of Viad’s current and former businesses are subject to U.S. federal and state environmental regulations, including laws enacted under the Comprehensive Environmental Response, Compensation and Liability Act, or its state law counterparts. Compliance with federal, state and local environmental, health and safety provisions, including, but not limited to, those regulating the discharge of materials into the environment and other actions relating to the environment have not had, and are not expected to have, a material effect on Viad’s capital expenditures, competitive position, financial condition or results of operations. See “Item 1A - Risk Factors - Liabilities relating to prior and discontinued operations may adversely affect results of operations” for a discussion of the risks related to liabilities arising from the Company’s compliance with federal, state and local environmental laws, which is incorporated herein by reference.

7
Employees
Viad’s businesses had approximately 3,630 employees as of December 31, 2013 as follows:
Approximate Number of Employees
Regular Full-Time Employees Covered by Collective Bargaining
Agreements Marketing & Events Group 2,930 940Travel & Recreation Group 550 110Viad Corporate 150 —
Total 3,630 1,050
Viad believes that relations with its employees are satisfactory and that collective-bargaining agreements expiring in 2014 will be renegotiated in the ordinary course of business without a material adverse effect on Viad’s operations.
Viad Corporate provides management, financial and accounting, internal auditing, tax, administrative, information technology, corporate development, legal and other services to its operating units and handles residual matters pertaining to businesses previously discontinued or sold by the Company. Viad is governed by a Board of Directors comprised of eight non-employee directors and one employee director, and has an executive management team consisting of seven executive officers.
Seasonality
Exhibition and event activity varies significantly depending on the frequency and timing of shows (some shows are not held each year and some may shift between quarters). The Marketing & Events U.S. segment generally reports its highest revenue during the first quarter of each year, while the Marketing & Events International segment generally reports its highest revenue during the second quarter of each year. The Travel & Recreation Group segment experiences peak activity during the summer months and during 2013, 86 percent of its revenue was earned in the second and third quarters. Viad’s average segment operating income during the past three years, as a percentage of the average full year’s segment operating income during the past three years, was approximately 31 percent (first quarter), 28 percent (second quarter), 57 percent (third quarter) and negative 16 percent (fourth quarter). See “Viad’s businesses are seasonal, which causes results of operations to fluctuate and makes results of operations particularly sensitive to adverse events during peak periods” and “Exhibition rotation impacts overall profitability and makes comparisons between periods difficult” under “Item 1A Risk Factors,” which are incorporated herein by reference; see also Notes 20 and 23 of Notes to Consolidated Financial Statements.
Financial Information about Restructuring Charges
Information regarding restructuring charges is provided in Note 17 of Notes to Consolidated Financial Statements.
Financial Information about Segments
Business segment financial information is provided in Note 20 of Notes to Consolidated Financial Statements.
Financial Information about Geographic Areas
Geographic area financial information is provided in Note 20 of Notes to Consolidated Financial Statements.
Available Information
Viad’s internet address is www.viad.com. Viad uses its web site as a routine channel for distribution of Company information, press releases, financial information and corporate governance initiatives. Viad posts filings as soon as reasonably practicable after they are electronically filed with, or furnished to, the U.S. Securities and Exchange Commission (“SEC”), including Viad’s annual, quarterly and current reports, proxy statements, amendments to those reports or statements and other information, as well as transactions in Viad securities by Viad’s directors and executive officers. All such postings and filings are available on Viad’s web site free of charge. In addition, Viad’s web site allows interested persons to sign up to automatically receive e-mail alerts when the Company posts news releases and financial information. The SEC’s web site, www.sec.gov, contains reports, proxy and information statements and other information regarding issuers that file electronically with the SEC. Such information also can be read and copied at the SEC’s public reference section, located in

8
Room 1580, 100 F Street N.E., Washington, D.C. 20549 and on the SEC’s internet site at www.sec.gov. Information regarding the operation of the public reference section can be obtained by calling (800) SEC-0330. The content on any web site referred to in this Form 10-K is not incorporated by reference in this Form 10-K unless expressly noted.
Viad’s web site, at http://viad.investorroom.com/, includes key information about the Company’s corporate governance initiatives, including its Corporate Governance Guidelines, charters of the committees of the Board of Directors, Code of Ethics and information concerning Viad’s directors and a method to communicate with them. Viad will make available in print any of this information upon request to: Corporate Secretary, Viad Corp, 1850 North Central Avenue, Suite 1900, Phoenix, Arizona 85004-4565.
Item 1A. Risk Factors.
Viad’s operating results are subject to known and unknown risks. As a result, past financial performance and historical trends may not be reliable indicators of future performance.
There can be no assurances that management’s current strategic evaluation of opportunities to enhance shareholder value will result in a transaction.
Viad’s Board of Directors authorized management to explore and evaluate opportunities to enhance shareholder value, including a potential separation of its Travel & Recreation and Marketing & Events business groups. The Company engaged J.P. Morgan Securities LLC as its financial advisor to assist in this evaluation process. No decision has been made to separate the two business groups, and Viad cannot assure that it will identify and undertake a transaction that allows its shareholders to realize an increase in the value of Viad’s stock or provide any guidance on the timing of any such action. Viad also cannot assure that any potential transaction or other strategic alternative, if identified, evaluated and consummated, will provide greater value to its shareholders than that reflected in the current stock price. Any potential transaction would be dependent upon a number of factors that may be beyond Viad’s control, including, among other factors, the U.S. and global economic and market conditions, industry trends, the interest of third parties in Viad’s businesses and the availability of financing to potential buyers on reasonable terms.
Viad’s future payment of special dividends should not be relied upon as a way to realize any future gains on an investment.
The Board of Directors generally declares and pays regular dividends to Viad’s shareholders on a quarterly basis and also paid special dividends in November 2013 and February 2014. The decision to declare a special dividend and the amount, timing and payment of any such dividend are at the sole discretion of the Board. Factors in any decision to declare a dividend would include the amount of funds legally available and an evaluation of the Company’s financial condition, capital requirements, future prospects and other factors deemed relevant by the Board. Accordingly, an investor should not rely on the future payment of special dividends as a way to realize gains on their investment.
Viad’s businesses and operating results are adversely affected by deterioration in general economic conditions.
Viad’s businesses are sensitive to fluctuations in general economic conditions and are impacted by increases and decreases in the cost of materials and operating supplies. Operating results for the Marketing & Events U.S. and International segments depend largely on the number of exhibitions held and on the size of exhibitors’ marketing expenditures, which in turn depend partly on the strength of particular industries in which exhibitors operate. The number and size of exhibitions generally decrease when the economy weakens.
Further, many exhibitors’ marketing budgets are partly discretionary, and are frequently among the first expenditures reduced by exhibitors when economic conditions deteriorate, resulting in reduced spending by exhibitors for the Company’s services. Marketing expenditures often are not increased until economic conditions improve. As a result, during periods of general economic weakness, the operating results for the Marketing & Events Group are adversely affected. Similarly, many of the retail shopping mall and lifestyle center clients of the Marketing & Events Group may reduce marketing expenditures when economic conditions deteriorate.
Revenues from the Travel & Recreation Group businesses depend largely on the amount of disposable income that consumers have available for travel and vacations. This amount decreases during periods of weak general economic conditions.

9
Viad’s results of operations are impacted by changes in foreign currency exchange rates.
Viad conducts foreign operations primarily in Canada, the United Kingdom and, to a lesser extent, in certain other countries. The functional currency of Viad’s foreign subsidiaries is their local currency. Accordingly, for purposes of consolidation, Viad translates the assets and liabilities of its foreign subsidiaries into U.S. dollars at the foreign exchange rates in effect at the balance sheet date. The unrealized gains or losses resulting from the translation of these foreign denominated assets and liabilities are included as a component of accumulated other comprehensive income in Viad’s consolidated balance sheets. Significant fluctuations in foreign exchange rates relative to the U.S. dollar may result in material changes to Viad’s net equity position reported in its consolidated balance sheets. Viad has not hedged its equity risk arising from the translation of foreign denominated assets and liabilities.
In addition, for purposes of consolidation, the revenue, expenses and gains and losses related to Viad’s foreign operations are translated into U.S. dollars at the average foreign exchange rates for the period. As a result, Viad’s consolidated results of operations are exposed to fluctuations in foreign exchange rates, even when the functional currency amounts have not changed. Accordingly, fluctuations in the exchange rates affect overall profitability and historical period-to-period comparisons. Viad has not hedged its net earnings exposure arising from the translation of its foreign operating results.
During 2013, $229.3 million of revenue and $9.1 million of segment operating income was derived through the International segment. In addition, $81.9 million of 2013 revenue and $19.1 million of 2013 segment operating income generated in the Travel & Recreation Group was derived through its Canadian operations. For this segment, Canadian operations are largely dependent on foreign customer visitation, and accordingly, increases in the value of the Canadian dollar as compared to other currencies could adversely affect customer volumes, and, therefore, revenue and segment operating income in the Travel & Recreation Group.
Exhibition rotation impacts overall profitability and makes comparisons between periods difficult.
The business activities of the Marketing & Events Group are largely dependent upon the frequency, timing and location of exhibitions and events. Some large exhibitions are not held annually (they may be held once every two or three years or longer). Some large exhibitions may be held at a different time of year than when they have historically been held. In addition, the same exhibition may be held in different locations in different years, and may result in Viad generating lower margins in a given period if the exhibition shifts to a higher-cost city.
As a consequence of these factors, the operating results for these businesses may fluctuate significantly from quarter to quarter or from year to year, making periodic comparisons difficult.
Viad’s businesses are adversely affected by disruptions in the travel industry, particularly those adversely affecting the hotel and airline industries.
The success of Viad’s businesses depends largely on the ability and willingness of people, whether exhibitors, exhibition attendees or others, to travel. Factors adversely affecting the travel industry as a whole, and particularly the airline and hotel industries, generally also adversely affect Viad’s businesses and results of operations. Factors that could adversely affect the travel industry as a whole include high or rising fuel prices, increased security and passport requirements, weather conditions, airline accidents and international political instability and hostilities. Unexpected events of this nature, or other events that may have an impact on the availability and pricing of air travel and accommodations, could adversely affect Viad’s businesses and results of operations.
The failure of a large client to renew its services contract or the loss of business from convention facilities could adversely impact revenue.
Although no single client accounts for more than 7.0 percent of the revenue of any of Viad’s reporting segments, the Marketing & Events U.S. and International segments have a relatively small number of large exhibition show organizers and large customer accounts. The loss of any of these large clients could adversely affect Viad’s results of operations.
In addition, revenue of the Marketing & Events Group may be significantly impacted if certain exhibition facilities choose to in-source electrical, plumbing or other services. When the Marketing & Events Group is hired as the official services contractor for an exhibition, the show organizer contractually grants an exclusive right to perform these electrical and plumbing services, subject in each case to the exhibition facility’s option to in-source the services (either by performing the services themselves or by hiring a separate service provider). Many exhibition facilities are under financial pressure as a result of conditions generally affecting their industry, including an increased supply of exhibition space. As a result, some of

10
these facilities have sought to in-source all or a large portion of these services. If a large number of facilities with which the Marketing & Events Group has these relationships moves these services in-house, Viad’s revenue and operating results could be adversely affected.
Viad’s key businesses are relationship driven.
The business activities of the Marketing & Events U.S. and International segments are heavily focused on client relationships, and, specifically, on the close collaboration and interaction with the client. These relationships require the account team to become attuned to the client’s desires and expectations in order to provide top-quality service. Viad has in the past lost, and may in the future lose, important clients (and corresponding revenue) if a key member of the account team were to cease employment with the Company and take those customers to a competitor.
Completed acquisitions may not perform as anticipated or be integrated as planned.
Viad has acquired businesses and intends to continue to pursue opportunities to acquire businesses that complement, enhance or expand Viad’s current businesses or offer growth opportunities to Viad. Any acquisition can involve a number of risks, including: the failure to achieve the financial and strategic goals and other benefits from the acquisition; the inability to successfully integrate the acquired business into Viad’s ongoing businesses; the inability to retain key personnel or customers of the acquired business; the inability to successfully integrate financial reporting and internal control systems; the disruption of Viad’s ongoing businesses and distraction of senior management and employees of Viad from other opportunities and challenges due to the integration of the acquired business; and the potential existence of liabilities or contingencies not disclosed to or known by Viad prior to closing the acquisition or not otherwise provided for through the purchase agreement.
Viad’s businesses are seasonal, which causes results of operations to fluctuate and makes results of operations particularly sensitive to adverse events during peak periods.
The Marketing & Events U.S. segment generally reports its highest revenue during the first quarter of each year, while the Marketing & Events International segment generally reports its highest revenue during the second quarter of each year. The Travel & Recreation Group businesses are generally also seasonal, experiencing peak activity during the second and third quarters. These quarters accounted for 86 percent of the segment’s 2013 revenue. Because of the seasonal nature of Viad’s businesses, adverse events or conditions occurring during peak periods could adversely affect the operating results of Viad’s businesses.
New capital projects may not be commercially successful.
From time to time, in an effort to seize opportunities that complement, enhance and expand its businesses, Viad pursues new capital projects. Capital projects are subject to a number of risks, including unanticipated delays and cost overruns, failure to achieve established financial and strategic goals and the inability to successfully integrate into Viad’s ongoing businesses, as well as additional risks specific to a project. The occurrence of any of the events described above could prevent a new capital project from performing in accordance with Viad’s commercial expectations and could have a material adverse effect on its businesses and results of operations.
Transportation disruptions and increases in transportation costs could adversely affect Viad’s businesses and operating results.
The Marketing & Events U.S. and International segments rely on independent transportation carriers to send materials and exhibits to and from exhibitions, warehouse facilities and customer facilities. If they were unable to secure the services of these independent transportation carriers at favorable rates, it could have a material adverse effect on these businesses and their results of operations. In addition, disruption of transportation services because of weather-related problems, strikes, lockouts or other events could adversely affect their ability to supply services to customers and could cause the cancellation of exhibitions, which may have a material adverse effect on these businesses and operating results. Similarly, disruption of transportation services could adversely affect the ability of the Marketing & Events Group to supply time-sensitive holiday-themed exhibits and experiences to retail shopping mall and lifestyle center customers and could cause the cancellation of the exhibits and experiences.
Union-represented labor creates an increased risk of work stoppages and higher labor costs.
A significant portion of Viad’s employees are unionized and Viad’s businesses are party to approximately 100 collective-bargaining agreements, with approximately one-third requiring renegotiation each year. If the results of labor negotiations caused the Company to increase wages or benefits, which increases total labor costs, the increased costs could

11
either be absorbed (which would adversely affect operating margins) or passed on to customers, which may lead customers to turn to other vendors in response to higher prices. In either event, Viad’s businesses and results of operations could be adversely affected.
Moreover, if the Company were unable to reach an agreement with a union during the collective-bargaining process, the union may strike or carry out other types of work stoppages. In such a circumstance, Viad might be unable to find substitute workers with the necessary skills to perform many of the services, or may incur additional costs to do so, which could adversely affect the Company’s businesses and results of operations.
Obligations to fund multi-employer pension plans to which Viad contributes may have an adverse impact on operating results.
Viad’s businesses contribute to various multi-employer pension plans based on obligations arising under collective-bargaining agreements covering its union-represented employees. Viad’s contributions to these multi-employer plans in 2013 and 2012 totaled $20.3 million and $20.7 million, respectively. Viad does not directly manage these multi-employer plans, which are generally managed by boards of trustees. Based upon the information available to Viad from plan administrators, management believes that several of these multi-employer plans are underfunded. The Pension Protection Act of 2006 requires pension plans underfunded at certain levels to reduce, over defined time periods, the underfunded status. In addition, under current laws, the termination of a plan, or a voluntary withdrawal from a plan by Viad, or a shrinking contribution base to a plan as a result of the insolvency or withdrawal of other contributing employers to such plan, would require Viad to make payments to such plan for its proportionate share of the plan’s unfunded vested liabilities. Viad cannot determine at this time the amount of additional funding, if any, it may be required to make to these plans. However, plan contribution increases, if any, could have an adverse impact on Viad’s consolidated financial condition, results of operations and cash flows.
Viad competes in competitive industries and increased competition could negatively impact operating results.
Viad is engaged in a number of highly competitive industries. Competition in the exhibition and events industry and the exhibits and experiential environments industries is driven by price and service quality, among other factors. To the extent competitors seek to gain or retain their market presence through aggressive underpricing strategies, Viad may be required to lower its prices and rates to avoid loss of related business, thereby adversely affecting operating results. In addition, if Viad is unable to anticipate and respond as effectively as competitors to changing business conditions, including new technologies and business models, Viad could lose market share to its competitors. If Viad were unable to meet the challenges presented by the competitive environment, results of operations could be adversely affected.
Liabilities relating to prior and discontinued operations may adversely affect results of operations.
Viad and its predecessors have a corporate history spanning over eight decades and involving approximately 2,400 previous subsidiaries in diverse businesses, such as the manufacturing of locomotives, buses, industrial chemicals, fertilizers, pharmaceuticals, leather, textiles, food and fresh meats. Some of these businesses used raw materials that have been, and may continue to be, the subject of litigation. Moreover, some of the raw materials used and the waste produced by these businesses have been and are the subject of U.S. federal and state environmental regulations, including laws enacted under the Comprehensive Environmental Response, Compensation and Liability Act, or its state law counterparts. In addition, Viad may incur other liabilities, resulting from indemnification claims involving sold subsidiaries, as well as from past operations of predecessors or their subsidiaries. Although the Company believes it has adequate reserves and sufficient insurance coverage to cover these future liabilities, results of operations could be materially affected if future events or proceedings contradict current assumptions, and reserves or insurance become inadequate.
Terrorist attacks, natural disasters or other catastrophic events may have a negative effect on Viad’s business.
The occurrence of catastrophic events ranging from natural disasters (such as hurricanes and floods), health epidemics or pandemics, acts of war or terrorism, or the prospect of these events could disrupt Viad’s businesses. Such catastrophic events could impact the Marketing & Events Group’s production facilities, preventing the Company from timely completing exhibit fabrication and other projects for customers, and also could cause a cancellation of exhibitions and other events held in public venues or a disruption in the services the Company provides to its customers at convention centers, exhibition halls, hotels and other public venues. Such catastrophic events also could adversely impact the Travel & Recreation Group businesses, which are heavily dependent on the ability and willingness of its guests to travel. The guests serviced by the Travel & Recreation Group tend to delay or postpone vacations if natural conditions differ from those that typically prevail at competing lodges, resorts and attractions during a given season, and catastrophic events could impede the guests’ ability to travel, interrupt the Company’s business operations and/or cause damage to the Company’s properties. If the conditions
12
arising from such events persist or worsen, Viad could experience continuing or increased adverse effects on its results of operations and financial condition.
Item 1B. Unresolved Staff Comments.
None.
Item 2. Properties.
Viad’s businesses operate service or production facilities and maintain sales and service offices in the United States, Canada, the United Kingdom, Germany, the United Arab Emirates and the Netherlands. The principal properties of Viad are operated by the Marketing & Events Group, the Travel & Recreation Group and Viad Corporate as follows:
Marketing & Events U.S. Segment. In 2013, the Company continued taking steps to reduce the physical footprint and overhead associated with the Marketing & Events Group’s U.S. warehousing facilities through its Service Delivery Network initiative. These steps included the sale of a New Jersey facility and the underlying land after determining that the property no longer met the Company’s operational needs. The goal of the Service Delivery Network initiative is to improve the efficiency and performance of the Marketing & Events Group’s U.S. warehousing operations by lowering operating costs and invested capital. Since 2008, the Company has reduced its U.S. facility footprint by approximately 1.2 million square feet, and has realized annualized cost savings of $7.7 million through the end of 2013.
The Marketing & Events U.S. segment operates 15 offices and 27 multi-use facilities (manufacturing, sales and design, office and/or warehouse and truck marshaling yards). The multi-use facilities vary in size up to approximately 592,100 square feet. Two of the multi-use facilities are owned; all other properties are leased.
Marketing & Events International Segment. The Marketing & Events International segment operates five offices and 20 multi-use facilities, with two offices and nine multi-use facilities in Canada, seven multi-use facilities in the United Kingdom, one office and two multi-use facilities in Germany, one office and two multi-use facilities in the United Arab Emirates and one office in the Netherlands. The multi-use facilities vary in size up to approximately 133,600 square feet. One of the multi-use facilities is owned; all other properties are leased.
Travel & Recreation Group Segment. The Travel & Recreation Group segment operates four offices, nine retail stores, one bus terminal, four garages, an icefield tour facility, a gondola lift operation, a boat tour facility, 14 hotels/lodges (including ancillary foodservice and recreational facilities) and 46 guest cabins. All of the facilities are in the United States or Canada. The bus terminal, three garages and the boat tour facility are owned and one garage is leased. The icefield tour facility and gondola lift operation are operated through lease agreements with Parks Canada and all other properties are leased.

13
The Travel & Recreation Group owns nine hotels/lodges and 42 guest cabins. During 2013, the Travel & Recreation Group also operated an additional five hotels/lodges and 12 retail stores pursuant to the Glacier Park concession contract. As shown in the table below, the nine hotels and lodges and the guest cabins owned and operated by the Travel & Recreation Group in 2013 accounted for 952 of the 1,444 rooms managed by the Travel & Recreation Group:
Number of
Rooms
Owned Properties: Banff International Hotel 162 Glacier Park Lodge 161 Grouse Mountain Lodge 143 Mount Royal Hotel 135 St. Mary Lodge 115 Prince of Wales Hotel 86 Denali Cabins 46 Denali Backcountry Lodge 42 Glacier View Inn 32 Motel Lake McDonald 30
Total 952 Concession Contract Properties:
Many Glacier Hotel 214 Lake McDonald Lodge 88 Swift Current Motor Inn 82 Rising Sun Motor Inn 72 Village Inn Motel 36
Total 492
Viad Corporate. Viad Corporate operates the Company’s headquarters, which are leased and approximate 24,700 square feet, and are located at 1850 North Central Avenue, Suite 1900 in Phoenix, Arizona 85004-4565.
Management believes that the Company’s facilities in the aggregate are adequate and suitable for their purposes and that capacity is sufficient for current needs.
Item 3. Legal Proceedings.
Viad and certain subsidiaries are plaintiffs or defendants to various actions, proceedings and pending claims, some of which involve, or may involve, compensatory, punitive or other damages. Litigation is subject to many uncertainties and it is possible that some of the legal actions, proceedings or claims could be decided against Viad. Although the amount of liability as of December 31, 2013 with respect to certain of these matters is not ascertainable, Viad believes that any resulting liability, after taking into consideration amounts already provided for and insurance coverage, will not have a material effect on Viad’s business, financial condition or results of operations.
Viad is subject to various U.S. federal, state and foreign laws and regulations governing the prevention of pollution and the protection of the environment in the jurisdictions in which Viad has or had operations. If the Company has failed to comply with these environmental laws and regulations, civil and criminal penalties could be imposed and Viad could become subject to regulatory enforcement actions in the form of injunctions and cease and desist orders. As is the case with many companies, Viad also faces exposure for actual or potential claims and lawsuits involving environmental matters relating to its past operations. Although it is a party to certain environmental disputes, Viad believes that any resulting liabilities, after taking into consideration amounts already provided for and insurance coverage, will not have a material effect on the Company’s financial condition or results of operations. See “Business - Government Regulation and Compliance” in Item 1; see also Note 19 of Notes to Consolidated Financial Statements.
Item 4. Mine Safety Disclosures.
None.
14
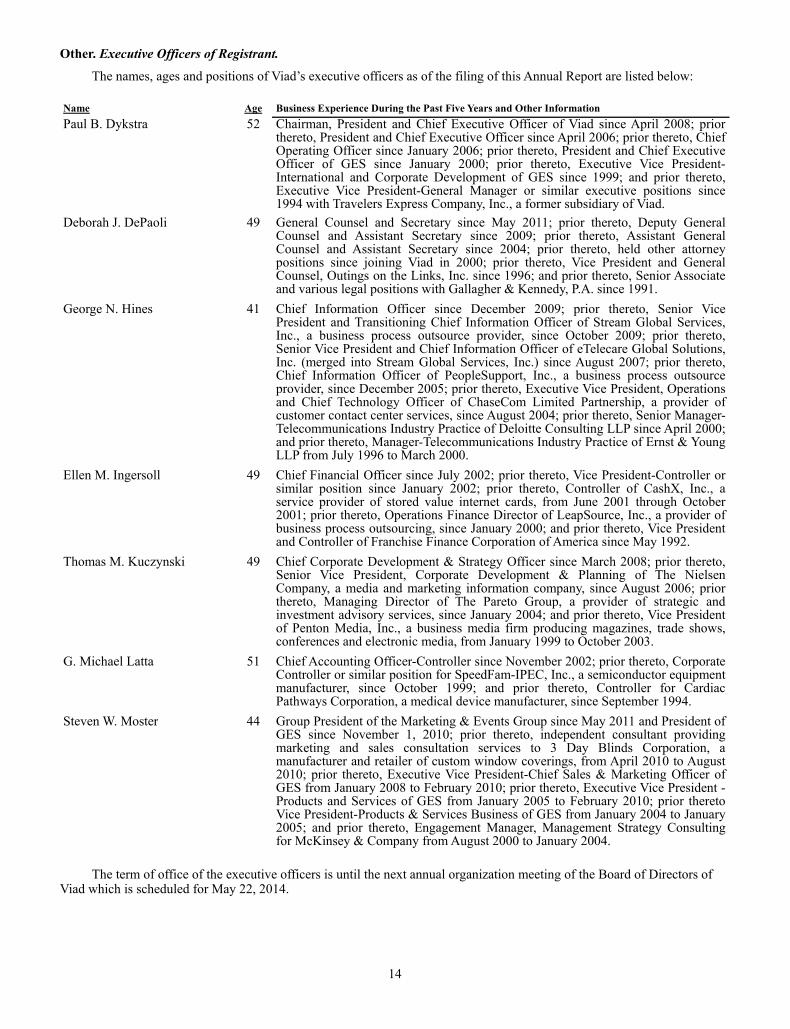
Other. Executive Officers of Registrant.
The names, ages and positions of Viad’s executive officers as of the filing of this Annual Report are listed below: Name Age Business Experience During the Past Five Years and Other Information Paul B. Dykstra 52
Chairman, President and Chief Executive Officer of Viad since April 2008; prior thereto, President and Chief Executive Officer since April 2006; prior thereto, Chief Operating Officer since January 2006; prior thereto, President and Chief Executive Officer of GES since January 2000; prior thereto, Executive Vice President-International and Corporate Development of GES since 1999; and prior thereto, Executive Vice President-General Manager or similar executive positions since 1994 with Travelers Express Company, Inc., a former subsidiary of Viad.
Deborah J. DePaoli 49
General Counsel and Secretary since May 2011; prior thereto, Deputy General Counsel and Assistant Secretary since 2009; prior thereto, Assistant General Counsel and Assistant Secretary since 2004; prior thereto, held other attorney positions since joining Viad in 2000; prior thereto, Vice President and General Counsel, Outings on the Links, Inc. since 1996; and prior thereto, Senior Associate and various legal positions with Gallagher & Kennedy, P.A. since 1991.
George N. Hines 41
Chief Information Officer since December 2009; prior thereto, Senior Vice President and Transitioning Chief Information Officer of Stream Global Services, Inc., a business process outsource provider, since October 2009; prior thereto, Senior Vice President and Chief Information Officer of eTelecare Global Solutions, Inc. (merged into Stream Global Services, Inc.) since August 2007; prior thereto, Chief Information Officer of PeopleSupport, Inc., a business process outsource provider, since December 2005; prior thereto, Executive Vice President, Operations and Chief Technology Officer of ChaseCom Limited Partnership, a provider of customer contact center services, since August 2004; prior thereto, Senior Manager-Telecommunications Industry Practice of Deloitte Consulting LLP since April 2000; and prior thereto, Manager-Telecommunications Industry Practice of Ernst & Young LLP from July 1996 to March 2000.
Ellen M. Ingersoll 49
Chief Financial Officer since July 2002; prior thereto, Vice President-Controller or similar position since January 2002; prior thereto, Controller of CashX, Inc., a service provider of stored value internet cards, from June 2001 through October 2001; prior thereto, Operations Finance Director of LeapSource, Inc., a provider of business process outsourcing, since January 2000; and prior thereto, Vice President and Controller of Franchise Finance Corporation of America since May 1992.
Thomas M. Kuczynski 49
Chief Corporate Development & Strategy Officer since March 2008; prior thereto, Senior Vice President, Corporate Development & Planning of The Nielsen Company, a media and marketing information company, since August 2006; prior thereto, Managing Director of The Pareto Group, a provider of strategic and investment advisory services, since January 2004; and prior thereto, Vice President of Penton Media, Inc., a business media firm producing magazines, trade shows, conferences and electronic media, from January 1999 to October 2003.
G. Michael Latta 51
Chief Accounting Officer-Controller since November 2002; prior thereto, Corporate Controller or similar position for SpeedFam-IPEC, Inc., a semiconductor equipment manufacturer, since October 1999; and prior thereto, Controller for Cardiac Pathways Corporation, a medical device manufacturer, since September 1994.
Steven W. Moster 44
Group President of the Marketing & Events Group since May 2011 and President of GES since November 1, 2010; prior thereto, independent consultant providing marketing and sales consultation services to 3 Day Blinds Corporation, a manufacturer and retailer of custom window coverings, from April 2010 to August 2010; prior thereto, Executive Vice President-Chief Sales & Marketing Officer of GES from January 2008 to February 2010; prior thereto, Executive Vice President -Products and Services of GES from January 2005 to February 2010; prior thereto Vice President-Products & Services Business of GES from January 2004 to January 2005; and prior thereto, Engagement Manager, Management Strategy Consulting for McKinsey & Company from August 2000 to January 2004.
The term of office of the executive officers is until the next annual organization meeting of the Board of Directors of Viad which is scheduled for May 22, 2014.
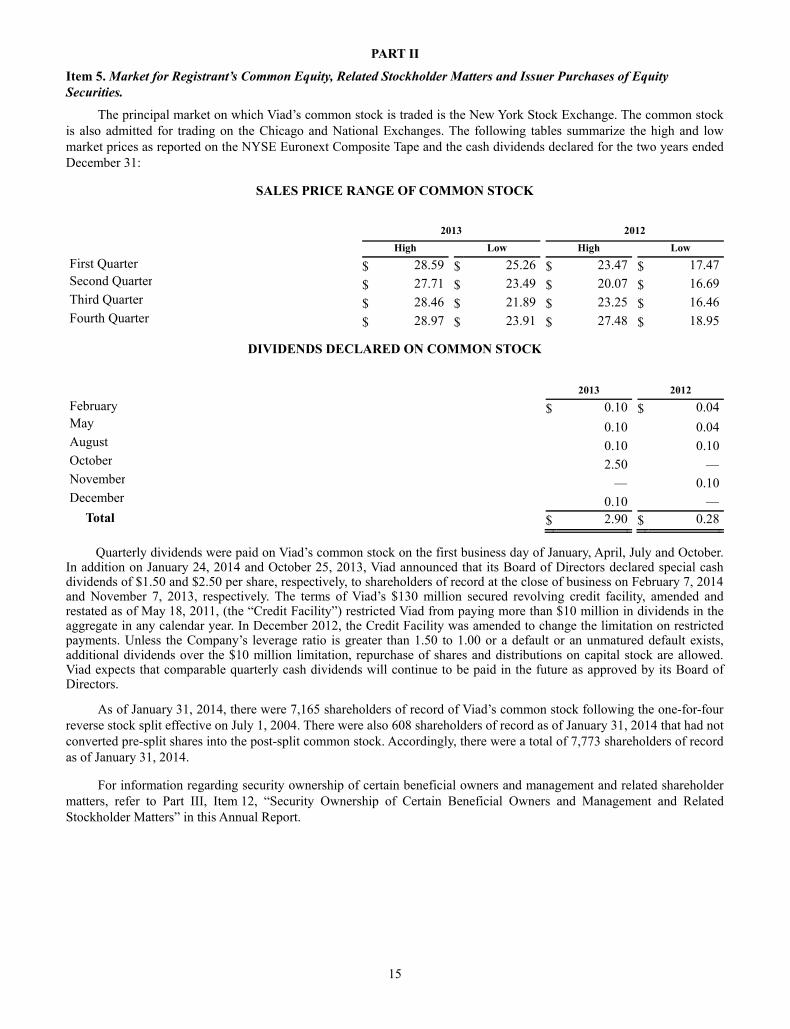
15
PART II
Item 5. Market for Registrant’s Common Equity, Related Stockholder Matters and Issuer Purchases of Equity Securities.
The principal market on which Viad’s common stock is traded is the New York Stock Exchange. The common stock is also admitted for trading on the Chicago and National Exchanges. The following tables summarize the high and low market prices as reported on the NYSE Euronext Composite Tape and the cash dividends declared for the two years ended December 31:
SALES PRICE RANGE OF COMMON STOCK
2013 2012 High Low High LowFirst Quarter $ 28.59 $ 25.26 $ 23.47 $ 17.47Second Quarter $ 27.71 $ 23.49 $ 20.07 $ 16.69Third Quarter $ 28.46 $ 21.89 $ 23.25 $ 16.46Fourth Quarter $ 28.97 $ 23.91 $ 27.48 $ 18.95
DIVIDENDS DECLARED ON COMMON STOCK
2013 2012 February $ 0.10 $ 0.04May 0.10 0.04August 0.10 0.10October 2.50 —November — 0.10December 0.10 —
Total $ 2.90 $ 0.28
Quarterly dividends were paid on Viad’s common stock on the first business day of January, April, July and October. In addition on January 24, 2014 and October 25, 2013, Viad announced that its Board of Directors declared special cash dividends of $1.50 and $2.50 per share, respectively, to shareholders of record at the close of business on February 7, 2014 and November 7, 2013, respectively. The terms of Viad’s $130 million secured revolving credit facility, amended and restated as of May 18, 2011, (the “Credit Facility”) restricted Viad from paying more than $10 million in dividends in the aggregate in any calendar year. In December 2012, the Credit Facility was amended to change the limitation on restricted payments. Unless the Company’s leverage ratio is greater than 1.50 to 1.00 or a default or an unmatured default exists, additional dividends over the $10 million limitation, repurchase of shares and distributions on capital stock are allowed. Viad expects that comparable quarterly cash dividends will continue to be paid in the future as approved by its Board of Directors.
As of January 31, 2014, there were 7,165 shareholders of record of Viad’s common stock following the one-for-four reverse stock split effective on July 1, 2004. There were also 608 shareholders of record as of January 31, 2014 that had not converted pre-split shares into the post-split common stock. Accordingly, there were a total of 7,773 shareholders of record as of January 31, 2014.
For information regarding security ownership of certain beneficial owners and management and related shareholder matters, refer to Part III, Item 12, “Security Ownership of Certain Beneficial Owners and Management and Related Stockholder Matters” in this Annual Report.

16
SHAREHOLDER RETURN PERFORMANCE GRAPH
Set forth below is a line graph comparing, for the five-year period ended December 31, 2013, the yearly percentage change in the cumulative total shareholder return on Viad’s common stock to the cumulative total return of the Standard & Poor’s SmallCap 600 Media Index, Standard & Poor’s SmallCap 600 Commercial Services & Supplies Index, Standard & Poor’s SmallCap 600 Index, Russell 2000 Index and Standard & Poor’s 500 Index.
The graph below assumes $100 was invested on December 31, 2008 in Viad’s common stock, Standard & Poor’s SmallCap 600 Media Index, Standard & Poor’s SmallCap 600 Commercial Services & Supplies Index, Standard & Poor’s SmallCap 600 Index, Russell 2000 Index and Standard & Poor’s 500 Index with reinvestment of all dividends.
Year Ended December 31,
2008 2009 2010 2011 2012 2013 Viad Corp $ 100.00 $ 84.20 $ 104.78 $ 72.48 $ 114.13 $ 130.31S&P 500 $ 100.00 $ 126.45 $ 145.49 $ 148.56 $ 172.32 $ 228.12Russell 2000 $ 100.00 $ 127.09 $ 161.16 $ 154.43 $ 179.71 $ 249.47S&P SmallCap 600 $ 100.00 $ 125.52 $ 158.52 $ 160.12 $ 186.22 $ 263.15S&P 600 Comm. Services & Supplies $ 100.00 $ 126.20 $ 147.34 $ 128.83 $ 168.47 $ 241.61S&P 600 Media Index $ 100.00 $ 170.62 $ 251.17 $ 194.05 $ 220.66 $ 358.90
Set forth below is a table showing the total number of shares of Viad’s common stock that were repurchased during the fourth quarter of 2013 by Viad either on the open market as part of a repurchase program or from employees, former employees and non-employee directors surrendering previously owned Viad common stock (outstanding shares) to pay the taxes in connection with the vesting of restricted stock awards.
Viad Corp
Russell 2000
S&P 600 Comm. Services & Supplies
S&P 500
S&P SmallCap 600
S&P 600 Media Index
2008 2009 2010
Period Ending
Comparison of Five-Year Cumulative Total Return
Inde
x V
alue
2011 2012 2013
0
40
80
120
160
240
200
280
320
360
400

17
ISSUER PURCHASES OF EQUITY SECURITIES
Period Total Number of
Shares Purchased (#) Average Price Paid
Per Share ($)
Total Number of Shares Purchased as Part of publicly
Announced Plans or Programs
Maximum Number (or Approximate Dollar Value) of Shares that
May Yet Be Purchased Under the Plans or Programs(1)
November 2013 2,024 26.70 — 1,030,438December 2013 783 27.40 — 1,030,438Total 2,807 26.90 — 1,030,438
(1) Viad has announced the authorization of its Board of Directors to repurchase shares of the Company’s common stock from time to time at prevailing market prices. No shares were repurchased on the open market during 2013. During 2012, Viad repurchased 23,183 shares for $526,000. As of December 31, 2013, 1,030,438 shares remain available for repurchase. The authorization of the Board of Directors does not have an expiration date. In December 2012, the Company’s $130 million Amended and Restated Credit Agreement dated as of May 18, 2011 was amended to remove the limitation on share repurchases of $10 million in the aggregate per calendar year. This amendment allows share repurchases unless the Company’s leverage ratio, as defined in the Credit Facility, is greater than 1.50 to 1.00 or a default or an unmatured default, as defined in the Credit Facility, exists.

18
Item 6. Selected Financial Data.
VIAD CORP SELECTED FINANCIAL AND OTHER DATA
Year Ended December 31,
(in thousands, except for per share data) 2013 2012 2011 2010 2009 Statement of Operations Data Revenues:
Exhibition and event services $ 685,350 $ 726,429 $ 670,054 $ 590,444 $ 582,969Exhibits and environments 159,554 175,611 170,496 166,040 147,533Travel and recreation services(1),(2) 127,888 123,191 101,814 88,277 75,302
Total revenues $ 972,792 $ 1,025,231 $ 942,364 $ 844,761 $ 805,804Income (loss) from continuing operations(3) $ 20,558 $ 5,959 $ 9,292 $ 817 $ (104,808)Income from discontinued operations(4) 1,128 624 451 262 679Net income (loss) 21,686 6,583 9,743 1,079 (104,129)Net income attributable to noncontrolling interest (131) (686) (533) (636) (582)Net income (loss) attributable to Viad $ 21,555 $ 5,897 $ 9,210 $ 443 $ (104,711)
Diluted Income (Loss) per Common Share Income (loss) from continuing operations attributable to Viad common stockholders(3) $ 1.01 $ 0.26 $ 0.43 $ 0.01
$ (5.28)
Income from discontinued operations attributable to Viad common stockholders(4) 0.05 0.03 0.02 0.01
0.03
Net income (loss) attributable to Viad common stockholders $ 1.06 $ 0.29 $ 0.45 $ 0.02
$ (5.25)
Weighted-average outstanding and potentially dilutive common shares 20,265 20,005 20,055 20,277
19,960
Basic Income (Loss) per Common Share Income (loss) from continuing operations attributable to Viad common stockholders(3) $ 1.01 $ 0.26 $ 0.43 $ 0.01
$ (5.28)
Income from discontinued operations attributable to Viad common stockholders(4) 0.05 0.03 0.02 0.01
0.03
Net income (loss) attributable to Viad common stockholders $ 1.06 $ 0.29 $ 0.45 $ 0.02
$ (5.25)
Weighted-average outstanding common shares 19,850 19,701 19,719 19,955 19,960Dividends declared per common share $ 2.90 $ 0.28 $ 0.16 $ 0.16 $ 0.16
Balance Sheet Data at Year-End Total assets $ 561,932 $ 650,577 $ 617,828 $ 616,503 $ 609,186Total debt and capital lease obligations 11,668 2,226 3,239 9,077 12,788Total stockholders’ equity 356,543 397,032 386,179 386,711 384,631Noncontrolling interest 9,102 8,971 8,285 7,752 7,116
Other Data Adjusted EBITDA(5) $ 62,806 $ 58,150 $ 43,284 $ 32,312 $ 12,793
(1) 2011 amounts include an aggregate $9.7 million in revenue from Grouse Mountain Lodge, St. Mary Lodge and Denali Backcountry Lodge and Denali Cabins which were acquired in January 2011, June 2011 and September 2011, respectively.
(2) 2012 amounts include $5.2 million in revenue from the Banff International Hotel which was acquired in March 2012. (3) Income from continuing operations include the following items (see Notes 5, 7, 15 and 17 of Notes to Consolidated
Financial Statements):
• Restructuring charges, net of tax of $2.7 million, $3.3 million, $2.5 million, $2.6 million and $8.7 million in 2013, 2012, 2011, 2010 and 2009, respectively.
• Impairment charges, net of tax of $3.4 million, $268,000 and $98.2 million in 2013, 2010 and 2009, respectively. • Income tax expense of $13.4 million in 2012 representing a valuation allowance for certain deferred tax assets
associated with foreign tax credit carryforwards. (4) The amounts relate to the sale of land and certain obligations associated with previously sold operations. (5) See Item 7, “Management’s Discussion and Analysis of Financial Condition and Results of Operations” for a discussion of “Non-GAAP Measure.”

19
Item 7. Management’s Discussion and Analysis of Financial Condition and Results of Operations.
The following discussion should be read in conjunction with Viad Corp’s consolidated financial statements and related notes. This discussion contains forward-looking statements that involve risks and uncertainties. Viad Corp’s actual results could differ materially from those anticipated due to various factors discussed under “Risk Factors,” “Forward-Looking Statements” and elsewhere in this Annual Report.
Overview
Viad Corp (“Viad” or the “Company”) operates in three reportable business segments: Marketing & Events U.S., Marketing & Events International and Travel & Recreation Group.
The Marketing & Events Group, comprised of Global Experience Specialists, Inc. and affiliates (“GES”), specializes in all aspects of the design, planning and production of face-to-face events, immersive environments and brand-based experiences for clients, including show organizers, corporate brand marketers and retail shopping centers. In addition, the Marketing & Events Group provides a variety of immersive, entertaining attractions and brand-based experiences, sponsored events, mobile marketing and other branded entertainment and face-to-face marketing solutions for clients and venues, including shopping malls, movie studios, museums and leading consumer brands.
The Travel & Recreation Group segment consists of Brewster Inc. (“Brewster”), Glacier Park, Inc. (“Glacier Park”) and Alaskan Park Properties, Inc. (“Alaska Denali Travel”). Brewster provides tourism products and experiential services in the Canadian Rockies in Alberta and in other parts of Western Canada. Brewster’s operations include the Banff Gondola, Columbia Icefield Glacier Adventure, motorcoach services, charter and sightseeing services, tour boat operations, inbound package tour operations and hotel operations. During 2013, Glacier Park, an 80 percent owned subsidiary of Viad, operated five lodges, three motor inns and one four-season resort hotel and provided food and beverage operations, retail operations and tour and transportation services in and around Glacier National Park in Montana and Waterton Lake National Park in Alberta, Canada. Glacier Park’s concession portion of its business with the U.S. National Park Service (the “Park Service”) for Glacier National Park expired on December 31, 2013. Thereafter, the ongoing operations of Glacier Park will include: Glacier Park Lodge in East Glacier, Montana; Grouse Mountain Lodge in Whitefish, Montana; St. Mary Lodge in St. Mary, Montana; Motel Lake McDonald, an in-holding within Glacier National Park and the Prince of Wales Hotel in Waterton Lakes National Park. Alaska Denali Travel operates the Denali Backcountry Lodge and Denali Cabins. In addition to lodging, Alaska Denali Travel also provides food and beverage operations and package tour and transportation services in and around Denali National Park and Preserve.
In December 2012, Viad announced that its Board of Directors authorized management to explore and evaluate opportunities to enhance shareholder value, including a potential separation of its Travel & Recreation and Marketing & Events business groups. Viad engaged J.P. Morgan Securities LLC as its financial advisor to assist in this evaluation process.
Financial Highlights
The following 2013 financial highlights are presented in accordance with accounting principles generally accepted in the United States of America (“GAAP”):
Viad Corp (Consolidated)
• Total revenues of $972.8 million, a decrease of 5.1 percent from 2012 revenues • Net income attributable to Viad of $21.6 million, as compared to $5.9 million in 2012 • Diluted income per share of $1.06, as compared to $0.29 in 2012 • Restructuring charges totaling $3.9 million primarily related to reorganization activities in the Marketing &
Events Group, comprised of the elimination of certain positions, as well as the elimination of certain positions in the Travel & Recreation Group and at Viad Corporate
• Income from discontinued operations of $1.1 million primarily related to the sale of land associated with previously sold operations
• Cash and cash equivalents were $45.8 million as of December 31, 2013 • Debt was $11.7 million as of December 31, 2013
Marketing & Events U.S.
• Revenues of $628.9 million, a decrease of 7.1 percent from 2012 revenues • Segment operating income of $11.0 million, as compared to $5.6 million in 2012 • A gain of $4.8 million was recorded related to the sale of a facility and related land
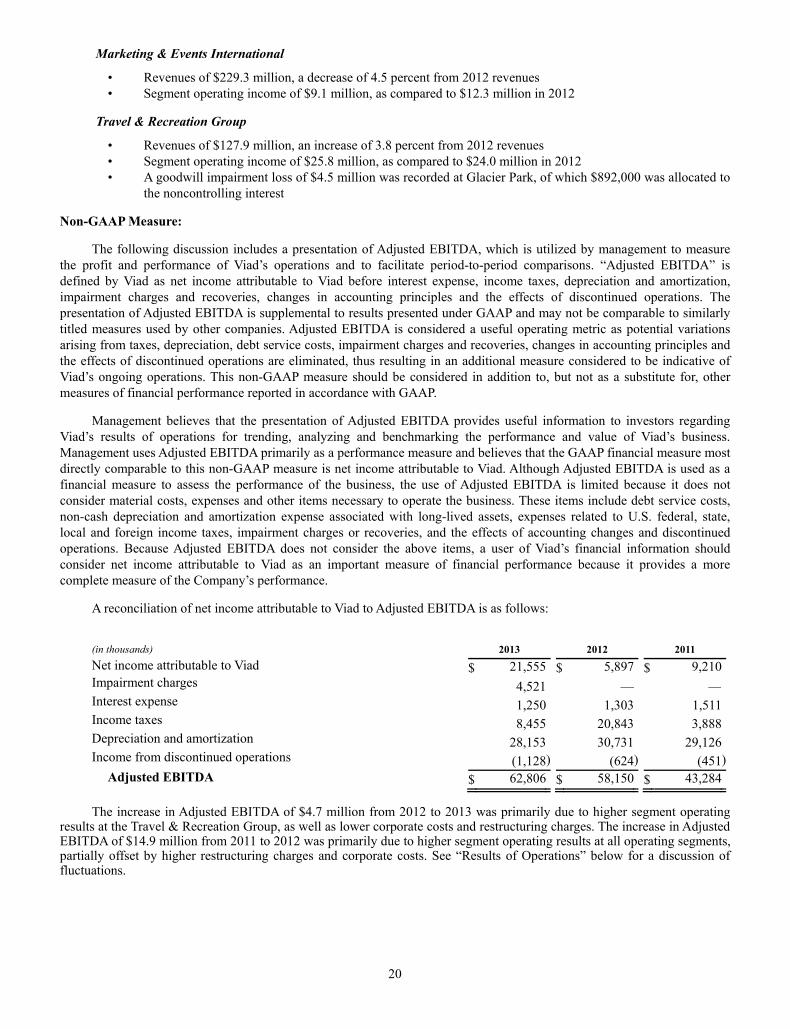
20
Marketing & Events International
• Revenues of $229.3 million, a decrease of 4.5 percent from 2012 revenues • Segment operating income of $9.1 million, as compared to $12.3 million in 2012
Travel & Recreation Group
• Revenues of $127.9 million, an increase of 3.8 percent from 2012 revenues • Segment operating income of $25.8 million, as compared to $24.0 million in 2012 • A goodwill impairment loss of $4.5 million was recorded at Glacier Park, of which $892,000 was allocated to
the noncontrolling interest
Non-GAAP Measure:
The following discussion includes a presentation of Adjusted EBITDA, which is utilized by management to measure the profit and performance of Viad’s operations and to facilitate period-to-period comparisons. “Adjusted EBITDA” is defined by Viad as net income attributable to Viad before interest expense, income taxes, depreciation and amortization, impairment charges and recoveries, changes in accounting principles and the effects of discontinued operations. The presentation of Adjusted EBITDA is supplemental to results presented under GAAP and may not be comparable to similarly titled measures used by other companies. Adjusted EBITDA is considered a useful operating metric as potential variations arising from taxes, depreciation, debt service costs, impairment charges and recoveries, changes in accounting principles and the effects of discontinued operations are eliminated, thus resulting in an additional measure considered to be indicative of Viad’s ongoing operations. This non-GAAP measure should be considered in addition to, but not as a substitute for, other measures of financial performance reported in accordance with GAAP.
Management believes that the presentation of Adjusted EBITDA provides useful information to investors regarding Viad’s results of operations for trending, analyzing and benchmarking the performance and value of Viad’s business. Management uses Adjusted EBITDA primarily as a performance measure and believes that the GAAP financial measure most directly comparable to this non-GAAP measure is net income attributable to Viad. Although Adjusted EBITDA is used as a financial measure to assess the performance of the business, the use of Adjusted EBITDA is limited because it does not consider material costs, expenses and other items necessary to operate the business. These items include debt service costs, non-cash depreciation and amortization expense associated with long-lived assets, expenses related to U.S. federal, state, local and foreign income taxes, impairment charges or recoveries, and the effects of accounting changes and discontinued operations. Because Adjusted EBITDA does not consider the above items, a user of Viad’s financial information should consider net income attributable to Viad as an important measure of financial performance because it provides a more complete measure of the Company’s performance.
A reconciliation of net income attributable to Viad to Adjusted EBITDA is as follows:
(in thousands) 2013 2012 2011 Net income attributable to Viad $ 21,555 $ 5,897 $ 9,210Impairment charges 4,521 — —Interest expense 1,250 1,303 1,511Income taxes 8,455 20,843 3,888Depreciation and amortization 28,153 30,731 29,126Income from discontinued operations (1,128) (624) (451)
Adjusted EBITDA $ 62,806 $ 58,150 $ 43,284
The increase in Adjusted EBITDA of $4.7 million from 2012 to 2013 was primarily due to higher segment operating results at the Travel & Recreation Group, as well as lower corporate costs and restructuring charges. The increase in Adjusted EBITDA of $14.9 million from 2011 to 2012 was primarily due to higher segment operating results at all operating segments, partially offset by higher restructuring charges and corporate costs. See “Results of Operations” below for a discussion of fluctuations.

21
Results of Operations:
2013 vs. 2012:
Revenues for 2013 decreased 5.1 percent to $972.8 million, as compared to $1.0 billion in 2012. Viad’s income from continuing operations before income taxes was $29.1 million for 2013, as compared to $26.8 million in 2012. Impairment losses for 2013 totaled $5.4 million, primarily related to the non-cash write-down of goodwill at Glacier Park of $4.5 million and the write-off of certain assets within the Marketing & Events Group of $952,000. Net restructuring charges in 2013 were $3.9 million, as compared to $4.9 million in 2012. The 2013 charges related to reorganization activities in the Marketing & Events Group, comprised of the elimination of certain positions. In addition, restructuring charges related to the elimination of certain positions in the Travel & Recreation Group and at Viad Corporate were also recorded in 2013. The 2012 restructuring charges primarily related to reorganization activities in the Marketing & Events Group, comprised of facility consolidations, as well as the elimination of certain positions. The increase in operating results, despite revenue declines, was primarily driven by continued same-show growth and focus on margin improvement at the Marketing & Events Group, as well as expanded revenues at all three operating units within the Travel & Recreation Group.
Net income attributable to Viad for 2013 was $21.6 million, or $1.06 per diluted share, as compared to $5.9 million, or $0.29 per diluted share, in 2012. In 2012, the Company recorded a non-cash charge of $13.4 million to income tax expense representing a valuation allowance established for certain deferred tax assets associated with foreign tax credit carryforwards. These results also include income from discontinued operations of $1.1 million, or $0.05 per diluted share, in 2013 and $624,000, or $0.03 per diluted share, in 2012, both primarily related to the sale of land associated with previously sold operations.
During 2013, foreign exchange rate variances resulted in decreases in revenues and segment operating income of $7.0 million and $1.0 million, respectively, as compared to 2012. Viad conducts its foreign operations primarily in Canada, the United Kingdom, Germany and to a lesser extent in certain other countries.
The following table summarizes the effects of foreign exchange rate variances on revenues and segment operating results from Viad’s significant international operations: Revenues Segment Operating Results
Weighted-Average
Exchange Rates Effect of Rate Variance
(in thousands)
Weighted-Average Exchange Rates Effect of Rate
Variance (in thousands) 2013 2012 2013 2012
Marketing & Events Group: Canada $ 0.97 $ 1.00 $ (2,103) $ 0.99 $ 1.04 $ (65)United Kingdom $ 1.56 $ 1.59 $ (2,582) $ 1.57 $ 1.60 $ (138)Germany $ 1.33 $ 1.29 $ 419 $ 1.33 $ 1.27 $ (37)
Travel & Recreation Group: Canada $ 0.96 $ 1.00 $ (2,756) $ 0.96 $ 1.00 $ (790)
Viad’s results were primarily impacted by the weakening of the Canadian dollar and British pound relative to the U.S. dollar. Future changes in the exchange rates may impact overall expected profitability and historical period-to-period comparisons when operating results are translated into U.S. dollars.
Marketing & Events Group. Revenues for the Marketing & Events U.S. segment were $628.9 million for 2013, down 7.1 percent, as compared to $676.8 million in 2012. The decrease was primarily due to negative show rotation of $54 million, partially offset by base same-show revenue increases of 3.1 percent. Management defines base same-show revenues as revenues derived from shows that the Company produced out of the same city during the same quarter in each year. Base same-shows represented 46 percent of Marketing & Events U.S. segment revenues in 2013. The 2013 segment operating income was $11.0 million, as compared to $5.6 million in 2012. The improved operating results were primarily due to lower performance-based incentives, the third quarter gain on sale of a facility in New Jersey and ongoing efforts to drive operating efficiencies.
The Company is continuing to execute against a number of margin improvement initiatives designed to more effectively manage labor costs (the “Labor Management” initiative) and to reduce the physical footprint and the overhead associated with the U.S. warehousing operation (the “Service Delivery Network” initiative). The focus of the Labor Management initiative is on driving productivity gains through rigorous and strategic pre-show planning that reduces the

22
ratio of labor costs to revenues. Driving this measure down continues to be a primary focus for management and the benefits are shown through a 70 basis point improvement in the variable labor-to-revenue ratio on a U.S. base same-show basis, as compared to 2012. The Company is also working to develop new tools to support and systematize show site labor planning, measurement and benchmarking. Through the Service Delivery Network initiative, the Company has reduced its U.S. facility footprint by approximately 1.1 million square feet since 2008, with annualized cost savings of $7.7 million realized through the end of 2013.
In connection with the Service Delivery Network initiative, Viad finalized plans to relocate the Marketing & Events Group’s New Jersey operations as a result of the facility no longer meeting the operational needs of the Company. Viad sold the facility and the land upon which it was situated for $12.7 million (net of selling costs) during the third quarter of 2013. Management realized a pre-tax gain on the sale of $4.8 million during the third quarter of 2013, which is included in the U.S. segment operating results and is partially offset by facility relocation costs during the fourth quarter of 2013.
Revenues for the Marketing & Events International segment were $229.3 million for 2013, down 4.5 percent, as compared to $240.1 million in 2012. Segment operating income was $9.1 million in 2013, as compared to $12.3 million in 2012. As discussed above, period-to-period comparisons for this segment were affected by exchange rate variances, which had an unfavorable impact on revenues of $4.3 million and segment operating income of $240,000, as compared to 2012. Excluding exchange rate variances, 2013 revenues decreased by $6.6 million, or 2.7 percent, and segment operating income decreased by $3.0 million, or 24.5 percent. These decreases were primarily driven by services provided for the 2012 London Summer Olympics and Paralympic Games, partially offset by positive show rotation revenues of approximately $6 million.
Although the Marketing & Events Group has a diversified revenue base and long-term contracts for future shows, its revenues are affected by general economic and industry-specific conditions. The prospects for individual shows tend to be driven by the success of the industry related to those shows. In general, the exhibition and event industry is experiencing modest improvement. Marketing & Events U.S. base same-show revenues have increased on a full year basis for 2011, 2012 and 2013.
For the 2014 full year, management expects U.S. base same-show revenues to increase at a low-to mid-single digit rate and show rotation to have a net positive impact on full year revenue of approximately $55 million. Additionally, management anticipates that foreign currency exchange rate variances versus 2013 will not have a meaningful impact on the Marketing & Events Group’s 2014 full year revenues and segment operating income. Management remains focused on improving the profitability of the Marketing & Events U.S. segment through continued integration and consolidation of operations to increase capacity utilization and reduce costs. Additional restructuring charges may be incurred as further cost structure improvements are made.
The Marketing & Events Group is subject to multiple collective-bargaining agreements that affect labor costs, about one-third of which expire each year. The Company entered into new showsite and warehouse agreements with the Chicago Teamsters Local 727, effective January 1, 2014, and those agreements contain provisions that allow the parties to re-open negotiation of the agreements on pension-related issues. The Company has commenced discussions regarding those issues with all relevant parties and is working diligently to resolve those issues in a manner that will be reasonable and equitable to employees, customers, and shareholders. Although the Company’s labor relations are currently stable, disruptions pending the outcome of the Local 727 negotiations could occur, as could with any collective bargaining agreement negotiation, with the possibility of an adverse impact on the operating results of the Marketing & Events Group.
Travel & Recreation Group. Revenues for the Travel & Recreation Group segment were $127.9 million, up 3.8 percent, as compared to 2012 revenues of $123.2 million. Segment operating income was $25.8 million, up 7.7 percent from 2012 segment operating income of $24.0 million. Segment operating margins were 20.2 percent in 2013, as compared to 19.5 percent in 2012. As discussed above, period-to-period comparisons for this segment were affected by exchange rate variances, which had an unfavorable impact on revenues of $2.8 million and segment operating income of $790,000, as compared to 2012. Excluding exchange rate variances, 2013 revenues increased by $7.5 million, or 6.0 percent, and segment operating income increased by $2.6 million, or 11.0 percent.
Results in 2013 were negatively impacted by extensive flooding that took place on June 20, 2013, in Alberta, Canada. Major pieces of infrastructure in the province were affected and many roads became impassable, which temporarily restricted access to Brewster’s hotel properties and attractions in the area. The provincial authorities were able to restore road access to Banff for both commercial and private vehicles by June 26, 2013, ahead of the Canada Day holiday weekend. Management started seeing more normalized occupancy and visitor traffic in August. Management estimates that the flooding had an

23
unfavorable impact on 2013 revenues of approximately $2 million. Brewster recovered well from the flooding that occurred in late June and delivered solid growth for the full year across nearly all of its lines of business.
The following table provides Travel & Recreation Group revenues by line of business: (in thousands) 2013 2012 Change
Revenues: Hospitality $ 54,828 $ 51,969 $ 2,859 5.5 %Attractions 38,956 38,141 815 2.1 %Package tours 18,950 18,805 145 0.8 %Transportation 17,247 16,858 389 2.3 %Intra-segment eliminations & other (2,093) (2,582) 489 (18.9)%
Total $ 127,888 $ 123,191 $ 4,697 3.8 %
The revenue growth from hospitality properties was primarily due to improved results at most of the lodges and hotels. Glacier Park saw strong results, particularly at the Grouse Mountain Lodge, which was recently updated and refreshed. In addition, the Banff International Hotel, which was acquired on March 7, 2012, benefited from a full first quarter contribution.
Management uses the following key business metrics to evaluate the Travel & Recreation Group hospitality business: RevPAR, average daily rate (“ADR”) and occupancy. These metrics are commonly used in the hospitality industry to measure performance.
RevPAR is calculated as total rooms revenue divided by the total number of room nights available for all comparable Travel & Recreation Group hospitality properties during the period. Total rooms revenue does not include non-rooms revenue, which consists of ancillary revenue generated by hospitality properties, such as food and beverage and retail revenue. RevPAR measures the period-over-period change in rooms revenue for comparable hospitality properties. RevPAR is affected by average daily rate and occupancy, which have different implications on profitability.
ADR is calculated as total rooms revenue divided by the total number of room nights sold for all comparable Travel & Recreation Group hospitality properties during the period. ADR is used to assess the pricing levels that the hospitality properties are able to generate. Increases in ADR at hospitality properties lead to increases in rooms revenue with no substantial effect on variable costs, therefore having a greater impact on margins than increases in occupancy.
Occupancy is calculated as the total number of room nights sold divided by the total number of room nights available for all comparable Travel & Recreation Group hospitality properties during the period. Occupancy measures the utilization of the available capacity at the hospitality properties. Increases in occupancy result in increases in rooms revenue and additional variable operating costs (including housekeeping services, utilities and room amenity costs), as well as lead to increased ancillary non-rooms revenue (including food and beverage and retail revenue).
Management evaluates the performance of the Travel & Recreation Group attractions business utilizing the number of passengers and total attraction revenue per passenger. The number of passengers allows management to assess the volume of visitor activity at each attraction during the period. Total attraction revenue per passenger is calculated as total attraction revenue divided by the total number of passengers at all Travel & Recreation Group attractions during the period. Total attraction revenue includes ticket sales and ancillary revenue generated by attractions, such as food and beverage and retail revenue. Total attraction revenue per passenger measures the total spend per visitor that attraction properties are able to capture, which is important to the profitability of the attractions business.
The following table provides Travel & Recreation Group same-store key performance indicators. The same-store metrics below indicate the performance of all Travel & Recreation Group properties that were owned by Viad and operating at full capacity, considering seasonal closures, for the entirety of both periods presented. For Travel & Recreation Group properties located in Canada, comparisons to the prior year are on a constant U.S. dollar basis, using the current year quarterly average exchange rates for previous periods, to eliminate the positive or negative effects that result from translating. Management believes that this same-store constant currency basis provides better comparability between reporting periods. The same-store key performance indicators for hospitality properties presented below for 2013 exclude the rooms at the Banff International Hotel (acquired in March 2012) that do not have comparable results for 2012.

24
2013 2012 Change
Hospitality: Room nights available 211,746 213,490 (0.8)%RevPAR $ 120 $ 111 8.1 %ADR $ 164 $ 158 3.8 %Occupancy 73.1% 70.0% 3.1 %
Attractions: Passengers 972,203 960,305 1.2 %Total attraction revenue per passenger $ 40 $ 38 5.3 %
Room nights available decreased in 2013 due to changes in seasonal opening dates of certain Glacier Park properties. Management schedules opening dates to optimize profitability based on anticipated travel patterns, and forecasted occupancy levels and operating expenses. The increase in RevPAR reflects improvement across most properties. The Grouse Mountain Lodge experienced particularly strong growth in both ADR and occupancy driven by the Company’s refresh initiatives.
The number of passengers increased across all of the Travel & Recreation Group’s attractions, despite the flood impact. Revenue per passenger increase was mainly driven by increased ticket prices at the Banff Gondola attraction.
During 2013, approximately 64 percent of revenues and 74 percent of segment operating income generated in the Travel & Recreation Group segment were derived through its Canadian operations. These operations are largely affected by foreign customer visitation, and, accordingly, increases in the value of the Canadian dollar, as compared to other currencies, could adversely affect customer volumes, revenues and segment operating income for the Travel & Recreation Group. Additionally, the Travel & Recreation Group is affected by consumer discretionary spending on tourism activities.
Management anticipates that foreign currency exchange rate variances versus 2013 will have an unfavorable impact on the Travel & Recreation Group’s 2014 full year revenues of approximately $3 million. Also, management anticipates the four acquisitions completed by Viad since the beginning of 2011 will generate approximately $27 million in revenues in 2014 with an average Adjusted EBITDA margin (defined as Adjusted EBITDA divided by revenues) of more than 30 percent. By leveraging economies of scale and scope and repositioning the acquired assets for higher returns, management expects to grow this revenue base by three percent in 2014, with continued revenue growth and expanding Adjusted EBITDA margins in future years.
Glacier Park operated the concession portion of its business under a concession contract with the U.S. National Park Service (the “Park Service”) for Glacier National Park. On December 31, 2013, the concession contract expired. Upon completion of the contract term, the Company received cash payments in January 2014 totaling $25 million for the Company’s “possessory interest,” which generally means the value of the structures acquired or constructed, fixtures installed and improvements made to the concession property at Glacier National Park during the term of the concession contract. The Company anticipates a cash payment of approximately $5 million for the personal property Glacier Park used at the facilities covered by the concession contract. Glacier Park generated approximately 47 percent of its 2013 revenues through its concession contract for services provided within Glacier National Park.
Glacier Park continues to generate revenue from the five properties it owns: (1) St. Mary Lodge in St. Mary, Montana; (2) Glacier Park Lodge in East Glacier, Montana; (3) Grouse Mountain Lodge in Whitefish, Montana; (4) the Prince of Wales Hotel in Waterton Lakes National Park, Alberta; and (5) Motel Lake McDonald, which is located inside Glacier National Park. Glacier Park also continues to operate the food and beverage services with respect to these properties and the retail shops located near Glacier National Park. The five properties Glacier Park currently owns contain more than one-half of the rooms that Glacier Park operated in 2013.
Based on the above, management revised its outlook for future revenues and earnings from Glacier Park and performed an impairment evaluation of goodwill at the Glacier Park reporting unit. Based on this evaluation, the Company recorded a non-cash impairment charge of $4.5 million representing all of the goodwill at Glacier Park, of which $892,000 related to the noncontrolling interest.
As a result of the concession contract expiration, partially offset by continued organic growth at the five remaining properties, management anticipates a full year revenue decline at Glacier Park of approximately $19 million. The majority of the revenue impact will occur during the third quarter of 2014, with an approximate $3 million decline expected during the

25
second quarter. Management anticipates a reduction in Glacier Park’s segment operating income of approximately $3.5 million to $4 million in 2014. Due to the seasonal nature of the concession operations, management anticipates Glacier Park’s third quarter operating income to be about $6 million lower than 2013, as this is when the concession properties run at full capacity. During the first, second and fourth quarters of 2014, Glacier Park is expected to have favorable operating results, primarily as a result of reduced overhead expenses and lower costs related to the opening and closing of the seasonal properties.
The following table summarizes Viad’s actual results in comparison to pro forma information for Viad assuming that Glacier Park did not operate the concession contract with the Park Service for Glacier National Park for the entirety of the periods presented: As Reported Pro Forma Results (in thousands) 2013 2012 2011 2013 2012 2011Revenue $ 972,792 $ 1,025,231 $ 942,364 $ 953,348 $ 1,006,645 $ 927,770Depreciation and amortization 28,615 30,731 29,126 27,973 30,138 28,581Segment operating income 45,891 41,862 25,376 41,911 38,190 23,089
Corporate Activities. Corporate activities expense of $6.8 million in 2013 decreased from $9.4 million in 2012. This decrease was primarily due to lower performance-based compensation expense in 2013, as well as higher costs in 2012 related to the amendment and restatement of the Company’s shareholder rights plan and higher legal costs related to employee benefits associated with previously divested operations. These decreases were partially offset by 2013 costs related to the Company’s strategic review process.
Corporate activities expense in 2014 is expected to approximate $9.5 million. The expected increase over 2013 is primarily related to two reasons. First, the Company has exhausted the Viad common stock held in the leveraged Employee Stock Ownership Plan feature of the Company’s 401(k) defined contribution plan (see Note 12) which has been used to fund matching contributions to the Company’s 401(k) plan. Without the benefit of these low cost shares on which to provide a matching contribution, beginning in 2014 Viad will fund 401(k) matching contributions from shares held in treasury which have a higher cost to the Company. The second reason for the increase is related to an increase in performance-based compensation expense.
Restructuring Charges. In 2013, Viad recorded net restructuring charges of $3.9 million, as compared to $4.9 million in 2012. The 2013 charges primarily related to reorganization activities in the Marketing & Events Group, comprised of the elimination of certain positions. In addition, restructuring charges related to the elimination of certain positions in the Travel & Recreation Group and at Viad Corporate were also recorded in 2013.
Impairment Charges. As noted above, Viad recorded a non-cash goodwill impairment charge related to Glacier Park of $4.5 million in 2013. Of the total amount, $892,000 of the goodwill impairment charge was allocated to the noncontrolling interest at Glacier Park. In addition, in 2013, Viad recorded impairment charges of $952,000 related to the write-off of certain assets within the Marketing & Events Group.
Income Taxes. The effective tax rate for 2013 was 29.5 percent, as compared to 77.8 percent for 2012. The high rate for 2012, as compared to the statutory rate, was due to the charge to income tax expense of $13.4 million, representing a valuation allowance for certain deferred tax assets associated with foreign tax credit carryforwards. 2012 vs. 2011:
Revenues for 2012 increased 8.8 percent to $1.0 billion, as compared to $942.4 million in 2011. Viad’s income from continuing operations before income taxes was $26.8 million for 2012, as compared to $13.2 million in 2011. These increases were primarily due to same-show growth, new business wins, positive show rotation revenue of approximately $16 million from non-annual shows that took place during 2012 and continued focus on operating efficiencies at Viad’s Marketing & Events Group, as well as the first peak season contributions from Alaska Denali Travel and the Banff International Hotel, the newly renovated rooms at the Many Glacier Hotel and organic growth at the Company’s Travel & Recreation Group. Net restructuring charges in 2012 were $4.9 million, as compared to $3.8 million in 2011, both primarily related to reorganization activities in the Marketing & Events Group, comprised of facility consolidations, as well as the elimination of certain positions.

26
Net income attributable to Viad for 2012 was $5.9 million, or $0.29 per diluted share, as compared to $9.2 million, or $0.45 per diluted share, in 2011. These results include a charge to income tax expense of $13.4 million representing a valuation allowance established for certain deferred tax assets associated with foreign tax credit carryforwards. These results also include income from discontinued operations of $624,000, or $0.03 per diluted share, in 2012 primarily related to the sale of land associated with previously sold operations and $451,000, or $0.02 per diluted share, in 2011 relating to obligations associated with previously sold operations.
During 2012, foreign exchange rate variances resulted in decreases in revenues and segment operating income of $6.6 million and $886,000, respectively, as compared to 2011. Viad conducts its foreign operations primarily in Canada, the United Kingdom, Germany and to a lesser extent in certain other countries.
The following table summarizes the effects of foreign exchange rate variances on revenues and segment operating results from Viad’s significant international operations: Revenues Segment Operating Results
Weighted-Average
Exchange Rates Effect of Rate Variance
(in thousands)
Weighted-Average Exchange Rates Effect of Rate
Variance (in thousands) 2012 2011 2012 2011
Marketing & Events Group: Canada $ 1.00 $ 1.01 $ (954) $ 1.04 $ 1.00 $ 19United Kingdom $ 1.59 $ 1.61 $ (1,938) $ 1.60 $ 1.61 $ (72)Germany $ 1.29 $ 1.40 $ (1,733) $ 1.27 $ 1.43 $ (107)
Travel & Recreation Group: Canada $ 1.00 $ 1.02 $ (1,952) $ 1.00 $ 1.03 $ (726)
Viad’s results were impacted by the weakening of the Canadian dollar, British pound and Euro relative to the U.S. dollar. Future changes in the exchange rates may impact overall expected profitability and historical period-to-period comparisons when operating results are translated into U.S. dollars.
Marketing & Events Group. Revenues for the Marketing & Events U.S. segment were $676.8 million for 2012, up 7.2 percent, as compared to $631.4 million in 2011. The increase was primarily due to base same-show revenue increases of 6.5 percent and positive show rotation of approximately $21 million. Base same-shows represented 41.5 percent of Marketing & Events U.S. segment revenues in 2012. The 2012 segment operating income was $5.6 million, as compared to a loss of $6.3 million in 2011. The improved operating results were primarily due to an increase in revenues with a continued focus on margin improvements, as well as ongoing efforts to drive operating efficiencies and control discretionary expenses.
Revenues for the Marketing & Events International segment were $240.1 million for 2012, up 9.8 percent, as compared to $218.6 million in 2011. Segment operating income was $12.3 million in 2012, as compared to $11.4 million in 2011. As discussed above, period-to-period comparisons for this segment were affected by exchange rate variances, which had an unfavorable impact on revenues of $4.6 million and segment operating income of $160,000, as compared to 2011. Excluding exchange rate variances, 2012 revenues increased by $26.1 million, or 11.9 percent, and operating income increased by $1.0 million, or 9.0 percent. These increases were primarily driven by services provided for the 2012 London Summer Olympics and Paralympic Games, as well as increased demand and new show wins, partially offset by net negative show rotation revenues of approximately $5 million.
Travel & Recreation Group. Revenues for the Travel & Recreation Group segment were $123.2 million, up 21.0 percent, as compared to 2011 revenues of $101.8 million. Segment operating income was $24.0 million, up 18.6 percent from 2011 segment operating income of $20.2 million. Segment operating margins were 19.5 percent in 2012, as compared to 19.8 percent in 2011. As discussed above, period-to-period comparisons for this segment were affected by exchange rate variances, which had an unfavorable impact on revenues of $2.0 million and segment operating income of $726,000, as compared to 2011. Excluding exchange rate variances, 2012 revenues increased by $23.3 million, or 22.9 percent, and segment operating income increased by $4.5 million, or 22.2 percent. In addition to increased revenues, as discussed below, operating results also reflect higher selling, general and administrative expenses, including costs related to additional resources to support the Company’s growth strategy of “Refresh-Build-Buy.”

27
The following table provides Travel & Recreation Group revenues by line of business: (in thousands) 2012 2011 Change
Revenues: Hospitality $ 51,969 $ 38,003 $ 13,966 36.7 %Attractions 38,141 34,243 3,898 11.4 %Package tours 18,805 17,409 1,396 8.0 %Transportation 16,858 14,782 2,076 14.0 %Intra-segment eliminations & other (2,582) (2,623) 41 (1.6)%
Total $ 123,191 $ 101,814 $ 21,377 21.0 %
Revenue growth from hospitality properties benefited from the initial peak season contributions from the Alaska Denali Travel business (acquired in September 2011) and the Banff International Hotel (acquired in March 2012), with approximately $11.9 million of incremental revenues. St. Mary Lodge and Grouse Mountain Lodge, both in their second year as part of the Travel & Recreation Group in 2012 and renovated as part of the Company’s Refresh-Build-Buy strategy, also increased revenue over 2011. Additionally, rooms that were under renovation at the Many Glacier Hotel in 2011 provided a full revenue contribution in 2012.
The following table provides Travel & Recreation Group same-store key performance indicators. The same-store key performance indicators for hospitality properties for 2012 exclude the rooms at the following properties that do not have comparable results for 2011: Banff International Hotel (acquired March 2012), Denali Cabins (acquired September 2011), Denali Backcountry Lodge (acquired September 2011), St. Mary Lodge (acquired June 2011) and Many Glacier Hotel (rooms closed for renovation during 2011). 2012 2011 Change
Hospitality:(1) Room nights available 169,011 169,034 — %RevPAR $ 95 $ 93 2.2 %ADR $ 146 $ 142 2.8 %Occupancy 64.8 % 65.9% (1.1)%
Attractions: Passengers 960,305 873,870 9.9 %Total attraction revenue per passenger $ 38 $ 37 2.7 %
(1) Grouse Mountain Lodge, acquired on January 5, 2011, is included in the same-store key performance indicators above.
Room nights available saw a slight decrease in 2012 primarily due to the change in seasonal opening and closing dates of certain Glacier Park properties. RevPAR increased due to improved results, primarily driven by the Lake McDonald Lodge and Glacier View Inn.
The number of passengers increased across all of the Travel & Recreation Group’s attractions. Revenue per passenger increased mainly driven by increased ticket prices at the Banff Gondola attraction.
During 2012, approximately 65 percent of revenues and 77 percent of segment operating income generated in the Travel & Recreation Group segment were derived through its Canadian operations. These operations are largely affected by foreign customer visitation, and, accordingly, increases in the value of the Canadian dollar, as compared to other currencies, could adversely affect customer volumes, revenues and segment operating income for the Travel & Recreation Group. Additionally, the Travel & Recreation Group is affected by consumer discretionary spending on tourism activities.
Corporate Activities. Corporate activities expense of $9.4 million in 2012 increased from $7.7 million in 2011. This increase was primarily due to costs related to the amendment and restatement of the Company’s shareholder rights plan as well as increased performance-based compensation expense.
Restructuring Charges. In 2012, Viad recorded net restructuring charges of $4.9 million, as compared to $3.8 million in 2011. These charges primarily related to reorganization activities in the Marketing & Events Group, comprised of facility consolidations as well as the elimination of certain positions.

28
Income Taxes. The effective tax rate for 2012 was 77.8 percent, as compared to 29.5 percent for 2011. The high rate for 2012, as compared to the statutory rate, was due to the charge to income tax expense of $13.4 million representing a valuation allowance for certain deferred tax assets associated with foreign tax credit carryforwards.
Liquidity and Capital Resources
Cash and cash equivalents were $45.8 million as of December 31, 2013, as compared to $114.2 million as of December 31, 2012, with the decrease primarily due to the payment of a $50.8 million special cash dividend in November 2013. During 2013, the Company generated net cash flows from operating activities of $6.1 million primarily driven by operating results, mostly offset by changes in working capital. Management believes that Viad’s existing sources of liquidity will be sufficient to fund operations and capital commitments for at least the next 12 months.
As of December 31, 2013, the Company had $41.5 million of its cash and cash equivalents held outside of the United States. Of the total amount, $32.6 million was held in Canada, $5.4 million in the United Kingdom, $2.0 million in Germany and $1.5 million in the United Arab Emirates. There were certain historical earnings related to its Canadian operations which, if repatriated to the United States, would result in incremental income tax expense. The incremental tax liability as of December 31, 2013 that would result assuming all foreign cash balances were repatriated to the United States would be approximately $1.0 million.
Cash Flows
Operating Activities (in thousands) 2013 2012 2011
Net income $ 21,686 $ 6,583 $ 9,743Depreciation and amortization 28,615 30,731 29,126Other non-cash items 14,209 32,482 11,383Changes in assets and liabilities (58,455) (610 ) (15,516)
Net cash provided by operating activities $ 6,055 $ 69,186 $ 34,736
2013 - The two larger items in other non-cash items consisted of $5.2 million of share-based compensation expense and $5.4 million of impairment charges. The changes in assets and liabilities primarily consisted of a $21.0 million decrease in customer deposits, a $15.4 million decrease in accounts payable and a $11.7 million decrease in accrued compensation.
2012 - Non-cash items primarily consisted of $11.3 million of deferred income taxes related to the valuation allowance for foreign tax credit carryforwards and $7.2 million of share-based compensation expense. The changes in assets and liabilities primarily consisted of a $4.7 million decrease in restructuring liabilities partially offset by a $4.3 million increase in accounts payable.
2011 - Non-cash items primarily consisted of $4.4 million of share-based compensation expense and $3.8 million of restructuring charges. The changes in assets and liabilities primarily consisted of an $18.1 million increase in receivables and a $3.9 million decrease in restructuring liabilities. This was partially offset by a $5.0 million increase in customer deposits and a $4.6 million increase in accrued compensation.
Investing Activities (in thousands) 2013 2012 2011
Capital expenditures $ (36,119) $ (27,675 ) $ (21,538)Acquisition of businesses, net of cash acquired (647) (23,546 ) (41,105)Proceeds from sale of facility and related land 12,696 — —Proceeds from the sale of land - discontinued operations 1,645 1,041 —Other 464 706 440
Net cash used in investing activities $ (21,961) $ (49,474 ) $ (62,203)
2013 - Cash used in investing activities was driven by $36.1 million of capital expenditures primarily related to the construction of the Glacier Skywalk at the Travel & Recreation Group as well as equipment and computer hardware at the

29
Marketing & Events U.S. segment. Partially offsetting this was $14.3 million of proceeds from the sale of a facility and related land in the Marketing & Events Group and the sale of land from a discontinued operation.
In 2013, the Travel & Recreation Group paid $12.7 million in capital expenditures relating to the Glacier Skywalk. Management projects that the Glacier Skywalk will generate approximately $4.5 million to $5 million in revenue and an operating income margin of more than 50 percent in 2014.
In connection with the expiration of the Company’s concession contract at Glacier National Park, Viad received cash payments in January 2014 totaling $25 million for its “possessory interest,” which generally means the value of the structures acquired or constructed, fixtures installed and improvements made to the concession property during the term of the concession contract. The Company anticipates a cash payment of approximately $5 million for the personal property Glacier Park used at the facilities covered by the concession contract.
2012 - Cash used in investing activities primarily consisted of $27.7 million used for capital expenditures related to the purchase of rental inventory, equipment and computer hardware and leasehold improvements at the Marketing & Events U.S. segment as well as Glacier Skywalk construction costs and building and other improvements at the Travel & Recreation Group, and $23.5 million used for the acquisition of the Banff International Hotel and related assets, net of cash acquired.
During 2012, the Company began construction on the Glacier Skywalk, a 1,312-foot guided interpretive walkway with a 98-foot glass-floored observation area overlooking the Sunwapta Valley in close proximity to the Company’s Columbia Icefield attraction in Jasper National Park, Alberta, Canada. In 2012, the Travel & Recreation Group incurred $8.9 million in capital expenditures relating to the Glacier Skywalk, with an accrued capital expenditure amount of $2.6 million as of December 31, 2012.
2011 - Cash used in investing activities primarily consisted of $41.1 million used for the acquisitions of Grouse Mountain Lodge, St. Mary Lodge, and Denali Backcountry Lodge and Denali Cabins, net of cash acquired and $21.5 million used for capital expenditures related to the purchase of rental inventory, equipment and computer hardware primarily at the Marketing & Events U.S. segment as well as building and other improvements at the Travel & Recreation Group.
Financing Activities
(in thousands) 2013 2012 2011
Payments on debt and capital lease obligations $ (11,362) $ (2,685 ) $ (7,375)Proceeds from borrowings 20,000 — —Dividends paid on common stock (58,914) (4,454 ) (3,241)Common stock purchased for treasury (1,328) (1,656 ) (5,230)Debt issuance costs — — (1,001)Other 1,199 541 350
Net cash used in financing activities $ (50,405) $ (8,254 ) $ (16,497)
2013 - Cash used in financing activities primarily consisted of $58.9 million used for payments of dividends on common stock, partially offset by a net debt borrowing of $8.6 million. On January 24, 2014 and October 25, 2013, Viad announced that its Board of Directors declared special cash dividends of $1.50 and $2.50 per share, respectively, to shareholders of record at the close of business on February 7, 2014 and November 7, 2013, respectively.
2012 - Cash used in financing activities primarily consisted of $4.5 million used for payments of dividends on common stock and $2.7 million used for payments on debt and capital lease obligations. In August 2012, Viad’s Board of Directors approved a 150 percent increase in the quarterly dividend from $0.04 per share to $0.10 per share.
2011 - Cash used in financing activities primarily consisted of $7.4 million used for payments on debt and capital lease obligations, $5.2 million used to purchase common stock for treasury and $3.2 million used for payments of dividends on common stock.

30
Debt
Viad’s total debt as of December 31, 2013 and 2012 was $11.7 million and $2.2 million, respectively. The debt-to-capital ratio was 0.032 to 1 and 0.006 to 1 as of December 31, 2013 and 2012, respectively. Capital is defined as total debt and capital lease obligations plus total stockholders’ equity.
In May 2011, Viad entered into an amended and restated revolving credit agreement (the “Credit Facility”). The Credit Facility provides for a $130 million revolving line of credit, which may be increased up to an additional $50 million under certain circumstances. The term of the Credit Facility is five years (expiring on May 18, 2016) and borrowings are to be used for general corporate purposes (including permitted acquisitions) and to support up to $50 million of letters of credit. The lenders have a first perfected security interest in all of the personal property of Viad and GES, including 65 percent of the capital stock of top-tier foreign subsidiaries. As of December 31, 2013, Viad’s total debt of $11.7 million consisted of $10.0 million of revolver borrowing on the Credit Facility and $1.7 million of capital lease obligations. As of December 31, 2013, Viad had $118.7 million of capacity remaining under its Credit Facility reflecting outstanding letters of credit of $1.3 million and the outstanding balance under the Credit Facility of $10.0 million.
Borrowings under the Credit Facility (of which GES is a guarantor) are indexed to the prime rate or the London Interbank Offered Rate, plus appropriate spreads tied to Viad’s leverage ratio. Commitment fees and letters of credit fees are also tied to Viad’s leverage ratio. The fees on the unused portion of the Credit Facility are currently 0.35 percent annually.
The Credit Facility contains various affirmative and negative covenants that are customary for facilities of this type, including a fixed-charge coverage ratio, leverage ratio and dividend and share repurchase limits. Significant other covenants include limitations on: investments, additional indebtedness, sales/leases of assets, acquisitions, consolidations or mergers and liens on property. As of December 31, 2013, Viad was in compliance with all covenants.
In December 2012, the Credit Facility was amended to remove the limitation on share repurchases of $10 million in the aggregate per calendar year pursuant to certain conditions. The amendment allows share repurchases unless the Company’s leverage ratio, as defined in the Credit Facility, is greater than 1.50 to 1.00 or a default or an unmatured default, as defined in the Credit Facility, exists. The amendment also allows dividends to be declared and paid in excess of $10 million in the aggregate per calendar year, as well as distributions on its capital stock, as defined in the Credit Facility, unless the Company’s leverage ratio, as defined in the Credit Facility, is greater than 1.50 to 1.00 or a default or an unmatured default, as defined in the Credit Facility, exists.
Effective November 14, 2013, the Credit Facility was amended to remove the liquidity covenant that required Viad to maintain at all times not less than $50 million of unrestricted cash and cash equivalent investments, as that term is defined in the Credit Facility. With the amendment, the Credit Facility no longer requires any minimum amount of unrestricted cash and cash equivalent investments.
Guarantees
As of December 31, 2013, Viad had certain obligations under guarantees to third parties on behalf of its subsidiaries. These guarantees are not subject to liability recognition in the consolidated financial statements and relate to leased facilities entered into by the Company’s subsidiary operations. The Company would generally be required to make payments to the respective third parties under these guarantees in the event that the related subsidiary could not meet its own payment obligations. The maximum potential amount of future payments that Viad would be required to make under all guarantees existing as of December 31, 2013 would be $13.7 million. These guarantees relate to leased facilities and expire through October 2017. There are no recourse provisions that would enable Viad to recover from third parties any payments made under the guarantees. Furthermore, there are no collateral or similar arrangements whereby Viad could recover payments.
Share Repurchases
Viad has announced the authorization of its Board of Directors to repurchase shares of the Company’s common stock on the open market from time to time at prevailing market prices. No shares were repurchased on the open market during 2013. During 2012, Viad repurchased 23,183 shares for $526,000. As of December 31, 2013, 1,030,438 shares remain available for repurchase. Additionally, during 2013 and 2012, the Company repurchased 50,156 shares for $1.3 million and 56,885 shares for $1.1 million, respectively, related to tax withholding requirements on share-based awards.

31
Contractual Obligations
The following table presents Viad’s contractual obligations as of December 31, 2013: Payments due by period
(in thousands) Less than
1 year 1-3 years 3-5 years More than
5 years Total Operating leases $ 19,808 $ 23,810 $ 13,967 $ 8,137 $ 65,722Pension and postretirement benefits(1) 3,645 7,507 7,626 19,317 38,095Purchase obligations(2) 18,828 10,227 2,567 22 31,644Capital lease obligations 984 795 34 — 1,813Estimated interest payments 76 67 2 — 145
Total contractual cash obligations(3) $ 43,341 $ 42,406 $ 24,196 $ 27,476 $ 137,419(1) Estimated contributions related to multi-employer benefit plans are excluded from the table above. See Note 16 of Notes
to Consolidated Financial Statements for disclosures regarding those obligations. (2) Purchase obligations primarily represent payments due under various licensing agreements and commitments related to
consulting and other contracted services that are enforceable and legally binding and that specify all significant terms, including open purchase orders.
(3) Aggregate self-insurance liabilities of $29.9 million are excluded from the table above as the timing and amounts of future cash outflows are uncertain. See Note 8 of Notes to Consolidated Financial Statements.
Viad and certain of its subsidiaries are plaintiffs or defendants to various actions, proceedings and pending claims, some of which involve, or may involve, compensatory, punitive or other damages. Litigation is subject to many uncertainties and it is possible that some of the legal actions, proceedings or claims could be decided against Viad. Although the amount of liability as of December 31, 2013 with respect to these matters is not ascertainable, Viad believes that any resulting liability, after taking into consideration amounts already provided for and insurance coverage, will not have a material effect on Viad’s business, financial position or results of operations.
Viad is subject to various U.S. federal, state and foreign laws and regulations governing the prevention of pollution and the protection of the environment in the jurisdictions in which Viad has or had operations. If the Company has failed to comply with these environmental laws and regulations, civil and criminal penalties could be imposed and Viad could become subject to regulatory enforcement actions in the form of injunctions and cease and desist orders. As is the case with many companies, Viad also faces exposure to actual or potential claims and lawsuits involving environmental matters relating to its past operations. Although it is a party to certain environmental disputes, Viad believes that any resulting liabilities, after taking into consideration amounts already provided for and insurance coverage, will not have a material effect on the Company’s financial position, results of operations or liquidity. As of December 31, 2013, there was a remaining environmental remediation liability of $5.0 million related to previously sold operations of which $353,000 is included in the consolidated balance sheets under the caption “Other current liabilities” and $4.7 million under the caption “Other deferred items and liabilities.”
Viad’s businesses contribute to various multi-employer pension plans based on obligations arising under collective-bargaining agreements covering its union-represented employees. Viad’s contributions to these plans in 2013, 2012 and 2011 totaled $20.3 million, $20.7 million and $19.6 million, respectively. Based upon the information available to Viad from plan administrators, management believes that several of these multi-employer plans are underfunded. The Pension Protection Act of 2006 requires pension plans underfunded at certain levels to reduce, over defined time periods, the underfunded status. In addition, under current laws, the termination of a plan, or a voluntary withdrawal from a plan by Viad, or a shrinking contribution base to a plan as a result of the insolvency or withdrawal of other contributing employers to such plan, would require Viad to make payments to such plan for its proportionate share of the plan’s unfunded vested liabilities. As of December 31, 2013, the amount of additional funding, if any, that Viad would be required to make related to multi-employer pension plans is not ascertainable.
Off-Balance Sheet Arrangements:
Viad does not have any “off-balance sheet” arrangements with unconsolidated special-purpose or other entities that would materially affect the Company’s financial position, results of operations, liquidity or capital resources. Furthermore, Viad does not have any relationships with special-purpose or other entities that provide off-balance sheet financing; liquidity, market risk or credit risk support; or engage in leasing or other services that may expose the Company to liability

32
or risks of loss that are not reflected in Viad’s consolidated financial statements and related notes. See Notes 9, 18 and 19 of Notes to Consolidated Financial Statements.
Critical Accounting Policies and Estimates:
The preparation of financial statements in conformity with GAAP requires estimates and assumptions that affect the reported amounts of assets and liabilities, revenues and expenses, and related disclosures of contingent assets and liabilities in the consolidated financial statements. The SEC has defined a company’s most critical accounting policies as those that are most important to the portrayal of a company’s financial position and results of operations, and that require a company to make its most difficult and subjective judgments, often as a result of the need to make estimates of matters that are inherently uncertain. Based on these criteria, Viad has identified and discussed with its audit committee the following critical accounting policies and estimates pertaining to Viad, and the methodology and disclosures related to those estimates:
Goodwill — Goodwill is not amortized, but tested for impairment at the reporting unit level on an annual basis on October 31 of each year. Goodwill is also tested for impairment between annual tests if an event occurs or circumstances change that would more-likely-than-not reduce the fair value of a reporting unit below its carrying amount. Viad’s reporting units are defined, and goodwill is tested, at either an operating segment level or at the component level of an operating segment, depending on various factors including: the internal reporting structure of the operating segment, the level of integration among components, the sharing of assets and other resources among components and the benefits and likely recoverability of goodwill by the component’s operations.
For impairment testing purposes, the goodwill related to the Marketing & Events U.S. segment is assigned to and tested at the operating segment level, which represents all domestic operations of GES. Furthermore, the goodwill related to the Marketing & Events International segment is assigned to and tested based on the segment’s geographical operations. For the Marketing & Events International segment the reporting units are GES United Kingdom and GES Canada. Brewster, Glacier Park and Alaska Denali Travel are considered reporting units for goodwill impairment testing purposes.
As of December 31, 2013, Viad had total goodwill of $129.5 million consisting of $85.3 million related to the Marketing & Events Group and $44.2 million related to the Travel & Recreation Group. The following table summarizes goodwill balances by reporting unit and segment as of December 31: (in thousands) 2013 2012 Marketing & Events Group:
Marketing & Events U.S. $ 62,686 $ 62,686Marketing & Events International:
GES United Kingdom 14,049 13,894GES Canada 8,562 9,160
Total Marketing & Events Group 85,297 85,740Travel & Recreation Group:
Brewster 41,062 44,435Alaska Denali Travel 3,184 3,184Glacier Park — 4,461
Total Travel & Recreation Group 44,246 52,080Total Goodwill $ 129,543 $ 137,820
Viad uses a discounted expected future cash flow methodology (income approach) in order to estimate the fair value of its reporting units for purposes of goodwill impairment testing. The estimates and assumptions regarding expected future cash flows, discount rates and terminal values require considerable judgment and are based on market conditions, financial forecasts, industry trends and historical experience.
The most critical assumptions and estimates in determining the estimated fair value of its reporting units relate to the amounts and timing of expected future cash flows for each reporting unit and the reporting unit cost of capital (discount rate) applied to those cash flows. Furthermore, the assumed reporting unit cost of capital rates (discount rates) are estimated using a build-up method based on the perceived risk associated with the cash flows pertaining to the specific reporting unit. In order to assess the reasonableness of its fair value estimates, the Company performs a reconciliation of the aggregate fair values of its reporting units to Viad’s market capitalization.
33
As noted above, the estimates and assumptions regarding expected future cash flows, discount rates and terminal values require considerable judgment and are based on market conditions, financial forecasts, industry trends and historical experience. These estimates, however, have inherent uncertainties and different assumptions could lead to materially different results. As of December 31, 2013, Viad had aggregate goodwill of $129.5 million recorded in the consolidated balance sheets. Furthermore, as a result of the Company’s most recent impairment analysis performed in October 2013, the excess of the estimated fair value over the carrying value (expressed as a percentage of the carrying amounts) under step one of the impairment test was 139 percent, 58 percent and 59 percent for each of the Marketing & Events Group reporting units in the United States, the United Kingdom and Canada, respectively. For the Brewster and Alaska Denali Travel reporting units, the excess of the estimated fair value over the carrying value was 54 percent and 15 percent, respectively, as of the most recent impairment test. Significant reductions in the Company’s expected future revenues, operating income or cash flow forecasts and projections, or an increase in reporting unit cost of capital, could trigger additional goodwill impairment testing, which may result in impairment charges. See “Results of Operations” above and Note 7 of Notes to Consolidated Financial Statements for a discussion of the goodwill impairment loss recorded during 2013 related to Glacier Park.
Income taxes — Viad is required to estimate and record provisions for income taxes in each of the jurisdictions in which the Company operates. Accordingly, the Company must estimate its actual current income tax liability, and assess temporary differences arising from the treatment of items for tax purposes, as compared to the treatment for accounting purposes. These differences result in deferred tax assets and liabilities which are included in Viad’s consolidated balance sheets. The Company must assess the likelihood that deferred tax assets will be recovered from future taxable income and to the extent that recovery is not likely, a valuation allowance must be established. The Company uses significant judgment in forming a conclusion regarding the recoverability of its deferred tax assets and evaluates the available positive and negative evidence to determine whether it is more-likely-than-not that its deferred tax assets will be realized in the future. As of December 31, 2013 and 2012, Viad had gross deferred tax assets of $77.0 million and $82.2 million, respectively. These deferred tax assets reflect the expected future tax benefits to be realized upon reversal of deductible temporary differences, and the utilization of net operating loss and tax credit carryforwards.
The Company considered all available positive and negative evidence regarding the future recoverability of its deferred tax assets, including the Company’s recent operating history, taxpaying history and future reversals of deferred tax liabilities. The Company also evaluated its ability to utilize its foreign tax credits, given its recent utilization history. These tax credits are subject to a 10-year carryforward period and begin to expire in 2019. Based on the Company’s assessment, it was determined during the fourth quarter of 2012 that the weight of the evidence indicated that certain deferred tax assets associated with foreign tax credit carryforwards no longer met the more-likely-than-not test regarding the realization of those assets. As a result, the Company recorded a valuation allowance of $13.4 million related to all of its foreign tax credit carryforwards. During 2013, the Company generated additional foreign tax credit carryforwards of $1.9 million for which an additional valuation allowance was recorded. However, the Company also determined, due to the taxable income associated with the Glacier Park possessory interest the Company received in the first quarter of 2014, it was more-likely-than-not that a portion of its previously existing foreign tax credit carryforwards would be utilized. Therefore, during the fourth quarter of 2013, the Company reversed $4.1 million of its valuation allowance related to those tax credits. Accordingly, the Company recorded a net decrease to income tax expense of $2.2 million and a decrease of $300,000 to deferred tax assets for a total decrease to income tax expense of $2.5 million related to changes in the valuation allowance associated with its foreign tax credit carryforwards. As of December 31, 2013 and 2012, Viad had federal, state and foreign net operating loss carryforwards of $96.0 million and $82.0 million, respectively, for which the Company had deferred tax assets of $4.8 million and $1.8 million, respectively. The state and foreign net operating loss carryforwards expire on various dates from 2014 through 2033. During 2013, the Company increased its valuation allowance related to state and foreign net operating loss carryforwards by $329,000. As of December 31, 2013 and 2012, Viad had a valuation allowance of $1.5 million and $1.2 million, respectively, related to those state and foreign deferred tax assets. With respect to all other deferred tax assets, management believes that recovery from future taxable income is more-likely-than-not.
As noted above, Viad uses considerable judgment in forming a conclusion regarding the recoverability of its deferred tax assets. As a result, there are inherent uncertainties regarding the ultimate realization of these assets, which is primarily dependent on Viad’s ability to generate sufficient taxable income in future periods. In future periods, it is reasonably possible that the relative weight of positive and negative evidence regarding the recoverability of Viad’s deferred tax assets may change, which could result in a material increase or decrease in the Company’s valuation allowance. If such a change in the valuation allowance were to occur, it would result in a material increase or decrease to income tax expense in the period the assessment was made.

34
Insurance liabilities — Viad is self-insured up to certain limits for workers’ compensation, automobile, product and general liability and property loss claims. The aggregate amount of insurance liabilities (up to the Company’s retention limit) related to Viad’s continuing operations was $20.0 million as of December 31, 2013. Of this total, $12.5 million related to workers’ compensation liabilities and the remaining $7.5 million related to general/auto liability claims. Viad has also retained and provided for certain insurance liabilities in conjunction with previously sold businesses totaling $5.0 million as of December 31, 2013, primarily related to workers’ compensation liabilities. Provisions for losses for claims incurred, including estimated claims incurred but not yet reported, are made based on Viad’s historical experience, claims frequency and other factors. A change in the assumptions used could result in an adjustment to recorded liabilities. Viad has purchased insurance for amounts in excess of the self-insured levels, which generally range from $200,000 to $500,000 on a per claim basis. Viad does not maintain a self-insured retention pool fund as claims are paid from current cash resources at the time of settlement. Viad’s net cash payments in connection with these insurance liabilities were $6.6 million, $5.6 million and $7.6 million in 2013, 2012 and 2011, respectively.
In addition, as of December 31, 2013, Viad has recorded insurance liabilities of $5.0 million related to continuing operations in excess of the self-insured levels for which Viad remains the primary obligor. Of this total, $1.7 million related to workers’ compensation liabilities and the remaining $3.3 million related to general liability claims. The Company has presented these amounts as other deferred items and liabilities with a corresponding receivable in other investments and assets.
Pension and postretirement benefits — Viad’s pension plans use traditional defined benefit formulas based on years of service and final average compensation. Funding policies provide that payments to defined benefit pension trusts shall be at least equal to the minimum funding required by applicable regulations. The Company presently anticipates contributing $1.4 million to its funded pension plans and $942,000 to its unfunded pension plans in 2014.
Viad and certain of its subsidiaries have defined benefit postretirement plans that provide medical and life insurance for certain eligible employees, retirees and dependents. The related postretirement benefit liabilities are recognized over the period that services are provided by employees. In addition, Viad retained the obligations for these benefits for retirees of certain sold businesses. While the plans have no funding requirements, Viad expects to contribute $950,000 to the plans in 2014.
The assumed health care cost trend rate used in measuring the December 31, 2013 accumulated postretirement benefit obligation was 8.0 percent, declining one-half percent each year to the ultimate rate of 5.0 percent by the year 2019 and remaining at that level thereafter. The assumed health care cost trend rate used in measuring the December 31, 2012 accumulated postretirement benefit obligation was 8.5 percent, declining one-half percent each year to the ultimate rate of 5.0 percent by the year 2019 and remaining at that level thereafter.
A one-percentage-point increase in the assumed health care cost trend rate for each year would increase the accumulated postretirement benefit obligation as of December 31, 2013 by approximately $1.5 million and the total of service and interest cost components by approximately $113,000. A one-percentage-point decrease in the assumed health care cost trend rate for each year would decrease the accumulated postretirement benefit obligation as of December 31, 2013 by approximately $1.3 million and the total of service and interest cost components by approximately $90,000.
The weighted-average assumptions used to determine the pension and postretirement benefit obligations as of December 31 were as follows: Domestic Plans
Funded Plans Unfunded Plans Postretirement Benefit Plans Foreign Plans
2013 2012 2013 2012 2013 2012 2013 2012Discount rate 4.89% 4.11% 4.60% 3.80% 4.65% 3.85% 4.67% 4.06%

35
The weighted-average assumptions used to determine net periodic benefit cost were as follows: Domestic Plans
Funded Plans Unfunded Plans Postretirement Benefit Plans Foreign Plans
2013 2012 2013 2012 2013 2012 2013 2012 Discount rate 4.09% 4.93% 3.80% 4.75% 3.85% 4.70% 4.03% 4.65%Expected return on plan assets 3.90% 4.20% N/A N/A 0.00% 4.65% 5.44% 5.45%
The discount rates used in determining future pension and postretirement benefit obligations are based on rates determined by actuarial analysis and management review, and reflect the estimated rates of return on a high-quality, hypothetical bond portfolio whose cash flows match the timing and amounts of expected benefit payments. See Note 16 of Notes to Consolidated Financial Statements.
Share-based compensation — Viad grants share-based compensation awards to officers, directors and certain key employees pursuant to the 2007 Viad Corp Omnibus Incentive Plan which has a 10-year life and provides for the following types of awards: (a) incentive and non-qualified stock options; (b) restricted stock and restricted stock units; (c) performance units or performance shares; (d) stock appreciation rights; (e) cash-based awards and (f) certain other stock-based awards.
Share-based compensation expense recognized in the consolidated financial statements in 2013, 2012 and 2011 was $5.2 million, $7.2 million and $4.4 million, respectively. Furthermore, the total tax benefits related to such costs were $1.9 million, $2.6 million and $1.6 million in 2013, 2012 and 2011, respectively. No share-based compensation costs were capitalized during 2013, 2012 or 2011.
The fair value of restricted stock and performance-based restricted stock awards are based on Viad’s stock price on the date of grant. Liability-based awards are recorded at estimated fair value, based on the number of units expected to vest and the level of achievement of predefined performance goals (where applicable) and are remeasured on each balance sheet date based on Viad’s stock price until the time of settlement. Viad uses the Black-Scholes option pricing model for purposes of determining the fair value of each stock option grant for which key assumptions are necessary. These assumptions include Viad’s expected stock price volatility, the expected period of time the stock option will remain outstanding, the expected dividend yield on Viad’s common stock and the risk-free interest rate. While the Company has not granted stock options since 2010, changes in the assumptions could result in different estimates of the fair value of stock option grants, and consequently impact Viad’s future results of operations. See Note 2 of Notes to Consolidated Financial Statements.
Impact of Recent Accounting Pronouncements:
For a description of recently issued accounting pronouncements, including the expected dates of adoption and estimated effects, if any, on Viad’s consolidated financial statements, see Note 1 of Notes to Consolidated Financial Statements.
Forward-Looking Statements:
As provided by the safe harbor provision under the Private Securities Litigation Reform Act of 1995, Viad cautions readers that, in addition to historical information contained herein, this Annual Report includes certain information, assumptions and discussions that may constitute forward-looking statements. These forward-looking statements are not historical facts, but reflect current estimates, projections, expectations, or trends concerning future growth, operating cash flows, availability of short-term borrowings, consumer demand, new or renewal business, investment policies, productivity improvements, ongoing cost reduction efforts, efficiency, competitiveness, legal expenses, tax rates and other tax matters, foreign exchange rates and the realization of restructuring cost savings. Actual results could differ materially from those discussed in the forward-looking statements. Viad’s businesses can be affected by a host of risks and uncertainties. Among other things, natural disasters, gains and losses of customers, consumer demand patterns, labor relations, purchasing decisions related to customer demand for exhibition and event services, existing and new competition, industry alliances, consolidation and growth patterns within the industries in which Viad competes, acquisitions, capital allocations, adverse developments in liabilities associated with discontinued operations and any deterioration in the economy and other risks discussed in Item 1A., “Risk Factors,” included in this Annual Report, may individually or in combination impact future results. In addition to factors mentioned elsewhere, economic, competitive, governmental, technological, capital marketplace and other factors,

36
including terrorist activities or war, a pandemic health crisis and international conditions, could affect the forward-looking statements in this Annual Report.
Item 7A. Quantitative and Qualitative Disclosures About Market Risk.
Viad’s market risk exposures relate to fluctuations in foreign exchange rates, interest rates and certain commodity prices. Foreign exchange risk is the risk that fluctuating exchange rates will adversely affect Viad’s financial condition or results of operations. Interest rate risk is the risk that changing interest rates will adversely affect the earnings of Viad. Commodity risk is the risk that changing prices will adversely affect results of operations.
Viad conducts its foreign operations primarily in Canada, the United Kingdom, Germany and to a lesser extent in certain other countries. The functional currency of Viad’s foreign subsidiaries is their local currency. Accordingly, for purposes of consolidation, Viad translates the assets and liabilities of its foreign subsidiaries into U.S. dollars at the foreign exchange rates in effect at the balance sheet date. The unrealized gains or losses resulting from the translation of these foreign denominated assets and liabilities are included as a component of accumulated other comprehensive income in Viad’s consolidated balance sheets. As a result, significant fluctuations in foreign exchange rates relative to the U.S. dollar may result in material changes to Viad’s net equity position reported in its consolidated balance sheets. Viad does not currently hedge its equity risk arising from the translation of foreign denominated assets and liabilities. Viad had cumulative unrealized foreign currency translation gains recorded in stockholders’ equity of $30.8 million and $42.2 million as of December 31, 2013 and 2012, respectively. During 2013 and 2012, an unrealized foreign currency translation loss of $11.3 million and a gain of $7.5 million, respectively, were recorded in other comprehensive income.
In addition, for purposes of consolidation, the revenues, expenses, gains and losses related to Viad’s foreign operations are translated into U.S. dollars at the average foreign exchange rates for the period. As a result, Viad’s consolidated results of operations are exposed to fluctuations in foreign exchange rates as the operating results of its foreign operations, when translated, may vary from period-to-period, even when the functional currency amounts have not changed. Such fluctuations may adversely impact overall expected profitability and historical period-to-period comparisons. Viad does not currently hedge its net earnings exposure arising from the translation of its foreign operating results.
The following table summarizes the effect of foreign exchange rate variances on segment operating results from Viad’s significant international operations:
Weighted-Average
Exchange Rates Effect of RateVariance
(thousands)
Weighted-Average Exchange Rates Effect of Rate
Variance (thousands) 2013 2012 2012 2011
Canadian Operations: Marketing & Events Group $ 0.99 $ 1.04 $ (65) $ 1.04 $ 1.00 $ 19Travel & Recreation Group $ 0.96 $ 1.00 $ (790) $ 1.00 $ 1.03 $ (726)
United Kingdom Operations: Marketing & Events Group $ 1.57 $ 1.60 $ (138) $ 1.60 $ 1.61 $ (72)
German Operations: Marketing & Events Group $ 1.33 $ 1.27 $ (37) $ 1.27 $ 1.43 $ (107)
As the Canadian operations generated aggregate operating income in 2013, Viad’s segment operating income has been unfavorably impacted by $855,000 from the strengthening of the Canadian dollar relative to the U.S. dollar. A hypothetical change of 10 percent in the Canadian exchange rate would have resulted in a change to operating income of approximately $2.0 million. As the United Kingdom operations generated aggregate operating income in 2013, Viad’s segment operating income has been unfavorably impacted by $138,000 from the strengthening of the British pound relative to the U.S. dollar. A hypothetical change of 10 percent in the British pound exchange rate would have resulted in a change to operating income of approximately $828,000. As the German operations generated aggregate operating income in 2013, Viad’s segment operating income has been unfavorably impacted by $37,000 from the strengthening of the Euro relative to the U.S. dollar. A hypothetical change of 10 percent in the Euro would have resulted in a change to operating income of approximately $126,000.
Viad is exposed to foreign exchange transaction risk as its foreign subsidiaries have certain revenue transactions denominated in currencies other than the functional currency of the respective subsidiary. From time to time, Viad utilizes forward contracts to mitigate the impact on earnings related to these transactions due to fluctuations in foreign exchange rates. As of December 31, 2013 and 2012, Viad did not have any significant foreign currency forward contracts outstanding.

37
Viad is exposed to short-term interest rate risk on certain of its debt obligations. Viad currently does not use derivative financial instruments to hedge cash flows for such obligations.
Viad’s subsidiaries have exposure to changing fuel prices. Periodically, Brewster enters into futures contracts with an oil company to purchase two types of fuel and specifies the monthly total volume, by fuel product, to be purchased over the agreed upon term of the contract, which is generally no longer than one year. The main objective of Viad’s risk policy related to changing fuel prices is to reduce transaction exposure in order to mitigate the cash flow risk and protect profit margins. There were no fuel contracts outstanding as of December 31, 2013 or 2012.
Item 8. Financial Statements and Supplementary Data.
Refer to Index to Financial Statements for required information.
Item 9. Changes in and Disagreements With Accountants on Accounting and Financial Disclosure.
None.
Item 9A. Controls and Procedures.
Under the supervision and with the participation of management, including the Chief Executive Officer and Chief Financial Officer of Viad, the effectiveness of the design and operation of disclosure controls and procedures has been evaluated as of December 31, 2013, and, based on that evaluation, the Chief Executive Officer and Chief Financial Officer have concluded that these disclosure controls and procedures are effective as of December 31, 2013. Disclosure controls and procedures are designed to ensure that information required to be disclosed in the reports filed or submitted under the Securities Exchange Act of 1934 is recorded, processed, summarized and reported, within the time periods specified in the SEC’s rules and forms. Disclosure controls and procedures include, without limitation, controls and procedures designed to ensure that information required to be disclosed in such reports is accumulated and communicated to management, including the Chief Executive Officer and Chief Financial Officer, as appropriate to allow for timely decisions regarding required disclosure.
There were no changes in the Company’s internal control over financial reporting during the fourth quarter of 2013 that have materially affected, or are reasonably likely to materially affect, internal control over financial reporting.
Management’s report on internal control over financial reporting and the report of Viad’s independent registered public accounting firm, Deloitte & Touche LLP, are provided in this Annual Report immediately prior to the Index to Financial Statements.
Item 9B. Other Information.
None.

38
PART III
Item 10. Directors, Executive Officers and Corporate Governance.
Information regarding directors of Viad, director nomination procedures, the Audit Committee of Viad’s Board of Directors and compliance with Section 16(a) of the Securities Exchange Act of 1934, as amended, are included in the Proxy Statement for the Annual Meeting of Shareholders of Viad to be held on May 22, 2014, under the captions “Election of Directors,” “Board of Directors and Corporate Governance” and “Information on Stock Ownership,” and are incorporated herein by reference. Information regarding executive officers of Viad is located in Part I, “Other - Executive Officers of Registrant” of this Annual Report.
Viad has adopted a Code of Ethics for all directors, officers and employees of the Company and its subsidiaries. A copy of the Company’s Code of Ethics is available at Viad’s website at www.viad.com/pdf/corpgovernance/CodeofEthics.pdf and is also available without charge to any shareholder upon request by writing to: Viad Corp, 1850 North Central Avenue, Suite 1900, Phoenix, Arizona 85004-4565, Attention: Corporate Secretary.
Item 11. Executive Compensation.
Information regarding executive compensation is contained in the Proxy Statement for the Annual Meeting of Shareholders of Viad to be held on May 22, 2014, under the captions “Compensation Discussion and Analysis,” “Board of Directors and Corporate Governance” and “Executive Compensation,” and is incorporated herein by reference.
Item 12. Security Ownership of Certain Beneficial Owners and Management and Related Stockholder Matters.
Information regarding security ownership of certain beneficial owners and management and information regarding securities authorized for issuance under equity compensation plans are contained in the Proxy Statement for the Annual Meeting of Shareholders of Viad to be held on May 22, 2014, under the captions “Executive Compensation” and “Information on Stock Ownership,” and is incorporated herein by reference.
Item 13. Certain Relationships and Related Transactions, and Director Independence.
Information regarding director independence, and certain relationships and related transactions, is contained in the Proxy Statement for the Annual Meeting of Shareholders of Viad to be held on May 22, 2014, under the caption “Board of Directors and Corporate Governance,” and is incorporated herein by reference.
Item 14. Principal Accounting Fees and Services.
Information regarding principal accounting fees and services and the pre-approval policies and procedures for such fees and services, as adopted by the Audit Committee of the Board of Directors, is contained in the Proxy Statement for the Annual Meeting of Shareholders of Viad to be held on May 22, 2014, under the caption “Ratification of the Appointment of Deloitte & Touche LLP as Viad’s Independent Public Accountants for 2014” and is incorporated herein by reference.
PART IV
Item 15. Exhibits, Financial Statement Schedules.
(a) 1. The financial statements listed in the accompanying Index to Financial Statements are filed as part of this Annual Report.
2. The exhibits listed in the accompanying Exhibit Index are filed as part of this Annual Report.
(b) Exhibits
See Exhibit Index.
(c) Financial Statement Schedules
Schedule II – Valuation and Qualifying Accounts.

39
SIGNATURES
Pursuant to the requirements of Section 13 or 15(d) of the Securities Exchange Act of 1934, the registrant has duly caused this Annual Report to be signed on its behalf by the undersigned, thereunto duly authorized, in Phoenix, Arizona, on March 7, 2014. VIAD CORP
By: /s/ Paul B. Dykstra
Paul B. Dykstra Chairman of the Board, President and
Chief Executive Officer
Pursuant to the requirements of the Securities Exchange Act of 1934, this Annual Report has been signed below by the following persons on behalf of Viad Corp and in the capacities and on the dates indicated: Principal Executive Officer
Date: March 7, 2014 By: /s/ Paul B. Dykstra
Paul B. Dykstra
Chairman of the Board, President and Chief Executive Officer
Principal Financial Officer
Date: March 7, 2014 By: /s/ Ellen M. Ingersoll
Ellen M. Ingersoll
Chief Financial Officer
Principal Accounting Officer
Date: March 7, 2014 By: /s/ G. Michael Latta
G. Michael Latta
Chief Accounting Officer—Controller
Directors
Andrew B. Benett Daniel Boggan Jr. Isabella Cunningham Richard H. Dozer Edward E. Mace Robert E. Munzenrider Margaret E. Pederson Albert M. Teplin
Date: March 7, 2014 By: /s/ Ellen M. Ingersoll
Ellen M. Ingersoll
Attorney-in-Fact
40
MANAGEMENT’S REPORT ON INTERNAL CONTROL OVER FINANCIAL REPORTING
The management of Viad Corp (“Viad” or the “Company”) is responsible for establishing and maintaining adequate internal control over financial reporting. Internal control over financial reporting is defined in Rule 13a-15(f) or 15d-15(f) promulgated under the Securities Exchange Act of 1934 as a process designed by, or under the supervision of, the Company’s principal executive and principal financial officers and effected by the Company’s board of directors, management and other personnel, to provide reasonable assurance regarding the reliability of financial reporting and the preparation of financial statements for external purposes in accordance with accounting principles generally accepted in the United States of America and includes those policies and procedures that:
• Pertain to the maintenance of records that in reasonable detail accurately and fairly reflect the transactions and dispositions of the assets of the Company;
• Provide reasonable assurance that transactions are recorded as necessary to permit preparation of financial statements in accordance with accounting principles generally accepted in the United States of America, and that receipts and expenditures of the Company are being made only in accordance with authorizations of management and directors of the Company; and
• Provide reasonable assurance regarding prevention or timely detection of unauthorized acquisition, use or disposition of the Company’s assets that could have a material effect on the financial statements.
Because of its inherent limitations, internal control over financial reporting may not prevent or detect misstatements. Projections of any evaluation of effectiveness to future periods are subject to the risk that controls may become inadequate because of changes in conditions, or that the degree of compliance with the policies or procedures may deteriorate. All internal control systems, no matter how well designed, have inherent limitations. Therefore, even those systems determined to be effective can provide only reasonable assurance with respect to financial statement preparation and presentation. Because of the inherent limitations of internal control, there is a risk that material misstatements may not be prevented or detected on a timely basis by internal control over financial reporting. However, these inherent limitations are known features of the financial reporting process. Therefore, it is possible to design into the process safeguards to reduce, though not eliminate, this risk.
Management performed an assessment of the effectiveness of Viad’s internal control over financial reporting using the criteria described in the “Internal Control - Integrated Framework (1992),” issued by the Committee of Sponsoring Organizations of the Treadway Commission. The objective of this assessment was to determine whether Viad’s internal control over financial reporting was effective as of December 31, 2013.
Based on its assessment, management concluded that, as of December 31, 2013, Viad’s internal control over financial reporting is effective based on those criteria.
Viad’s independent registered public accounting firm, Deloitte & Touche LLP, has issued a report relating to its audit of the effectiveness of Viad’s internal control over financial reporting, which appears on the following page of this Annual Report.

41
REPORT OF INDEPENDENT REGISTERED PUBLIC ACCOUNTING FIRM
Board of Directors and Stockholders of Viad Corp Phoenix, Arizona
We have audited the internal control over financial reporting of Viad Corp and subsidiaries (the “Company”) as of December 31, 2013, based on criteria established in Internal Control-Integrated Framework (1992) issued by the Committee of Sponsoring Organizations of the Treadway Commission. The Company’s management is responsible for maintaining effective internal control over financial reporting and for its assessment of the effectiveness of internal control over financial reporting, included in the accompanying Management’s Report on Internal Control over Financial Reporting. Our responsibility is to express an opinion on the Company’s internal control over financial reporting based on our audit.
We conducted our audit in accordance with the standards of the Public Company Accounting Oversight Board (United States). Those standards require that we plan and perform the audit to obtain reasonable assurance about whether effective internal control over financial reporting was maintained in all material respects. Our audit included obtaining an understanding of internal control over financial reporting, assessing the risk that a material weakness exists, testing and evaluating the design and operating effectiveness of internal control based on the assessed risk, and performing such other procedures as we considered necessary in the circumstances. We believe that our audit provides a reasonable basis for our opinion.
A company’s internal control over financial reporting is a process designed by, or under the supervision of, the company’s principal executive and principal financial officers, or persons performing similar functions, and effected by the company’s board of directors, management, and other personnel to provide reasonable assurance regarding the reliability of financial reporting and the preparation of financial statements for external purposes in accordance with generally accepted accounting principles. A company’s internal control over financial reporting includes those policies and procedures that (1) pertain to the maintenance of records that, in reasonable detail, accurately and fairly reflect the transactions and dispositions of the assets of the company; (2) provide reasonable assurance that transactions are recorded as necessary to permit preparation of financial statements in accordance with generally accepted accounting principles, and that receipts and expenditures of the company are being made only in accordance with authorizations of management and directors of the company; and (3) provide reasonable assurance regarding prevention or timely detection of unauthorized acquisition, use, or disposition of the company’s assets that could have a material effect on the financial statements.
Because of the inherent limitations of internal control over financial reporting, including the possibility of collusion or improper management override of controls, material misstatements due to error or fraud may not be prevented or detected on a timely basis. Also, projections of any evaluation of the effectiveness of the internal control over financial reporting to future periods are subject to the risk that the controls may become inadequate because of changes in conditions, or that the degree of compliance with the policies or procedures may deteriorate.
In our opinion, the Company maintained, in all material respects, effective internal control over financial reporting as of December 31, 2013, based on the criteria established in Internal Control - Integrated Framework (1992) issued by the Committee of Sponsoring Organizations of the Treadway Commission.
We have also audited, in accordance with the standards of the Public Company Accounting Oversight Board (United States), the consolidated financial statements and financial statement schedule as of and for the year ended December 31, 2013 of the Company and our report dated March 7, 2014 expressed an unqualified opinion on those consolidated financial statements and financial statement schedule. /s/ DELOITTE & TOUCHE LLP
Deloitte & Touche LLP Phoenix, Arizona
March 7, 2014

42
INDEX TO FINANCIAL STATEMENTS
Page Consolidated Balance Sheets ............................................................................................................................................... F-1Consolidated Statements of Operations ............................................................................................................................... F-2Consolidated Statements of Comprehensive Income .......................................................................................................... F-3Consolidated Statements of Stockholders’ Equity............................................................................................................... F-4Consolidated Statements of Cash Flows ............................................................................................................................. F-5Notes to Consolidated Financial Statements ....................................................................................................................... F-6Report of Independent Registered Public Accounting Firm................................................................................................ F-40Schedule II – Valuation and Qualifying Accounts............................................................................................................... F-41

F-1
VIAD CORP CONSOLIDATED BALANCE SHEETS
December 31,
(in thousands, except share data) 2013 2012 Assets
Current assets Cash and cash equivalents $ 45,821 $ 114,171Accounts receivable, net of allowance for doubtful accounts of $877 and $1,150,respectively 61,197
62,756
Inventories 27,993 35,656Deferred income taxes 20,577 26,301Other current assets 17,142 15,534
Total current assets 172,730 254,418Property and equipment, net 190,330 197,298Other investments and assets 35,026 32,416Deferred income taxes 29,823 26,104Goodwill 129,543 137,820Other intangible assets, net 4,480 2,521Total Assets $ 561,932 $ 650,577
Liabilities and Stockholders’ EquityCurrent liabilities
Accounts payable $ 40,941 $ 57,995Other current liabilities 73,489 107,684Current portion of long-term debt and capital lease obligations 10,903 1,347
Total current liabilities 125,333 167,026Long-term capital lease obligations 765 879Pension and postretirement benefits 30,672 37,812Other deferred items and liabilities 48,619 47,828Total liabilities 205,389 253,545Commitments and contingencies Stockholders’ equity Viad Corp stockholders’ equity:
Common stock, $1.50 par value, 200,000,000 shares authorized, 24,934,981 shares issued 37,402
37,402
Additional capital 590,862 593,862Retained deficit (50,393 ) (13,034)Unearned employee benefits and other (21 ) (1,301)Accumulated other comprehensive income (loss):
Unrealized gain on investments 429 275Cumulative foreign currency translation adjustments 30,847 42,158Unrecognized net actuarial loss and prior service credit, net (11,259 ) (14,968)
Common stock in treasury, at cost, 4,618,433 and 4,694,468 shares, respectively (250,426 ) (256,333)Total Viad Corp stockholders’ equity 347,441 388,061Noncontrolling interest 9,102 8,971Total stockholders’ equity 356,543 397,032Total Liabilities and Stockholders’ Equity $ 561,932 $ 650,577

F-2
VIAD CORP CONSOLIDATED STATEMENTS OF OPERATIONS
Year Ended December 31,
(in thousands, except per share data) 2013 2012 2011 Revenues:
Exhibition and event services $ 685,350 $ 726,429 $ 670,054Exhibits and environments 159,554 175,611 170,496Travel and recreation services 127,888 123,191 101,814
Total revenues 972,792 1,025,231 942,364Costs and expenses:
Costs of services 773,931 818,837 752,679Costs of products sold 157,745 164,532 164,309Gain on sale of facility and related land (4,775) — —Corporate activities 6,755 9,408 7,682Interest income (550) (593 ) (779)Interest expense 1,234 1,303 1,511Restructuring charges 3,891 4,942 3,782Goodwill impairment charge 4,461 — —Other impairment charges 952 — —
Total costs and expenses 943,644 998,429 929,184Income from continuing operations before income taxes 29,148 26,802 13,180Income tax expense 8,590 20,843 3,888Income from continuing operations 20,558 5,959 9,292Income from discontinued operations 1,128 624 451Net income 21,686 6,583 9,743Net income attributable to noncontrolling interest (131) (686 ) (533)Net income attributable to Viad $ 21,555 $ 5,897 $ 9,210Diluted income per common share: Continuing operations attributable to Viad common stockholders $ 1.01 $ 0.26 $ 0.43Discontinued operations attributable to Viad common stockholders 0.05 0.03 0.02Net income attributable to Viad common stockholders $ 1.06 $ 0.29 $ 0.45Weighted-average outstanding and potentially dilutive common shares 20,265 20,005 20,055Basic income per common share: Continuing operations attributable to Viad common stockholders $ 1.01 $ 0.26 $ 0.43Discontinued operations attributable to Viad common stockholders 0.05 0.03 0.02Net income attributable to Viad common stockholders $ 1.06 $ 0.29 $ 0.45Weighted-average outstanding common shares 19,850 19,701 19,719Dividends declared per common share $ 2.90 $ 0.28 $ 0.16Amounts attributable to Viad common stockholders Income from continuing operations $ 20,427 $ 5,273 $ 8,759Income from discontinued operations 1,128 624 451Net income $ 21,555 $ 5,897 $ 9,210
See Notes to Consolidated Financial Statements.
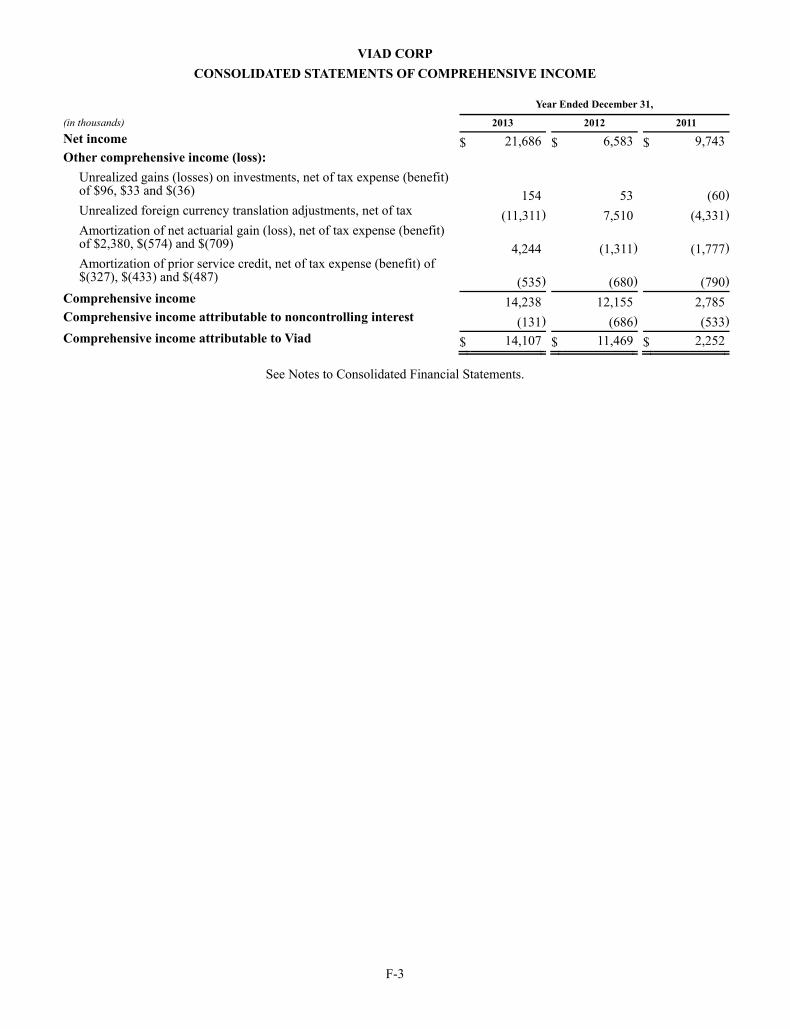
F-3
VIAD CORP CONSOLIDATED STATEMENTS OF COMPREHENSIVE INCOME
Year Ended December 31,
(in thousands) 2013 2012 2011 Net income $ 21,686 $ 6,583 $ 9,743Other comprehensive income (loss):
Unrealized gains (losses) on investments, net of tax expense (benefit) of $96, $33 and $(36) 154 53
(60)
Unrealized foreign currency translation adjustments, net of tax (11,311) 7,510 (4,331)Amortization of net actuarial gain (loss), net of tax expense (benefit) of $2,380, $(574) and $(709) 4,244 (1,311 ) (1,777)Amortization of prior service credit, net of tax expense (benefit) of $(327), $(433) and $(487) (535) (680 ) (790)
Comprehensive income 14,238 12,155 2,785Comprehensive income attributable to noncontrolling interest (131) (686 ) (533)Comprehensive income attributable to Viad $ 14,107 $ 11,469 $ 2,252
See Notes to Consolidated Financial Statements.

F-4
VIAD CORP CONSOLIDATED STATEMENTS OF STOCKHOLDERS’ EQUITY
(in thousands) Common
Stock Additional Capital
Retained Deficit
Unearned Employee Benefits
and Other
Accumulated Other
Comprehensive Income
Common Stock in Treasury
Total Viad
Equity Non-
ControllingInterest
Total Stockholders’
Equity
Balance, January 1, 2011 $ 37,402 $ 606,902 $ (19,229) $ (4,433) $ 28,851 $ (270,534) $ 378,959 $ 7,752 $ 386,711Net income — — 9,210 — — — 9,210 533 9,743Dividends on common stock — — (3,241) — — — (3,241 ) — (3,241)Common stock purchased for treasury — — — — — (5,230) (5,230 ) — (5,230)Employee benefit plans — (11,086) — — — 11,381 295 — 295ESOP allocation adjustment — — — 1,490 — — 1,490 — 1,490Share-based compensation—equity awards —
3,688 — — — —
3,688
— 3,688
Tax deficiencies from share-based compensation —
(325) — — — —
(325 ) — (325)
Unrealized foreign currency translation adjustment —
— — — (4,331) —
(4,331 ) — (4,331)
Unrealized loss on investments — — — — (60) — (60 ) — (60)Amortization of prior service credit — — — — (790) — (790 ) — (790)Amortization of net actuarial loss — — — — (1,777) — (1,777 ) — (1,777)Other, net — 9 4 (8) — 1 6 — 6Balance, December 31, 2011 37,402 599,188 (13,256) (2,951) 21,893 (264,382) 377,894 8,285 386,179Net income — — 5,897 — — — 5,897 686 6,583Dividends on common stock — — (5,674) — — — (5,674 ) — (5,674)Common stock purchased for treasury — — — — — (1,656) (1,656 ) — (1,656)Employee benefit plans — (9,456) — — — 9,704 248 — 248ESOP allocation adjustment — — — 1,647 — — 1,647 — 1,647Share-based compensation—equity awards —
4,036 — — — —
4,036
— 4,036
Tax benefits from share-based compensation —
96 — — — —
96
— 96
Unrealized foreign currency translation adjustment —
— — — 7,510 —
7,510
— 7,510
Unrealized gain on investments — — — — 53 — 53 — 53Amortization of net actuarial loss — — — — (1,311) — (1,311 ) — (1,311)Amortization of prior service credit — — — — (680) — (680 ) — (680)Other, net — (2) (1) 3 — 1 1 — 1Balance, December 31, 2012 37,402 593,862 (13,034) (1,301) 27,465 (256,333) 388,061 8,971 397,032Net income — — 21,555 — — — 21,555 131 21,686Dividends on common stock — — (58,914) — — — (58,914 ) — (58,914)Common stock purchased for treasury — — — — — (1,328) (1,328 ) — (1,328)Employee benefit plans — (6,456) — — — 7,234 778 — 778ESOP allocation adjustment — — — 1,280 — — 1,280 — 1,280Share-based compensation—equity awards —
3,053 — — — —
3,053
— 3,053
Tax benefits from share-based compensation —
404 — — — —
404
— 404
Unrealized foreign currency translation adjustment —
— — — (11,311) —
(11,311 ) — (11,311)
Unrealized gain on investments — — — — 154 — 154 — 154Amortization of net actuarial loss — — — — 4,244 — 4,244 — 4,244Amortization of prior service credit — — — — (535) — (535 ) — (535)Other, net — (1) — — 1 — — —Balance, December 31, 2013 $ 37,402 $ 590,862 $ (50,393) $ (21) $ 20,017 $ (250,426) $ 347,441 $ 9,102 $ 356,543
See Notes to Consolidated Financial Statements.

F-5
VIAD CORP CONSOLIDATED STATEMENTS OF CASH FLOWS
Year Ended December 31,(in thousands) 2013 2012 2011
Cash flows from operating activities Net income $ 21,686 $ 6,583 $ 9,743Adjustments to reconcile net income to net cash provided by operating activities:
Depreciation and amortization 28,615 30,731 29,126Deferred income taxes 1,404 11,274 (924)Income from discontinued operations (1,128) (624 ) (451)Restructuring charges 3,891 4,942 3,782Impairment charges 5,413 — —Gain on sale of facility and related land (4,775) — —Gains on dispositions of property and other assets (265) (206 ) (42)Share-based compensation expense 5,221 7,232 4,413Excess tax benefit from share-based compensation arrangements (422) (293 ) (54)Other non-cash items, net 4,870 10,157 4,659Change in operating assets and liabilities (excluding the impact of acquisitions):
Receivables 1,246 142 (18,092)Inventories 7,663 195 3,729Accounts payable (15,436) 4,310 4,372Restructuring liabilities (4,841) (4,694 ) (3,888)Accrued compensation (11,707) 1,631 4,563Customer deposits (20,965) 926 4,950Income taxes payable 218 467 (2,694)Other assets and liabilities, net (14,633) (3,587 ) (8,456)
Net cash provided by operating activities 6,055 69,186 34,736Cash flows from investing activities
Capital expenditures (36,119) (27,675 ) (21,538)Acquisition of businesses, net of cash acquired (647) (23,546 ) (41,105)Proceeds from sale of facility and related land 12,696 — —Proceeds from sale of land—discontinued operations 1,645 1,041 —Proceeds from dispositions of property and other assets 464 322 440Proceeds from sale of short-term investments — 384 —
Net cash used in investing activities (21,961) (49,474 ) (62,203)Cash flows from financing activities
Payments on debt and capital lease obligations (11,362) (2,685 ) (7,375)Proceeds from borrowings 20,000 — —Dividends paid on common stock (58,914) (4,454 ) (3,241)Common stock purchased for treasury (1,328) (1,656 ) (5,230)Debt issuance costs — — (1,001)Excess tax benefit from share-based compensation arrangements 422 293 54Proceeds from exercise of stock options 777 248 296
Net cash used in financing activities (50,405) (8,254 ) (16,497)Effect of exchange rate changes on cash and cash equivalents (2,039) 2,337 (1,501)Net change in cash and cash equivalents (68,350) 13,795 (45,465)Cash and cash equivalents, beginning of year 114,171 100,376 145,841Cash and cash equivalents, end of year $ 45,821 $ 114,171 $ 100,376Supplemental disclosure of cash flow information
Cash paid for income taxes $ 8,498 $ 8,386 $ 10,213Cash paid for interest $ 1,006 $ 1,103 $ 1,088Property and equipment acquired under capital leases $ 832 $ 1,011 $ 1,327Property and equipment purchases in accounts payable and accrued liabilities $ 3,204 $ 4,822
$ 2,585
See Notes to Consolidated Financial Statements.

F-6
VIAD CORP
NOTES TO CONSOLIDATED FINANCIAL STATEMENTS
Note 1. Summary of Significant Accounting Policies
Basis of Presentation and Principles of Consolidation
The consolidated financial statements of Viad Corp (“Viad” or the “Company”) are prepared in conformity with accounting principles generally accepted in the United States of America (“GAAP”) and include the accounts of Viad and all of its subsidiaries. All intercompany account balances and transactions between Viad and its subsidiaries have been eliminated in consolidation.
Nature of Business
Viad’s reportable segments consist of Marketing & Events U.S., Marketing & Events International and Travel & Recreation Group.
Marketing & Events Group
The Marketing & Events Group, comprised of Global Experience Specialists, Inc. and affiliates (“GES”), specializes in all aspects of the design, planning and production of face-to-face events, immersive environments and brand-based experiences for clients, including show organizers, corporate brand marketers and retail shopping centers. In addition, the Marketing & Events Group provides a variety of immersive, entertaining attractions and brand-based experiences, sponsored events, mobile marketing and other branded entertainment and face-to-face marketing solutions for clients and venues, including shopping malls, movie studios, museums and leading consumer brands.
Travel & Recreation Group
The Travel & Recreation Group segment consists of Brewster Inc. (“Brewster”), Glacier Park, Inc. (“Glacier Park”) and Alaskan Park Properties, Inc. (“Alaska Denali Travel”). Brewster provides tourism services in the Canadian Rockies in Alberta and in other parts of Western Canada. Brewster’s operations include the Banff Gondola, Columbia Icefield Glacier Adventure, motorcoach services, charter and sightseeing services, tour boat operations, inbound package tour operations and hotel operations. During 2013, Glacier Park, an 80 percent owned subsidiary of Viad, operated five lodges, three motor inns and one four-season resort hotel and provided food and beverage operations, retail operations and tour and transportation services in and around Glacier National Park in Montana and Waterton Lake National Park in Alberta, Canada. As discussed in Note 7 below, Glacier Park’s concession portion of its business with the U.S. National Park Service (the “Park Service”) for Glacier National Park expired on December 31, 2013. Thereafter, the ongoing operations of Glacier Park will include: Glacier Park Lodge in East Glacier, Montana; Grouse Mountain Lodge in Whitefish, Montana; St. Mary Lodge in St. Mary, Montana; Motel Lake McDonald, an in-holding within Glacier National Park and the Prince of Wales Hotel in Waterton Lakes National Park, Alberta, Canada. Alaska Denali Travel operates Denali Backcountry Lodge and Denali Cabins. In addition to lodging, Alaska Denali Travel also provides food and beverage operations and package tour and transportation services in and around Denali National Park and Preserve.
Significant Accounting Policies
Use of Estimates. The preparation of financial statements in conformity with GAAP requires management to make estimates and assumptions that affect the amounts reported in the consolidated financial statements and accompanying notes. These estimates and assumptions include, but are not limited to:
• Fair value of Viad’s reporting units used to perform annual impairment testing of recorded goodwill; • Allowances for uncollectible accounts receivable; • Provisions for income taxes, including uncertain tax positions; • Valuation allowances related to deferred tax assets; • Liabilities for losses related to self-insured liability claims; • Liabilities for losses related to environmental remediation obligations; • Sublease income associated with restructuring liabilities; • Assumptions used to measure pension and postretirement benefit costs and obligations; • Assumptions used to determine share-based compensation costs under the fair value method and • Allocation of purchase price of acquired businesses.
Actual results could differ from these and other estimates.

F-7
Cash and Cash Equivalents. Viad considers all highly-liquid investments with remaining maturities when purchased of three months or less to be cash equivalents. Viad’s cash and cash equivalents consist of cash and bank demand deposits, bank time deposits and money market mutual funds. The Company’s investments in money market mutual funds are classified as available-for-sale and carried at fair value.
Inventories. Inventories, which consist primarily of exhibit design and construction materials and supplies used in providing convention show services, are stated at the lower of cost (first-in, first-out and specific identification methods) or market.
Property and Equipment. Property and equipment are stated at cost, net of accumulated depreciation. Property and equipment are depreciated using the straight-line method over the estimated useful lives of the assets: buildings, 15 to 40 years; equipment, 3 to 12 years; and leasehold improvements, over the shorter of the lease term or useful life. Property and equipment are tested for potential impairment whenever events or changes in circumstances indicate that the carrying amount of the long-lived asset may not be recoverable through undiscounted cash flows.
Capitalized Software. Viad capitalizes certain internal and external costs incurred in developing or obtaining internal use software. Capitalized costs principally relate to costs incurred to purchase software from third parties, external direct costs of materials and services, and certain payroll-related costs for employees directly associated with software projects once application development begins. Costs associated with preliminary project activities, training and other post-implementation activities are expensed as incurred. Capitalized software costs are amortized using the straight-line method over the estimated useful lives of the software, ranging from three to ten years. These costs are included in the consolidated balance sheets under the caption “Property and equipment, net.”
Goodwill. Goodwill is tested for impairment at the reporting unit level on an annual basis on October 31 of each year. Goodwill is also tested for impairment between annual tests if an event occurs or circumstances change that would more-likely-than-not reduce the fair value of a reporting unit below its carrying amount. Viad uses a discounted expected future cash flow methodology (income approach) in order to estimate the fair value of its reporting units for purposes of goodwill impairment testing. The estimates and assumptions regarding expected future cash flows, discount rates and terminal values require considerable judgment and are based on market conditions, financial forecasts, industry trends and historical experience. These estimates, however, have inherent uncertainties and different assumptions could lead to materially different results.
Cash Surrender Value of Life Insurance. Viad has Company-owned life insurance contracts which are intended to fund the cost of certain employee compensation and benefit programs. These contracts are carried at cash surrender value, net of outstanding policy loans. The cash surrender value represents the amount of cash the Company could receive if the policies were discontinued before maturity. The changes in the cash surrender value of the policies, net of insurance premiums, are included as a component of “Costs of Services” in the consolidated statements of operations.
Self-Insurance Liabilities. Viad is self-insured up to certain limits for workers’ compensation, automobile, product and general liability, property loss and medical claims. Viad has also retained certain liabilities related to workers’ compensation and general liability insurance claims in conjunction with previously sold operations. Provisions for losses for claims incurred, including estimated claims incurred but not yet reported, are made based on Viad’s prior historical experience, claims frequency and other factors. Viad has purchased insurance for amounts in excess of the self-insured levels.
Environmental Remediation Liabilities. Viad has retained certain liabilities representing the estimated cost of environmental remediation obligations primarily associated with previously sold operations. The amounts accrued primarily consist of the estimated direct incremental costs, on an undiscounted basis, for contractor and other services related to remedial actions and post-remediation site monitoring. Environmental remediation liabilities are recorded when the specific obligation is considered probable and the costs are reasonably estimable. Subsequent recoveries from third parties, if any, are recorded through discontinued operations when realized.
Fair Value of Financial Instruments. The carrying values of cash and cash equivalents, receivables and accounts payable approximate fair value due to the short-term maturities of these instruments. The estimated fair value of debt obligations is disclosed in Note 9.
Foreign Currency Translation. Viad conducts its foreign operations primarily in Canada, the United Kingdom, Germany and to a lesser extent in certain other countries. The functional currency of Viad’s foreign subsidiaries is their local currency. Accordingly, for purposes of consolidation, Viad translates the assets and liabilities of its foreign subsidiaries into U.S. dollars at the foreign exchange rates in effect at the balance sheet date. The unrealized gains or losses resulting from the

F-8
translation of these foreign denominated assets and liabilities are included as a component of accumulated other comprehensive income in Viad’s consolidated balance sheets. In addition, for purposes of consolidation, the revenues, expenses and gains and losses related to Viad’s foreign operations are translated into U.S. dollars at the average foreign exchange rates for the period.
Revenue Recognition. Viad recognizes revenue when persuasive evidence of an arrangement exists, delivery has occurred or services have been rendered, the sales price is fixed or determinable and collectability is reasonably assured. GES derives revenues primarily by providing show services to exhibitors participating in exhibitions and events and from the design, construction and refurbishment of exhibit booths and holiday themed environments. Service revenue is recognized at the time services are performed. Exhibits and environments revenue is accounted for using the completed-contract method as contracts are typically completed within 3 months of contract signing. The Travel & Recreation Group generates revenues through its attractions, hotels and transportation and sightseeing services. Revenues are recognized at the time services are performed.
Share-Based Compensation. Viad recognizes and measures compensation costs related to all share-based payment awards using the fair value method of accounting. These awards generally include restricted stock, performance-based restricted stock (“PBRS”), stock options and liability-based awards (including performance units, restricted stock units and performance-based restricted stock units). These awards contain forfeiture and non-compete provisions.
The fair value of restricted stock and PBRS awards are based on Viad’s stock price on the date of grant. Viad issues restricted stock and PBRS awards from shares held in treasury. Future vesting of restricted stock and PBRS is generally subject to continued employment with Viad or its subsidiaries. Holders of restricted stock and PBRS have the right to receive dividends and vote the shares, but may not sell, assign, transfer, pledge or otherwise encumber the stock, except to the extent restrictions have lapsed.
Restricted stock awards vest between three and five years from the date of grant. Share-based compensation expense related to restricted stock is recognized using the straight-line method over the requisite service period of approximately three years except for certain awards with a five-year vesting period whereby expense is recognized based on an accelerated multiple-award approach over a five-year period. For these awards, 40 percent of the shares vest on the third anniversary of the grant and the remaining shares vest in 30 percent increments over the subsequent two anniversary dates.
Liability-based awards (including restricted stock units and PBRS units awarded to key employees at certain of the Company’s Canadian operations) are recorded at estimated fair value, based on the number of units expected to vest and the level of achievement of predefined performance goals (where applicable) and are remeasured on each balance sheet date based on Viad’s stock price until the time of settlement. To the extent earned, liability-based awards are settled in cash based on Viad’s stock price. Compensation expense related to liability-based awards is recognized ratably over the requisite service period of approximately three years.
Share-based compensation expense related to PBRS awards is recognized based on an accelerated multiple-award approach over the requisite service period of approximately three years. PBRS vests when certain incentive performance targets established in the year of grant are achieved at target levels. PBRS is subject to a graded vesting schedule whereby one third of the earned shares vest after the first year and the remaining earned shares vest in one-third increments each year over the next two years on the first business day in January.
The fair value of each stock option grant is estimated on the date of grant using the Black-Scholes option pricing model. Share-based compensation expense related to stock option awards is recognized using the straight-line method over the requisite service period of approximately five years. The exercise price of stock options is based on the market value of Viad’s common stock at the date of grant.
Common Stock in Treasury. Common stock purchased for treasury is recorded at historical cost. Subsequent share reissuances are primarily related to share-based compensation programs and recorded at weighted-average cost.
Income Per Common Share. Viad applies the two-class method in calculating income per common share as unvested share-based payment awards that contain nonforfeitable rights to dividends are considered participating securities. Accordingly, such securities are included in the earnings allocation in calculating income per share. Furthermore, Viad funds its matching contributions to employees’ 401(k) accounts through the Company’s leveraged Employee Stock Ownership Plan (“ESOP”) feature of the Company’s 401(k) defined contribution plan. ESOP shares are treated as outstanding for income per share calculations.

F-9
Impact of Recent Accounting Pronouncements
In February 2013, the Financial Accounting Standards Board (“FASB”) issued new guidance related to the reporting of amounts reclassified out of accumulated other comprehensive income, which is codified in Accounting Standards Codification (“ASC”) Topic 220. The new guidance requires entities to provide information about the amounts reclassified out of accumulated other comprehensive income by component. In addition, entities are required to present significant amounts reclassified out of other comprehensive income by the respective line items of net income in certain circumstances, or otherwise cross-reference amounts to other disclosures. The adoption of this new guidance did not have an impact on Viad’s financial condition or results of operations. See Note 14 for required disclosures.
In July 2013, the FASB issued new guidance related to the financial statement presentation of an unrecognized tax benefit when a net operating loss carryforward, a similar tax loss or a tax credit carryforward exists, which is codified in ASC Topic 740. This new guidance is effective prospectively for fiscal years, and interim periods within those years, beginning after December 15, 2013. Retrospective application is permitted. Management does not believe that this guidance will have an impact on Viad’s financial condition or results of operations.
In January 2014, the FASB issued new guidance, which is codified in ASC Topic 853, related to the accounting for service concession arrangements between a public-sector entity grantor and an operating entity under which the operating entity operates the grantor’s infrastructure. The new guidance specifies that an entity should not account for a service concession arrangement that is within its scope as a lease. Furthermore, the guidance also specifies that the infrastructure used in a service concession arrangement should not be recognized as property, plant, and equipment of the operating entity. The guidance is effective for annual periods and interim periods beginning after December 15, 2014. Viad has not yet determined if the adoption of this new guidance will have a material impact on its financial condition or results of operations.
Note 2. Share-Based Compensation
Viad grants share-based compensation awards to officers, directors and certain key employees pursuant to the 2007 Viad Corp Omnibus Incentive Plan (the “2007 Plan”). The 2007 Plan has a 10-year life and provides for the following types of awards: (a) incentive and non-qualified stock options; (b) restricted stock and restricted stock units; (c) performance units or performance shares; (d) stock appreciation rights; (e) cash-based awards and (f) certain other stock-based awards. The number of shares of common stock available for grant under the 2007 Plan is limited to 1.7 million shares plus shares awarded under the 1997 Viad Corp Omnibus Incentive Plan (which terminated in May 2007) (the “1997 Plan”) that subsequently cease for any reason to be subject to such awards (other than by reason of exercise or settlement of the awards to the extent the shares are exercised for, or settled in, vested and non-forfeited shares) up to an aggregate maximum of 1.5 million shares. As of December 31, 2013, there were 983,971 total shares available for future grant.
The following table summarizes share-based compensation expense: (in thousands) 2013 2012 2011 Restricted stock/PBRS $ 3,073 $ 3,267 $ 3,042Performance unit incentive plan (“PUP”) 1,864 2,922 714Restricted stock units/PBRS units 177 450 120Stock options 107 593 537
Total share-based compensation before income tax benefit 5,221 7,232 4,413Income tax benefit (1,936) (2,574 ) (1,594)Total share-based compensation, net of income tax benefit $ 3,285 $ 4,658 $ 2,819
In addition, $676,000, $253,000 and $124,000 of costs associated with share-based compensation were included in restructuring expense in 2013, 2012 and 2011, respectively. Of the 2013 amount, $154,000 and $329,000 related to the restricted stock units and PUP awards presented below, respectively. Similarly, of the 2012 amount, $94,000 related to PUP awards. No share-based compensation costs were capitalized during 2013, 2012 or 2011.
On October 25, 2013, Viad announced that its Board of Directors declared a special cash dividend of $2.50 per share, or $50.8 million in the aggregate, which was paid on November 14, 2013. In accordance with the mandatory provisions of the 2007 Plan and the 1997 Plan, the Human Resources Committee of Viad’s Board of Directors approved equitable adjustments to outstanding long-term incentive awards of stock options and PUP awards issued pursuant to those plans in order to prevent the special dividends from diluting the rights of participants under those plans. The equitable adjustments to the outstanding stock options reduced the exercise price and increased the number of shares of common stock underlying such options. The

F-10
equitable adjustment to the PUP awards reflects the effect of the special dividends, but would be paid only if certain performance goals are met at the end of the 3-year performance period.
Restricted Stock and PBRS. The following table summarizes restricted stock and PBRS activity: Restricted Stock PBRS
Shares
Weighted-AverageGrant Date Fair Value Shares
Weighted-AverageGrant Date Fair Value
Balance at January 1, 2011 478,499 $ 21.51 18,830 $ 33.02Granted 191,850 22.70 — —Vested (91,212) 31.31 (18,414 ) 33.42Forfeited (7,115) 20.81 — —Balance, December 31, 2011 572,022 20.36 416 15.36Granted 168,050 20.46 — —Vested (219,571) 18.26 (416 ) 15.36Forfeited (4,150) 24.80 — —Balance, December 31, 2012 516,351 21.25 — —Granted 101,300 27.27 — —Vested (166,320) 20.83 — —Forfeited (20,432) 22.13 — —Balance, December 31, 2013 430,899 22.78 — —
The grant date fair value of restricted stock which vested during 2013, 2012 and 2011 was $3.5 million, $4.0 million and $2.9 million, respectively. The grant date fair value of PBRS which vested during 2012 and 2011 was $6,000 and $615,000, respectively. No PBRS vested during 2013. As of December 31, 2013, the unamortized cost of all outstanding stock awards was $3.2 million, which Viad expects to recognize in the consolidated financial statements over a weighted-average period of approximately 1.7 years. During 2013, 2012 and 2011, the Company repurchased 50,156 shares for $1.3 million, 56,885 shares for $1.1 million and 28,627 shares for $679,000, respectively, related to tax withholding requirements on vested share-based awards.
Liability-Based Awards. The following table summarizes the liability-based award activity: PUP Awards Restricted Stock Units PBRS Units
Units
Weighted-Average
Grant Date Fair Value Units
Weighted-Average
Grant Date Fair Value Units
Weighted-Average
Grant Date Fair Value
Balance at January 1, 2011 102,960 $ 33.81 26,050 $ 17.18 3,914 $ 15.36Granted 95,500 23.02 12,550 23.01 — —Vested — — — — (1,958) 15.36Forfeited (102,960) 33.81 — — — —Balance, December 31, 2011 95,500 23.02 38,600 19.07 1,956 15.36Granted 115,100 20.60 15,850 20.57 — —Vested — — (13,100) 15.36 (1,956) 15.36Forfeited — — (850) 20.89 — —Balance, December 31, 2012 210,600 21.70 40,500 20.82 — —Granted 93,100 27.35 8,600 27.35 — —Vested — — (11,300) 19.10 — —Forfeited (3,932) 21.15 (9,240) 22.55 — —Balance, December 31, 2013 299,768 23.46 28,560 22.91 — —

F-11
As of December 31, 2013 and 2012, Viad had liabilities recorded of $5.9 million and $3.7 million, respectively, related to PUP awards. There were no cash settlements of PUP awards during 2013 or 2012. As of December 31, 2013 and 2012, Viad had aggregate liabilities recorded of $664,000 and $633,000, respectively, related to restricted stock unit liability awards. In February 2013 and 2012, portions of the 2009 and 2010 restricted stock unit awards vested and cash payouts of $300,000 and $257,000 were distributed, respectively. A portion of the 2009 PBRS unit awards vested effective December 31, 2009 and cash payouts of $35,000 and $52,000 were distributed in January 2012 and 2011, respectively.
Stock Options. The following table summarizes stock option activity:
Shares
Weighted- Average
Exercise Price Options
Exercisable Options outstanding at January 1, 2011 763,794 $ 23.38 451,194Exercised (14,616) 20.14 Forfeited or expired (164,977) 23.88 Options outstanding at December 31, 2011 584,201 23.32 396,688Exercised (12,099) 19.41 Forfeited or expired (208,206) 25.81 Options outstanding at December 31, 2012 363,896 22.03 276,009Exercised (59,543) 19.42 Forfeited or expired(1) (15,853) 40.45 Award modification 25,823 N/A Options outstanding at December 31, 2013 314,323 19.79 314,323
(1) This includes the reversal of previously canceled stock options.
As of December 31, 2013, there were no unrecognized costs related to non-vested stock option awards. No stock options were granted in 2013, 2012 or 2011. As previously discussed above, the equitable adjustments to the outstanding stock options resulting from the special cash dividend paid on November 14, 2013 reduced the exercise price and increased the number of shares of common stock underlying such options.
The following table summarizes information concerning stock options outstanding and exercisable as of December 31, 2013: Options Outstanding Options Exercisable
Weighted-Average
Remaining Contractual Life
(in years)
Weighted- Average
Exercise Price Weighted-
Average Exercise Price Range of Exercise Prices: Shares Shares
$17.62 262,788 5.7 $ 17.62 262,788 $ 17.62$22.85 10,895 1.9 22.85 10,895 22.85$31.03 22,118 1.2 31.03 22,118 31.03$35.28 18,522 0.1 35.28 18,522 35.28$17.62 to $35.28 314,323 5.1 19.79 314,323 19.79
Additional information pertaining to stock options is provided in the table below: (in thousands) 2013 2012 2011 Total intrinsic value of stock options outstanding $ 2,723 $ 2,329 $ —Total intrinsic value of stock options exercised $ 1,611 $ 296 $ 325Fair value of stock options vested $ 532 $ 539 $ 682Cash received from the exercise of stock options $ 777 $ 248 $ 296Tax benefits (deficiencies) realized for tax deductions related to stock option exercises and performance-based awards $ 404 $ 96
$ (325)
The aggregate intrinsic value of stock options outstanding in the table above represents the difference between Viad’s closing stock price on December 31 of each year and the exercise price, multiplied by the number of in-the-money options.

F-12
The intrinsic value of stock options outstanding therefore changes based on changes in the fair market value of Viad’s common stock.
Note 3. Acquisition of Businesses
On February 19, 2013, Viad acquired the assets of Resource Creative Limited (“RCL”) for $647,000 in cash, subject to certain adjustments, plus a deferred payment of up to approximately $278,000, which is contingent upon RCL’s performance. RCL is a United Kingdom-based company specializing in providing creative graphic services to the exhibition, events and retail markets throughout the United Kingdom and continental Europe.
The final amounts assigned to the assets of RCL as of the acquisition date included: property and equipment of $72,000, goodwill of $158,000 and other intangible assets of $695,000. In addition, a liability of $278,000 was recorded as of the acquisition date related to the contingent consideration. The primary factor that contributed to a purchase price resulting in the recognition of goodwill relates to future growth opportunities. The goodwill is deductible for tax purposes over a period of 15 years. The amounts assigned to other intangible assets included: $564,000 of customer relationships and $131,000 of noncompete agreements. The weighted-average amortization period related to the other intangible assets was 4.5 years. The transaction costs related to the acquisition were insignificant. The results of operations of RCL have been included in Viad’s consolidated financial statements from the date of acquisition.
In March 2012, Viad acquired the Banff International Hotel and related assets for $23.6 million in cash. The Banff International Hotel is a 162-guest room hotel located in downtown Banff, Alberta, Canada and is operated by Brewster within the Travel & Recreation Group. The following information represents the final amounts assigned to the assets and liabilities of the Banff International Hotel as of the date of acquisition: (in thousands) Cash and cash equivalents $ 10Accounts receivable 23Other current assets 33Property and equipment 20,408Goodwill 1,890Other intangible assets 1,323Total assets acquired 23,687Customer deposits (64)Other current liabilities (67)Total liabilities acquired (131)
Purchase price $ 23,556
The goodwill recorded in connection with the transaction is included in the Travel & Recreation Group. The primary factor that contributed to a purchase price resulting in the recognition of goodwill relates to future growth opportunities. The goodwill is deductible for tax purposes pursuant to regulations in Canada. The amount assigned to other intangible assets relates to an operating contract and customer relationships. The weighted-average amortization period related to the other intangible assets was 7.7 years. The transaction costs related to the acquisition were insignificant. The results of operations of the Banff International Hotel have been included in Viad’s consolidated financial statements from the date of acquisition.
In September 2011, Viad acquired the Denali Backcountry Lodge and Denali Cabins for $15.3 million in cash. Denali Backcountry Lodge is a 42-guest room lodge located within Denali National Park and Preserve in Alaska and Denali Cabins consist of 46 guest cabins near the entrance to Denali National Park and Preserve. These properties are operated by Alaska Denali Travel within the Travel & Recreation Group. The Company recorded $3.2 million of goodwill in connection with the transaction. The amount assigned to other intangible assets of $626,000 relates to customer relationships.
In June 2011, Viad acquired St. Mary Lodge (“St. Mary”) for $15.3 million in cash. St. Mary is a 115-guest room hotel located outside of Glacier National Park’s east entrance and is operated by Glacier Park within the Travel & Recreation Group. The Company recorded $3.1 million of goodwill in connection with the transaction. The amount assigned to other intangible assets of $60,000 relates to a non-amortized business license.
In January 2011, Viad acquired Grouse Mountain Lodge for $10.5 million in cash. Grouse Mountain Lodge is located in Whitefish, Montana and is operated by Glacier Park within the Travel & Recreation Group. The Company recorded $1.3

F-13
million of goodwill in connection with the transaction. The amount assigned to other intangible assets of $400,000 relates to a non-amortized business license.
The following information represents the aggregate amounts assigned to the assets and liabilities of the acquisitions that occurred during 2011: (in thousands) Cash and cash equivalents $ 30Other current assets 870Property and equipment 32,905Goodwill 7,645Other intangible assets 1,086Total assets acquired 42,536Customer deposits (821)Other current liabilities (198)Other long-term liabilities (382)Total liabilities acquired (1,401)
Purchase price $ 41,135
The primary factor that contributed to the recognition of goodwill for the 2011 acquisitions relates to future growth opportunities. The acquired goodwill is included in the Travel & Recreation Group and is deductible for tax purposes over a period of 15 years. The transaction costs related to the acquisitions were insignificant. The results of operations of the acquisitions have been included in Viad’s consolidated financial statements from the date of each acquisition. See Note 7 for a discussion of impairment charges on goodwill.
The following table summarizes the unaudited pro forma results of operations attributable to Viad, assuming that the acquisitions above had each been completed at the beginning of each year: (in thousands, except per share data) 2013 2012 2011 Revenue $ 973,039 $ 1,027,107 $ 956,570Depreciation and amortization 28,697 31,131 30,648Segment operating income 45,919 41,859 28,602Income from continuing operations 20,444 5,269 10,674Net income attributable to Viad 21,572 5,893 11,125Diluted net income per share 1.06 0.29 0.45Basic net income per share 1.06 0.29 0.45
Note 4. Inventories
The components of inventories as of December 31 were as follows: (in thousands) 2013 2012 Raw materials $ 14,825 $ 16,422Work in process 13,168 19,234
Inventories $ 27,993 $ 35,656
Note 5. Property and Equipment
In August 2013, Viad sold a facility and the land upon which it was situated within the Marketing & Events Group for $12.7 million (net of selling costs). Viad recorded a gain on the sale of the facility and related land of $4.8 million.

F-14
Property and equipment as of December 31 consisted of the following: (in thousands) 2013 2012 Land and land interests $ 23,646 $ 26,124Buildings and leasehold improvements 139,889 137,293Equipment and other 294,409 310,448
Gross property and equipment 457,944 473,865Accumulated depreciation (267,614 ) (276,567)Property and equipment, net $ 190,330 $ 197,298
Included in the “Equipment and other” caption above are capitalized costs incurred in developing or obtaining internal use software. The net carrying amount of capitalized software was $13.9 million and $14.2 million as of December 31, 2013 and 2012, respectively.
Included in the “Land and land interests” caption above are certain leasehold interests in land within the Travel & Recreation Group for which the Company is considered to have perpetual use rights. The carrying amount of these leasehold interests was $10.0 million and $10.6 million at December 31, 2013 and 2012, respectively. These land interests are not subject to amortization.
Depreciation expense was $27.4 million, $30.0 million and $28.4 million for 2013, 2012 and 2011, respectively. During 2013, Viad recorded impairment charges of $952,000 at the Marketing & Events Group related to the write off of a touring exhibition asset and amounts capitalized for internally developed software that is not anticipated to be put into use. These impairment losses are included in the consolidated statements of operations under the caption “Other impairment charges.”
Note 6. Other Investments and Assets
As of December 31 other investments and assets consisted of the following: (in thousands) 2013 2012 Cash surrender value of life insurance $ 19,690 $ 19,142Workers’ compensation insurance security deposits 3,350 3,350Other 11,986 9,924
Total other investments and assets $ 35,026 $ 32,416
Note 7. Goodwill and other Intangible Assets
In August 2013, Viad was notified by the Park Service that the concession contract for Glacier National Park, commencing in 2014, was awarded to another concessionaire. As a result, management revised its outlook for future revenues and earnings from Glacier Park and performed an impairment evaluation of goodwill at the Glacier Park reporting unit. Based on this evaluation, the Company recorded a non-cash impairment charge of $4.5 million representing all goodwill at the Glacier Park reporting unit, of which $892,000 related to the noncontrolling interest. The goodwill impairment loss is included in the consolidated statements of operations under the caption “Goodwill impairment charge.”
The changes in the carrying amount of goodwill were as follows:
(in thousands) Marketing & Events U.S.
Marketing & Events
International
Travel & Recreation
Group Total Balance at January 1, 2012 $ 62,686 $ 22,198 $ 48,810 $ 133,694Business acquisitions — — 1,890 1,890Foreign currency translation adjustments — 856 1,380 2,236Balance at December 31, 2012 62,686 23,054 52,080 137,820Goodwill impairment charge — — (4,461 ) (4,461)Business acquisition — 158 — 158Foreign currency translation adjustments — (601) (3,373 ) (3,974)Balance at December 31, 2013 $ 62,686 $ 22,611 $ 44,246 $ 129,543

F-15
The following table summarizes goodwill by reporting unit and segment as of December 31: (in thousands) 2013 2012 Marketing & Events Group:
Marketing & Events U.S. $ 62,686 $ 62,686Marketing & Events International:
GES United Kingdom 14,049 13,894GES Canada 8,562 9,160
Total Marketing & Events Group 85,297 85,740Travel & Recreation Group:
Brewster 41,062 44,435Alaska Denali Travel 3,184 3,184Glacier Park — 4,461
Total Travel & Recreation Group 44,246 52,080Total Goodwill $ 129,543 $ 137,820
For impairment testing purposes, the goodwill related to the Marketing & Events U.S. segment is assigned to and tested at the operating segment level. Furthermore, the goodwill related to the Marketing & Events International segment is assigned to and tested based on the segment’s geographical operations. For the Marketing & Events International segment the reporting units are GES United Kingdom and GES Canada. Brewster, Glacier Park and Alaska Denali Travel are considered reporting units for goodwill impairment testing purposes within the Travel & Recreation Group.
As a result of the Company’s most recent analysis performed in October 2013, the excess of the estimated fair values over the carrying values (expressed as a percentage of the carrying amounts) under step one of the impairment test was 139 percent, 58 percent and 59 percent for each of the Marketing & Events Group reporting units in the United States, the United Kingdom and Canada, respectively. For the Brewster and Alaska Denali Travel reporting units, the excess of the estimated fair value over the carrying value was 54 percent and 15 percent, respectively, as of the most recent impairment test. Significant reductions in the Company’s expected future revenues, operating income or cash flow forecasts and projections, or an increase in reporting unit cost of capital, could trigger additional impairment testing, which may result in impairment charges.
As of December 31, 2013, Viad had cumulative goodwill impairment charges of $229.7 million since the adoption of the goodwill impairment testing provisions of ASC Topic 350.
A summary of other intangible assets as of December 31, 2013 is presented below:
(in thousands) Gross Carrying
Value Accumulated Amortization
Net Carrying Value
Amortized intangible assets: Customer contracts and relationships $ 5,537 $ (2,521) $ 3,016Other 1,280 (276) 1,004
Total amortized intangible assets 6,817 (2,797) 4,020Unamortized intangible assets:
Business licenses 460 — 460Total $ 7,277 $ (2,797) $ 4,480

F-16
A summary of other intangible assets as of December 31, 2012 is presented below:
(in thousands) Gross Carrying
Value Accumulated Amortization
Net Carrying Value
Amortized intangible assets: Customer contracts and relationships $ 3,594 $ (2,384) $ 1,210Other 959 (108) 851
Total amortized intangible assets 4,553 (2,492) 2,061Unamortized intangible assets:
Business licenses 460 — 460Total $ 5,013 $ (2,492) $ 2,521
Intangible asset amortization expense for 2013, 2012 and 2011 was $1.3 million, $693,000 and $772,000, respectively. The weighted-average amortization period of customer contracts and relationships and other amortizable intangible assets is approximately 5.2 years and 1.8 years, respectively. Estimated amortization expense related to amortized intangible assets for future years is expected to be as follows: (in thousands) 2014 $ 9962015 $ 7952016 $ 6712017 $ 5532018 $ 442Thereafter $ 563
Note 8. Accrued Liabilities and Other
As of December 31 other current liabilities consisted of the following: (in thousands) 2013 2012 Continuing operations:
Customer deposits $ 29,207 $ 50,172Accrued compensation 15,113 25,067Self-insured liability accrual 7,603 8,501Accrued restructuring 3,877 4,084Accrued employee benefit costs 2,751 3,132Accrued dividends 2,192 2,053Accrued sales and use taxes 1,609 3,179Accrued foreign income taxes 565 28Other 9,573 9,998
Total continuing operations 72,490 106,214Discontinued operations:
Self-insured liability accrual 469 527Environmental remediation liabilities 353 571Other 177 372
Total discontinued operations 999 1,470Total other current liabilities $ 73,489 $ 107,684

F-17
As of December 31 other deferred items and liabilities consisted of the following: (in thousands) 2013 2012 Continuing operations:
Self-insured liability accrual $ 17,316 $ 15,579Accrued compensation 8,349 8,061Foreign deferred tax liability 1,989 2,024Accrued restructuring 1,919 3,140Other 7,552 6,734
Total continuing operations 37,125 35,538Discontinued operations:
Environmental remediation liabilities 4,666 4,745Self-insured liability accrual 4,489 5,188Accrued income taxes 1,085 1,053Other 1,254 1,304
Total discontinued operations 11,494 12,290Total other deferred items and liabilities $ 48,619 $ 47,828
Note 9. Debt
Long-term debt as of December 31 was as follows: (in thousands, except interest rates) 2013 2012 Revolving credit agreement, 2.2% (2013) weighted-average interest rate at December 31, 2013 $ 10,000
$ —
Capital lease obligations, 6.9% (2013) and 6.4% (2012) weighted-average interest rate at December 31, due to 2017 1,668
2,226
Total debt 11,668 2,226Current portion (10,903 ) (1,347)
Long-term capital lease obligations $ 765 $ 879
In May 2011, Viad entered into an amended and restated revolving credit agreement (the “Credit Facility”). The Credit Facility provides for a $130 million revolving line of credit, which may be increased up to an additional $50 million under certain circumstances. The term of the Credit Facility is five years (expiring on May 18, 2016) and borrowings are to be used for general corporate purposes (including permitted acquisitions) and to support up to $50 million of letters of credit. The lenders have a first perfected security interest in all of the personal property of Viad and GES, including 65 percent of the capital stock of top-tier foreign subsidiaries. As of December 31, 2013, Viad’s total debt of $11.7 million consisted of a $10 million revolver borrowing on the Credit Facility and $1.7 million of capital lease obligations. As of December 31, 2013, Viad had $118.7 million of capacity remaining under its Credit Facility reflecting outstanding letters of credit of $1.3 million and the outstanding balance under the Credit Facility of $10 million.
Borrowings under the Credit Facility (of which GES is a guarantor) are indexed to the prime rate or the London Interbank Offered Rate, plus appropriate spreads tied to Viad’s leverage ratio. Commitment fees and letters of credit fees are also tied to Viad’s leverage ratio. The fees on the unused portion of the Credit Facility are currently 0.35 percent annually.
The Credit Facility contains various affirmative and negative covenants that are customary for facilities of this type, including a fixed-charge coverage ratio, leverage ratio and dividend and share repurchase limits. Significant other covenants include limitations on: investments, additional indebtedness, sales/leases of assets, acquisitions, consolidations or mergers and liens on property. As of December 31, 2013, Viad was in compliance with all covenants.
In December 2012, the Credit Facility was amended to remove the limitation on share repurchases of $10 million in the aggregate per calendar year pursuant to certain conditions. The amendment allows share repurchases unless the Company’s leverage ratio, as defined in the Credit Facility, is greater than 1.50 to 1.00 or a default or an unmatured default, as defined in the Credit Facility, exists. The amendment also allows dividends to be declared and paid in excess of $10 million in the aggregate per calendar year, as well as distributions on its capital stock, as defined in the Credit Facility, unless the

F-18
Company’s leverage ratio, as defined in the Credit Facility, is greater than 1.50 to 1.00 or a default or an unmatured default, as defined in the Credit Facility, exists.
Effective November 14, 2013, the Credit Facility was amended to remove the liquidity covenant that required Viad to maintain at all times not less than $50 million of unrestricted cash and cash equivalent investments, as that term is defined in the Credit Facility. With the amendment, the Credit Facility no longer requires any minimum amount of unrestricted cash and cash equivalent investments.
As of December 31, 2013, Viad had certain obligations under guarantees to third parties on behalf of its subsidiaries. These guarantees are not subject to liability recognition in the consolidated financial statements and relate to leased facilities entered into by the Company’s subsidiary operations. The Company would generally be required to make payments to the respective third parties under these guarantees in the event that the related subsidiary could not meet its own payment obligations. The maximum potential amount of future payments that Viad would be required to make under all guarantees existing as of December 31, 2013 would be $13.7 million. These guarantees relate to leased facilities and expire through October 2017. There are no recourse provisions that would enable Viad to recover from third parties any payments made under the guarantees. Furthermore, there are no collateral or similar arrangements whereby Viad could recover payments.
Aggregate annual maturities of long-term debt and capital lease obligations as of December 31, 2013 are as follows:
(in thousands) Revolving Credit
Agreement Capital Lease Obligations
2014 $ 10,000 $ 9842015 — 6092016 — 1862017 — 322018 — 2
Total $ 10,000 1,813Less: Amount representing interest (145)
Present value of minimum lease payments $ 1,668
The gross amount of assets recorded under capital leases as of December 31, 2013 was $3.9 million and accumulated amortization was $2.1 million. As of December 31, 2012, the gross amount of assets recorded under capital leases and accumulated amortization was $5.9 million and $2.9 million, respectively. The amortization charges related to assets recorded under capital leases are included in depreciation expense. See Note 5.
The weighted-average interest rate on total debt was 4.2 percent, 8.5 percent and 7.8 percent for 2013, 2012 and 2011, respectively. The estimated fair value of total debt was $11.5 million and $2.1 million as of December 31, 2013 and 2012, respectively. The fair value of debt was estimated by discounting the future cash flows using rates currently available for debt of similar terms and maturity.
Note 10. Fair Value Measurements
The fair value of an asset or liability is defined as the price that would be received to sell an asset or paid to transfer a liability in an orderly transaction between market participants at the measurement date. The fair value guidance requires an entity to maximize the use of quoted prices and other observable inputs and minimize the use of unobservable inputs when measuring fair value, and also establishes a fair value hierarchy which prioritizes the inputs to valuation techniques used to measure fair value as follows:
Level 1 - Quoted prices in active markets for identical assets or liabilities. Level 2 - Observable inputs other than quoted prices included within Level 1 that are observable for the asset or liability,
either directly or indirectly. Level 3 - Unobservable inputs to the valuation methodology that are significant to the measurement of fair value.

F-19
Viad measures its money market mutual funds and certain other mutual fund investments at fair value on a recurring basis using Level 1 inputs. The fair value information related to these assets is summarized in the following tables: Fair Value Measurements at Reporting Date Using
(in thousands) December 31, 2013
Quoted Prices inActive
Markets (Level 1)
Significant Other
Observable Inputs
(Level 2)
Significant Unobserved
Inputs (Level 3)
Assets: Money market funds $ 118 $ 118 $ — $ —Other mutual funds 2,023 2,023 — —
Total assets at fair value on a recurring basis $ 2,141 $ 2,141 $ — $ —
Fair Value Measurements at Reporting Date Using
(in thousands) December 31, 2012
Quoted Prices in Active Markets (Level 1)
Significant Other
Observable Inputs
(Level 2)
Significant Unobserved
Inputs (Level 3)
Assets: Money market funds $ 10,177 $ 10,177 $ — $ —Other mutual funds 1,239 1,239 — —
Total assets at fair value on a recurring basis $ 11,416 $ 11,416 $ — $ —
As of December 31, 2013 and 2012, Viad had investments in money market mutual funds of $118,000 and $10.2 million, respectively, which are included in the consolidated balance sheets under the caption “Cash and cash equivalents.” These investments are classified as available-for-sale and were recorded at fair value. There have been no realized or unrealized gains or losses related to these investments and the Company has not experienced any redemption restrictions with respect to any of the money market mutual funds.
As of December 31, 2013 and 2012, Viad had investments in other mutual funds of $2.0 million and $1.2 million, respectively, which are classified in the consolidated balance sheets under the caption “Other investments and assets.” These investments were classified as available-for-sale and were recorded at fair value. As of December 31, 2013 and 2012, there were unrealized gains of $700,000 ($429,000 after-tax) and $450,000 ($275,000 after-tax), respectively, which were included in the consolidated balance sheets under the caption “Accumulated other comprehensive income (loss).”
The carrying values of cash and cash equivalents, receivables and accounts payable approximate fair value due to the short-term maturities of these instruments. The estimated fair value of debt obligations is disclosed in Note 9.
During 2013, Viad had certain non-financial assets that were measured at fair value on a non-recurring basis using Level 3 inputs. These assets include goodwill and certain property and equipment for which impairment losses were recorded during 2013. The fair value information related to these assets is summarized in the following table: Fair Value Measurements at Reporting Date Using
(in thousands) December 31,
2013
Quoted Prices inActive
Markets (Level 1)
SignificantOther
Observable Inputs
(Level 2)
Significant Unobserved
Inputs (Level 3)
Total Gains (Losses)
Assets: Goodwill (1) $ — $ — $ — $ — $ (4,461)Property and equipment(1) — — — — (952)
Total assets at fair value on a non-recurring basis $ — $ — $ —
$ — $ (5,413)
(1) See Notes 5 and 7 for details of the impairment charges.

F-20
Note 11. Income Per Share
The following are the components of basic and diluted income per share: (in thousands, except per share data) 2013 2012 2011 Net income attributable to Viad (diluted) $ 21,555 $ 5,897 $ 9,210
Less: Allocation to non-vested shares (485) (157 ) (248)Net income allocated to Viad common stockholders (basic) $ 21,070 $ 5,740 $ 8,962Basic weighted-average outstanding common shares 19,850 19,701 19,719
Additional dilutive shares related to share-based compensation 415 304 336Diluted weighted-average outstanding shares 20,265 20,005 20,055Income per share: Basic income attributable to Viad common stockholders $ 1.06 $ 0.29 $ 0.45Diluted income attributable to Viad common stockholders(1)
$ 1.06 $ 0.29 $ 0.45(1) Diluted income per share amount cannot exceed basic income per share.
Options to purchase 47,000, 110,000 and 304,000 shares of common stock were outstanding during 2013, 2012 and 2011, respectively, but were not included in the computation of dilutive shares outstanding because the effect would be anti-dilutive. Additionally, 415,000, 304,000 and 336,000 share-based compensation awards were considered dilutive and included in the computation of diluted income per share in 2013, 2012 and 2011, respectively.
Note 12. Employee Stock Ownership Feature of 401(k) Plan
Viad funds its matching contributions to employees’ 401(k) accounts through the Company’s ESOP portion of the Viad Corp Capital Accumulation Plan (the “401(k) Plan”). All eligible employees of Viad and its participating affiliates, other than certain employees covered by collective-bargaining agreements that do not expressly provide for participation of such employees in an employee stock ownership plan, may participate in the employee stock ownership feature within the 401(k) Plan.
In 1989, the ESOP borrowed $40.0 million (guaranteed by Viad) to purchase treasury shares from the Company. In 2004, Viad borrowed $12.2 million under its revolving credit agreement to pay in full the outstanding ESOP loan and obtain release of Viad from its guarantee of the loan. In connection with the loan payoff, the ESOP entered into a $12.4 million loan with Viad maturing in June 2009 calling for minimum quarterly principal payments of $250,000 plus interest. The same amount, representing unearned employee benefits, was recorded as a reduction of stockholders’ equity. In 2007, the loan agreement between the ESOP and Viad was extended to December 31, 2016. As of December 31, 2013, the balance of the ESOP loan was $44,000 and is included in the consolidated balance sheets under the caption “Unearned employee benefits and other.” The liability is reduced as the ESOP makes principal payments on the borrowing, and the amount offsetting stockholders’ equity is reduced as stock is allocated to employees and benefits are charged to expense. The 401(k) Plan repays the loan using Viad contributions and dividends received on the unallocated Viad shares held by the 401(k) Plan.
Information regarding ESOP transactions is as follows: (in thousands) 2013 2012 2011 Amounts paid by ESOP for:
Debt repayment $ 1,280 $ 1,647 $ 1,490Interest 1 5 8
Amounts received from Viad as: Contributions 1,202 1,604 1,435Dividends 79 48 63
Shares were released for allocation to participants based upon the ratio of the current year’s principal and interest payments to the sum of the total principal and interest payments expected over the remaining life of the loan. Viad recorded expense of $1.3 million, $1.7 million and $1.6 million in 2013, 2012 and 2011, respectively.
Unallocated shares held by the 401(k) Plan totaled 4,361 and 130,577 as of December 31, 2013 and 2012, respectively. Shares allocated during 2013 and 2012 totaled 126,216 and 162,703, respectively. In January 2014, the 4,361 shares

F-21
remaining in the ESOP as of December 31, 2013 had been fully exhausted. Future matching contributions on employee deferrals will be made from shares held in treasury.
Note 13. Preferred Stock Purchase Rights
Viad has authorized five million and two million shares of Preferred Stock and Junior Participating Preferred Stock, respectively, none of which was outstanding on December 31, 2013.
On February 28, 2013, Viad’s shareholder rights plan (the “Rights Agreement”), as adjusted in connection with Viad’s one-for-four reverse stock split on July 1, 2004 and as amended on February 28, 2012, terminated on its own terms and the Preferred Stock Purchase Rights issued pursuant to the Rights Agreement expired.
Note 14. Accumulated Other Comprehensive Income
Changes in accumulated other comprehensive income (“AOCI”) by component were as follows:
(in thousands) Unrealized Gains on Investments
Cumulative Foreign Currency
Translation Adjustments
Unrecognized Net Actuarial Loss and
Service Credit
Accumulated Other
Comprehensive Income
Balance at January 1, 2013 $ 275 $ 42,158 $ (14,968) $ 27,465Other comprehensive income before reclassifications 215 (11,311) 3,421
(7,675)
Amounts reclassified from AOCI, net of tax (61) — 288 227Net other comprehensive income (loss) 154 (11,311) 3,709 (7,448)Balance at December 31, 2013 $ 429 $ 30,847 $ (11,259) $ 20,017
The following table presents information about reclassification adjustments out of AOCI:
(in thousands) 2013 2012
Affected Line Item in the Statement Where Net Income is Presented
Unrealized gains on investments $ 99 $ 92 Interest income Tax effect (38) (35) Income taxes $ 61 $ 57 Net of tax
Recognized net actuarial loss $ (1,349) $ (1,239) See Note 16 Amortization of prior service credit 902 1,113 See Note 16 Tax effect 159 42 Income taxes $ (288) $ (84) Net of tax

F-22
Note 15. Income Taxes
The following represents a reconciliation of income tax expense and the amount that would be computed using the statutory federal income tax rates: (in thousands) 2013 2012 2011
Computed income tax expense at statutory federal income tax rate of 35% $ 10,201 35.0 % $ 9,381 35.0 % $ 4,613 35.0 %State income taxes, net of federal provision 345 1.2 % 470 1.8 % (100) (0.8)%Foreign tax rate differentials 77 0.3 % (2,031) (7.6)% (1,679) (12.7)%U.S. tax on foreign earnings (net of foreign tax credits) (1,831) (6.3)% (595) (2.2)% 1,105 8.4 %Tax resolutions, net — — % — — % (103) (0.8)%Change in valuation allowance (2,184) (7.5)% 14,220 53.1 % (55) (0.4)%Proceeds from life insurance (196) (0.7)% (472) (1.8)% — — %Return to provision and other adjustments 1,664 5.7 % (371) (1.4)% (43) (0.3)%Other, net 514 1.8 % 241 0.9 % 150 1.1 %
Income tax expense $ 8,590 29.5 % $ 20,843 77.8 % $ 3,888 29.5 %
Viad is subject to regular and recurring audits by the taxing authorities in the jurisdictions in which the Company conducts or had previously conducted operations. These include U.S. federal and most state jurisdictions, and certain foreign jurisdictions including Canada, the United Kingdom and Germany.
Viad exercises judgment in determining its income tax provision due to transactions, credits and calculations where the ultimate tax determination is uncertain. As of December 31, 2013, the Company recognized an increase in the liability for uncertain tax positions for continuing operations of approximately $736,000 as there were no accrued gross liabilities associated with uncertain tax positions as of December 31, 2012. As of December 31, 2013, Viad had accrued interest and penalties related to uncertain tax positions for continuing operations of $20,000. Viad classifies interest and penalties related to income tax liabilities as a component of income tax expense. The tax expense impact of the uncertain tax positions was $200,000 due to tax credit carryforwards that were available to offset the expense. The Company believes that it is reasonably possible that approximately $293,000 of its uncertain tax positions could be resolved or settled within the next twelve months, which would reduce the amount of accrued income taxes payable.
During 2011, Viad recorded tax benefits related to the favorable resolution of tax matters in continuing operations of $103,000. These tax resolutions primarily represent the reversal of amounts accrued for tax and related interest and penalties in connection with uncertain tax positions which were effectively settled or for which there was a lapse of the applicable statute of limitations.
In addition to the above, Viad had accrued gross liabilities associated with uncertain tax positions for discontinued operations of $636,000 as of both December 31, 2013 and 2012. In addition, as of December 31, 2013 and 2012, Viad had accrued interest and penalties related to uncertain tax positions for discontinued operations of $450,000 and $418,000, respectively. Future tax resolutions or settlements that may occur related to these uncertain tax positions would be recorded through discontinued operations (net of federal tax effects, if applicable). Viad believes that it is reasonably possible that the unrecognized tax benefits related to discontinued operations will be recognized or settled during the next 12 months as the statute of limitations related to this item will lapse on December 31, 2014.
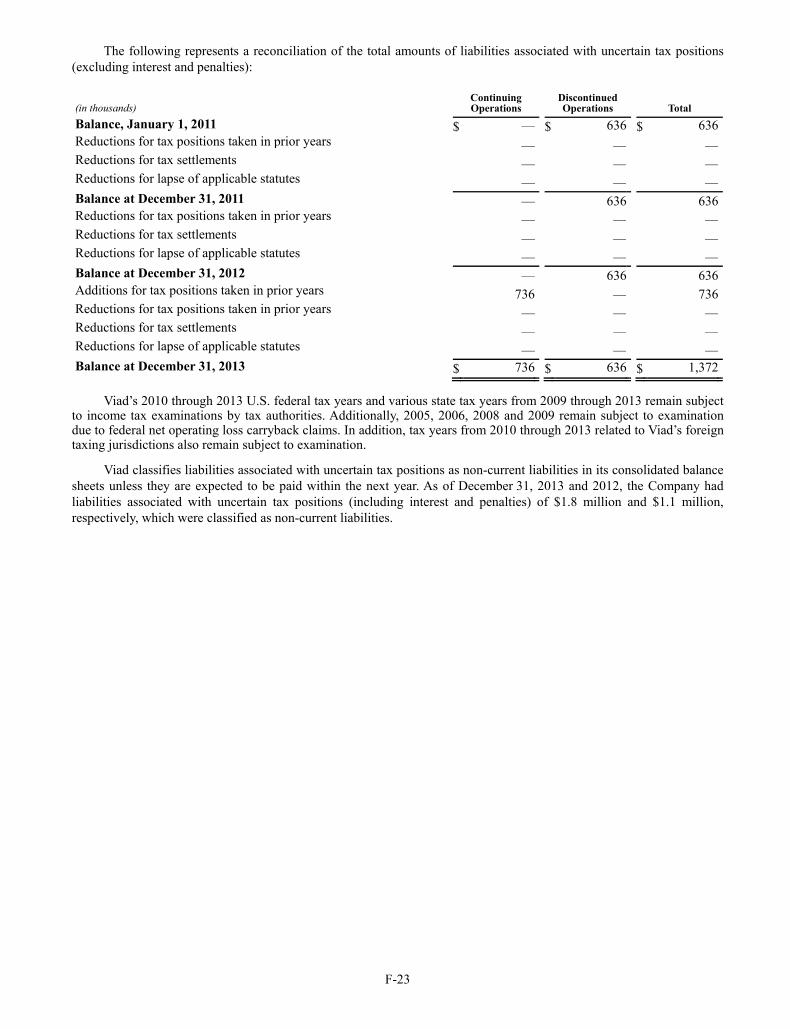
F-23
The following represents a reconciliation of the total amounts of liabilities associated with uncertain tax positions (excluding interest and penalties):
(in thousands) Continuing Operations
Discontinued Operations Total
Balance, January 1, 2011 $ — $ 636 $ 636Reductions for tax positions taken in prior years — — —Reductions for tax settlements — — —Reductions for lapse of applicable statutes — — —Balance at December 31, 2011 — 636 636Reductions for tax positions taken in prior years — — —Reductions for tax settlements — — —Reductions for lapse of applicable statutes — — —Balance at December 31, 2012 — 636 636Additions for tax positions taken in prior years 736 — 736Reductions for tax positions taken in prior years — — —Reductions for tax settlements — — —Reductions for lapse of applicable statutes — — —Balance at December 31, 2013 $ 736 $ 636 $ 1,372
Viad’s 2010 through 2013 U.S. federal tax years and various state tax years from 2009 through 2013 remain subject to income tax examinations by tax authorities. Additionally, 2005, 2006, 2008 and 2009 remain subject to examination due to federal net operating loss carryback claims. In addition, tax years from 2010 through 2013 related to Viad’s foreign taxing jurisdictions also remain subject to examination.
Viad classifies liabilities associated with uncertain tax positions as non-current liabilities in its consolidated balance sheets unless they are expected to be paid within the next year. As of December 31, 2013 and 2012, the Company had liabilities associated with uncertain tax positions (including interest and penalties) of $1.8 million and $1.1 million, respectively, which were classified as non-current liabilities.

F-24
Deferred income tax assets and liabilities included in the consolidated balance sheets as of December 31 related to the following: (in thousands) 2013 2012 Deferred tax assets:
Tax credit carryforwards $ 26,945 $ 25,290Pension, compensation and other employee benefits 23,835 31,782Provisions for losses 13,674 15,229Net operating loss carryforward 4,794 1,755State income taxes 2,170 2,813Other deferred income tax assets 5,552 5,331
Total deferred tax assets 76,970 82,200Valuation allowance (12,393 ) (14,576)Foreign deferred tax assets included above (1,713 ) (990)
Net deferred tax assets 62,864 66,634Deferred tax liabilities:
Property and equipment (7,861 ) (8,801)Deferred tax related to life insurance (4,842 ) (4,992)Goodwill and other intangible assets (959 ) (1,306)Unremitted foreign earnings (398 ) (978)Other deferred income tax liabilities (393 ) (176)
Total deferred tax liabilities (14,453 ) (16,253)Foreign deferred tax liabilities included above 1,989 2,024United States deferred tax assets $ 50,400 $ 52,405
Viad is required to estimate and record provisions for income taxes in each of the jurisdictions in which the
Company operates. Accordingly, the Company must estimate its actual current income tax liability, and assess temporary differences arising from the treatment of items for tax purposes, as compared to the treatment for accounting purposes. These differences result in deferred tax assets and liabilities which are included in Viad’s consolidated balance sheets. The Company must assess the likelihood that deferred tax assets will be recovered from future taxable income and to the extent that recovery is not likely, a valuation allowance must be established. The Company uses significant judgment in forming a conclusion regarding the recoverability of its deferred tax assets and evaluates the available positive and negative evidence to determine whether it is more-likely-than-not that its deferred tax assets will be realized in the future. As of December 31, 2013 and 2012, Viad had gross deferred tax assets of $77.0 million and $82.2 million, respectively. These deferred tax assets reflect the expected future tax benefits to be realized upon reversal of deductible temporary differences, and the utilization of net operating loss and tax credit carryforwards.
The Company considered all available positive and negative evidence regarding the future recoverability of its deferred tax assets, including the Company’s recent operating history, taxpaying history and future reversals of deferred tax liabilities. The Company also evaluated its ability to utilize its foreign tax credits, given its recent utilization history. These tax credits are subject to a 10-year carryforward period and begin to expire in 2019. Based on the Company’s assessment, it was determined during the fourth quarter of 2012 that the weight of the evidence indicated that certain deferred tax assets associated with foreign tax credit carryforwards no longer met the more-likely-than-not test regarding the realization of those assets. As a result, the Company recorded a valuation allowance of $13.4 million related to all of its foreign tax credit carryforwards. During 2013, the Company generated additional foreign tax credit carryforwards of $1.9 million for which an additional valuation allowance was recorded. However, the Company also determined, due to the taxable income associated with the Glacier Park possessory interest the Company received in the first quarter of 2014, it was more-likely-than-not that a portion of its previously existing foreign tax credit carryforwards would be utilized. Therefore, during the fourth quarter of 2013, the Company reversed $4.1 million of its valuation allowance related to those tax credits. Accordingly, the Company recorded a net decrease to income tax expense of $2.2 million and a decrease of $300,000 to deferred tax assets for a total decrease to income tax expense of $2.5 million related to changes in the valuation allowance associated with its foreign tax credit carryforwards. As of December 31, 2013 and 2012, Viad had federal, state and foreign net operating loss carryforwards of $96.0 million and $82.0 million, respectively, for which the Company had deferred tax assets of $4.8 million and $1.8 million, respectively. The state and foreign net operating loss

F-25
carryforwards expire on various dates from 2014 through 2033. During 2013, the Company increased its valuation allowance related to state and foreign net operating loss carryforwards by $329,000. As of December 31, 2013 and 2012, Viad had a valuation allowance of $1.5 million and $1.2 million, respectively, related to those state and foreign deferred tax assets. With respect to all other deferred tax assets, management believes that recovery from future taxable income is more-likely-than-not.
As noted above, Viad uses considerable judgment in forming a conclusion regarding the recoverability of its deferred tax assets. As a result, there are inherent uncertainties regarding the ultimate realization of these assets, which is primarily dependent on Viad’s ability to generate sufficient taxable income in future periods. In future periods, it is reasonably possible that the relative weight of positive and negative evidence regarding the recoverability of Viad’s deferred tax assets may change, which could result in a material increase or decrease in the Company’s valuation allowance. If such a change in the valuation allowance were to occur, it would result in a material increase or decrease to income tax expense in the period the assessment was made.
As of December 31, 2013, Viad had tax credit carryforwards related to alternative minimum tax of $11.3 million that may be carried forward indefinitely. Additionally, as of December 31, 2013, Viad had foreign tax credit carryforwards of $15.0 million, of which $222,000 expire in 2019, $8.3 million expire in 2020, $4.4 million expire in 2021 and $2.1 million expire in 2033. The Company has a valuation allowance of $10.9 million related to the foreign tax credit carryforwards. Viad also had general business credits of $622,000 as of December 31, 2013, which expire at various dates from 2028 to 2033.
Viad has not recorded deferred taxes on certain historical unremitted earnings of its Canadian subsidiaries as management intends to reinvest those earnings in its Canadian operations. As of December 31, 2013, the incremental unrecognized tax liability (net of estimated foreign tax credits) related to those undistributed earnings was approximately $1.0 million. To the extent that circumstances change and it becomes apparent that some or all of those undistributed earnings will be remitted to the U.S., Viad would accrue income taxes attributable to such remittance.
Income tax expense consisted of the following: (in thousands) 2013 2012 2011 Current:
United States: Federal $ (2,134) $ (272) $ (4,643)State (286) 2,189 1,292
Foreign 9,606 7,652 8,163Total current 7,186 9,569 4,812Deferred:
United States: Federal 1,113 11,127 992State 651 40 (1,560)
Foreign (360) 107 (356)Total deferred 1,404 11,274 (924)Income tax expense $ 8,590 $ 20,843 $ 3,888
The aggregate tax benefit realized in connection with the vesting of restricted stock and the exercise of stock
options was $404,000 for 2013, which was recorded as a credit to stockholders’ equity. During 2012 and 2011, the Company recorded tax deficiencies of $96,000 and $325,000, respectively, related to the vesting of restricted stock and the exercise of stock options, which were recorded as charges to stockholders’ equity.
Eligible subsidiaries (including sold and discontinued businesses up to their respective disposition dates) are included in the consolidated federal and other applicable income tax returns of Viad.
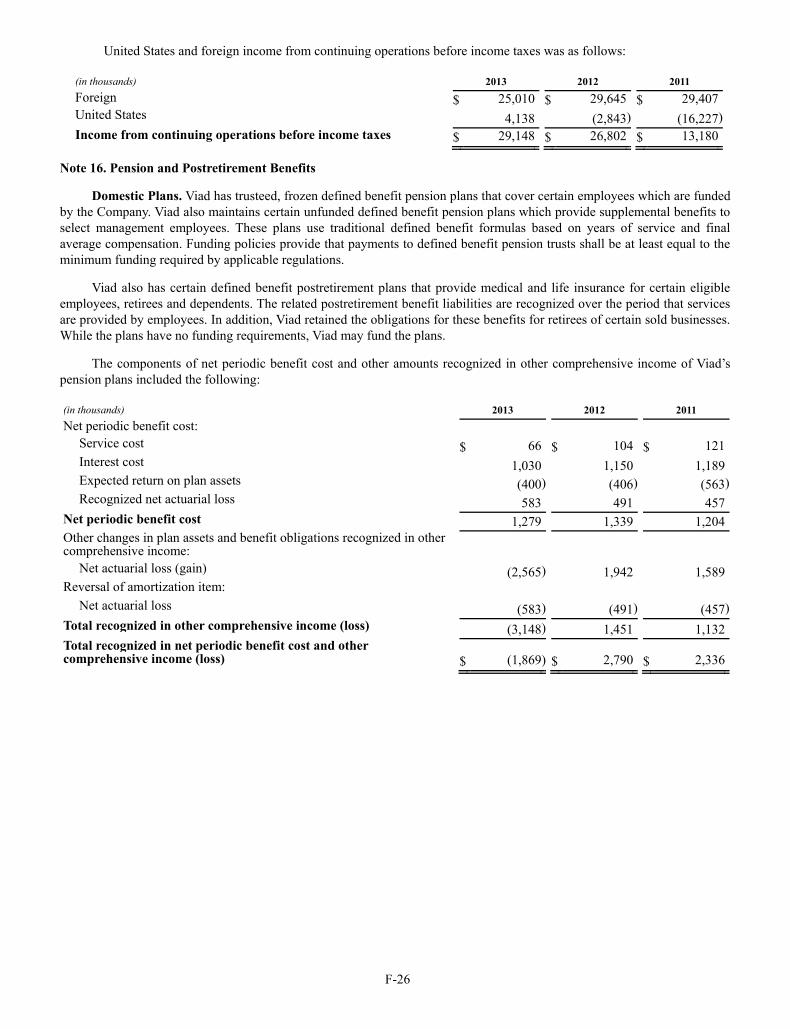
F-26
United States and foreign income from continuing operations before income taxes was as follows: (in thousands) 2013 2012 2011 Foreign $ 25,010 $ 29,645 $ 29,407United States 4,138 (2,843) (16,227)Income from continuing operations before income taxes $ 29,148 $ 26,802 $ 13,180
Note 16. Pension and Postretirement Benefits
Domestic Plans. Viad has trusteed, frozen defined benefit pension plans that cover certain employees which are funded by the Company. Viad also maintains certain unfunded defined benefit pension plans which provide supplemental benefits to select management employees. These plans use traditional defined benefit formulas based on years of service and final average compensation. Funding policies provide that payments to defined benefit pension trusts shall be at least equal to the minimum funding required by applicable regulations.
Viad also has certain defined benefit postretirement plans that provide medical and life insurance for certain eligible employees, retirees and dependents. The related postretirement benefit liabilities are recognized over the period that services are provided by employees. In addition, Viad retained the obligations for these benefits for retirees of certain sold businesses. While the plans have no funding requirements, Viad may fund the plans.
The components of net periodic benefit cost and other amounts recognized in other comprehensive income of Viad’s pension plans included the following: (in thousands) 2013 2012 2011 Net periodic benefit cost:
Service cost $ 66 $ 104 $ 121Interest cost 1,030 1,150 1,189Expected return on plan assets (400) (406 ) (563)Recognized net actuarial loss 583 491 457
Net periodic benefit cost 1,279 1,339 1,204Other changes in plan assets and benefit obligations recognized in other comprehensive income:
Net actuarial loss (gain) (2,565) 1,942 1,589Reversal of amortization item:
Net actuarial loss (583) (491 ) (457)Total recognized in other comprehensive income (loss) (3,148) 1,451 1,132Total recognized in net periodic benefit cost and other comprehensive income (loss) $ (1,869) $ 2,790
$ 2,336

F-27
The components of net periodic benefit cost and other amounts recognized in other comprehensive income of Viad’s postretirement benefit plans included the following: (in thousands) 2013 2012 2011 Net periodic benefit cost:
Service cost $ 156 $ 146 $ 128Interest cost 663 814 868Expected return on plan assets — (74 ) (135)Amortization of prior service credit (902) (1,113 ) (1,277)Recognized net actuarial loss 518 547 533
Net periodic benefit cost 435 320 117Other changes in plan assets and benefit obligations recognized in other comprehensive income:
Net actuarial loss (gain) (1,496) 224 24Prior service credit (40) — —
Reversal of amortization item: Net actuarial loss (518) (547 ) (533)Prior service credit 902 1,113 1,277
Total recognized in other comprehensive income (loss) (1,152) 790 768Total recognized in net periodic benefit cost and other comprehensive income (loss) $ (717) $ 1,110
$ 885
The following table indicates the funded status of the plans as of December 31:
PostretirementBenefit Plans Funded Plans Unfunded Plans
(in thousands) 2013 2012 2013 2012 2013 2012 Change in benefit obligation:
Benefit obligation at beginning of year $ 15,348 $ 13,938 $ 11,570 $ 10,883
$ 18,701 $ 18,667
Service cost — — 66 104 156 146Interest cost 608 659 422 491 663 814Actuarial adjustments (1,530) 1,419 (856) 799 (1,631) 250Plan amendments — — — — (40) —Benefits paid (991) (668) (666) (707) (930) (1,176)
Benefit obligation at end of year 13,435 15,348 10,536 11,570 16,919 18,701Change in plan assets:
Fair value of plan assets at beginning of year 10,624 9,846 — —
1,397 2,118
Actual return on plan assets 580 683 — — (135) 100Company contributions 659 763 666 707 188 355Benefits paid (991) (668) (666) (707) (930) (1,176)
Fair value of plan assets at end of year 10,872 10,624 — —
520 1,397
Funded status at end of year $ (2,563) $ (4,724) $ (10,536) $ (11,570) $ (16,399) $ (17,304)

F-28
The net amounts recognized in Viad’s consolidated balance sheets under the caption “Pension and postretirement benefits” as of December 31 were as follows:
PostretirementBenefit Plans Funded Plans Unfunded Plans
(in thousands) 2013 2012 2013 2012 2013 2012Other current liabilities $ — $ — $ 713 $ 816 $ 928 $ 392Non-current liabilities 2,563 4,724 9,823 10,754 15,471 16,912Net amount recognized $ 2,563 $ 4,724 $ 10,536 $ 11,570 $ 16,399 $ 17,304
Amounts recognized in accumulated other comprehensive income as of December 31, 2013 consisted of:
(in thousands) Funded Plans
Unfunded Plans
Postretirement Benefit Plans Total
Net actuarial loss $ 6,972 $ 3,480 $ 4,692 $ 15,144Prior service credit — — (2,038 ) (2,038)
Subtotal 6,972 3,480 2,654 13,106Less tax effect (2,644) (1,320) (1,006 ) (4,970)
Total $ 4,328 $ 2,160 $ 1,648 $ 8,136
Amounts recognized in accumulated other comprehensive income as of December 31, 2012 consisted of:
(in thousands) Funded Plans
Unfunded Plans
Postretirement Benefit Plans Total
Net actuarial loss $ 9,052 $ 4,548 $ 6,706 $ 20,306Prior service credit — — (2,900 ) (2,900)
Subtotal 9,052 4,548 3,806 17,406Less tax effect (3,433) (1,725) (1,443 ) (6,601)
Total $ 5,619 $ 2,823 $ 2,363 $ 10,805
The estimated net actuarial loss for the pension plans that is expected to be amortized from accumulated other comprehensive income into net periodic pension cost in 2014 is approximately $416,000. The estimated net actuarial loss for the postretirement benefit plans that is expected to be amortized from accumulated other comprehensive income into net periodic benefit cost in 2014 is approximately $405,000. The estimated prior service credit for the postretirement benefit plans that is expected to be amortized from accumulated other comprehensive income into net periodic benefit credit in 2014 is approximately $592,000.
The fair value of the domestic plans’ assets by asset class was as follows: Fair Value Measurements at December 31, 2013
Quoted Prices in Active Markets
Significant Other
Observable Inputs
Significant Unobserved
Inputs (in thousands) Total (Level 1) (Level 2) (Level 3) Domestic pension plans:
Fixed income securities $ 5,966 $ 5,966 $ — $ —U.S. equity securities 4,542 4,542 — —Cash 147 147 — —Other 217 — 217 —
Total $ 10,872 $ 10,655 $ 217 $ —Postretirement benefit plans:
Fixed income securities $ 407 $ 407 $ — $ —U.S. equity securities 109 109 — —Cash 4 4 — —
Total $ 520 $ 520 $ — $ —

F-29
Fair Value Measurements at December 31, 2012
Quoted Prices in Active Markets
Significant Other
Observable Inputs
Significant Unobserved
Inputs (in thousands) Total (Level 1) (Level 2) (Level 3) Domestic pension plans:
Cash $ 10,401 $ 10,401 $ — $ —Other 223 — 223 —
Total $ 10,624 $ 10,401 $ 223 $ —Postretirement benefit plans:
Cash $ 1,397 $ 1,397 $ — $ —
The significant amount of investments held in cash in the domestic pension and postretirement plans as of December 31, 2012 was due to a change in the investment custodian during December 2012. All securities held by the previous custodian were liquidated to cash and transferred to the new custodian in December 2012. During January and February 2013, the new custodian invested the plans’ assets in a mix of equities and fixed income securities approximating the same mixes as December 31, 2011.
Viad employs a total return investment approach whereby a mix of equities and fixed income securities is used to maximize the long-term return of plan assets for a prudent level of risk. Risk tolerance is established through careful consideration of plan liabilities, plan funded status, and corporate financial condition. The investment portfolio contains a diversified blend of equity and fixed income securities. Furthermore, equity securities are diversified across U.S. and non-U.S. stocks, as well as growth and value. Investment risk is measured and monitored on an ongoing basis through quarterly investment portfolio reviews and annual liability measurements.
Viad utilizes a building-block approach in determining the long-term expected rate of return on plan assets. Historical markets are studied and long-term historical relationships between equity securities and fixed income securities are preserved consistent with the widely accepted capital market principle that assets with higher volatility generate a greater return over the long run. Current market factors such as inflation and interest rates are evaluated before long-term capital market assumptions are determined. The long-term portfolio return also considers diversification and rebalancing. Peer data and historical returns are reviewed relative to Viad’s assumed rates for reasonableness and appropriateness.
The following pension and postretirement benefit payments, which reflect expected future service, as appropriate, are expected to be paid, as well as the Medicare Part D subsidy expected to be received:
(in thousands) Funded Plans
Unfunded Plans
Postretirement Benefit Plans
Medicare Part D Subsidy
Receipts
2014 $ 853 $ 729 $ 1,739 $ 2542015 879 716 1,702 2542016 830 806 1,691 2532017 865 827 1,649 2512018 857 894 1,609 2472019-2022 4,668 4,211 7,330 1,169

F-30
Foreign Pension Plans. Certain of Viad’s foreign operations also maintain trusteed defined benefit pension plans covering certain employees which are funded by the companies, and unfunded defined benefit pension plans providing supplemental benefits to select management employees. These plans use traditional defined benefit formulas based on years of service and final average compensation. Funding policies provide that payments to defined benefit pension trusts shall be at least equal to the minimum funding required by applicable regulations. The components of net periodic benefit cost and other amounts recognized in other comprehensive income included the following: (in thousands) 2013 2012 2011 Net periodic benefit cost:
Service cost $ 534 $ 491 $ 366Interest cost 702 737 729Expected return on plan assets (698) (622 ) (665)Recognized net actuarial loss 248 201 73
Net periodic benefit cost 786 807 503Other changes in plan assets and benefit obligations recognized in other comprehensive income:
Net actuarial loss (gain) (1,214) 958 1,936Reversal of amortization of net actuarial loss (248) (201 ) (73)
Total recognized in other comprehensive income (loss) (1,462) 757 1,863Total recognized in net periodic benefit cost and other comprehensive income (loss) $ (676) $ 1,564
$ 2,366
The following table represents the funded status of the plans as of December 31:
Funded Plans Unfunded Plans(in thousands) 2013 2012 2013 2012Change in benefit obligation:
Benefit obligation at beginning of year $ 15,387 $ 13,141 $ 3,032 $ 2,939Service cost 534 491 — —Interest cost 582 607 120 130Actuarial adjustments (473) 1,086 44 113Benefits paid (3,644) (328) (219 ) (220)Translation adjustment (926) 390 (66 ) 70
Benefit obligation at end of year 11,460 15,387 2,911 3,032Change in plan assets:
Fair value of plan assets at beginning of year 12,997 11,028 — —Actual return on plan assets 1,148 860 — —Company contributions 1,892 1,111 219 220Benefits paid (3,644) (328) (219 ) (220)Translation adjustment (833) 326 — —
Fair value of plan assets at end of year 11,560 12,997 — —Funded status at end of year $ 100 $ (2,390) $ (2,911 ) $ (3,032)
As of December 31, 2013 and 2012, the foreign funded plans had net assets of $100,000 and net liabilities of $2.4 million, respectively. The unfunded plans had liabilities of $2.9 million and $3.0 million at December 31, 2013 and 2012, respectively. These amounts are each included in the consolidated balance sheets under the caption “Pension and postretirement benefits.”
The net actuarial losses for the foreign funded plans as of December 31, 2013 and 2012 were $3.8 million ($2.8 million after-tax) and $5.3 million ($3.9 million after-tax), respectively. The net actuarial losses as of December 31, 2013 and 2012 for the foreign unfunded plans were $367,000 ($275,000 after-tax) and $366,000 ($271,000 after-tax), respectively.
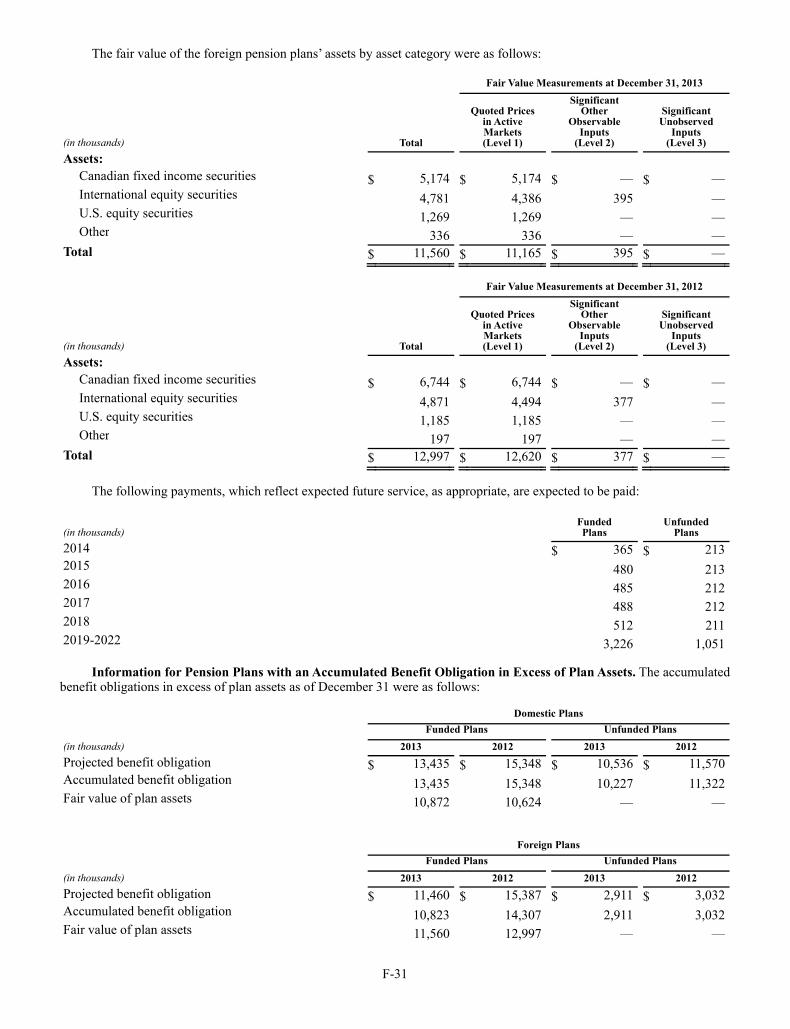
F-31
The fair value of the foreign pension plans’ assets by asset category were as follows: Fair Value Measurements at December 31, 2013
(in thousands) Total
Quoted Prices in Active Markets (Level 1)
Significant Other
Observable Inputs
(Level 2)
Significant Unobserved
Inputs (Level 3)
Assets: Canadian fixed income securities $ 5,174 $ 5,174 $ — $ —International equity securities 4,781 4,386 395 —U.S. equity securities 1,269 1,269 — —Other 336 336 — —
Total $ 11,560 $ 11,165 $ 395 $ — Fair Value Measurements at December 31, 2012
(in thousands) Total
Quoted Prices in Active Markets (Level 1)
Significant Other
Observable Inputs
(Level 2)
Significant Unobserved
Inputs (Level 3)
Assets: Canadian fixed income securities $ 6,744 $ 6,744 $ — $ —International equity securities 4,871 4,494 377 —U.S. equity securities 1,185 1,185 — —Other 197 197 — —
Total $ 12,997 $ 12,620 $ 377 $ — The following payments, which reflect expected future service, as appropriate, are expected to be paid:
(in thousands) Funded Plans
Unfunded Plans
2014 $ 365 $ 2132015 480 2132016 485 2122017 488 2122018 512 2112019-2022 3,226 1,051
Information for Pension Plans with an Accumulated Benefit Obligation in Excess of Plan Assets. The accumulated benefit obligations in excess of plan assets as of December 31 were as follows: Domestic Plans Funded Plans Unfunded Plans(in thousands) 2013 2012 2013 2012Projected benefit obligation $ 13,435 $ 15,348 $ 10,536 $ 11,570Accumulated benefit obligation 13,435 15,348 10,227 11,322Fair value of plan assets 10,872 10,624 — —
Foreign Plans Funded Plans Unfunded Plans(in thousands) 2013 2012 2013 2012Projected benefit obligation $ 11,460 $ 15,387 $ 2,911 $ 3,032Accumulated benefit obligation 10,823 14,307 2,911 3,032Fair value of plan assets 11,560 12,997 — —

F-32
Contributions. In aggregate for both the domestic and foreign plans, the Company anticipates contributing $1.4 million to the funded pension plans, $942,000 to the unfunded pension plans and $950,000 to the postretirement benefit plans in 2014.
Weighted-Average Assumptions. Weighted-average assumptions used to determine benefit obligations as of December 31 were as follows: Domestic Plans
Funded Plans Unfunded Plans Postretirement Benefit Plans Foreign Plans
2013 2012 2013 2012 2013 2012 2013 2012Discount rate 4.89% 4.11% 4.60% 3.80% 4.65% 3.85 % 4.67% 4.06%Rate of compensation increase N/A N/A 3.00% 4.50% N/A N/A 3.00% 3.00%
Weighted-average assumptions used to determine net periodic benefit cost were as follows: Domestic Plans Postretirement
Benefit Plans
Funded Plans Unfunded Plans Foreign Plans 2013 2012 2013 2012 2013 2012 2013 2012Discount rate 4.09% 4.93% 3.80% 4.75% 3.85% 4.70% 4.03% 4.65%Expected return on plan assets 3.90% 4.20% N/A N/A 0.00% 4.65% 5.44% 5.45%Rate of compensation increase N/A N/A 4.50% 4.50% N/A N/A 3.00% 3.00%
The assumed health care cost trend rate used in measuring the December 31, 2013 accumulated postretirement benefit obligation was 8.0 percent, declining one-half percent each year to the ultimate rate of 5.0 percent by the year 2019 and remaining at that level thereafter. The assumed health care cost trend rate used in measuring the December 31, 2012 accumulated postretirement benefit obligation was 8.5 percent, declining one-half percent each year to the ultimate rate of 5.0 percent by the year 2019 and remaining at that level thereafter.
A one-percentage-point increase in the assumed health care cost trend rate for each year would increase the accumulated postretirement benefit obligation as of December 31, 2013 by approximately $1.5 million and the total of service and interest cost components by approximately $113,000. A one-percentage-point decrease in the assumed health care cost trend rate for each year would decrease the accumulated postretirement benefit obligation as of December 31, 2013 by approximately $1.3 million and the total of service and interest cost components by approximately $90,000.
Multi-employer Plans. Viad contributes to defined benefit pension plans under the terms of collective-bargaining agreements that cover its union-represented employees. The financial risks of participating in these multi-employer pension plans generally include the fact that assets contributed to the plan by one employer may be used to provide benefits to employees of other participating employers. Furthermore, if a participating employer ceases to contribute to the plan, the unfunded obligations of the plan may be borne by the remaining participating employers. In addition, if Viad were to discontinue its participation in some of its multi-employer pension plans, the Company may be required to pay those plans a withdrawal liability amount based on the underfunded status of the plan. Viad also contributes to defined contribution plans pursuant to its collective-bargaining agreements, which are generally not subject to the funding risks inherent in defined benefit pension plans. The overall level of Viad’s contributions to its multi-employer plans may significantly vary from year to year based on the demand for union-represented labor to support the Company’s operations. Viad does not have any minimum contribution requirements for future periods pursuant to its collective-bargaining agreements for individually significant multi-employer plans.

F-33
Viad’s participation in multi-employer pension plans for 2013 is outlined in the following table. Unless otherwise noted, the most recent Pension Protection Act zone status available in 2013 and 2012 relates to the plan’s year end as of December 31, 2012 and 2011, respectively, and is based on information received from the plan. Among other factors, plans in the red zone are generally less than 65 percent funded, plans in the yellow zone are less than 80 percent funded, and plans in the green zone are at least 80 percent funded. The “FIP/RP Status Pending/Implemented” column indicates plans for which a financial improvement plan or a rehabilitation plan is either pending or has been implemented.
Plan Pension
Protection Act Zone Status
FIP/RP Status
Pending/ Implemented
Viad Contributions Surcharg
e Paid
Expiration Date of
Collective- Bargaining
Agreement(s) (in thousands) EIN No. 2013 2012 2013 2012 2011 Pension Fund: Western Conference of Teamsters Pension Plan 91-6145047 1
Green Green No $ 5,524 $ 5,694 $ 5,720
No
3/31/14 to 5/31/15
Southern California Local 831—Employer Pension Fund(1) 95-6376874 1
Green Green No 2,244 2,358 2,232
No 8/31/14National Electrical Benefit Fund 53-0181657 1
Green Green No 1,631 1,814 1,691
No
5/31/14 to 6/16/14
Chicago Regional Council of Carpenters Pension Fund(2) 36-6130207 1
Yellow Yellow Yes 1,614 1,749 1,411
No 5/31/14
Electrical Contractors Assoc. Chicago Local Union 134, IBEW Joint Pension Trust of Chicago Plan #2 51-6030753 2
Green Green No 957 108 —
No 6/3/14Central States, Southeast and Southwest Areas Pension Plan 36-6044243 1
Red Red Yes 836 874 725
No 7/31/15Southwest Carpenters Pension Trust 95-6042875 1
Green Green No 812 944 1,031
No 6/30/15
Machinery Movers Riggers & Mach Erect Local 136 Supplemental Retirement Plan(1),(2) 36-1416355 1
Red Red Yes 430 930 386
No 6/30/14Nevada Resort Association IATSE Local 720 Retirement Plan 51-0144767 1
Red Red Yes 367 516 329
No 12/31/14Sign Pictorial & Display Industry Pension Plan 94-6278490 1
Green Green No 367 196 191
No 3/31/15
Carpenters Retirement Plan of Western Washington 91-6029051 1
Green Green No 357 357 286
No 5/31/13
New England Teamsters & Trucking Industry Pension(3) 04-6372430 1
Yellow Red Yes 347 334 339
No 3/31/17
Steelworkers Pension Trust 23-6648508 499
Green Green No 266 326 422
No
3/31/13 to 2/28/15
All other funds(4) 2,592 2,468 2,946 Total contributions to defined benefit plans 18,344 18,668 17,709
Total contributions to other plans 1,969 2,001 1,892
Total contributions to multi-employer plans $ 20,313 $ 20,669 $ 19,601
(1) The Company contributed more than 5 percent of total plan contributions for the 2012 and 2011 plan years based on the plans’ Form 5500s. (2) Zone status as of 6/30/12 and 6/30/11. (3) Zone status as of 9/30/12 and 9/30/11. (4) Represents participation in 37 pension funds during 2013.
Other Employee Benefits. Costs of the 401(k) Plan and other benefit plans totaled $1.3 million, $1.7 million and $1.3 million in 2013, 2012 and 2011, respectively.

F-34
Note 17. Restructuring Charges
Marketing & Events Group Consolidation
Beginning in 2009, Viad commenced certain restructuring actions designed to reduce the Company’s cost structure primarily within the Marketing & Events U.S. segment, and to a lesser extent in the Marketing & Events International segment. The Company implemented a strategic reorganization plan in order to consolidate the separate business units within the Marketing & Events U.S. segment. The Company also consolidated facilities and streamlined its operations in the United Kingdom and Germany. As a result, the Company recorded restructuring charges in 2013, 2012 and 2011, primarily consisting of severance and related benefits as a result of workforce reductions and charges related to the consolidation and downsizing of facilities representing the remaining operating lease obligations (net of estimated sublease income) and related costs. During 2012 and 2011, the Company recorded restructuring charges related to leased facility consolidations and optimization of the Marketing & Events U.S. segment’s service delivery network.
Other Restructurings
The Company has recorded restructuring charges in connection with the consolidation of certain support functions at its corporate headquarters, and certain reorganization activities within the Travel & Recreation Group. These charges primarily consist of severance and related benefits due to headcount reductions. In addition, the Company had recorded significant restructuring charges in past years, primarily within the Marketing & Events U.S. segment. These legacy restructuring liabilities represented the remaining contractual lease obligations on certain facilities, and were subject to periodic adjustments as a result of changes in estimated sublease activity and other factors.
The table below represents a reconciliation of beginning and ending liability balances by major restructuring activity:
Marketing & Events Group Consolidation Other Restructurings
(in thousands)
Severance &Employee Benefits Facilities
Severance &Employee Benefits Facilities Total
Balance at January 1, 2011 $ 1,106 $ 5,051 $ 197 $ 1,642 $ 7,996Restructuring charges 1,182 2,519 26 55 3,782Cash payments (1,175) (2,356) (199) (158) (3,888)Adjustment to liability (294) (397) — (263) (954)Foreign currency translation adjustment 12 2 — — 14Balance at December 31, 2011 831 4,819 24 1,276 6,950Restructuring charges 2,506 2,346 90 — 4,942Cash payments (2,670) (1,567) (114) (343) (4,694)Adjustment to liability 51 (27) — — 24Foreign currency translation adjustment 2 — — — 2Balance at December 31, 2012 720 5,571 — 933 7,224Restructuring charges (recoveries) 2,931 (315) 1,967 (692) 3,891Cash payments (2,411) (1,691) (498) (241) (4,841)Adjustment to liability — — (478) — (478)Balance at December 31, 2013 $ 1,240 $ 3,565 $ 991 $ — $ 5,796
As of December 31, 2013, the liabilities related to severance and employee benefits are expected to be paid by the end of 2014. Additionally, the liability of $3.6 million related to future lease payments are to be paid over the remaining lease terms at the Marketing & Events Group. See Note 20 for information regarding restructuring charges by segment.
Note 18. Leases and Other
Viad has entered into operating leases for the use of certain of its offices, equipment and other facilities. These leases expire over periods up to 40 years. Leases which expire are generally renewed or replaced by similar leases. Some leases contain scheduled rental increases accounted for on a straight-line basis.

F-35
As of December 31, 2013, Viad’s future minimum rental payments and related sublease rentals receivable with respect to non-cancelable operating leases with terms in excess of one year were as follows:
(in thousands) Rental
Payments Receivable
Under Subleases
2014 $ 19,808 $ 1,6652015 14,371 1,2122016 9,439 9632017 7,870 9632018 6,097 873Thereafter 8,137 1,092
Total $ 65,722 $ 6,768
Net rent expense under operating leases consisted of the following: (in thousands) 2013 2012 2011 Minimum rentals $ 34,201 $ 36,309 $ 30,860Sublease rentals (6,815) (6,501 ) (6,497)
Total rentals, net $ 27,386 $ 29,808 $ 24,363
The aggregate annual maturities and the related amounts representing interest on capital lease obligations are included in Note 9.
In addition, as of December 31, 2013, the Company had aggregate purchase obligations of $31.6 million related to various licensing agreements, consulting and other contracted services.
Note 19. Litigation, Claims, Contingencies and Other
Viad and certain of its subsidiaries are plaintiffs or defendants to various actions, proceedings and pending claims, some of which involve, or may involve, compensatory, punitive or other damages. Litigation is subject to many uncertainties and it is possible that some of the legal actions, proceedings or claims could be decided against Viad. Although the amount of liability as of December 31, 2013 with respect to these matters is not ascertainable, Viad believes that any resulting liability, after taking into consideration amounts already provided for and insurance coverage, will not have a material effect on Viad’s business, financial position or results of operations.
Viad is subject to various U.S. federal, state and foreign laws and regulations governing the prevention of pollution and the protection of the environment in the jurisdictions in which Viad has or had operations. If the Company has failed to comply with these environmental laws and regulations, civil and criminal penalties could be imposed and Viad could become subject to regulatory enforcement actions in the form of injunctions and cease and desist orders. As is the case with many companies, Viad also faces exposure to actual or potential claims and lawsuits involving environmental matters relating to its past operations. Although it is a party to certain environmental disputes, Viad believes that any resulting liabilities, after taking into consideration amounts already provided for and insurance coverage, will not have a material effect on the Company’s financial position or results of operations. As of December 31, 2013 and 2012, Viad had recorded environmental remediation liabilities of $5.0 million and $5.3 million, respectively, related to previously sold operations.
As of December 31, 2013, Viad had certain obligations under guarantees to third parties on behalf of its subsidiaries. These guarantees are not subject to liability recognition in the consolidated financial statements and relate to leased facilities entered into by Viad’s subsidiary operations. The Company would generally be required to make payments to the respective third parties under these guarantees in the event that the related subsidiary could not meet its own payment obligations. The maximum potential amount of future payments that Viad would be required to make under all guarantees existing as of December 31, 2013 would be $13.7 million. These guarantees relate to leased facilities expiring through October 2017. There are no recourse provisions that would enable Viad to recover from third parties any payments made under the guarantees. Furthermore, there are no collateral or similar arrangements whereby Viad could recover payments.
A significant portion of Viad’s employees are unionized and the Company is a party to approximately 100 collective-bargaining agreements, with approximately one-third requiring renegotiation each year. As of December 31, 2013, approximately 30 percent of Viad’s regular full-time employees are covered by collective-bargaining agreements. If the

F-36
Company were unable to reach an agreement with a union during the collective-bargaining process, the union may call for a strike or work stoppage, which may, under certain circumstances, adversely impact the Company’s businesses and results of operations. Viad believes that relations with its employees are satisfactory and that collective-bargaining agreements expiring in 2014 will be renegotiated in the ordinary course of business without having a material adverse effect on Viad’s operations.
Viad’s businesses contribute to various multi-employer pension plans based on obligations arising under collective bargaining agreements covering its union-represented employees. Viad’s contributions to these plans in 2013, 2012 and 2011 totaled $20.3 million, $20.7 million and $19.6 million, respectively. Based upon the information available to Viad from plan administrators, management believes that several of these multi-employer plans are underfunded. The Pension Protection Act of 2006 requires pension plans underfunded at certain levels to reduce, over defined time periods, the underfunded status. In addition, under current laws, the termination of a plan, or a voluntary withdrawal from a plan by Viad, or a shrinking contribution base to a plan as a result of the insolvency or withdrawal of other contributing employers to such plan, would require Viad to make payments to such plan for its proportionate share of the plan’s unfunded vested liabilities. As of December 31, 2013, the amount of additional funding, if any, that Viad would be required to make related to multi-employer pension plans is not ascertainable.
On December 31, 2013, Glacier Park’s concession contract to operate lodging, tour and transportation and other hospitality services for Glacier National Park expired. Glacier Park generated approximately 47 percent of its 2013 revenue through its concession contract for services provided within Glacier National Park.
Upon completion of the contract term, the Company received in January 2014 cash payments totaling $25 million for the Company’s “possessory interest,” which generally means the value of the structures acquired or constructed, fixtures installed and improvements made to the concession property at Glacier National Park during the term of the concession contract. The Company anticipates a cash payment of approximately $5 million for the personal property Glacier Park used at the facilities covered by the concession contract.
Glacier Park continues to generate revenue from the five properties it owns: (1) St. Mary Lodge in St. Mary, Montana; (2) Glacier Park Lodge in East Glacier, Montana; (3) Grouse Mountain Lodge in Whitefish, Montana; (4) the Prince of Wales Hotel in Waterton Lakes National Park, Alberta; and (5) Motel Lake McDonald, which is located inside Glacier National Park. Glacier Park also continues to operate the food and beverage services with respect to these properties and the retail shops located near Glacier National Park. The five properties Glacier Park currently owns contain more than one-half of the rooms that Glacier Park operated in 2013.

F-37
Note 20. Segment Information
Viad measures profit and performance of its operations on the basis of segment operating income which excludes restructuring charges and recoveries and impairment charges and recoveries. Intersegment sales are eliminated in consolidation and intersegment transfers are not significant. Corporate activities include expenses not allocated to operations. Depreciation and amortization and share-based compensation expense are the only significant non-cash items for the reportable segments. No reportable segment has a client comprising more than 7.0 percent of that segment’s revenues, and no client comprises more than 4.5 percent of Viad’s revenues. Disclosures regarding Viad’s reportable segments with reconciliations to consolidated totals are as follows: (in thousands) 2013 2012 2011 Revenues: Marketing & Events Group:
U.S. $ 628,856 $ 676,772 $ 631,360International 229,312 240,137 218,639Intersegment eliminations (13,264) (14,869 ) (9,449)
844,904 902,040 840,550Travel & Recreation Group 127,888 123,191 101,814Total Revenue $ 972,792 $ 1,025,231 $ 942,364Segment operating income (loss): Marketing & Events Group:
U.S. $ 11,024 $ 5,579 $ (6,269)International 9,068 12,321 11,449
20,092 17,900 5,180Travel & Recreation Group 25,799 23,962 20,196 45,891 41,862 25,376
Corporate activities (6,755) (9,408 ) (7,682) 39,136 32,454 17,694
Interest income 550 593 779Interest expense (1,234) (1,303 ) (1,511)
Restructuring recoveries (charges): Marketing & Events U.S. 409 (3,479 ) (3,756)Marketing & Events International (2,362) (1,373 ) —Travel & Recreation Group (907) (79 ) —Corporate (1,031) (11 ) (26)
Impairment charges: Marketing & Events U.S. (658) — —Marketing & Events International (294) — —Travel & Recreation Group (4,461) — —
Income from continuing operations before income taxes $ 29,148 $ 26,802 $ 13,180

F-38
(in thousands) 2013 2012 2011 Assets: Marketing & Events Group:
U.S. $ 194,422 $ 203,145 $ 213,843International 81,058 100,387 96,996
Travel & Recreation Group 209,611 223,199 194,278Corporate and other 76,841 123,846 112,711 $ 561,932 $ 650,577 $ 617,828Depreciation and amortization: Marketing & Events Group:
U.S. $ 14,906 $ 17,643 $ 17,247International 5,566 5,162 5,027
Travel & Recreation Group 7,967 7,781 6,674Corporate and other 176 145 178 $ 28,615 $ 30,731 $ 29,126Capital expenditures: Marketing & Events Group:
U.S. $ 8,278 $ 7,525 $ 11,692International 4,332 4,913 5,635
Travel & Recreation Group 23,108 15,201 3,271Corporate and other 401 36 940 $ 36,119 $ 27,675 $ 21,538
Products and Services. Viad’s revenues for each group of products and services are presented in the following table: (in thousands) 2013 2012 2011 Revenues:
Exhibition and event services $ 685,350 $ 726,429 $ 670,054Exhibits and environments 159,554 175,611 170,496Travel and recreation services 127,888 123,191 101,814
Total revenues $ 972,792 $ 1,025,231 $ 942,364
Geographic Areas. Viad’s foreign operations are located principally in Canada, the United Kingdom, Germany and the United Arab Emirates. Marketing & Events Group revenues are designated as domestic or foreign based on the originating location of the product or service. Long-lived assets are attributed to domestic or foreign based principally on the physical location of the assets. Long-lived assets consist of “Property and equipment, net” and “Other investments and assets.” The table below presents the financial information by major geographic area: (in thousands) 2013 2012 2011 Revenues:
United States $ 656,927 $ 700,414 $ 660,998United Kingdom 151,217 153,027 124,208Canada 148,934 151,070 140,374Other international 15,714 20,720 16,784
Total revenues $ 972,792 $ 1,025,231 $ 942,364Long-lived assets:
United States $ 132,315 $ 141,727 $ 145,217Canada 82,986 76,067 47,624United Kingdom 9,631 9,757 8,165Other international 424 2,163 3,858
Total long-lived assets $ 225,356 $ 229,714 $ 204,864

F-39
Note 21. Common Stock Repurchases
In December 2012, Viad announced the authorization of its Board of Directors to repurchase shares of the Company’s common stock from time to time at prevailing market prices. No shares were repurchased on the open market during 2013. During 2012 and 2011, Viad repurchased 23,183 shares for $526,000 and 250,760 shares for $4.6 million, respectively. As of December 31, 2013, 1,030,438 shares remain available for repurchase. Additionally, during 2013, 2012 and 2011, the Company repurchased 50,156 shares for $1.3 million, 56,885 shares for $1.1 million and 28,627 shares for $679,000, respectively, related to tax withholding requirements on share-based awards.
Note 22. Discontinued Operations
In 2013 and 2012, Viad recorded income from discontinued operations of $1.1 million and $624,000, respectively, primarily related to the sale of land associated with previously sold operations. In 2011, Viad recorded income from discontinued operations of $451,000 related to the reversal of certain liabilities associated with previously sold operations.
Note 23. Condensed Consolidated Quarterly Results (Unaudited)
The following quarterly financial information was derived from the Company’s interim financial statements and was prepared in a manner consistent with the annual financial statements and includes all adjustments (consisting of normal recurring accruals) considered necessary for a fair presentation. 2013 2012
(in thousands, except per share data) First
Quarter Second Quarter
Third Quarter
Fourth Quarter
First Quarter
Second Quarter
Third Quarter
Fourth Quarter
Revenues: $ 285,163 $ 249,314 $ 236,473 $ 201,842 $ 268,772 $ 246,450 $ 307,457 $ 202,552Operating income (loss):
Ongoing operations(1) $ 12,827 $ 10,881 $ 24,624 $ (2,441) $ 5,533 $ 10,498 $ 34,182 $ (8,351)Corporate activities
(806) (1,167) (2,034) (2,748) (1,777) (2,187) (2,036) (3,408)Restructuring charges (720) (773) (714) (1,684) (2,225) (678) (608) (1,431)Impairment charges — — (5,413) — — — — —Operating income (loss) $ 11,301 $ 8,941 $ 16,463 $ (6,873) $ 1,531 $ 7,633 $ 31,538 $ (13,190)
Income (loss) from continuing operations attributable to Viad(2) $ 8,065 $ 6,253 $ 10,849 $ (4,740) $ 1,027 $ 5,451
$ 19,976 $ (21,181)
Net income (loss) attributable to Viad(2) $ 8,065 $ 6,253 $ 11,855 $ (4,618) $ 1,027 $ 6,090 $ 19,976 $ (21,196)Income (loss) per common share-Diluted(2),(3):
Income (loss) from continuing operations attributable to Viad
$ 0.40 $ 0.31 $ 0.53 $ (0.24) $ 0.05 $ 0.27
$ 0.99 $ (1.07)
Net income (loss) attributable to Viad $ 0.40 $ 0.31 $ 0.58 $ (0.23) $ 0.05 $ 0.30 $ 0.99 $ (1.07)Income (loss) per common share-Basic(2),(3):
Income (loss) from continuing operations attributable to Viad $ 0.40 $ 0.31 $ 0.53 $ (0.24) $ 0.05 $ 0.27
$ 0.99 $ (1.07)
Net income (loss) attributable to Viad $ 0.40 $ 0.31 $ 0.58 $ (0.23) $ 0.05 $ 0.30 $ 0.99 $ (1.07)(1) Represents revenues less costs of services and products sold. (2) The fourth quarter of 2012 includes a tax charge of $13.4 million representing a valuation allowance for certain deferred
tax assets associated with foreign tax credit carryforwards. (3) The sum of quarterly income per share amounts may not equal annual income per share due to rounding.
Note 24. Subsequent Events
In connection with the expiration of the Company’s concession contract at Glacier National Park, Viad received cash payments in January 2014 totaling $25 million for its “possessory interest,” which generally means the value of the structures acquired or constructed, fixtures installed and improvements made to the concession property during the term of the concession contract. The Company also anticipates a cash payment of approximately $5 million for the personal property Glacier Park uses at the facilities covered by the concession contract.
On January 24, 2014, Viad announced that its Board of Directors declared a special cash dividend of $1.50 per share, or approximately $30.5 million in the aggregate, to shareholders of record at the close of business on February 7, 2014. The dividend was paid on February 14, 2014.

F-40
REPORT OF INDEPENDENT REGISTERED PUBLIC ACCOUNTING FIRM
Board of Directors and Stockholders Viad Corp Phoenix, Arizona
We have audited the accompanying consolidated balance sheets of Viad Corp and subsidiaries (the “Company”) as of December 31, 2013 and 2012, and the related consolidated statements of operations, comprehensive income, stockholders’ equity and cash flows for each of the three years in the period ended December 31, 2013. Our audits also included the financial statement schedule listed in the Index at Item 15. These consolidated financial statements and financial statement schedule are the responsibility of the Company’s management. Our responsibility is to express an opinion on these consolidated financial statements and financial statement schedule based on our audits.
We conducted our audits in accordance with the standards of the Public Company Accounting Oversight Board (United States). Those standards require that we plan and perform the audit to obtain reasonable assurance about whether the financial statements are free of material misstatement. An audit includes examining, on a test basis, evidence supporting the amounts and disclosures in the financial statements. An audit also includes assessing the accounting principles used and significant estimates made by management, as well as evaluating the overall financial statement presentation. We believe that our audits provide a reasonable basis for our opinion.
In our opinion, such consolidated financial statements present fairly, in all material respects, the financial position of the Company as of December 31, 2013 and 2012, and the results of its operations and its cash flows for each of the three years in the period ended December 31, 2013, in conformity with accounting principles generally accepted in the United States of America. Also, in our opinion, such financial statement schedule, when considered in relation to the basic consolidated financial statements taken as a whole, presents fairly, in all material respects, the information set forth therein.
We have also audited, in accordance with the standards of the Public Company Accounting Oversight Board (United States), the Company’s internal control over financial reporting as of December 31, 2013, based on the criteria established in Internal Control-Integrated Framework (1992) issued by the Committee of Sponsoring Organizations of the Treadway Commission and our report dated March 7, 2014 expressed an unqualified opinion on the Company’s internal control over financial reporting.
/s/ DELOITTE & TOUCHE LLP Deloitte & Touche LLP Phoenix, Arizona March 7, 2014

F-41
VIAD CORP SCHEDULE II – VALUATION AND QUALIFYING ACCOUNTS
Additions Deductions
Balance atBeginning Charged to
Charged toOther
Credited to Other Balance at
(in thousands) of Year Expense Accounts Write Offs Accounts End of Year Allowance for doubtful accounts:
December 31, 2011 $ 1,172 1,696 — (1,796) — $ 1,072December 31, 2012 1,072 708 — (630) — 1,150December 31, 2013 1,150 313 — (586) — 877
Deferred tax valuation allowance: December 31, 2011 $ 411 — — (55) — $ 356December 31, 2012 356 14,220 — — — 14,576December 31, 2013 14,576 1,917 — (4,100) — 12,393

EXHIBIT INDEX Exhibit # 3.A
Copy of Restated Certificate of Incorporation of Viad Corp, as amended through July 1, 2004, filed as Exhibit 3.Ato Viad Corp’s Form 10-Q for the period ended June 30, 2004, is hereby incorporated by reference (SEC File No. 001-11015; SEC Film No. 04961107).
3.B
Copy of Bylaws of Viad Corp, as amended through December 5, 2013, filed as Exhibit 3 to Viad Corp’s Form 8-K filed December 9, 2013, is hereby incorporated by reference.
4.A1
Copy of $130,000,000 Amended and Restated Credit Agreement dated as of May 18, 2011 and Affirmation and Amendment of Collateral Documents dated as of May 18, 2011, filed as Exhibit 4 to Viad Corp’s Form 8-K filed May 24, 2011, is hereby incorporated by reference.
4.A2
Copy of amendment No. 1 to the $130,000,000 Amended and Restated Credit Agreement dated as of May 18, 2011, effective as of December 12, 2012, filed as Exhibit 4 to Viad Corp’s Form 8-K filed December 14, 2012, is hereby incorporated by reference.
4.A3
Copy of amendment No. 2 to the $130,000,000 Amended and Restated Credit Agreement dated as of May 18, 2011, effective as of November 14, 2013, filed as Exhibit 4 to Viad Corp’s Form 8-K filed November 14, 2013, is hereby incorporated by reference.
4.B
Copy of Pledge and Security Agreement, Guaranty, and Subsidiary Pledge and Security Agreement dated as of June 30, 2004, filed as Exhibit 4.A to Viad Corp’s Form 10-Q for the period ended June 30, 2004, is hereby incorporated by reference (SEC File No. 001-11015; SEC Film No. 04961107).
10.A1
Copy of 2007 Viad Corp Omnibus Incentive Plan, filed as Appendix A to Viad Corp’s Proxy Statement for the 2012 Annual Meeting of Shareholders, filed April 13, 2012, is hereby incorporated by reference.+
10.A2
Copy of form of Restricted Stock Agreement-Executives, effective as of February 25, 2008, pursuant to the 2007 Viad Corp Omnibus Incentive Plan, filed as Exhibit 10.C to Viad Corp’s Form 8-K filed February 28, 2008, is hereby incorporated by reference (SEC File No. 001-11015).+
10.A3
Copy of form of Restricted Stock Agreement for Outside Directors, effective as of February 25, 2008, pursuant to the 2007 Viad Corp Omnibus Incentive Plan, filed as Exhibit 10.F to Viad Corp’s Form 8-K filed February 28, 2008, is hereby incorporated by reference (SEC File No. 001-11015).+
10.A4
Copy of form of Restricted Stock Agreement-Executives (five-year cliff), effective as of March 23, 2011, pursuant to the 2007 Viad Corp Omnibus Incentive Plan, filed as Exhibit 10.A to Viad Corp’s Form 8-K filed March 29, 2011, is hereby incorporated by reference.+
10.A5
Copy of form of Restricted Stock Agreement – Executives (three-year cliff vesting), effective as of March 23, 2011, pursuant to the 2007 Viad Corp Omnibus Incentive Plan, filed as Exhibit 10.B to Viad Corp’s Form 8-K filed March 29, 2011, is hereby incorporated by reference. +
10.A6
Copy of form of Restricted Stock Units Agreement, effective as of March 23, 2011, pursuant to the 2007 Viad Corp Omnibus Incentive Plan, filed as Exhibit 10.C to Viad Corp’s Form 8-K filed March 29, 2011, is hereby incorporated by reference. +
10.A7
Copy of form of Performance Unit Agreement, effective as of March 23, 2011, pursuant to the 2007 Viad Corp Omnibus Incentive Plan, filed as Exhibit 10.D to Viad Corp’s Form 8-K filed March 29, 2011, is hereby incorporated by reference.+
10.A8
Copy of Viad Corp Performance Unit Incentive Plan, effective as of February 27, 2013, pursuant to the 2007 Viad Corp Omnibus Incentive Plan, filed as Exhibit 10.D to Viad Corp’s Form 8-K filed March 5, 2013, is hereby incorporated by reference.+
10.A9
Copy of Viad Corp Management Incentive Plan, amended as of February 27, 2013, pursuant to the 2007 Viad Corp Omnibus Incentive Plan, filed as Exhibit 10.C to Viad Corp’s Form 8-K filed March 5, 2013, is hereby incorporated by reference.+
10.A10
Copy of form of Non-Qualified Stock Option Agreement, effective as of February 25, 2008, pursuant to the 2007 Viad Corp Omnibus Incentive Plan, filed as Exhibit 10.D to Viad Corp’s Form 8-K filed February 28, 2008, is hereby incorporated by reference (SEC File No. 001-11015).+
10.A11
Copy of form of Non-Qualified Stock Option Agreement, effective as of February 25, 2010, pursuant to the 2007 Viad Corp Omnibus Incentive Plan, filed as Exhibit 10.B to Viad Corp’s Form 8-K filed February 26, 2010, is hereby incorporated by reference.+
10.A12
Copy of form of Incentive Stock Option Agreement, effective as of February 25, 2010, pursuant to the 2007 Viad Corp Omnibus Incentive Plan, filed as Exhibit 10.A to Viad Corp’s Form 8-K filed February 26, 2010, is hereby incorporated by reference.+
10.A13
Copy of form of Restricted Stock Units Agreement, effective as of February 24, 2009, pursuant to the 2007 Viad Corp Omnibus Incentive Plan, filed as Exhibit 10.A to Viad Corp’s Form 8-K filed February 26, 2009, is hereby incorporated by reference (SEC File No. 001-11015).+

10.A14
Copy of form of Restricted Stock Agreement – Executives (three-year cliff vesting), effective as of November 29, 2012, pursuant to the 2007 Viad Corp Omnibus Incentive Plan, filed as Exhibit 10 to Viad Corp’s Form 8-K filed December 3, 2012, is hereby incorporated by reference.+
10.B1
Copy of 1997 Viad Corp Omnibus Incentive Plan, as amended through February 23, 2006, filed as Exhibit 10.A to Viad Corp’s 8-K filed February 28, 2006, is hereby incorporated by reference (SEC File No. 001-11015; SEC Film No. 06650477).+
10.B2
Copy of form of Non-Qualified Stock Option Agreement, as amended through August 13, 2004, pursuant to the 1997 Viad Corp Omnibus Incentive Plan, filed as Exhibit 10.C2 to Viad Corp’s Form 10-Q for the period ended September 30, 2004, is hereby incorporated by reference (SEC File No. 001-11015; SEC Film No. 041123501).+
10.C1
Copy of Viad Corp Deferred Compensation Plan (Executive) Amended and Restated as of August 13, 2004, filed as Exhibit 10.A to Viad Corp’s Form 10-Q for the period ended September 30, 2004, is hereby incorporated by reference (SEC File No. 001-11015; SEC Film No. 041123501).+
10.C2
Copy of form of Viad Corp Executive Severance Plan (Tier I-2013), effective as February 27, 2013, filed as Exhibit 10.B to Viad Corp’s Form 8-K filed March 5, 2013, is hereby incorporated by reference.+
10.C3
Copy of forms of Viad Corp Executive Severance Plans (Tier I and II), amended and restated for Code Section 409A as of January 1, 2005, filed as Exhibit 10.B to Viad Corp’s Form 8-K filed August 29, 2007, is hereby incorporated by reference (SEC File No. 001-11015; SEC Film No. 071088413).+
10.C4
Copy of amendment No. 1 to Viad Corp Executive Severance Plan (Tier I), effective as of February 26, 2014, filed as Exhibit 10 to Viad Corp’s Form 8-K filed March 4, 2014, is hereby incorporated by reference.+
10.C5
Copy of Executive Officer Pay Continuation Policy adopted February 7, 2007, filed as Exhibit 10.A to Viad Corp’s Form 8-K filed February 13, 2007, is hereby incorporated by reference (SEC File No. 001-11015; SEC Film No. 07609762).+
10.D1
Copy of Employment Agreement between Viad Corp and Paul B. Dykstra dated as of May 15, 2007, filed as Exhibit 10.B to Viad Corp’s Form 8-K filed May 21, 2007, is hereby incorporated by reference (SEC File No. 001-11015; SEC Film No. 07867527).+
10.D2
Copy of Amendment No. 1 to Employment Agreement between Viad Corp and Paul B. Dykstra effective as of February 27, 2013, filed as Exhibit 10.A to Viad Corp’s Form 8-K filed March 5, 2013, is hereby incorporated by reference.+
10.E
Copy of Viad Corp Supplemental TRIM Plan, as amended and restated effective January 1, 2005 for Code Section 409A, filed as Exhibit 10.E to Viad Corp’s Form 8-K filed August 29, 2007, is hereby incorporated by reference (SEC File No. 001-11015; SEC Film No. 071088413).+
10.F1
Copy of Viad Corp Supplemental Pension Plan, amended and restated as of January 1, 2005 for Code Section 409A, filed as Exhibit 10.A to Viad Corp’s Form 8-K filed August 29, 2007, is hereby incorporated by reference (SEC File No. 001-11015; SEC Film No. 071088413).+
10.F2
Copy of Viad Corp Defined Contribution Supplemental Executive Retirement Plan, effective as of January 1, 2013, filed as Exhibit 10.E to Viad Corp’s Form 8-K filed March 5, 2013, is hereby incorporated by reference.+
10.G1
Summary of Compensation Program of Non-Employee Directors of Viad Corp as of January 1, 2012, filed as Exhibit 10.G1 to Viad Corp’s 2011 Form 10-K filed March 9, 2012, is hereby incorporated by reference.+
10.G2
Description of Viad Corp Director’s Matching Gift Program, filed as Exhibit 10.Q to Viad Corp’s 1999 Form 10-K filed March 17, 2000, is hereby incorporated by reference (SEC File No. 001-11015; SEC Film No. 572329).+
10.H
Copy of form of Indemnification Agreement between Viad Corp and Directors of Viad Corp, as approved by Viad Corp stockholders on October 16, 1987, as updated to reflect revised company name and gender-neutral references only, and filed as Exhibit 10.I to Viad Corp’s 2008 Form 10-K filed February 27, 2009, is hereby incorporated by reference (SEC File No. 001-11015).+
10.I
Copy of Retirement Plan for Management Employees of Brewster Inc., as amended and restated effective January 1, 2010, and filed as Exhibit 10.J to Viad Corp’s 2009 Form 10-K filed March 8, 2010, is hereby incorporated by reference.+
14
Copy of Code of Ethics of Viad Corp adopted May 13, 2003, filed as Exhibit 14 to Viad Corp’s 2003 Form 10-K filed March 11, 2004, is hereby incorporated by reference (SEC File No. 001-11015; SEC Film No. 04663620).
21 List of Subsidiaries of Viad Corp.* 23
Consent of Independent Registered Public Accounting Firm to the incorporation by reference into specified registration statements on Form S-3 or on Form S-8 of their report contained in this Annual Report.*
24 Power of Attorney signed by Directors of Viad Corp.*

31.1
Exhibit of Certification of Chief Executive Officer of Viad Corp pursuant to Section 302 of the Sarbanes-Oxley Act of 2002.#*
31.2
Exhibit of Certification of Chief Financial Officer of Viad Corp pursuant to Section 302 of the Sarbanes-Oxley Act of 2002.#*
32.1
Additional Exhibit of Certification of Chief Executive Officer of Viad Corp pursuant to Section 906 of the Sarbanes-Oxley Act of 2002.#**
32.2
Additional Exhibit of Certification of Chief Financial Officer of Viad Corp pursuant to Section 906 of the Sarbanes-Oxley Act of 2002.#**
101.INS XBRL Instance Document.** 101.SCH XBRL Taxonomy Extension Schema Document.**101.CAL XBRL Taxonomy Extension Calculation Linkbase Document.**101.DEF XBRL Taxonomy Extension Definition Linkbase Document.**101.LAB XBRL Taxonomy Extension Label Linkbase Document.**101.PRE XBRL Taxonomy Extension Presentation Linkbase Document.**
* Filed herewith.
** Furnished herewith.
+ Management contract or compensation plan or arrangement.
# A signed original of this written statement has been provided to Viad Corp and will be retained by Viad Corp and
furnished to the Securities and Exchange Commission upon request.
Documents incorporated by reference can be read and copied at the SEC’s public reference section, located in Room 1580, 100 F Street, N.E., Washington, DC 20549, and on the SEC’s Internet site at www.sec.gov.

ViaD cORP BOaRD Of DiREctORs
Paul B. Dykstra (4)
Phoenix, Arizona
Chairman, President and Chief Executive Officer
Robert E. Munzenrider (1, 3)
Payson, Arizona
Retired President, Harmon AutoGlass
Margaret E. Pederson (2, 3, 4)
New Canaan, Connecticut
President–Amirexx LLC and Managing Director, Golden Seeds Fund LP
Dr. Albert M. Teplin (1, 2)
Rockville, Maryland
Retired Senior Economist, Board of Governors of the Federal Reserve System
Board Committees(1) Audit Committee (Chair, Robert E. Munzenrider)(2) Corporate Governance and Nominating Committee (Chair, Dr. Albert M. Teplin)(3) Human Resources Committee (Chair, Richard H. Dozer)(4) Innovation & Marketing Strategy Committee (Chair, Margaret E. Pederson)
Edward E. Mace (1, 3)
Denver, Colorado
President of Mace Pacific Holding Company, LLC
Daniel Boggan Jr. (2, 3)
Oakland, California
Retired Senior Vice President and Chief Operating Officer, National Collegiate Athletic Association (NCAA)
Dr. Isabella Cunningham (1, 2, 4)
Austin, Texas
Ernest A. Sharpe Centennial Professor in Communication and Chair of Advertising Department at The University of Texas at Austin
Richard H. Dozer (1, 3)
Phoenix, Arizona
Former President, Arizona Diamondbacks, and President, US Airways Center
Andrew B. Benett (2, 4)
New Canaan, Connecticut
Global Chief Executive Officer of Havas Worldwide and Chief Strategy Officer of Havas Creative Group

MARkETING & EVENTS GROUP
Specialists in the Art and Science of Engagement
There’s more to a successful trade show than meets the eye. As a global leader in trade show and event marketing, Global Experience Specialists (GES) unique-ly combines the art of high-impact creativity and service with the science of easy-to-use technol-ogy, strategy and worldwide logistics to help clients gain more awareness, more involvement and more value from their trade show programs.

MARkETING & EVENTS GROUP
Exhibitor Services
GES offers exhibitors and
marketers a full range of services
and capabilities, from material handling, rig-
ging, electrical and other on-site services to the design
and production of compel-ling, immersive experiences that
engage audiences and build brand awareness. GES experts in design,
brand planning, marketing and analytics create fully-integrated programs that weave
together exhibits, events, audio visual, and full marketing communications, to help exhibitors
engage attendees, generate and measure leads and improve ROI.
Show Organizer Services
GES partners with show organizers to create high-value, face-to-face events that bring buyers and sellers together to
conduct business, learn about new products and services and expand their business network. Along with a complete range of
at-show services, GES offers organizers a full suite of online tools and new technologies that help them more easily manage the complexities
of a trade show.
Other Marketing Services
In addition to marketing communications offered to clients, GES partners with leading entertainment brands, movie studios and sports marketers to generate
buzz and excitement, through national and international promotional tours, large-scale touring exhibitions, PR events and guerilla marketing. GES also partners with
retailers to design and produce unique retail environments and experiences that drive traffic, build brand awareness and improve sales. Retail solutions include pop-up stores and
kiosks, large-scale interactive holiday programs and unique branded installations.

TRAVEL & RECREATION GROUP

Brewster Travel Canada (Brewster)
With expertise in travel planning, hospitality, recreational attractions and transportation, Brewster has been delivering authentic Canadian travel
experiences to the global market for more than a century. Brewster owns and operates three lodging properties and four recreational
attractions within Banff and Jasper National Parks. Brewster’s world-class attractions include: the Banff Gondola; the Columbia Icefield
Glacier Adventure; the Banff Lake Cruise; and, opening in May 2014, the Glacier Skywalk. Brewster also offers in-bound pack-
age tours, corporate and event management services, luxury motorcoach charters, guided sightseeing excursions and
convenient airport shuttle services.
Glacier Park
Glacier Park owns and operates five lodging proper-ties that are ideally located for guests to enjoy the
infinite splendors and majestic scenery of Glacier National Park and Waterton Lakes National Park.
Ranging from historic and rustic to upscale, Glacier Park’s full-service lodges, inns, cabins
and hotels are where the ordinary stops and the journey begins.
Alaska Denali Travel
As Alaska experts and Denali special-ists, the team at Alaska Denali Travel
is committed to sharing the best of Alaska. Alaska Denali Travel
owns and operates two lodg-ing properties and offers
tours in and around Denali National Park, in addition
to providing complete travel planning ser-
vices and vacation packages through-
out Alaska.
TRAVEL & RECREATION GROUP
Passionate Destination Experts
Viad’s Travel & Recreation Group offers guests rich travel experiences in iconic natural destinations in North America through its hotels and lodges, recreational attractions, food and bever-age offerings, retail operations, transporta-tion services and package tours. Composed of Brewster Travel Canada, Glacier Park and Alaska Denali Travel, the group has operations in or adjacent to Glacier and Denali National Parks in the United States and Banff, Jasper and Waterton Lakes National Parks in Canada.

Executive Officers
Paul B. DykstraChairman, President & Chief Executive Officer
Deborah J. DePaoliGeneral Counsel and Secretary
George N. HinesChief Information Officer
Ellen M. IngersollChief Financial Officer
Thomas M. KuczynskiChief Corporate Development & Strategy Officer
G. Michael LattaChief Accounting Officer – Controller
Steven W. MosterGroup President – Marketing & Events
President – Global Experience Specialists, Inc.
Shareholder Information
Annual Shareholders Meeting
The annual meeting of shareholders will be held on:
May 22, 2014
8:00 a.m. (MST)
The Ritz Carlton
2401 East Camelback Road Phoenix, AZ 85016
(602) 468-0700
www.ritzcarlton.com/en/Properties/Phoenix
Transfer Agent
To submit a change of address, to make inquiries regarding dividend payments, to mail Common Stock certificates for transfer or to redeem $4.75 Preferred Stock certificates, please contact:
Wells Fargo Shareowner Services
PO Box 64874 St. Paul, MN 55164-0874
(800) 453-2235
www.wellsfargo.com/shareownerservices
Shareholders of record who receive more than one copy of this annual report may contact our transfer agent and arrange to have their accounts consolidated.
1850 North Central Avenue, Suite 1900 Phoenix, AZ 85004-4565 www.viad.com
Pictured on front cover (from top to bottom): Glacier Skywalk, Rain Room installation at MoMA, Prince of Wales Hotel
85004-4565 www.viad.com
otel
5 www.viad.co