2013-2014 accountability update accountability services
TRANSCRIPT

2013-2014ACCOUNTABILITY UPDATE
Accountability Services

Transition to 5 Achievement Levels
October 2013 State Board of Education adopted four academic achievement levels with descriptors
March 2014State Board of Education adopted an additional academic achievement level for a total of five levels
• Level 1: Limited Command • Level 2: Partial Command • Level 3: Sufficient Command (State Proficiency Standard) • Level 4: Solid Command (College & Career Readiness) • Level 5: Superior Command (College & Career Readiness)

Two Reporting Standards
GLP - Grade Level Proficiency
• Achievement Levels 3 and above
• Used in School Performance Grades
• Present in all accountability reporting and NC School Report Card
• Is not used in AMO calculations
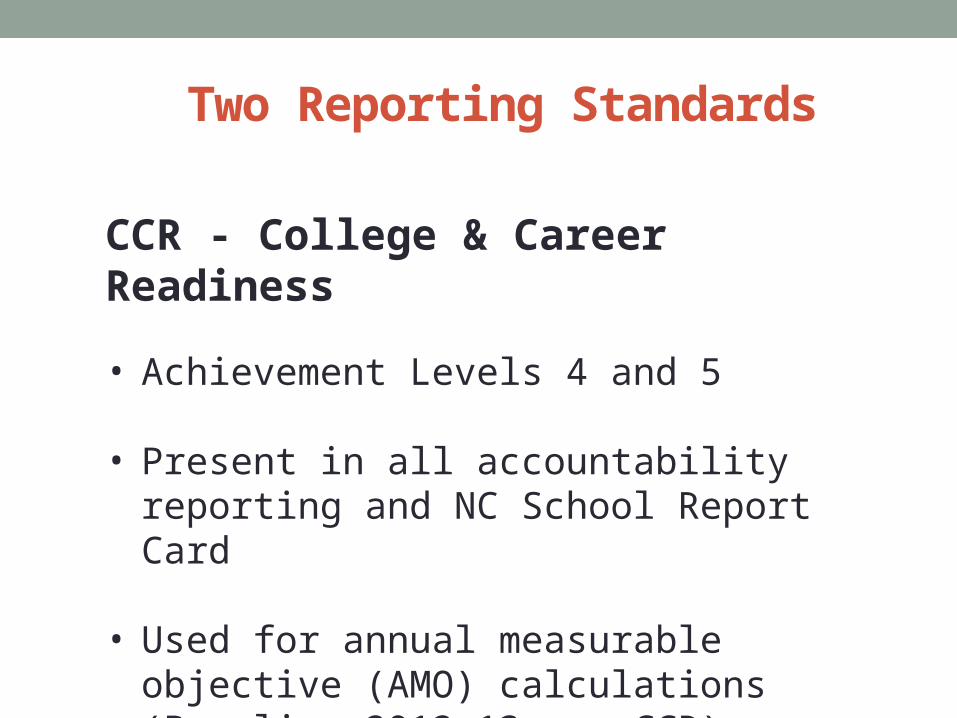
Two Reporting Standards
CCR - College & Career Readiness
• Achievement Levels 4 and 5
• Present in all accountability reporting and NC School Report Card
• Used for annual measurable objective (AMO) calculations (Baseline 2012–13 was CCR)

Understanding the Five Achievement Levels
• Scale score ranges for EOY assessments did not change
• New level III was created from the scale score range that met the standard error of measurement (SEM) for Level II’s

EOG / EOC Scale Score Distribution
Prior to March 2014
Level I

EOG / EOC Scale Score Distribution
Prior to READY Model
Level II Standard Error ofMeasure

EOG / EOC Scale Score Distribution
In March 2014
New Level III

EOG / EOC Scale Score Distribution
After March 2014
Level I

New Achievement Level III
• Identifies students who are prepared for the next grade but do not meet the college and career readiness standard.
• Students are grade level proficient for READY accountability, but NOT proficient for College Career Readiness and AMOs.
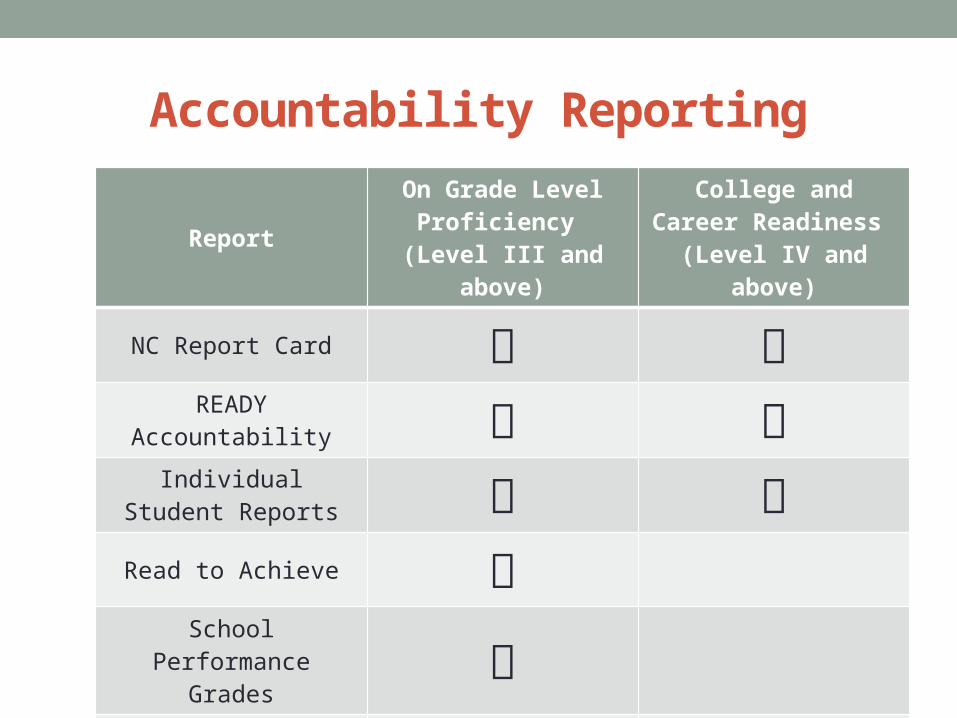
Accountability Reporting
Report
On Grade Level Proficiency
(Level III and above)
College and Career Readiness
(Level IV and above)
NC Report Card READY Accountability
Individual Student Reports
Read to Achieve School Performance
Grades AMOs

Reporting Comparisons
2012–13 College and Career Readiness at Level 3 and above
2013–14 College and Career Readiness (CCR) at Level 4 and above
AND
State Proficiency (GLP) at Level 3 and above

READING Grades 3 - 5
Levels III & IV
Levels IV & V
Levels III-V

Levels III & IV
Levels IV & V
Levels III-V
More Accurate
Comparison
Includes Level II
Standard Error (SEM)
READING Grades 3 - 5

School Performance Indicators
Elementary/Middle
EOG Math EOG Reading/ELA EOG Science EOC Math I
High School
Biology English II Math I ACT Math Course Rigor ACT WorkKeys Graduation Rate
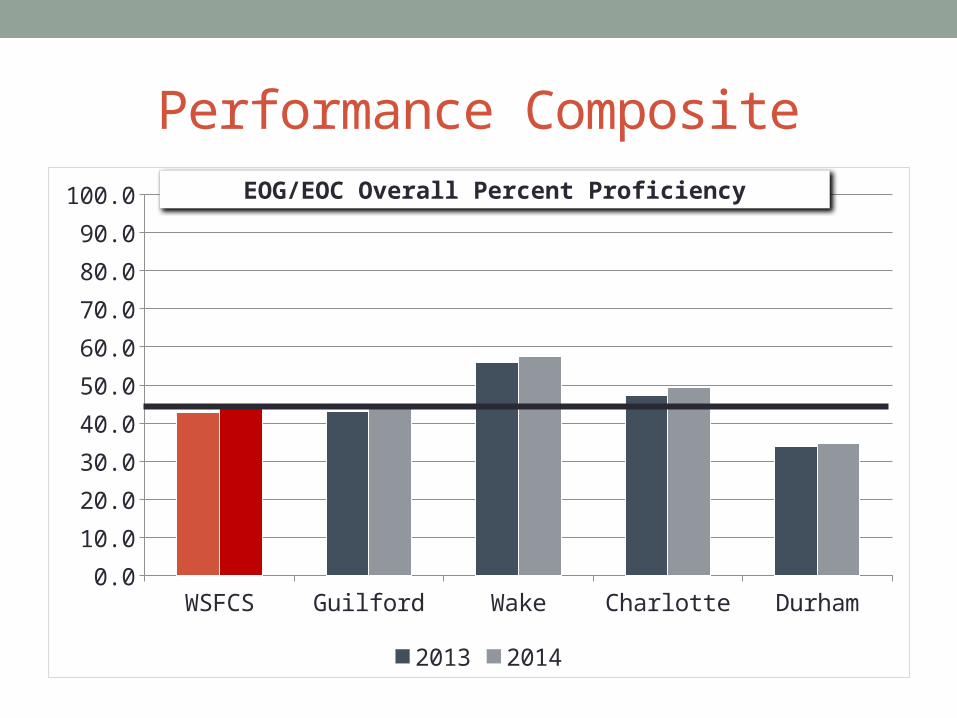
Performance Composite
WSFCS Guilford Wake Charlotte Durham0.0
10.0
20.0
30.0
40.0
50.0
60.0
70.0
80.0
90.0
100.0
2013 2014
EOG/EOC Overall Percent Proficiency

Math
WSFCS Guilford Wake Charlotte Durham0
10
20
30
40
50
60
70
80
90
100
2013 2014
% of Students Proficient in Mathematics (Grades 3-8)

Reading/ELA
WSFCS Guilford Wake Charlotte Durham0
10
20
30
40
50
60
70
80
90
100
2013 2014
% of Students Proficient in Reading (Grades 3-8)

Science
WSFCS Guilford Wake Charlotte Durham0
10
20
30
40
50
60
70
80
90
100
2013 2014
% of Students Proficient in Science (Grades 5 & 8)

Biology
WSFCS Guilford Wake Charlotte Durham0
10
20
30
40
50
60
70
80
90
100
2013 2014
% of Students Proficient in Biology

English II
WSFCS Guilford Wake Charlotte Durham0
10
20
30
40
50
60
70
80
90
100
2013 2014
% of Students Proficient in English II

Math I
WSFCS Guilford Wake Charlotte Durham0.0
10.0
20.0
30.0
40.0
50.0
60.0
70.0
80.0
90.0
100.0
2013 2014
% of Students Proficient in Math I

ACT
WSFCS Guilford Wake Charlotte Durham0
10
20
30
40
50
60
70
80
90
100
2013 2014
% of students that met minimum UNC admissions standard (Composite score of 17)

Work Keys
WSFCS Guilford Wake Charlotte Durham0
10
20
30
40
50
60
70
80
90
100
2013 2014
% of students that scored Silver level or better

Cohort Graduation Rate
NC WSFCS Guilford Wake Charlotte Durham0.0
10.0
20.0
30.0
40.0
50.0
60.0
70.0
80.0
90.0
100.0
2013 2014
4-year Cohort Graduation Percentages

GROWTHSchools that make progress similar to the progress at an average
school in the State.
Growth is reported as:
Met
Exceeded
Did Not Meet

Growth Summary
2012-13 2013-14
WSFCS 50 of 71 (70.5%) 48 of 70 (68.6%)
Elementary 32 of 42 (76.2%) 33 of 42 (78.6%)
Middle 9 of 14 (64.4%) 6 of 13 (46.2%)
High 11 of 15 (73.3%) 6 of 12 (50.0%)
Composite N/A 3 of 3 (100%)
* 11 schools did not meet the criteria for the calculation of a school-wide growth score in 2013-14.

Winston-Salem/Forsyth County Schools
2013-2014EVAAS Growth Status
28.6
40.0
31.4
Exceeded Met Not Met

Elementary Schools
2013-2014EVAAS Growth Status
38.1
40.5
21.4
Exceeded Met Not Met

Middle Schools
2013-2014EVAAS Growth Status
15.4
30.853.8
Exceeded Met Not Met

High Schools
2013-2014EVAAS Growth Status
16.7
33.3
50.0
Exceeded Met Not Met

AMOs
Annual Measurable Objectives

AMO Summary2012-13 2013-14
Subject # Met # Targ Pct % # Met # Targ Pct %
RD 3-8 19 22 86.4 15 22 68.2
MA 3-8 18 22 81.8 15 22 68.2
SCI 3-8 17 20 85.0 17 20 85.0
ENG II 18 20 90.0 13 20 65.0
BIO 19 20 95.0 13 20 65.0
MATH I 13 20 65.0 12 20 60.0
CY EOC 11 11 100.0 11 11 100.0
ATTEND 1 1 100.0 1 1 100.0
CGR 8 10 80.0 8 10 80.0
ACT 18 20 90.0 12 20 60.0
WKKEYS 16 16 100.0 7 12 58.3
MCR 10 10 100.0 9 10 90.0
TOTAL 168 192 87.5 133 188 70.7

Reading
ALL AMIN ASIA BLCK HISP MULTWHTE EDS LEP SWD AIG0.0
10.0
20.0
30.0
40.0
50.0
60.0
70.0
80.0
90.0
100.0 Sub-group Proficiencies in Reading (Grades 3-8)
*AMO proficiency targets are in green.

Mathematics
ALL AMIN ASIA BLCK HISP MULTWHTE EDS LEP SWD AIG0.0
10.0
20.0
30.0
40.0
50.0
60.0
70.0
80.0
90.0
100.0 Sub-group Proficiencies in Mathematics (Grades 3-8)
*AMO proficiency targets are in green.
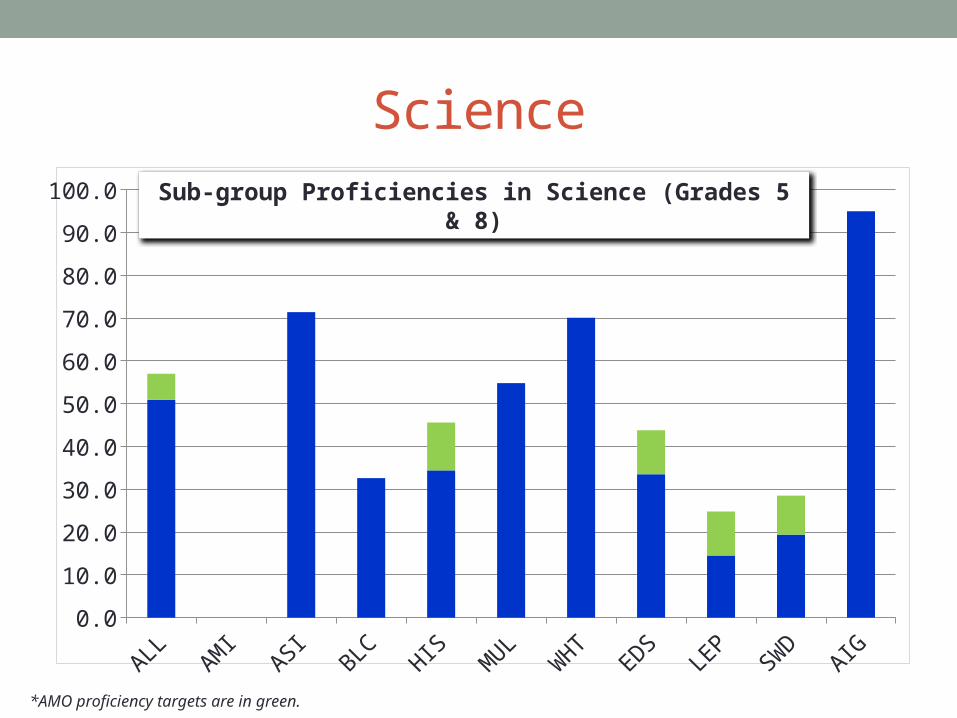
Science
0.0
10.0
20.0
30.0
40.0
50.0
60.0
70.0
80.0
90.0
100.0 Sub-group Proficiencies in Science (Grades 5 & 8)
*AMO proficiency targets are in green.

Reading Grade 10
ALL AMIN ASIA BLCK HISP MULTWHTE EDS LEP SWD AIG0.0
10.0
20.0
30.0
40.0
50.0
60.0
70.0
80.0
90.0
100.0 Sub-group Proficiencies in English II
*AMO proficiency targets are in green.

Math Grade 10
ALL AMIN ASIA BLCK HISP MULTWHTE EDS LEP SWD AIG0.0
10.0
20.0
30.0
40.0
50.0
60.0
70.0
80.0
90.0
100.0 Sub-group Proficiencies in Math I
*AMO proficiency targets are in green.

Science Grade 11
ALL AMIN ASIA BLCK HISP MULTWHTE EDS LEP SWD AIG0.0
10.0
20.0
30.0
40.0
50.0
60.0
70.0
80.0
90.0
100.0 Sub-group Proficiencies in Biology
*AMO proficiency targets are in green.

ACT
ALL AMIN ASIA BLCK HISP MULTWHTE EDS LEP SWD AIG0.0
10.0
20.0
30.0
40.0
50.0
60.0
70.0
80.0
90.0
100.0% of Students Scoring a Composite
Score of 17 or Higher
*AMO proficiency targets are in green.

ACT WorkKeys
ALL AMIN ASIA BLCK HISP MULTWHTE EDS LEP SWD AIG0.0
10.0
20.0
30.0
40.0
50.0
60.0
70.0
80.0
90.0
100.0 CTE Concentrators Earning Minimum NCRC Silver
*AMO proficiency targets are in green.

Math Course Rigor
ALL AMIN ASIA BLCK HISP MULTWHTE EDS LEP SWD AIG0.0
10.0
20.0
30.0
40.0
50.0
60.0
70.0
80.0
90.0
100.0% of Graduates Earning Credit in Math III / Algebra II
*AMO proficiency targets are in green.

Cohort Graduation Rate
ALL AMIN ASIA BLCK HISP MULTWHTE EDS LEP SWD AIG0.0
10.0
20.0
30.0
40.0
50.0
60.0
70.0
80.0
90.0
100.0
2013 2014
% of Student Graduating in 4 Years

Questions?