2012 asia pacific sales leadership priorities survey report
TRANSCRIPT
1
The contents of these pages are copyright © 2012 Frost & Sullivan. All rights reserved.
growth team m e m b e r s h i p™
Co-Sponsor
Productivity, Lead Generation, and Social Selling
asia pacific
®
2012 sales leadership priorities survey results
TWEET ABOUT THE SURVEYS
#2012priorities
2
The contents of these pages are copyright © 2012 Frost & Sullivan. All rights reserved.
2012 survey resultsgrowth team m e m b e r s h i p™
CONTENTS
INTRO
Executive Summary . . . . . . . . . . . . . . . . . . . . . . . . . . . . . . . . . . . . 3
Survey Purpose and Respondents . . . . . . . . . . . . . . . . . . . . . . . . . . . . 4
What is the Growth Team Membership™ . . . . . . . . . . . . . . . . . . . . . . . . 5
Sales Leadership Overarching Challenges . . . . . . . . . . . . . . . . . . . . . . . . 6
Key Sales Leadership Challenges . . . . . . . . . . . . . . . . . . . . . . . . . . . . . 7SECTION
1
Respondent Demographics . . . . . . . . . . . . . . . . . . . . . . . . . . . . . . . . 25SECTION
4
Sales Leadership Resource Trends . . . . . . . . . . . . . . . . . . . . . . . . . . . . 11SECTION
2
Special Interest Topic: Tools and Social Media . . . . . . . . . . . . . . . . . . . . . . 17SECTION
3
3
The contents of these pages are copyright © 2012 Frost & Sullivan. All rights reserved.
2012 survey resultsgrowth team m e m b e r s h i p™
Growth Team Membership™ research.
Introduction
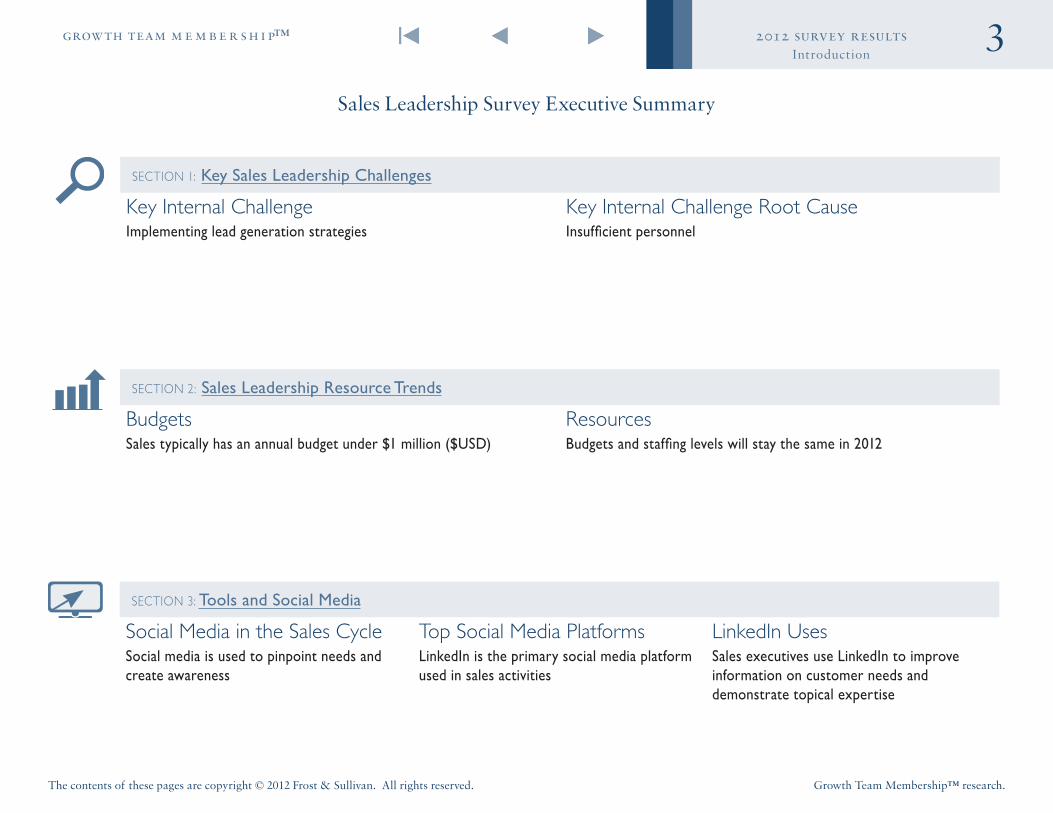
Sales Leadership Survey Executive Summary
SECTION 1: Key Sales Leadership Challenges
Key Internal Challenge Key Internal Challenge Root CauseImplementing lead generation strategies Insufficient personnel
SECTION 2: Sales Leadership Resource Trends
Budgets ResourcesSales typically has an annual budget under $1 million ($USD) Budgets and staffing levels will stay the same in 2012
SECTION 3: Tools and Social Media
Social Media in the Sales Cycle Top Social Media Platforms LinkedIn UsesSocial media is used to pinpoint needs and create awareness
LinkedIn is the primary social media platform used in sales activities
Sales executives use LinkedIn to improve information on customer needs and demonstrate topical expertise
4
The contents of these pages are copyright © 2012 Frost & Sullivan. All rights reserved.
2012 survey resultsgrowth team m e m b e r s h i p™
Growth Team Membership™ research.
Introduction
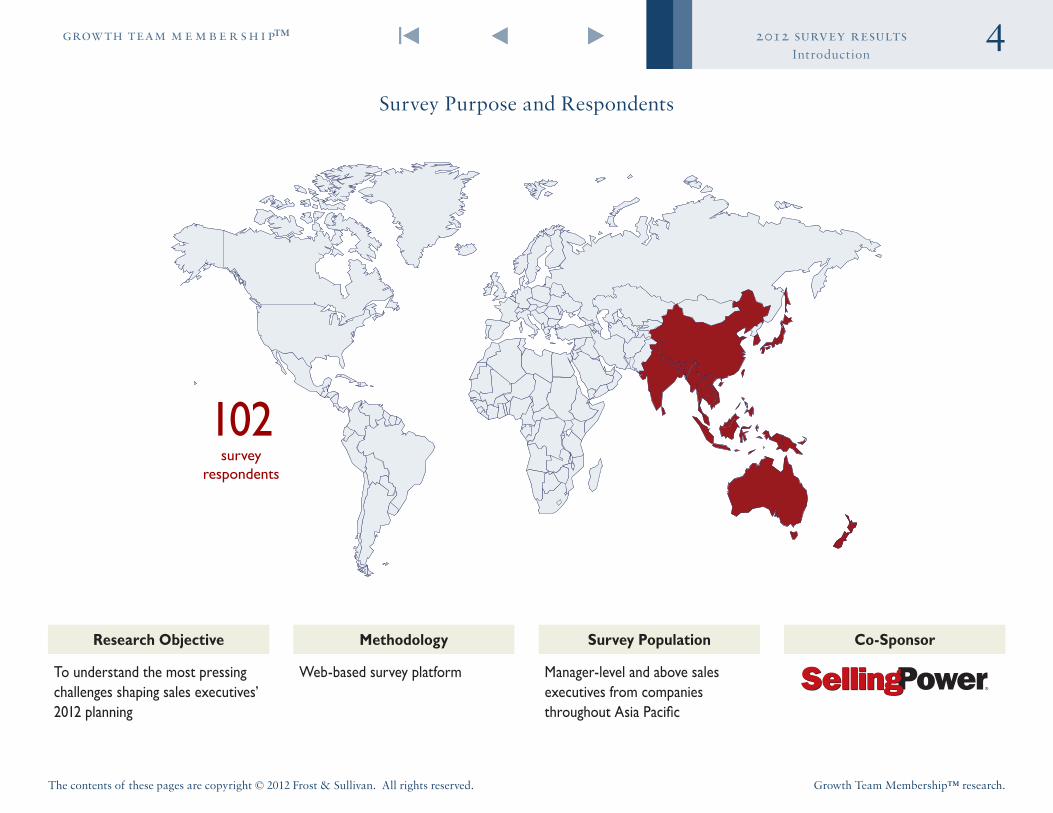
Survey Purpose and Respondents
Co-SponsorSurvey PopulationMethodologyResearch Objective
To understand the most pressing challenges shaping sales executives’ 2012 planning
Web-based survey platform Manager-level and above sales executives from companies throughout Asia Pacific
®
102survey
respondents
5
The contents of these pages are copyright © 2012 Frost & Sullivan. All rights reserved.
2012 survey resultsgrowth team m e m b e r s h i p™
Growth Team Membership™ research.
Introduction
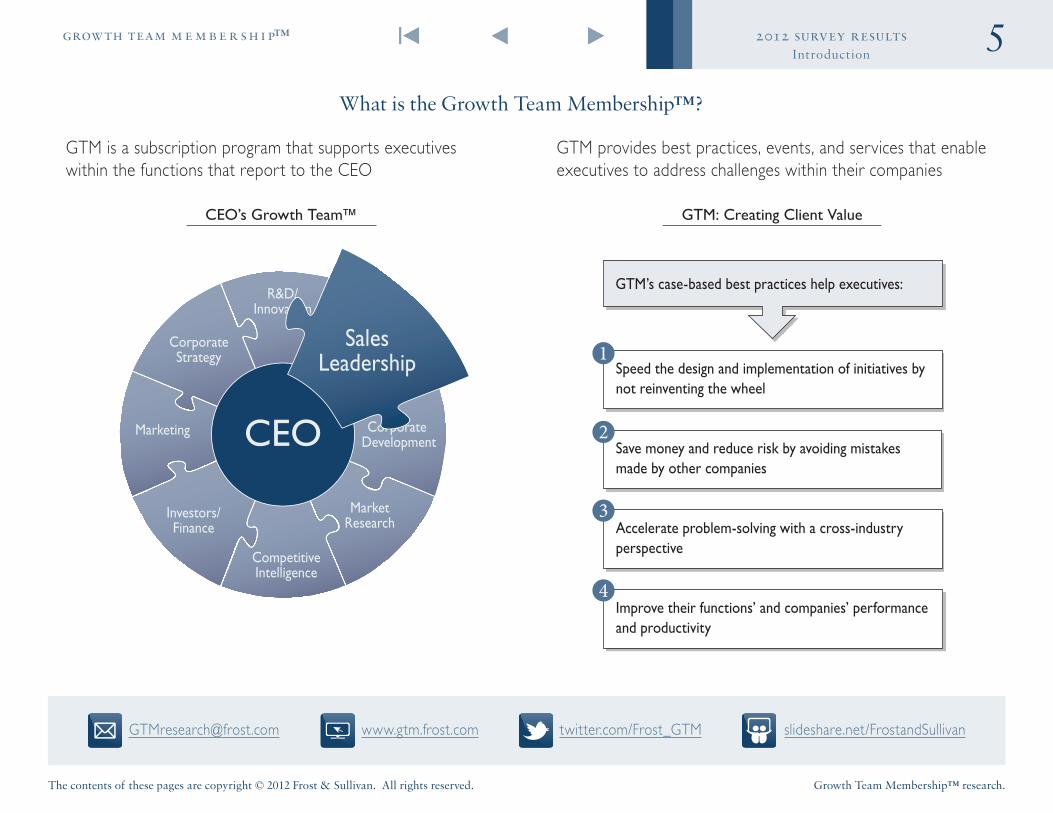
What is the Growth Team Membership™?
GTM is a subscription program that supports executives within the functions that report to the CEO
GTM provides best practices, events, and services that enable executives to address challenges within their companies
CorporateStrategy
Corporate Development
Marketing
CompetitiveIntelligence
MarketResearch
SalesLeadership
R&D/Innovation
Investors/Finance
CEO
SalesLeadership
CEO’s Growth Team™ GTM: Creating Client Value
GTM’s case-based best practices help executives:
Speed the design and implementation of initiatives by not reinventing the wheel
Save money and reduce risk by avoiding mistakes made by other companies
Accelerate problem-solving with a cross-industry perspective
Improve their functions’ and companies’ performance and productivity
[email protected] www.gtm.frost.com slideshare.net/FrostandSullivantwitter.com/Frost_GTM
6
The contents of these pages are copyright © 2012 Frost & Sullivan. All rights reserved.
2012 survey resultsgrowth team m e m b e r s h i p™
Growth Team Membership™ research.
Introduction
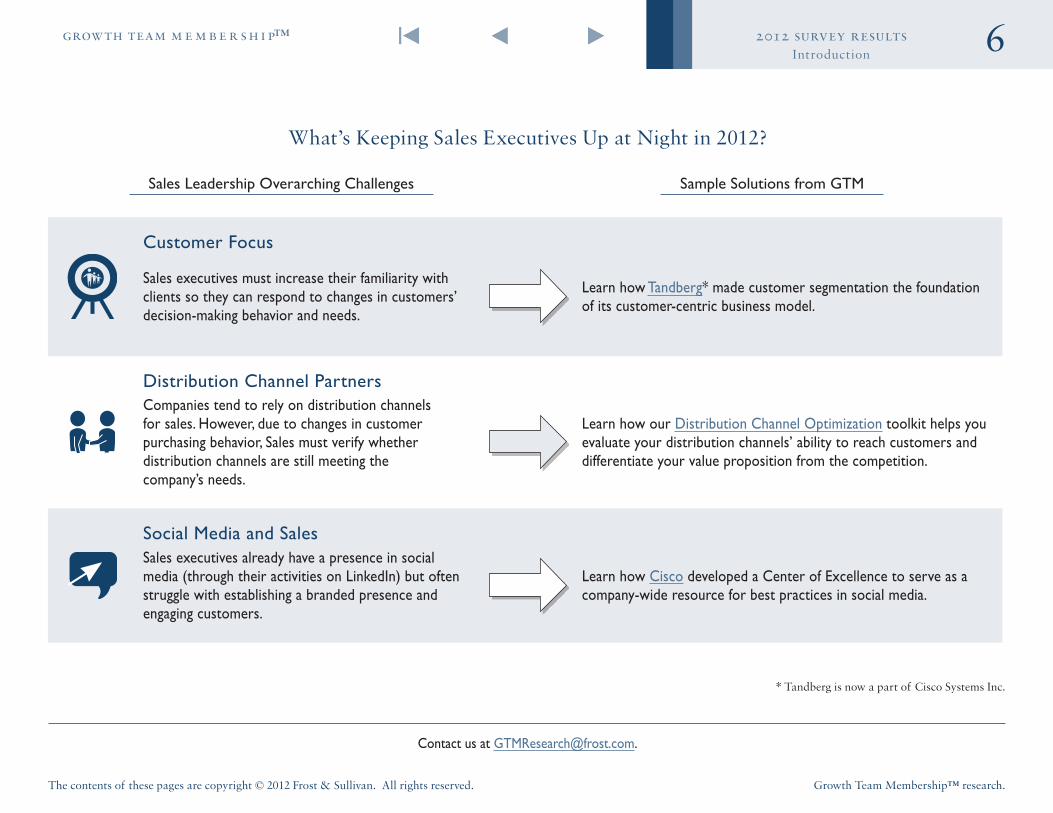
Sales Leadership Overarching Challenges Sample Solutions from GTM
What’s Keeping Sales Executives Up at Night in 2012?
Contact us at GTMResearch@frost .com .
Customer Focus
Sales executives must increase their familiarity with clients so they can respond to changes in customers’ decision-making behavior and needs .
Learn how Tandberg* made customer segmentation the foundation of its customer-centric business model .
Distribution Channel PartnersCompanies tend to rely on distribution channels for sales . However, due to changes in customer purchasing behavior, Sales must verify whether distribution channels are still meeting the company’s needs .
Learn how our Distribution Channel Optimization toolkit helps you evaluate your distribution channels’ ability to reach customers and differentiate your value proposition from the competition .
Social Media and SalesSales executives already have a presence in social media (through their activities on LinkedIn) but often struggle with establishing a branded presence and engaging customers .
Learn how Cisco developed a Center of Excellence to serve as a company-wide resource for best practices in social media .
* Tandberg is now a part of Cisco Systems Inc.
7
The contents of these pages are copyright © 2012 Frost & Sullivan. All rights reserved.
2012 survey resultsgrowth team m e m b e r s h i p™
Growth Team Membership™ research.
INTRO
SECTION
1
SECTION
2
SECTION
4
SECTION
3
SECTION
1 Key Sales Leadership Challenges
8
The contents of these pages are copyright © 2012 Frost & Sullivan. All rights reserved.
2012 survey resultsgrowth team m e m b e r s h i p™
Growth Team Membership™ research.
Section 1
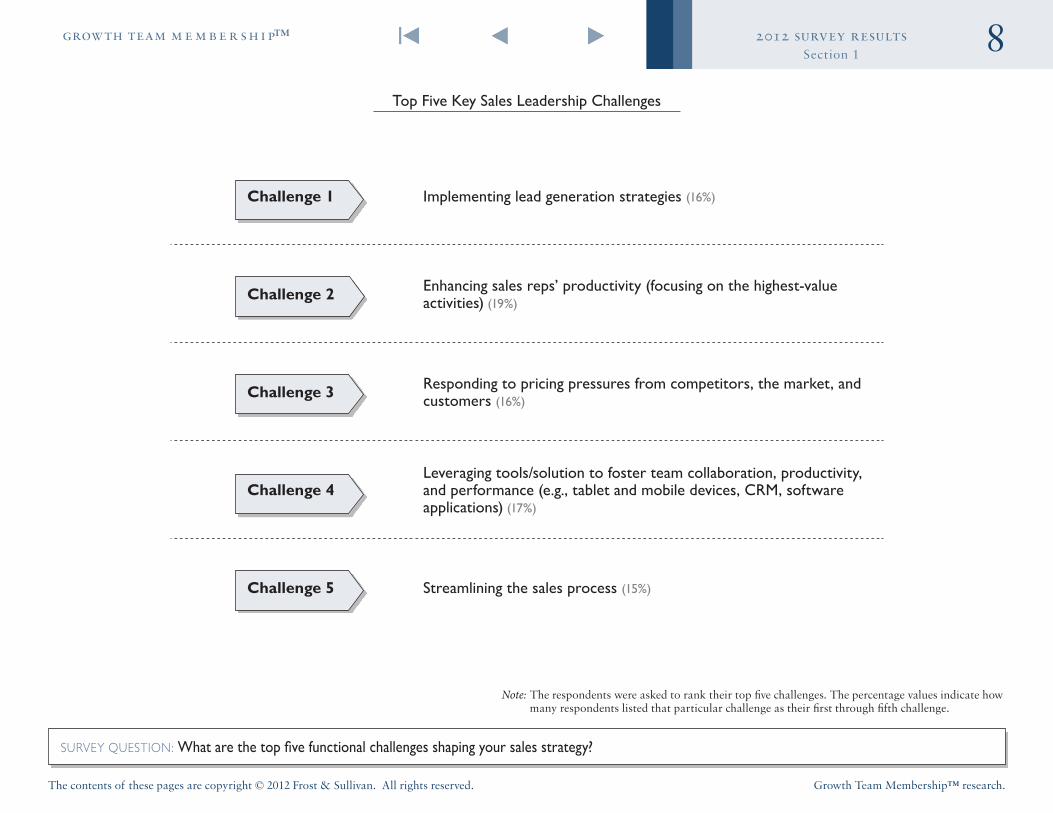
Challenge 1 Implementing lead generation strategies (16%)
Challenge 2 Enhancing sales reps’ productivity (focusing on the highest-value activities) (19%)
Challenge 3 Responding to pricing pressures from competitors, the market, and customers (16%)
Challenge 4Leveraging tools/solution to foster team collaboration, productivity, and performance (e .g ., tablet and mobile devices, CRM, software applications) (17%)
Challenge 5 Streamlining the sales process (15%)
Top Five Key Sales Leadership Challenges
SURVEY QUESTION: What are the top five functional challenges shaping your sales strategy?
Note: The respondents were asked to rank their top five challenges. The percentage values indicate how many respondents listed that particular challenge as their first through fifth challenge.
9
The contents of these pages are copyright © 2012 Frost & Sullivan. All rights reserved.
2012 survey resultsgrowth team m e m b e r s h i p™
Growth Team Membership™ research.
Section 1
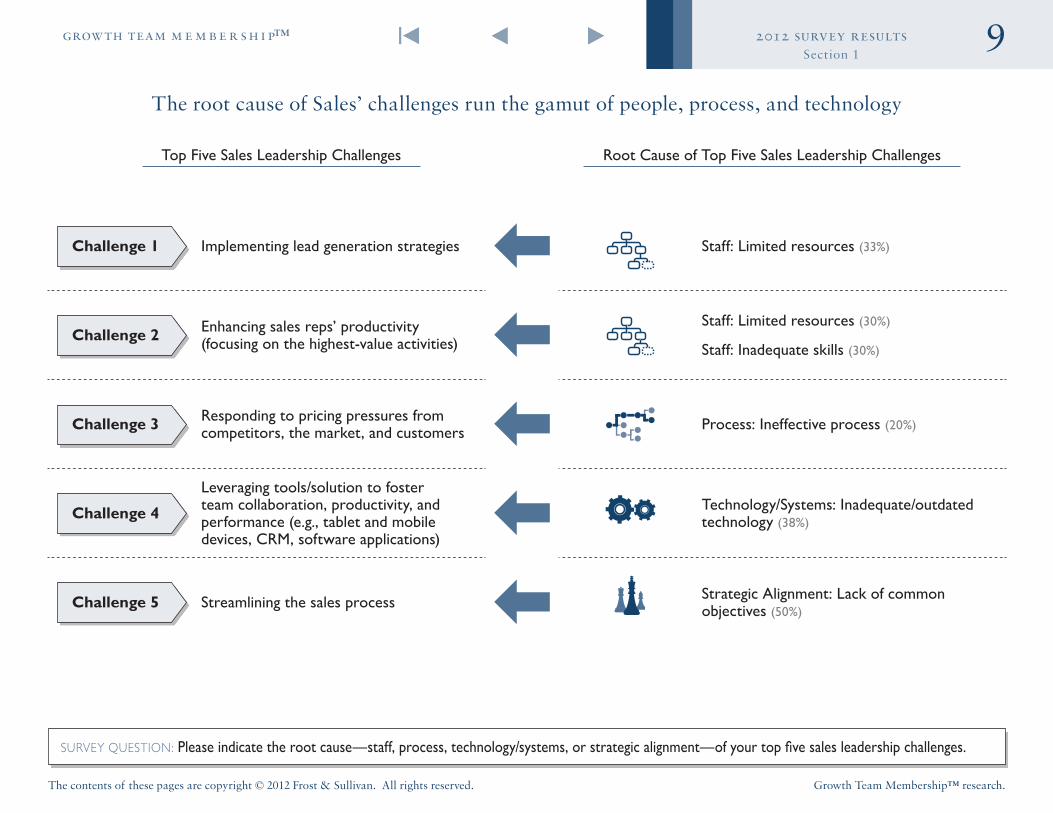
The root cause of Sales’ challenges run the gamut of people, process, and technology
SURVEY QUESTION: Please indicate the root cause—staff, process, technology/systems, or strategic alignment—of your top five sales leadership challenges.
Root Cause of Top Five Sales Leadership ChallengesTop Five Sales Leadership Challenges
Challenge 1 Implementing lead generation strategies Staff: Limited resources (33%)
Challenge 2 Enhancing sales reps’ productivity (focusing on the highest-value activities)
Staff: Limited resources (30%)
Staff: Inadequate skills (30%)
Challenge 3 Responding to pricing pressures from competitors, the market, and customers Process: Ineffective process (20%)
Challenge 4
Leveraging tools/solution to foster team collaboration, productivity, and performance (e .g ., tablet and mobile devices, CRM, software applications)
Technology/Systems: Inadequate/outdated technology (38%)
Challenge 5 Streamlining the sales process Strategic Alignment: Lack of common objectives (50%)
10
The contents of these pages are copyright © 2012 Frost & Sullivan. All rights reserved.
2012 survey resultsgrowth team m e m b e r s h i p™
Growth Team Membership™ research.
INTRO
SECTION
1
SECTION
2
SECTION
4
SECTION
3
SECTION
2 Sales Leadership Resource Trends
11
The contents of these pages are copyright © 2012 Frost & Sullivan. All rights reserved.
2012 survey resultsgrowth team m e m b e r s h i p™
Growth Team Membership™ research.
Section 2
0%
10%
20%
30%
27%
24%
11%
15%
9%
14%
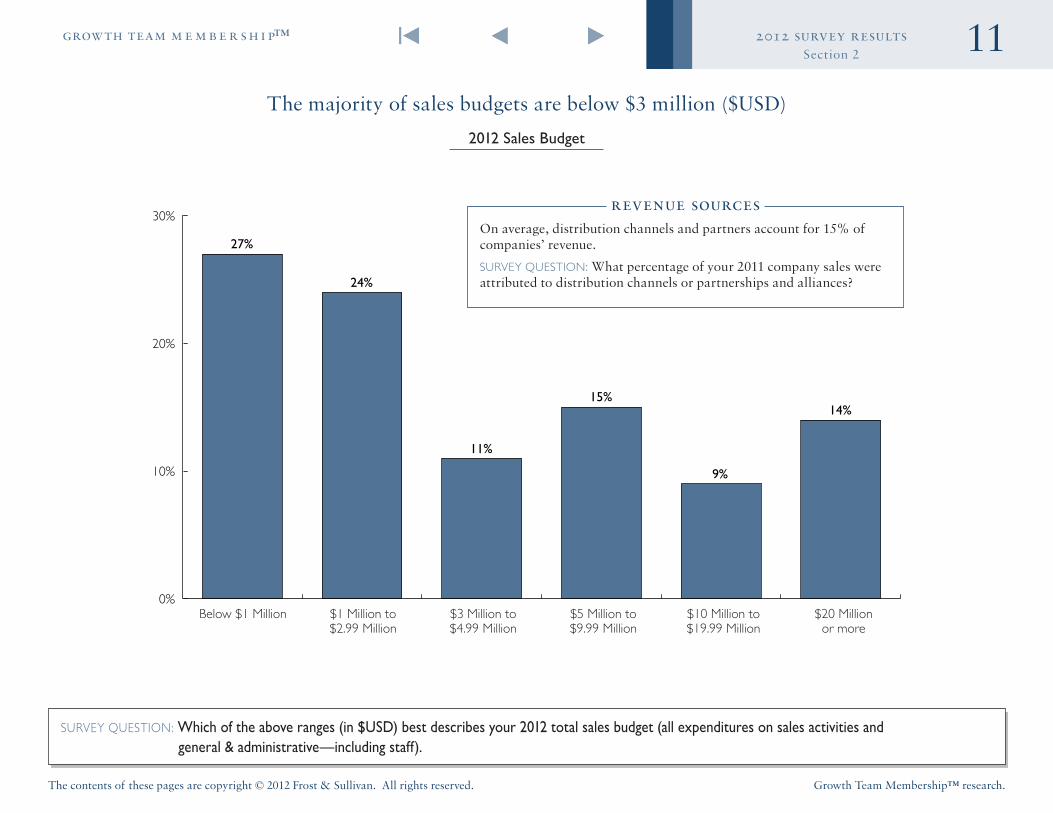
The majority of sales budgets are below $3 million ($USD)
2012 Sales Budget
SURVEY QUESTION: Which of the above ranges (in $USD) best describes your 2012 total sales budget (all expenditures on sales activities and general & administrative—including staff) .
Below $1 Million $1 Million to $2.99 Million
$3 Million to $4.99 Million
$5 Million to $9.99 Million
$10 Million to $19.99 Million
$20 Million or more
revenue sourcesOn average, distribution channels and partners account for 15% of companies’ revenue.
SURVEY QUESTION: What percentage of your 2011 company sales were attributed to distribution channels or partnerships and alliances?
12
The contents of these pages are copyright © 2012 Frost & Sullivan. All rights reserved.
2012 survey resultsgrowth team m e m b e r s h i p™
Growth Team Membership™ research.
Section 2
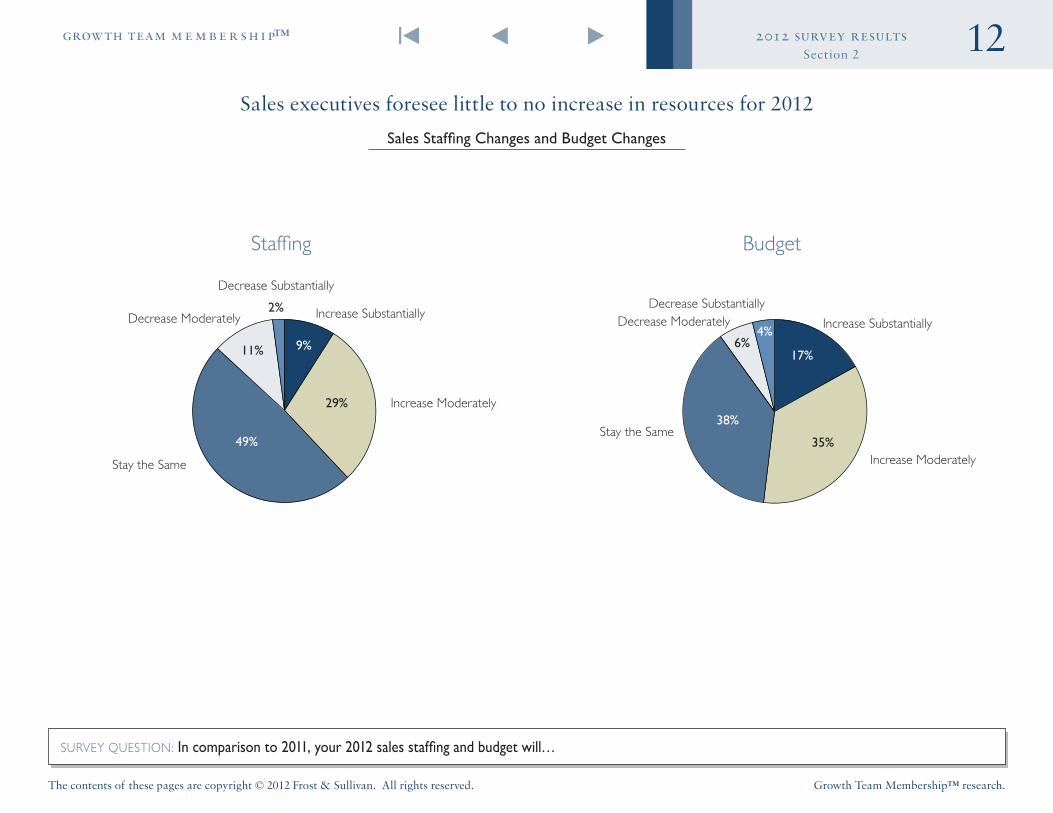
Sales executives foresee little to no increase in resources for 2012
Sales Staffing Changes and Budget Changes
SURVEY QUESTION: In comparison to 2011, your 2012 sales staffing and budget will…
11%
2%
49%
29%
Stay the Same
Decrease Moderately
Decrease Substantially
Increase Substantially
Increase Moderately
Staffing Budget
Decrease Substantially
Increase Substantially
9%17%
4%
38%
35%
6%
Stay the Same
Decrease Moderately
Increase Moderately
13
The contents of these pages are copyright © 2012 Frost & Sullivan. All rights reserved.
2012 survey resultsgrowth team m e m b e r s h i p™
Growth Team Membership™ research.
Section 2
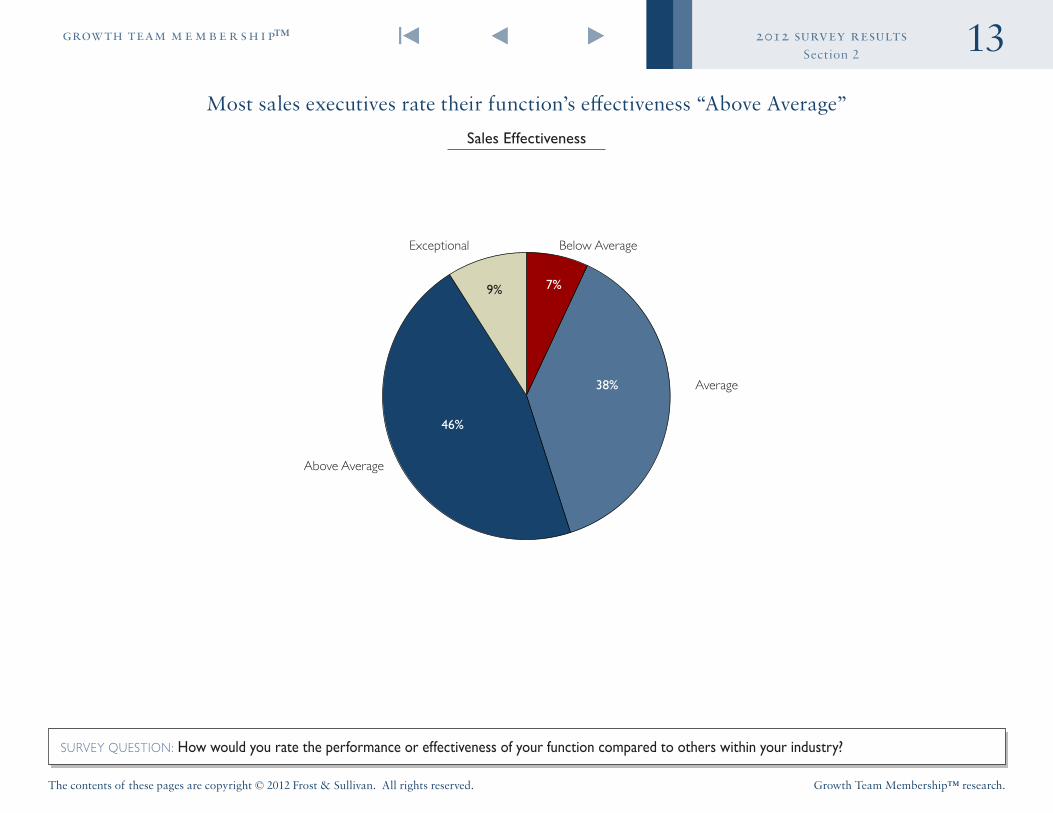
Most sales executives rate their function’s effectiveness “Above Average”
Sales Effectiveness
SURVEY QUESTION: How would you rate the performance or effectiveness of your function compared to others within your industry?
9%
46%
38%
7%
Above Average
Exceptional Below Average
Average
14
The contents of these pages are copyright © 2012 Frost & Sullivan. All rights reserved.
2012 survey resultsgrowth team m e m b e r s h i p™
Growth Team Membership™ research.
INTRO
SECTION
1
SECTION
2
SECTION
4
SECTION
3SECTION
3 Special Interest Topic: Tools and Social Media
15
The contents of these pages are copyright © 2012 Frost & Sullivan. All rights reserved.
2012 survey resultsgrowth team m e m b e r s h i p™
Growth Team Membership™ research.
Section 3
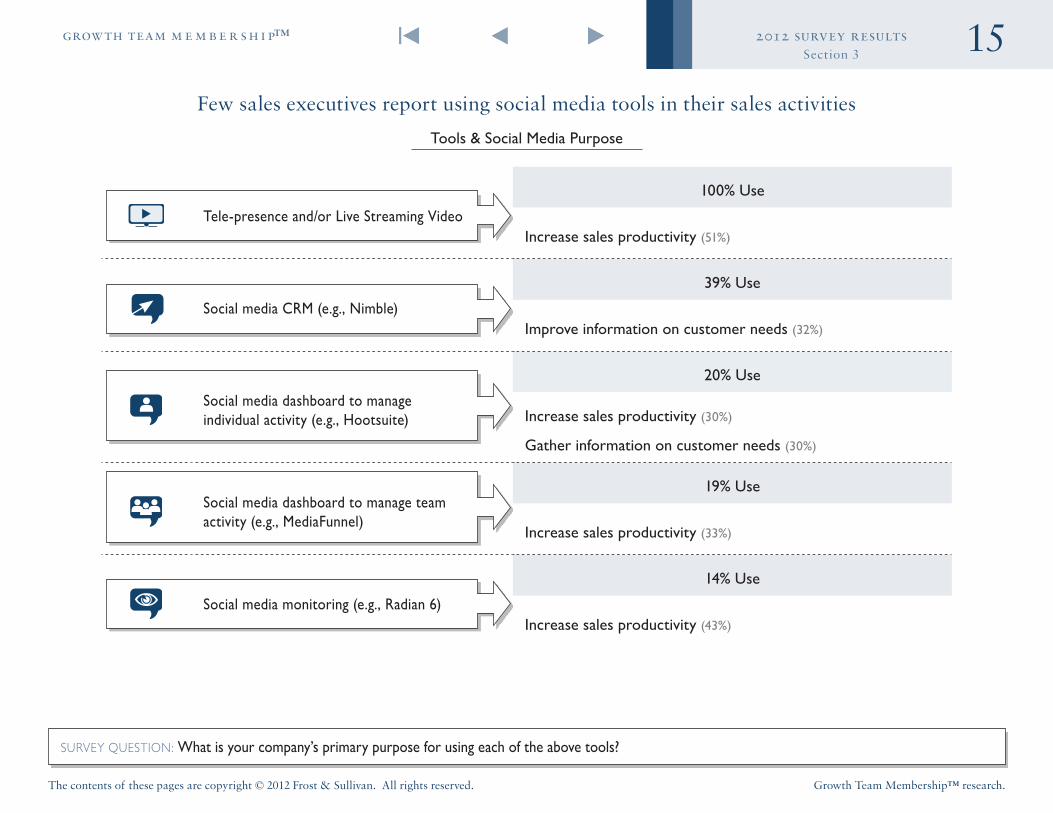
SURVEY QUESTION: What is your company’s primary purpose for using each of the above tools?
Few sales executives report using social media tools in their sales activities
Tools & Social Media Purpose
Tele-presence and/or Live Streaming Video
100% Use
Increase sales productivity (51%)
Social media CRM (e .g ., Nimble)
39% Use
Improve information on customer needs (32%)
Social media dashboard to manage individual activity (e .g ., Hootsuite)
20% Use
Increase sales productivity (30%)
Gather information on customer needs (30%)
Social media dashboard to manage team activity (e .g ., MediaFunnel)
19% Use
Increase sales productivity (33%)
Social media monitoring (e .g ., Radian 6)
14% Use
Increase sales productivity (43%)
16
The contents of these pages are copyright © 2012 Frost & Sullivan. All rights reserved.
2012 survey resultsgrowth team m e m b e r s h i p™
Growth Team Membership™ research.
Section 3
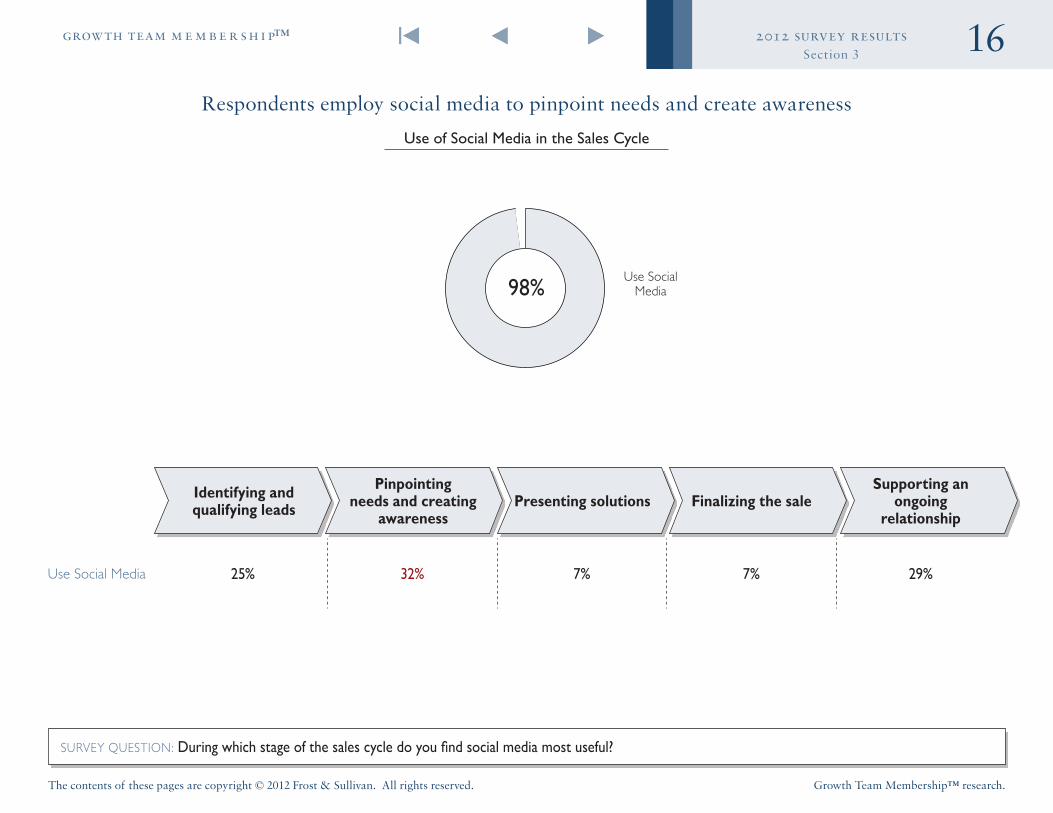
SURVEY QUESTION: During which stage of the sales cycle do you find social media most useful?
Respondents employ social media to pinpoint needs and create awareness
Use of Social Media in the Sales Cycle
Use Social Media 25% 32% 7% 7% 29%
Identifying and qualifying leads
Pinpointing needs and creating
awarenessPresenting solutions Finalizing the sale
Supporting an ongoing
relationship
Use Social Media98%
17
The contents of these pages are copyright © 2012 Frost & Sullivan. All rights reserved.
2012 survey resultsgrowth team m e m b e r s h i p™
Growth Team Membership™ research.
Section 3
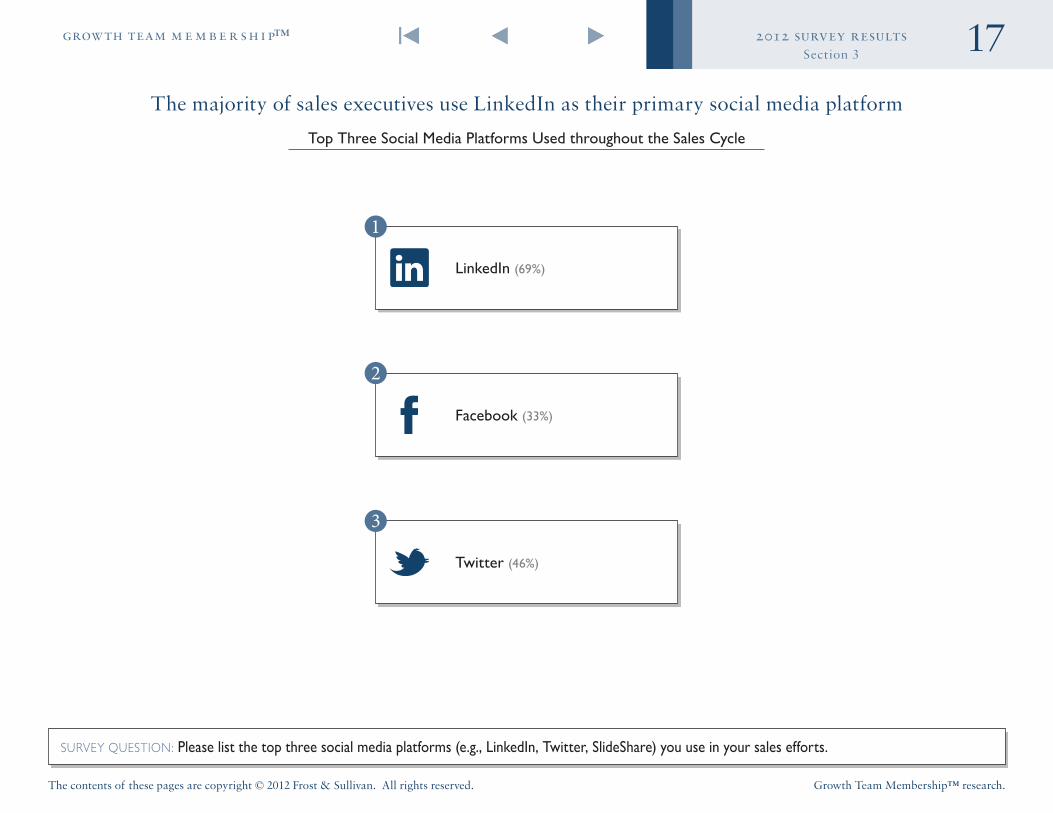
SURVEY QUESTION: Please list the top three social media platforms (e .g ., LinkedIn, Twitter, SlideShare) you use in your sales efforts .
The majority of sales executives use LinkedIn as their primary social media platform
Top Three Social Media Platforms Used throughout the Sales Cycle
Facebook (33%)
Twitter (46%)
LinkedIn (69%)
18
The contents of these pages are copyright © 2012 Frost & Sullivan. All rights reserved.
2012 survey resultsgrowth team m e m b e r s h i p™
Growth Team Membership™ research.
Section 3
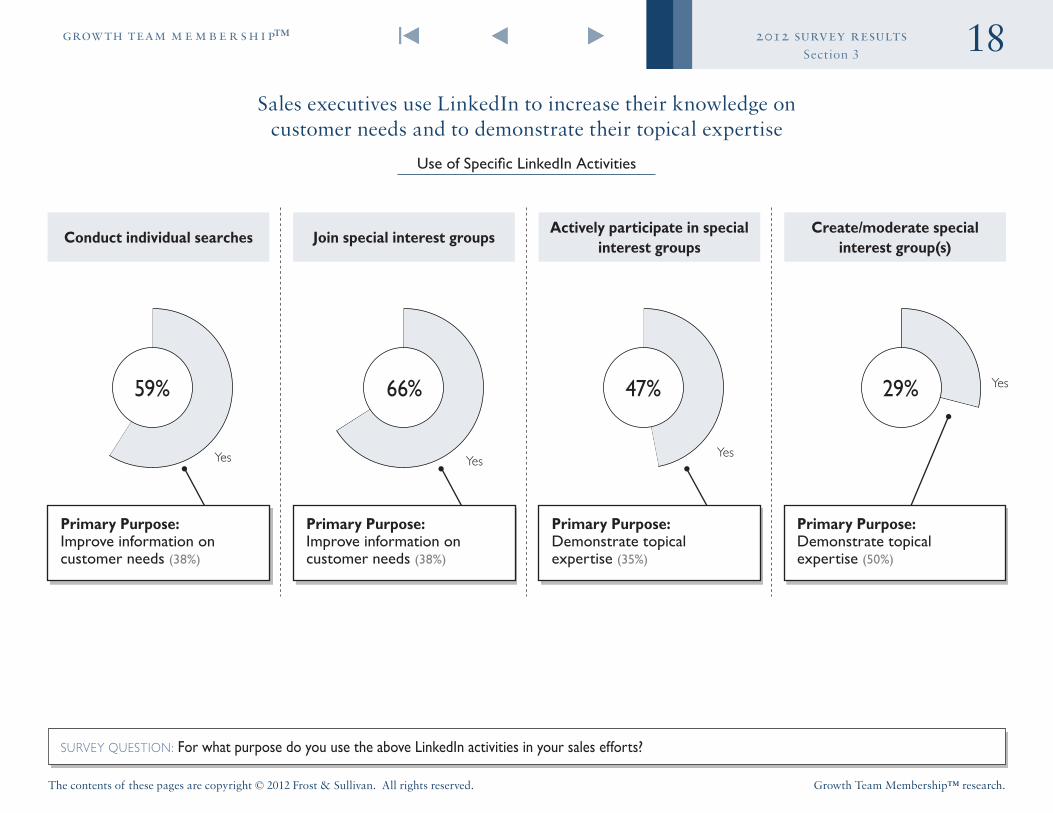
SURVEY QUESTION: For what purpose do you use the above LinkedIn activities in your sales efforts?
Sales executives use LinkedIn to increase their knowledge on customer needs and to demonstrate their topical expertise
Use of Specific LinkedIn Activities
Yes YesYes
Yes
Conduct individual searches Join special interest groups Actively participate in special interest groups
Create/moderate special interest group(s)
59% 66% 47% 29%
Primary Purpose:Improve information on customer needs (38%)
Primary Purpose:Improve information on customer needs (38%)
Primary Purpose:Demonstrate topical expertise (35%)
Primary Purpose:Demonstrate topical expertise (50%)
19
The contents of these pages are copyright © 2012 Frost & Sullivan. All rights reserved.
2012 survey resultsgrowth team m e m b e r s h i p™
Growth Team Membership™ research.
Section 3
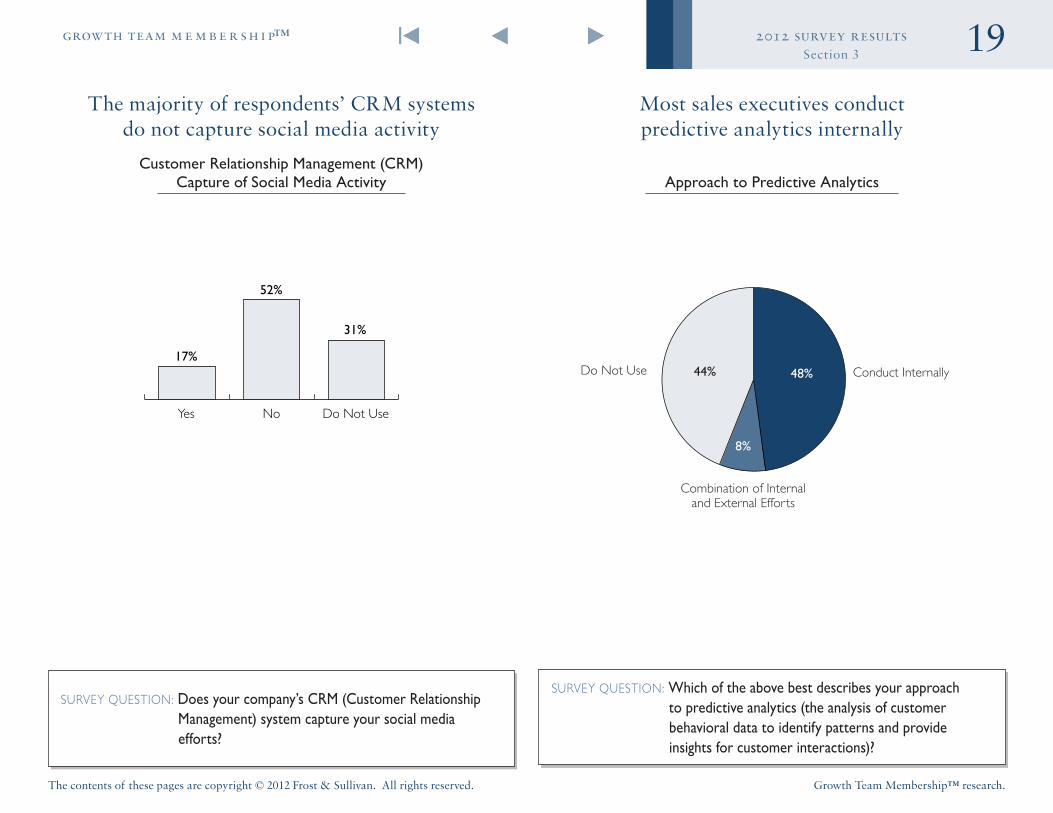
The majority of respondents’ CRM systems do not capture social media activity
Customer Relationship Management (CRM) Capture of Social Media Activity
SURVEY QUESTION: Does your company’s CRM (Customer Relationship Management) system capture your social media efforts?
Yes No Do Not Use
17%
52%
31%
Most sales executives conduct predictive analytics internally
Approach to Predictive Analytics
44%
8%
48%
Combination of Internal and External Efforts
Do Not Use Conduct Internally
SURVEY QUESTION: Which of the above best describes your approach to predictive analytics (the analysis of customer behavioral data to identify patterns and provide insights for customer interactions)?
20
The contents of these pages are copyright © 2012 Frost & Sullivan. All rights reserved.
2012 survey resultsgrowth team m e m b e r s h i p™
Growth Team Membership™ research.
INTRO
SECTION
1
SECTION
2
SECTION
4
SECTION
3
SECTION
4 Respondent Demographics
21
The contents of these pages are copyright © 2012 Frost & Sullivan. All rights reserved.
2012 survey resultsgrowth team m e m b e r s h i p™
Growth Team Membership™ research.
Section 4
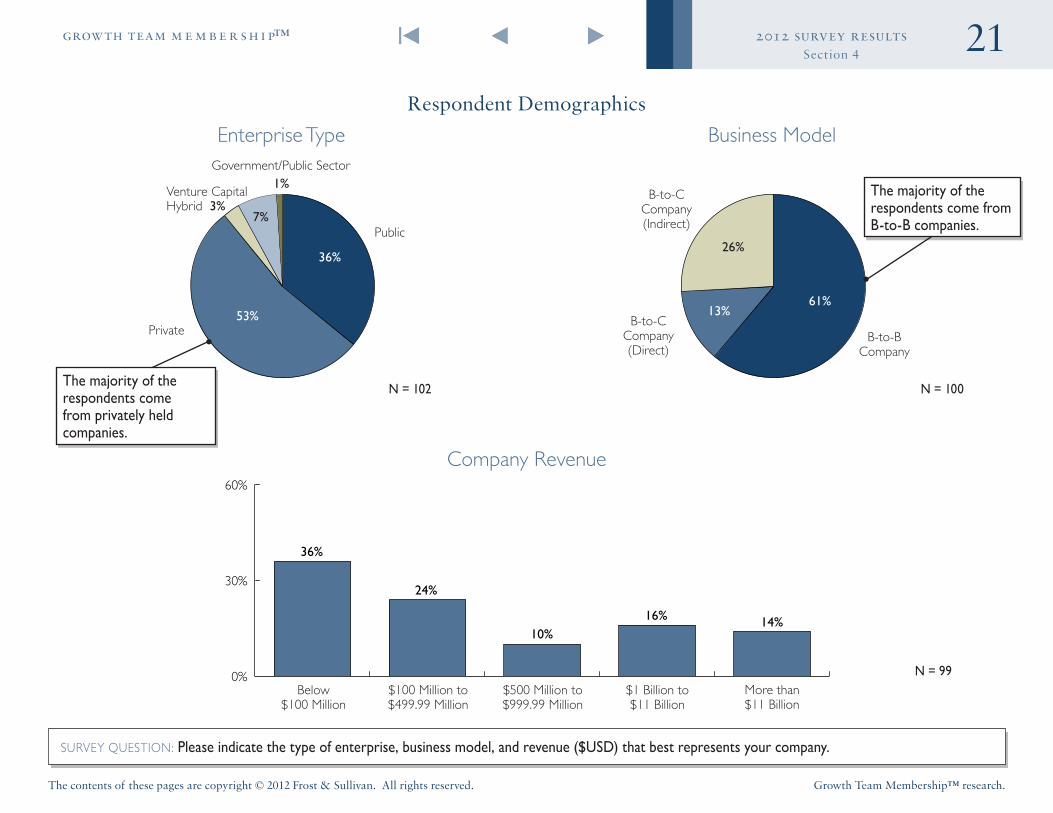
Respondent Demographics
SURVEY QUESTION: Please indicate the type of enterprise, business model, and revenue ($USD) that best represents your company .
N = 99
N = 100N = 102
Enterprise Type Business Model
Company Revenue
53%
7%3%
1%
36%26%
13%61%
Public
Private
Hybrid
B-to-B Company
Venture Capital
Government/Public Sector
0%
30%
60%
36%
24%
10%16% 14%
Below $100 Million
$100 Million to $499.99 Million
$500 Million to $999.99 Million
$1 Billion to $11 Billion
More than $11 Billion
B-to-C Company (Indirect)
B-to-C Company (Direct)
The majority of the respondents come from B-to-B companies .
The majority of the respondents come from privately held companies .
22
The contents of these pages are copyright © 2012 Frost & Sullivan. All rights reserved.
2012 survey resultsgrowth team m e m b e r s h i p™
Growth Team Membership™ research.
Section 4
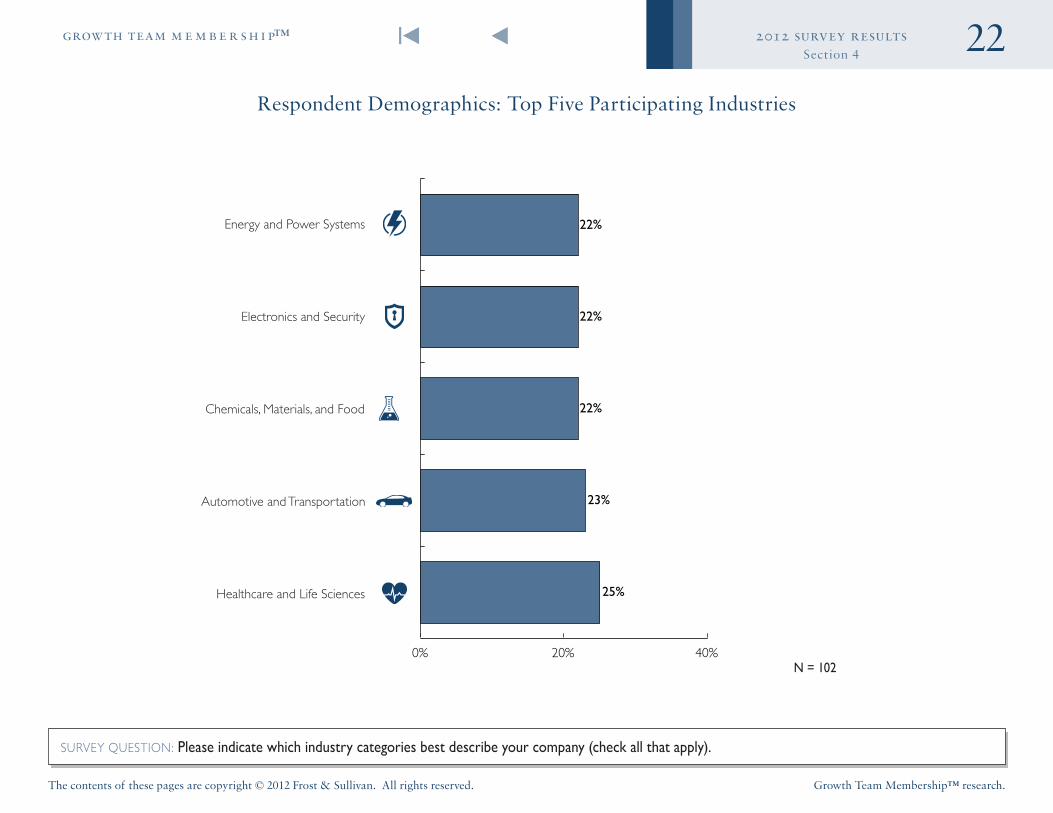
Chemicals, Materials, and Food
Electronics and Security
SURVEY QUESTION: Please indicate which industry categories best describe your company (check all that apply) .
Respondent Demographics: Top Five Participating Industries
N = 1020% 20% 40%
25%
23%
22%
22%
22%
Automotive and Transportation
Energy and Power Systems
Healthcare and Life Sciences