2009 annual reportannualreports.com/hosteddata/annualreportarchive/o/... · oceaneering...
TRANSCRIPT

2009 Annual Report
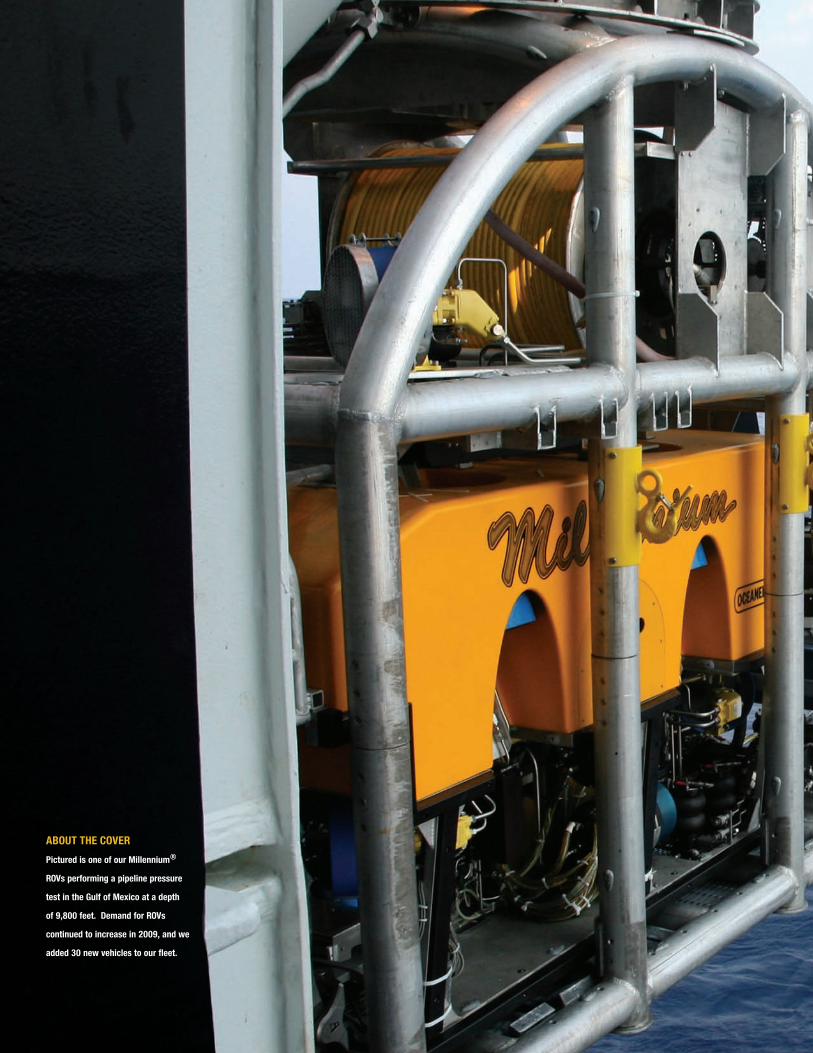
ABOut the cOveRpictured is one of our millennium®
ROvs performing a pipeline pressure
test in the gulf of mexico at a depth
of 9,800 feet. demand for ROvs
continued to increase in 2009, and we
added 30 new vehicles to our fleet.

1.0_OCEANEERING AT WORK
2009 2008
REVENUE $1,822,081 $1,977,421GROSSMARGIN 437,726 464,800OPERATINGINCOME 292,116 317,558NETINCOME 188,353 199,386DILUTEDEARNINGSPERSHARE 3.40 3.56
Financial HigHligHts($inthousands,exceptpershareamounts)
For 2009 Oceaneering reported its second best earnings performance in the company’s history. EPs of $3.40 was only 4% below last year’s record result. We achieved record ROV operating income for the sixth consecutive year.
OVERViEW
cORPORatE PROFilE
Oceaneeringisaglobaloilfieldproviderofengineeredservicesandproducts,primarilytotheoffshoreoilandgasindustry,withafocusondeepwaterapplications.Throughthe
useofitsappliedtechnologyexpertise,Oceaneeringalsoservesthedefenseandaerospaceindustries.
Oceaneering’sbusinessofferingsincluderemotelyoperatedvehicles,built-to-orderspecialtyhardware,deepwaterinterventionandmanneddivingservices,non-destructivetestingandinspections,mobileoffshoreproductionsystems,andengineeringandprojectmanagement.
BacKgROUnD
Foundedin1964,OceaneeringhasgrownfromanairandmixedgasdivingbusinessintheGulfofMexicotoaproviderofdiversified,engineeredservicesandproductsoperatingworldwide.Wehaveachievedthisgrowthbyexecutingaplanofinternaldevelopmentaugmentedbystrategicacquisitions.
DuringtheyearendedDecember31,2009,weearnednetincomeof$188milliononrevenueof$1.8billionwhileemployingapproximately7,900peopleworkingoutof68locationsin21countries.WeserveouroffshoreoilandgascustomersthroughthetradenamesofOceaneeringInternational,OceaneeringInterventionEngineering(OIE),OceaneeringMultiflex,OceaneeringGrayloc,OceaneeringRotator,andOceaneeringInspectionServices.OurAdvancedTechnologiesGroup,whichincludesOceaneeringTechnologiesandOceaneeringSpaceSystems,servesourcustomersoutsidetheoilandgasindustry.
MissiOn statEMEnt
Oceaneering’smissionistoincreasethenetwealthofitsShareholdersbyprovidingsafe,cost-effective,andquality-basedtechnicalsolutionssatisfyingcustomerneedsworldwide.
LETTER TO SHAREHOLDERS 2 OCEANEERING AT A GLANCE 4 OCEANEERING AT WORK 6WORLDWIDE LOCATIONS 8 FINANCIAL SECTION 9 DIRECTORS & KEY MANAGEMENT 57
TABLEOFCONTENTS:

Our2009earningsperformancewasthesecondbestinOceaneering’shistory.Thiswasaremarkableaccomplishmentandparticularlygratifyingduringatimeofglobaleconomic recession, tight credit markets, and declining oil consumption.Theseconditionsledtoareductioninoilindustryexplorationandproduction(E&P)spendingandtosubstantiallylowerdemandformanyoilfieldservicesandproducts.However,thedeepwatermarketweservewaslessvulnerabletotheseE&Pspendingcuts.
lEttER tOsHaREHOlDERs
For 2009 we achieved record ROV operating income, and our Subsea Projects and Inspection operations performed in line with our
expectations. MOPS operating income was better than anticipated as we benefitted from longer-than-expected use of the Ocean
Producer and the gain we realized on the sale of that asset. Subsea Products operating income was below our projection due to
reduced market demand for our specialty subsea products, lower throughput at our umbilical plants, and unanticipated manufacturing
costs we incurred on two BOP control systems.
EPS of $3.40 was slightly above the midpoint of the 2009 EPS guidance range I gave in last year’s shareholder letter, and only 4% below
our record 2008 result. By comparison, the EPS of the Oil Service Sector Index (OSX) quoted on the Philadelphia Stock Exchange
declined nearly 30%. Our ability to outperform the OSX group of companies was largely attributable to increased demand for ROV drill
support services and the success of our efforts to control expenses, which enabled us to maintain the operating income margin we
achieved in 2008. In recognition of this performance and our future business prospects, the market price of our stock doubled during
the year – an increase of 40% more than the OSX.
2 LETTER TO SHAREHOLDERS
8
7 3
7
2
1
5
6
4 4
Our efforts to enhance operational execution and sustain our
strong safety culture continued to produce outstanding results.
Process improvements we implemented were integral to our
success in reducing costs and raising the quality of our services
and products. We excelled in working safely, and I am very
pleased to report that for 2009 we attained the best annual
safety performance in Oceaneering’s history.
During 2009 we continued to fund growth opportunities.
Our capital expenditures totaled $175 million, of which
$147 million was spent on growing and upgrading our ROV
operations. We placed 30 new vehicles into service during
the year. We also repaid $109 million of debt. Funding for our
investments and debt retirement came from cash flow provided
by operating activities.
Our balance sheet remained in great shape. At year-end,
we had $162 million of cash, $120 million of debt, $200 million
available under our revolving credit facility, and $1.2 billion
of equity.
For 2010 the International Energy Agency forecasts a global
surplus supply of oil due to a reduction in demand stemming
from the 2009 global economic recession. We, therefore,
anticipate some deepwater construction projects will
continue to be deferred until there is a meaningful recovery in
hydrocarbon demand. We believe, however, deepwater drilling
activity will keep growing in 2010 as floating rigs currently under
construction are added to the worldwide fleet.
We are forecasting our 2010 EPS to be relatively flat with
2009, in the range of $3.25 to $3.55. Compared to 2009, our
forecast assumptions include unit volume growth and increased
operating profit from ROVs, improved operating efficiencies and
results for Subsea Products, declines in Subsea Projects activity
levels and operating income, and a lower contribution from
MOPS, due primarily to the retirement and sale of the
Ocean Producer.
We continue to believe the oil and gas industry will increase
investment in deepwater projects to counteract high existing
reservoir depletion rates. Deepwater is one of the best frontiers
for adding large hydrocarbon reserves with high production flow
rates at relatively low per barrel finding and development costs.
Therefore, we anticipate demand for our deepwater services
and products will remain promising. With our existing assets,
we are well positioned to supply a wide range of the services
and products required to support the deepwater exploration,
development, and production efforts of our customers.
Given our outlook, we plan to expand our ability to participate
in the deepwater market by continuing to grow organically and
making additional acquisition investments. During 2010 we
anticipate generating over $300 million of cash flow, simply
defined as net income plus depreciation and amortization.
This projected cash flow will provide ample resources to invest
in Oceaneering’s growth.
I’d like to thank our employees who accomplished our 2009
results. Their commitment to safely provide high-quality
solutions to our customers’ needs is the foundation for our
continued success.
I look forward to leading Oceaneering to another year of
significant earnings performance in 2010 and our efforts to
position the company for growth in 2011 and beyond.
t. Jay cOllinsPresident and Chief Executive Officer
3 LETTER TO SHAREHOLDERS

8
7 3
7
2
1
5
6
4 4
We achieved record operating income performance by increasing our vehicle days on hire and controlling our expenses. During 2009 we put 30 new ROVs into service and retired nine. At year-end we had 248 vehicles in our fleet.
Operating income decreased due to declines in demand for our specialty subsea products, lower umbilical plant throughput, and unanticipated manufacturing costs we incurred on two BOP control systems.
Operating income declined due to lower demand for our shallow-water vessel and diving services and competitive pressure in our deepwater vessel market due to an increase in industry vessel availability.
We expect the profit contribution from this segment to improve due to an increase in days on hire. We anticipate benefiting from a full year of operations of the vehicles we placed in service during 2009 and plan to add 15 to 20 vehicles to our fleet in 2010.
We expect operating income to increase as we benefit from manufacturing process improvements and cost reductions implemented in 2009, increased throughput at our umbilical plants, and higher ROV tooling rentals and subsea field development hardware sales.
2009 REViEWEarnings of $188 million were the second highest in Oceaneering’s history. EPS of $3.40 was only 4% below last year’s record result.
We achieved record ROV operating income performance for the sixth consecutive year.
During the year we continued to position the company for future growth and increased earnings. Our capital expenditures were
$175 million, of which $147 million was spent on growing and upgrading our ROV operations. We placed 30 new vehicles into service
during the year.
REMOtEly OPERatED VEHiclEs
sUBsEa PRODUcts
sUBsEa PROJEcts
09REViEW 10 OUtlOOK
We anticipate operating income to be lower due to the completion of The Performer contract off Angola early in the year and a softer market for our deepwater vessels in the Gulf of Mexico. We also expect a continued decline in demand for diving and shallow water vessel services and higher vessel drydock expenses.
OcEanEERing at a glancE
4 OCEANEERING AT A GLANCE

8
7 3
7
2
1
5
6
4 4
2010 OUtlOOKWe forecast our EPS in 2010 to be in the range of $3.25 to $3.55, relatively flat with 2009. Compared to 2009, our forecast assumptions
include unit volume growth and increased operating profit from ROVs, improved operating efficiencies and results for Subsea Products,
declines in Subsea Projects activity levels and operating income, and a lower contribution from MOPS, due primarily to the retirement
and sale of the Ocean Producer.
insPEctiOn
MOBilE OFFsHORE PRODUctiOn systEMs
aDVancED tEcHnOlOgiEs
Operating income decreased due to the unfavorable currency impact of a stronger U.S. Dollar relative to the British Pound and lower demand for our services.
Operating income increased as our 2008 results included an impairment charge to our investment in the Ocean Pensador. This asset was sold in June.
Operating income increased due to an escalation in work on entertainment industry projects, the award of the NASA Constellation Space Suit System contract, and an increase in U.S. Navy engineering services.
We expect the operating profit contribution from this segment to be approximately the same as in 2009.
We expect operating income to decline due primarily to the retirement and sale of the Ocean Producer in December 2009. We anticipate the Ocean Legend will continue working under its current contract for the entire year.
We are forecasting the operating income performance of this segment to be comparable to 2009.
09REViEW 10 OUtlOOK
5 OCEANEERING AT A GLANCE

OcEanEERing
Riserless Well Intervention to Change Out Failed Downhole Safety Valve
Subsea Intervention Lubricator System
Radiographic Pipeline Weld Inspection
Subsea Tree Hydrate Remediation
Platform Riser Inspection
Installation and Workover Control System
Maintenance and Repair of Electrical Hydraulic Distribution Unit
Hurricane-Damaged Platform Repair
6 OCEANEERING AT WORK

at WORK
Saturation Diving Bell Deployment and Diver Locking Out
Subsea Well Stimulation with Acid InjectionTool
Pipeline Tie-In Foundation Installation
Umbilical Loadout from Panama City, FL Multiflex Plant and Installation from Olympic Intervention IV
Dry Habitat Hyperbaric Welding Repair
Field Maintenance Support
7 OCEANEERING AT WORK

REgiOnal HEaDqUaRtERs
OcEanEERing intERnatiOnal, inc.
5004 Railroad Avenue Morgan City, LA 70380 Telephone: (985) 329-3900 Fax: (985) 329-3266
OcEanEERing intERnatiOnal sERVicEs liMitED
Oceaneering House Pitmedden Road, Dyce Aberdeen AB21 0DP, Scotland Telephone: (44-1224) 758500 Fax: (44-1224) 758519
OcEanEERing intERnatiOnal DUBai llc
Al Moosa Tower 2, Suite 15 Sheikh Zayed Road Dubai, United Arab Emirates Telephone: (971-4) 311-7500 Fax: (971-4) 331-0800
OcEanEERing aDVancED tEcHnOlOgiEs
7001 Dorsey Road Hanover, MD 21076 Telephone: (443) 459-3700 Fax: (443) 459-3980
MaRinE PRODUctiOn systEMs DO BRasil ltDa.
Praca Alcides Pereira, n° 3 Ilha da Conceicão/Niteroi 24.050-350 Rio de Janeiro, Brasil Telephone: (55 21) 2729-8900 Fax: (55 21) 2722-1515
OcEanEERing intERnatiOnal PtE ltD
No. 1 Kwong Min Road Jurong, Singapore 628704 Telephone: (65) 6261 3211 Fax: (65) 6261 3230
OcEanEERing as
Jåttåvågen, Hinna PB 8024 4068 Stavanger, Norway Telephone: (47) 51 82 51 00 Fax: (47) 51 82 52 90
cORPORatE HEaDqUaRtERs
OcEanEERing intERnatiOnal, inc.
11911 FM 529 Houston, TX 77041-3000 P.O. Box 40494 Houston, TX 77240-0494
Telephone: (713) 329-4500 Fax: (713) 329-4951
www.oceaneering.com
OPERatiOnal BasEs
intERnatiOnal
Cabinda, Angola Lobito, Angola Luanda, Angola Perth, W.A., Australia Baku, Azerbaijan Macaé, Brasil Niteroi, Brasil Rio de Janeiro, Brasil St. John’s, Newfoundland, Canada Cairo, Egypt Malabo, Equatorial Guinea Tbilisi, Georgia Takoradi, Ghana Mumbai, India Chandigarh, India Kakinada, India Balikpapan, Indonesia Batam, Indonesia Handil, Indonesia Jakarta, Indonesia Tripoli, Libya Kuala Lumpur, Malaysia Miri, Sarawak, Malaysia Mexico D.F., Mexico Cd. del Carmen, Mexico Ikeja, Lagos, Nigeria Port Harcourt, Nigeria Warri, Nigeria Kristiansund, Norway Nodeland, Norway Stavanger, Norway Jurong, Singapore Zug, Switzerland Abu Dhabi, U.A.E. Dubai, U.A.E. Aberdeen, Scotland, U.K. Gloucester, England, U.K. Immingham, England, U.K. London, England, U.K. Mossbank, Shetland Islands, U.K. Port Clarence, North Tees, U.K. Rosyth, Scotland, U.K. Southampton, England, U.K. Stockton, England, U.K. Swansea, Wales, U.K. Rochester, England, U.K. Whitley Bridge, England, U.K. Wilton, England, U.K.
UnitED statEs
San Diego, California Gales Ferry, Connecticut Orlando, Florida Panama City, Florida Pearl Harbor, Hawaii Bayou Vista, Louisiana Houma, Louisiana Lafayette, Louisiana Morgan City, Louisiana New Iberia, Louisiana New Orleans, Louisiana Cataumet, Massachusetts Hanover, Maryland Portsmouth, New Hampshire Austin, Texas Corpus Christi, Texas Clear Lake, Texas Houston, Texas Ingleside, Texas Chesapeake, Virginia
OcEanEERing intERnatiOnal lOcatiOns
8 WORLDWIDE LOCATIONS

2009FINANCIALSECTION

10 OCEANEERING INTERNATIONAL
PERFORMANCE GRAPH
The following graph compares our total shareholder return to the Standard & Poor’s 500 Stock Index (“S&P 500”) and the weighted average return generated by a peer group from December 31, 2004 through December 31, 2009. The peer group companies for this performance graph are Global Industries, Ltd., Halliburton Company, McDermott International, Inc., Cal Dive International, Inc., Bristow Group Inc., Acergy S.A., and Tidewater, Inc.
It is assumed in the graph that: (1) $100 was invested in Oceaneering Common Stock, the S&P 500 and the Peer Group on December 31, 2004; (2) the peer group investment is weighted based on the market capitalization of each individual company within the peer group at the beginning of each period; and (3) any dividends are reinvested. We have not declared any dividends during the period covered by the graph. The shareholder return shown is not necessarily indicative of future performance.
December 31,2004 2005 2006 2007 2008 2009
Oceaneering 100.00 133.39 212.75 360.93 156.16 313.61
S&P 500 100.00 104.91 121.48 128.16 80.74 102.11
Peer Group 100.00 160.01 176.36 241.35 95.94 167.60
$0
$100
$200
$300
$400
$500
12/31/04 12/31/05 12/31/06 12/31/07 12/31/08 12/31/09
Oceaneering International, Inc. S&P 500 Index Peer Group

11 FINANCIAL SECTION
OCEANEERING COMMON STOCK
Our common stock is listed on the New York Stock Exchange under the symbol OII. We submitted to the New York Stock Exchange during 2009 a certification of our Chief Executive Officer regarding compliance with the Exchange's corporate governance listing standards. We also included as exhibits to the annual report on Form 10-K, as filed with the SEC, the certifications of our Chief Executive Officer and Chief Financial Officer required under Section 302 of the Sarbanes-Oxley Act of 2002.
The following table sets out, for the periods indicated, the high and low sales prices for our common stock as reported on the New York Stock Exchange (consolidated transaction reporting system):
For the quarter ended: High Low High Low March 31 41.62$ 27.78$ 76.40$ 54.37$ June 30 55.55 35.34 82.49 60.63 September 30 60.70 39.91 78.22 49.00 December 31 60.90 50.14 52.10 18.05
2009 2008
On February 12, 2010, there were 397 holders of record of our common stock. On that date, the closing sales price, as quoted on the New York Stock Exchange, was $54.45. We have not made any common stock dividend payments since 1977, and we currently have no plans to pay cash dividends. Our credit agreements contain restrictions on the payment of dividends. See Note 5 of Notes to Consolidated Financial Statements included in this report.
We did not repurchase any shares of our common stock in 2009. We repurchased 986,400 shares of our common stock for $54.9 million in 2008.
In February 2010, our Board of Directors approved a plan to repurchase up to 6,000,000 shares of our common stock.

12 OCEANEERING INTERNATIONAL
SELECTED FINANCIAL DATA
The following table sets forth certain selected historical consolidated financial data and should be read in conjunction with Management's Discussion and Analysis of Financial Condition and Results of Operation and our Consolidated Financial Statements and Notes included in this report. The following information may not be indicative of our future operating results.
Results of Operations:
(in thousands, except per share amounts) 2009 2008 2007 2006 2005Revenue 1,822,081$ 1,977,421$ 1,743,080$ 1,280,198$ 998,543$Cost of services and products 1,384,355 1,512,621 1,329,795 984,077 819,263Gross margin 437,726 464,800 413,285 296,121 179,280Selling, general and administrative expense 145,610 147,242 123,662 101,785 85,211Income from operations 292,116$ 317,558$ 289,623$ 194,336$ 94,069$Net income 188,353$ 199,386$ 180,374$ 124,494$ 62,680$Diluted earnings per share 3.40 3.56 3.22 2.26 1.17Depreciation and amortization, including impairment charge in 2008 122,945 115,029 93,776 80,456 79,613Capital expenditures, including business acquisitions 175,021 252,277 233,795 193,842 142,269
Other Financial Data:
(in thousands, except ratios) 2009 2008 2007 2006 2005Working capital ratio 2.25 2.09 1.98 1.87 1.77Working capital 485,592$ 390,378$ 331,594$ 243,939$ 171,566$Total assets 1,880,287 1,670,020 1,531,440 1,242,022 989,568Long-term debt 120,000 229,000 200,000 194,000 174,000Shareholders' equity 1,224,323 967,654 915,310 696,764 536,118
Year Ended December 31,
As of December 31,

13 FINANCIAL SECTION
MANAGEMENT'S DISCUSSION AND ANALYSIS OF FINANCIAL CONDITION AND RESULTS OF OPERATIONS
Certain statements in this annual report, including, without limitation, statements regarding the following matters are forward-looking statements made pursuant to the safe harbor provisions of the Private Securities Litigation Reform Act of 1995:
our business strategy; our plans for future operations; industry conditions; our expectations about 2010 earnings per share and segment operating results, and
the factors underlying those expectations, including our expectations about demand for our deepwater oilfield services and products as a result of the factors we specify in the "Overview" below;
projections relating to subsea tree orders; the adequacy of our liquidity and capital resources to support our operations and
internally-generated growth initiatives; our projected capital expenditures for 2010; the adequacy of our accruals for uninsured expected liabilities from workers’
compensation, maritime employer’s liability and general liability claims; our expectation that our total unrecognized tax benefits will not significantly increase or
decrease in the next 12 months; our expectations about the cash flows from our investment in Medusa Spar LLC, and
the factors underlying those expectations; our expectations regarding 2010 operating income for each of our segments and the
factors underlying those expectations; our backlog; and our expectations regarding the effect of inflation in the near future.
These forward-looking statements are subject to various risks, uncertainties and assumptions, including those we refer to under the headings "Risk Factors" and "Cautionary Statement Concerning Forward-Looking Statements" in Part I of our annual report on Form 10-K. Although we believe that the expectations reflected in such forward-looking statements are reasonable, because of the inherent limitations in the forecasting process, as well as the relatively volatile nature of the industries in which we operate, we can give no assurance that those expectations will prove to have been correct. Accordingly, evaluation of our future prospects must be made with caution when relying on forward-looking information.
Overview
The table that follows sets out our revenue and profitability for 2009, 2008 and 2007.
(dollars in thousands) 2009 2008 2007
Revenue 1,822,081$ 1,977,421$ 1,743,080$Gross Margin 437,726 464,800 413,285Gross Margin % 24% 24% 24%Operating Income 292,116 317,558 289,623Operating Income % 16% 16% 17%Net Income 188,353 199,386 180,374
Year Ended December 31,
During 2009, we generated approximately 89% of our revenue, and 97% of our operating income, from our services and products provided to the oil and gas industry. In 2009, our revenue

14 OCEANEERING INTERNATIONAL
decreased by 8%, with the largest decreases in our Subsea Products (25%) and Inspection (13%) segments. Our Subsea Products segment revenue decreased primarily from lower umbilical plant throughput. Our Inspection segment revenue decreased from lower demand for those services and the impact of a stronger U.S. dollar against the U.K pound sterling. Our ROV segment revenue increased 4%, as a result of a growth in days on hire for our larger work-class fleet.
The $188.4 million consolidated net income we earned in 2009 was the second highest in our history. The $11.0 million decrease from 2008 net income was attributable to a lower profit contribution from our Subsea Products segment, which had $36 million less operating income on $162 million less revenue. The lower revenue and operating income was primarily in our umbilical operations.
In 2009, we invested in the following major capital projects:
additions of work-class ROVs, including 30 new vehicles placed into service during the year;
expenditures to build our own facility to produce control umbilicals for our ROVs; and expansion of our specialty products business in foreign markets.
For 2010, the International Energy Agency forecasts a global surplus supply of oil due to a reduction in demand stemming from the 2009 global economic recession. We therefore anticipate some deepwater construction projects will continue to be delayed until there is a meaningful recovery in hydrocarbon demand. We believe, however, that deepwater drilling activity will continue growing in 2010, as floating rigs currently under construction are added to the worldwide fleet. We believe the trend for our customers to increasingly invest in deepwater projects will continue. Our belief is based on the length of time needed to plan and execute deepwater projects, and the long-term outlook for oil and gas supply, which includes limited non-OPEC supply growth, rapid reservoir depletion rates and eventually increasing hydrocarbon demand.
We expect our 2010 diluted earnings per share to be in the range of $3.25 to $3.55, as compared to $3.40 in 2009, with an increase in operating income in our ROV and Subsea Products segments and decreases in our Subsea Projects and MOPS segments. We anticipate ROV operating income to increase in 2010 as a result of a higher average fleet size and our Subsea Products operating income to increase from higher revenue, manufacturing efficiencies and better job execution.
We use our ROVs in the offshore oil and gas industry to perform a variety of underwater tasks, including drill support, installation and construction support, pipeline inspection and surveys and subsea production facility inspection, repair and maintenance. The largest percentage of our ROVs has historically been used to provide drill support services. Therefore, the number of floating drilling rigs on hire is a leading market indicator for this business. The following table shows average floating rigs on hire and our ROV utilization.
2009 2008 2007Average number of floating rigs 208 201 196ROV days on hire (in thousands) 69 65 63ROV utilization 79% 82% 87%
Demand for floating rigs is our primary driver of future growth prospects. According to industry data published by ODS-Petrodata, at the end of 2009, there were 235 floating drilling rigs in the world, with 90% of the rigs under contract and 70% of the rigs contracted through 2010. Seventy-four additional floating rigs were on order and scheduled to be delivered through 2012, and 45 of these have been contracted long-term, for an average term of approximately seven years. We estimate 30 to 35 floating rigs will be placed in service during 2010, and we have ROV contracts on

15 FINANCIAL SECTION
17 of those to supply 18 ROVs. Competitors have the ROV contracts on six rigs, leaving seven to 12 contract opportunities, and we are pursuing all of those.
In addition to floating rig demand, subsea tree completions are another leading indicator of the strength of the deepwater market and the primary demand driver for our Subsea Products lines. According to industry data published by Quest Offshore Resources, Inc., there were less than 600 subsea completions before 1990, approximately 1,100 in the decade of the 1990s, approximately 2,700 in the decade of the 2000s, and Quest forecasts over 4,100 for the decade of the 2010s. Additionally, the projected global market for subsea tree orders is expected to increase 40% in the 2010-2014 time period compared to the previous five years.
Critical Accounting Policies and Estimates
We have based the following discussion and analysis of our financial condition and results of operations on our consolidated financial statements, which we have prepared in conformity with accounting principles generally accepted in the United States. These principles require us to make various estimates, judgments and assumptions that affect the reported amounts of assets and liabilities at the date of the financial statements and the reported amounts of revenue and expense during the periods we present. We base our estimates on historical experience, available information and other assumptions we believe to be reasonable under the circumstances. On an ongoing basis, we evaluate our estimates; however, our actual results may differ from these estimates under different assumptions or conditions. The following discussion summarizes the accounting policies we believe (1) require our management's most difficult, subjective or complex judgments and (2) are the most critical to our reporting of results of operations and financial position.
Revenue Recognition. We recognize our revenue according to the type of contract involved. On a daily basis, we recognize revenue under contracts that provide for specific time, material and equipment charges, which we bill periodically, ranging from weekly to monthly.
We account for significant fixed-price contracts, which we enter into mainly in our Subsea Products segment, and occasionally in our Subsea Projects and Advanced Technologies segments, using the percentage-of-completion method. In 2009, we accounted for 12% of our revenue using the percentage-of-completion method. In determining whether a contract should be accounted for using the percentage-of-completion method, we consider whether:
the customer provides specifications for the construction of facilities or production of goods or for the provision of related services;
we can reasonably estimate our progress towards completion and our costs; the contract includes provisions as to the enforceable rights regarding the goods or
services to be provided, consideration to be received and the manner and terms of payment;
the customer can be expected to satisfy its obligations under the contract; and we can be expected to perform our contractual obligations.
Under the percentage-of-completion method, we recognize estimated contract revenue based on costs incurred to date as a percentage of total estimated costs. Changes in the expected cost of materials and labor, productivity, scheduling and other factors affect the total estimated costs. Additionally, external factors, including weather or other factors outside of our control, may also affect the progress and estimated cost of a project's completion and, therefore, the timing of income and revenue recognition. We routinely review estimates related to our contracts and reflect revisions to profitability in earnings immediately. If a current estimate of total contract cost indicates an ultimate loss on a contract, we recognize the projected loss in full when we determine it. In prior years, we have recorded adjustments to earnings as a result of revisions to contract estimates. Although we are continually striving to improve our ability to estimate our contract costs and profitability, adjustments to overall contract costs could be significant in future periods.

16 OCEANEERING INTERNATIONAL
We recognize the remainder of our revenue when persuasive evidence of an arrangement exists, delivery has occurred or services have been rendered, price is fixed or determinable and collection is reasonably assured.
Long-lived Assets. We evaluate our property and equipment for impairment whenever events or changes in circumstances indicate that the carrying amounts may not be appropriate. We base these evaluations on a comparison of the assets' carrying values to forecasts of undiscounted cash flows associated with the assets or quoted market prices. If an impairment has occurred, we recognize a loss for the difference between the carrying amount and the fair value of the asset. Our expectations regarding future sales and undiscounted cash flows are highly subjective, cover extended periods of time and depend on a number of factors outside our control, such as changes in general economic conditions, laws and regulations. Accordingly, these expectations could differ significantly from year to year. In 2008, we recorded an impairment charge of $5.7 million to reduce our investment in the Ocean Pensador, an oil tanker we were holding for possible conversion, to its fair value. In 2009 we sold that asset at a further loss of $0.8 million.
We charge the costs of repair and maintenance of property and equipment to operations as incurred, while we capitalize the costs of improvements.
Goodwill. We account for acquisitions using the purchase method of accounting, with the purchase price being allocated to the net assets acquired based on their fair market values at the date of acquisition. We test the goodwill attributable to each of our reporting units for impairment annually, or more frequently whenever events or changes in circumstances indicate that the carrying amounts may not be appropriate. Except for ROVs and Inspection, which are tested as single reporting units, our operating units are one level below our business segments. We estimate fair value of the reporting units using both an income approach, which considers a discounted cash flow model, and a market approach. Reductions in estimates of our future cash flows or adverse changes in market comparable information may result in goodwill impairments in the future. For reporting units with significant goodwill, we do not believe our goodwill will be impaired during 2010.
Loss Contingencies. We self-insure for workers' compensation, maritime employer's liability and comprehensive general liability claims to levels we consider financially prudent and carry insurance for exposures beyond the self-insurance levels, which can be by occurrence or in the aggregate. We determine the level of accruals by reviewing our historical experience and current year claim activity. We do not record accruals on a present-value basis. We review larger claims with insurance adjusters and establish specific reserves for known liabilities. We establish an additional reserve for incidents incurred but not reported to us for each year using our estimates and based on prior experience. We believe we have established adequate accruals for uninsured expected liabilities arising from those obligations. However, it is possible that future earnings could be affected by changes in our estimates relating to these matters.
We are involved in various claims and actions against us, most of which are covered by insurance. We believe that our ultimate liability, if any, that may result from these claims and actions will not materially affect our financial position, cash flows or results of operations.
Income Taxes. We account for any applicable interest and penalties on uncertain tax positions as a component of our provision for income taxes on our financial statements. We charged $0.5 million to income tax expense in 2009 for penalties and interest for uncertain tax positions, which brought our total liabilities for penalties and interest on uncertain tax positions to $3.8 million on our balance sheet at December 31, 2009. Including associated foreign tax credits and penalties and interest, we have accrued a net total of $6.1 million in the caption "other long-term liabilities" on our balance sheet for unrecognized tax benefits. All additions or reductions to those liabilities affect our effective income tax rate in the periods of change.

17 FINANCIAL SECTION
We do not believe that the total of unrecognized tax benefits will significantly increase or decrease in the next 12 months.
Our tax provisions are based on our expected taxable income, statutory rates and tax-planning opportunities available to us in the various jurisdictions in which we operate. Determination of taxable income in any jurisdiction requires the interpretation of the related tax laws. We are at risk that a taxing authority's final determination of our tax liabilities may differ from our interpretation. Our effective tax rate may fluctuate from year to year as our operations are conducted in different taxing jurisdictions, the amount of pre-tax income fluctuates and our estimates regarding the realizability of items such as foreign tax credits may change. In 2009, 2008 and 2007, we recorded reductions of income tax expense of $0.2 million, $0.6 million and $1.1 million, respectively, resulting from the resolution of uncertain tax positions related to certain tax liabilities we recorded in prior years. Current income tax expense represents either nonresident withholding taxes or the liabilities expected to be reflected on our income tax returns for the current year, while the net deferred income tax expense or benefit represents the change in the balance of deferred tax assets or liabilities as reported on our balance sheet.
We establish valuation allowances to reduce deferred tax assets when it is more likely than not that some portion or all of the deferred tax assets will not be realized in the future. We currently have no valuation allowances. While we have considered estimated future taxable income and ongoing prudent and feasible tax-planning strategies in assessing the need for the valuation allowances, changes in these estimates and assumptions, as well as changes in tax laws, could require us to adjust the valuation allowances for our deferred tax assets. These adjustments to the valuation allowance would impact our income tax provision in the period in which such adjustments are identified and recorded.
For a summary of our major accounting policies and a discussion of recently adopted accounting standards, please see Note 1 to our Consolidated Financial Statements.
Liquidity and Capital Resources
We consider our liquidity and capital resources adequate to support our operations and internally-generated growth initiatives. At December 31, 2009, we had working capital of $486 million, including cash and cash equivalents of $162 million. Additionally, we had $200 million available under our revolving credit facility, which currently extends to January 2012. We had total borrowings of $120 million at December 31, 2009, with total maturities in 2010 of $20 million. Maturities in 2010 are not classified as current as of December 31, 2009, since we are able and have the intent to extend the stated maturities by borrowing amounts equal to the 2010 maturities under the revolving credit facility, with a maturity date after one year. At December 31, 2009, our debt-to-total capitalization ratio was 9%. Our net cash provided by operating activities was $418 million, $248 million and $209 million for 2009, 2008 and 2007, respectively.
Our capital expenditures, including business acquisitions, for 2009, 2008 and 2007 were $175 million, $252 million and $234 million, respectively. For 2010, we plan to invest to support growth of our ROV fleet to meet firm demand and we plan to add a new diving support vessel as a replacement for another vessel. Capital expenditures in 2009 included expenditures for: additions and upgrades to our ROV fleet; the construction of our own facility to produce control umbilicals for our ROVs; and expansion of our specialty subsea products business in foreign markets. Capital expenditures in 2008 included expenditures for: additions and upgrades to our ROV fleet; the purchase of GTO for $40 million; vessel upgrades; and facility expansions for our specialty subsea products. Capital expenditures in 2007 included expenditures for: additions and upgrades to our ROV fleet; the purchase of Norway-based Ifokus Engineering AS ("Ifokus"), a designer and manufacturer of specialty subsea products, for $20 million; vessel upgrades; the acquisition of a small inspection company in the United Kingdom; and facility expansions in the United Kingdom, Norway, Morgan City, LA and Houston. Our facility expansions in the United Kingdom, Norway

18 OCEANEERING INTERNATIONAL
and Houston during 2007 related to our Subsea Products manufacturing operations, and our Morgan City expansion supports our ROV and Subsea Projects operations.
Our capital expenditures during 2009, 2008 and 2007 included $147 million, $146 million and $122 million, respectively, in our ROV segment, principally for additions and upgrades to our ROV fleet to expand the fleet and replace units we retired and for facilities infrastructure to support our growing ROV fleet size. We plan to continue adding ROVs at levels we determine appropriate to meet market opportunities as they arise. We added 30, 21 and 31 ROVs to our fleet and disposed of nine, four and seven units during 2009, 2008 and 2007, respectively, resulting in a total of 248 work-class systems in the fleet at December 31, 2009.
In 2006, we chartered a larger deepwater vessel, the Ocean Intervention III, for three years, with extension options for up to six additional years. The initial three-year term of the charter began in May 2007. We also chartered an additional larger deepwater vessel, the Olympic Intervention IV,for an initial term of five years, which began in the third quarter of 2008. We outfitted each of these larger deepwater vessels with two of our high-specification work-class ROVs, and we expect to utilize these vessels to perform subsea hardware installation and inspection, repair and maintenance projects, and to conduct well intervention services in the ultra-deep waters of the U.S. Gulf of Mexico.
We have not guaranteed any debt not reflected on our consolidated balance sheet. In 2003, we acquired a 50% interest in Medusa Spar LLC. At formation, Medusa Spar LLC borrowed $84 million, or approximately 50% of its total capitalization, from a group of banks. The loan was repaid in 2008. We expect the majority of the positive net cash flow generated in the future by Medusa Spar LLC will be distributed to the equity holders. We received $8.5 million, $2.5 million and $3.4 million of cash distributions from Medusa Spar LLC and recognized $3.2 million, $1.9 million and $3.8 million of equity in the earnings of Medusa Spar LLC in 2009, 2008 and 2007, respectively. Medusa Spar LLC is a variable interest entity under accounting rules. As we are not the primary beneficiary of Medusa Spar LLC, we are accounting for our investment in Medusa Spar LLC using the equity method of accounting. At December 31, 2009, our investment in Medusa Spar LLC was $57.4 million.
Our principal source of cash from operating activities is our net income, adjusted for the non-cash expenses of depreciation and amortization, deferred income taxes and noncash compensation under our restricted stock plans. Our $418 million, $248 million and $209 million of cash provided from operating activities in 2009, 2008 and 2007, respectively, were net of increases/(decreases) of ($12 million), $72 million and $55 million, respectively, in accounts receivable and increases/(decreases) of ($14 million), $17 million and $91 million, respectively, in inventory and other current assets. The changes in accounts receivable were due to changes in revenue in the fourth quarter of the respective years, in each case as compared to the fourth quarter of the immediately preceding year. The changes in inventory and other current assets principally related to ROV requirements and Subsea Products raw materials. The raw materials increases in 2007 related to preparations for building goods in our Subsea Products segment, which experienced revenue increases of 25% and 43% in 2008 and 2007, respectively. The increases in ROV inventory related to equipment waiting for assembly into ROVs to be placed in service in subsequent years and increases in parts to be used for servicing our growing ROV fleet.
In 2009 we used $162 million in investing activities, including $147 million on growing and upgrading our ROV operations.
In 2008, we used $246 million in investing activities, including $146 million to modernize and add additional units to our ROV fleet and $78 million to increase our Subsea Products capabilities, including our acquisition of GTO for $40 million. In 2007, we used $227 million in investing activities, including $122 million to modernize and add additional units to our ROV fleet, $66 million to add capacity to our Subsea Products facilities, including our acquisition of Ifokus for $20 million.

19 FINANCIAL SECTION
In 2009, 2008 and 2007, we received $2 million, $2 million and $5 million, respectively, in cash flow from financing activities as proceeds from the sale of our common stock pursuant to the exercise of employee stock options. In addition, in 2009, 2008 and 2007, we received $3 million, $7 million and $8 million, respectively, of tax benefit realized from tax deductions in excess of financial statement expense related to our stock-based compensation plans. For a description of our incentive plans, please see Note 8 to our Consolidated Financial Statements.
In 2002, our Board of Directors approved a plan to repurchase up to 6,000,000 shares of our common stock, subject to a $75 million aggregate purchase price limitation. During 2008, we completed the authorized repurchases under the plan by repurchasing 986,400 shares at a total cost of $54.9 million, which is reflected in our cash used in financing activities. Under our stock repurchase plan, we repurchased 2,782,000 shares of common stock from 2002 through 2008 at a total cost of $75 million. Through December 31, 2009, we had reissued all but 499,292 of these shares, primarily in connection with stock-based compensation plans. In February 2010, our Board of Directors approved a new plan to repurchase up to an additional 6,000,000 shares of our common stock. The timing and amount of any repurchases will be determined by our management. We expect that any shares repurchased under the new plan will be held as treasury stock for future use. The new plan does not obligate us to repurchase any particular number of shares.
Because of our significant foreign operations, we are exposed to currency fluctuations and exchange risks. We generally minimize these risks primarily through matching, to the extent possible, revenue and expense in the various currencies in which we operate. Cumulative translation adjustments as of December 31, 2009 relate primarily to our net investments in, including long-term loans to, our foreign subsidiaries. A stronger U.S. dollar against the U.K. pound sterling and the Norwegian kroner would result in lower operating income. See Item 7A – "Quantitative and Qualitative Disclosures About Market Risk." Inflation has not had a material effect on our revenue or income from operations in the past three years, and no such effect is expected in the near future.
Results of Operations
Information on our business segments is shown in Note 7 of the Notes to Consolidated Financial Statements included in this report.

20 OCEANEERING INTERNATIONAL
Oil and Gas. The table that follows sets out revenue and profitability for the business segments within our Oil and Gas business.
(dollars in thousands) 2009 2008 2007
Remotely Operated VehiclesRevenue 649,228$ 625,921$ 531,381$Gross Margin 237,023 221,270 168,322Gross Margin % 37% 35% 32%Operating Income 207,683 190,343 144,242Operating Income % 32% 30% 27%Days available 86,527 79,052 72,880Utilization % 79% 82% 87%
Subsea ProductsRevenue 487,726 649,857 521,937Gross Margin 115,056 146,747 133,285Gross Margin % 24% 23% 26%Operating Income 60,526 96,046 92,804Operating Income % 12% 15% 18%Backlog at end of period 321,000 298,000 338,000
Subsea ProjectsRevenue 241,393 256,517 257,752Gross Margin 74,564 81,534 100,577Gross Margin % 31% 32% 39%Operating Income 66,514 72,816 92,841Operating Income % 28% 28% 36%
InspectionRevenue 216,140 249,109 219,686Gross Margin 41,125 48,518 37,195Gross Margin % 19% 19% 17%Operating Income 26,443 31,017 22,749Operating Income % 12% 12% 10%
Mobile Offshore Production SystemsRevenue 33,214 39,274 50,103Gross Margin 10,093 8,361 12,443Gross Margin % 30% 21% 25%Operating Income 8,890 6,730 11,048Operating Income % 27% 17% 22%
Total Oil and GasRevenue 1,627,701$ 1,820,678$ 1,580,859$Gross Margin 477,861 506,430 451,822Gross Margin % 29% 28% 29%Operating Income 370,056 396,952 363,684Operating Income % 23% 22% 23%
Year Ended December 31,
In response to continued increasing demand to support deepwater drilling and identified future construction and production maintenance work, we continue to build new ROVs. These new

21 FINANCIAL SECTION
vehicles are designed for use around the world in water depths of 10,000 feet or more. We added 30, 21 and 31 ROVs in 2009, 2008 and 2007, respectively, while disposing of 20 units over the three-year period. We plan to continue adding ROVs at levels we determine appropriate to meet market opportunities.
For 2009, our ROV revenue increased 4% over 2008 from the growth in days on hire for our larger work-class fleet, as our revenue per day on hire decreased approximately 2%. Our operating margin percentage increased as a result of cost controls. For 2008, our ROV revenue increased 18% over 2007 from improvements in average revenue per day-on-hire and growth in days on hire. We grew our ROV fleet size to 248 at December 31, 2009 from 227 at December 31, 2008 and 210 at December 31, 2007. Operating income increased by 9% in 2009 over 2008 and 32% in 2008 over 2007.
We anticipate ROV operating income to increase in 2010 as a result of an increase in days on hire. In addition to having a full year of service from the units we added during 2009, we expect to add approximately 15 to 20 ROVs in 2010 and retire four to six ROVs. Our operating margin percentage may decline slightly in 2010 due to a change in geographic mix.
Our Subsea Products revenue for 2009 declined 25% from 2008 from decreased demand for our specialty subsea products and lower umbilical plant throughput. In 2009, our operating margin percentage decreased from 15% to 12% due to the same factors. Our operating income and margins were also adversely affected by $5.5 million of unexpected costs we incurred in the third quarter of 2009 on two blowout preventer ("BOP") control systems that we expect to deliver in 2010.
Our Subsea Products revenue for 2008 rose 25% over 2007 on increased sales of our specialty subsea products and umbilicals. In 2008, our operating margin percentage decreased from 18% to 15% due to engineering and manufacturing cost overruns related to two BOP control systems we delivered in 2009 and slightly lower margins on several of our other specialty product lines.
We anticipate our Subsea Products segment operating income in 2010 to be higher than 2009, as we expect to benefit from manufacturing improvements and cost reductions we implemented in 2009, avoid repetition of the unexpected costs we incurred in 2009 in manufacturing the BOP control systems, increase throughput in our umbilical plants and have higher ROV tooling rentals and subsea field development hardware sales. Our Subsea Products backlog was $321 million at December 31, 2009, 8% more than our $298 million backlog at December 31, 2008.
Our 2009 Subsea Projects revenue and operating income declined from 2008 due to a softer market for our diving and shallow water vessel services and competitive pressure in our deepwater vessel market due to an increase in vessel availability.
Our 2008 Subsea Projects operating income declined $20 million from 2007 on relatively flat revenue due to a softer market for our diving and shallow water vessel services, principally as a result of the substantial completion of work associated with damage caused by hurricanes in 2004 and 2005; costs incurred to mobilize the Olympic Intervention IV to the U.S. Gulf of Mexico and complete its preparation for service; and expenses we incurred associated with regulatory inspection of four of our vessels. The 2007 amount included a $3.5 million gain from the sale of an ROV support vessel. The revenue shortage from the factors mentioned above was partially offset by additional revenue from a full year of availability from the Ocean Intervention III and the fourth quarter utilization of the Olympic Intervention IV.
We anticipate our 2010 operating income for Subsea Projects to be less than in 2009, as we complete The Performer contract off Angola early in 2010 and foresee a softer market for our deepwater vessels in the U.S. Gulf of Mexico. We also expect a continued decline in demand for our diving and shallow water vessel services and higher vessel drydock expenses.

22 OCEANEERING INTERNATIONAL
Our Inspection segment operating income decreased in 2009 compared to 2008 due to a lower exchange rate for the U.K. pound sterling against the U.S. dollar and decreased demand for our services.
In 2008 as compared to 2007, our Inspection revenue and margins increased, due to strong growth in all of the geographic areas we serve. We continued to sell more value-added services at improved pricing.
We expect that our Inspection segment operating income will be relatively flat in 2010.
The two Mobile Offshore Production Systems operating units we owned at the start of 2009 continued to work under the same contracts during the year. In December 2009 we sold one of them, the Ocean Producer, at a gain of $1.9 million. In June 2009 we sold Ocean Pensador, an oil tanker we were holding for possible conversion, at a loss of $0.8 million. We had recorded an impairment charge of $5.7 million on that vessel in 2008. The decreases in margins in 2008 compared to 2007 were the result of the $5.7 million impairment charge and the decline in the dayrate of the Ocean Legend, as per the customer renewal option terms in the existing contract.
We anticipate our Mobile Offshore Production Systems operating income in 2010 will decline from 2009 as a result of the retirement and sale of the Ocean Producer in December 2009. We anticipate the Ocean Legend will continue to work on its current contract for all of 2010.
Advanced Technologies. The table that follows sets out revenue and profitability for this segment.
(dollars in thousands) 2009 2008 2007
Revenue 194,380$ 156,743$ 162,221$Gross Margin 25,128 21,596 25,561Gross Margin % 13% 14% 16%Operating Income 12,366 9,773 14,458Operating Income % 6% 6% 9%
Year Ended December 31,
Our Advanced Technologies segment's 2009 revenue and operating income were higher than 2008 due to an escalation in work on entertainment industry projects and the award of the NASA Constellation Space Suit System contract.
Our Advanced Technologies segment's 2008 operating income was lower than 2007 due to the completion in 2007 of an engineering services contract that had been ongoing for more than five years.
We anticipate our Advanced Technologies 2010 operating income will be approximately the same as 2009.
Unallocated Expenses. Our unallocated expenses, i.e., those not associated with a specific business segment, within gross margin consist of expenses related to our incentive and deferred compensation plans, including restricted stock and bonuses, as well as other general expenses. A portion of our restricted stock expense varies with the market price of our common stock. Our unallocated expenses within operating income consist of those within gross margin plus general and administrative expenses related to corporate functions. The table that follows sets out our unallocated expenses.

23 FINANCIAL SECTION
(dollars in thousands) 2009 2008 2007
Gross margin expenses (65,263)$ (63,226)$ (64,098)$% of revenue 4% 3% 4%Operating expenses (90,306) (89,167) (88,519)% of revenue 5% 5% 5%
Year Ended December 31,
Our unallocated gross margin and operating expenses increased in 2009, primarily due to higher compensation related to incentive plans.
Other. The table that follows sets forth our significant financial statement items below the operating income line.
(dollars in thousands) 2009 2008 2007
Interest income 694$ 907$ 1,198$Interest expense, net of amounts capitalized (7,781) (13,485) (15,333)Equity earnings of unconsolidated affiliates:
Medusa Spar LLC 3,242 1,894 3,779Other - 25 251
Other income (expense), net 1,504 321 (2,020)Provision for income taxes 101,422 107,834 97,124
Year Ended December 31,
Interest expense decreased in 2009 and 2008, primarily from lower interest rates on LIBOR-based borrowings under our revolving credit agreement and term loan, and lower debt levels. Interest expense is net of capitalized interest of $1.0 million for 2007. We capitalized less than $0.1 million of interest in each of 2009 and 2008.
We earn equity income from our 50% investment in Medusa Spar LLC, which we acquired in 2003. Medusa Spar LLC owns 75% of a production spar in the U.S. Gulf of Mexico and earns its revenue from fees charged on production processed through the facility. In 2008, we experienced a decrease in equity in earnings of unconsolidated affiliates from our investment in Medusa Spar LLC due to lower production throughput at the spar. In 2009, Medusa Spar LLC's net income was higher due to increased throughput from the original blocks dedicated to be processed at the Medusa Spar, throughput from third parties and the elimination of interest expense, as Medusa Spar LLC repaid its debt during 2008. Throughput from the original blocks was higher in 2009 than 2008 due to less downtime from hurricanes in 2009.
We expect Medusa Spar LLC revenue will decline in 2010 due to normal rates of well decline. Medusa Spar LLC's revenue could be increased if the operator of the producing wells is able to either start producing from other zones in the existing wells, which are anticipated to have higher flow rates than the currently-producing zones, or connect more wells to the spar.
Our effective tax rate, including foreign, state and local taxes, was 35% for each of 2009, 2008 and 2007, which included favorable resolutions of uncertain tax positions of $0.2 million, $0.6 million and $1.1 million, respectively, related to certain tax liabilities we recorded in prior years.
Off-Balance Sheet Arrangements
We do not have any off-balance sheet arrangements, as defined by SEC rules.

24 OCEANEERING INTERNATIONAL
Contractual Obligations
At December 31, 2009, we had payments due under contractual obligations as follows:
(dollars in thousands)
Total 2010 2011-2012 2013-2014After 2014
Long-term Debt $120,000 $ 20,000 $100,000 $ - $ - Operating Leases 173,580 44,000 61,919 26,545 41,116 Purchase Obligations 119,477 119,477 - - - Other Long-term Obligations reflected on our balance sheet under GAAP 48,014 1,319 2,879 3,212 40,604
TOTAL $461,071 $184,796 $164,798 $ 29,757 $81,720
Payments due by period
At December 31, 2009, we had outstanding purchase order commitments totaling $119 million, including approximately $22 million for specialized steel tubes to be used in our manufacturing of steel tube umbilicals by our Subsea Products segment, $12 million for a new diving vessel being constructed at an estimated total cost of $17 million and $7 million for ROV winches and control umbilicals for ROV units. We have ordered the specialized steel tubes in advance to meet expected sales commitments. The diving vessel is being built as a replacement for another vessel. The winches and ROV umbilicals have been ordered for new ROVs and for anticipated replacements due to normal wear and tear. Should we decide not to accept delivery of the steel tubes, we would incur cancellation charges of at least 10% of the amount canceled.
In 2001, we entered into an agreement with our Chairman (the "Chairman") who was also then our Chief Executive Officer. That agreement was amended in 2006 and in 2008. Pursuant to the amended agreement, the Chairman relinquished his position as Chief Executive Officer in May 2006 and began his post-employment service period on December 31, 2006. The agreement provides for a specific service period ending no later than August 15, 2011, during which the Chairman, acting as an independent contractor, has agreed to serve as nonexecutive Chairman of our Board of Directors for so long as our Board of Directors desires that he shall continue to serve in that capacity. The agreement provides the Chairman with post-employment benefits for ten years following the sooner to occur of August 15, 2011 or the termination of his services to us. The amendment in 2006 included a lump-sum cash buyout, paid in 2007, of the Chairman’s entitlement to perquisites and administrative assistance during that ten-year period (expected to run from 2011 to 2021). As a result, we recorded $2.8 million of associated expense in the fourth quarter of 2006. The agreement also provides for medical coverage on an after-tax basis to the Chairman, his spouse and children during his service with us and thereafter for their lives. We are recognizing the net present value of the post-employment benefits over the expected service period. If the service period is terminated for any reason (other than the Chairman’s refusal to continue serving), we will recognize all the previously unaccrued benefits in the period in which that termination occurs. Our total accrued liabilities, current and long-term, under this post-employment benefit were $6.3 million and $5.6 million at December 31, 2009 and 2008, respectively.
Effects of Inflation and Changing Prices
Our financial statements are prepared in accordance with generally accepted accounting principles in the United States, using historical U.S. dollar accounting, or historical cost. Statements based on historical cost, however, do not adequately reflect the cumulative effect of increasing costs and changes in the purchasing power of the dollar, especially during times of significant and continued inflation.
In order to minimize the negative impact of inflation on our operations, we attempt to cover the increased cost of anticipated changes in labor, material and service costs, either through an

25 FINANCIAL SECTION
estimate of those changes, which we reflect in the original price, or through price escalation clauses in our contracts.
QUANTITATIVE AND QUALITATIVE DISCLOSURES ABOUT MARKET RISK.
We are currently exposed to certain market risks arising from transactions we have entered into in the normal course of business. These risks relate to interest rate changes and fluctuations in foreign exchange rates. We do not believe these risks are material. We have not entered into any market risk sensitive instruments for speculative or trading purposes. We manage our exposure to interest rate changes through the use of a combination of fixed- and floating-rate debt. See Note 5 of Notes to Consolidated Financial Statements included in this report for a description of our long-term debt agreements, interest rates and maturities. We believe significant interest rate changes would not have a material near term impact on our future earnings or cash flows. We have an interest rate hedge in place on $100 million of floating rate debt under our revolving credit facility for the period August 2008 to August 2011. The hedge fixes three-month LIBOR at 3.31% until August 2011.
Because we operate in various oil and gas exploration and production regions in the world, we conduct a portion of our business in currencies other than the U.S. dollar. The functional currency for several of our international operations is the applicable local currency. A stronger U.S. dollar against the U.K. pound sterling and the Norwegian kroner would result in lower operating income. We manage our exposure to changes in foreign exchange rates principally through arranging compensation in U.S. dollars or freely convertible currency and, to the extent possible, by limiting compensation received in other currencies to amounts necessary to meet obligations denominated in those currencies. We use the exchange rates in effect as of the balance sheet date to translate assets and liabilities as to which the functional currency is the local currency, resulting in translation adjustments that we reflect as accumulated other comprehensive income or loss in the shareholders' equity section of our Consolidated Balance Sheets. We recorded adjustments of $56 million, ($106 million) and $21 million to our equity accounts in 2009, 2008 and 2007, respectively. Negative adjustments reflect the net impact of the strengthening of the U.S. dollar against various foreign currencies for locations where the functional currency is not the U.S. dollar. Conversely, positive adjustments reflect the effect of a weakening dollar.
We recorded foreign currency transaction gains (losses) of $2.0 million, $0.7 million and ($0.3 million) which is included in Other income (expense), net in our Consolidated Income Statements in 2009, 2008 and 2007, respectively, related to our foreign operations.
CONTROLS AND PROCEDURES.
Disclosure Controls and Procedures
In accordance with Rules 13a-15 and 15d-15 under the Securities Exchange Act of 1934, as amended (the "Exchange Act"), we carried out an evaluation, under the supervision and with the participation of management, including our chief executive officer and chief financial officer, of the effectiveness of our disclosure controls and procedures (as that term is defined in Rules 13a-15(e) and 15d-15(e) under the Exchange Act) as of the end of the period covered by this report. Based on that evaluation, our chief executive officer and chief financial officer concluded that our disclosure controls and procedures were effective as of December 31, 2009 to provide reasonable assurance that information required to be disclosed in our reports filed or submitted under the Exchange Act is recorded, processed, summarized and reported within the time periods specified in the Securities and Exchange Commission's rules and forms. There has been no change in our internal control over financial reporting that occurred during the year ended December 31, 2009 that has materially affected, or is reasonably likely to materially affect, our internal control over financial reporting.

26 OCEANEERING INTERNATIONAL
Management’s Report on Internal Control Over Financial Reporting
Our management is responsible for establishing and maintaining adequate internal control over financial reporting (as that term is defined in Rules 13a-15(f) and 15d-15(f) under the Exchange Act). Our internal control over financial reporting is a process designed to provide reasonable, but not absolute, assurance regarding the reliability of financial reporting and the preparation of financial statements for external reporting purposes in accordance with accounting principles generally accepted in the United States of America. We developed our internal control over financial reporting through a process in which our management applied its judgment in assessing the costs and benefits of various controls and procedures, which, by their nature, can provide only reasonable assurance regarding the control objectives. You should note that the design of any system of controls is based in part on various assumptions about the likelihood of future events, and we cannot assure you that any system of controls will succeed in achieving its stated goals under all potential future conditions, regardless of how remote. Because of its inherent limitations, internal control over financial reporting may not prevent or detect misstatements. Also, projections of any evaluation of effectiveness to future periods are subject to the risk that controls may become inadequate because of changes in conditions, or that the degree of compliance with the policies and procedures may deteriorate.
Under the supervision and with the participation of our management, including our principal executive, financial and accounting officers, we have conducted an evaluation of the effectiveness of our internal control over financial reporting based on the framework in "Internal Control – Integrated Framework" issued by the Committee of Sponsoring Organizations of the Treadway Commission. This evaluation included a review of the documentation surrounding our financial reporting controls, an evaluation of the design effectiveness of these controls, testing of the operating effectiveness of these controls and an evaluation of our overall control environment. Based on that evaluation, our management has concluded that our internal control over financial reporting was effective as of December 31, 2009.
Ernst & Young LLP, an independent registered public accounting firm, has audited our internal control over financial reporting, as stated in their report which follows.

27 FINANCIAL SECTION
Report of Independent Registered Public Accounting Firm
The Board of Directors and Shareholders of Oceaneering International, Inc.
We have audited Oceaneering International, Inc. and Subsidiaries’ internal control over financial reporting as of December 31, 2009, based on criteria established in Internal Control—Integrated Framework issued by the Committee of Sponsoring Organizations of the Treadway Commission (the COSO criteria). Oceaneering International, Inc. and Subsidiaries’ management is responsible for maintaining effective internal control over financial reporting, and for its assessment of the effectiveness of internal control over financial reporting included in the accompanying Management’s Report on Internal Control over Financial Reporting. Our responsibility is to express an opinion on the company’s internal control over financial reporting based on our audit.
We conducted our audit in accordance with the standards of the Public Company Accounting Oversight Board (United States). Those standards require that we plan and perform the audit to obtain reasonable assurance about whether effective internal control over financial reporting was maintained in all material respects. Our audit included obtaining an understanding of internal control over financial reporting, assessing the risk that a material weakness exists, testing and evaluating the design and operating effectiveness of internal control based on the assessed risk, and performing such other procedures as we considered necessary in the circumstances. We believe that our audit provides a reasonable basis for our opinion.
A company’s internal control over financial reporting is a process designed to provide reasonable assurance regarding the reliability of financial reporting and the preparation of financial statements for external purposes in accordance with generally accepted accounting principles. A company’s internal control over financial reporting includes those policies and procedures that (1) pertain to the maintenance of records that, in reasonable detail, accurately and fairly reflect the transactions and dispositions of the assets of the company; (2) provide reasonable assurance that transactions are recorded as necessary to permit preparation of financial statements in accordance with generally accepted accounting principles, and that receipts and expenditures of the company are being made only in accordance with authorizations of management and directors of the company; and (3) provide reasonable assurance regarding prevention or timely detection of unauthorized acquisition, use or disposition of the company’s assets that could have a material effect on the financial statements.
Because of its inherent limitations, internal control over financial reporting may not prevent or detect misstatements. Also, projections of any evaluation of effectiveness to future periods are subject to the risk that controls may become inadequate because of changes in conditions, or that the degree of compliance with the policies or procedures may deteriorate.
In our opinion, Oceaneering International, Inc. and Subsidiaries maintained, in all material respects, effective internal control over financial reporting as of December 31, 2009, based on the COSO criteria.
We also have audited, in accordance with the standards of the Public Company Accounting Oversight Board (United States), the consolidated balance sheets of Oceaneering International, Inc. and Subsidiaries as of December 31, 2009 and 2008, and the related consolidated statements of income, cash flows, and shareholders’ equity and comprehensive income for each of the three years in the period ended December 31, 2009 and our report dated February 24, 2010 expressed an unqualified opinion thereon.
Houston, Texas February 24, 2010

28 OCEANEERING INTERNATIONAL
INDEX TO FINANCIAL STATEMENTS
Index to Financial Statements
Report of Independent Registered Public Accounting Firm Consolidated Balance Sheets Consolidated Statements of Income Consolidated Statements of Cash Flows Consolidated Statements of Shareholders' Equity and Comprehensive Income Notes to Consolidated Financial Statements Selected Quarterly Financial Data (unaudited)
REPORT OF INDEPENDENT REGISTERED PUBLIC ACCOUNTING FIRM
To the Board of Directors and Shareholders of Oceaneering International, Inc.
We have audited the accompanying consolidated balance sheets of Oceaneering International, Inc. and Subsidiaries (the Company) as of December 31, 2009 and 2008, and the related consolidated statements of income, cash flows, and shareholders’ equity and comprehensive income for each of the three years in the period ended December 31, 2009. These financial statements are the responsibility of the Company’s management. Our responsibility is to express an opinion on these financial statements based on our audits.
We conducted our audits in accordance with the standards of the Public Company Accounting Oversight Board (United States). Those standards require that we plan and perform the audit to obtain reasonable assurance about whether the financial statements are free of material misstatement. An audit includes examining, on a test basis, evidence supporting the amounts and disclosures in the financial statements. An audit also includes assessing the accounting principles used and significant estimates made by management, as well as evaluating the overall financial statement presentation. We believe that our audits provide a reasonable basis for our opinion.
In our opinion, the consolidated financial statements referred to above present fairly, in all material respects, the consolidated financial position of Oceaneering International, Inc. and Subsidiaries at December 31, 2009 and 2008, and the consolidated results of their operations and their cash flows for each of the three years in the period ended December 31, 2009, in conformity with U.S. generally accepted accounting principles.
As discussed in Note 1 to the consolidated financial statements, the consolidated financial statements have been retroactively adjusted to reflect the application of a new accounting standard related to participating securities and earnings per share.
We have also audited, in accordance with the standards of the Public Company Accounting Oversight Board (United States), the Oceaneering International Inc. and Subsidiaries’ internal control over financial reporting as of December 31, 2009, based on criteria established in Internal Control – Integrated Framework issued by the Committee of Sponsoring Organizations of the Treadway Commission and our report dated February 24, 2010 expressed an unqualified opinion thereon.
Houston, Texas February 24, 2010

29 FINANCIAL SECTION
OCEANEERING INTERNATIONAL, INC. AND SUBSIDIARIESCONSOLIDATED BALANCE SHEETS
(in thousands, except share data) 2009 2008ASSETSCurrent Assets:
Cash and cash equivalents 162,351$ 11,200$
435,151 446,719 Inventory 232,217 235,582 Other current assets 44,420 54,204
Total Current Assets 874,139 747,705
Property and Equipment, at cost 1,501,243 1,351,839 Less accumulated depreciation 734,882 654,409
Net Property and Equipment 766,361 697,430
Other Assets:Goodwill 130,820 118,706 Investments in unconsolidated affiliates 58,736 63,930 Other 50,231 42,249
Total Other Assets 239,787 224,885 Total Assets 1,880,287$ 1,670,020$
LIABILITIES AND SHAREHOLDERS' EQUITYCurrent Liabilities:
Accounts payable 86,484$ 92,511$ Accrued liabilities 255,704 244,035 Income taxes payable 46,359 20,781
Total Current Liabilities 388,547 357,327
Long-term Debt 120,000 229,000
Other Long-term Liabilities 147,417 116,039
Commitments and Contingencies
Shareholders' Equity:Common Stock, par value $0.25 per share; 180,000,000 shares
authorized; 55,417,044 shares issued 13,854 13,854 Additional paid-in capital 212,788 224,245 Treasury stock; 499,292 and 941,600 shares, at cost (27,796) (52,419) Retained earnings 1,039,043 850,690 Accumulated other comprehensive income (13,566) (68,716)
Total Shareholders' Equity 1,224,323 967,654 Total Liabilities and Shareholders' Equity 1,880,287$ 1,670,020$
The accompanying Notes are an integral part of these Consolidated Financial Statements.
December 31,
Accounts receivable, net of allowances for doubtful accounts of $274 and $1,492

30 OCEANEERING INTERNATIONAL
OCEANEERING INTERNATIONAL, INC. AND SUBSIDIARIESCONSOLIDATED STATEMENTS OF INCOME
(in thousands, except per share data) 2009 2008 2007
Revenue 1,822,081$ 1,977,421$ 1,743,080$
Cost of services and products 1,384,355 1,512,621 1,329,795
Gross Margin 437,726 464,800 413,285
Selling, general and administrative expense 145,610 147,242 123,662
Income from Operations 292,116 317,558 289,623
Interest income 694 907 1,198
Interest expense, net of amounts capitalized (7,781) (13,485) (15,333)
Equity earnings of unconsolidated affiliates 3,242 1,919 4,030
Other income (expense), net 1,504 321 (2,020)
Income before Income Taxes 289,775 307,220 277,498
Provision for income taxes 101,422 107,834 97,124
Net Income 188,353$ 199,386$ 180,374$
Basic Earnings per Share 3.42$ 3.59$ 3.27$ Diluted Earnings per Share 3.40$ 3.56$ 3.22$
The accompanying Notes are an integral part of these Consolidated Financial Statements.
Year Ended December 31,

31 FINANCIAL SECTION
OCEANEERING INTERNATIONAL, INC. AND SUBSIDIARIESCONSOLIDATED STATEMENTS OF CASH FLOWS
(in thousands) 2009 2008 2007Cash Flows from Operating Activities:
Net income $188,353 $199,386 $180,374 Adjustments to reconcile net income to net cashprovided by operating activities:Depreciation and amortization 122,945 115,029 93,776 Deferred income tax provision 21,631 45,876 10,265 Net gain on sales of property and equipment (305) (5,460) (4,198)Noncash compensation 6,369 7,956 5,337 Distributions from unconsolidated affiliates greater than(less than) earnings 5,194 725 (33)Increase (decrease) in cash from:
Accounts receivable, net 11,568 (71,903) (55,357)Inventory and other current assets 14,073 (15,968) (95,726)Other assets (9,506) 4,527 1,462 Currency translation effect on working capital 16,215 (44,224) 14,918 Accounts payable (6,027) 14,602 6,064 Accrued liabilities 14,063 10,265 55,676 Income taxes payable 25,578 (7,618) (2,470)Other long-term liabilities 8,083 (5,279) (1,213)
Total adjustments to net income 229,881 48,528 28,501
Net Cash Provided by Operating Activities 418,234 247,914 208,875
Cash Flows from Investing Activities:Purchases of property and equipment (175,021) (209,301) (208,696)Business acquisitions, net of cash acquired - (42,976) (25,099)Dispositions of property and equipment 12,535 5,886 6,941
Net Cash Used in Investing Activities (162,486) (246,391) (226,854)
Cash Flows from Financing Activities:Net (payments) proceeds from revolving credit facility (4,000) (36,000) 25,561 Payments of 6.72% Senior Notes (20,000) (20,000) (20,000)Proceeds (payments) from Term Loan (85,000) 85,000 - Proceeds from issuance of common stock 1,880 1,726 5,277 Excess tax benefits from stock-based compensation 2,523 6,770 8,023 Purchases of treasury stock - (54,929) -
Net Cash Provided by (Used in) Financing Activities (104,597) (17,433) 18,861
Net Increase (Decrease) in Cash and Cash Equivalents 151,151 (15,910) 882 Cash and Cash Equivalents – Beginning of Period 11,200 27,110 26,228
Cash and Cash Equivalents – End of Period $162,351 $ 11,200 $ 27,110
The accompanying Notes are an integral part of these Consolidated Financial Statements.
Year Ended December 31,

32 OCEANEERING INTERNATIONAL
OCEANEERING INTERNATIONAL, INC. AND SUBSIDIARIESCONSOLIDATED STATEMENTS OF SHAREHOLDERS' EQUITY AND COMPREHENSIVE INCOME
Additional UnearnedPaid-in Compen-
(in thousands) Shares Amounts Capital sation
Balance, December 31, 2006 54,440 13,610$ 191,986$ (76)$ Adjustment to initially apply FIN No. 48,
net of tax - - - - Adjusted balance, January 1, 2007 54,440 13,610 191,986 (76) Comprehensive Income:
Net Income - - - - Change in fair value of interest rate hedge, net of tax - - - - Pension-related adjustments, net of tax - - - - Translation adjustments - - - -
Total Comprehensive Income - - - - Restricted stock expense 228 57 3,995 1,281 Restricted stock grant 32 8 1,306 (1,314) Stock options exercised 375 94 5,183 - Stock options expense - - 4 - Tax benefits from stock plans - - 8,023 - Balance, December 31, 2007 55,075 13,769 210,497 (109) Comprehensive Income:
Net Income - - - - Change in fair value of interest rate hedge and other, net of tax - - - - Pension-related adjustments, net of tax - - - - Translation adjustments - - - -
Total Comprehensive Income - - - - Restricted stock expense 224 56 5,965 1,935 Restricted stock grant 32 8 1,984 (1,992) Stock options exercised 86 21 (805) - Tax benefits from stock plans - - 6,770 - Treasury stock purchases, 986,400 shares - - - - Balance, December 31, 2008 55,417 13,854 224,411 (166) Comprehensive Income:
Net Income - - - - Change in fair value of interest rate hedge and other, net of tax - - - - Pension-related adjustments, net of tax - - - - Translation adjustments - - - -
Total Comprehensive Income - - - - Restricted stock expense - - (9,066) 1,077 Restricted stock grant - - (787) (994) Stock options exercised - - (4,210) - Tax benefits from stock plans - - 2,523 - Balance, December 31, 2009 55,417 13,854$ 212,871$ (83)$
The accompanying Notes are an integral part of these Consolidated Financial Statements.
Common StockIssued

33 FINANCIAL SECTION
Fair Value CurrencyTreasury Retained of Hedging Translation
Stock Earnings Instruments Adjustments Pension Total
-$ 472,525$ 353$ 21,573$ (3,207)$ 696,764$
- (1,595) - - - (1,595) - 470,930 353 21,573 (3,207) 695,169
- 180,374 - - - 180,374
- - (277) - - (277) - - - - 396 396 - - - 21,011 - 21,011 - 180,374 (277) 21,011 396 201,504 - - - - - 5,333 - - - - - - - - - - - 5,277 - - - - - 4 - - - - - 8,023 - 651,304 76 42,584 (2,811) 915,310
- 199,386 - - - 199,386
- - (3,133) - - (3,133) - - - - 641 641 - - - (106,073) - (106,073) - 199,386 (3,133) (106,073) 641 90,821 - - - - - 7,956 - - - - - -
2,510 - - - - 1,726 - - - - - 6,770
(54,929) - - - - (54,929) (52,419) 850,690 (3,057) (63,489) (2,170) 967,654
- 188,353 - - - 188,353
- - 629 - - 629 - - - - (1,812) (1,812) - - - 56,333 - 56,333 - 188,353 629 56,333 (1,812) 243,503
16,752 - - - - 8,763 1,781 - - - - - 6,090 - - - - 1,880
- - - - - 2,523 (27,796)$ 1,039,043$ (2,428)$ (7,156)$ (3,982)$ 1,224,323$
Accumulated OtherComprehensive Income (Loss)

34 OCEANEERING INTERNATIONAL
NOTES TO CONSOLIDATED FINANCIAL STATEMENTS
1. SUMMARY OF MAJOR ACCOUNTING POLICIES
Basis of Presentation
Principles of Consolidation. The consolidated financial statements include the accounts of Oceaneering International, Inc. and our 50% or more owned and controlled subsidiaries. We also consolidate entities that are determined to be variable interest entities if we determine that we are the primary beneficiary; otherwise, we account for these entities using the equity method of accounting. We use the equity method to account for our investments in unconsolidated affiliated companies of which we own an equity interest of between 20% and 50% and as to which we have significant influence, but not control, over operations. All significant intercompany accounts and transactions have been eliminated.
Use of Estimates. The preparation of financial statements in conformity with accounting principles generally accepted in the United States requires that our management make estimates and assumptions that affect the reported amounts of assets and liabilities, disclosure of contingent assets and liabilities at the date of the financial statements and the reported amounts of revenue and expense during the reporting period. Actual results could differ from those estimates.
Reclassifications. Certain amounts from prior periods have been reclassified to conform with the current year presentation.
Cash and Cash Equivalents. Cash and cash equivalents include demand deposits and highly liquid investments with original maturities of three months or less from the date of the investment.
Accounts Receivable – Allowances for Doubtful Accounts. We determine the need for allowances for doubtful accounts using the specific identification method. We do not generally require collateral from our customers.
Inventory. Inventory is valued at lower of cost or market. We determine cost using the weighted-average method.
Property and Equipment. We provide for depreciation of property and equipment on the straight-line method over estimated useful lives of three to 20 years for marine services equipment (such as ROVs, vessels and diving equipment), up to 12 years for mobile offshore production equipment and three to 25 years for buildings, improvements and other equipment.
We charge the costs of repair and maintenance of property and equipment to operations as incurred, while we capitalize the costs of improvements.
We capitalize interest on assets where the construction period is anticipated to be more than three months. We capitalized $1.0 million 2007. We capitalized less than $0.1 million of interest in each of 2009 and 2008. We do not allocate general administrative costs to capital projects. Upon the disposition of property and equipment, the related cost and accumulated depreciation accounts are relieved and any resulting gain or loss is included as an adjustment to cost of services and products.
Our management periodically, and upon the occurrence of a triggering event, reviews the realizability of long-lived assets, excluding goodwill and indefinite-lived intangibles, which are held and used by us, to determine whether any events or changes in circumstances indicate that the carrying amount of the asset may not be recoverable. For long-lived assets to be held and used, we base our evaluation on impairment indicators such as the nature of the assets,

35 FINANCIAL SECTION
the future economic benefit of the assets, any historical or future profitability measurements and other external market conditions or factors that may be present. If such impairment indicators are present or other factors exist that indicate that the carrying amount of the asset may not be recoverable, we determine whether an impairment has occurred through the use of an undiscounted cash flows analysis of the asset at the lowest level for which identifiable cash flows exist. If an impairment has occurred, we recognize a loss for the difference between the carrying amount and the fair value of the asset. For assets held for sale or disposal, the fair value of the asset is measured using fair market value less cost to sell. Assets are classified as held-for-sale when we have a plan for disposal of certain assets and those assets meet the held for sale criteria. In 2008, we recorded an impairment charge of $5.7 million to reduce our investment in the Ocean Pensador, an oil tanker we were holding for possible conversion, to its fair value, based on quoted steel commodity prices. This impairment charge was recorded in our cost of services and products in our Mobile Offshore Production Systems segment.
Business Acquisitions. In March 2008, we purchased GTO Subsea AS ("GTO"), a Norwegian rental provider of specialized subsea dredging equipment, including ROV-deployed units, to the offshore oil and gas industry for $40 million. We accounted for this acquisition using the purchase method of accounting, with the purchase price being allocated to the net assets acquired based on their fair market values at the date of acquisition. Our goodwill, all nondeductible, associated with the acquisition was $23.2 million, and other intangible assets were $8.1 million. The results of operations of GTO are included in our consolidated statements of income from the date of acquisition.
In 2007, we acquired Ifokus Engineering AS ("Ifokus"), a designer and manufacturer of specialty subsea products based in Norway, for $20 million. We accounted for this acquisition using the purchase method of accounting, with the purchase price being allocated to the net assets acquired based on their fair market values at the date of acquisition. Our goodwill, all nondeductible, associated with the acquisition was $18 million, and other intangible assets were $2 million. The results of operations of Ifokus are included in our consolidated statements of income from the date of acquisition.
We also made several smaller acquisitions during the periods presented.
The above acquisitions were not material. As a result, we have not included pro forma information related to the acquisitions in this report.
Goodwill and Intangible Assets. We tested the goodwill attributable to each of our reporting units for impairment as of December 31, 2009, 2008 and 2007 and concluded that there was no impairment. Our reporting units are the operating units one level below our business segments, except for ROVs and Inspection, which are tested as single reporting units. We estimated fair value using discounted cash flow methodologies and market comparable information. The only changes in our reporting units’ goodwill during the periods presented are from business acquisitions, as discussed above, and currency exchange rate changes. For more information regarding goodwill by business segment, see Note 7.
Within our balance sheet caption Other Assets: Other, at December 31, 2009 and 2008, we had $20.1 million and $21.4 million, respectively, of intangible assets, primarily acquired in connection with business combinations. These intangible assets include trade names, intellectual property and customer relationships, and are being amortized with a weighted average remaining life of approximately 10 years.
Revenue Recognition. We recognize our revenue according to the type of contract involved. On a daily basis, we recognize revenue under contracts that provide for specific time, material and equipment charges, which we bill periodically, ranging from weekly to monthly.

36 OCEANEERING INTERNATIONAL
We account for significant fixed-price contracts, which we enter into mainly in our Subsea Products segment, and to a lesser extent in our Subsea Projects and Advanced Technologies segments, using the percentage-of-completion method. In 2009, we accounted for 12% of our revenue using the percentage-of-completion method. In determining whether a contract should be accounted for using the percentage-of-completion method, we consider whether:
the customer provides specifications for the construction of facilities or production of goods or for the provision of related services;
we can reasonably estimate our progress towards completion and our costs; the contract includes provisions as to the enforceable rights regarding the goods or
services to be provided, consideration to be received and the manner and terms of payment;
the customer can be expected to satisfy its obligations under the contract; and we can be expected to perform our contractual obligations.
Under the percentage-of-completion method, we recognize estimated contract revenue based on costs incurred to date as a percentage of total estimated costs. Changes in the expected cost of materials and labor, productivity, scheduling and other factors affect the total estimated costs. Additionally, external factors, including weather or other factors outside of our control, also affect the progress and estimated cost of a project's completion and, therefore, the timing of income and revenue recognition. We routinely review estimates related to our contracts and reflect revisions to profitability in earnings immediately. If a current estimate of total contract cost indicates an ultimate loss on a contract, we recognize the projected loss in full when we determine it. Although we are continually striving to improve our ability to estimate our contract costs and profitability, adjustments to overall contract costs could be significant in future periods.
We recognize the remainder of our revenue when persuasive evidence of an arrangement exists, delivery has occurred or services have been rendered, price is fixed or determinable and collection is reasonably assured.
Revenue in Excess of Amounts Billed is classified as accounts receivable and relates to recoverable costs and accrued profits on contracts in progress. Billings in Excess of Revenue Recognized on uncompleted contracts are classified in accrued liabilities.
Revenue in Excess of Amounts Billed on uncompleted fixed-price contracts accounted for using the percentage-of-completion method is summarized as follows:
(in thousands) 2009 2008
Revenue recognized 164,296$ 173,625$Less: Billings to customers (146,241) (136,113)Revenue in excess of amounts billed 18,055$ 37,512$
December 31,

37 FINANCIAL SECTION
Billings in Excess of Revenue Recognized on uncompleted fixed-price contracts accounted for using the percentage-of-completion method are summarized as follows:
(in thousands) 2009 2008
Amounts billed to customers 28,361$ 18,263$Less: Revenue recognized (15,371) (11,578)Billings in excess of revenue recognized 12,990$ 6,685$
December 31,
Stock-Based Compensation. For all awards granted after December 31, 2005 and awards modified, repurchased or canceled after that date, as well as the unvested portion of awards granted prior to December 31, 2005, we recognize all share-based payments to directors, officers and employees, including grants of stock options, over their vesting periods in the income statement based on their estimated fair values.
In light of the accounting expense recognition requirements effective as of January 1, 2006, the Compensation Committee of our Board of Directors has expressed its intention to refrain from using stock options as a component of compensation for our executive officers and other employees for the foreseeable future. Additionally, our Board of Directors has expressed its intention to refrain from using stock options as a component of nonemployee director compensation for the foreseeable future. No stock options have been granted since 2005. For more information on our employee benefit plans, see Note 8.
Income Taxes. We provide income taxes at appropriate tax rates in accordance with our interpretation of the respective tax laws and regulations after review and consultation with our internal tax department, tax advisors and, in some cases, legal counsel in various jurisdictions. We provide for deferred income taxes for differences between carrying amounts of assets and liabilities for financial and tax reporting purposes. Our policy is to provide for deferred U.S. income taxes on foreign income only to the extent such income is not to be invested indefinitely in the related foreign entity. We provide a valuation allowance against deferred tax assets when it is more likely than not that the asset will not be realized.
We recognize the benefit for a tax position if the benefit is more likely than not to be sustainable upon audit by the applicable taxing authority. If this threshold is met, the tax benefit is then measured and recognized at the largest amount that is greater than 50 percent likely of being realized upon ultimate settlement. We account for any applicable interest and penalties on uncertain tax positions as a component of our provision for income taxes on our financial statements.
Foreign Currency Translation. The functional currency for several of our foreign subsidiaries is the applicable local currency. Results of operations for foreign subsidiaries with functional currencies other than the U.S. dollar are translated into U.S. dollars using average exchange rates during the period. Assets and liabilities of these foreign subsidiaries are translated into U.S. dollars using the exchange rates in effect at the balance sheet date, and the resulting translation adjustments are accumulated as a component of shareholders' equity. All foreign currency transaction gains and losses are recognized currently in the Consolidated Statements of Income. We recorded $2.0 million, $0.7 million and ($0.3 million) of foreign currency gains (losses) in 2009, 2008 and 2007, respectively, and those amounts are included as a component of Other income (expense), net.
Earnings Per Share. In 2008, the Financial Accounting Standards Board (the "FASB") issued a staff position on determining whether instruments granted in share-based payment transactions are participating securities, stating that unvested share-based payment awards that contain non-forfeitable rights to dividends or dividend equivalents (whether paid or unpaid)

38 OCEANEERING INTERNATIONAL
are participating securities and, therefore, need to be included in the earnings allocation in computing earnings per share. Certain of our share-based payments contain such rights to dividends or dividend equivalents and are considered participating securities under this staff position. We adopted the staff position as of January 1, 2009, as required. The following table presents our earnings per share calculations in accordance with this staff position:
2009 2008 2007(in thousands, except per share data)
Basic earnings per share:
Net income per consolidated statements of income 188,353$ 199,386$ 180,374$Income allocable to participating securities (1,324) (2,118) (1,358) Earnings allocable to common shareholders 187,029$ 197,268$ 179,016$
Basic shares outstanding 54,766 54,949 54,786
Basic earnings per share 3.42$ 3.59$ 3.27$
Basic earnings per share, as previously reported N/A 3.63$ 3.29$
Diluted earnings per share:
Net income per consolidated statements of income 188,353$ 199,386$ 180,374$Income allocable to participating securities (1,318) (2,102) (1,340) Earnings allocable to diluted common shareholders 187,035$ 197,284$ 179,034$
Diluted shares outstanding 55,026 55,374 55,537
Diluted earnings per share 3.40$ 3.56$ 3.22$
Diluted earnings per share, as previously reported N/A 3.58$ 3.24$
Year Ended December 31,
Financial Instruments. We recognize all derivative instruments as either assets or liabilities in the balance sheet and measure those instruments at fair value. Subsequent changes in fair value are reflected in current earnings or other comprehensive income, depending on whether a derivative instrument is designated as part of a hedge relationship and, if it is, the type of hedge relationship.
Pension and Postretirement Benefits. We recognize the funded status of the pension and postretirement plans in our balance sheet, along with a corresponding noncash, after-tax adjustment to shareholders’ equity. Funded status is determined as the difference between the fair value of plan assets and the projected benefit obligation. We determine the fair value of our pension plan assets using Level 2 inputs, primarily the quoted market prices of the underlying securities of the Plan investments. Changes in the funded status will be recognized in other comprehensive income (loss).
Subsequent Events. In February 2010, our Board of Directors approved a plan to repurchase up to 6,000,000 shares of our common stock. We have evaluated events and transactions through the issuance of these financial statements on February 24, 2010 for possible recognition or disclosure.
39 FINANCIAL SECTION
New Accounting Standards. The following is a summary of recent accounting pronouncements that are applicable to us.
In 2006, the FASB issued a statement on fair value measurements, which defines fair value, establishes a framework for measuring fair value in accounting principles generally accepted in the United States, and expands disclosures about fair value measurements. The statement applies under other accounting pronouncements that require or permit fair value measurements, except as otherwise specified therein. The effective date for the application of this statement to certain items was deferred to January 1, 2009, and we adopted this statement at that time.
In 2007, the FASB issued revisions to the accounting principles related to business combinations. The revisions still require purchase accounting in business combinations, but they:
require an acquirer to recognize all assets and liabilities acquired at the acquisition date, measured at their fair values as of that date, with limited exceptions;
require the expensing of all transaction costs and restructuring charges; require the acquirer in a business combination achieved in stages to recognize the
identifiable assets and liabilities at the full amounts of their fair market values at the acquisition date; and
require the acquirer to recognize contingent consideration, including earn-out arrangements, at the acquisition date, measured at its fair value at that date, with subsequent changes to be recognized in earnings.
These items have not been material to us to date. We adopted these revisions as of January 1, 2009, as required.
In 2007, the FASB issued a statement regarding noncontrolling interests in consolidated financial statements, which requires that revenue, expenses, gains, losses, net income or loss and other comprehensive income be reported in the consolidated financial statements at the consolidated amounts, and that the amount of net income attributable to the noncontrolling interest (commonly called minority interest) be reported separately in the consolidated statement of income. This statement also requires that the noncontrolling interest in subsidiaries be separately presented in the consolidated balance sheets within equity. These items have not been material to us to date. We adopted this statement as of January 1, 2009, as required.
In 2008, the FASB issued guidance to improve financial reporting about derivative instruments and hedging activities by requiring enhanced disclosures to enable investors to better understand the effects of these activities on an entity's financial position, financial performance and cash flows. We adopted the guidance as of January 1, 2009, as required.
In May 2009, the FASB established new principles and reporting requirements for subsequent events. In particular, the FASB set forth the period after the balance sheet date during which management of a reporting entity shall evaluate: events or transactions that may occur for potential recognition or disclosure in its financial statements; the circumstances under which it shall recognize events or transactions occurring after the balance sheet date in its financial statements; and the disclosures that it shall make about events or transactions that occurred after the balance sheet date. We adopted these principles and requirements as of June 30, 2009, as required.

40 OCEANEERING INTERNATIONAL
In June 2009, the FASB issued an updated accounting principle regarding accounting for variable interest entities, specifically to:
require ongoing reassessments of whether an enterprise is the primary beneficiary of a variable interest entity;
eliminate the quantitative approach previously required for determining the primary beneficiary of a variable interest entity, which was based on determining which enterprise absorbs the majority of the entity’s expected losses, receives a majority of the entity’s expected residual returns, or both;
change certain guidance for determining whether an entity is a variable interest entity;
add an additional reconsideration event for determining whether an entity is a variable interest entity when any changes in facts and circumstances occur such that the holders of the equity investment at risk, as a group, lose the power from voting rights or similar rights of those investments to direct the activities of the entity that most significantly impact the entity’s economic performance; and
require enhanced disclosures that will provide users of financial statements with more transparent information about an enterprise’s involvement in a variable interest entity.
The principle will be effective for our first quarter 2010 financial statements, and earlier adoption is not allowed. We are evaluating the impact of this principle on our financial statements.
2. INVESTMENTS IN UNCONSOLIDATED AFFILIATES
Our investments in unconsolidated affiliates consisted of the following:
(in thousands) 2009 2008 2007
Medusa Spar LLC $ 57,388 $ 62,583 $ 63,183 Other 1,348 1,347 1,472
$ 58,736 $ 63,930 $ 64,655
December 31,
In 2003, we purchased a 50% equity interest in Medusa Spar LLC for $43.7 million. Medusa Spar LLC owns a 75% interest in a production spar platform in the U.S. Gulf of Mexico. Medusa Spar LLC's revenue is derived from processing oil and gas production for a fee based on the volumes processed through the platform (throughput). Medusa Spar LLC financed its acquisition of its 75% interest in the production spar platform using approximately 50% debt and 50% equity from its equity holders. The debt was repaid in 2008. We believe our maximum exposure to loss from our investment in Medusa Spar LLC is our $57 million investment. Medusa Spar LLC is a variable interest entity. We are not the primary beneficiary under of Medusa Spar LLC, since we own 50%, do not manage the operations of the asset it owns and another owner guaranteed the revenue stream necessary for it to repay its debt. As we are not the primary beneficiary, we are accounting for our investment in Medusa Spar LLC under the equity method of accounting. Summarized 100% financial information relative to Medusa Spar LLC and a reconciliation of the underlying equity in net assets to our carrying value follows.

41 FINANCIAL SECTION
(in thousands) 2009 2008 2007Medusa Spar LLCCondensed Balance Sheets
ASSETSCash and cash equivalents $ 949 $ 3,520 $ 18,181 Other current assets 4,116 2,456 879 Property and Equipment, net 110,028 119,506 128,983 Other Non-Current Assets - - 378 Total Assets $ 115,093 $ 125,482 $ 148,421
LIABILITIES AND MEMBERS' EQUITYCurrent Maturities of Long-Term Debt $ - $ - $ 8,810 Other Current Liabilities 17 17 16 Total Current Liabilities 17 17 8,826 Long-Term Debt, net of current maturities - - 12,928 Other Comprehensive Income - - 233 Members' Equity 115,076 125,465 126,434 Total Liabilities and Members' Equity $ 115,093 $ 125,482 $ 148,421 Condensed Statements of OperationsRevenue $ 16,143 $ 14,455 $ 18,839 Depreciation (9,478) (9,478) (9,478)General and Administrative (70) (118) (112)Interest - (832) (1,451)Net Income $ 6,595 $ 4,027 $ 7,798
December 31,
Our 50% share of the underlying equity of the net assets of Medusa Spar LLC is approximately equal to its carrying value. Our 50% share of the cumulative undistributed earnings of Medusa Spar LLC was $15.7 million and $20.9 million at December 31, 2009 and 2008, respectively.
3. INCOME TAXES
We recognize the benefit for a tax position if the benefit is more likely than not to be sustainable upon audit by the applicable taxing authority. If this threshold is met, the tax benefit is then measured and recognized at the largest amount that is greater than 50 percent likely of being realized upon ultimate settlement.
We account for any applicable interest and penalties on uncertain tax positions as a component of our provision for income taxes on our financial statements. We charged $0.5 million, $0.4 million and $0.4 million to income tax expense in 2009, 2008 and 2007, respectively, for penalties and interest taken on our financial statements on uncertain tax positions, which brought our total liabilities for penalties and interest on uncertain tax positions to $3.8 million and $3.2 million on our balance sheet at December 31, 2009 and 2008, respectively. Including associated foreign tax credits and penalties and interest, we have accrued a total of $6.1 million in the caption "other long-term liabilities" on our balance sheet for unrecognized tax benefits at December 31, 2009. All additions or reductions to those liabilities affect our effective income tax rate in the periods of change.

42 OCEANEERING INTERNATIONAL
A reconciliation of the beginning and ending amount of gross unrecognized tax benefits, not including associated foreign tax credits and penalties and interest, is as follows:
Year Ended December 31,(in thousands) 2009 2008 2007
Beginning of year 8,402$ 7,450$ 7,001$ Additions based on tax positions relatedto the current year 1,361 1,354 1,392 Reductions for expiration of statutes of limitations (81) (402) (587) Settlements (194) - (356) Balance at end of year 9,488$ 8,402$ 7,450$
We do not believe that the total of unrecognized tax benefits will significantly increase or decrease in the next 12 months.
We file a consolidated U.S. federal income tax return for Oceaneering International, Inc. and our domestic subsidiaries, including acquired companies from their respective dates of acquisition. We conduct our international operations in a number of locations that have varying laws and regulations with regard to income and other taxes, some of which are subject to interpretation. Our management believes that adequate provisions have been made for all taxes that will ultimately be payable, although final determination of tax liabilities may differ from our estimates.
Income before income taxes is as follows:
(in thousands) 2009 2008 2007
Domestic 64,410$ 88,843$ 140,692$ Foreign 225,365 218,377 136,806 Income before income taxes 289,775$ 307,220$ 277,498$
Year Ended December 31,
Our provisions for income taxes and our cash taxes paid are as follows:
(in thousands) 2009 2008 2007
Current:Domestic $ 12,839 $ 9,404 $ 41,512 Foreign 66,952 52,554 45,347 Total current 79,791 61,958 86,859
Deferred:Domestic 10,737 22,006 7,621 Foreign 10,894 23,870 2,644 Total deferred 21,631 45,876 10,265
Total provision for income taxes $ 101,422 $ 107,834 $ 97,124
Cash taxes paid $ 42,520 $ 66,594 $ 82,171
Year Ended December 31,

43 FINANCIAL SECTION
As of December 31, 2009 and 2008, our worldwide deferred tax assets, liabilities and net deferred tax liabilities were as follows:
(in thousands) 2009 2008Deferred tax assets:Deferred compensation 22,185$ 21,014$Foreign tax credit carryforwards 3,773 4,747Accrued expenses 6,512 6,578Deferred income 7,271 5,581Other 7,389 7,760Gross deferred tax assets 47,130 45,680Valuation allowance - - Total deferred tax assets 47,130$ 45,680$
Deferred tax liabilities:Property and equipment 67,409$ 54,506$Basis difference in equity investments 16,599 16,058Unremitted foreign earnings 35,291 24,695Other 5,958 7,998Total deferred tax liabilities 125,257$ 103,257$
Net deferred income tax liability 78,127$ 57,577$
December 31,
Our net deferred tax liability is reflected on our balance sheet as follows:
(in thousands) 2009 2008
Deferred tax liabilities 94,219$ 72,204$Current deferred assets (16,092) (14,627)Net deferred income tax liability 78,127$ 57,577$
December 31,
We have $17 million of earnings of our Swiss subsidiary, Oceaneering International AG, that we consider indefinitely reinvested outside the United States and that we do not expect to repatriate. None of our foreign tax credits are scheduled to expire before December 31, 2014.
We believe it is more likely than not that all our deferred tax assets are realizable. We conduct business through several foreign subsidiaries and, although we expect our consolidated operations to be profitable, there is no assurance that profits will be earned in entities or jurisdictions that have NOLs available. Income taxes, computed by applying the federal statutory income tax rate of 35% to income before income taxes, are not materially different than our actual provisions for income taxes.
We conduct our operations in a number of locations that have varying laws and regulations with regard to income and other taxes, some of which are subject to interpretation. Our tax returns are subject to audit by taxing authorities in multiple jurisdictions. These audits often take years to complete and settle. The following lists the earliest tax years open to examination by tax authorities where we have significant operations:

44 OCEANEERING INTERNATIONAL
Jurisdiction Periods
United States 2006United Kingdom 2007Norway 2000Angola 2004Nigeria 2003Brazil 2004Australia 2006Canada 2006
4. SELECTED BALANCE SHEET ACCOUNTS
The following is information regarding selected balance sheet accounts:
(in thousands) 2009 2008Inventory:Inventory for remotely operated vehicles 110,043$ 104,892$Other inventory, primarily raw materials 122,174 130,690Total 232,217$ 235,582$
December 31,
Other Current Assets:Deferred income taxes 16,092$ 14,627$Prepaids and other 28,328 39,577Total 44,420$ 54,204$
Accrued Liabilities:Payroll and related costs $ 153,256 $ 143,613 Accrued job costs 48,541 62,112 Deferred revenue, including billings in excessof revenue recognized 28,311 17,559 Other 25,596 20,751 Total $ 255,704 $ 244,035
Other Long-Term Liabilities:Deferred income taxes $ 94,219 $ 72,204 Supplemental Executive Retirement Plan 25,547 16,921 Accrued post-employment benefit obligations 14,176 11,178 Other 13,475 15,736 Total $ 147,417 $ 116,039

45 FINANCIAL SECTION
5. DEBT
Long-term Debt consisted of the following:
(in thousands) 2009 200820,000$ 40,000$
100,000 104,000 Term Loan - 85,000 Long-term Debt $ 120,000 $ 229,000
6.72% Senior Notes, maturing September 2010Revolving credit facility, maturing January 2012
December 31,
As of December 31, 2009, we had a $300 million revolving credit facility under an agreement (the "Credit Agreement") that currently extends to January 2012. We have to pay a commitment fee ranging from 0.125% to 0.175% on the unused portion of the facility, depending on our debt-to-capitalization ratio. Under the Credit Agreement, we have the option to borrow at LIBOR plus a margin ranging from 0.50% to 1.25%, depending on our debt-to-capitalization ratio, or at the agent bank's prime rate. At December 31, 2009, we had $100 million of borrowings outstanding under the Credit Agreement and $200 million available for borrowing. The weighted average interest rates on all our outstanding borrowings were 4.3% at December 31, 2009 and 2008.
In September 2008, we signed a one-year, unsecured term loan agreement providing for borrowings of up to $85 million. In October 2008, we borrowed the $85 million and used the proceeds to repay borrowings under our revolving credit facility. We repaid the term loan in 2009.
The 6.72% Senior Notes contain restrictive covenants as to minimum net worth, debt-to-capitalization ratio, fixed charge coverage, interest coverage and restricted payments. Restricted payments, which include dividends and treasury stock purchases, are limited from April 1, 1998, on a net basis, to the sum of $25 million plus 50% of our consolidated net income after April 1, 1998, plus cash proceeds from any sales of our common stock. The Credit Agreement contains restrictive covenants as to debt-to-capitalization ratio and interest coverage.
We have an interest rate hedge in place on $100 million of floating rate debt under our revolving credit facility for the period August 2009 to August 2011. The hedge fixes three-month LIBOR at 3.31%. We estimated the fair value of the interest rate hedge to be a liability of $3.7 million at December 31, 2009. This liability valuation was arrived at using a discounted cash flow model, which uses Level 2 inputs, and is reflected on our balance sheet as $2.1 million in current accrued liabilities and $1.6 million in other long-term liabilities.
Scheduled maturities of Long-term Debt outstanding as of December 31, 2009 were as follows:
(in thousands)6.72% Notes
RevolvingCredit Total
2010 $ 20,000 $ - $ 20,000 2011 - - - 2012 - 100,000 100,000 Total $ 20,000 $ 100,000 $ 120,000
Maturities in 2010 are not classified as current as of December 31, 2009, since we are able and have the intent to extend the stated maturities by borrowing amounts equal to the 2010 maturities under the revolving credit facility, with a maturity date after one year.

46 OCEANEERING INTERNATIONAL
We made cash interest payments of $8.9 million, $13.6 million and $15.2 million in 2009, 2008 and 2007, respectively.
6. COMMITMENTS AND CONTINGENCIES
Lease Commitments
At December 31, 2009, we occupied several facilities under noncancellable operating leases expiring at various dates through 2025. Future minimum rentals under all of our operating leases, including vessel rentals, are as follows:
(in thousands)2010 $ 44,000 2011 33,346 2012 28,573 2013 19,725 2014 6,820 Thereafter 41,116 Total Lease Commitments 173,580$
The above table includes $57 million related to the five-year time charter of a vessel and crew, which began in the third quarter of 2008. Rental expense, which includes hire of vessels, specialized equipment and real estate rental, was approximately $74 million, $79 million and $82 million for 2009, 2008 and 2007, respectively.
Insurance
We self-insure for workers' compensation, maritime employer's liability and comprehensive general liability claims to levels we consider financially prudent, and carry insurance for exposures beyond the self-insurance levels, which can be by occurrence or in the aggregate. We determine the level of accruals by reviewing our historical experience and current-year claim activity. We do not record accruals on a present-value basis. We review larger claims with insurance adjusters and establish specific reserves for all known liabilities. We establish an additional reserve for incidents incurred but not reported to us for each year using management estimates and based on prior experience. We believe that we have established adequate accruals for uninsured expected liabilities arising from those obligations. However, it is possible that future earnings could be affected by actual outcomes as well as changes in our estimates relating to these matters.
Litigation
Various actions and claims are pending against us, most of which are covered by insurance. Although we cannot predict the ultimate outcome of these matters, we believe the ultimate liability, if any, that may result from these actions and claims will not materially affect our results of operations, cash flow or financial position.
Letters of Credit
We had $36 million and $23 million in letters of credit outstanding as of December 31, 2009 and 2008, respectively, as guarantees in force for self-insurance requirements and various performance and bid bonds, which are usually for the duration of the applicable contract.

47 FINANCIAL SECTION
Financial Instruments and Risk Concentration
In the normal course of business, we manage risks associated with foreign exchange rates and interest rates through a variety of strategies, including the use of hedging transactions. As a matter of policy, we do not use derivative instruments unless there is an underlying exposure.
At December 31, 2009, we had an interest rate swap in place related to $100 million of debt under our revolving credit agreement. The fair value of the interest rate swap is deferred in accumulated other comprehensive income and is subsequently reclassified into earnings in the periods in which the hedged interest payments on the variable rate debt affect earnings.
Other financial instruments that potentially subject us to concentrations of credit risk are principally cash and cash equivalents and accounts receivable. The carrying values of cash and cash equivalents and bank borrowings approximate their fair values due to the short maturity of those instruments or the short-term duration of the associated interest rate periods. Accounts receivable are generated from a broad group of customers, primarily from within the energy industry, which is our major source of revenue. At December 31, 2009, one customer in West Africa owed us $50 million. Due to their short-term nature, carrying values of our accounts receivable and accounts payable approximate fair market value.
We estimated the fair value of our $20 million of 6.72% Senior Notes to be approximately equal to their face value as of December 31, 2009. We arrived at this estimate by computing the present value of the future principal and interest payments using a yield-to-maturity interest rate for securities of similar quality and term, which we believe are Level 2 inputs.
7. OPERATIONS BY BUSINESS SEGMENT AND GEOGRAPHIC AREA
Business Segment Information
We are a global oilfield provider of engineered services and products, primarily to the offshore oil and gas industry, with a focus on deepwater applications. Through the use of our applied technology expertise, we also serve the defense and aerospace industries. Our Oil and Gas business consists of Remotely Operated Vehicles ("ROVs"), Subsea Products, Subsea Projects, Mobile Offshore Production Systems and Inspection. Our ROV segment provides submersible vehicles operated from the surface to support offshore oil and gas exploration, production and construction activities. Our Subsea Products segment supplies a variety of built-to-order specialty subsea hardware. Our Subsea Projects segment provides multiservice vessels, oilfield diving and support vessel operations, which are used primarily in inspection, repair and maintenance and installation activities. Our Inspection segment provides customers with a wide range of third-party inspection services to satisfy contractual structural specifications, internal safety standards and regulatory requirements. Our Mobile Offshore Production Systems segment provides offshore production facilities through mobile offshore production systems that we own and a 50%-owned entity, which owns 75% of another system. Our Advanced Technologies business provides project management, engineering services and equipment for applications in non-oilfield markets. Unallocated Expenses are those not associated with a specific business segment. These consist of expenses related to our incentive and deferred compensation plans, including restricted stock and bonuses, as well as other general expenses, including corporate administrative expenses.

48 OCEANEERING INTERNATIONAL
The table that follows presents Revenue, Income from Operations, Depreciation and Amortization Expense and Equity Earnings of Unconsolidated Affiliates by business segment:
(in thousands) 2009 2008 2007
Revenue
Oil and GasRemotely Operated Vehicles 649,228$ 625,921$ 531,381$Subsea Products 487,726 649,857 521,937Subsea Projects 241,393 256,517 257,752Inspection 216,140 249,109 219,686Mobile Offshore Production Systems 33,214 39,274 50,103
Total Oil and Gas 1,627,701 1,820,678 1,580,859Advanced Technologies 194,380 156,743 162,221
Total 1,822,081$ 1,977,421$ 1,743,080$
Income from Operations
Oil and GasRemotely Operated Vehicles 207,683$ 190,343$ 144,242$Subsea Products 60,526 96,046 92,804Subsea Projects 66,514 72,816 92,841Inspection 26,443 31,017 22,749Mobile Offshore Production Systems 8,890 6,730 11,048
Total Oil and Gas 370,056 396,952 363,684Advanced Technologies 12,366 9,773 14,458Unallocated Expenses (90,306) (89,167) (88,519)
Total 292,116$ 317,558$ 289,623$
Depreciation and Amortization Expense
Oil and GasRemotely Operated Vehicles 68,022$ 55,948$ 46,305$Subsea Products 24,133 22,016 17,201Subsea Projects 11,061 11,129 9,111Inspection 3,794 3,691 3,137Mobile Offshore Production Systems 7,950 16,690 13,510
Total Oil and Gas 114,960 109,474 89,264Advanced Technologies 2,526 1,425 1,438Unallocated Expenses 5,459 4,130 3,074
Total 122,945$ 115,029$ 93,776$
Equity Earnings of Unconsolidated Affiliates
Mobile Offshore Production Systems 3,242$ 1,894$ 3,779$Advanced Technologies - 25 251
Total 3,242$ 1,919$ 4,030$
Year Ended December 31,
We determine income from operations for each business segment before interest income or expense, other income (expense) and provision for income taxes. We do not consider an allocation of these items to be practical.

49 FINANCIAL SECTION
Depreciation and amortization expense for Mobile Offshore Production Systems in 2008 includes an impairment charge of $5.7 million to reduce our investment in the Ocean Pensadorto fair value.
No individual customer accounted for more than 10% of our consolidated revenue during 2009 or 2008. During 2007, revenue from one customer, BP plc and subsidiaries, in our oil and gas business segments accounted for 14% of our total consolidated revenue.
The following table presents Assets, Property and Equipment and Goodwill by business segment as of the dates indicated:
(in thousands) 2009 2008Assets
Oil and GasRemotely Operated Vehicles 755,612$ 651,852$Subsea Products 516,239 578,523Subsea Projects 144,357 149,113Inspection 76,513 65,009 Mobile Offshore Production Systems 89,509 111,406
Total Oil and Gas 1,582,230 1,555,903Advanced Technologies 62,193 43,259 Corporate and Other 235,864 70,858
Total 1,880,287$ 1,670,020$
Property and Equipment, netOil and Gas
Remotely Operated Vehicles 470,975$ 378,982$Subsea Products 160,214 161,405Subsea Projects 75,731 82,237 Inspection 14,574 11,418 Mobile Offshore Production Systems 26,724 43,265
Total Oil and Gas 748,218 677,307Advanced Technologies 7,546 6,170 Corporate and Other 10,597 13,953
Total 766,361$ 697,430$
GoodwillOil and Gas
Remotely Operated Vehicles 27,083$ 25,614$ Subsea Products 78,481 68,997 Inspection 14,802 13,641
Total Oil and Gas 120,366 108,252Advanced Technologies 10,454 10,454
Total 130,820$ 118,706$
December 31,
All assets specifically identified with a particular business segment have been segregated. Cash and cash equivalents, certain other current assets, certain investments and other assets have not been allocated to particular business segments and are included in Corporate and Other.

50 OCEANEERING INTERNATIONAL
The following table presents Capital Expenditures by business segment for the periods indicated:
(in thousands) 2009 2008 2007Capital Expenditures
Oil and GasRemotely Operated Vehicles $ 146,707 $ 146,363 $ 121,643 Subsea Products 13,694 78,424 65,727 Subsea Projects 2,732 12,730 27,901 Inspection 6,611 6,558 14,801 Mobile Offshore Production Systems 85 208 650
Total Oil and Gas 169,829 244,283 230,722 Advanced Technologies 3,234 2,806 621 Corporate and Other 1,958 5,188 2,452
Total $ 175,021 $ 252,277 $ 233,795
Year Ended December 31,
Capital expenditures in the table include the costs of business acquisitions.
Geographic Operating Areas
The following table summarizes certain financial data by geographic area:
(in thousands) 2009 2008 2007Revenue
Foreign:West Africa 280,707$ 284,523$ 225,879$ Norway 230,874 231,632 176,467 United Kingdom 156,748 251,660 242,680 Asia and Australia 135,721 129,315 115,842 Brazil 97,401 116,919 78,662 Other 60,610 48,530 41,130
Total Foreign 962,061 1,062,579 880,660 United States 860,020 914,842 862,420
Total 1,822,081$ 1,977,421$ 1,743,080$
Long-Lived AssetsForeign:
West Africa 95,326$ 88,895$ 81,647$ Norway 170,617 141,123 111,386 United Kingdom 63,334 58,371 69,525 Asia and Australia 76,622 78,082 77,471 Brazil 63,653 32,745 25,447 Other 20,490 17,406 7,551
Total Foreign 490,042 416,622 373,027 United States 487,453 486,264 462,109
Total 977,495$ 902,886$ 835,136$
Year Ended December 31,
Revenue is based on location where services are performed and products are manufactured.
51 FINANCIAL SECTION
Additional Income Statement Detail
The following schedule shows our revenue, costs and gross margins by services and products:
(in thousands) 2009 2008 2007Revenue:
Services 1,275,263$ 1,311,149$ 1,193,797$Products 546,818 666,272 549,283
Total revenue 1,822,081 1,977,421 1,743,080
Cost of Services and Products:Services 897,654 935,752 860,582 Products 421,438 513,643 405,115 Unallocated expenses 65,263 63,226 64,098
Total cost of services and products 1,384,355 1,512,621 1,329,795
Gross margin:Services 377,609 375,397 333,215 Products 125,380 152,629 144,168 Unallocated expenses (65,263) (63,226) (64,098)
Total gross margin 437,726$ 464,800$ 413,285$
Year Ended December 31,
8. EMPLOYEE BENEFIT PLANS AND SHAREHOLDER RIGHTS PLAN
Retirement Investment Plans
We have several employee retirement investment plans that, taken together, cover most of our full time employees. The Oceaneering Retirement Investment Plan is a 401(k) plan in which U.S. employees may participate by deferring a portion of their gross monthly salary and directing us to contribute the deferred amount to the plan. We match a portion of the employees' deferred compensation. Our contributions to the 401(k) plan were $13.2 million, $12.9 million and $9.6 million for the plan years ended December 31, 2009, 2008 and 2007, respectively.
We also make matching contributions to other foreign employee savings plans similar in nature to a 401(k) plan. In 2009, 2008 and 2007, these contributions, principally related to plans associated with U.K. and Norwegian subsidiaries, were $5.2 million, $5.1 million and $3.8 million, respectively.
The Oceaneering International, Inc. Supplemental Executive Retirement Plan covers selected key management employees and executives, as approved by the Compensation Committee of our Board of Directors (the "Compensation Committee"). Under this plan, we accrue an amount determined as a percentage of the participant's gross monthly salary and the amounts accrued are treated as if they are invested in one or more investment vehicles pursuant to this plan. Expenses related to this plan during 2009, 2008 and 2007 were $3.5 million, $2.6 million and $2.9 million, respectively.
We have defined benefit plans covering some of our employees in the U.K. and Norway. There are no further benefits accruing under the U.K. plan, and the Norway plan is closed to new participants. The projected benefit obligations for both plans were $21 million and $17 million, at December 31, 2009 and 2008, respectively, and the fair values of the plan

52 OCEANEERING INTERNATIONAL
assets (using Level 2 inputs) for both plans were $15 million and $12 million at December 31, 2009 and 2008, respectively.
Incentive and Stock Option Plans
Under our 2005 Incentive Plan (the "Incentive Plan"), shares of our common stock are made available for awards to employees and nonemployee members of our Board of Directors.
The Incentive Plan is administered by the Compensation Committee; however, the full Board of Directors makes determinations regarding awards to nonemployee directors under the Incentive Plan. The Compensation Committee or our Board of Directors, as applicable, determines the type or types of award(s) to be made to each participant and sets forth in the related award agreement the terms, conditions and limitations applicable to each award. Stock options, stock appreciation rights and stock and cash awards may be made under the Incentive Plan. Options outstanding under the Incentive Plan and prior plans vest over a six-month period and are exercisable over a period of seven years after the date of grant. Under the Incentive Plan, a stock option must have a term not exceeding seven years from the date of grant and must have an exercise price of not less than the fair market value of a share of our common stock on the date of grant. The Compensation Committee may not: (1) grant, in exchange for a stock option, a new stock option having a lower exercise price; or (2) reduce the exercise price of a stock option. In light of the accounting expense recognition requirements established as of January 1, 2006, the Compensation Committee has expressed its intention to refrain from using stock options as a component of employee compensation for our executive officers and other employees for the foreseeable future. Additionally, the Board of Directors has expressed its intention to refrain from using stock options as a component of nonemployee director compensation for the foreseeable future.
In 2009, 2008 and 2007, the Compensation Committee granted awards of performance units under the Incentive Plan to certain of our key executives and employees. In 2009 and 2008, our Board of Directors granted awards of performance units under the Incentive Plan to our Chairman of the Board. The performance units awarded are scheduled to vest in full on the third anniversary of the award date, or pro rata over three years if the participant meets certain age and years of service requirements. The Compensation Committee and the Board of Directors have approved specific financial goals and measures based on our cumulative cash flow from operations, and a comparison of return on invested capital and cost of capital for each of the three-year periods ending December 31, 2011, 2010 and 2009 to be used as the basis for the final value of the performance units. The final value of each performance unit may range from $0 to $125. Upon vesting and determination of value, the value of the performance units will be payable in cash. As of December 31, 2009, there were 325,075 performance units outstanding.

53 FINANCIAL SECTION
The following is a summary of our stock option activity for the three years ended December 31, 2009:
Shares under Option
Weighted Average Exercise
PriceAggregate
Intrinsic ValueBalance at December 31, 2006 663,250 14.61$
Granted - - Exercised (374,850) 14.08 15,125,000$Forfeited (2,400) 11.58
Balance at December 31, 2007 286,000 15.32 Granted - - Exercised (130,100) 13.27 7,125,000$Forfeited (3,000) 13.51
Balance at December 31, 2008 152,900 17.11 Granted - - Exercised (109,400) 17.19 3,257,000$Forfeited (2,500) 17.14
Balance at December 31, 2009 41,000 16.90$
The following table provides information about the options outstanding at December 31, 2009.
WeightedNumber of Average Weighted Number of WeightedShares at Remaining Average Shares at Average
Range of December 31, Contractual Exercise December 31, ExerciseExercise Prices 2009 Life (years) Price 2009 Price
$16.90 – 16.96 41,000 2.4 16.90$ 41,000 16.90$
Outstanding Exercisable
The aggregate intrinsic value of our exercisable stock options was $1.7 million at December 31, 2009. We received $1.9 million, $1.7 million and $5.3 million from the exercise of stock options in 2009, 2008 and 2007, respectively. The excess tax benefit realized from tax deductions from stock options for 2009, 2008 and 2007 was $0.9 million, $2.0 million and $4.6 million, respectively. Excess tax benefits from share-based compensation are classified as a cash outflow in cash flows from operating activities and an inflow in cash flows from financing activities in the statement of cash flows.
Restricted Stock Plan Information
During 2009, 2008 and 2007, the Compensation Committee granted restricted units of our common stock to certain of our key executives and employees. During 2009, 2008 and 2007, our Board of Directors granted restricted units of our common stock to our Chairman of the Board of Directors and restricted common stock to our other nonemployee directors. Over 65% of the grants made in 2009, 2008 and 2007 to our employees vest in full on the third anniversary of the award date, conditional upon continued employment. The remainder of the grants made to employees and all the grants made to our Chairman of the Board of Directors vest pro rata over three years, as these participants meet certain age and years-of-service requirements. For the grants to each of the participant employees and the Chairman of our Board of Directors, the participant will be issued a share of our common stock for the participant’s vested common stock units at the earlier of three years or, if the participant vested earlier after meeting the age and service requirements, at termination of employment or

54 OCEANEERING INTERNATIONAL
service. The grants to our nonemployee directors vest in full on the first anniversary of the award date conditional upon continued service as a director. Pursuant to grants of restricted common stock units to our employees made prior to 2005, at the time of each vesting, a participant receives a tax-assistance payment. Our tax assistance payments were $3.7 million in 2009, $8.9 million in 2008 and $7.0 million in 2007. In April 2009, the Compensation Committee adopted a policy that Oceaneering will not provide U.S. federal income tax gross-up payments to any of its directors or executive officers in connection with future awards of restricted stock or stock units. This policy does not affect existing change-in-control agreements with several of our executive officers and our Chairman of the Board, as well as our existing service agreement with our Chairman of the Board, which provide for tax gross-up payments that could become applicable to such future awards in limited circumstances, such as following a change in control of our company. This policy also has no effect on previously outstanding awards granted in 2002 and 2004 that provide for tax gross-up payments. The tax benefit realized from tax deductions in excess of financial statement expense was $1.6 million, $4.8 million and $3.4 million in 2009, 2008 and 2007, respectively.
The following is a summary of our restricted stock and restricted stock unit activity for 2009, 2008 and 2007:
Weighted AggregateAverage Intrinsic
Number Fair Value ValueBalance at December 31, 2006 917,250 14.47$
Granted 245,750 41.05 Issued (259,933) 12.02 13,770,000$Forfeited (17,617) 25.44
Balance at December 31, 2007 885,450 22.35 Granted 206,875 62.24 Issued (256,600) 13.62 17,880,000$Forfeited (10,975) 46.83
Balance at December 31, 2008 824,750 34.75 Granted 205,925 31.06 Issued (376,250) 23.94 14,239,000$Forfeited (32,900) 41.42
Balance at December 31, 2009 621,525 39.71$
Each grantee of shares of restricted common stock is deemed to be the record owner of those shares during the restriction period, with the right to vote and receive any dividends on those shares. The restricted stock units granted in 2009, 2008 and 2007 carry no voting rights and, with respect to the 2008 and 2007 grants, carry a dividend right should we pay dividends on our common stock.
Effective January 1, 2006, the unvested portions of our grants of restricted stock units were valued at their estimated fair values as of their respective grant dates. For grants made prior to 2006, we used a Black-Scholes methodology to produce a Monte Carlo simulation model, which allows for the incorporation of the performance criteria that had to be met before the awards were earned by the holders. The valuations allowed for variables, such as volatility, the risk-free interest rate, dividends and performance hurdles. The assumptions used for the grants prior to 2006 were: expected volatility of 50% (based on historic analysis), risk-free interest rate of 2% and no dividends. The grants in 2009, 2008 and 2007 were subject only to vesting conditioned on continued employment; therefore, these grants were valued at the grant date fair market value using the closing price of our stock on the New York Stock Exchange.

55 FINANCIAL SECTION
Compensation expense under the restricted stock plans was $23.8 million, $23.0 million and $25.0 million for 2009, 2008 and 2007, respectively. As of December 31, 2009, we had $5.8 million of future expense to be recognized related to our restricted stock unit plans over a weighted average remaining life of 1.5 years.
Stockholder Rights Plan
We adopted a Stockholder Rights Plan on November 20, 1992, which was amended and restated as of November 16, 2001. Each Right initially entitles the holder to purchase from us a fractional share consisting of one two-hundredth of a share of Series B Junior Participating Preferred Stock, at a purchase price of $30 per fractional share, subject to adjustment. The Rights generally will not become exercisable until ten days after a public announcement that a person or group has acquired 15% or more of our common stock (thereby becoming an "Acquiring Person") or the commencement of a tender or exchange offer that would result in a person or group becoming an Acquiring Person (the earlier of such dates being called the "Distribution Date"). Rights were issued and will continue to be issued with all shares of our common stock that are issued until the Distribution Date. Until the Distribution Date, the Rights will be evidenced by the certificates representing our common stock and will be transferable only with our common stock. Generally, if any person or group becomes an Acquiring Person, each Right, other than Rights beneficially owned by the Acquiring Person (which will thereupon become void), will thereafter entitle its holder to purchase, at the Rights’ then-current exercise price, shares of our common stock having a market value of two times the exercise price of the Right. At any time until ten days after a public announcement that the Rights have been triggered, we will generally be entitled to redeem the Rights for $0.01 and to amend the Rights in any manner other than certain specified exceptions. Certain subsequent amendments are also permitted. The Stockholder Rights Plan is scheduled to expire on November 20, 2011.
Post-Employment Benefit
In 2001, we entered into an agreement with our Chairman (the "Chairman") who was also then our Chief Executive Officer. That agreement was amended in 2006 and in 2008. Pursuant to the amended agreement, the Chairman relinquished his position as Chief Executive Officer in May 2006 and began his post-employment service period on December 31, 2006. The agreement provides for a specific service period ending no later than August 15, 2011, during which the Chairman, acting as an independent contractor, has agreed to serve as nonexecutive Chairman of our Board of Directors for so long as our Board of Directors desires that he shall continue to serve in that capacity. The agreement provides the Chairman with post-employment benefits for ten years following the sooner to occur of August 15, 2011 or the termination of his services to us. The amendment in 2006 included a lump-sum cash buyout, paid in 2007, of the Chairman’s entitlement to perquisites and administrative assistance during that ten-year period (expected to run from 2011 to 2021). As a result, we recorded $2.8 million of associated expense in the fourth quarter of 2006. The agreement also provides for medical coverage on an after-tax basis to the Chairman, his spouse and children during his service with us and thereafter for their lives. We are recognizing the net present value of the post-employment benefits over the expected service period. If the service period is terminated for any reason (other than the Chairman’s refusal to continue serving), we will recognize all the previously unaccrued benefits in the period in which that termination occurs. Our total accrued liabilities, current and long-term, under this post-employment benefit were $6.3 million and $5.6 million at December 31, 2009 and 2008, respectively.
As part of the arrangements relating to the Chairman’s post-employment benefits, we established an irrevocable grantor trust, commonly known as a "rabbi trust," to provide the Chairman greater assurance that we will set aside an adequate source of funds to fund payment of the post-retirement benefits under this agreement, including the medical coverage benefits payable to the Chairman, his spouse and their children for their lives. In connection with establishment of the rabbi trust, we contributed to the trust a life insurance policy on the

56 OCEANEERING INTERNATIONAL
life of the Chairman, which we had previously obtained, and we agreed to continue to pay the premiums due on that policy. When the life insurance policy matures, the proceeds of the policy will become assets of the trust. If the value of the trust exceeds $4 million, as adjusted by the consumer price index, at any time after January 1, 2012, the excess may be paid to us. However, because the trust is irrevocable, the assets of the trust are generally not available to fund our future operations until the trust terminates, which is not expected to be during the lives of the Chairman, his spouse or their children. Furthermore, no tax deduction will be available for our contributions to the trust; however, we may benefit from future tax deductions for benefits actually paid from the trust (although benefit payments from the trust are not expected to occur in the near term, because we expect to make direct payments of those benefits for the foreseeable future).
SELECTED QUARTERLY FINANCIAL DATA (UNAUDITED)(in thousands, except per share data)
Quarter Ended March 31 June 30 Sept. 30 Dec. 31 TotalRevenue 435,100$ 450,683$ 484,036$ 452,262$ 1,822,081$ Gross profit 105,802 110,145 114,045 107,734 437,726 Income from operations 69,380 74,298 76,306 72,132 292,116 Net income 44,345 48,111 49,839 46,058 188,353 Diluted earnings per share 0.80$ 0.87$ 0.90$ 0.83$ 3.40$ Weighted average number of diluted shares outstanding 54,863 55,041 55,058 55,095 55,026
Quarter Ended March 31 June 30 Sept. 30 Dec. 31 TotalRevenue 435,815$ 500,120$ 515,795$ 525,691$ 1,977,421$ Gross profit 98,666 118,290 127,596 120,248 464,800 Income from operations 64,770 81,465 89,697 81,626 317,558 Net income 41,279 52,123 54,975 51,009 199,386 Diluted earnings per share * 0.73$ 0.93$ 0.98$ 0.92$ 3.56$ Weighted average number of diluted shares outstanding 55,668 55,710 55,399 54,726 55,374
* 2008 period amounts have been restated to comply with current accounting rules.
Year Ended December 31, 2009
Year Ended December 31, 2008

57 FINANCIAL SECTION
2009DIRECTORS &KEY MANAGEMENT

DIRECTORS
T. JAY COLLINSPresident and Chief Executive Offi cer of
Oceaneering International, Inc.
JEROLD J. DESROCHEPartner and a Director of National Power Company
DAVID S. HOOKERChairman of Houlder Limited, Ocean Hover Limited, and Avoco Secure Ltd., and a Director of Aminex plc and
Eleuthera Capital Ltd.
JOHN R. HUFFChairman of Oceaneering International, Inc., and a Director of BJ Services Company, KBR, Inc., and Suncor Energy Inc.
D. MICHAEL HUGHESOwner of The Broken Arrow Ranch and Affi liated Businesses
HARRIS J. PAPPASPresident of Pappas Restaurants, Inc. and aDirector of Luby’s, Inc.
CORPORATE MANAGEMENT
T. JAY COLLINSPresident and Chief Executive Offi cer
M. KEVIN MCEVOY Executive Vice President and Chief Operating Offi cer
MARVIN J. MIGURASenior Vice President and Chief Financial Offi cer
GEORGE R. HAUBENREICH, JR.Senior Vice President, General Counsel and Secretary
F. RICHARD FRISBIESenior Vice President Deepwater Technologies
KEVIN KERINSSenior Vice President
STEPHEN E. BRADSHAWVice President Business Development
JANET G. CHARLESVice President Human Resources
GREGG K. FARRISVice President Information Technology
W. CARDON GERNERVice President and Chief Accounting Offi cer
TODD HOEFLER Vice President Supply Chain Management
ROBERT P. MINGOIAVice President and Treasurer
ROBERT P. MOSCHETTAVice President Health Safety Environment
JACK JURKOSHEKDirector Investor Relations
DAVID K. LAWRENCEAssistant General Counsel
DAVID M. LEUNGManager Insurance
MATTHEW R. STERNERCorporate Health Safety Environment Director
ROBERT H. STEVENSONDirector Taxation
REUBEN TAMEZDirector Internal Audit
JOHN L. ZACHARYDirector Financial Business Systems
ADMINISTRATIVE MANAGEMENT
AMERICAS
JERRY A. GAUTHIERVice President & General Manager, Americas Region
CHARLES A. ROYCEVice President, Sales & Marketing
SCOTT A. WAGNERVice President & General Manager, Brazil
DUANE LANDRYRegional Controller
DUANE LODRIGUERegional Human Resources Manager
ERNESTO MARCOSCountry Manager, Mexico
PEG NEWMANManager, Marketing
JOSHUA OLDAGHSE Manager
EASTERN HEMISPHERE
ALEX WESTWOODSenior Vice President
ANDREW ATKINSONVice President & General Manager, Asia
ALAN DAVIDSONMaterials Manager, Europe
COLIN FORBESRegional Legal Counsel
FIONA INKSTERDirector, Regional Human Resources
BILL KIRTONManager, IT
CHANDRU LALWANIController
BERNT AAGE LIEGeneral Manager, Norway
ANDREW MACKIEManager, Tax, Europe & Africa
ABIGAIL SILKContracts Manager
AMIR THURAISINGHAMController and Manager, Tax, Asia
ROV
KEVIN KERINSSenior Vice President
DAVID KELSALLBusiness Manager
MARK PHILIPTechnical Manager
SHIL SRIVASTAVARobotic Software Development Manager
TOM HALLIGANManager, WW ROV Equipment Maintenance
JOHN PETRIEDirector, WW ROV Materials
ANDREW SUNLEYWW Operational Engineering & Installations Manager
AMERICAS
ROBERT “PAT” MANNINAVice President & General Manager
MARK CAMPBELLROV Manufacturing Manager
JEFF HARRISCommercial Manager
ANTHONY HARWINRegional Technical Manager
TIM LAWRENCEROV Manager, Canada
CHRIS NICHOLSONGeneral Manager, Deep Sea Systems International
JODY NAQUINSenior Operations Manager
DARRYL RUNDQUISTSenior ROV Operations Manager
BRAZIL
SCOTT WAGNERVice President & General Manager
WAYNE BETTSROV Manager
GUILHERME DIASSenior Operations Manager
DELL D. DODSONManager, ROV SCM
DAMON HICKEYOperations Manager
U.K.
ESPEN INGEBRETSENROV Manager
NORWAY
ERIK H. SAESTADVice President & General Manager
AFRICA, MIDDLE EAST, AND CASPIAN SEA
MARTIN MCDONALDVice President & General Manager
HAROLD ROBERTSCountry Manager, Angola
JONATHON E. PLAYFORDCommercial Manager
NEIL WELLAMManager, Business Development, Nigeria
ASIA
BRETT “GONZO” EYCHNERROV Manager, Asia
ALISTAIR PARLEYTechnical Manager, Eastern Hemisphere
SUBSEA PRODUCTS
L. SCOTT COOKVice President, Subsea Products Sales & Marketing
ROBERT C. BURNETTContracts Group Manager
ALAN CURTISController
ANTHONY FRANKLINDirector, Business Development
STACEY GREENEManager, HSE
TODD NEWELLDirector, Operational Excellence
MICHAEL PALITSCHDirector, Quality Assurance
MULTIFLEX
CHARLES W. DAVISON, JR.Vice President, Multifl ex
MARK CUMMINGGeneral Manager, Multifl ex U.K.
G. SCOTT REYNOLDSGeneral Manager, Multifl ex Brazil
MIKE SMITHGeneral Manager, Multifl ex U.S.
HOWARD BLANDSales Manager, Multifl ex U.S.
ALAN DUNCANDirector, Materials & Commodities
CARLOS NIEMEYERSales Manager, Multifl ex Brazil
CRAIG QUENSTEDTController, Multifl ex
GREG SCOTTGeneral Manager, Central Engineering
DIRECTORS & KEY MANAGEMENT
58 DIRECTORS & KEY MANAGEMENT

ALAN STEVENSONSales Manager, Multifl ex U.K.
OCEANEERING INTERVENTION ENGINEERING
CHAD BLANCHARDManager, IWOCS Services
JOHN CHARALAMBIDESManager, Pipeline Repair Systems
MICHAEL T. CUNNINGHAMManager, Subsea Field Development
PAUL A. FRIKSTADManaging Director, Rotator
BRUCE T. GARTHWAITEOperations Manager, Subsea BOP Controls Systems
MICHAEL HESSEL, JR.General Manager, High Performance Cabling
PATRICK HILLController, OIE
GRAEME REYNOLDSManager, Subsea BOP Controls Systems
MIKE ROBBINSGeneral Manager, Grayloc Products
DEEPWATER TECHNICAL SOLUTIONS
DREW TRENTVice President, Deepwater Technical Solutions
RICHARD J. THOMPSONVice President, Deepwater Processing Technologies
ALF-KRISTIAN AADLANDManager, IFOKUS
JAN L. BJORGEManager, DTS Norway
JOHN DAVISManager, DTS Western Region
CHARLES B. HANSENManager, RIT Norway
CURTIS HENSLEYManager, DTS Houston Manufacturing
FRED KILGOREManager, DTS Southeast Asia
DAVE MCKECHNIEManager, DTS Eastern Region
SUBSEA PROJECTS/DIVING
CLYDE HEWLETTSenior Vice President
NORB D. GORMANVice President & General Manager
PROJECTS
DENISE ADAIRIMR Projects Manager
MIKE ELLISManager, Installation Projects
RANDALL G. KILLEManager, IMR Projects
DEAN KINKLECommercial Manager
BLAINE LECOMPTEManager, Business Development
TOMMY LORDManager, Shore Base Logistics
PATRICK MATTHEWSManager, Survey
DAVE MEDEIROSSenior IMR Projects Manager
STEVE OLMOSProjects Group Manager
KIRK SCHUMACHERManager, Engineering
MIKE TODDManager, Operations
DIVING
STEVEN HALLManager, Diving
JACK COUCHTechnical Sales
GERALD KLEINManager, Operations
WARREN KLINGLERManager, Dive/Marine
MARINE
DARRIN MCGUIREManager, Marine
JIM MCGURKManager, Diving Vessels
TIM WHITEManager, DP Vessels
INSPECTION
ERIC JOHNSTONVice President
JOHN DEIGHANCQI Manager
ALAN GRAYGlobal Integrity Manager
MALCOLM GRAYPipelines Manager
JOHN MCMENEMYInternational Commercial Manager
JAMES MCNABGlobal Technology Manager
FRANCES MILNEBusiness Manager
C. ANDRE OLIVIERInspection Manager, Americas
NEIL RIDDLEInspection Manager, International
NIGEL SMITHACET Software Development Manager
JOHN WATKINSONInspection Manager, UK NDT
MOBILE OFFSHOREPRODUCTION SYSTEMS
CLYDE HEWLETTSenior Vice President
ERIC ADAMSVice President, Business Development
MIKE CHERRYOperations Manager
GRAHAM GOUGHOperations Manager
ANDY HENDERSONManager, Engineering & Projects
MAX KATTNERSenior Staff Engineer
ED LILESProject Manager
JAMES MCALLISTERProject Manager
BEN NEWTONManaging Director, Australia
RICK SPOTTSWOODConstruction Manager
DON THORNEProject Manager
ADVANCED TECHNOLOGIES
JOHN R. KREIDERSenior Vice President
CHARLES B. YOUNGVice President, Strategic Business Planning
ROBERT BROWNController
JIM MARTINManager, Manufacturing
NOREEN O’NEILLDirector, Contracts
TYRONE FARMERManager, HSE
DAVID VAN VALKENBURGHMaterials Manager
MARINE SERVICES
TOM STOWELLVice President & General Manager
JOHN BOYDDirector, Deep Submergence Systems
PHIL MILLERActing Director, Surface and LCAC Programs
LARRY INGELSDirector, Submarine & Manufacturing Program
MARTIN MERZWA, SR.Director, Business Development
JEFF SCHMIDTDirector, Operations Support
TOM VANPETTENDirector, Diving Operations & Special Programs
OCEANEERING SPACE SYSTEMS
MARK M. GITTLEMANVice President & General Manager
JAMES F. BUCHLIVice President & Program Manager, Constellation
Space Suit System
JEFF LASATERManager, Business Development
FRANK SAGERProgram Manager, Operations & Services / NBL
DAVID SPANGLERProgram Manager, Robotics & Automation Programs
DAVE WALLACEGeneral Manager & Deputy Program Manager, Constellation
Space Suit System
MICHAEL WITHEYSenior Manager, Human Space Flight Programs
OCEANEERING TECHNOLOGIES
DUNCAN MCLEANVice President & General Manager
PHIL BEIERLManager of Programs, Marine Projects
JOHN HAMMONDManager, OTECH San Diego
LARRY KARLManager, Marine Systems
JIM KELLYManager of Programs, Marine Systems
GEORGE KOTULAManager, Operations
CRAIG MCLAUGHLINManager, OTECH Nauticos
DAVE WEAVERManager, Marine Projects
ENTERTAINMENT SYSTEMS
DAVE MAUCKDirector, Entertainment Systems
MIKE BOSHEARSManager, Business Development
RON GARBERManager of Programs
NICK MILLERManager, Engineering Services
NICK THOMAREASManager, Business Administration Services
RENAULD WASHINGTONManager, Production & Installation Services
59 DIRECTORS & KEY MANAGEMENT

FORWARD-LOOKING STATEMENTS
All statements in this report that express a belief, expectation, or intention, as well as those that are not historical fact, are forward-looking statements made pursuant to the safe harbor provisions of the Private Securities Litigation Reform Act of 1995. These forward-looking statements are based on current information at the time this report was written and expectations that involve a number of risks, uncertainties, and assumptions. Among the factors that could cause the actual results to diff er materially from those indicated in the forward-looking statements are: industry conditions; prices of crude oil and natural gas; Oceaneering’s ability to obtain and the timing of new projects; operating risks; changes in government regulations; technological changes; and changes incompetitive factors. Should one or more of these risks or uncertainties materialize, or should the assumptions underlying the forward-looking statements prove incorrect, actual outcomes could vary materially from those indicated. These and other risks are fully described in Oceaneering’s annual report on Form 10-K for the year ended December 31, 2009 and other periodic fi lings with the Securities and Exchange Commission.
The use in this report of such terms as Oceaneering, company, group, organization, we, us, our, and its, or references to specifi c entities, is not intended to be a precise description of corporate relationships.
FORM 10-K
The entire Form 10-K, as fi led with the Securities and Exchange Commission, may be accessed through the Oceaneering website, www.oceaneering.com, by selecting “Investor Relations,” then “SEC Financial Reports,” then selecting the desired report, or may be obtained by writing to:
George R. Haubenreich, Jr.SecretaryOceaneering International, Inc.P.O. Box 40494Houston, TX 77240-0494
60

CORPORATE OFFICE
OceAneeRing inteRnAtiOnAl, inc.11911 FM 529 Houston, TX 77041-3000 P.O. Box 40494 Houston, TX 77240-0494 Telephone: (713) 329-4500 Fax: (713) 329-4951 www.oceaneering.com
Stock Symbol: OII Stock traded on NYSE CUSIP Number: 675232102 Please direct communications concerning stock transfer requirements or lost certificates to our transfer agent.
TRAnsFER AgEnT And REgIsTRAR
cOmputeRshARe tRust cOmpAny, n.A.P.O. Box 43078 Providence, RI 02940-3078
Overnight Deliveries: 250 Royall Street Canton, MA 02021-1011
OII Account Information www.computershare.com Telephone: (781) 575-2879 Fax: (781) 575-3605 Hearing Impaired/TDD: (800) 952-9245
AnnUAL sHAREHOLdERs’ MEETIng
Date: May 7, 2010 Time: 8:30 a.m. CDT Location: Oceaneering International, Inc. 11911 FM 529 Houston, TX 77041
IndEPEndEnT PUbLIC ACCOUnTAnTs
Ernst & Young LLP 5 Houston Center 1401 McKinney, Suite 1200 Houston, TX 77010-4035
COUnsEL
Baker Botts L.L.P. One Shell Plaza 910 Louisiana Street Houston, TX 77002-4995
PHOTO CREdITs
cOveRPipeline Pressure Test — Tate Morton
inside fROnt cOveRMillennium® Work Class ROV — Salah Baker
letteR tO shARehOldeRsRiser Clamp Installation Inspection — Ivor A’leeROV Launch — Salah BakerOcean Intervention II — Frank ConnorsSmart Tap Deployment — Scott Wigington
OceAneeRing At A glAncepAge 4ROV Recovery — Salah Baker
pAge 5Pipework Inspection — William Martin WhiteOcean Legend — Courtesy of Woodside Petroleum LtdUSS Asheville (SSN 758) — Courtesy of U.S. Navy
OceAneeRing At wORkpAge 6Pipeline Inspection — Malcolm GrayIWOCS — David SchoreackPlatform Riser Inspection — Ivor A’leeSubsea Tree Hydrate Remediation — Millennium® 67 ROV TeamSILS® — Steven TorresRiserless Well Intervention — Millennium® 67 ROV TeamOcean Project — Dan ClancyWet Welding Diver — Louis Fourgere
pAge 7Diving Bell Deployment — Roger SmithDiver Locking Out — Louis FourgereOlympic Intervention IV — El Hussain MoutiaPipeline Tie-in Foundation — Frank ConnorsAcid Injection Tool — Justin BrannerSubsea Well Stimulation — Millennium® 68 ROV TeamField Maintenance Support — Rune HansenDry Habitat — Alan CharlsonHyperbaric Welding Diver — Eric Casey
gEnERAL InFORMATIOn

OceAneeRing inteRnAtiOnAl, inc.11911 FM 529 Houston, TX 77041-3000
P.O. Box 40494 Houston, TX 77240-0494
Telephone: (713) 329-4500 Fax: (713) 329-4951
www.oceaneering.com