2001 baseline wetland vegetation … baseline wetland vegetation monitoring for the poplar island...
TRANSCRIPT
2001 BASELINE WETLAND VEGETATION MO NITORING
FOR THE POPLAR ISLAND RESTORATION PROJECT
Publication No. CBFO-FAO2-02
Prepared For:
U.S. Army Corps of Engineers, Baltimore District
Prepared By:
Jason K. Miller
Dan Murphy
Under Supervision Of:
Bob Zepp, Permits and Federal Activities Program Leader
John P. Wolflin, Supervisor
U.S. Fish and Wildlife Service
Chesapeake Bay Field Office
177 Admiral Cochrane Drive
Annapolis, MD 21401
2002

i
TABLE OF CONTENTS
Page
LIST OF TABLES .......................................................................... ii
LIST OF FIGURES .......................................................................... iii
LIST OF APPENDICES .............................................................. iv
ACKNOWLEDGMENTS .............................................................. v
EXECUTIVE SUMMARY ........................................................... vi
INTRODUCTION .......................................................................... 1
METHODS ...................................................................................... 2
RESULTS ...................................................................................... 5
DISCUSSION .......................................................................... 8
LITERATURE CITED ........................................................... 9
ii
LIST OF TABLES
Table 1. Letter codes and study status for wetland vegetation
monitoring sites. 2
Table 2. Vegetative areal cover by site and low marsh/high marsh
zones 10
Table 3. Relative vegetative areal cover by site and low marsh/
high marsh zones 11
Table 4. Average percent cover by each plant species for all 2001
vegetation monitoring sites with observations divided by
LOW marsh and HIGH marsh zonation 12
Table 5. Comparison of percent cover for each plant species
observed in LOW m arsh quad rats (#’s one & two combined)
during 2001 wetland vegetation monitoring. Species with
no letters in com mon in the right-hand column are sign ifican tly
different (p<0.05 ). Species are listed in descen ding order
by rank as assigned from sample medians. 13
Table 6. Comparison of percent cover for each plant species observed
in HIGH marsh quadrats (#’s three & four combined) during 2001
wetland vegetation monitoring. Species with no letters in
common in the right-hand column are significantly different
(p<0.05). Species are listed in descending order by rank as
assigned from sample medians. 14
Table 7. Average stem height by species and by low marsh/high
marsh zonation 15
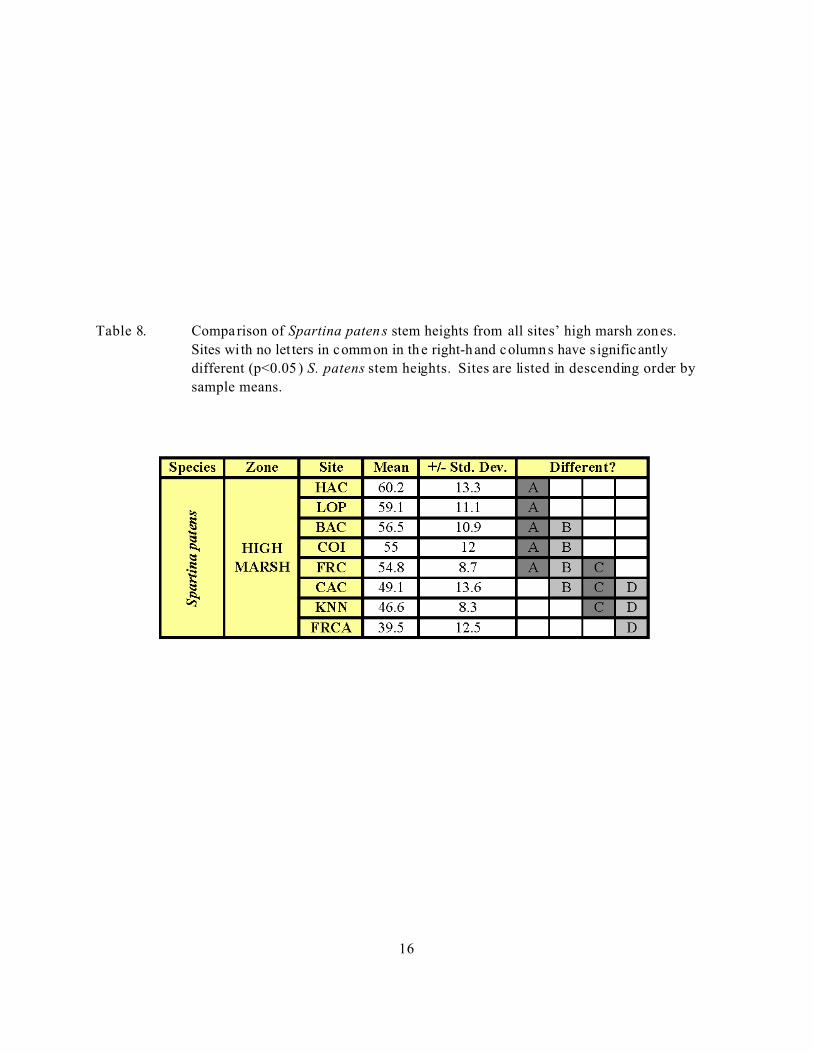
Table 8. Comparison of Spartina paten s stem heights from all sites’
high marsh zones. Sites with no letters in common in the
right-hand columns have significantly different (p<0 .05)
S. patens stem heights. Sites are listed in descending order
by sample means. 16
Table 9. Table 9. Simpson's diversity indices and species richness
for 2001 and 1996 sampling episodes 17
Table 10. Table 10. Faunal taxa abundance by low and high marsh
zones for 2001 sampling sites 18
iii
LIST OF FIGURES
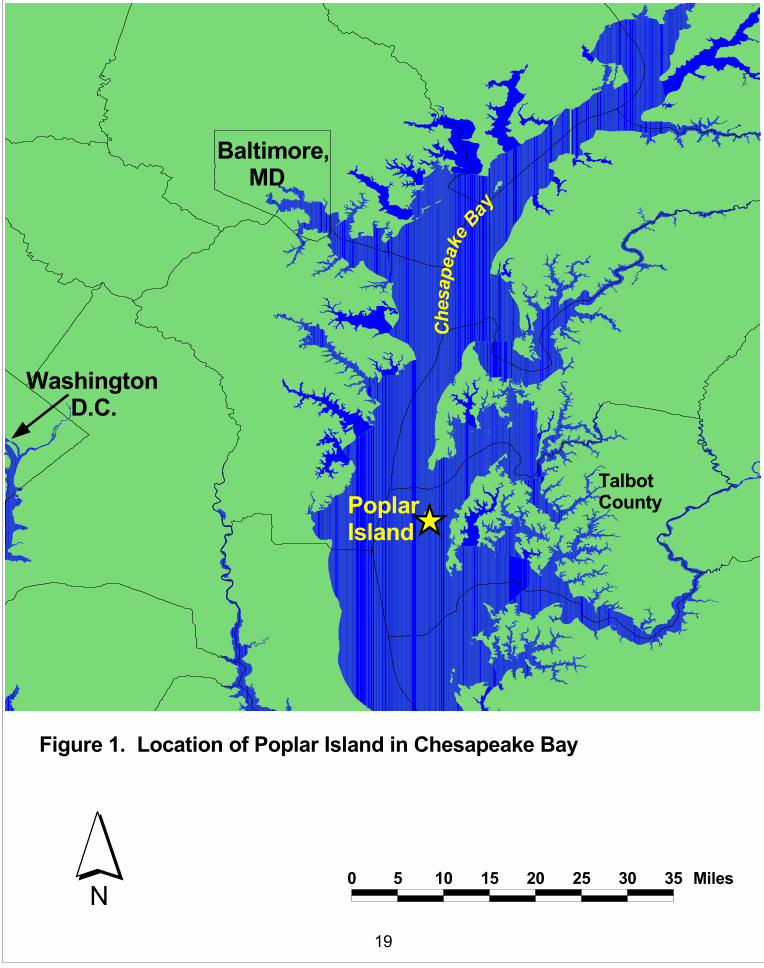
Figure 1. Location of Poplar Island in Chesapeake Bay 19
Figure 2. Location of wetland vegetation monitoring reference
marshes 20
Figure 3. Idealized representation of spatia l relationship between
sampling featu res and wetland elevations. Features are
not drawn to sca le. 21
Figure 4. Back Creek Wetland V egetation Monitoring Site 22
Figure 5. Cabin Cove Wetland V egetation Monitoring Site 23
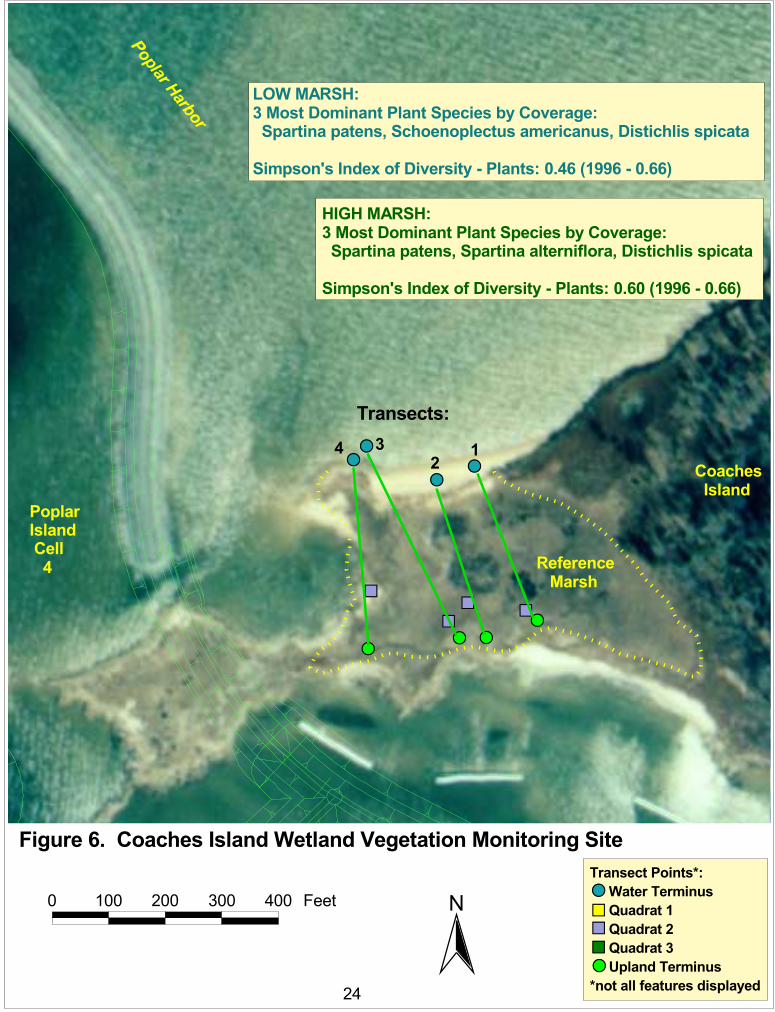
Figure 6. Coaches Island Wetland Vegetation Monitoring Site 24
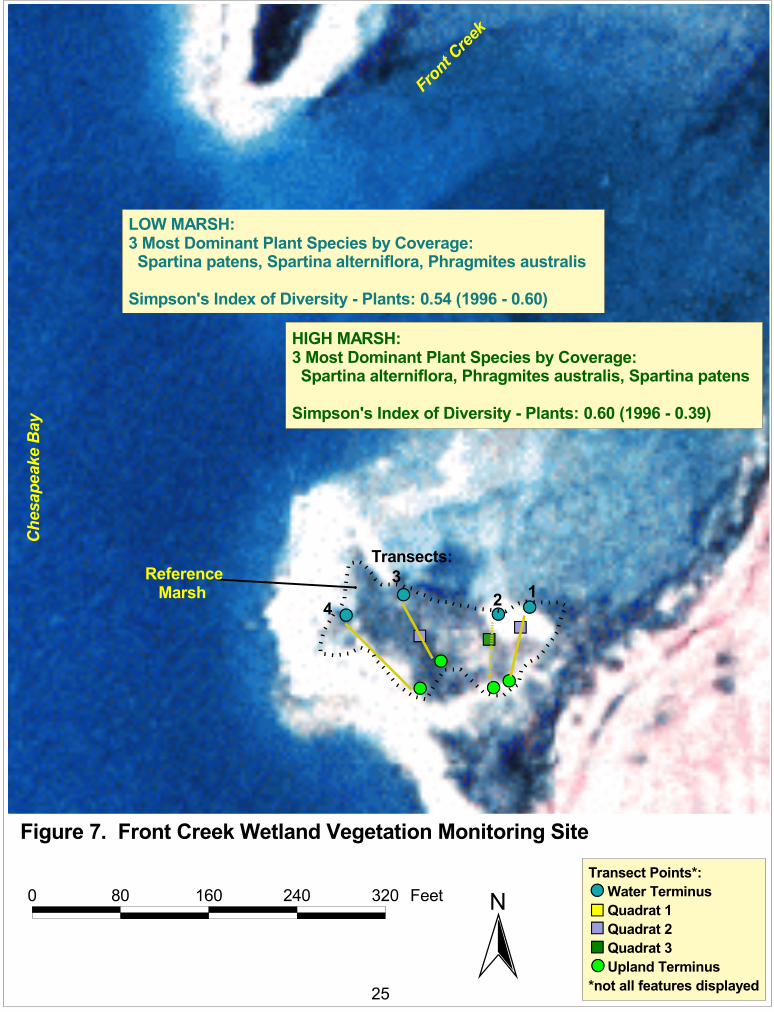
Figure 7. Front Creek Wetland Vegetation Monitoring Site 25
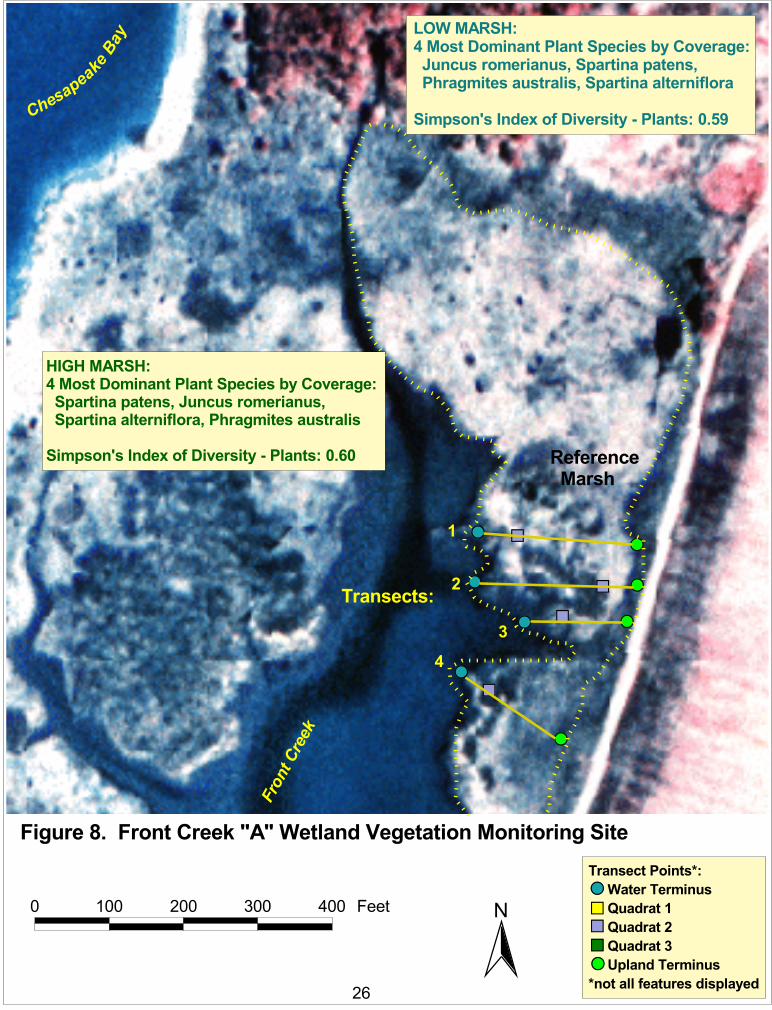
Figure 8. Front Creek “A” Wetland Vegetation Monitoring Site 26
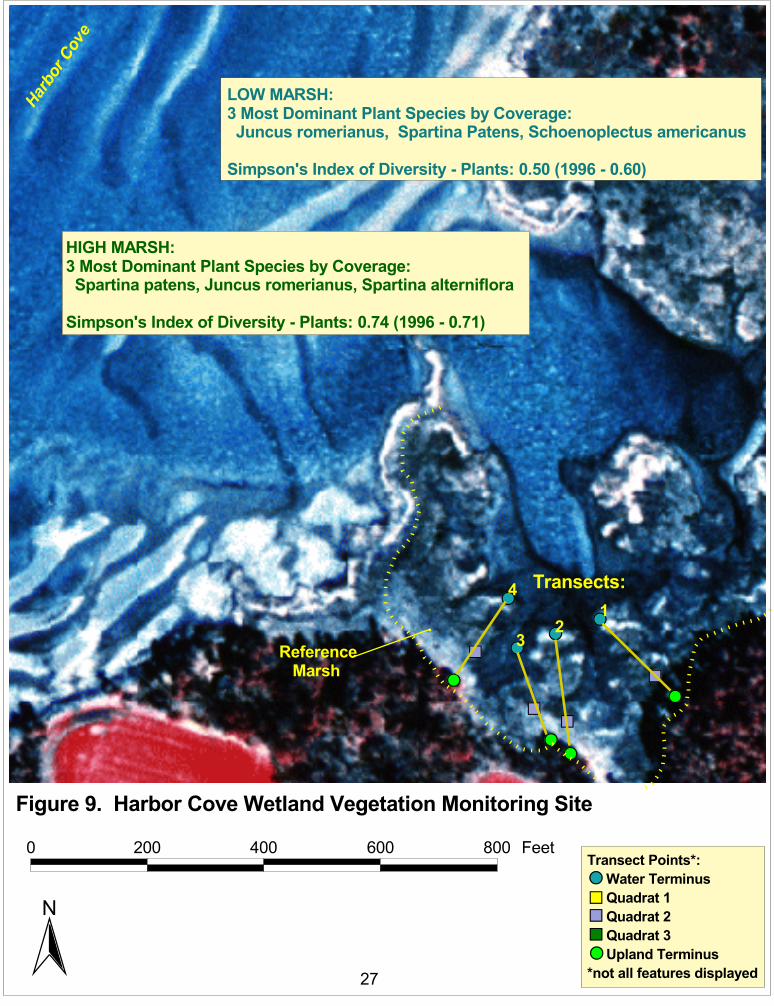
Figure 9. Harbor Cove Wetland Vegetation Mon itoring Site 27
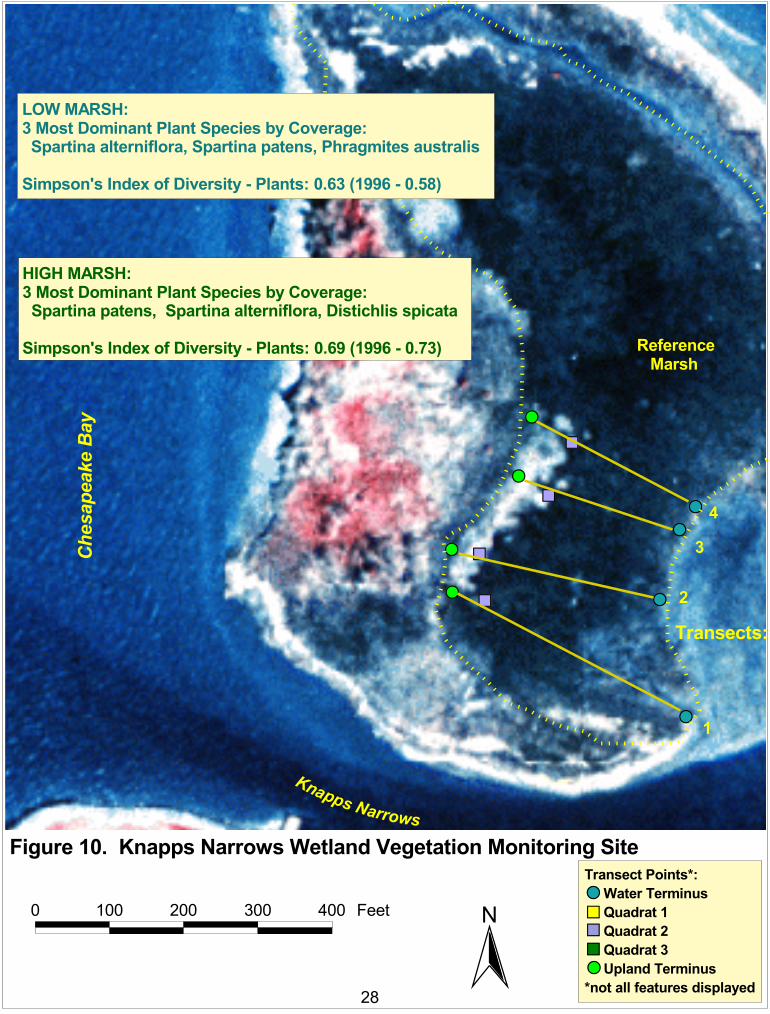
Figure 10. Knapps Narrows Wetland Vegetation M onitoring Site 28
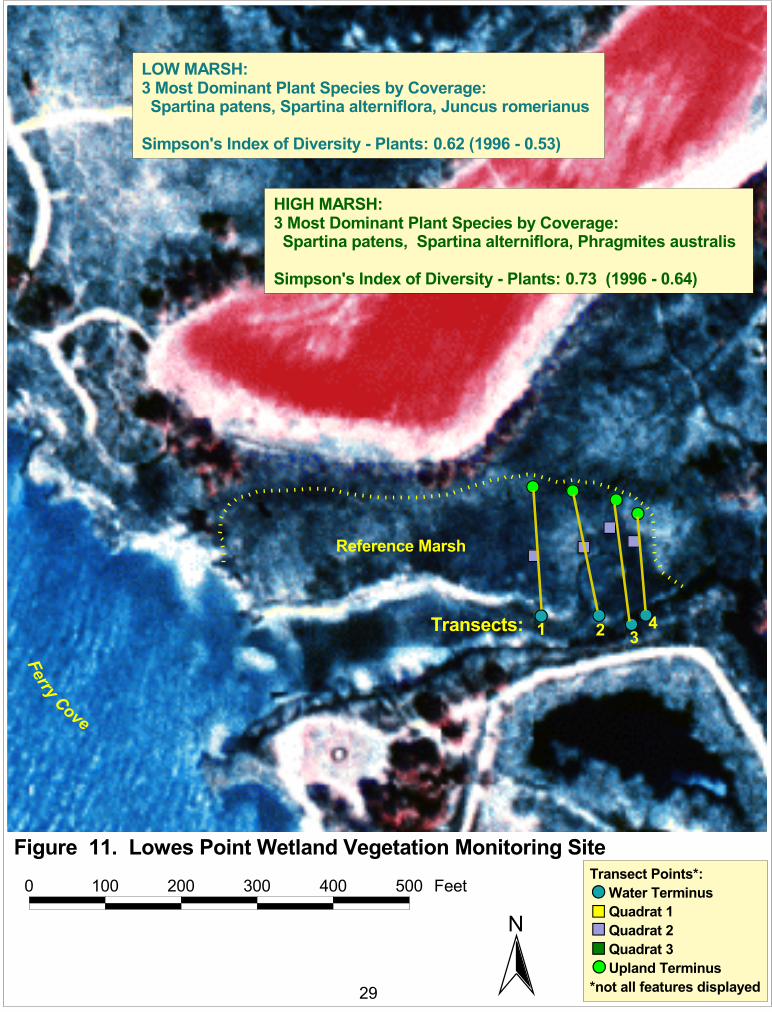
Figure 11. Lowes Point Wetland Vegetation Monitoring Site 29
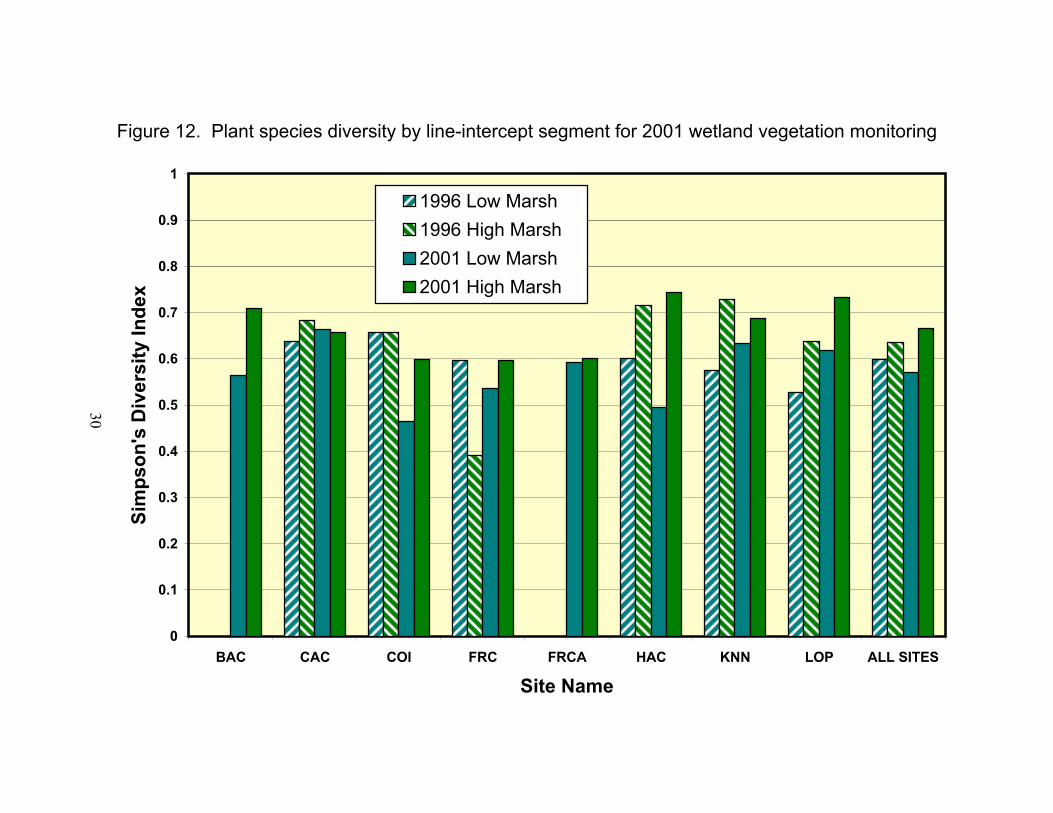
Figure 12. Plant species diversity by line-intercept segment for 2001 30
wetland vegetation monitoring
Figure 13. Faunal taxa frequency for 2001 wetland vegetation
monitoring 31
iv
LIST OF APPENDICES:
Appendix A. GPS coordinates of transect locations for 2001 Vegetation Monitoring
Appendix B. Photomonitoring log
Appendix C. Vegetation Data: Raw percent cover and vegetation community composition data
Appendix D. Statistics output: Percent cover, stem heights, diversity
Appendix E. Faunal/Quadrat Data: Raw faunal community diversity data
Appendix F. List of plant species observed during 2001 wetland vegetation monitoring

v
ACKNOWLEDGMENTS
This monitoring study was funded by the U.S. Army Corps of Engineers, Baltimore District.
Several U.S. Fish and Wildlife Service personnel assisted with this study. Chris Dobony, Paige
Doelling-Brown, John Gill, Peter McGowan, Kathy Reshetiloff and Susan Talbott assisted with
field work during July and September of 2001. Leslie Gerlich provided GIS support. We also
thank the Maryland Environmental Service for providing digital images of Poplar Island used in
this report.
vi
EXECUTIVE SUMMARY
The objectives of the Poplar Island restoration project in Chesapeake Bay are to create wetland
and uplan d island hab itats by restoring the eroded island with dredged m aterial from Baltimore’s
shipping-channel comp lex. Project planners anticipate creating approximately 550 acres of
saltmarsh within the historic island footp rint. Evaluations of wetland creation success may differ
depending upon the evaluation criteria used. For this project, it was concluded that data
collections must consider both the structure and fun ction of representative na tural wetlands when
comparing the Poplar Island constructed wetlands with natural ecosystems. The vegetation data
presented herein represen ts one of the wetland criteria identified as part of a m ultifaceted
monitoring program designed to assess an array of wetland and habitat func tions. The U.S. Fish
and Wildlife Service bega n monitoring severa l reference marshes in the Poplar Island complex
and along the Eastern Shore of the Chesapeake Bay in September of 1996. That monitoring study
was intended to establish a body of local saltmarsh vegetation information to be used in evaluation
of the future wetlands created on a restored Poplar Island. The 2001 iteration was intended to
further define and update the baseline reference marsh conditions while comparing to those
described by the 1996 study. Using a system of fixed transec ts, eight reference marshes were
sampled in Au gust 2001 . From the data gathered, indices desc ribing vegetative cover, stem
height variation, and plant species diversity were calculated to illustrate vegetation patterns
apparent in the local saltmarsh com munities.
As expected, there were differences in vegetation parameters between low marsh and high marsh
zones of our reference sites. Among our results from the 2001 sampling episode, we found that
saltmarsh cordgrass (Spartina alterniflora ) was the dominant plant spec ies in the low marsh zone,
with sa ltmeadow hay (Spartina patens) a secondary dominant species. Within the high marsh
zone, S. patens was the overwhelming dominant species, but common reed (Phragmites
australis), saltgrass (Distichlis spicata), S. alterniflora, and high tide bush (Iva frutescens) were
also important community components. We also found that the plant commu nity in the high
marsh zone had greater diversity than in the low marsh zone. Stem heights varied from site-to-
site for most species analyzed. The information yielded represents a furtherance of understanding
of naturally-occurring wetland systems in the vicinity of Poplar Island that will be valuable in
mid-course corrections and evaluations necessary for the success of the restoration project.
Additional information could facilitate the application of this information in adaptive
managem ent of constructed wetlands on Poplar Island and in design prescription of future
projects. Linking the detailed vegetation community information directly to elevational
positioning in the m arsh landscape wou ld create a more intuit ively-app licable , visua lly-accessible
representation of local saltmarsh vegetation. Establishing connections between vegetation
comm unity va riation and m arsh elevations would make moni toring s tudy produc ts more readily
applicable to design and mid-course correction guidance. Future monitoring should include
microtopographical elevation determinations.
1
INTRODUCTION
The Poplar Island restoration project, located in Chesapeake Bay off Tilghman Island in Talbot
County, Maryland (Figure 1), was undertaken as a cooperative solution addressing the problems
of dredged material disposal and island erosion. Records from the 1670's describe Poplar Island
as 1,400 acres in size, though it may have once covered 2,000 acres. By the 1990's less than10
acres of disjunct remnants remained of Poplar Island itself (Leatherman et al. 1995), with less
than 125 acres remaining of the island complex that includes Poplar, Coaches and Jefferson
Islands. The restoration project is using dredged material from the Baltimore shipping ch annel
complex to reestablish an approximately 1,100-acre island within the historic footprint of Poplar
Island. Fifty percent of the reestablished island will be constructed at elevations suitable for the
creation of wetlands. In order to make appropriate design and m anagement prescriptions for these
created wetlands, it was necessary to develop a body of structure and function information for
local, representative wetlands.
The U.S. Fish and Wildlife Service (Service) participates in an interagency Poplar Island
monitoring task force. In addition to the wetland monitoring desc ribed in this report, submerged
aquatic vegetation is being monitored by the Service, wildlife usage by the U.S. Geological
Survey, and fisheries usage by the National Marine Fisheries Service. Together, these multi-year
efforts will enable Federal and State agencies to guide and judge the success of restoration
measures at Poplar Island.
In September of 1996, the Service began monitoring saltmarsh vegetation in the remnant marshes
of Poplar Island, Coaches Island and in marshes on the mainland north of Tilghman Island. The
objectives of this initial sam pling were to estimate baseline marsh com munity structu re
information such as plant cover dominance, diversity, and above ground biom ass. The objectives
of the 2001 monitoring episode were to update this baseline information while allowing
interannual comparison by replicating the 1996 effort. Ultimately, the reference marsh
information will be compared to the conditions in the newly-created Poplar Island saltmarshes to
test for differences in community structure parameters as a measure of wetland creation success
and s tability.
The wetlands being sampled in this monitoring study include the following types from the U.S.
Fish and Wild life Service’s classification system (C owardin, et al. 1979):
Estuarine, Intertidal, Emergent, Narrow-leaved Persistent, Regularly Tidal
Estuarine, Intertidal, Emergent, Narrow-leaved Persistent, Irregularly Tidal
Estuarine, Intertidal, Beach/Bar, Regularly Tidal
These communities are characterized by species such as sm ooth cordgrass (Spartina alterniflora ),
saltmeadow hay (Spartina patens), salt grass (Distichlis spicata), black needlerush (Juncus
romerianus), and threesqua re (Schoenoplectus americanus), with lesser amounts of high tide bush
(Iva frutescens) and common reed (Phragmites australis). Mean tida l range within the stud y area
is 0.5 meters, with salinity ranges from a minimum of approximately 5ppt in Spring to 18ppt in
2
Autumn. Throughout this report, comparisons will be made between low marsh com munity
parameters and high marsh community parameters. These two zones are typical of Chesapeake
Bay salt marshes. Low marsh refers to the zone inundated twice daily by the lunar tidal cycle and
high marsh refers to the zone inundated on a less regular and frequent basis (Gill and McGowan
1998).
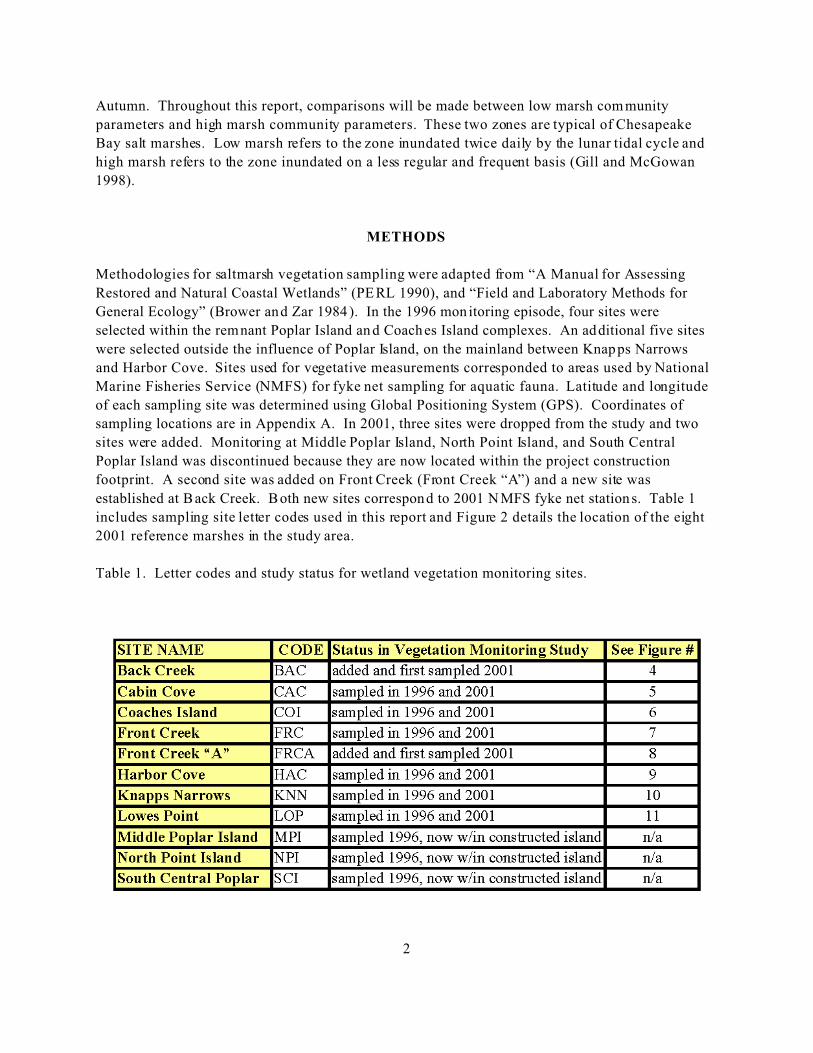
METHODS
Methodologies for saltmarsh vegetation sampling were adapted from “A Manual for Assessing
Restored and Natural Coastal Wetlands” (PERL 1990), and “Field and Laboratory Methods for
General Ecology” (Brower and Zar 1984 ). In the 1996 mon itoring episode, four sites were
selected within the remnant Poplar Island an d Coaches Island complexes. An additional five sites
were selected outside the influence of Poplar Island, on the mainland between Knapps Narrows
and Harbor Cove. Sites used for vegetative measurements corresponded to areas used by National
Marine Fisheries Service (NMFS) for fyke net sampling for aquatic fauna. Latitude and longitude
of each sampling site was determined using Global Positioning System (GPS). Coordinates of
sampling locations are in Appendix A. In 2001, three sites were dropped from the study and two
sites were added. Monitoring at Middle Poplar Island, North Point Island, and South Central
Poplar Island was discontinued because they are now located within the project construction
footprint. A second site was added on Front Creek (Front Creek “A”) and a new site was
established at B ack Creek. B oth new sites correspond to 2001 N MFS fyke net station s. Table 1
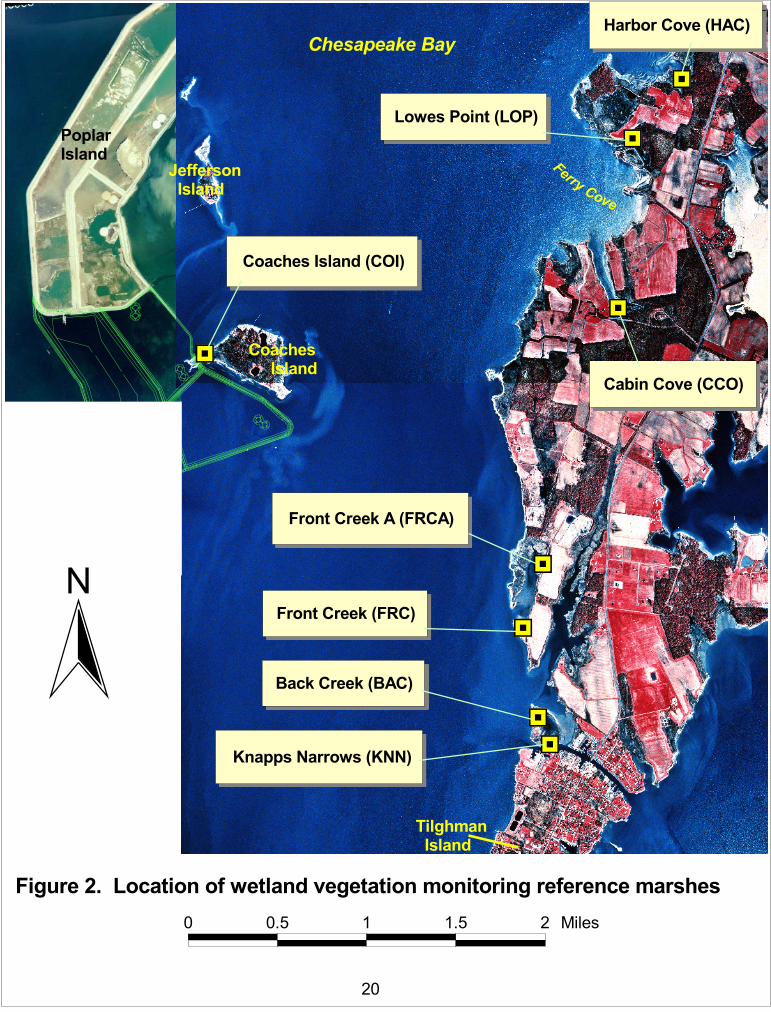
includes sampling site letter codes used in this report and Figure 2 details the location of the eight
2001 reference marshes in the study area.
Table 1. Letter codes and study status for wetland vegetation monitoring sites.
3
The six 1996 reference sites re-sampled in 2001 were located using GPS and reestablished as
necessary using PV C poles in prepa ration for the 2001 monitoring episode. The two new sites
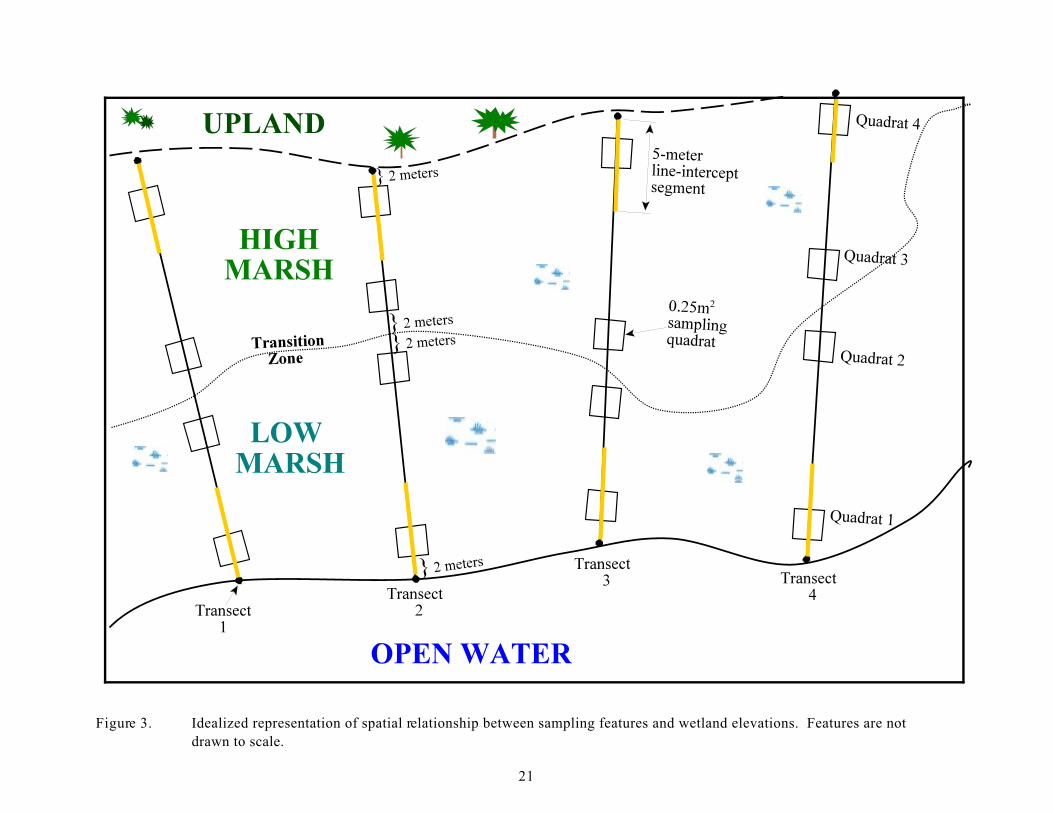
were arranged identically to the 1996 sites. At each site, four variable-length perma nently-marked
transects were established perpendicular to the shoreline, stretching from the water’s edge to the
upland edge of the marsh. Two central transects at each site corresponded to National Marine
Fisheries Service fyke net stations, with the two remaining transects located from 2 to 10m on
either side of the central transects. Transects were numbered left to right, 1 through 4, looking
from the water into the marsh interior. (See Figure 3 for a representative schematic diagram of
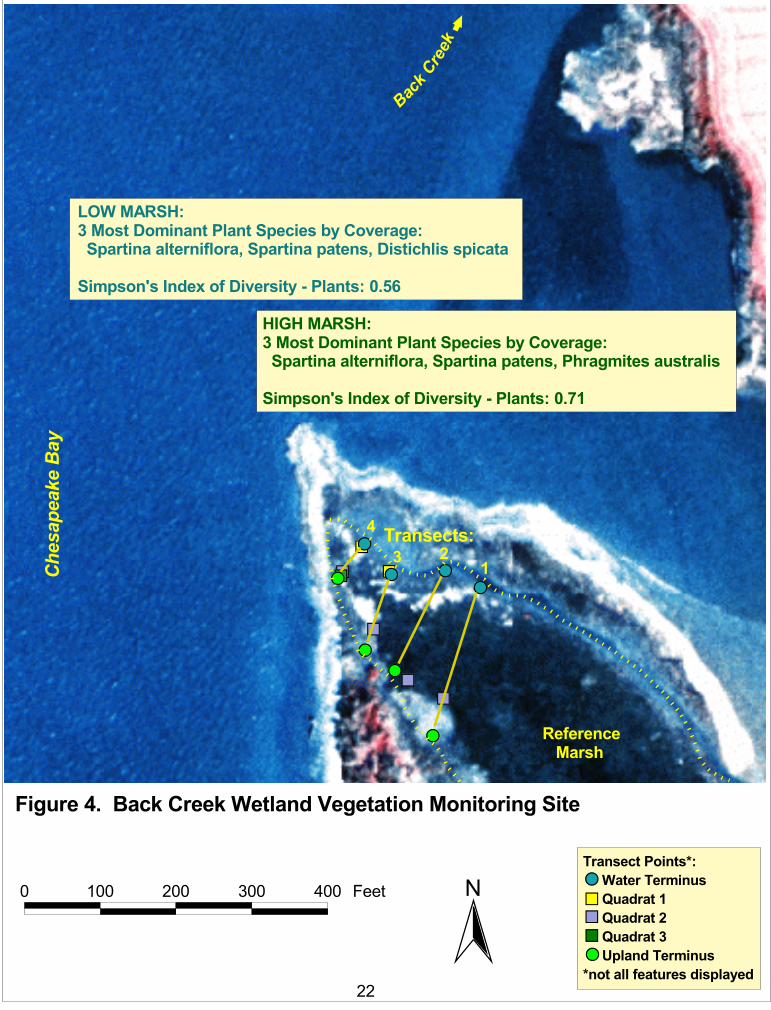
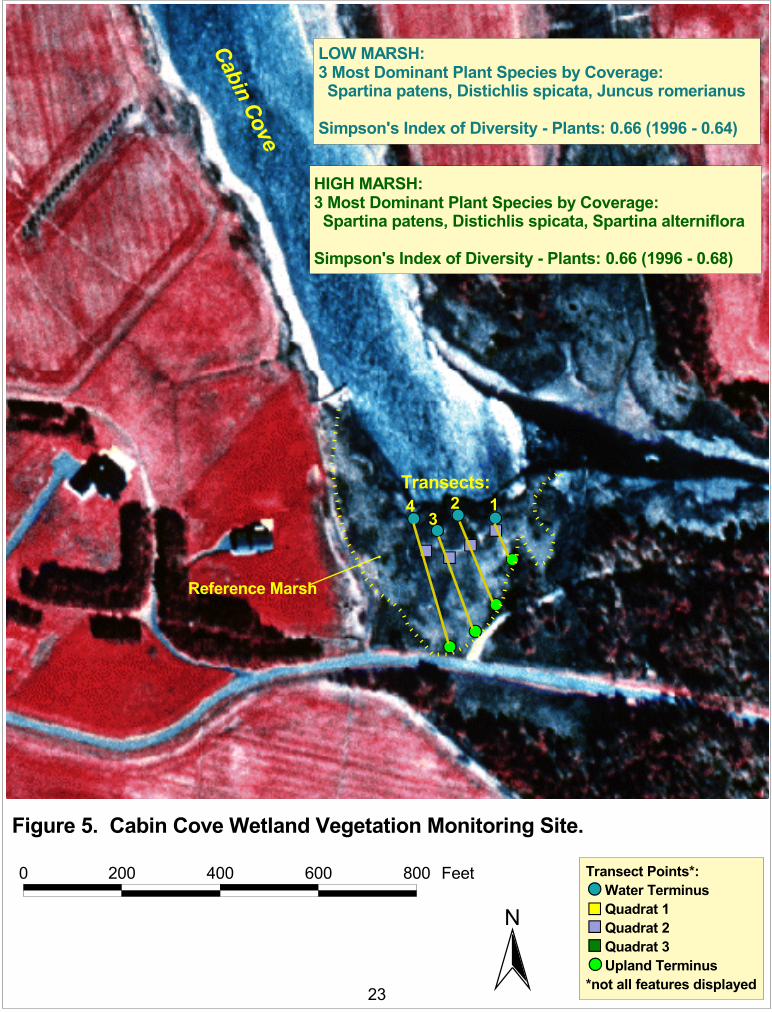
the transect layout used at each reference marsh). Figures 4 through 11 illustrate partial layouts of
transects overlaid on maps of individual reference marshes.
Along each of the four transects, four, 0.25 m² quadrats were used to measure areal coverage and
stem height of each plant species present (Figure 3). Quadrats were positioned at 2m from the
water’s edge (Quadrat 1), 2m channelward of the low/high marsh edge (Qu adrat 2), 2m landward
of the low/high marsh edge (Quadrat 3 ), and 2m channelward of the upland edge (Quadrat 4).
Again , low marsh was defined as predominantly S. alterniflora with twice daily innundation by
the diurnal tida l cycle. High marsh was represented by less regular innundation an d plant species
such as S. patens and D. spicata. Given the micro-topography of many sampling locations, the
demarcation between high and low marsh was often subtle. In such cases, wrack lines or other
non-dominant species were used for marsh transition delineation and quadrat placement purposes.
Areal cover is an indicator of species dominance in the vegetative community. The 0.25m²
quadrats were further divided into 0.01m² subsections. The number of 0.01m² subsections
containing an originating stem was recorded for each species within each quadrat. The areal
cover was then expressed as the percentage of 0 .01m² subsections conta ining each sp ecies.
Relative areal cover of each species was expressed as the proportion of its areal cover to the total
areal cover of all plants in the quadrat.
For the purposes of this monitoring study, stem height can serve as an indicator of the differential
productivity of different wetland sites and potentially, differential success of individual species on
dredged-material growing substrates vs. local marsh soils. To determine average stem height, five
stems for each species found in the 0.25 m² quadrats were measured. Stems were selected from
the center and each of the four corners of the quadrat.
Cover-segment line-intercept records were made to determine plant community composition. For
each transect, a 5 m segment was measured starting at each endpoint (water’s edge and upland)
and extending into the marsh’s interior (Figure 3). The segment beginning at the upland terminus
of each transect was used for high marsh composition determination with the waterward segment
used for low marsh composition determination. Presence of all plant species was recorded at 50
one-decimeter intervals along each 5m segment and totaled. From this species composition and
frequency information, Simpson’s Index of Diversity was calculated for each 5m segment
sampled. The diversity index is an expression of the number of times pairs of
individual plants would have to be taken at random from the entire plant community sampled to
4
find two of the same species, and is calculated as follows:
Ds = 1 - [�ni(ni - 1) / N(N -1)]
where niis the abundance of each species and N is the total abundance of all species recorded .
Diversity increases as Simpson’s Index approaches 1.0.
In addition to vegetation sampling, all invertebrates encountered within the areal cover quadrats
were recorded. Counts encompassed the total number of each faunal taxa within the 0.25m²
quadrat, as well as additional observations of invertebrate and vertebrate sign, including scat,
tracks, burrows, etc. Faunal data were collected to enable a general assessment of the dominant
invertebrate taxa present in the reference marshes.
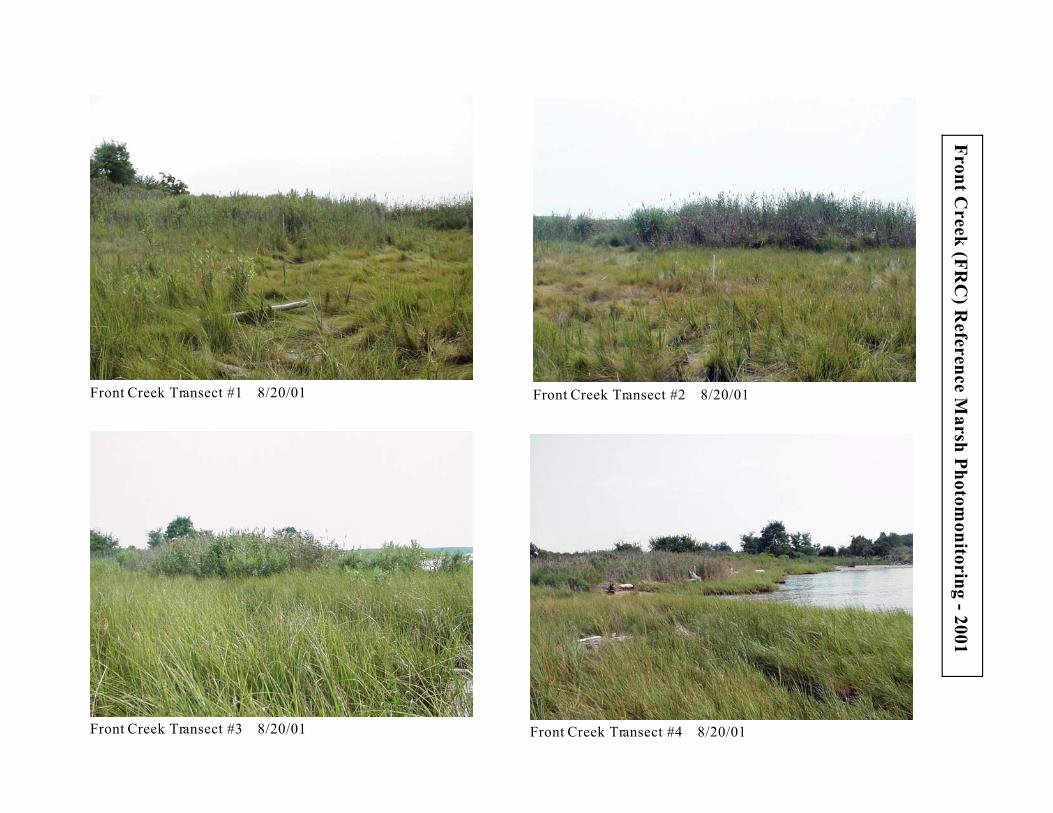
A photomonitoring record of site conditions was mad e at each transec t of all reference marshes.
A digital photo was taken while standing at the water terminus of each transect and focusing the
camera along the transect axis toward the uplan d terminus. Future photomonitoring itera tions will
be conducted using the sam e positioning. At transects with a narrow band of taller vegetation
near the water’s edge tha t would otherwise obscu re views of the reference marsh, ph otos were
taken from just inside the taller vegetation. Comparing the photomonitoring record from different
sampling years will provide a qualitative gauge of stability or change in site conditions,
illustrating coarse-scale successional chan ges. Appendix B contains the photomonitoring record
for 2001.
Data Analysis
Wetland vegetation data for each sampling location were entered into Excel computer data files.
Analyses of all data was performed using SigmaStat statistical com puter software (Jandel 1997).
For each sampling location, data was analyzed for the following vegetation parameters: areal
cover, relative cover, canopy height, and Simpson’s Index of Diversity. Using these parameters,
reference marshes were com pared within respective low marsh and high marsh zones and between
sampling years. Within this framework, our analyses followed a general sequence of a One-Way
Analysis of Variance followed by a mult iple com parison test. When data was normally
distrib uted, a standard ANOVA was used to detect differences and a Tukey parametric multiple
comparison procedure was used to illustrate those differences between sites or other groupings.
When data d id not meet the assumptions of a norma l distribution , a non-parametric Kruskal-
Wallis One-Way Analysis of Variance followed by a S tuden t-Newm an-Keu ls or Dunn’s mu ltiple
comparison procedure was used. The Student-Newman-Keuls and Dunn’s tests are non-
parametric analogs of the Tukey test and determine which pairs of ranked medians are
significantly different from one another. The Dunn’s test is approp riate for comparisons in cases
with different samp le sizes.

5
RESULTS
Wetland vegetation sampling at reference marshes was conducted over a nine-day period in mid-
August 2001. The 1996 baseline sampling episode occurred in late September. During the 2001
monitoring period, the main objectives were to update baseline wetland vegetation community
parameters while replicating the 1996 sampling effort for the purpose of interannual comparisons.
Data analysis will be discussed within the framework of three categories of community indices:
percen t cover, s tem he ight, and species d iversity. R aw data is presented in Appendix C and all
SigmaStat statistical runs are presented in Appendix D.
Percent Cover
Percent vegetative areal cover information was calculated from data collected using the arrays of
0.25m2 quadrats as described in the Methods section. For each quadrat, the percentage of the
quadrat area covered by a given species was defined as the number of 0.01m2 quadrat subsections
occupied by a stem of that species divided by a total of 25 subsections. Data were pooled to yield
transect averages, site averages, or aggregate percent cover estimations for low marsh and high
marsh zones among all reference marshes. Data from quadrats num ber 1 and 2 were combined
for low marsh cover estimates. Data from quadrats number 3 and 4 were combined for high
marsh cover estimates.
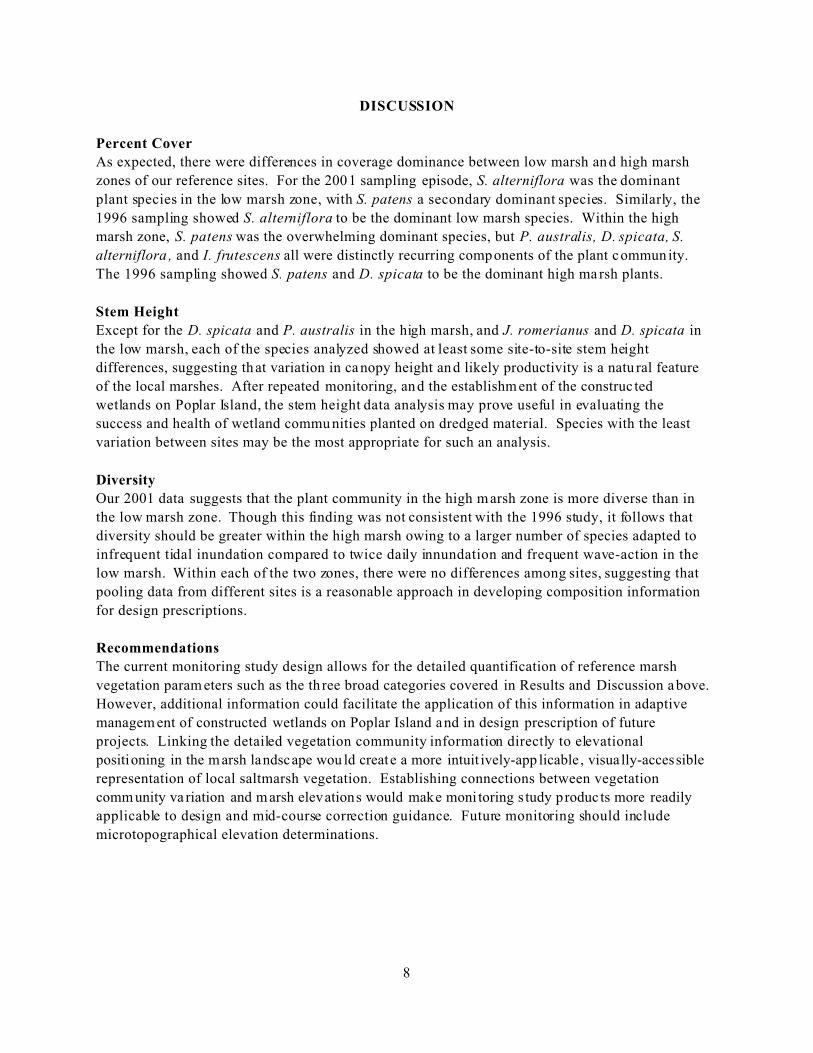
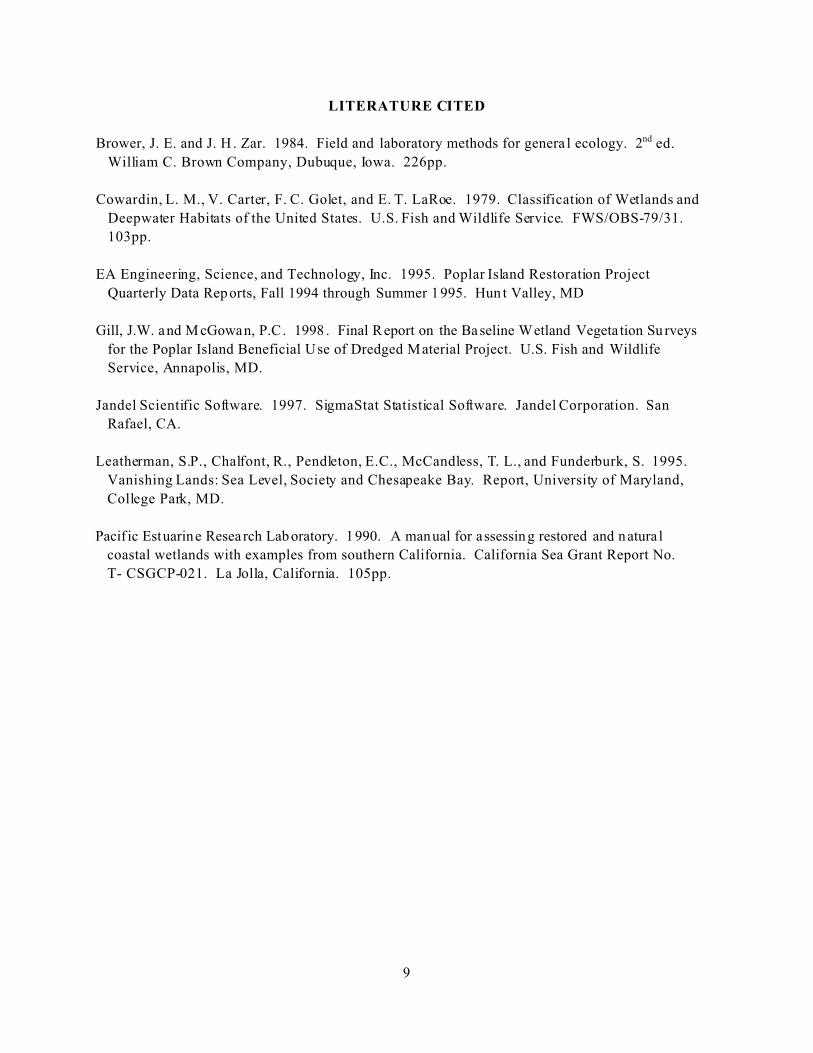
Table 2 contains percent areal cover by each plant species calculated for low marsh and high
marsh locations within each site. Table 3 contains the same information, recalculated to percent
relative areal cover, i.e. coverages within a given combination sum to 100%.
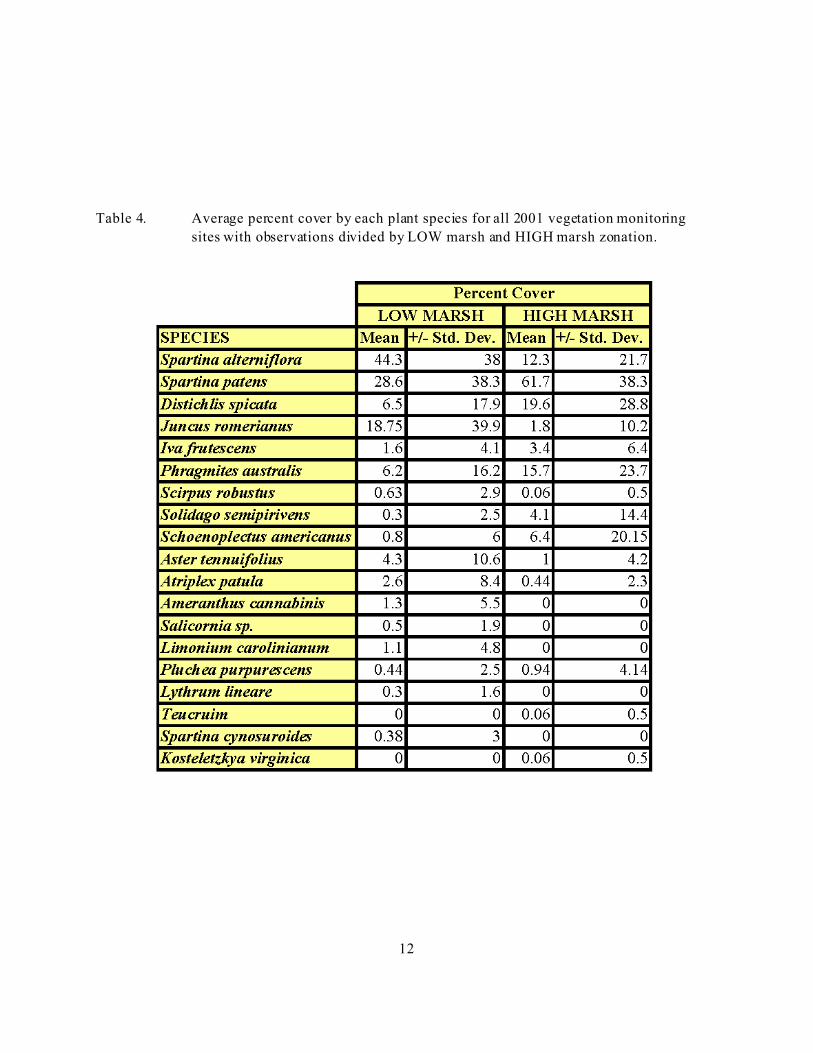
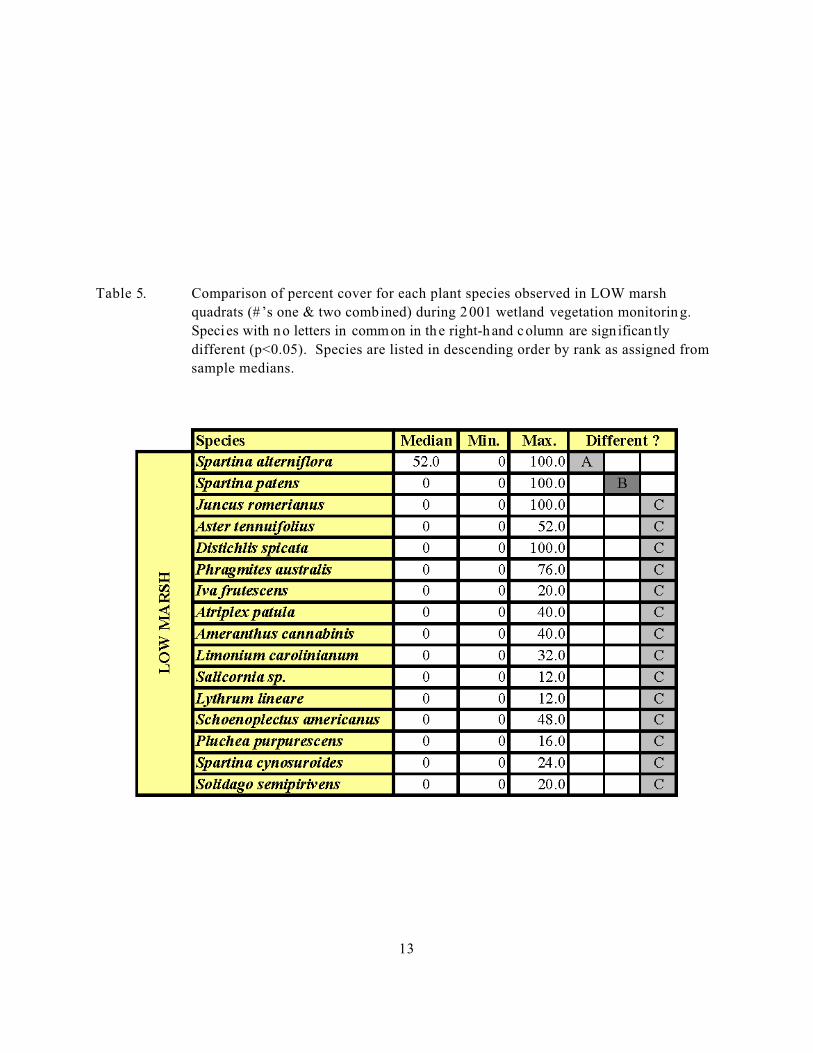
Percen t coverages were calcula ted for each species from com bined low marsh data from a ll
reference sites. The average cover by S. alterniflora (44.3%), S. patens (28.6%), and J.
romerianus (18.8%) showed these to be the three dominant low marsh species by percent cover
(Table 4). Prior to analysis, we performed an arcsine transformation function on the percentage
data in an attempt to normalize the distribution. The transformed data still did not meet the
assumptions of a normal distribution, so we proceeded with a non-pa rametric Kruskal-Wallis
One-Way Analys is of Variance on Ra nks followed by a Student-Newman-Keuls multiple
comparison test to determine if the apparent dominance relationsh ips were statistically significan t.
In this case, the Student-Newman-Keuls multiple comparison procedure was used to determine
which pairs of ranks (derived from each species’ median rating) were significantly different from
one another. The dominance by percent cover of S. alterniflora in the low marsh zone was
statistically significant (p<0.05), with the secondary dominance of S. patens also sta tistica lly
significant. There were no statistically significant percent cover differences between any of the
other species observed. Table 5 details the differences in percent cover ranks by species in the
low marsh zone.
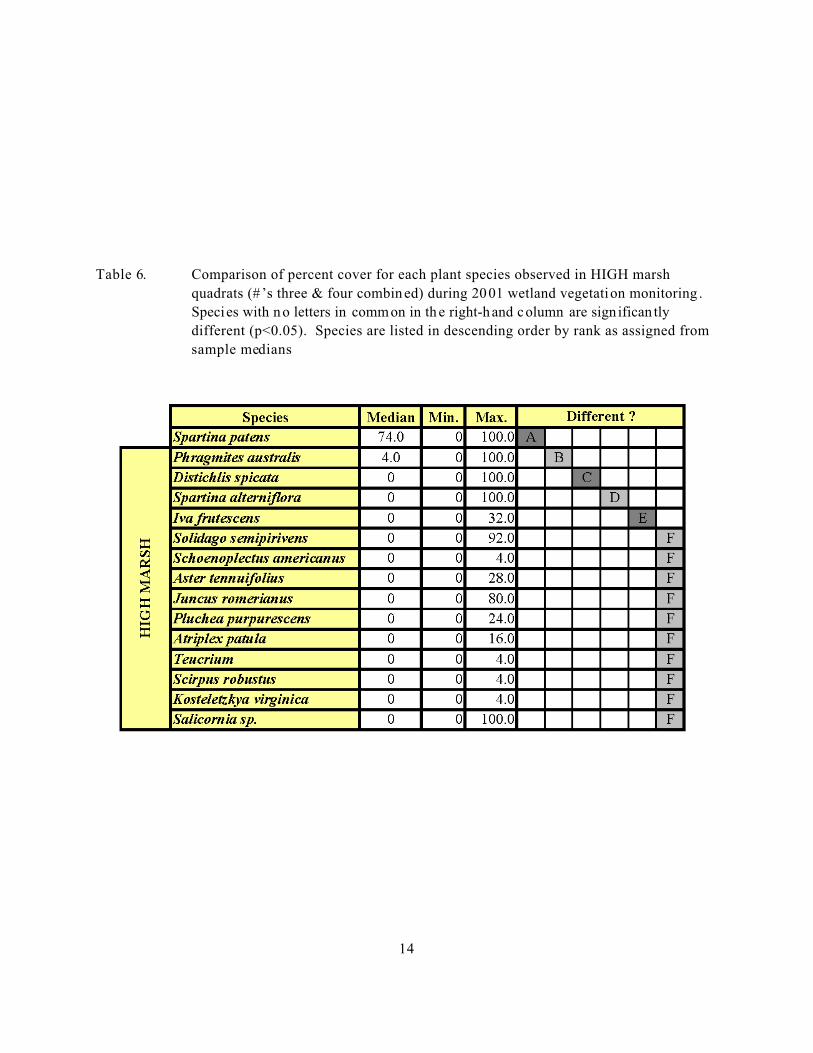
In the combined-sites high marsh zone, S. patens (61.7%), D. spicata (19.6%), and P. australis
(15.7%) had the three highest average percent coverages. Using the same method a s with low
marsh coverages, the dominance hierarchy of high marsh species was tested. By assigned rank,
and in order, the perc ent cover by the fo llowing sp ecies were statis tically di stinc t (p<0 .05): S.
6
patens, P . australis, D. sp icata, S. alte rniflora, and I. frutescens. All other species had
statistically similar percent cover (Table 6).
Stem Height
From the stem height data collected by measuring the height (in cm) of 5 representative stems of
each species observed in each sampling quadrat, we calculated average stem height values for
each species for the low an d high marsh zones of each site (Tab le 7).
For analysis of stem height data we chose the 5 species with the greatest percent cover (from
Table 4 ) in both low and high marsh zones. For the low marsh zone those species were: S.
alterniflora , S. patens, J. romerianus, D. spicata, and P. australis. For the high marsh zone the 5
species were: S. patens, D . spicata, P. australis, S. alterniflora, and S. americanus. To determine
if a given species had significantly shorter or taller stem heights in different reference marshes,
within the respective high or low marsh zones, we again used a One-Way Analysis of Variance
followed by a multiple comparison test. When stem height data d id not meet the assumptions of a
normal distribution, a non-parametric Kruskal-Wallis One-Way Analysis of Variance followed by
a Dunn’s mu ltiple com parison procedure was used. As with the Studen t-Newm an-Keu ls multiple
comparison procedure, Dunn’s test determines which pairs of ranks are significantly different
from one another, but is appropriate for comparisons with different samp le sizes. When stem
height data was normally distributed, as in the case of D. spicata in the low marsh and S. patens,
S. alterniflora, and S. americanus in the high marsh, a Tukey parametric multiple comparison
procedure was used to compare samp le means between all sites.
Within the low marsh, S. alterniflora was significantly (p<0.05) shorter (median 53.5 cm) at
Cabin Cove than at Lowes Point (median 73.0 cm), Front Creek “A” (median 74.0 cm), and
Knapps Narrows (median 7 0.0). S. patens was significantly (p<0.05) taller at Lowes Point
(median 56.0 cm) than at Back Creek (median 36.0 cm ). There were no other differences
between sites for S. patens. There were no significan t differences between sites for J. romerianus
or D. spicata stem heights in the low marsh. For P. australis, stem heights were sign ifican tly
(p<0.05) taller at Coaches Island than at Front Creek, but were similar between all other sites.
Within the h igh marsh, S. patens had significantly different (p<0.05) stem heights at several
reference marshes. Stem heights for this species were h ighest at Harbor C ove and Lowes Point.
See Table 8 for a full description of height differences for S. patens. There were no significant
differences between sites for D. spicata or P. australis stem heights in the high marsh. S.
alterniflora was significan tly (p<0.05) taller (mean 79.2 cm) at Harbor Cove than at either
Knapps Narrows (mean 51.9 cm) or Back Creek (mean 61.6 cm). Also, the same species had
significantly (p<0.05) greater stem heights at Lowes Point (mean 69.9 cm) and Front Creek (mean
66.2 cm) than at Knapps Narrows (mean 51.9 cm). Finally, for S. america nus, there were no
significant high marsh stem height differences between sites.
When considering differences between species, P. australis was the species with the highest
median stem heights at all eight sites in the h igh marsh zone, as expected. In the low marsh th ere
was more variation, with S. alterniflora, P. austra lis, and J. romerianus frequently exhibiting the
greatest stem heights. The stem height observations should be interpreted with caution, as the
7
combina tion with a given species’ level of coverage dominance may more acc urately illustrate a
species’ influence on marsh structu re than stem heigh t information alone.
Diversity
Plant species diversity was calculated from species occurrence data collected along two line-
intercept segmen ts per transect. Within each segment, Simpson’s Diversity Indices were
calculated according to the desc ription in the M ethods section. These indices were then combined
for estimates of low marsh and high marsh diversity. Observation s from the four waterward
segments per site were pooled for estimates of low marsh zone diversity, while observations from
the four landward segments per site were pooled for estimates of high marsh zone diversity. The
resulting diversity indices are presented in Table 9 and Figure 12. A Kruskal-Wallis one-way
analysis of variance on ranks was used to detect differences am ong low marsh diversity indices
for all sites as sampled in 2001. There were no significant differences (p=0.785), indicating that
the low marsh portions of each site had similar plant community diversity in 2001. As in the low
marsh, there were no significant differences (p=0.237) in diversity among high marsh sites in
2001. We then compared the combined all-sites low marsh zone d iversity indices to the combined
all-sites high marsh zone diversity indices. The high marsh zone (median 0.69) had a
significantly (p<0.05) higher level of plant diversity than the low marsh zone (median 0.59) in
2001. This comparison was made using the Student-Newman-Keuls method.
Before comparing 2001 p lant diversity levels to those estimated in 1996, we tested for differenc es
within the 1996 sites respective low and high marsh zones. There were no significan t differences
in plant diversity among 1996 low marsh sites (p=0 .822) or amon g 1996 high marsh sites
(p=0.149). Also, combined low marsh diversity was similar (p=0.061) to combined high marsh
diversity in 1996.
In comparing 2001 diversity levels to 1996 indices, we first compared low marsh and high marsh
zones within each sampling site. There were no significant interannual differences in any of the
comparisons made for the six sites in common between the two sampling episodes. Finally, we
compared the combined all-sites low marsh zone and combined all-sites high marsh zone diversity
indices from 2001 to their 1996 counterparts using Dunn’s method. There were no significant
differences.
Faunal D ata
As described in the Methods, we recorded the abund ance of each faunal taxa observed within
each sampling quad rat. Detailed statistical analyses were not conducted for these data, but taxa
abundance by low and h igh marsh zones is displayed in Tab le 10 and illustrated in Figure 13.
Raw observations are presented in Appendix E. Two molluscs composed the overwhelming
majority of invertebrate observations. In the low marsh, there were similar numbers of marsh
periwinkles (genus Littorina) and salt marsh snails (genus Melampus). In the high marsh,
Melampus was by far the most nu merous faunal taxon in our study, with over 1,000 observa tions.
A list of all plant species observed during the 2001 sam pling is in Appendix F.
8
DISCUSSION
Percent Cover
As expected, there were differences in coverage dominance between low marsh and high marsh
zones of our reference sites. For the 2001 sampling episode, S. alterniflora was the dominant
plant species in the low marsh zone, with S. patens a secondary dominant species. Similarly, the
1996 sampling showed S. alterniflora to be the dominant low marsh species. Within the high
marsh zone, S. patens was the overwhelming dominant species, but P. australis, D. spicata, S.
alterniflora , and I. frutescens all were distinctly recurring components of the plant commun ity.
The 1996 sampling showed S. patens and D. spicata to be the dominant high ma rsh plants.
Stem Height
Except for the D. spicata and P. australis in the high marsh, and J. romerianus and D. spicata in
the low marsh, each of the species analyzed showed at least some site-to-site stem height
differences, suggesting that variation in ca nopy height and likely productivity is a natu ral feature
of the local marshes. After repeated monitoring, and the establishm ent of the construc ted
wetlands on Poplar Island, the stem height data analysis may prove useful in evaluating the
success and health of wetland commu nities planted on dredged material. Species with the least
variation between sites may be the most appropriate for such an analysis.
Diversity
Our 2001 data suggests that the plant community in the high marsh zone is more diverse than in
the low marsh zone. Though this finding was not consistent with the 1996 study, it follows that
diversity should be greater within the high marsh owing to a larger number of species adapted to
infrequent tidal inundation compared to twice daily innundation and frequent wave-action in the
low marsh. Within each of the two zones, there were no differences among sites, suggesting that
pooling data from different sites is a reasonable approach in developing composition information
for design prescriptions.
Recommendations
The current monitoring study design allows for the detailed quantification of reference marsh
vegetation param eters such as the th ree broad categories covered in Results and Discussion above.
However, additional information could facilitate the application of this information in adaptive
managem ent of constructed wetlands on Poplar Island and in design prescription of future
projects. Linking the detailed vegetation community information directly to elevational
positioning in the m arsh landscape wou ld create a more intuit ively-app licable , visua lly-accessible
representation of local saltmarsh vegetation. Establishing connections between vegetation
comm unity va riation and m arsh elevations would make moni toring s tudy produc ts more readily
applicable to design and mid-course correction guidance. Future monitoring should include
microtopographical elevation determinations.
9
LITERATURE CITED
Brower, J. E. and J. H . Zar. 1984. Field and laboratory methods for genera l ecology. 2nd ed.
William C. Brown Company, Dubuque, Iowa. 226pp.
Cowardin, L. M., V. Carter, F. C. Golet, and E. T. LaRoe. 1979. Classification of Wetlands and
Deepwater Habitats of the United States. U.S. Fish and Wildlife Service. FWS/OBS-79/31.
103pp.
EA Engineering, Science, and Technology, Inc. 1995. Poplar Island Restoration Project
Quarterly Data Reports, Fall 1994 through Summer 1995. Hun t Valley, MD
Gill, J.W. and M cGowan, P.C. 1998 . Final Report on the Baseline Wetland Vegeta tion Su rveys
for the Poplar Island Beneficial Use of Dredged Material Project. U.S. Fish and Wildlife
Service, Annapolis, MD.
Jandel Scientific Software. 1997. SigmaStat Statistical Software. Jandel Corporation. San
Rafael, CA.
Leatherman, S.P., Chalfont, R., Pendleton, E.C., McCandless, T. L., and Funderburk, S. 1995.
Vanishing Lands: Sea Level, Society and Chesapeake Bay. Report, University of Maryland,
College Park, MD.
Pacif ic Estuarine Resea rch Lab oratory. 1990. A manual for assessing restored and natura l
coastal wetlands with examples from southern California. California Sea Grant Report No.
T- CSGCP-021. La Jolla, California. 105pp.
Table 2. Vegetative Areal Cover by site and low marsh / high marsh zones
SITE
NAME
Am
era
nth
us
can
na
bin
is
Ast
er t
enn
uif
oli
us
Atr
iple
x p
atu
la
Dis
tich
lis
spic
ata
Iva
fru
tesc
ens
Ju
ncu
s ro
meri
an
us
Ko
stele
tzk
ya
vir
gin
ica
Lim
on
ium
ca
roli
nia
nu
m
Lyt
hru
m l
inea
re
Ph
rag
mit
es
au
stra
lis
Plu
chea
pu
rpu
resc
ens
Sp
art
ina
alt
ern
iflo
ra
Sp
art
ina
cyn
osu
roid
es
Sp
art
ina
pa
ten
s
Sa
lico
rnia
sp
.
Sch
oen
op
lect
us
am
eric
an
us
Scir
pu
s ro
bu
stu
s
Scir
pu
s va
lid
us
So
lid
ag
o s
em
ipir
iven
s
Teu
criu
m c
an
ad
ense
Tota
ls
LOW 7.0 1.0 9.5 19.5 3.5 8.0 42.0 31.5 0.5 0.5 123.0
HIGH 1.0 5.5 2.5 2.0 7.0 60.5 36.0 114.5
SITE 5.8 3.5 8.4 14.6 3.6 9.5 61.8 41.6 148.8
LOW 3.0 0.5 35.5 8.5 15.0 2.0 1.5 3.0 10.5 52.0 5.5 137.0
HIGH 0.5 41.5 0.5 5.0 4.0 10.5 4.0 28.5 78.0 0.5 11.5 184.5
SITE 2.5 0.4 47.4 6.6 13.8 0.0 3.5 1.1 7.5 2.0 22.1 78.0 9.9 194.8
1996 23.3 0.5 4.5 3.5 2.0 33.3 31.5 0.5 0.8 99.9
LOW 24.0 13.5 4.0 66.0 30.5 0.5 138.5
HIGH 9.0 8.5 19.0 54.0 8.0 98.5
SITE 22.5 14.4 3.0 9.5 76.5 26.9 0.4 153.1
1996 20.8 5.5 3.5 20.0 48.0 4.0 0.3 102.1
LOW 1.0 10.0 2.0 14.0 28.0 47.5 0.5 103.0
HIGH 3.5 14.0 52.5 7.5 77.5
SITE 2.5 7.5 1.5 17.5 47.3 39.4 0.4 116.0
1996 5.0 0.3 36.8 34.5 0.3 76.9
LOW 7.5 12.0 1.0 25.0 1.5 19.0 18.5 3.0 21.5 3.5 112.5
HIGH 3.5 6.0 1.5 31.0 0.5 29.0 29.5 32.5 1.5 135.0
SITE 7.4 12.0 1.5 34.3 1.4 28.8 28.6 2.3 32.4 3.4 151.9
LOW 3.5 2.0 51.5 1.0 8.5 37.5 10.0 4.0 2.5 120.5
HIGH 0.5 10.5 12.0 0.5 24.0 1.0 1.0 12.0 12.5 61.5 9.5 10.0 155.0
SITE 0.3 7.9 7.5 0.3 50.6 0.5 0.5 6.8 12.6 58.9 12.3 3.0 6.9 167.9
1996 1.8 0.3 25.8 1.3 22.5 13.8 45.0 1.0 3.3 2.5 117.3
LOW 2.0 5.5 4.5 5.5 10.5 49.0 30.5 1.5 0.5 109.5
HIGH 1.5 1.5 1.0 20.0 2.5 3.5 43.0 48.5 1.5 0.5 123.5
SITE 0.8 2.3 4.6 13.4 5.4 9.6 58.3 47.1 1.9 0.6 143.9
1996 1.0 2.0 9.8 1.3 0.3 43.8 34.0 2.3 94.5
LOW 4.0 9.5 6.0 12.5 5.0 3.0 33.0 48.0 121.0
HIGH 1.0 3.0 6.5 0.5 16.5 17.5 70.5 115.5
SITE 3.0 0.5 8.6 7.8 9.4 0.3 12.0 2.3 33.5 71.3 148.5
1996 28.3 1.5 6.3 1.8 24.5 50.5 0.5 113.4
10
BACK
CREEK
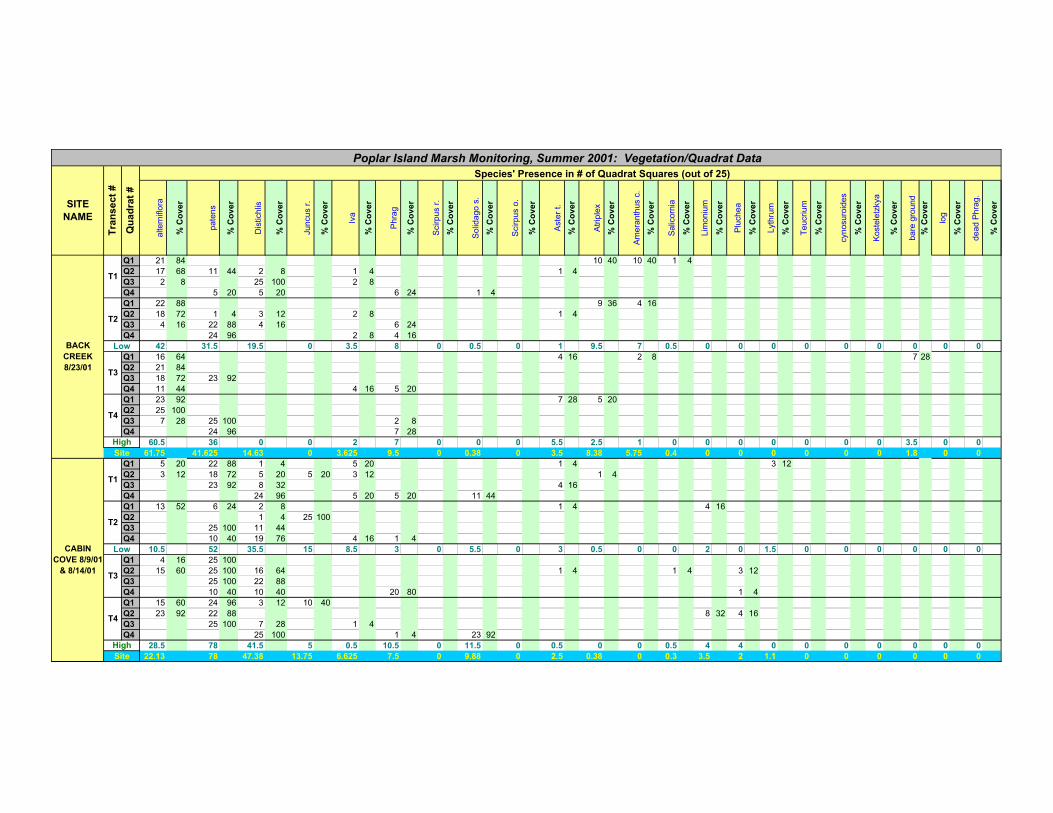
Poplar Island Marsh Monitoring, Summer 2001: Vegetation/Quadrat Data
Species
Vegetative areal cover as measured by percentage of all 0.25m2 quadrats
FRONT
CREEK
COACHES
ISLAND
CABIN COVE
LOWES
POINT
KNAPPS
NARROWS
HARBOR
COVE
FRONT
CREEK A
Table 3. Relative vegetative areal cover by site and low marsh / high marsh zones
SITE
NAME
Am
era
nth
us
can
na
bin
is
Ast
er t
enn
uif
oli
us
Atr
iple
x p
atu
la
Dis
tich
lis
spic
ata
Iva
fru
tesc
ens
Ju
ncu
s ro
meri
an
us
Ko
stele
tzk
ya
vir
gin
ica
Lim
on
ium
ca
roli
nia
nu
m
Lyt
hru
m l
inea
re
Ph
rag
mit
es
au
stra
lis
Plu
chea
pu
rpu
resc
ens
Sp
art
ina
alt
ern
iflo
ra
Sp
art
ina
cyn
osu
roid
es
Sp
art
ina
pa
ten
s
Sa
lico
rnia
sp
.
Sch
oen
op
lect
us
am
eric
an
us
Scir
pu
s ro
bu
stu
s
Scir
pu
s va
lid
us
So
lid
ag
o s
em
ipir
iven
s
Teu
criu
m c
an
ad
ense
bare
gro
un
d
Tota
ls
LOW 5.7 0.8 7.7 15.9 2.8 6.5 34.1 25.6 100
HIGH 0.8 4.7 2.1 1.7 5.9 51.3 30.5 3.0 100
SITE 3.8 2.3 5.6 9.7 2.4 6.3 41.0 27.7 1.2 100
LOW 2.2 0.4 25.9 6.2 10.9 1.5 1.1 2.2 7.7 38.0 4.0 100
HIGH 0.3 22.5 0.3 2.7 2.2 5.7 2.2 15.4 42.3 6.2 100
SITE 1.3 0.2 24.3 3.4 7.1 1.8 0.6 3.9 1.0 11.4 40.1 5.1 100
1995 23.3 0.5 4.5 3.5 2.0 33.3 31.5 0.5 0.8 100
LOW 17.3 9.7 2.9 47.7 22.0 100
HIGH 8.7 8.2 18.4 52.2 7.7 4.8 100
SITE 14.5 9.2 1.9 6.1 49.1 17.3 1.6 100
1995 20.4 5.4 3.4 19.6 47.0 3.9 100
LOW 0.9 9.4 1.9 13.1 26.3 75.0 44.6 0.5 3.3 175
HIGH 4.5 18.1 67.7 9.7 100
SITE 2.1 6.3 1.3 14.8 39.8 33.2 0.3 2.2 100
1995 6.5 0.4 47.9 44.9 0.4 100
LOW 6.7 10.7 0.9 22.2 1.3 16.9 16.4 2.7 19.1 3.1 100
HIGH 2.6 4.4 1.1 23.0 0.4 21.5 21.9 24.1 1.1 100
SITE 4.9 7.9 1.0 22.6 0.9 18.9 18.8 1.5 21.3 2.2 100
LOW 2.9 1.7 42.7 0.8 7.1 31.1 8.3 3.3 2.1 100
HIGH 0.3 6.8 7.7 0.3 15.5 0.6 0.6 7.7 8.1 39.7 6.1 6.5 100
SITE 0.1 4.7 4.5 0.1 30.2 0.3 0.3 4.0 7.5 35.1 7.3 1.8 4.1 100
1995 1.5 0.3 22.0 1.1 19.2 11.8 38.4 0.9 2.8 2.1 100
LOW 1.8 5.0 4.1 5.0 9.6 44.7 27.9 1.4 0.5 100
HIGH 1.2 1.2 0.8 16.2 2.0 2.8 34.8 39.3 1.2 0.4 100
SITE 0.5 1.6 3.2 9.3 3.7 6.7 40.5 32.8 1.3 0.4 100
1995 1.1 2.1 10.4 1.4 0.3 46.3 36.0 2.4 100
LOW 3.3 7.9 5.0 10.3 4.1 2.5 27.3 39.7 100
HIGH 0.9 2.6 5.6 0.4 14.2 15.1 60.8 0.4 100
SITE 2.0 0.3 5.8 5.2 6.3 0.2 8.1 1.5 22.5 47.9 0.2 100
1995 25.0 1.3 5.6 1.6 21.6 44.5 100
11
LOWES
POINT
KNAPPS
NARROWS
HARBOR
COVE
FRONT
CREEK A
RELATIVE Vegetative areal cover as measured by percentage of all 0.25m2 quadrats
Poplar Island Marsh Monitoring, Summer 2001: Vegetation/Quadrat Data
FRONT
CREEK
COACHES
ISLAND
CABIN COVE
BACK
CREEK
Species
12
Table 4. Average percent cover by each plant species for all 2001 vegetation monitoring
sites with observations divided by LOW marsh and HIGH marsh zonation.
13
Table 5. Comparison of percent cover for each plant species observed in LOW marsh
quadrats (# ’s one & two combined) during 2001 wetland vegetation monitorin g.
Species with n o letters in common in th e right-hand column are sign ifican tly
different (p<0.05). Species are listed in descending order by rank as assigned from
sample medians.
14
Table 6. Comparison of percent cover for each plant species observed in HIGH marsh
quadrats (# ’s three & four combined) during 2001 wetland vegetation monitoring .
Species with n o letters in common in th e right-hand column are sign ifican tly
different (p<0.05). Species are listed in descending order by rank as assigned from
sample medians
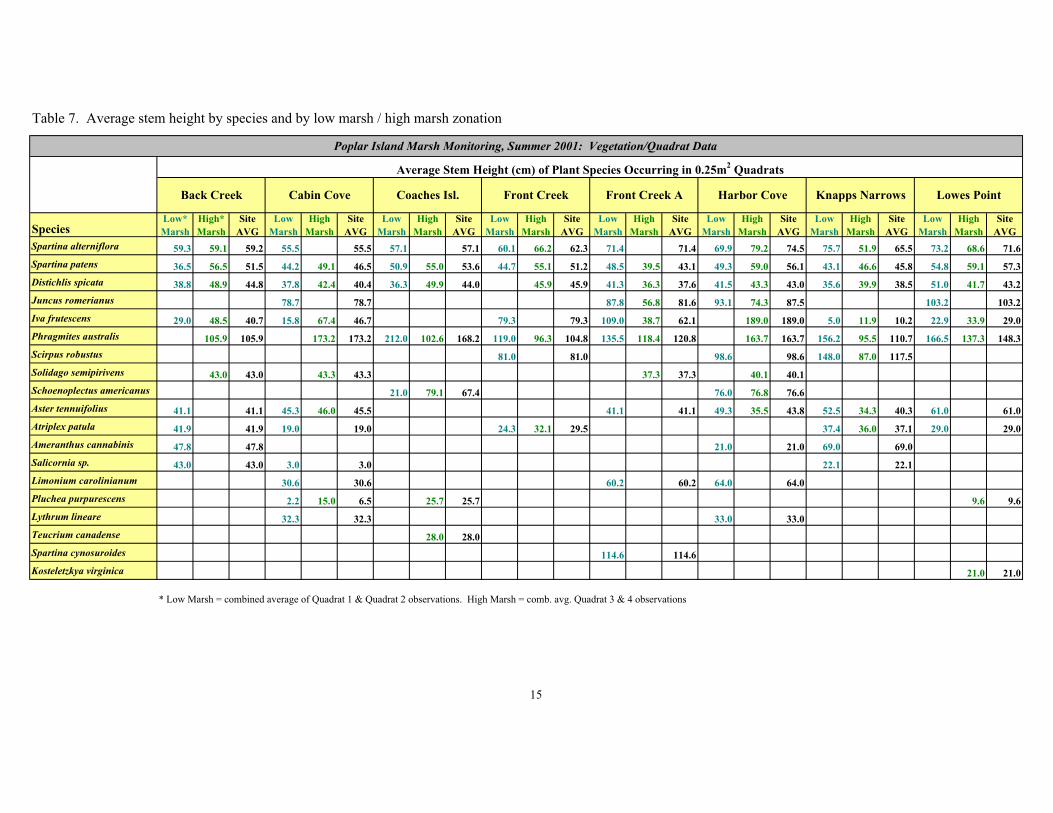
Table 7. Average stem height by species and by low marsh / high marsh zonation
SpeciesLow*
Marsh
High*
Marsh
Site
AVG
Low
Marsh
High
Marsh
Site
AVG
Low
Marsh
High
Marsh
Site
AVG
Low
Marsh
High
Marsh
Site
AVG
Low
Marsh
High
Marsh
Site
AVG
Low
Marsh
High
Marsh
Site
AVG
Low
Marsh
High
Marsh
Site
AVG
Low
Marsh
High
Marsh
Site
AVG
Spartina alterniflora 59.3 59.1 59.2 55.5 55.5 57.1 57.1 60.1 66.2 62.3 71.4 71.4 69.9 79.2 74.5 75.7 51.9 65.5 73.2 68.6 71.6
Spartina patens 36.5 56.5 51.5 44.2 49.1 46.5 50.9 55.0 53.6 44.7 55.1 51.2 48.5 39.5 43.1 49.3 59.0 56.1 43.1 46.6 45.8 54.8 59.1 57.3
Distichlis spicata 38.8 48.9 44.8 37.8 42.4 40.4 36.3 49.9 44.0 45.9 45.9 41.3 36.3 37.6 41.5 43.3 43.0 35.6 39.9 38.5 51.0 41.7 43.2
Juncus romerianus 78.7 78.7 87.8 56.8 81.6 93.1 74.3 87.5 103.2 103.2
Iva frutescens 29.0 48.5 40.7 15.8 67.4 46.7 79.3 79.3 109.0 38.7 62.1 189.0 189.0 5.0 11.9 10.2 22.9 33.9 29.0
Phragmites australis 105.9 105.9 173.2 173.2 212.0 102.6 168.2 119.0 96.3 104.8 135.5 118.4 120.8 163.7 163.7 156.2 95.5 110.7 166.5 137.3 148.3
Scirpus robustus 81.0 81.0 98.6 98.6 148.0 87.0 117.5
Solidago semipirivens 43.0 43.0 43.3 43.3 37.3 37.3 40.1 40.1
Schoenoplectus americanus 21.0 79.1 67.4 76.0 76.8 76.6
Aster tennuifolius 41.1 41.1 45.3 46.0 45.5 41.1 41.1 49.3 35.5 43.8 52.5 34.3 40.3 61.0 61.0
Atriplex patula 41.9 41.9 19.0 19.0 24.3 32.1 29.5 37.4 36.0 37.1 29.0 29.0
Ameranthus cannabinis 47.8 47.8 21.0 21.0 69.0 69.0
Salicornia sp. 43.0 43.0 3.0 3.0 22.1 22.1
Limonium carolinianum 30.6 30.6 60.2 60.2 64.0 64.0
Pluchea purpurescens 2.2 15.0 6.5 25.7 25.7 9.6 9.6
Lythrum lineare 32.3 32.3 33.0 33.0
Teucrium canadense 28.0 28.0
Spartina cynosuroides 114.6 114.6
Kosteletzkya virginica 21.0 21.0
* Low Marsh = combined average of Quadrat 1 & Quadrat 2 observations. High Marsh = comb. avg. Quadrat 3 & 4 observations
15
Poplar Island Marsh Monitoring, Summer 2001: Vegetation/Quadrat Data
Average Stem Height (cm) of Plant Species Occurring in 0.25m2 Quadrats
Front Creek A Harbor Cove Knapps Narrows Lowes PointBack Creek Cabin Cove Coaches Isl. Front Creek
16
Table 8. Comparison of Spartina paten s stem heights from all sites’ high marsh zones.
Sites wi th no let ters in common in th e right-hand columns have s ignificantly
different (p<0.05 ) S. patens stem heights. Sites are listed in descending order by
sample means.
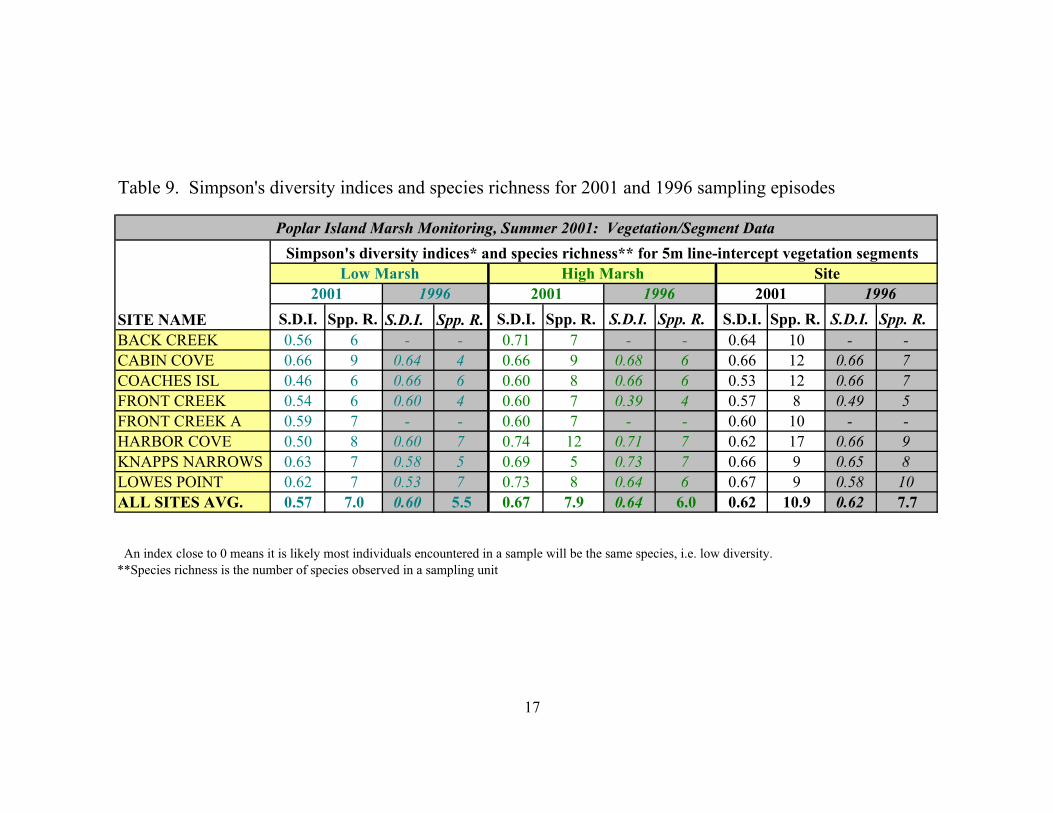
Table 9. Simpson's diversity indices and species richness for 2001 and 1996 sampling episodes
S.D.I. Spp. R. S.D.I. Spp. R. S.D.I. Spp. R. S.D.I. Spp. R. S.D.I. Spp. R. S.D.I. Spp. R.
BACK CREEK 0.56 6 - - 0.71 7 - - 0.64 10 - -
CABIN COVE 0.66 9 0.64 4 0.66 9 0.68 6 0.66 12 0.66 7
COACHES ISL 0.46 6 0.66 6 0.60 8 0.66 6 0.53 12 0.66 7
FRONT CREEK 0.54 6 0.60 4 0.60 7 0.39 4 0.57 8 0.49 5
FRONT CREEK A 0.59 7 - - 0.60 7 - - 0.60 10 - -
HARBOR COVE 0.50 8 0.60 7 0.74 12 0.71 7 0.62 17 0.66 9
KNAPPS NARROWS 0.63 7 0.58 5 0.69 5 0.73 7 0.66 9 0.65 8
LOWES POINT 0.62 7 0.53 7 0.73 8 0.64 6 0.67 9 0.58 10
ALL SITES AVG. 0.57 7.0 0.60 5.5 0.67 7.9 0.64 6.0 0.62 10.9 0.62 7.7
An index close to 0 means it is likely most individuals encountered in a sample will be the same species, i.e. low diversity.
**Species richness is the number of species observed in a sampling unit
17
Site
2001 1996
Low Marsh
Poplar Island Marsh Monitoring, Summer 2001: Vegetation/Segment Data
Simpson's diversity indices* and species richness** for 5m line-intercept vegetation segments
SITE NAME
2001 1996
High Marsh
19962001
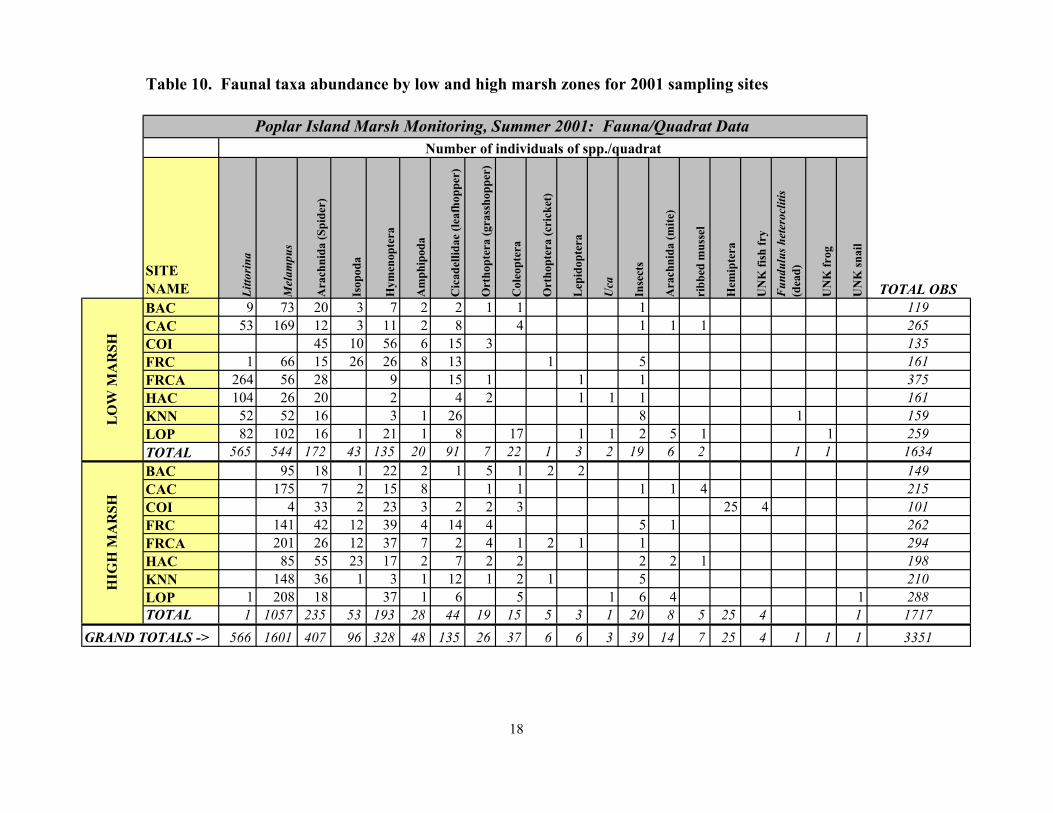
Table 10. Faunal taxa abundance by low and high marsh zones for 2001 sampling sites
SITE
NAME Lit
tori
na
Mela
mp
us
Ara
chn
ida (
Sp
ider
)
Isop
od
a
Hym
enop
tera
Am
ph
ipod
a
Cic
ad
elli
dae
(lea
fhop
per
)
Ort
hop
tera
(gra
ssh
op
per
)
Cole
op
tera
Ort
hop
tera
(cr
ick
et)
Lep
idop
tera
Uca
Inse
cts
Ara
chn
ida (
mit
e)
rib
bed
mu
ssel
Hem
ipte
ra
UN
K f
ish
fry
Fu
nd
ulu
s h
eter
ocl
itis
(dea
d)
UN
K f
rog
UN
K s
nail
TOTAL OBS
BAC 9 73 20 3 7 2 2 1 1 1 119
CAC 53 169 12 3 11 2 8 4 1 1 1 265
COI 45 10 56 6 15 3 135
FRC 1 66 15 26 26 8 13 1 5 161
FRCA 264 56 28 9 15 1 1 1 375
HAC 104 26 20 2 4 2 1 1 1 161
KNN 52 52 16 3 1 26 8 1 159
LOP 82 102 16 1 21 1 8 17 1 1 2 5 1 1 259
TOTAL 565 544 172 43 135 20 91 7 22 1 3 2 19 6 2 1 1 1634
BAC 95 18 1 22 2 1 5 1 2 2 149
CAC 175 7 2 15 8 1 1 1 1 4 215
COI 4 33 2 23 3 2 2 3 25 4 101
FRC 141 42 12 39 4 14 4 5 1 262
FRCA 201 26 12 37 7 2 4 1 2 1 1 294
HAC 85 55 23 17 2 7 2 2 2 2 1 198
KNN 148 36 1 3 1 12 1 2 1 5 210
LOP 1 208 18 37 1 6 5 1 6 4 1 288
TOTAL 1 1057 235 53 193 28 44 19 15 5 3 1 20 8 5 25 4 1 1717
566 1601 407 96 328 48 135 26 37 6 6 3 39 14 7 25 4 1 1 1 3351
18
GRAND TOTALS ->
Number of individuals of spp./quadrat
Poplar Island Marsh Monitoring, Summer 2001: Fauna/Quadrat Data L
OW
MA
RS
HH
IGH
MA
RS
H
�����������
�������������
����
����
�������
������������������
������
����������������� ����������������������!����
� " # �" �# $" $# %" %# �����
��
����
��
��
����
��
���������������
�����������
�� ����������
�����������������
�������������
������ �
�������������������� ���������������������������� �������������
�
� ��� � ��� � ���
������������������
!��"�����"��!#�
���������"���$�
���������������%�
��&����������%
�������������%�
'��&���������'#�
��
���������"�#���$�#
21
Figure 3. Idealized representation of spatial relationship between sampling features and wetland elevations. Features are not
drawn to scale.
����
����
��
����
��
����
�� ������
�� ����������
��
�����������������
����
���������
���������
�
��������������������������������������������������������
�� ��� ��� ��� ��� ����
��
!���" �#��������$�%������&������'������()���*����������'�������������������+��'�������'�����+�$�����������'�����
��%'���,��-���.����$�*�����)�/�&�������0�12�
#-3#��" �#��������$�%������&������'������()���*����������'�������������������+��'�������'�����+�&����%������������������%'���,��-���.����$�*�����)�/�&�������0�4�
���������&�����5���������������%���������6������������6������������6�������������7'��������%����5��������������������'��)��
����
��
����
�������� ��
����
��
��������
��������������� ����������������� ��� ��� ����������
�
� ��� ��� ��� ��� ����
�
����������
�
��������������
�����������
�
!"#!��$��!���� ���% &�����'�����(�������)� ����������(�����(����*�%�����������(���*��(������������� �����&(� �+��"���,� ��%�������)�-�'������.�//�0�11/�-�.�/23
45���$��!���� ���% &�����'�����(�������)� ����������(�����(����*�%�����������(���*�6������� &����������&(� �+��"���,� ��%�������)�-�'������.�//�0�11/�-�.�/ 3
��������' ����7��������������&���������8�����������8�����������8�����������9(�������&����7� ����������������(�)��
����
��
����
������
��
��
�� ������
������
���������������
������� ��
��������������
���������������������
�������������
������������������������������� ���������������������!���
�� ��� ��� ��� ��� ����
��
"#���$�!% ������&�'������������!������()���*����� ���!�������������+�!�������������'�������+�&��������������
!�'���,�����-����&�*����)�.������ �/����0�11��.�/���2
%�3%��$�!% ������&�'������������!������()���*����� ���!�������������+�!��������������������+�&��������������!�'���,�����-����&�*����)�.������ �/��/�0�11��.�/���2��
�������������4 ��������������'��������5�������������5�������������5�������������6���������'���4���������������������)��
����
��
����
���� ��
������
��
������
���
���������������
���������
��
��
����
��� ��
�� ������������������������������ ����������������� �����
�� �� ��� ��� ��� �
��
��������
���
�
!���"��#�������$�%������&������'�����()���*��� ������'�������'����+��'�������������������+�&�� %���������������%'��,�-���.����$�*����)�/�&������0�1��2�334�/�0�405
#-6#��"��#�������$�%������&������'�����()���*��� ������'�������������������+�&�� %�����������+��'�������'��������%'��,�-���.����$�*����)�/�&������0�40�2�334�/�0��35
��������&����7���������������%��������8�������������8�������������8�������������9'��������%���7������������������'��)��
����
��
����
��
����
��
��
��
��
��
��
��
��
��
�������
����
���������������
����
�����
��
�������
�
�
��
����������������������������������� ���������������������!���
�� ��� ��� ��� ��� ����
�
"#�����!$ ������%�&������'�����!(�����)*���+����� ���,�������&������-�!(�������(����-���'���&�����������-�!(���������������������!�&(��.�/���0����%�+����*�1�'���� �2�34�
$/5$����!$ ������%�&������'�����!(�����)*���+����� ���!(�������(����-�,�������&������-���!(�������������������-�'���&������������!�&(��.�/���0����%�+����*�1�'���� �2�62��
��������'����7 ��������������&��������8�������������8�������������8�������������9(��������&���7������������������(��*��
����
��
����
��
����
��
��
����
��
����
��
��
���������������� ������������������������������������
�
� ��� ��� ��� ��� ����
�
�
����������������
�����
������
����������
�
!
"#���$��� ������%�&�����'�����(�������)� ����������*��������&������+���(�����'����+��������(�������&�������
��&(���,��-���.����%�������)�/�'������0�10�2���3�/�0�304
-5��$��� ������%�&�����'�����(�������)� �����������(�����(����+�*��������&������+��(���������������
��&(���,��-���.����%�������)�/�'������0�6!�2���3�/�0�6�4
��������'�����7��������������&���������8�����������8�����������8����� �����9(�������&����7������������������(�)��
����
��
����
��
��
��
��
��
��
��
��
����
��
��
���������������
�������������
�������
��
�
�
������� �����
��������������������������������� ���������������������!���
�� ��� ��� ��� ��� ����
�
"#���$�!% ������&�'������(�����!������)*�+�,����� ���!��������������������-�!�������������-�(���'�������������!�'���.�/���0����&�,����*�1�(���� ���2��3�442�1���567
%/8%��$�!% ������&�'������(�����!������)*�+�,����� ���!�������������-��!��������������������-�&���������������!�'���.�/���0����&�,����*�1�(���� ���24�3�442�1���9�7
��������(����: ��������������'��������;�������������;�������������;�������������<���������'���:���������������������*��
����
��
����
�� ���� ��
�� �� �� ��
�� �� ����
�������������
������� � � ��
����������
����������������������������������������������������������
�
��
� ���!��" ������#�$�������������%�����&'�(�)����� ����%�������%����*��%�������������������*�+�������$����������$%��,�-���.����#�)����'�/������ �0�1��2�331�/�0�4�5
"-6"��!��" ������#�$�������������%�����&'�(�)����� ����%�������%����*���%�������������������*�����$���������������$%��,�-���.����#�)����'�/������ �0�7���2�331�/�0�1�5
� ��� ��� ��� ��� ��� � �������������8 ��������������$��������9�������������9�������������9�������������:%��������$���8������������������%��'��
����
��
����
0
0.1
0.2
0.3
0.4
0.5
0.6
0.7
0.8
0.9
1
BAC CAC COI FRC FRCA HAC KNN LOP ALL SITES
Site Name
Sim
pso
n's
Div
ers
ity In
dex
1996 Low Marsh
1996 High Marsh
2001 Low Marsh
2001 High Marsh
Figure 12. Plant species diversity by line-intercept segment for 2001 wetland vegetation monitoring
30
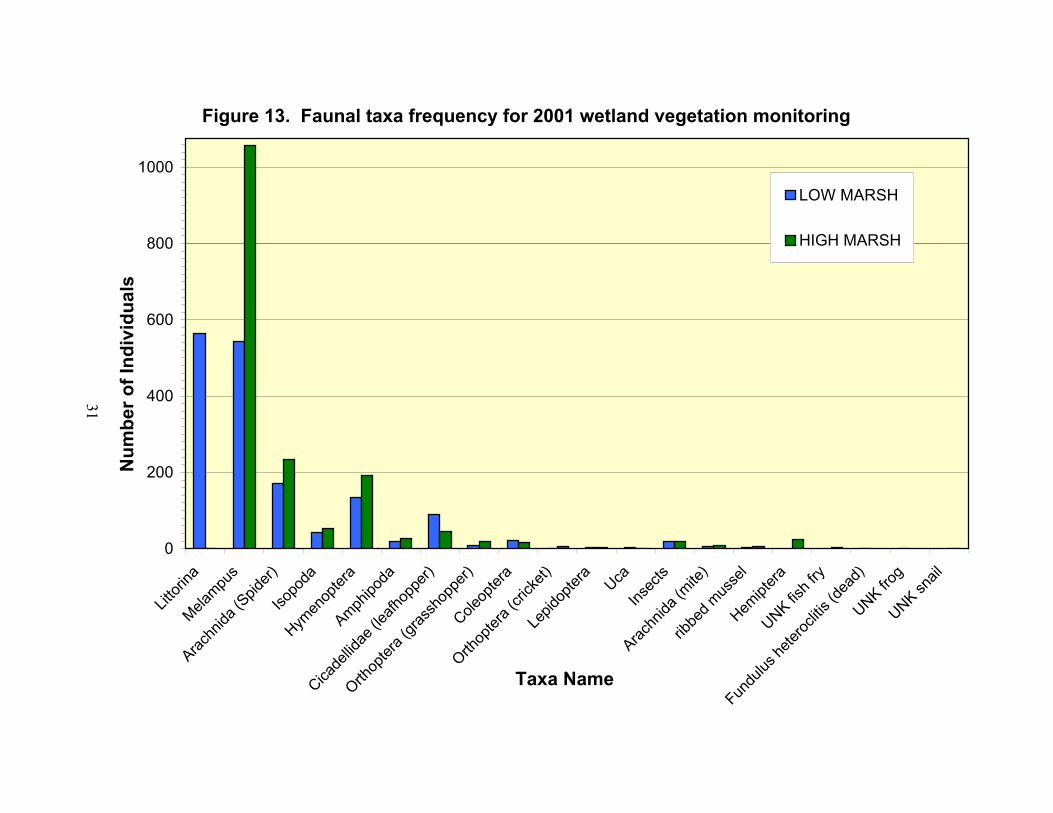
Figure 13. Faunal taxa frequency for 2001 wetland vegetation monitoring
0
200
400
600
800
1000
Litto
rina
Melam
pus
Ara
chnida
(Spide
r)
Isop
oda
Hym
enop
tera
Am
phipod
a
Cicad
ellid
ae (l
eafh
oppe
r)
Orth
opte
ra (g
rass
hopp
er)
Coleo
pter
a
Orth
opte
ra (c
ricke
t)
Lepido
pter
aUca
Inse
cts
Ara
chnida
(mite
)
ribbe
d m
usse
l
Hem
ipte
ra
UNK fish
fry
Fundu
lus he
tero
clitis (d
ead)
UNK fr
og
UNK sna
il
Taxa Name
Nu
mb
er
of
Ind
ivid
uals
LOW MARSH
HIGH MARSH
31

APPENDIX A
GPS coordinates of transect locations for 2001 Vegetation Monitoring
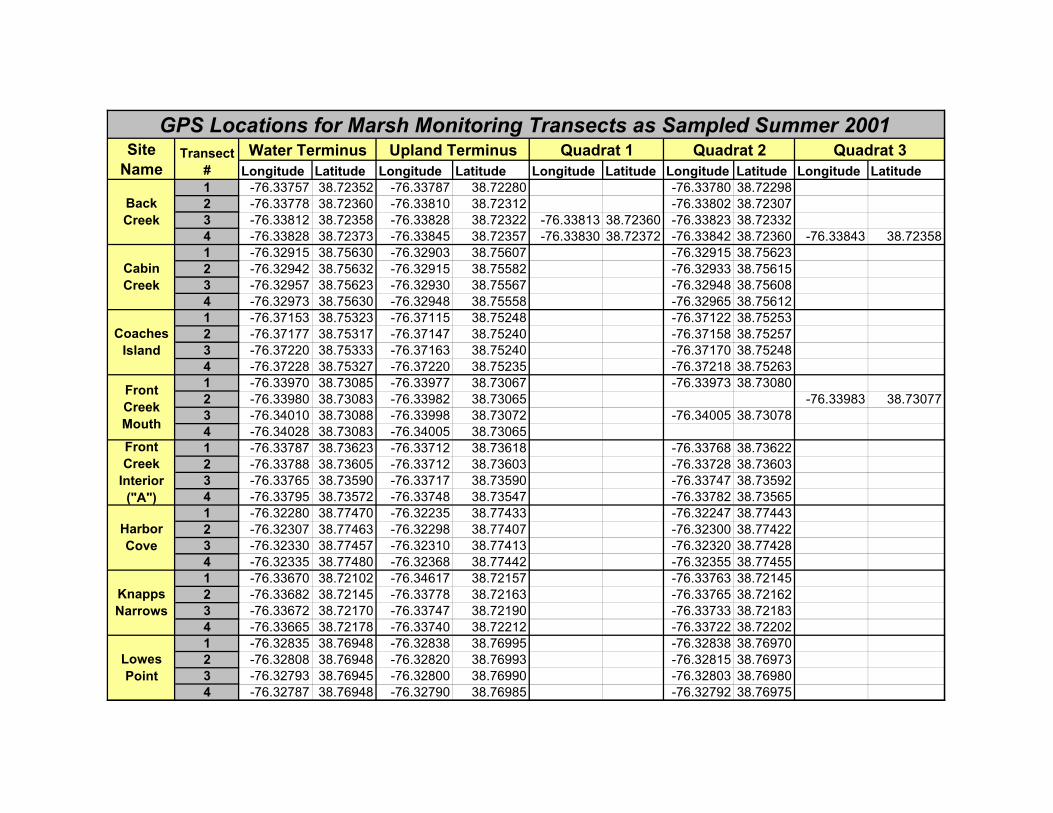
Longitude Latitude Longitude Latitude Longitude Latitude Longitude Latitude Longitude Latitude
1 -76.33757 38.72352 -76.33787 38.72280 -76.33780 38.72298
2 -76.33778 38.72360 -76.33810 38.72312 -76.33802 38.72307
3 -76.33812 38.72358 -76.33828 38.72322 -76.33813 38.72360 -76.33823 38.72332
4 -76.33828 38.72373 -76.33845 38.72357 -76.33830 38.72372 -76.33842 38.72360 -76.33843 38.72358
1 -76.32915 38.75630 -76.32903 38.75607 -76.32915 38.75623
2 -76.32942 38.75632 -76.32915 38.75582 -76.32933 38.75615
3 -76.32957 38.75623 -76.32930 38.75567 -76.32948 38.75608
4 -76.32973 38.75630 -76.32948 38.75558 -76.32965 38.75612
1 -76.37153 38.75323 -76.37115 38.75248 -76.37122 38.75253
2 -76.37177 38.75317 -76.37147 38.75240 -76.37158 38.75257
3 -76.37220 38.75333 -76.37163 38.75240 -76.37170 38.75248
4 -76.37228 38.75327 -76.37220 38.75235 -76.37218 38.75263
1 -76.33970 38.73085 -76.33977 38.73067 -76.33973 38.73080
2 -76.33980 38.73083 -76.33982 38.73065 -76.33983 38.73077
3 -76.34010 38.73088 -76.33998 38.73072 -76.34005 38.73078
4 -76.34028 38.73083 -76.34005 38.73065
1 -76.33787 38.73623 -76.33712 38.73618 -76.33768 38.73622
2 -76.33788 38.73605 -76.33712 38.73603 -76.33728 38.73603
3 -76.33765 38.73590 -76.33717 38.73590 -76.33747 38.73592
4 -76.33795 38.73572 -76.33748 38.73547 -76.33782 38.73565
1 -76.32280 38.77470 -76.32235 38.77433 -76.32247 38.77443
2 -76.32307 38.77463 -76.32298 38.77407 -76.32300 38.77422
3 -76.32330 38.77457 -76.32310 38.77413 -76.32320 38.77428
4 -76.32335 38.77480 -76.32368 38.77442 -76.32355 38.77455
1 -76.33670 38.72102 -76.34617 38.72157 -76.33763 38.72145
2 -76.33682 38.72145 -76.33778 38.72163 -76.33765 38.72162
3 -76.33672 38.72170 -76.33747 38.72190 -76.33733 38.72183
4 -76.33665 38.72178 -76.33740 38.72212 -76.33722 38.72202
1 -76.32835 38.76948 -76.32838 38.76995 -76.32838 38.76970
2 -76.32808 38.76948 -76.32820 38.76993 -76.32815 38.76973
3 -76.32793 38.76945 -76.32800 38.76990 -76.32803 38.76980
4 -76.32787 38.76948 -76.32790 38.76985 -76.32792 38.76975
Knapps
Narrows
Lowes
Point
Water TerminusTransect
#
Site
Name
Harbor
Cove
GPS Locations for Marsh Monitoring Transects as Sampled Summer 2001
Coaches
Island
Front
Creek
Mouth
Front
Creek
Interior
("A")
Back
Creek
Cabin
Creek
Upland Terminus Quadrat 1 Quadrat 2 Quadrat 3

APPENDIX B
Photomonitoring log
(all views from transects’ water terminus toward upland edge of marsh)
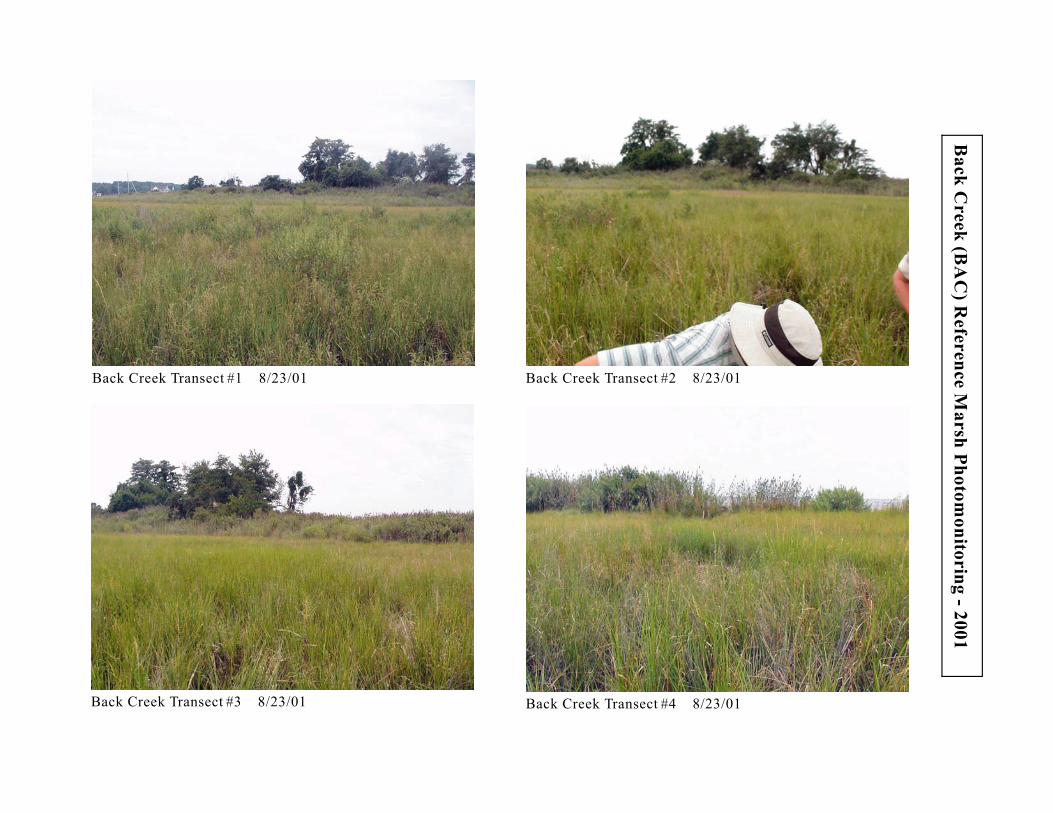
Back Creek Transect #1 8/23/01 Back Creek Transect #2 8/23/01
Ba
ck
Creek
(BA
C)
Refe
ren
ce
Ma
rsh
Ph
oto
mo
nito
rin
g-
20
01
Back Creek Transect #3 8/23/01 Back Creek Transect #4 8/23/01
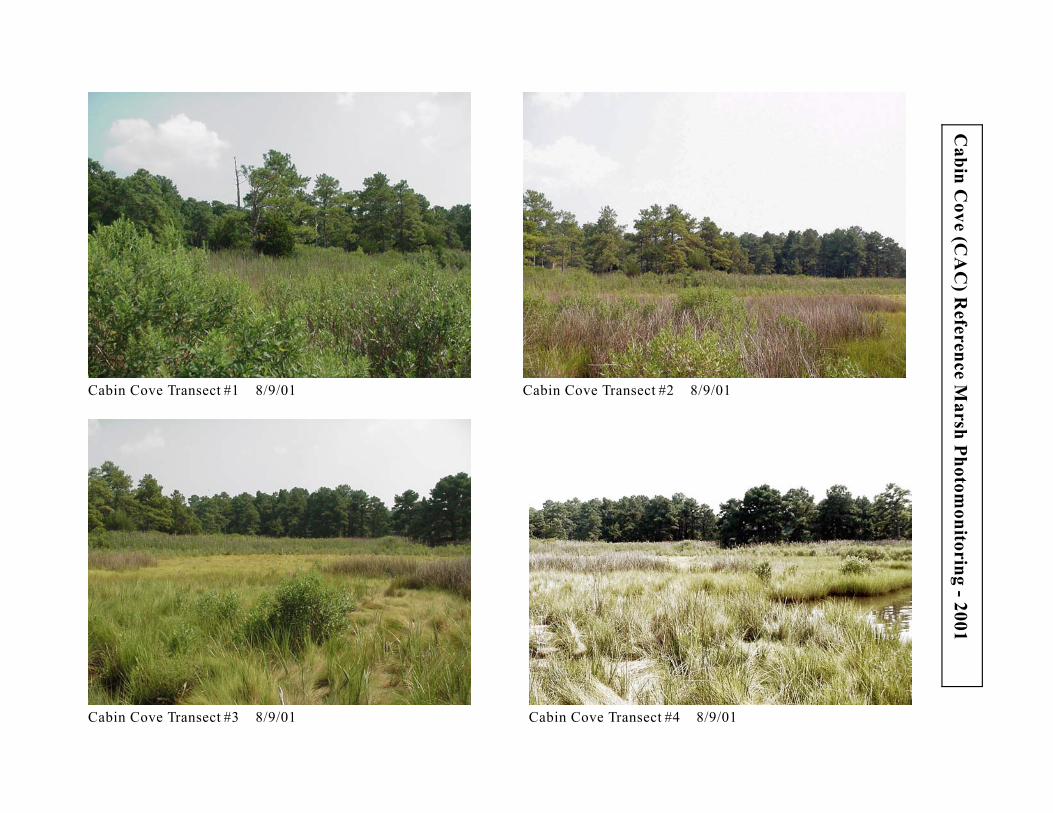
Cabin Cove Transect #1 8/9/01 Cabin Cove Transect #2 8/9/01
Ca
bin
Co
ve
(CA
C)
Refe
ren
ce
Ma
rsh
Ph
oto
mo
nito
rin
g-
20
01
Cabin Cove Transect #3 8/9/01 Cabin Cove Transect #4 8/9/01
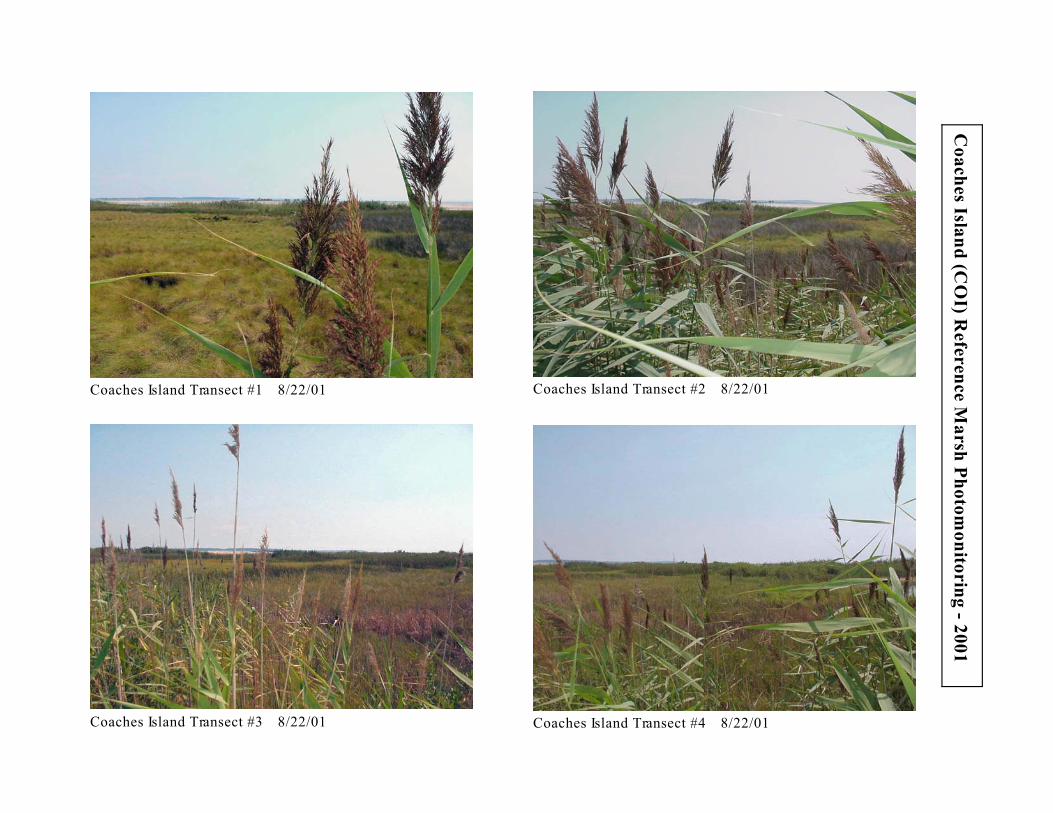
Coaches Island Transect #1 8/22/01 Coaches Island Transect #2 8/22/01
Co
ach
es
Islan
d(C
OI)
Refe
ren
ce
Ma
rsh
Ph
oto
mo
nito
rin
g-
20
01
Coaches Island Transect #4 8/22/01Coaches Island Transect #3 8/22/01
Front Creek Transect #1 8/20/01 Front Creek Transect #2 8/20/01
Fro
nt
Creek
(FR
C)
Refe
ren
ce
Ma
rsh
Ph
oto
mo
nito
rin
g-
20
01
Front Creek Transect #3 8/20/01 Front Creek Transect #4 8/20/01
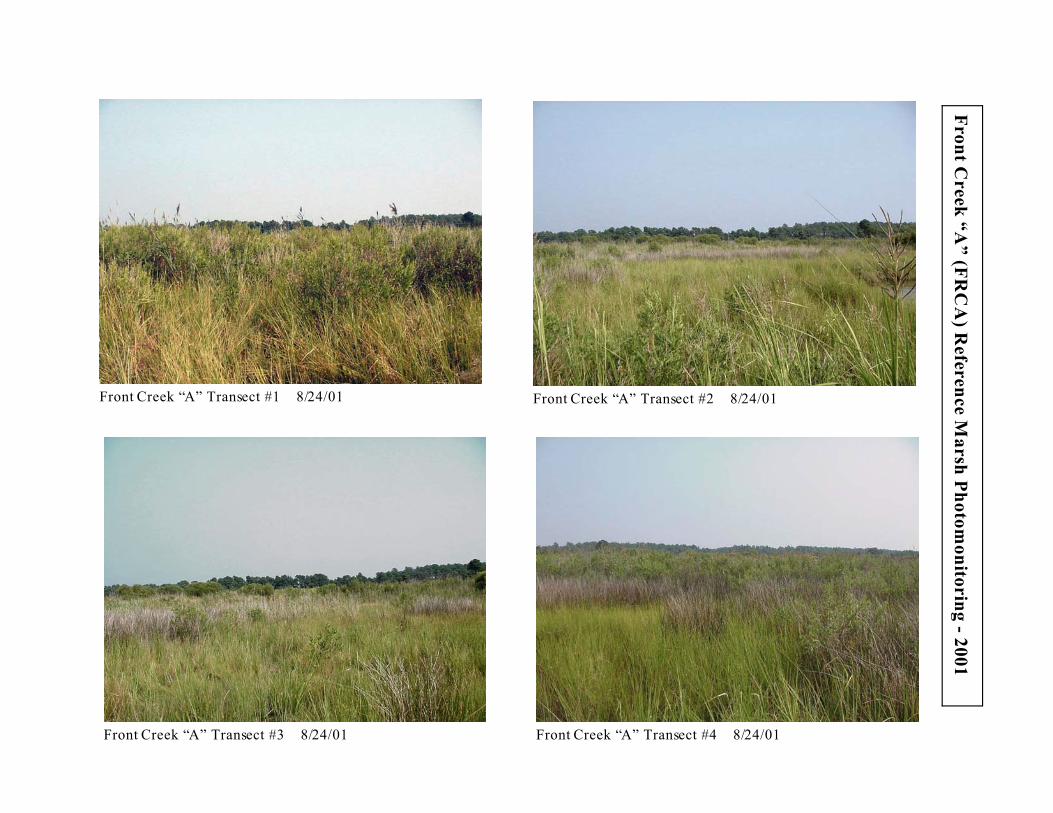
Front Creek “A” Transect #1 8/24/01 Front Creek “A” Transect #2 8/24/01
Fro
nt
Creek
“A
”(F
RC
A)
Refe
ren
ce
Ma
rsh
Ph
oto
mo
nito
rin
g-
20
01
Front Creek “A” Transect #3 8/24/01 Front Creek “A” Transect #4 8/24/01
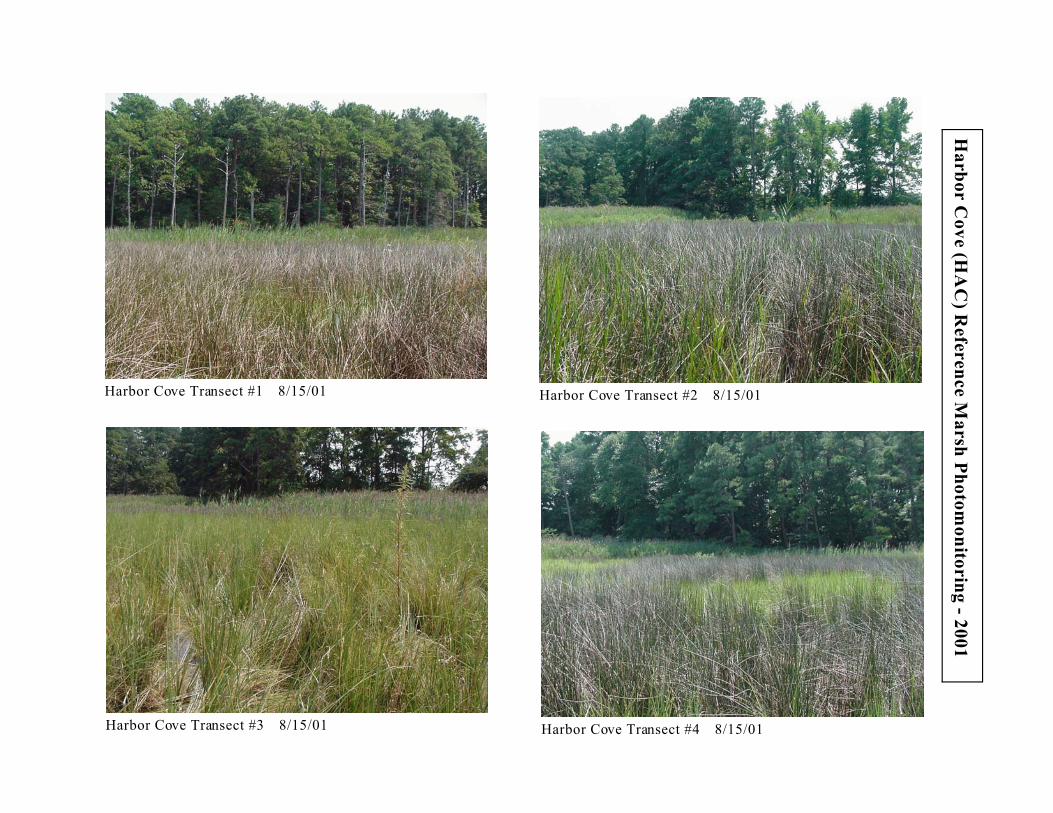
Harbor Cove Transect #1 8/15/01 Harbor Cove Transect #2 8/15/01
Ha
rb
or
Co
ve
(HA
C)
Refe
ren
ce
Ma
rsh
Ph
oto
mo
nito
rin
g-
20
01
Harbor Cove Transect #3 8/15/01 Harbor Cove Transect #4 8/15/01
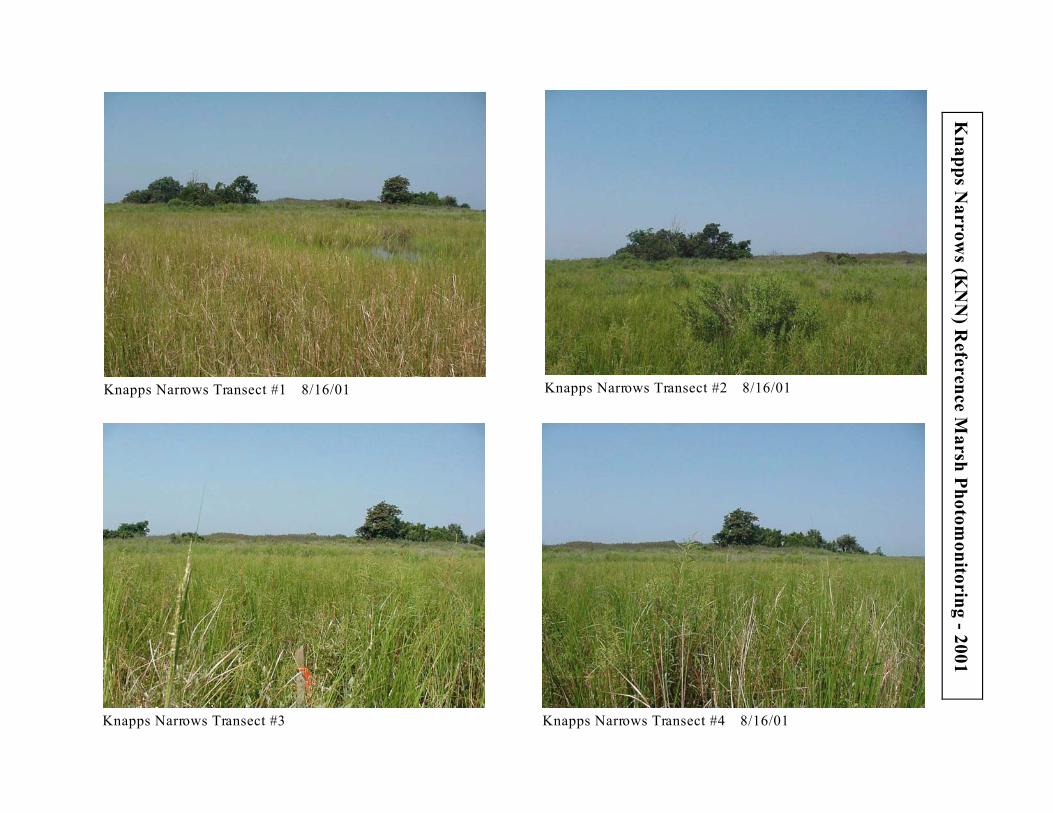
Knapps Narrows Transect #1 8/16/01 Knapps Narrows Transect #2 8/16/01
Kn
ap
ps
Na
rro
ws
(KN
N)
Refe
ren
ce
Ma
rsh
Ph
oto
mo
nito
rin
g-
20
01
Knapps Narrows Transect #3 Knapps Narrows Transect #4 8/16/01

Lowes Point Transect #1 8/14/01 Lowes Point Transect #2 8/14/01
Lo
wes
Po
int
(LO
P)
Refe
ren
ce
Ma
rsh
Ph
oto
mo
nito
rin
g-
20
01
Lowes Point Transect #4 8/14/01Lowes Point Transect #3 8/14/01

APPENDIX C
Vegetation Data: Raw perce nt cover and vegetation community composition data

Vegetation/Quadrat Data: Raw perce nt cover data
altern
iflo
ra
% C
over
pate
ns
% C
over
Dis
tichlis
% C
over
Juncus r
.
% C
over
Iva
% C
over
Phra
g
% C
over
Scirpus r
.
% C
over
Solid
ago s
.
% C
over
Scirpus o
.
% C
over
Aste
r t.
% C
over
Atr
iple
x
% C
over
Am
era
nth
us c
.
% C
over
Salic
orn
ia
% C
over
Lim
oniu
m
% C
over
Plu
chea
% C
over
Lyth
rum
% C
over
Teucrium
% C
over
cynosuro
ides
% C
over
Koste
letz
kya
% C
over
bare
gro
und
% C
over
log
% C
over
dead P
hra
g.
% C
over
Q1 21 84 10 40 10 40 1 4
Q2 17 68 11 44 2 8 1 4 1 4
Q3 2 8 25 100 2 8
Q4 5 20 5 20 6 24 1 4
Q1 22 88 9 36 4 16
Q2 18 72 1 4 3 12 2 8 1 4
Q3 4 16 22 88 4 16 6 24
Q4 24 96 2 8 4 16
42 31.5 19.5 0 3.5 8 0 0.5 0 1 9.5 7 0.5 0 0 0 0 0 0 0 0 0
Q1 16 64 4 16 2 8 7 28
Q2 21 84
Q3 18 72 23 92
Q4 11 44 4 16 5 20
Q1 23 92 7 28 5 20
Q2 25 100
Q3 7 28 25 100 2 8
Q4 24 96 7 28
60.5 36 0 0 2 7 0 0 0 5.5 2.5 1 0 0 0 0 0 0 0 3.5 0 0
61.75 41.625 14.63 0 3.625 9.5 0 0.38 0 3.5 8.38 5.75 0.4 0 0 0 0 0 0 1.8 0 0
Q1 5 20 22 88 1 4 5 20 1 4 3 12
Q2 3 12 18 72 5 20 5 20 3 12 1 4
Q3 23 92 8 32 4 16
Q4 24 96 5 20 5 20 11 44
Q1 13 52 6 24 2 8 1 4 4 16
Q2 1 4 25 100
Q3 25 100 11 44
Q4 10 40 19 76 4 16 1 4
10.5 52 35.5 15 8.5 3 0 5.5 0 3 0.5 0 0 2 0 1.5 0 0 0 0 0 0
Q1 4 16 25 100
Q2 15 60 25 100 16 64 1 4 1 4 3 12
Q3 25 100 22 88
Q4 10 40 10 40 20 80 1 4
Q1 15 60 24 96 3 12 10 40
Q2 23 92 22 88 8 32 4 16
Q3 25 100 7 28 1 4
Q4 25 100 1 4 23 92
28.5 78 41.5 5 0.5 10.5 0 11.5 0 0.5 0 0 0.5 4 4 0 0 0 0 0 0 0
22.13 78 47.38 13.75 6.625 7.5 0 9.88 0 2.5 0.38 0 0.3 3.5 2 1.1 0 0 0 0 0 0
Qu
ad
rat
#
SITE
NAME
Tra
ns
ec
t #
T1
T1
T3
BACK
CREEK
8/23/01
T4
T2
High
Site
Low
T2
CABIN
COVE 8/9/01
& 8/14/01
T4
High
Site
Low
T3
Poplar Island Marsh Monitoring, Summer 2001: Vegetation/Quadrat Data
Species' Presence in # of Quadrat Squares (out of 25)
altern
iflo
ra
% C
over
pate
ns
% C
over
Dis
tichlis
% C
over
Juncus r
.
% C
over
Iva
% C
over
Phra
g
% C
over
Scirpus r
.
% C
over
Solid
ago s
.
% C
over
Scirpus o
.
% C
over
Aste
r t.
% C
over
Atr
iple
x
% C
over
Am
era
nth
us c
.
% C
over
Salic
orn
ia
% C
over
Lim
oniu
m
% C
over
Plu
chea
% C
over
Lyth
rum
% C
over
Teucrium
% C
over
cynosuro
ides
% C
over
Koste
letz
kya
% C
over
bare
gro
und
% C
over
log
% C
over
dead P
hra
g.
% C
over
Qu
ad
rat
#
SITE
NAME
Tra
ns
ec
t #
Poplar Island Marsh Monitoring, Summer 2001: Vegetation/Quadrat Data
Species' Presence in # of Quadrat Squares (out of 25)
Q1 6 24 19 76
Q2 23 92 11 44 1 4
Q3 17 68 4 16 25 100 3 12
Q4 22 88 1 4
Q1 3 12 8 32
Q2 25 100 14 56
Q3 11 44 19 76 5 20
Q4 25 100 19 76 16 64
0 66 24 0 0 13.5 0 0 30.5 0 0 0 0 0 4 0 0.5 0 0 0 0 0
Q1 25 100
Q2 13 52 13 52
Q3 17 68 4 16 5 20
Q4 16 64 16 64
Q1 20 80 10 40 5 20
Q2 13 52
Q3 22 88 3 12
Q4 20 80 1 4 4 16
19 54 9 0 0 8.5 0 0 8 0 0 0 0 0 0 0 0 0 0 5 0 0
9.5 76.5 22.5 0 0 14.4 0 0 26.9 0 0 0 0 0 3 0 0.4 0 0 2.5 0 0
Q1 7 28 4 16 7 28
Q2 22 88 7 28
Q3 11 44 21 84
Q4 25 100 4 16 7 28 2 8
Q1 1 4 5 20 5 20 7 28
Q2 3 12 4 16 1 4 1 4
Q3 12 48 15 60 11 44
Q4 25 100 5 20 1 4
28 47.5 10 0 2 14 0.5 0 0 0 1 0 0 0 0 0 0 0 0 3.5 0 0
Q1 25 100 5 20
Q2 25 100 3 12
Q3 5 20 6 24 9 36 4 16
Q4 4 16 15 60
Q1 25 100
Q2
Q3
Q4 25 100 4 16
52.5 7.5 0 0 0 14 0 0 0 0 3.5 0 0 0 0 0 0 0 0 0 0 0
47.25 39.375 7.5 0 1.5 17.5 0.38 0 0 0 2.5 0 0 0 0 0 0 0 0 2.6 0 0
T1
T2
T3
High
Site
Low
T3
COACHES
ISLAND
8/22/01.
note: T1Q1
& T2Q2 on
sandy dune.
T1Q4 also
sandy
T4
FRONT
CREEK
8/20/01.
Note: T1Q2,
T1Q3, T2Q3,
T3Q2 had 2-
6" water
T4
T2
LOW
HIGH
SITE
T1
altern
iflo
ra
% C
over
pate
ns
% C
over
Dis
tichlis
% C
over
Juncus r
.
% C
over
Iva
% C
over
Phra
g
% C
over
Scirpus r
.
% C
over
Solid
ago s
.
% C
over
Scirpus o
.
% C
over
Aste
r t.
% C
over
Atr
iple
x
% C
over
Am
era
nth
us c
.
% C
over
Salic
orn
ia
% C
over
Lim
oniu
m
% C
over
Plu
chea
% C
over
Lyth
rum
% C
over
Teucrium
% C
over
cynosuro
ides
% C
over
Koste
letz
kya
% C
over
bare
gro
und
% C
over
log
% C
over
dead P
hra
g.
% C
over
Qu
ad
rat
#
SITE
NAME
Tra
ns
ec
t #
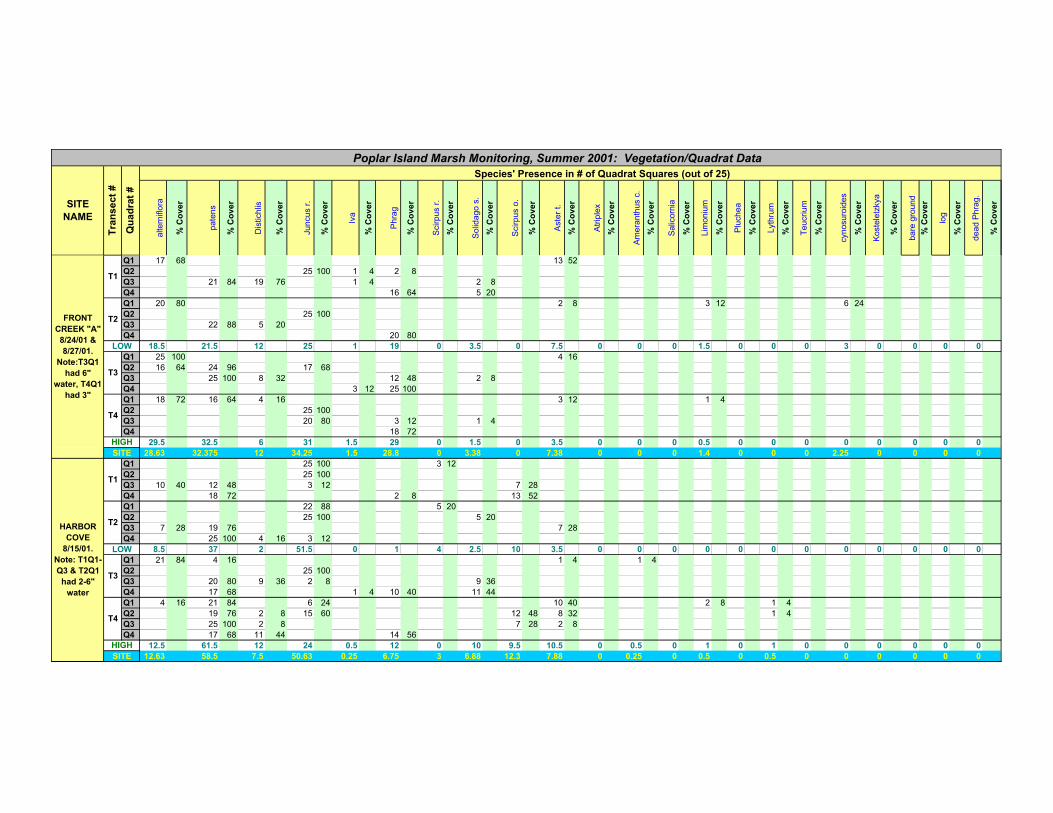
Poplar Island Marsh Monitoring, Summer 2001: Vegetation/Quadrat Data
Species' Presence in # of Quadrat Squares (out of 25)
Q1 17 68 13 52
Q2 25 100 1 4 2 8
Q3 21 84 19 76 1 4 2 8
Q4 16 64 5 20
Q1 20 80 2 8 3 12 6 24
Q2 25 100
Q3 22 88 5 20
Q4 20 80
18.5 21.5 12 25 1 19 0 3.5 0 7.5 0 0 0 1.5 0 0 0 3 0 0 0 0
Q1 25 100 4 16
Q2 16 64 24 96 17 68
Q3 25 100 8 32 12 48 2 8
Q4 3 12 25 100
Q1 18 72 16 64 4 16 3 12 1 4
Q2 25 100
Q3 20 80 3 12 1 4
Q4 18 72
29.5 32.5 6 31 1.5 29 0 1.5 0 3.5 0 0 0 0.5 0 0 0 0 0 0 0 0
28.63 32.375 12 34.25 1.5 28.8 0 3.38 0 7.38 0 0 0 1.4 0 0 0 2.25 0 0 0 0
Q1 25 100 3 12
Q2 25 100
Q3 10 40 12 48 3 12 7 28
Q4 18 72 2 8 13 52
Q1 22 88 5 20
Q2 25 100 5 20
Q3 7 28 19 76 7 28
Q4 25 100 4 16 3 12
8.5 37 2 51.5 0 1 4 2.5 10 3.5 0 0 0 0 0 0 0 0 0 0 0 0
Q1 21 84 4 16 1 4 1 4
Q2 25 100
Q3 20 80 9 36 2 8 9 36
Q4 17 68 1 4 10 40 11 44
Q1 4 16 21 84 6 24 10 40 2 8 1 4
Q2 19 76 2 8 15 60 12 48 8 32 1 4
Q3 25 100 2 8 7 28 2 8
Q4 17 68 11 44 14 56
12.5 61.5 12 24 0.5 12 0 10 9.5 10.5 0 0.5 0 1 0 1 0 0 0 0 0 0
12.63 58.5 7.5 50.63 0.25 6.75 3 6.88 12.3 7.88 0 0.25 0 0.5 0 0.5 0 0 0 0 0 0
T1
T3
T2
T3
T4
T1
HIGH
SITE
T4
HARBOR
COVE
8/15/01.
Note: T1Q1-
Q3 & T2Q1
had 2-6"
water
LOW
LOW
HIGH
SITE
FRONT
CREEK "A"
8/24/01 &
8/27/01.
Note:T3Q1
had 6"
water, T4Q1
had 3"
T2
altern
iflo
ra
% C
over
pate
ns
% C
over
Dis
tichlis
% C
over
Juncus r
.
% C
over
Iva
% C
over
Phra
g
% C
over
Scirpus r
.
% C
over
Solid
ago s
.
% C
over
Scirpus o
.
% C
over
Aste
r t.
% C
over
Atr
iple
x
% C
over
Am
era
nth
us c
.
% C
over
Salic
orn
ia
% C
over
Lim
oniu
m
% C
over
Plu
chea
% C
over
Lyth
rum
% C
over
Teucrium
% C
over
cynosuro
ides
% C
over
Koste
letz
kya
% C
over
bare
gro
und
% C
over
log
% C
over
dead P
hra
g.
% C
over
Qu
ad
rat
#
SITE
NAME
Tra
ns
ec
t #
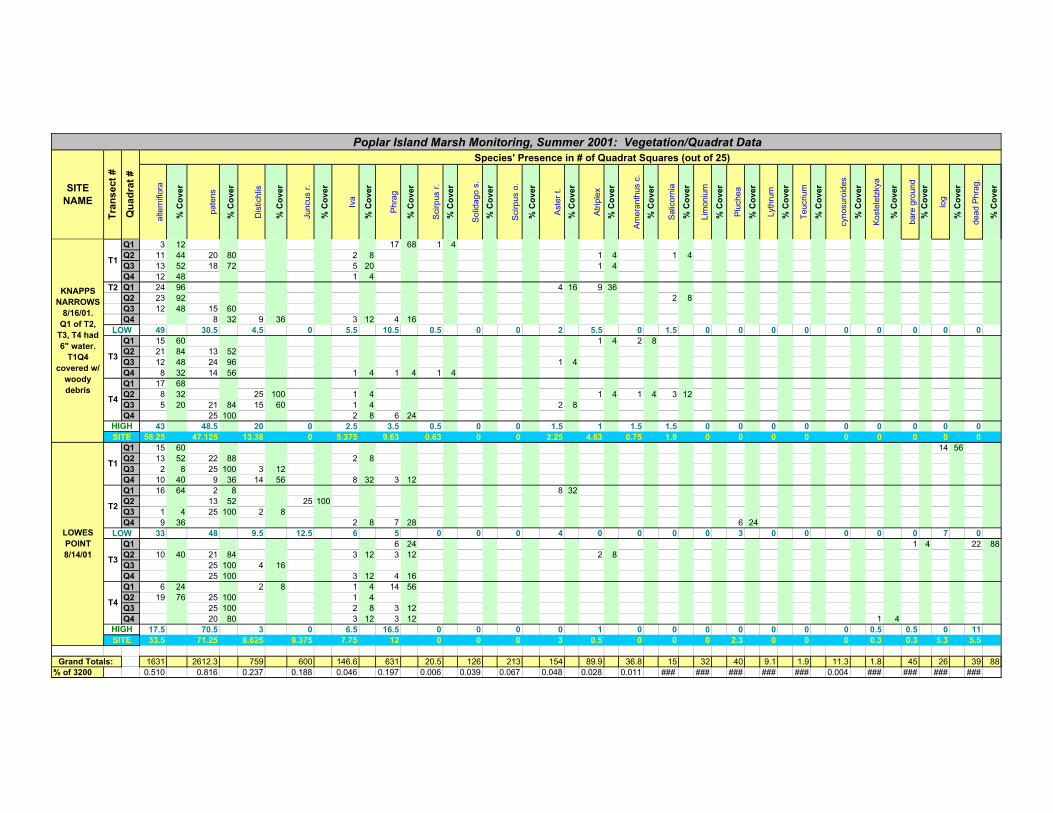
Poplar Island Marsh Monitoring, Summer 2001: Vegetation/Quadrat Data
Species' Presence in # of Quadrat Squares (out of 25)
Q1 3 12 17 68 1 4
Q2 11 44 20 80 2 8 1 4 1 4
Q3 13 52 18 72 5 20 1 4
Q4 12 48 1 4
T2 Q1 24 96 4 16 9 36
Q2 23 92 2 8
Q3 12 48 15 60
Q4 8 32 9 36 3 12 4 16
49 30.5 4.5 0 5.5 10.5 0.5 0 0 2 5.5 0 1.5 0 0 0 0 0 0 0 0 0
Q1 15 60 1 4 2 8
Q2 21 84 13 52
Q3 12 48 24 96 1 4
Q4 8 32 14 56 1 4 1 4 1 4
Q1 17 68
Q2 8 32 25 100 1 4 1 4 1 4 3 12
Q3 5 20 21 84 15 60 1 4 2 8
Q4 25 100 2 8 6 24
43 48.5 20 0 2.5 3.5 0.5 0 0 1.5 1 1.5 1.5 0 0 0 0 0 0 0 0 0
58.25 47.125 13.38 0 5.375 9.63 0.63 0 0 2.25 4.63 0.75 1.9 0 0 0 0 0 0 0 0 0
Q1 15 60 14 56
Q2 13 52 22 88 2 8
Q3 2 8 25 100 3 12
Q4 10 40 9 36 14 56 8 32 3 12
Q1 16 64 2 8 8 32
Q2 13 52 25 100
Q3 1 4 25 100 2 8
Q4 9 36 2 8 7 28 6 24
33 48 9.5 12.5 6 5 0 0 0 4 0 0 0 0 3 0 0 0 0 0 7 0
Q1 6 24 1 4 22 88
Q2 10 40 21 84 3 12 3 12 2 8
Q3 25 100 4 16
Q4 25 100 3 12 4 16
Q1 6 24 2 8 1 4 14 56
Q2 19 76 25 100 1 4
Q3 25 100 2 8 3 12
Q4 20 80 3 12 3 12 1 4
17.5 70.5 3 0 6.5 16.5 0 0 0 0 1 0 0 0 0 0 0 0 0.5 0.5 0 11
33.5 71.25 8.625 9.375 7.75 12 0 0 0 3 0.5 0 0 0 2.3 0 0 0 0.3 0.3 5.3 5.5
1631 2612.3 759 600 146.6 631 20.5 126 213 154 89.9 36.8 15 32 40 9.1 1.9 11.3 1.8 45 26 39 88
% of 3200 0.510 0.816 0.237 0.188 0.046 0.197 0.006 0.039 0.067 0.048 0.028 0.011 ### ### ### ### ### 0.004 ### ### ### ###
Grand Totals:
T3
T4
T1
T1
KNAPPS
NARROWS
8/16/01.
Q1 of T2,
T3, T4 had
6" water.
T1Q4
covered w/
woody
debris
SITE
T3
LOWES
POINT
8/14/01
HIGH
SITE
T2
LOW
LOW
HIGH
T4

Vegetation/Segment Data: Raw vegetation community co mposition data
altern
iflo
ra
pate
ns
Dis
tichlis
Juncus r
.
Iva
Phra
g
Scirpus r
.
Solid
ago s
.
Scirpus o
.
Aste
r t.
Atr
iple
x
Am
era
nth
us c
.
Salic
orn
ia
Lim
oniu
m
Plu
chea
Lyth
rum
Teucrium
cynosuro
ides
Koste
letz
kya
Seta
ria p
arv
aflora
dodder
Am
moph. bre
vil.
Hib
iscus m
.
Germ
ander
Ipom
oea s
.
sw
itch g
rass
Baccharis
Loblo
lly p
ine
N(N
-1)
SU
M n
i(n
i-1)
Sim
pso
n's
Div
er.
Ind
ex
Avg
. S
.D.I
Lo
wM
ars
h
Avg
. S
.D.I
Hig
hM
ars
h
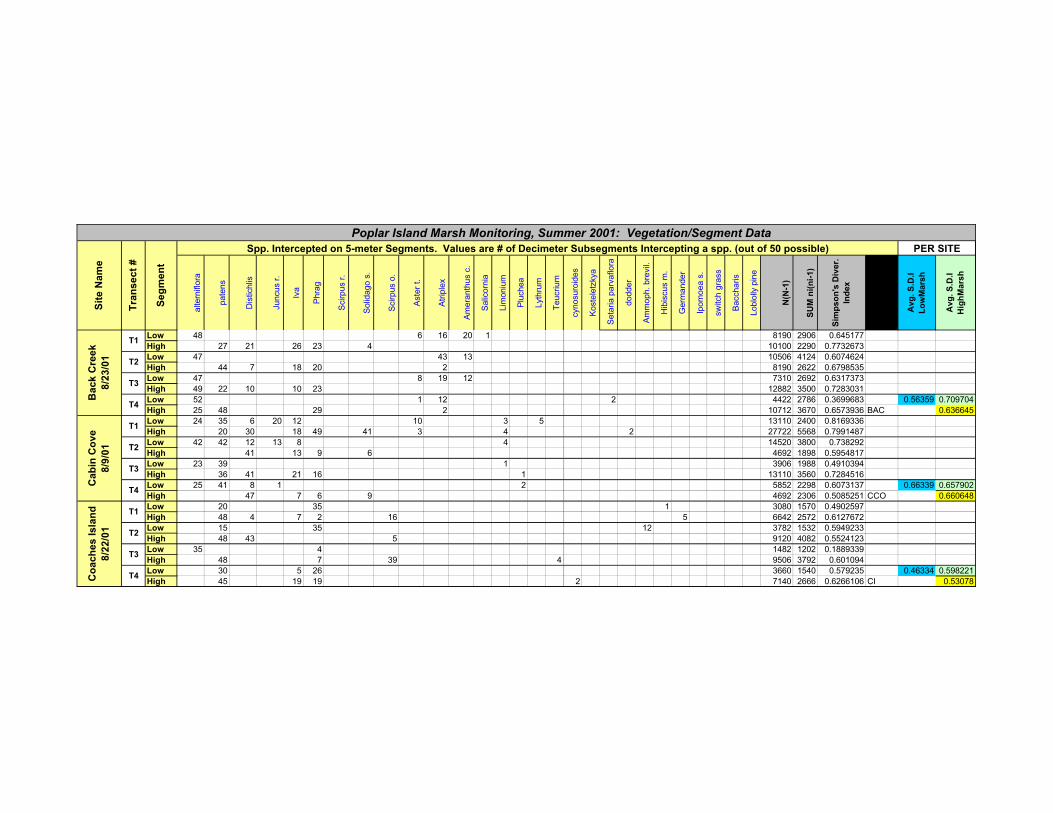
Low 48 6 16 20 1 8190 2906 0.645177
High 27 21 26 23 4 10100 2290 0.7732673
Low 47 43 13 10506 4124 0.6074624
High 44 7 18 20 2 8190 2622 0.6798535
Low 47 8 19 12 7310 2692 0.6317373
High 49 22 10 10 23 12882 3500 0.7283031
Low 52 1 12 2 4422 2786 0.3699683 0.56359 0.709704
High 25 48 29 2 10712 3670 0.6573936 BAC 0.636645
Low 24 35 6 20 12 10 3 5 13110 2400 0.8169336
High 20 30 18 49 41 3 4 2 27722 5568 0.7991487
Low 42 42 12 13 8 4 14520 3800 0.738292
High 41 13 9 6 4692 1898 0.5954817
Low 23 39 1 3906 1988 0.4910394
High 36 41 21 16 1 13110 3560 0.7284516
Low 25 41 8 1 2 5852 2298 0.6073137 0.66339 0.657902
High 47 7 6 9 4692 2306 0.5085251 CCO 0.660648
Low 20 35 1 3080 1570 0.4902597
High 48 4 7 2 16 5 6642 2572 0.6127672
Low 15 35 12 3782 1532 0.5949233
High 48 43 5 9120 4082 0.5524123
Low 35 4 1482 1202 0.1889339
High 48 7 39 4 9506 3792 0.601094
Low 30 5 26 3660 1540 0.579235 0.46334 0.598221
High 45 19 19 2 7140 2666 0.6266106 CI 0.53078
Poplar Island Marsh Monitoring, Summer 2001: Vegetation/Segment Data
Tra
ns
ec
t #
Sit
e N
am
e
T1
T2
Ba
ck
Cre
ek
8/2
3/0
1
Ca
bin
Co
ve
8/9
/01
Co
ac
he
s I
sla
nd
8/2
2/0
1
T4
T2
T3
T4
Se
gm
en
t
T3
T4
T1
T2
T3
PER SITESpp. Intercepted on 5-meter Segments. Values are # of Decimeter Subsegments Intercepting a spp. (out of 50 possible)
T1
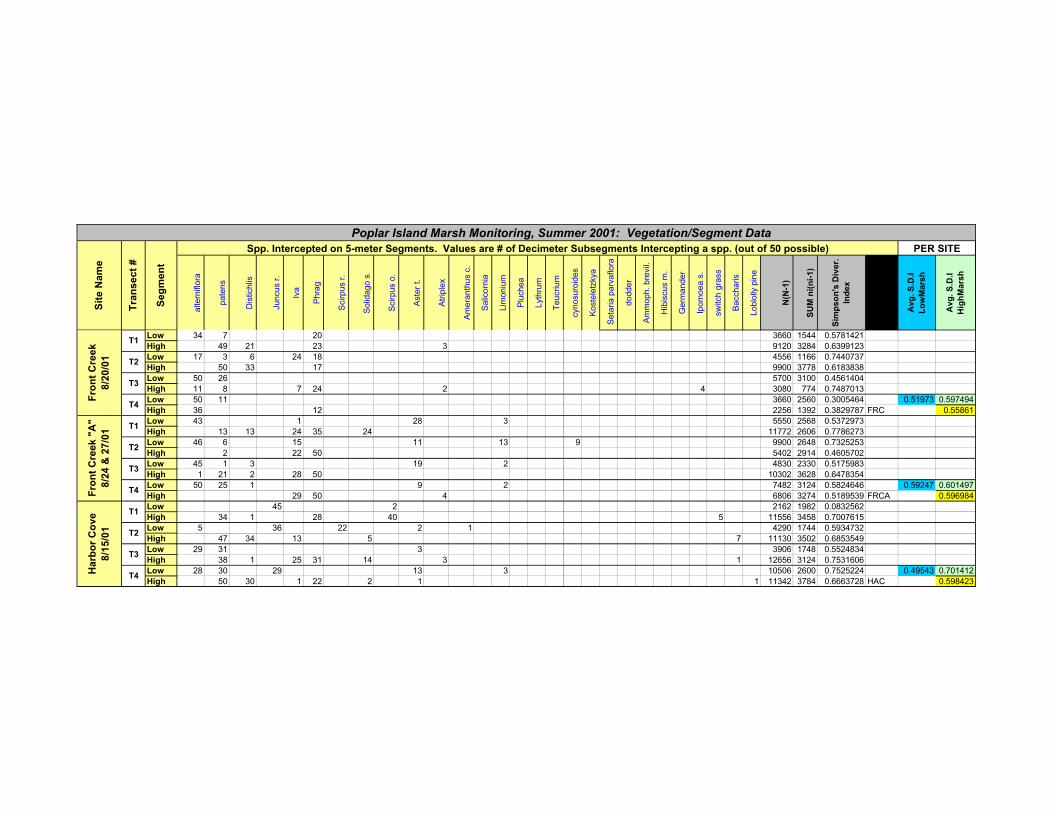
altern
iflo
ra
pate
ns
Dis
tichlis
Juncus r
.
Iva
Phra
g
Scirpus r
.
Solid
ago s
.
Scirpus o
.
Aste
r t.
Atr
iple
x
Am
era
nth
us c
.
Salic
orn
ia
Lim
oniu
m
Plu
chea
Lyth
rum
Teucrium
cynosuro
ides
Koste
letz
kya
Seta
ria p
arv
aflora
dodder
Am
moph. bre
vil.
Hib
iscus m
.
Germ
ander
Ipom
oea s
.
sw
itch g
rass
Baccharis
Loblo
lly p
ine
N(N
-1)
SU
M n
i(n
i-1)
Sim
pso
n's
Div
er.
Ind
ex
Avg
. S
.D.I
Lo
wM
ars
h
Avg
. S
.D.I
Hig
hM
ars
h
Poplar Island Marsh Monitoring, Summer 2001: Vegetation/Segment Data
Tra
ns
ec
t #
Sit
e N
am
e
Se
gm
en
t
PER SITESpp. Intercepted on 5-meter Segments. Values are # of Decimeter Subsegments Intercepting a spp. (out of 50 possible)
Low 34 7 20 3660 1544 0.5781421
High 49 21 23 3 9120 3284 0.6399123
Low 17 3 6 24 18 4556 1166 0.7440737
High 50 33 17 9900 3778 0.6183838
Low 50 26 5700 3100 0.4561404
High 11 8 7 24 2 4 3080 774 0.7487013
Low 50 11 3660 2560 0.3005464 0.51973 0.597494
High 36 12 2256 1392 0.3829787 FRC 0.55861
Low 43 1 28 3 5550 2568 0.5372973
High 13 13 24 35 24 11772 2606 0.7786273
Low 46 6 15 11 13 9 9900 2648 0.7325253
High 2 22 50 5402 2914 0.4605702
Low 45 1 3 19 2 4830 2330 0.5175983
High 1 21 2 28 50 10302 3628 0.6478354
Low 50 25 1 9 2 7482 3124 0.5824646 0.59247 0.601497
High 29 50 4 6806 3274 0.5189539 FRCA 0.596984
Low 45 2 2162 1982 0.0832562
High 34 1 28 40 5 11556 3458 0.7007615
Low 5 36 22 2 1 4290 1744 0.5934732
High 47 34 13 5 7 11130 3502 0.6853549
Low 29 31 3 3906 1748 0.5524834
High 38 1 25 31 14 3 1 12656 3124 0.7531606
Low 28 30 29 13 3 10506 2600 0.7525224 0.49543 0.701412
High 50 30 1 22 2 1 1 11342 3784 0.6663728 HAC 0.598423
Fro
nt
Cre
ek
"A
"
8/2
4 &
27
/01
T3
T4
T1
T2
Fro
nt
Cre
ek
8/2
0/0
1
T3
Ha
rbo
r C
ov
e
8/1
5/0
1
T1
T2
T1
T2
T3
T4
T4
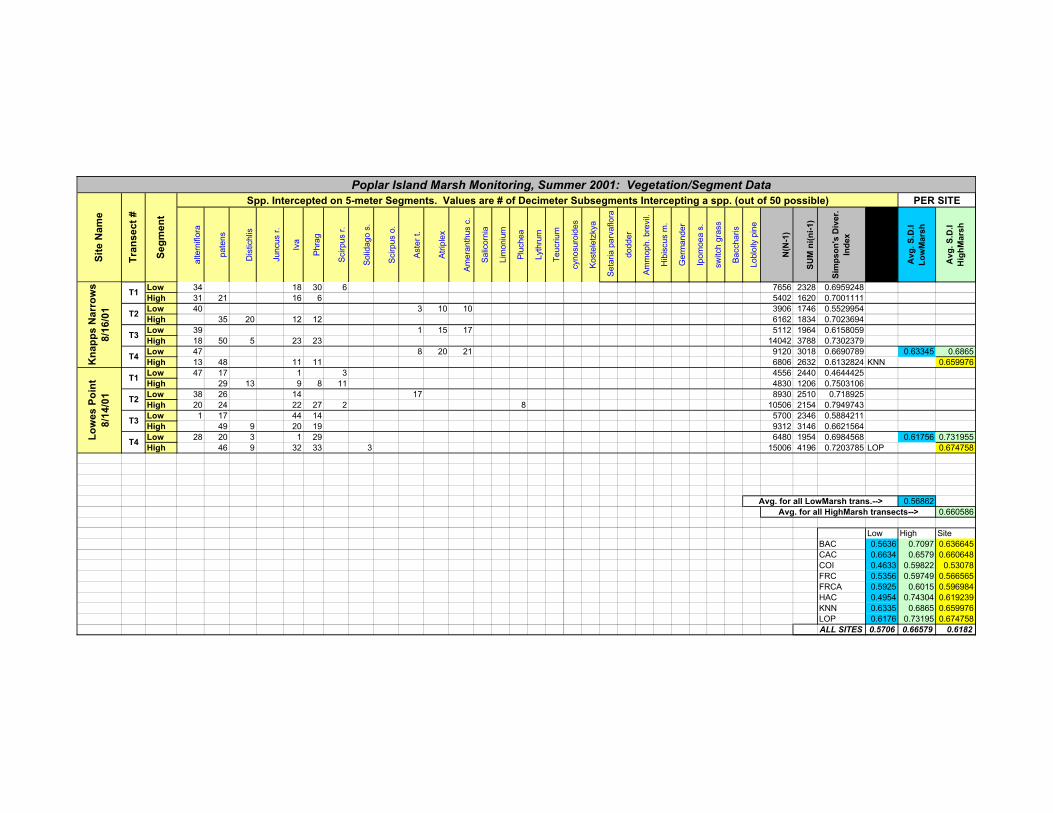
altern
iflo
ra
pate
ns
Dis
tichlis
Juncus r
.
Iva
Phra
g
Scirpus r
.
Solid
ago s
.
Scirpus o
.
Aste
r t.
Atr
iple
x
Am
era
nth
us c
.
Salic
orn
ia
Lim
oniu
m
Plu
chea
Lyth
rum
Teucrium
cynosuro
ides
Koste
letz
kya
Seta
ria p
arv
aflora
dodder
Am
moph. bre
vil.
Hib
iscus m
.
Germ
ander
Ipom
oea s
.
sw
itch g
rass
Baccharis
Loblo
lly p
ine
N(N
-1)
SU
M n
i(n
i-1)
Sim
pso
n's
Div
er.
Ind
ex
Avg
. S
.D.I
Lo
wM
ars
h
Avg
. S
.D.I
Hig
hM
ars
h
Poplar Island Marsh Monitoring, Summer 2001: Vegetation/Segment Data
Tra
ns
ec
t #
Sit
e N
am
e
Se
gm
en
t
PER SITESpp. Intercepted on 5-meter Segments. Values are # of Decimeter Subsegments Intercepting a spp. (out of 50 possible)
Low 34 18 30 6 7656 2328 0.6959248
High 31 21 16 6 5402 1620 0.7001111
Low 40 3 10 10 3906 1746 0.5529954
High 35 20 12 12 6162 1834 0.7023694
Low 39 1 15 17 5112 1964 0.6158059
High 18 50 5 23 23 14042 3788 0.7302379
Low 47 8 20 21 9120 3018 0.6690789 0.63345 0.6865
High 13 48 11 11 6806 2632 0.6132824 KNN 0.659976
Low 47 17 1 3 4556 2440 0.4644425
High 29 13 9 8 11 4830 1206 0.7503106
Low 38 26 14 17 8930 2510 0.718925
High 20 24 22 27 2 8 10506 2154 0.7949743
Low 1 17 44 14 5700 2346 0.5884211
High 49 9 20 19 9312 3146 0.6621564
Low 28 20 3 1 29 6480 1954 0.6984568 0.61756 0.731955
High 46 9 32 33 3 15006 4196 0.7203785 LOP 0.674758
0.56862
0.660586
Low High Site
BAC 0.5636 0.7097 0.636645
CAC 0.6634 0.6579 0.660648
COI 0.4633 0.59822 0.53078
FRC 0.5356 0.59749 0.566565
FRCA 0.5925 0.6015 0.596984
HAC 0.4954 0.74304 0.619239
KNN 0.6335 0.6865 0.659976
LOP 0.6176 0.73195 0.674758
ALL SITES 0.5706 0.66579 0.6182
Lo
we
s P
oin
t
8/1
4/0
1
Kn
ap
ps
Na
rro
ws
8/1
6/0
1
T3
T4
T3
T4
T1
T2
Avg. for all HighMarsh transects-->
Avg. for all LowMarsh trans.-->
T1
T2
APPENDIX E
Faunal/Q uadrat Da ta: Raw fa unal community diversity data
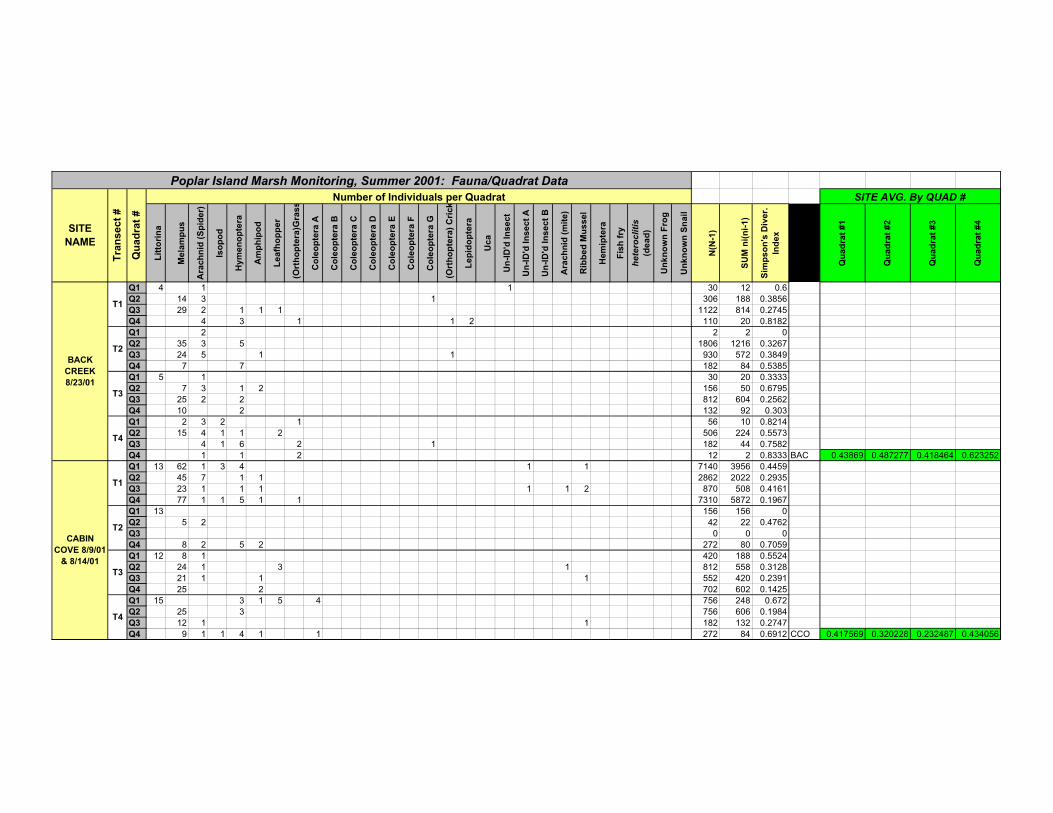
Lit
tori
na
Mela
mp
us
Ara
ch
nid
(S
pid
er)
Iso
po
d
Hym
en
op
tera
Am
ph
ipo
d
Le
afh
op
pe
r
(Ort
ho
pte
ra)G
ras
s
Co
leo
pte
ra A
Co
leo
pte
ra B
Co
leo
pte
ra C
Co
leo
pte
ra D
Co
leo
pte
ra E
Co
leo
pte
ra F
Co
leo
pte
ra G
(Ort
ho
pte
ra)
Cri
ck
Le
pid
op
tera
Uc
a
Un
-ID
'd In
sect
Un
-ID
'd In
sect
A
Un
-ID
'd In
sect
B
Ara
ch
nid
(m
ite)
Rib
be
d M
us
se
l
Hem
ipte
ra
Fis
h f
ry
hete
rocliti
s
(de
ad
)
Un
kn
ow
n F
rog
Un
kn
ow
n S
na
il
N(N
-1)
SU
M n
i(n
i-1)
Sim
pso
n's
Div
er.
Ind
ex
Qu
ad
rat
#1
Qu
ad
rat
#2
Qu
ad
rat
#3
Qu
ad
rat
#4
Q1 4 1 1 30 12 0.6
Q2 14 3 1 306 188 0.3856
Q3 29 2 1 1 1 1122 814 0.2745
Q4 4 3 1 1 2 110 20 0.8182
Q1 2 2 2 0
Q2 35 3 5 1806 1216 0.3267
Q3 24 5 1 1 930 572 0.3849
Q4 7 7 182 84 0.5385
Q1 5 1 30 20 0.3333
Q2 7 3 1 2 156 50 0.6795
Q3 25 2 2 812 604 0.2562
Q4 10 2 132 92 0.303
Q1 2 3 2 1 56 10 0.8214
Q2 15 4 1 1 2 506 224 0.5573
Q3 4 1 6 2 1 182 44 0.7582
Q4 1 1 2 12 2 0.8333 BAC 0.43869 0.487277 0.418464 0.623252
Q1 13 62 1 3 4 1 1 7140 3956 0.4459
Q2 45 7 1 1 2862 2022 0.2935
Q3 23 1 1 1 1 1 2 870 508 0.4161
Q4 77 1 1 5 1 1 7310 5872 0.1967
Q1 13 156 156 0
Q2 5 2 42 22 0.4762
Q3 0 0 0
Q4 8 2 5 2 272 80 0.7059
Q1 12 8 1 420 188 0.5524
Q2 24 1 3 1 812 558 0.3128
Q3 21 1 1 1 552 420 0.2391
Q4 25 2 702 602 0.1425
Q1 15 3 1 5 4 756 248 0.672
Q2 25 3 756 606 0.1984
Q3 12 1 1 182 132 0.2747
Q4 9 1 1 4 1 1 272 84 0.6912 CCO 0.417569 0.320228 0.232487 0.434056
Number of Individuals per Quadrat
Poplar Island Marsh Monitoring, Summer 2001: Fauna/Quadrat Data
SITE AVG. By QUAD #
T1
T2
T3
T4
T1
T2
T3
T4
SITE
NAME
Tra
nsect
#
BACK
CREEK
8/23/01
Qu
ad
rat
#
CABIN
COVE 8/9/01
& 8/14/01
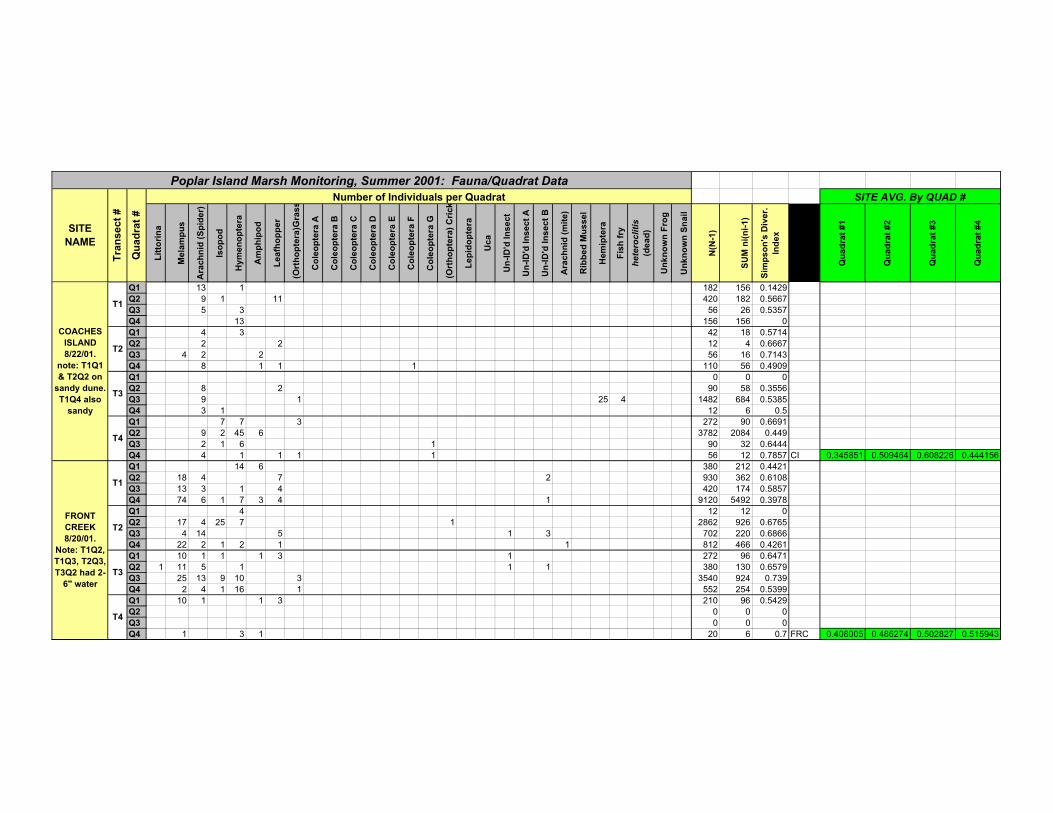
Lit
tori
na
Mela
mp
us
Ara
ch
nid
(S
pid
er)
Iso
po
d
Hym
en
op
tera
Am
ph
ipo
d
Le
afh
op
pe
r
(Ort
ho
pte
ra)G
ras
s
Co
leo
pte
ra A
Co
leo
pte
ra B
Co
leo
pte
ra C
Co
leo
pte
ra D
Co
leo
pte
ra E
Co
leo
pte
ra F
Co
leo
pte
ra G
(Ort
ho
pte
ra)
Cri
ck
Le
pid
op
tera
Uc
a
Un
-ID
'd In
sect
Un
-ID
'd In
sect
A
Un
-ID
'd In
sect
B
Ara
ch
nid
(m
ite)
Rib
be
d M
us
se
l
Hem
ipte
ra
Fis
h f
ry
hete
rocliti
s
(de
ad
)
Un
kn
ow
n F
rog
Un
kn
ow
n S
na
il
N(N
-1)
SU
M n
i(n
i-1)
Sim
pso
n's
Div
er.
Ind
ex
Qu
ad
rat
#1
Qu
ad
rat
#2
Qu
ad
rat
#3
Qu
ad
rat
#4
Number of Individuals per Quadrat
Poplar Island Marsh Monitoring, Summer 2001: Fauna/Quadrat Data
SITE AVG. By QUAD #
SITE
NAME
Tra
nsect
#
Qu
ad
rat
#
Q1 13 1 182 156 0.1429
Q2 9 1 11 420 182 0.5667
Q3 5 3 56 26 0.5357
Q4 13 156 156 0
Q1 4 3 42 18 0.5714
Q2 2 2 12 4 0.6667
Q3 4 2 2 56 16 0.7143
Q4 8 1 1 1 110 56 0.4909
Q1 0 0 0
Q2 8 2 90 58 0.3556
Q3 9 1 25 4 1482 684 0.5385
Q4 3 1 12 6 0.5
Q1 7 7 3 272 90 0.6691
Q2 9 2 45 6 3782 2084 0.449
Q3 2 1 6 1 90 32 0.6444
Q4 4 1 1 1 1 56 12 0.7857 CI 0.345851 0.509464 0.608226 0.444156
Q1 14 6 380 212 0.4421
Q2 18 4 7 2 930 362 0.6108
Q3 13 3 1 4 420 174 0.5857
Q4 74 6 1 7 3 4 1 9120 5492 0.3978
Q1 4 12 12 0
Q2 17 4 25 7 1 2862 926 0.6765
Q3 4 14 5 1 3 702 220 0.6866
Q4 22 2 1 2 1 1 812 466 0.4261
Q1 10 1 1 1 3 1 272 96 0.6471
Q2 1 11 5 1 1 1 380 130 0.6579
Q3 25 13 9 10 3 3540 924 0.739
Q4 2 4 1 16 1 552 254 0.5399
Q1 10 1 1 3 210 96 0.5429
Q2 0 0 0
Q3 0 0 0
Q4 1 3 1 20 6 0.7 FRC 0.408005 0.486274 0.502827 0.515943
T2
T3
T4
T1
T1
T2
T3
T4
COACHES
ISLAND
8/22/01.
note: T1Q1
& T2Q2 on
sandy dune.
T1Q4 also
sandy
FRONT
CREEK
8/20/01.
Note: T1Q2,
T1Q3, T2Q3,
T3Q2 had 2-
6" water

Lit
tori
na
Mela
mp
us
Ara
ch
nid
(S
pid
er)
Iso
po
d
Hym
en
op
tera
Am
ph
ipo
d
Le
afh
op
pe
r
(Ort
ho
pte
ra)G
ras
s
Co
leo
pte
ra A
Co
leo
pte
ra B
Co
leo
pte
ra C
Co
leo
pte
ra D
Co
leo
pte
ra E
Co
leo
pte
ra F
Co
leo
pte
ra G
(Ort
ho
pte
ra)
Cri
ck
Le
pid
op
tera
Uc
a
Un
-ID
'd In
sect
Un
-ID
'd In
sect
A
Un
-ID
'd In
sect
B
Ara
ch
nid
(m
ite)
Rib
be
d M
us
se
l
Hem
ipte
ra
Fis
h f
ry
hete
rocliti
s
(de
ad
)
Un
kn
ow
n F
rog
Un
kn
ow
n S
na
il
N(N
-1)
SU
M n
i(n
i-1)
Sim
pso
n's
Div
er.
Ind
ex
Qu
ad
rat
#1
Qu
ad
rat
#2
Qu
ad
rat
#3
Qu
ad
rat
#4
Number of Individuals per Quadrat
Poplar Island Marsh Monitoring, Summer 2001: Fauna/Quadrat Data
SITE AVG. By QUAD #
SITE
NAME
Tra
nsect
#
Qu
ad
rat
#
Q1 36 1 1332 1260 0.0541
Q2 8 4 1 1 182 68 0.6264
Q3 34 1 7 1 1 1892 1164 0.3848
Q4 5 3 4 13 1 650 194 0.7015
Q1 53 2756 2756 0
Q2 4 1 1 30 12 0.6
Q3 27 4 930 714 0.2323
Q4 16 1 1 306 240 0.2157
Q1 110 1 8 14042 12046 0.1421
Q2 4 19 2 2 702 358 0.49
Q3 16 6 5 2 1 870 292 0.6644
Q4 50 11 1 3782 2560 0.3231
Q1 65 15 2 6642 4372 0.3418
Q2 29 7 1 1332 854 0.3589
Q3 45 11 7 1 2 2 4556 2136 0.5312
Q4 8 1 1 4 1 210 68 0.6762 FRCA 0.134491 0.518815 0.453143 0.479131
Q1 39 1 1560 1482 0.05
Q2 3 1 1 20 6 0.7
Q3 2 2 1 20 4 0.8
Q4 4 2 1 1 1 72 14 0.8056
Q1 5 2 42 22 0.4762
Q2 2 4 1 42 14 0.6667
Q3 34 1 2 1332 1124 0.1562
Q4 1 13 12 2 1 2 1 992 292 0.7056
Q1 33 1 2 3 1482 1064 0.2821
Q2 6 5 2 1 182 52 0.7143
Q3 7 3 1 110 48 0.5636
Q4 8 8 10 6 2 1122 234 0.7914
Q1 27 2 812 704 0.133
Q2 15 3 1 1 380 216 0.4316
Q3 22 17 1 2 1 1806 736 0.5925
Q4 11 8 4 1 1 2 702 180 0.7436 HAC 0.235312 0.628133 0.528066 0.761559
T1
T4
T2
T2
T3
T4
T1
FRONT
CREEK "A"
8/24/01 &
8/27/01.
Note:T3Q1
had 6"
water, T4Q1
had 3"
HARBOR
COVE
8/15/01.
Note: T1Q1-
Q3 & T2Q1
had 2-6"
water
T3
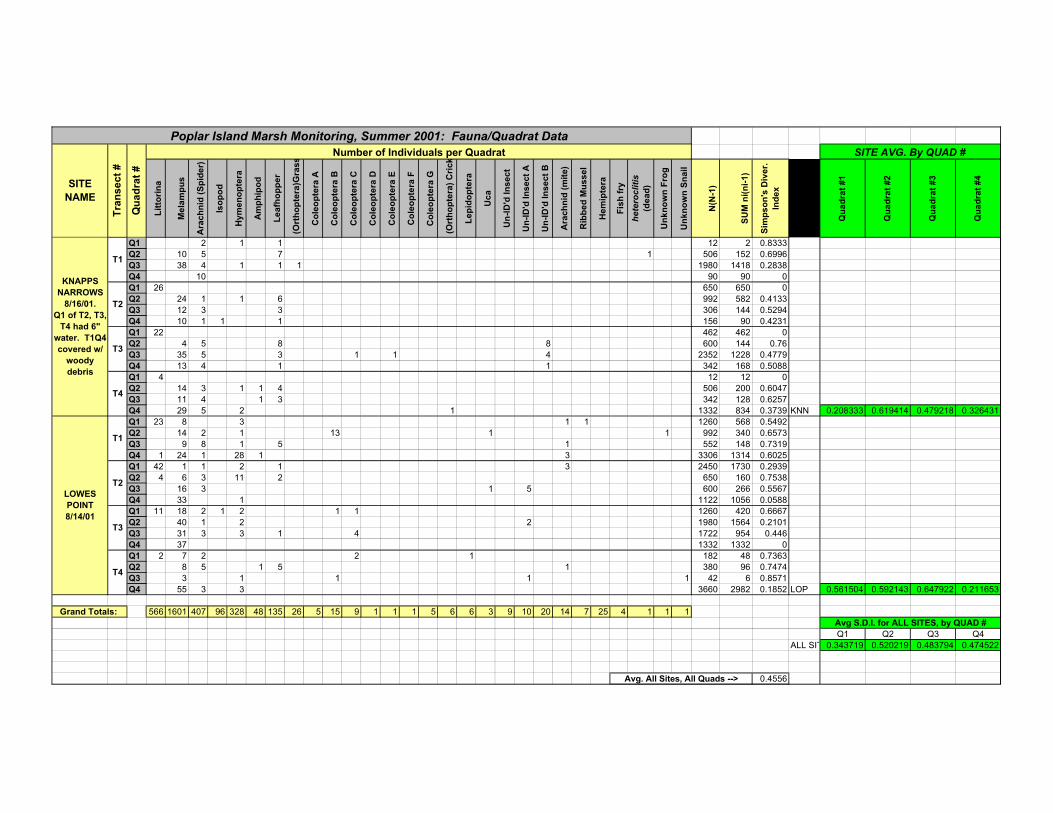
Lit
tori
na
Mela
mp
us
Ara
ch
nid
(S
pid
er)
Iso
po
d
Hym
en
op
tera
Am
ph
ipo
d
Le
afh
op
pe
r
(Ort
ho
pte
ra)G
ras
s
Co
leo
pte
ra A
Co
leo
pte
ra B
Co
leo
pte
ra C
Co
leo
pte
ra D
Co
leo
pte
ra E
Co
leo
pte
ra F
Co
leo
pte
ra G
(Ort
ho
pte
ra)
Cri
ck
Le
pid
op
tera
Uc
a
Un
-ID
'd In
sect
Un
-ID
'd In
sect
A
Un
-ID
'd In
sect
B
Ara
ch
nid
(m
ite)
Rib
be
d M
us
se
l
Hem
ipte
ra
Fis
h f
ry
hete
rocliti
s
(de
ad
)
Un
kn
ow
n F
rog
Un
kn
ow
n S
na
il
N(N
-1)
SU
M n
i(n
i-1)
Sim
pso
n's
Div
er.
Ind
ex
Qu
ad
rat
#1
Qu
ad
rat
#2
Qu
ad
rat
#3
Qu
ad
rat
#4
Number of Individuals per Quadrat
Poplar Island Marsh Monitoring, Summer 2001: Fauna/Quadrat Data
SITE AVG. By QUAD #
SITE
NAME
Tra
nsect
#
Qu
ad
rat
#
Q1 2 1 1 12 2 0.8333
Q2 10 5 7 1 506 152 0.6996
Q3 38 4 1 1 1 1980 1418 0.2838
Q4 10 90 90 0
Q1 26 650 650 0
Q2 24 1 1 6 992 582 0.4133
Q3 12 3 3 306 144 0.5294
Q4 10 1 1 1 156 90 0.4231
Q1 22 462 462 0
Q2 4 5 8 8 600 144 0.76
Q3 35 5 3 1 1 4 2352 1228 0.4779
Q4 13 4 1 1 342 168 0.5088
Q1 4 12 12 0
Q2 14 3 1 1 4 506 200 0.6047
Q3 11 4 1 3 342 128 0.6257
Q4 29 5 2 1 1332 834 0.3739 KNN 0.208333 0.619414 0.479218 0.326431
Q1 23 8 3 1 1 1260 568 0.5492
Q2 14 2 1 13 1 1 992 340 0.6573
Q3 9 8 1 5 1 552 148 0.7319
Q4 1 24 1 28 1 3 3306 1314 0.6025
Q1 42 1 1 2 1 3 2450 1730 0.2939
Q2 4 6 3 11 2 650 160 0.7538
Q3 16 3 1 5 600 266 0.5567
Q4 33 1 1122 1056 0.0588
Q1 11 18 2 1 2 1 1 1260 420 0.6667
Q2 40 1 2 2 1980 1564 0.2101
Q3 31 3 3 1 4 1722 954 0.446
Q4 37 1332 1332 0
Q1 2 7 2 2 1 182 48 0.7363
Q2 8 5 1 5 1 380 96 0.7474
Q3 3 1 1 1 1 42 6 0.8571
Q4 55 3 3 3660 2982 0.1852 LOP 0.561504 0.592143 0.647922 0.211653
566 1601 407 96 328 48 135 26 5 15 9 1 1 1 5 6 6 3 9 10 20 14 7 25 4 1 1 1
Q1 Q2 Q3 Q4
ALL SIT 0.343719 0.520219 0.483794 0.474522
0.4556
Avg S.D.I. for ALL SITES, by QUAD #
Avg. All Sites, All Quads -->
T4
T3
T1
Grand Totals:
LOWES
POINT
8/14/01
T3
T4
T2
KNAPPS
NARROWS
8/16/01.
Q1 of T2, T3,
T4 had 6"
water. T1Q4
covered w/
woody
debris
T1
T2
APPENDIX F
List of plant species observed during 2001 wetland vegetation monitoring
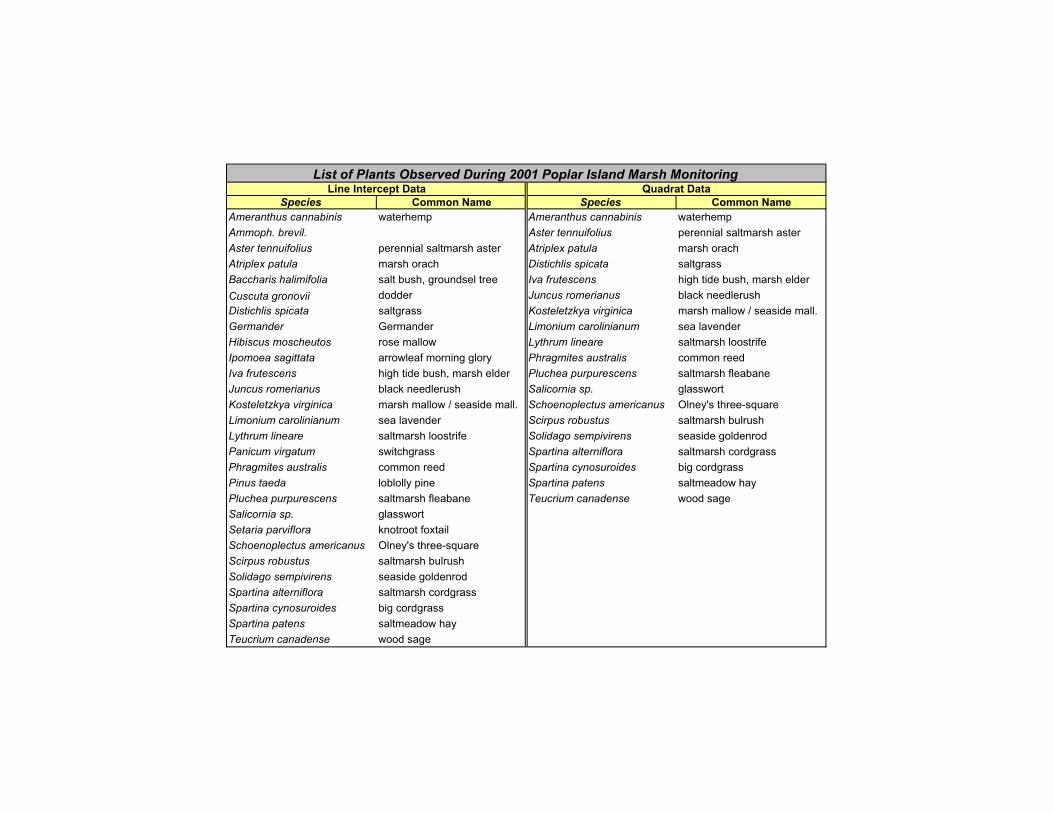
Species Common Name Species Common Name
Ameranthus cannabinis waterhemp Ameranthus cannabinis waterhemp
Ammoph. brevil. Aster tennuifolius perennial saltmarsh aster
Aster tennuifolius perennial saltmarsh aster Atriplex patula marsh orach
Atriplex patula marsh orach Distichlis spicata saltgrass
Baccharis halimifolia salt bush, groundsel tree Iva frutescens high tide bush, marsh elder
Cuscuta gronovii dodder Juncus romerianus black needlerush
Distichlis spicata saltgrass Kosteletzkya virginica marsh mallow / seaside mall.
Germander Germander Limonium carolinianum sea lavender
Hibiscus moscheutos rose mallow Lythrum lineare saltmarsh loostrife
Ipomoea sagittata arrowleaf morning glory Phragmites australis common reed
Iva frutescens high tide bush, marsh elder Pluchea purpurescens saltmarsh fleabane
Juncus romerianus black needlerush Salicornia sp. glasswort
Kosteletzkya virginica marsh mallow / seaside mall. Schoenoplectus americanus Olney's three-square
Limonium carolinianum sea lavender Scirpus robustus saltmarsh bulrush
Lythrum lineare saltmarsh loostrife Solidago sempivirens seaside goldenrod
Panicum virgatum switchgrass Spartina alterniflora saltmarsh cordgrass
Phragmites australis common reed Spartina cynosuroides big cordgrass
Pinus taeda loblolly pine Spartina patens saltmeadow hay
Pluchea purpurescens saltmarsh fleabane Teucrium canadense wood sage
Salicornia sp. glasswort
Setaria parviflora knotroot foxtail
Schoenoplectus americanus Olney's three-square
Scirpus robustus saltmarsh bulrush
Solidago sempivirens seaside goldenrod
Spartina alterniflora saltmarsh cordgrass
Spartina cynosuroides big cordgrass
Spartina patens saltmeadow hay
Teucrium canadense wood sage
Line Intercept Data Quadrat Data
List of Plants Observed During 2001 Poplar Island Marsh Monitoring