2 maps -...
TRANSCRIPT
Maps 23
2 Maps
A. Maps—their history and importance.
The earliest map was probably drawn in the dirt by an ab-origine sharing the whereabouts of water. Then perhapscame maps of territory-minded peoples in efforts to delin-eate land ownership. Then came navigation charts and thegeography of trade routes, etc.
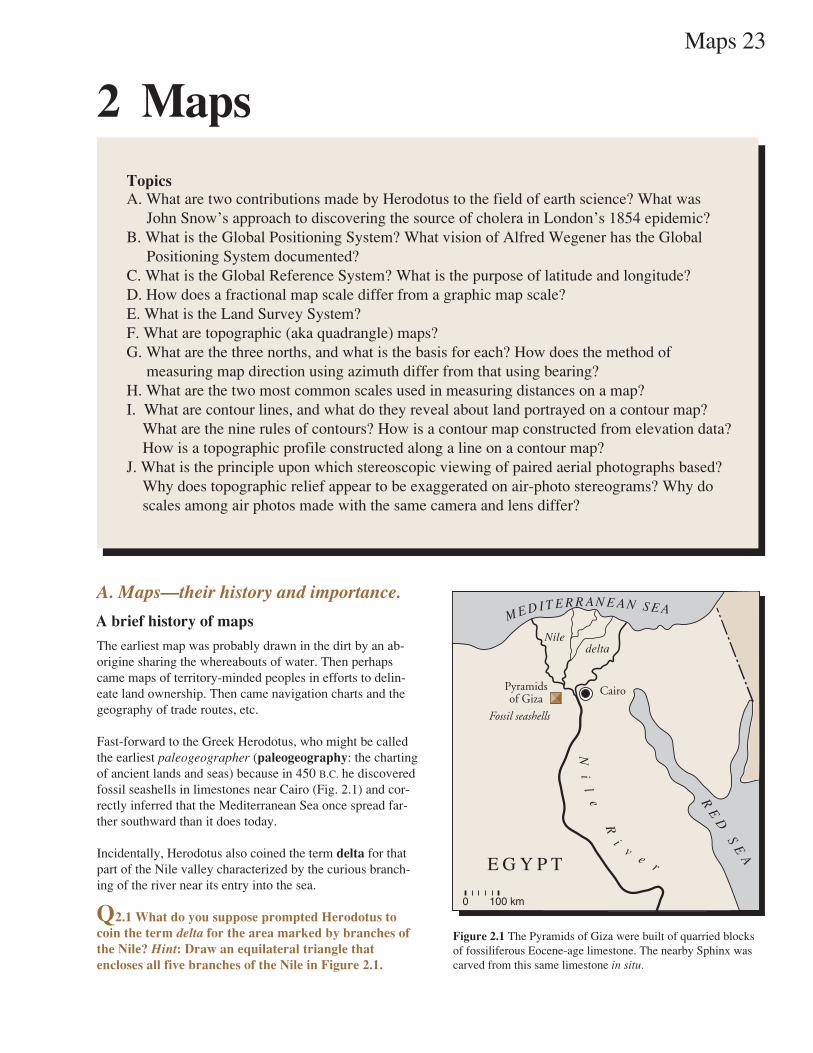
Fast-forward to the Greek Herodotus, who might be calledthe earliest paleogeographer (paleogeography: the chartingof ancient lands and seas) because in 450 B.C. he discoveredfossil seashells in limestones near Cairo (Fig. 2.1) and cor-rectly inferred that the Mediterranean Sea once spread far-ther southward than it does today.
Incidentally, Herodotus also coined the term delta for thatpart of the Nile valley characterized by the curious branch-ing of the river near its entry into the sea.
Q2.1 What do you suppose prompted Herodotus tocoin the term delta for the area marked by branches ofthe Nile? Hint: Draw an equilateral triangle thatencloses all five branches of the Nile in Figure 2.1.
Figure 2.1 The Pyramids of Giza were built of quarried blocksof fossiliferous Eocene-age limestone. The nearby Sphinx wascarved from this same limestone in situ.
TopicsA. What are two contributions made by Herodotus to the field of earth science? What was John Snow’s approach to discovering the source of cholera in London’s 1854 epidemic?B. What is the Global Positioning System? What vision of Alfred Wegener has the Global Positioning System documented?C. What is the Global Reference System? What is the purpose of latitude and longitude?D. How does a fractional map scale differ from a graphic map scale?E. What is the Land Survey System?F. What are topographic (aka quadrangle) maps?G. What are the three norths, and what is the basis for each? How does the method of measuring map direction using azimuth differ from that using bearing?H. What are the two most common scales used in measuring distances on a map?I. What are contour lines, and what do they reveal about land portrayed on a contour map? What are the nine rules of contours? How is a contour map constructed from elevation data? How is a topographic profile constructed along a line on a contour map?J. What is the principle upon which stereoscopic viewing of paired aerial photographs based? Why does topographic relief appear to be exaggerated on air-photo stereograms? Why do scales among air photos made with the same camera and lens differ?
A brief history of maps
E G Y P T
RE
D S
EA
Cairo
Ni
le
Ri
ve
r
M E D I T E R R A N E A N S E A
Fossil seashells
delta
Pyramidsof Giza
100 km0
Nile
24 Maps
A brief history of maps (cont.)—Fast-forward again,this time to Francis Bacon, noted British essayist. It was amap of the world that prompted Bacon in 1620 toexclaim, “I say!” (Or some such.)“It appears as though Africaand South America wereonce united and havesince drifted apart.”Alfred Wegener andothers eventuallycompiled abundantevidence in supportof ‘continental drift,’but it was a cursoryview of maps by Baconand others before him thatfirst suggested the notion.
Cholera—a disease of the small intestine, with severediarrhea, vomiting, and rapid dehydration. Mortalityrate of 50% if untreated.
In the 1800s, London community wells were shallowand subject to contamination by sewage—the breedingground of cholera.
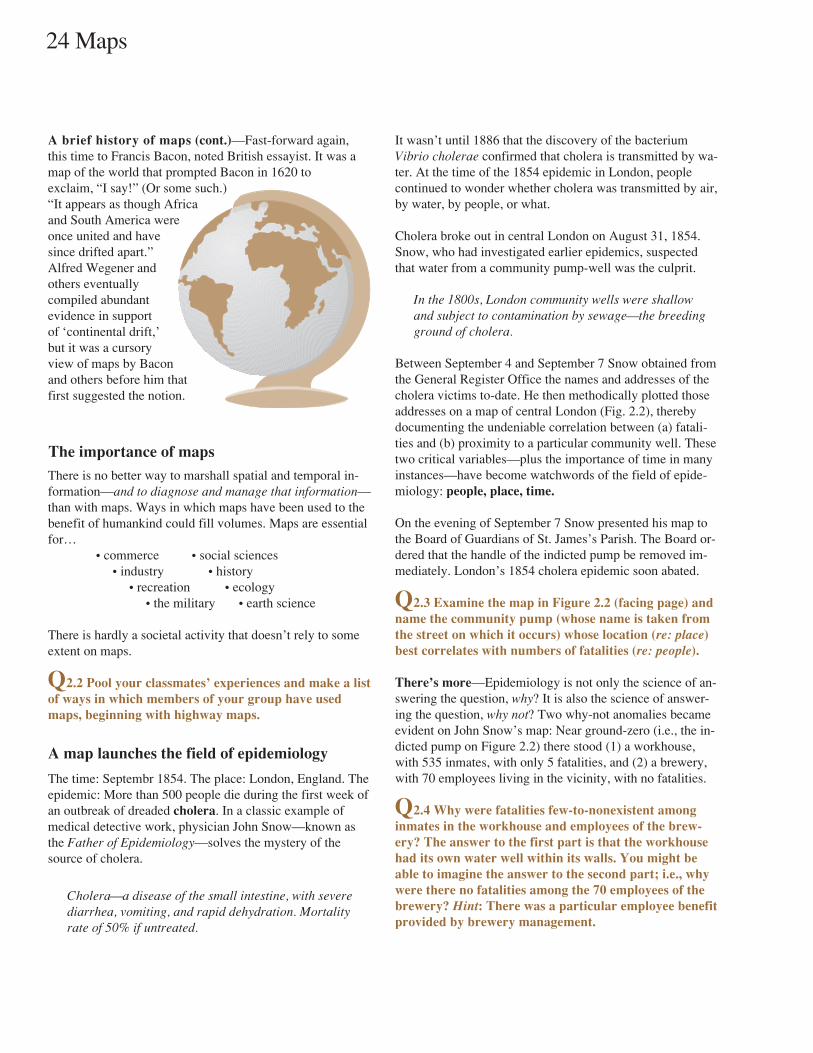
Between September 4 and September 7 Snow obtained fromthe General Register Office the names and addresses of thecholera victims to-date. He then methodically plotted thoseaddresses on a map of central London (Fig. 2.2), therebydocumenting the undeniable correlation between (a) fatali-ties and (b) proximity to a particular community well. Thesetwo critical variables—plus the importance of time in manyinstances—have become watchwords of the field of epide-miology: people, place, time.
On the evening of September 7 Snow presented his map tothe Board of Guardians of St. James’s Parish. The Board or-dered that the handle of the indicted pump be removed im-mediately. London’s 1854 cholera epidemic soon abated.
Q2.3 Examine the map in Figure 2.2 (facing page) andname the community pump (whose name is taken fromthe street on which it occurs) whose location (re: place)best correlates with numbers of fatalities (re: people).
There’s more—Epidemiology is not only the science of an-swering the question, why? It is also the science of answer-ing the question, why not? Two why-not anomalies becameevident on John Snow’s map: Near ground-zero (i.e., the in-dicted pump on Figure 2.2) there stood (1) a workhouse,with 535 inmates, with only 5 fatalities, and (2) a brewery,with 70 employees living in the vicinity, with no fatalities.
Q2.4 Why were fatalities few-to-nonexistent amonginmates in the workhouse and employees of the brew-ery? The answer to the first part is that the workhousehad its own water well within its walls. You might beable to imagine the answer to the second part; i.e., whywere there no fatalities among the 70 employees of thebrewery? Hint: There was a particular employee benefitprovided by brewery management.
It wasn’t until 1886 that the discovery of the bacteriumVibrio cholerae confirmed that cholera is transmitted by wa-ter. At the time of the 1854 epidemic in London, peoplecontinued to wonder whether cholera was transmitted by air,by water, by people, or what.
Cholera broke out in central London on August 31, 1854.Snow, who had investigated earlier epidemics, suspectedthat water from a community pump-well was the culprit.
There is no better way to marshall spatial and temporal in-formation—and to diagnose and manage that information—than with maps. Ways in which maps have been used to thebenefit of humankind could fill volumes. Maps are essentialfor…
• commerce • social sciences • industry • history • recreation • ecology • the military • earth science
There is hardly a societal activity that doesn’t rely to someextent on maps.
Q2.2 Pool your classmates’ experiences and make a listof ways in which members of your group have usedmaps, beginning with highway maps.
The time: Septembr 1854. The place: London, England. Theepidemic: More than 500 people die during the first week ofan outbreak of dreaded cholera. In a classic example ofmedical detective work, physician John Snow—known asthe Father of Epidemiology—solves the mystery of thesource of cholera.
The importance of maps
A map launches the field of epidemiology
Maps 25
Figure 2.2 John Snow’s map of fatalities resulting from London’s 1854 cholera epidemic. Thirteen community pump-wells are shown, andblack bars mark addresses of fatalities. Two why-not anomalies—the workhouse and the brewery—are highlighted.
PUMP
PUMP
PUMP
PUMP
PUMP
PUMP
PUMP
PUMPPUMP
PUMP
PUMP
PUMP
PUMP
CA
MB
RID
GE ST.
W O R K
H O U S E
S O H O
S Q U A R E
BR
EW
ER
Y
G O L D E N
S Q U A R E
R E G E N T S Q U A D R A N T
RE
G E N T
PI C
CA
DI L
LY
C I R C
US
BR
OA
D S
TR
EE
T
HA
YM
AR
KE
T
WA
RW
IC
K
S
TR
EE
T
RU
PE
RT
S
TR
EE
T
CA
RN
AB
Y
S
TR
EE
T
RE
GE
NT
S
TR
EE
T
BR
EW
ER
S
TR
EE
T
V I G O S T R E E T
M A R Y L E B O N E S T R E E T
C O V E N T R Y S T R E E T
DE
AN
S
TR
EE
T
O X F O R D S T R E E T
NE
WM
AN
ST
.
BE
RN
ER
S S
T.
MA
RK
ET
PL
.
C A S T L E S T. E A S T
MARLBOROUGH MEWS
WA
RD
OU
R
S
TR
EE
T
PO
LA
ND
ST
RE
ET
G R E AT M A R L B O R O U G H S T R E E T
P O R T L A N D S T R E E T
N O E L S T R E E T
GR
EA
T CH
AP
EL S
TRE
ET
WI
CK
ST
RE
ET
FR
IT
H
ST
RE
ET
CR
EE
K S
TR
EE
T
CH
AR
LES
STR
EE
T
O L D CO M P T O N S
T R E E T
G E R R A R D ST.
L I SL E S
T.
PR
IN
CE
S
ST
RE
ET
Q U E E N S T R E E T
RE
GE
NT
ST
.
SA
CK
VI L
LE
ST
RE
ET
AL
BA
NY
ST
RE
ET
GR
EA
T P
UL
TE
NY
ST
RE
ET
SH
ER
RA
RD
ST
RE
ET
GR
EA
T
WIN
DM
I LL
ST
RE
ET
OX
EN
DO
N S
TR
EE
T
PA N T O N ST R E E T
A R C H E R ST.
K I NG S
T R E E T
SI
LV
ER
S
TR
EE
T
MA
RS
HA
LL
ST
RE
ET
BR
I DL
ES
TR
EE
T
T I C H B O R N E S T R E E T
WE
LL
S S
T.
WI N
SL
EY
ST
.
BL
EN
HE
IM
S
TR
EE
T
LI T
TL
E W
I ND
MI L
L
ST
RE
ET
London 1854Map of Cholera deaths
byDr. John Snow
26 Maps
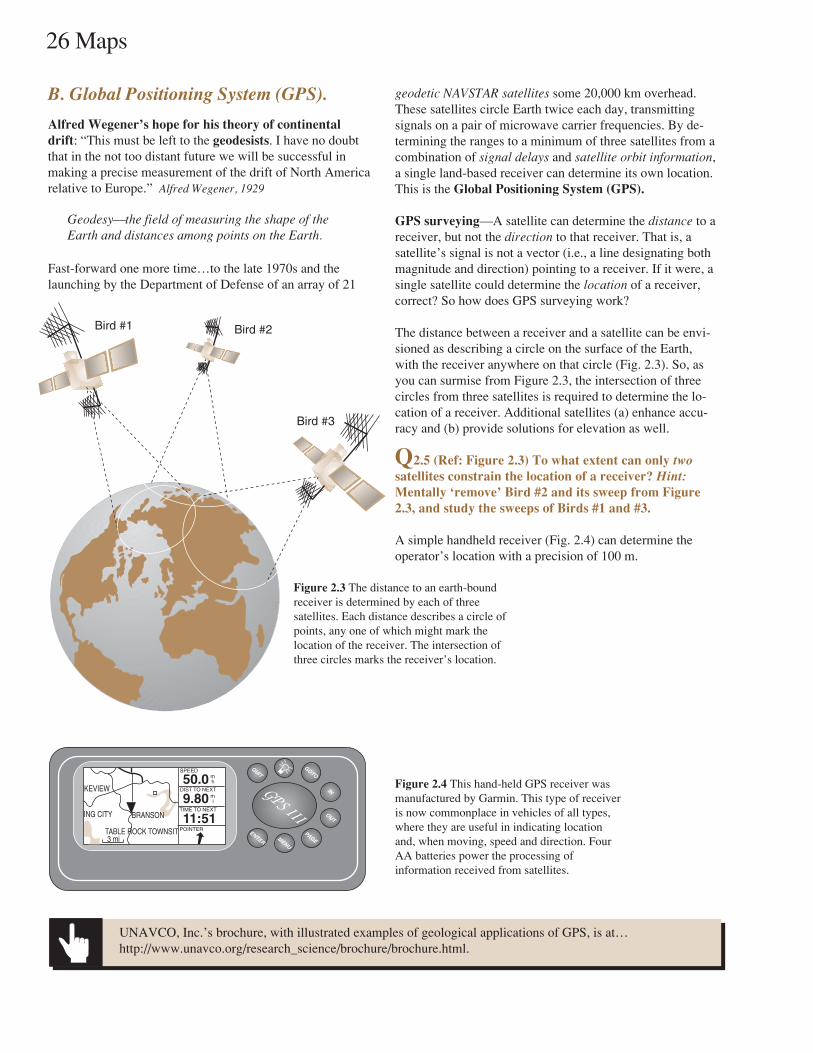
Figure 2.4 This hand-held GPS receiver wasmanufactured by Garmin. This type of receiveris now commonplace in vehicles of all types,where they are useful in indicating locationand, when moving, speed and direction. FourAA batteries power the processing ofinformation received from satellites.
Geodesy—the field of measuring the shape of theEarth and distances among points on the Earth.
Alfred Wegener’s hope for his theory of continentaldrift: “This must be left to the geodesists. I have no doubtthat in the not too distant future we will be successful inmaking a precise measurement of the drift of North Americarelative to Europe.” Alfred Wegener, 1929
Fast-forward one more time…to the late 1970s and thelaunching by the Department of Defense of an array of 21
geodetic NAVSTAR satellites some 20,000 km overhead.These satellites circle Earth twice each day, transmittingsignals on a pair of microwave carrier frequencies. By de-termining the ranges to a minimum of three satellites from acombination of signal delays and satellite orbit information,a single land-based receiver can determine its own location.This is the Global Positioning System (GPS).
GPS surveying—A satellite can determine the distance to areceiver, but not the direction to that receiver. That is, asatellite’s signal is not a vector (i.e., a line designating bothmagnitude and direction) pointing to a receiver. If it were, asingle satellite could determine the location of a receiver,correct? So how does GPS surveying work?
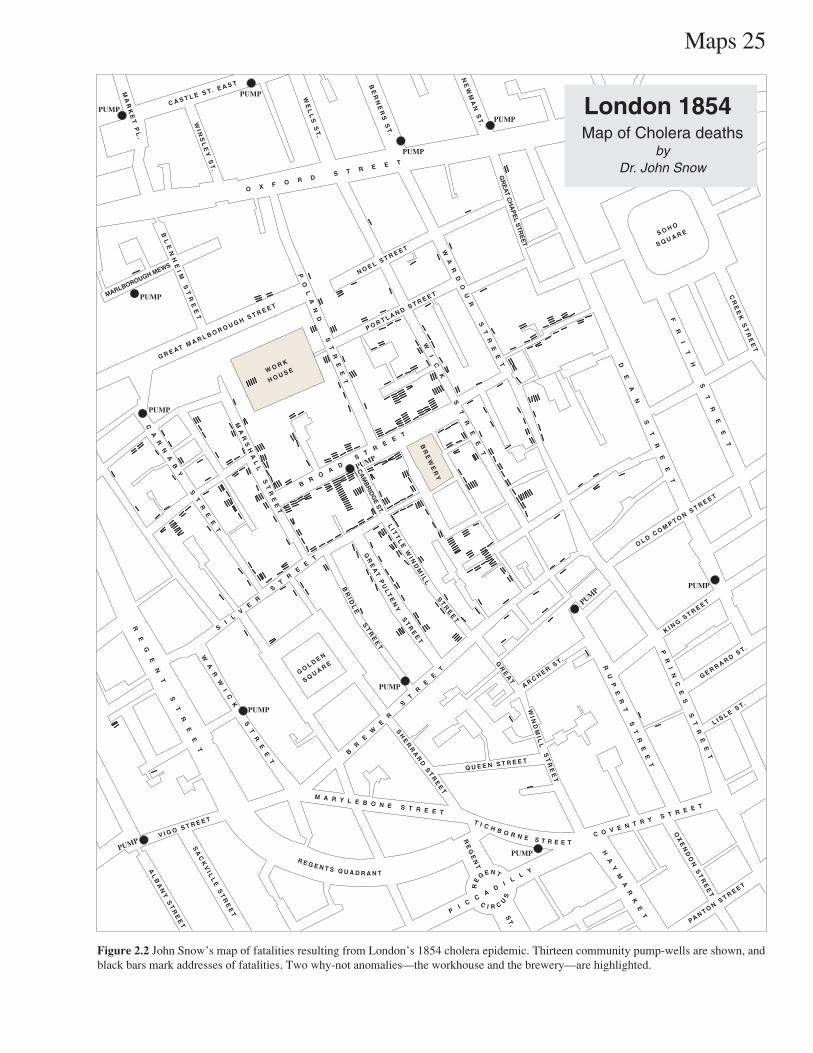
The distance between a receiver and a satellite can be envi-sioned as describing a circle on the surface of the Earth,with the receiver anywhere on that circle (Fig. 2.3). So, asyou can surmise from Figure 2.3, the intersection of threecircles from three satellites is required to determine the lo-cation of a receiver. Additional satellites (a) enhance accu-racy and (b) provide solutions for elevation as well.
Q2.5 (Ref: Figure 2.3) To what extent can only twosatellites constrain the location of a receiver? Hint:Mentally ‘remove’ Bird #2 and its sweep from Figure2.3, and study the sweeps of Birds #1 and #3.
A simple handheld receiver (Fig. 2.4) can determine theoperator’s location with a precision of 100 m.
UNAVCO, Inc.’s brochure, with illustrated examples of geological applications of GPS, is at…http://www.unavco.org/research_science/brochure/brochure.html.
TABLE ROCK TOWNSIT
KEVIEW
ING CITY
SPEED
DIST TO NEXT
POINTER
TIME TO NEXTBRANSON
3 mi
50.09.80
11:51
mh
mi
GOTOQUIT
IN
OUT
PAGEMENU
ENTER
GPS III
B. Global Positioning System (GPS).
Figure 2.3 The distance to an earth-boundreceiver is determined by each of threesatellites. Each distance describes a circle ofpoints, any one of which might mark thelocation of the receiver. The intersection ofthree circles marks the receiver’s location.
Bird #1 Bird #2
Bird #3
Maps 27
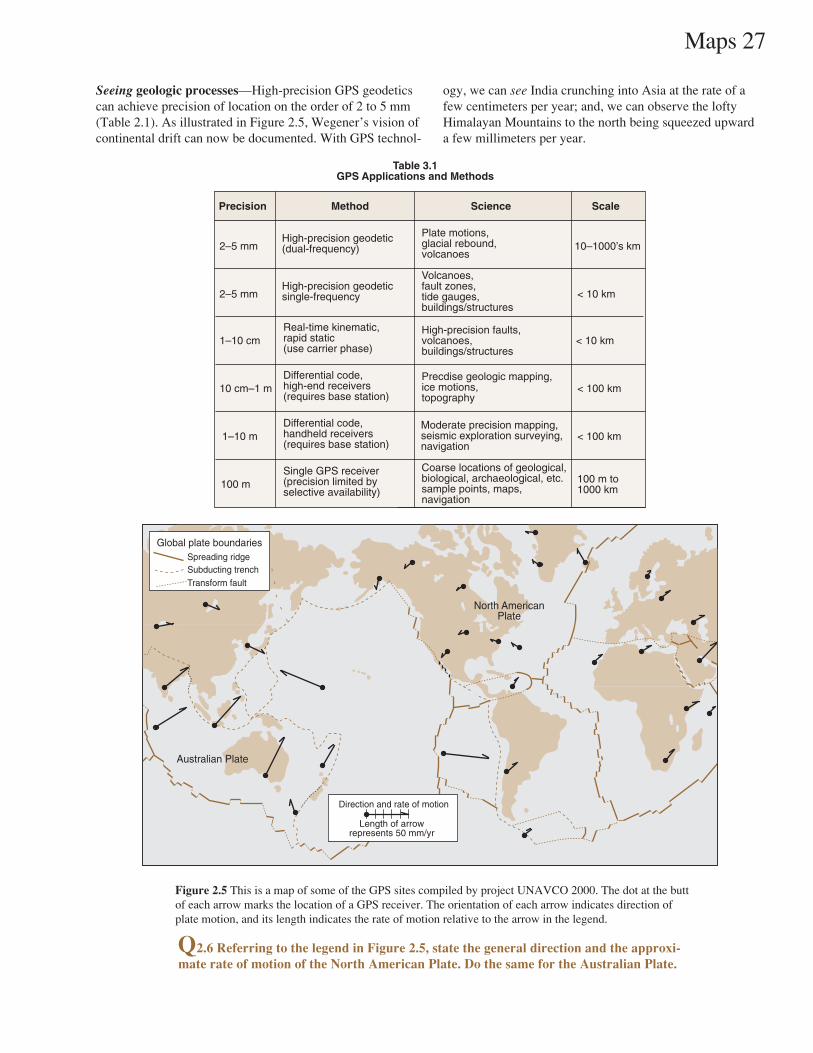
Seeing geologic processes—High-precision GPS geodeticscan achieve precision of location on the order of 2 to 5 mm(Table 2.1). As illustrated in Figure 2.5, Wegener’s vision ofcontinental drift can now be documented. With GPS technol-
Figure 2.5 This is a map of some of the GPS sites compiled by project UNAVCO 2000. The dot at the buttof each arrow marks the location of a GPS receiver. The orientation of each arrow indicates direction ofplate motion, and its length indicates the rate of motion relative to the arrow in the legend.
Q2.6 Referring to the legend in Figure 2.5, state the general direction and the approxi-mate rate of motion of the North American Plate. Do the same for the Australian Plate.
ogy, we can see India crunching into Asia at the rate of afew centimeters per year; and, we can observe the loftyHimalayan Mountains to the north being squeezed upwarda few millimeters per year.
Spreading ridgeSubducting trenchTransform fault
Global plate boundaries
North AmericanPlate
Australian Plate
Length of arrowrepresents 50 mm/yr
Direction and rate of motion
2–5 mm
2–5 mm
1–10 cm
10 cm–1 m
1–10 m
100 m
10–1000’s km
< 10 km
< 10 km
< 100 km
< 100 km
100 m to1000 km
High-precision geodetic(dual-frequency)
High-precision geodeticsingle-frequency
Real-time kinematic,rapid static(use carrier phase)
Differential code,high-end receivers(requires base station)
Differential code,handheld receivers(requires base station)
Single GPS receiver(precision limited byselective availability)
Plate motions,glacial rebound,volcanoes
Volcanoes,fault zones,tide gauges,buildings/structures
High-precision faults,volcanoes,buildings/structures
Precdise geologic mapping,ice motions,topography
Moderate precision mapping,seismic exploration surveying,navigation
Coarse locations of geological,biological, archaeological, etc.sample points, maps,navigation
ScienceMethodPrecision Scale
Table 3.1GPS Applications and Methods

28 Maps
Prime
(zero)m
eridian
60° w
est 30
° west
30°
15°
east
30° east
60° angleBLines of longitude
(meridians)
15° south
60°
angle
N
o r t h po l e
60° n
orth
30° north
ALines of latitude
(parallels)
Equator (zero latitude)
Land-use planning has given new im-portance to a great variety of maps, allof which utilize the Global ReferenceSystem of latitude and longitude as ameans of locating points on Earth’s sur-face (Fig. 2.6). Latitude is the anglemeasured both northward and south-ward from the equator, which is as-signed a value of zero. Longitude is theangle measured both westward andeastward from a meridian runningthrough Greenwich, England (the primemeridian), which is assigned a value ofzero.
Q2.7 What is the latitude at (A) thenorth pole? (B) The south pole?
Q2.8. What do you imagine themaximum longitude value on Earthto be? Hint: It is on the opposite sideof the Earth from the prime merid-ian.
Q2.9. A young man recentlydrafted by a team in the NationalBasketball Association was quotedby the press as having said, “We’regoing to turn this team around 360degrees.” What’s wrong with thispicture?
C. Global Reference System (GRS).
Locating with latitude and longitude—The most funda-mental method of expressing the location of any spot onEarth’s surface is some number of degrees north or south ofthe equator (= latitude), followed by some number of de-grees east or west of the prime meridian (= longitude). Thelocation of Willow Springs, Missouri is shown in Figure 2.7.
(Optional teaser)Fun with latitude: Seen in a Sunday supplement: There isone point on Earth’s surface from which one can walk onemile southward, then one mile westward, then one milenorthward and be back at the starting point. Question:Where is this starting point? Answer: The north pole. Didyou find that one easy? If so, try the following: There is aninfinite number of points on Earth’s surface from which onecan walk one mile southward, then one mile westward, thenone mile northward and be back at the starting point.Question: Where are these countless starting points?
Figure 2.7 Location of Willow Springs, Missouri:37° north latitude, 92° west longitude.
Figure 2.6 Earth is divided (A) north–south by lines of latitude (called parallels)and (B) east–west by lines of longitude(called meridians).
92° westEquator
37°
nort
h
GreenwichWillow Springs
Maps 29
D. Map scales.
The scale of a map shows the relationship between thelength of a line on that map and the distance represented bythat line on the ground. This relationship can be expressedby a fractional scale, which is either a ratio or a represen-tative fraction (RF), designating the length of the line on themap equal to 1. For example, a scale of 1:24,000 (or 1/24,000 RF) is taken to mean that the length of a measure-ment along the edge of an English or metric rule represents24,000 times that length in actual distance on Earth’s sur-face. To illustrate…
Q2.10 Given a scale of 1:24,000: (A) What is theground distance in feet represented by three inches onthe map? (B) What is the ground distance in metersrepresented by 5 cm on the map? (C) How about theground distance in kilometers represented by 5 cm onthe map? Hint: Multiples of units of measures—andtheir conversions to other systems of measures—appearon pages i and ii at the front of this manual.
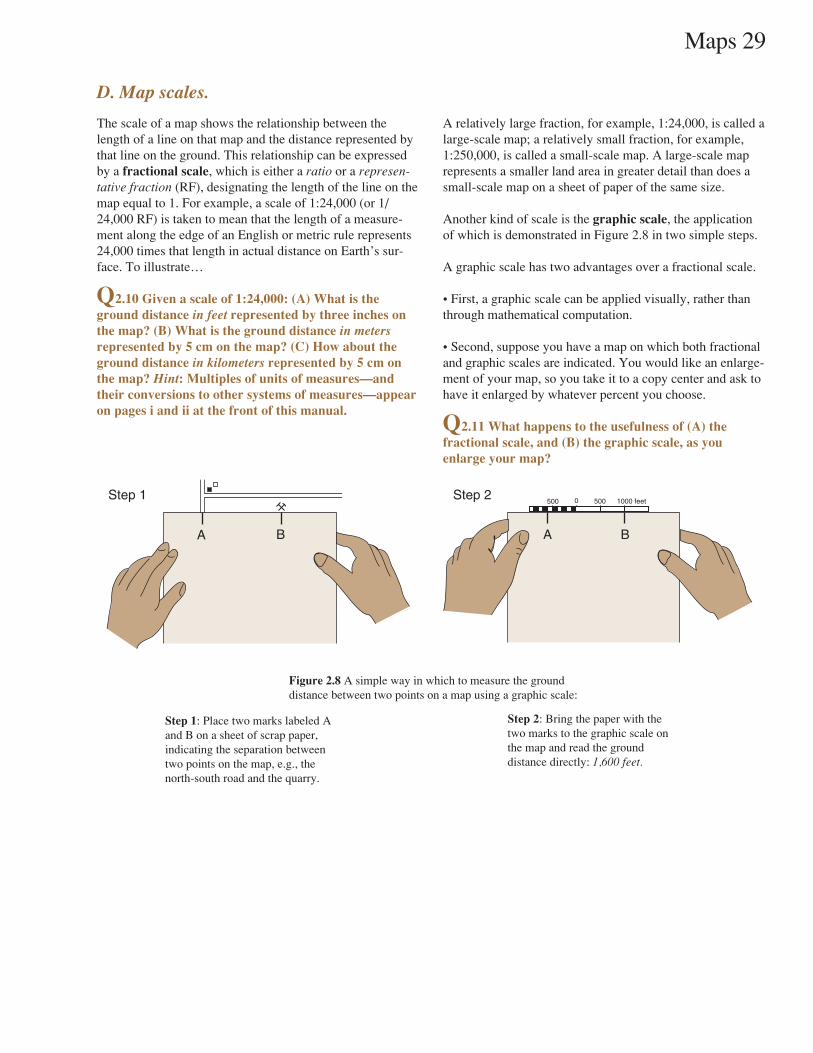
Step 1: Place two marks labeled Aand B on a sheet of scrap paper,indicating the separation betweentwo points on the map, e.g., thenorth-south road and the quarry.
A relatively large fraction, for example, 1:24,000, is called alarge-scale map; a relatively small fraction, for example,1:250,000, is called a small-scale map. A large-scale maprepresents a smaller land area in greater detail than does asmall-scale map on a sheet of paper of the same size.
Another kind of scale is the graphic scale, the applicationof which is demonstrated in Figure 2.8 in two simple steps.
A graphic scale has two advantages over a fractional scale.
• First, a graphic scale can be applied visually, rather thanthrough mathematical computation.
• Second, suppose you have a map on which both fractionaland graphic scales are indicated. You would like an enlarge-ment of your map, so you take it to a copy center and ask tohave it enlarged by whatever percent you choose.
Q2.11 What happens to the usefulness of (A) thefractional scale, and (B) the graphic scale, as youenlarge your map?
Step 2: Bring the paper with thetwo marks to the graphic scale onthe map and read the grounddistance directly: 1,600 feet.
Figure 2.8 A simple way in which to measure the grounddistance between two points on a map using a graphic scale:
Step 1
A B
Step 2500 0 1000 feet500
A B
30 Maps
6 5 4 3 2 1
7 8 9 11T4N
T3N
T2N
base line
5th
prin
cipa
l mer
idia
n
34 35 3631 32 33
T2N, R4E
R1E R2E R3E R4E
10 12
15 14 1318 17 16
22 23 2419 20 21
27 26 2530 29 28
rang
e lin
e
township line
T1N
A
C‘c’
z
B
y
x
D
Sec. 32
E. Land survey system.
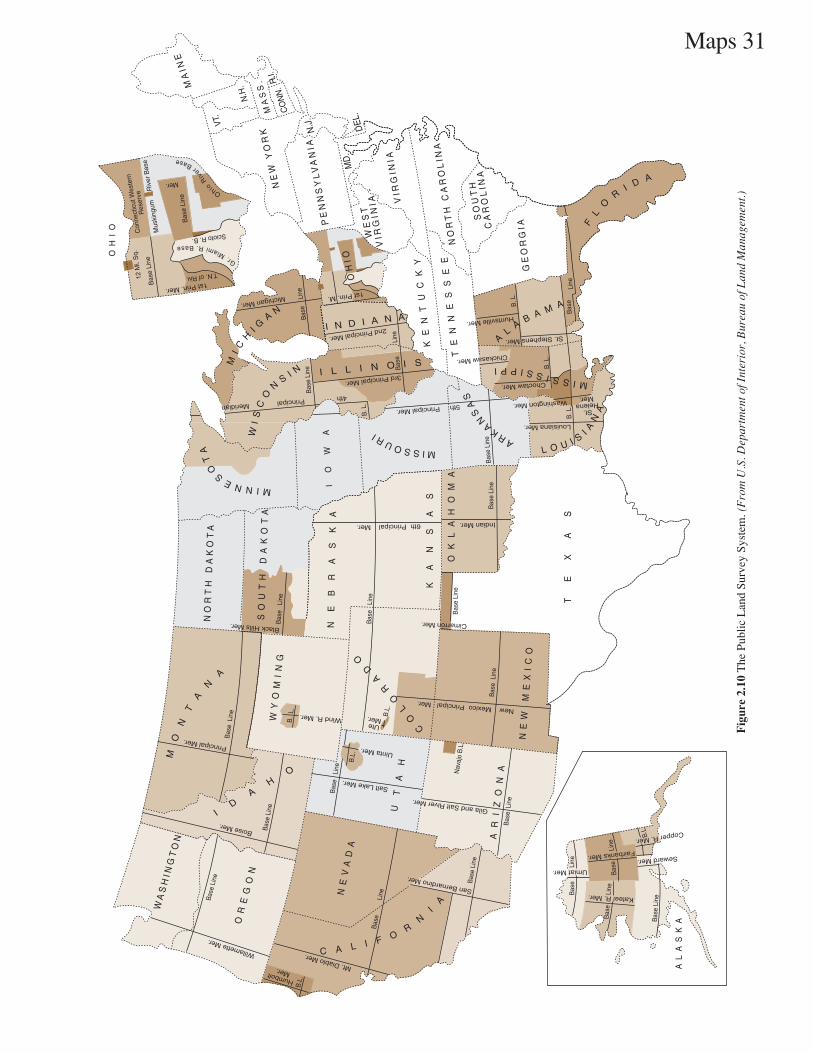
Townships—In 1785 the Continental Congress, directed by Thomas Jefferson, es-tablished a rectangular system of public land survey that has since been adopted bysome 30 states. The original thirteen states and five others, plus Texas and Hawaii,use a variety of different systems (Fig. 2.10).
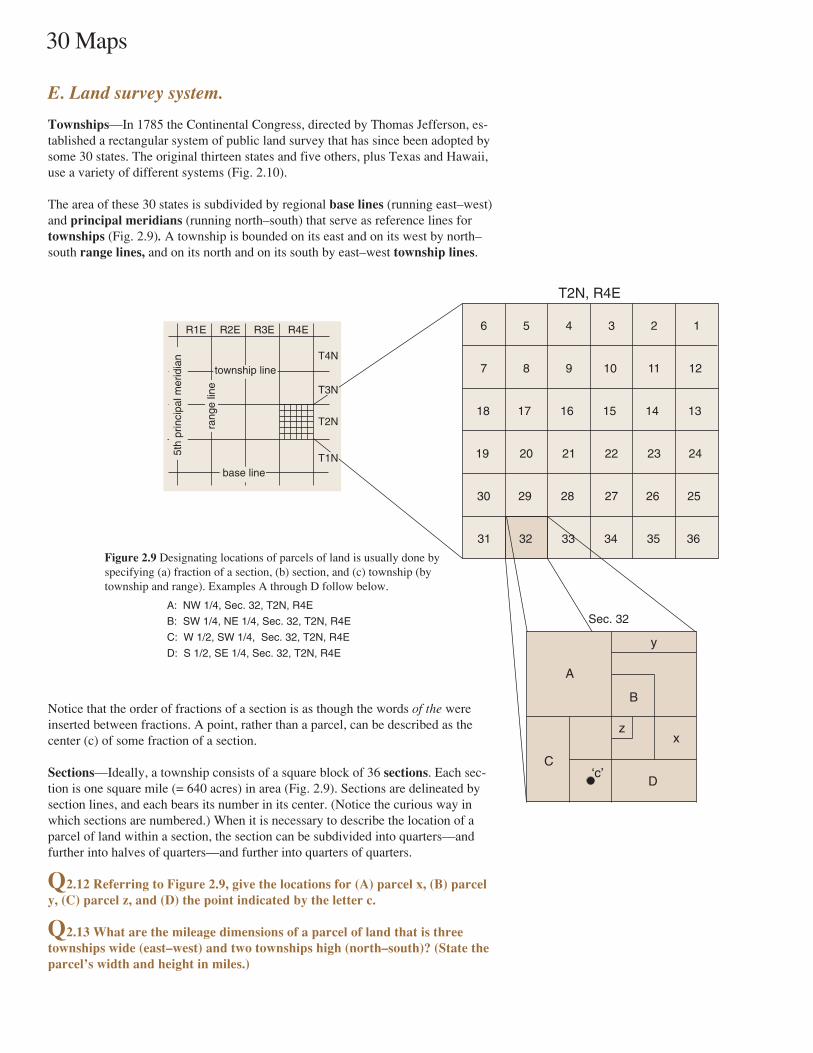
The area of these 30 states is subdivided by regional base lines (running east–west)and principal meridians (running north–south) that serve as reference lines fortownships (Fig. 2.9). A township is bounded on its east and on its west by north–south range lines, and on its north and on its south by east–west township lines.
Notice that the order of fractions of a section is as though the words of the wereinserted between fractions. A point, rather than a parcel, can be described as thecenter (c) of some fraction of a section.
Sections—Ideally, a township consists of a square block of 36 sections. Each sec-tion is one square mile (= 640 acres) in area (Fig. 2.9). Sections are delineated bysection lines, and each bears its number in its center. (Notice the curious way inwhich sections are numbered.) When it is necessary to describe the location of aparcel of land within a section, the section can be subdivided into quarters—andfurther into halves of quarters—and further into quarters of quarters.
Q2.12 Referring to Figure 2.9, give the locations for (A) parcel x, (B) parcely, (C) parcel z, and (D) the point indicated by the letter c.
Q2.13 What are the mileage dimensions of a parcel of land that is threetownships wide (east–west) and two townships high (north–south)? (State theparcel’s width and height in miles.)
Figure 2.9 Designating locations of parcels of land is usually done byspecifying (a) fraction of a section, (b) section, and (c) township (bytownship and range). Examples A through D follow below.
A: NW 1/4, Sec. 32, T2N, R4E
B: SW 1/4, NE 1/4, Sec. 32, T2N, R4E
C: W 1/2, SW 1/4, Sec. 32, T2N, R4E
D: S 1/2, SE 1/4, Sec. 32, T2N, R4E
Maps 31
Fig
ure
2.10
The
Pub
lic L
and
Surv
ey S
yste
m. (
Fro
m U
.S. D
epar
tmen
t of I
nter
ior,
Bur
eau
of L
and
Man
agem
ent.)
Willamette Mer.
Bas
e Li
neBoise Mer.
Bas
e Li
ne
WA
SH
I NG
TO
N
OR
EG
ON
NE
VA
DA
C A L I F OR
NI
A
Humbolt Mer.
ID
AH
O
MO
NT
AN
A
WY
OM
IN
G
CO
LO
RA
DO
UT
AH
AR
IZ
ON
A
NE
W
ME
XI
CO
TE
XA
S
OK
LA
HO
MA
ARKA
NS
AS
L O U I SI A
NA
KA
NS
AS
NE
BR
AS
KA
SO
UT
H
DA
KO
TA
NO
RT
H D
AK
OT
A
MINNES
OT
A
WI
SC
O
NS
I N
IO
WA
MISSOURI
I L L I N O I S
I N D I A N A
KE
NT
UC
KY
TE
NN
ES
SE
EN
OR
TH
CA
RO
LIN
A
SO
UT
H
CA
RO
LIN
A
VIR
GIN
IA
WE
ST
VIR
GIN
IA
PE
NN
SY
LV
AN
IA
MI
CH
I GA
N
NE
W Y
OR
K
GE
OR
GIA
AL
AB A M A
FL
OR
I D A
MISSISSIPPI
MA
INE
MA
SS
.
CO
NN
.
N.J
.
MD
.
DE
L.
R.I.
B.L
.
Bas
e
L
ine
Mt. Diablo Mer.
San Bernardino Mer.
Bas
e Li
ne
Gila and Salt River Mer.
Bas
e L
ine
Salt Lake Mer.
Bas
e L
ine
Uinta Mer.
Ute Mer. B
.L.
B.L
.
Nav
ajo
B.L
.
Wind R. Mer.
B.
L.
New Mexico Principal Mer.
Bas
e L
ine
Black Hills Mer. Bas
e L
ine
Bas
e L
ine
6th Principal Mer. Indian Mer.
5th Principal Mer.
Bas
e Li
neB
ase
Line
Louisiana Mer.
B. L
. St.Helena
Mer.Washington Mer.
Choctaw Mer.
B. L
.
St. Stephens Mer.
Bas
eLi
ne
B. L
.
Huntsville Mer.
Chickasaw Mer.
B. L
.
4th Principal Meridian
Bas
e Li
neB
ase
Li
neMichigan Mer.
3rd Principal Mer.
2nd Principal Mer.
Bas
e
L
ine
AL
AS
KA
VT.
N.H
.
Bas
e Li
ne
Cimarron Mer.
Bas
e Li
ne
Bas
e
Lin
e
Bas
e
L
ine
Bas
e
Lin
e
B.L
.
Kateel R. Mer.
Umiat Mer.
Fairbanks Mer. Seward Mer.
Copper R. Mer.
Bas
e L
ine
Principal Mer.
OH
IO
1st Prin. M.
Bas
e Li
ne
Con
nect
icut
Wes
tern
Res
erve Ohio
Riv
erBase
12 M
i. S
q.
Mus
king
um
Riv
er B
ase
Bas
e Li
ne
T.N. of Riv.
Gr.MiamiR.Base
Mer.
Scioto R. B.
OH
IO
1st Prin. Mer.
32 Maps
The U.S. Geological Survey was established by Congress in 1879 to consolidatefour earlier organizations that had been engaged in the mapping of public lands. In1882 a general plan was adopted for the Survey to produce a series of topographic(aka quadrangle) maps, examples of which appear in this manual.
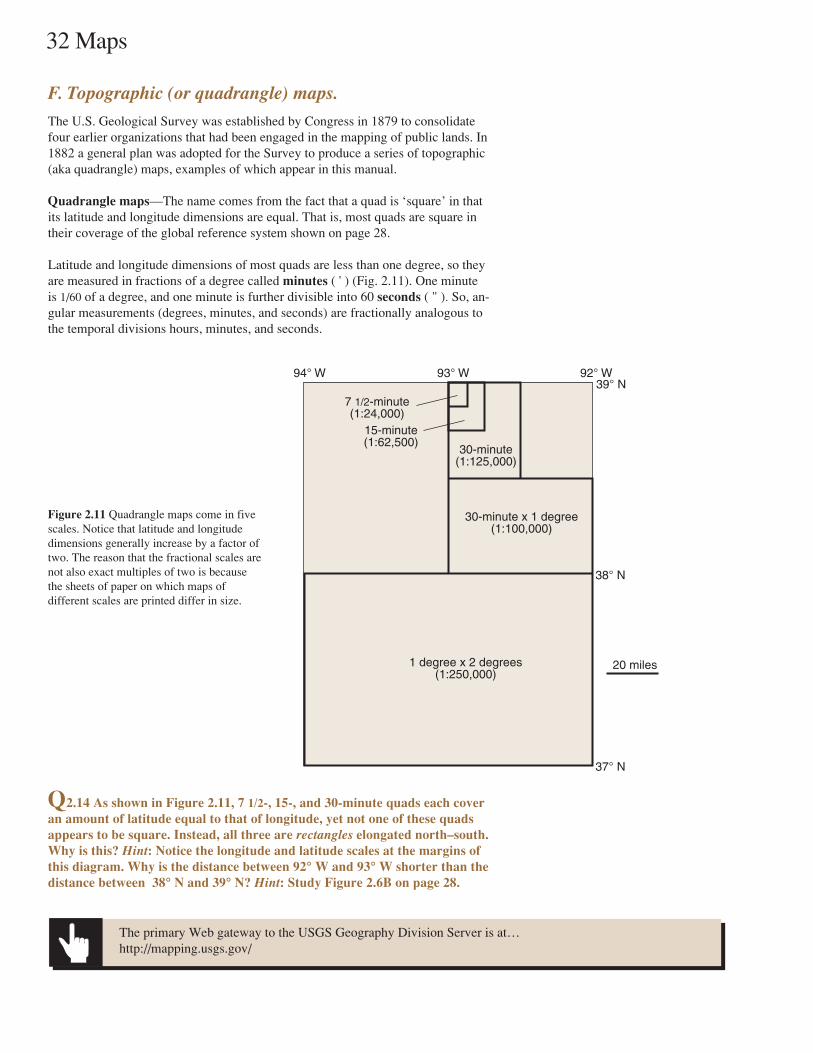
Quadrangle maps—The name comes from the fact that a quad is ‘square’ in thatits latitude and longitude dimensions are equal. That is, most quads are square intheir coverage of the global reference system shown on page 28.
Latitude and longitude dimensions of most quads are less than one degree, so theyare measured in fractions of a degree called minutes ( ' ) (Fig. 2.11). One minuteis 1/60 of a degree, and one minute is further divisible into 60 seconds ( " ). So, an-gular measurements (degrees, minutes, and seconds) are fractionally analogous tothe temporal divisions hours, minutes, and seconds.
Q2.14 As shown in Figure 2.11, 7 1/2-, 15-, and 30-minute quads each coveran amount of latitude equal to that of longitude, yet not one of these quadsappears to be square. Instead, all three are rectangles elongated north–south.Why is this? Hint: Notice the longitude and latitude scales at the margins ofthis diagram. Why is the distance between 92° W and 93° W shorter than thedistance between 38° N and 39° N? Hint: Study Figure 2.6B on page 28.
F. Topographic (or quadrangle) maps.
Figure 2.11 Quadrangle maps come in fivescales. Notice that latitude and longitudedimensions generally increase by a factor oftwo. The reason that the fractional scales arenot also exact multiples of two is becausethe sheets of paper on which maps ofdifferent scales are printed differ in size.
The primary Web gateway to the USGS Geography Division Server is at…http://mapping.usgs.gov/
7 1/2-minute(1:24,000)
15-minute(1:62,500)
30-minute(1:125,000)
30-minute x 1 degree(1:100,000)
1 degree x 2 degrees(1:250,000)
39° N
38° N
37° N
92° W93° W94° W
20 miles
Maps 33
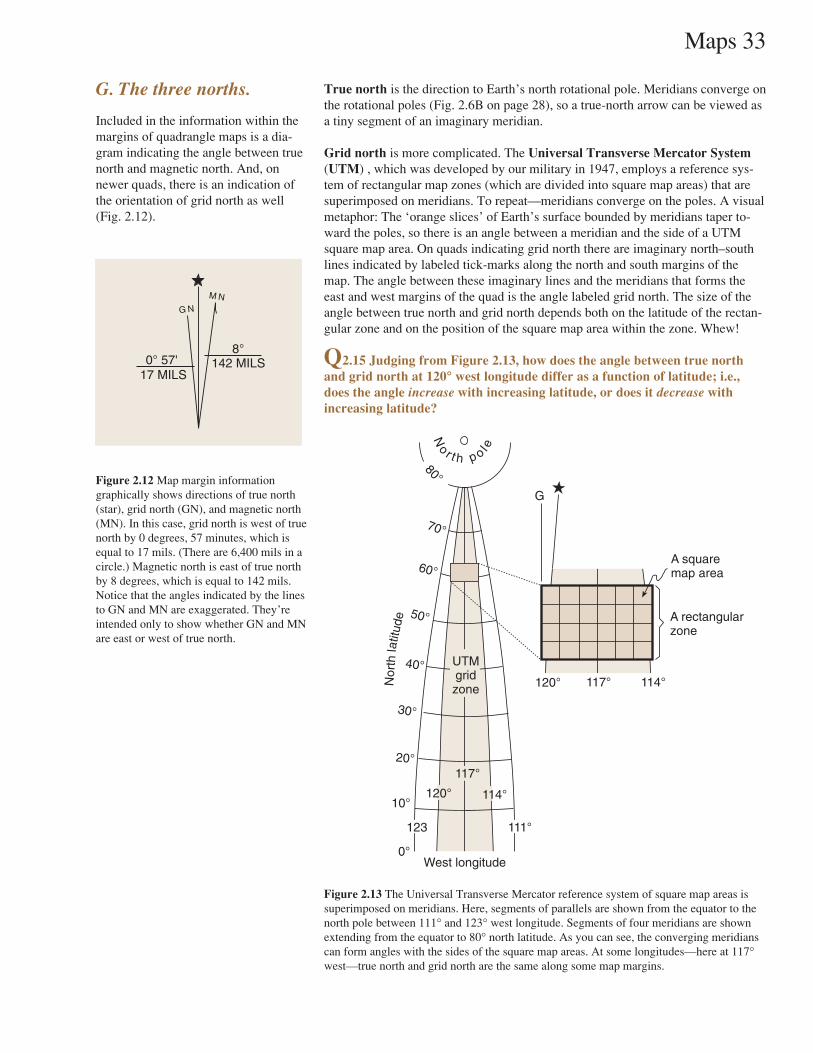
Included in the information within themargins of quadrangle maps is a dia-gram indicating the angle between truenorth and magnetic north. And, onnewer quads, there is an indication ofthe orientation of grid north as well(Fig. 2.12).
True north is the direction to Earth’s north rotational pole. Meridians converge onthe rotational poles (Fig. 2.6B on page 28), so a true-north arrow can be viewed asa tiny segment of an imaginary meridian.
Grid north is more complicated. The Universal Transverse Mercator System(UTM) , which was developed by our military in 1947, employs a reference sys-tem of rectangular map zones (which are divided into square map areas) that aresuperimposed on meridians. To repeat—meridians converge on the poles. A visualmetaphor: The ‘orange slices’ of Earth’s surface bounded by meridians taper to-ward the poles, so there is an angle between a meridian and the side of a UTMsquare map area. On quads indicating grid north there are imaginary north–southlines indicated by labeled tick-marks along the north and south margins of themap. The angle between these imaginary lines and the meridians that forms theeast and west margins of the quad is the angle labeled grid north. The size of theangle between true north and grid north depends both on the latitude of the rectan-gular zone and on the position of the square map area within the zone. Whew!
Q2.15 Judging from Figure 2.13, how does the angle between true northand grid north at 120° west longitude differ as a function of latitude; i.e.,does the angle increase with increasing latitude, or does it decrease withincreasing latitude?
Figure 2.13 The Universal Transverse Mercator reference system of square map areas issuperimposed on meridians. Here, segments of parallels are shown from the equator to thenorth pole between 111° and 123° west longitude. Segments of four meridians are shownextending from the equator to 80° north latitude. As you can see, the converging meridianscan form angles with the sides of the square map areas. At some longitudes—here at 117°west—true north and grid north are the same along some map margins.
Figure 2.12 Map margin informationgraphically shows directions of true north(star), grid north (GN), and magnetic north(MN). In this case, grid north is west of truenorth by 0 degrees, 57 minutes, which isequal to 17 mils. (There are 6,400 mils in acircle.) Magnetic north is east of true northby 8 degrees, which is equal to 142 mils.Notice that the angles indicated by the linesto GN and MN are exaggerated. They’reintended only to show whether GN and MNare east or west of true north.
G. The three norths.
17 MILS0° 57'
M N
G N
8°142 MILS
70°
60°
50°
40°
20°
30°
10°
80°
0°
114°
117°
120°
West longitude
Nor
thla
titud
e
No r t h p o l e
111°123
UTMgridzone
G
A rectangularzone
A squaremap area
114°117°120°
34 Maps
Magnetic north pole
True north (rotational) pole
Westdec
linat
ionE
ast declination
Agonic line(zero declination)
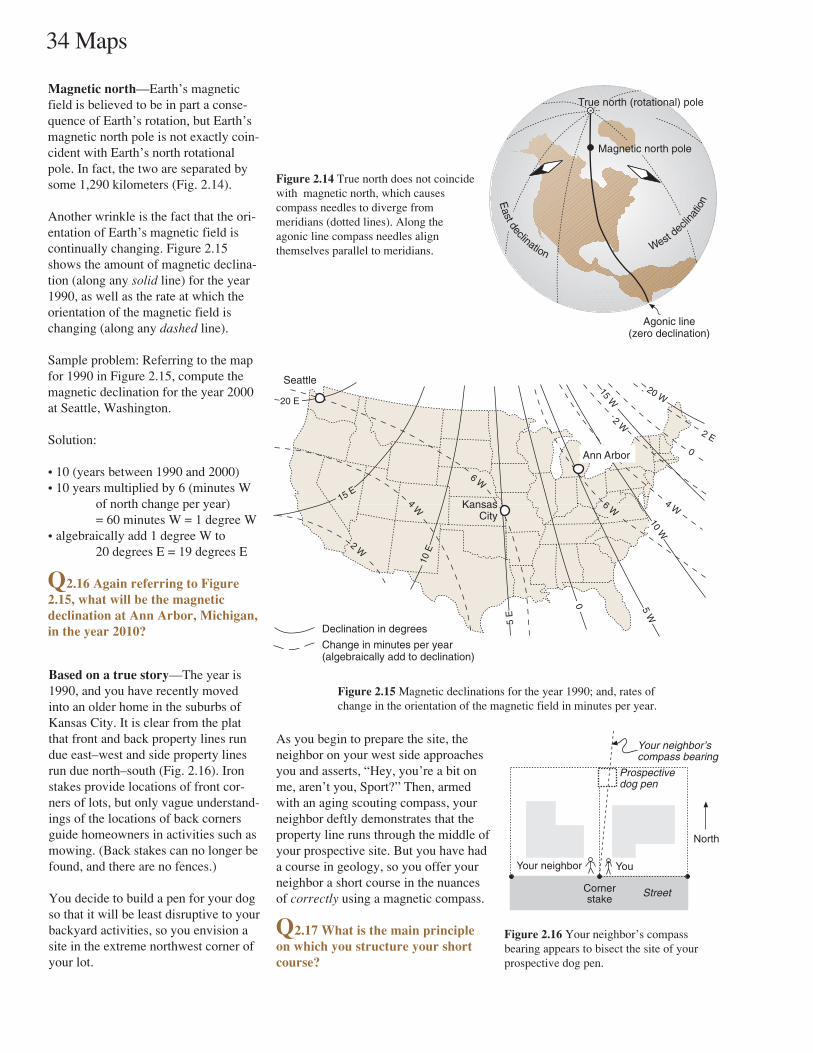
Figure 2.15 Magnetic declinations for the year 1990; and, rates ofchange in the orientation of the magnetic field in minutes per year.
Magnetic north—Earth’s magneticfield is believed to be in part a conse-quence of Earth’s rotation, but Earth’smagnetic north pole is not exactly coin-cident with Earth’s north rotationalpole. In fact, the two are separated bysome 1,290 kilometers (Fig. 2.14).
Another wrinkle is the fact that the ori-entation of Earth’s magnetic field iscontinually changing. Figure 2.15shows the amount of magnetic declina-tion (along any solid line) for the year1990, as well as the rate at which theorientation of the magnetic field ischanging (along any dashed line).
Sample problem: Referring to the mapfor 1990 in Figure 2.15, compute themagnetic declination for the year 2000at Seattle, Washington.
Solution:
• 10 (years between 1990 and 2000)• 10 years multiplied by 6 (minutes W
of north change per year)= 60 minutes W = 1 degree W
• algebraically add 1 degree W to20 degrees E = 19 degrees E
Q2.16 Again referring to Figure2.15, what will be the magneticdeclination at Ann Arbor, Michigan,in the year 2010?
Figure 2.14 True north does not coincidewith magnetic north, which causescompass needles to diverge frommeridians (dotted lines). Along theagonic line compass needles alignthemselves parallel to meridians.
Based on a true story—The year is1990, and you have recently movedinto an older home in the suburbs ofKansas City. It is clear from the platthat front and back property lines rundue east–west and side property linesrun due north–south (Fig. 2.16). Ironstakes provide locations of front cor-ners of lots, but only vague understand-ings of the locations of back cornersguide homeowners in activities such asmowing. (Back stakes can no longer befound, and there are no fences.)
You decide to build a pen for your dogso that it will be least disruptive to yourbackyard activities, so you envision asite in the extreme northwest corner ofyour lot.
As you begin to prepare the site, theneighbor on your west side approachesyou and asserts, “Hey, you’re a bit onme, aren’t you, Sport?” Then, armedwith an aging scouting compass, yourneighbor deftly demonstrates that theproperty line runs through the middle ofyour prospective site. But you have hada course in geology, so you offer yourneighbor a short course in the nuancesof correctly using a magnetic compass.
Q2.17 What is the main principleon which you structure your shortcourse?
Figure 2.16 Your neighbor’s compassbearing appears to bisect the site of yourprospective dog pen.
2 E
Declination in degrees
Change in minutes per year(algebraically add to declination)
Seattle
Ann Arbor
2 W
6 W
0
10 E
6 W
4 W
15 E
2 W
20 E
0
20 W
15 W
4 W
10 W
5 W
5 E
KansasCity
Street
You
Cornerstake
Your neighbor
Your neighbor’scompass bearing
North
Prospectivedog pen
Maps 35
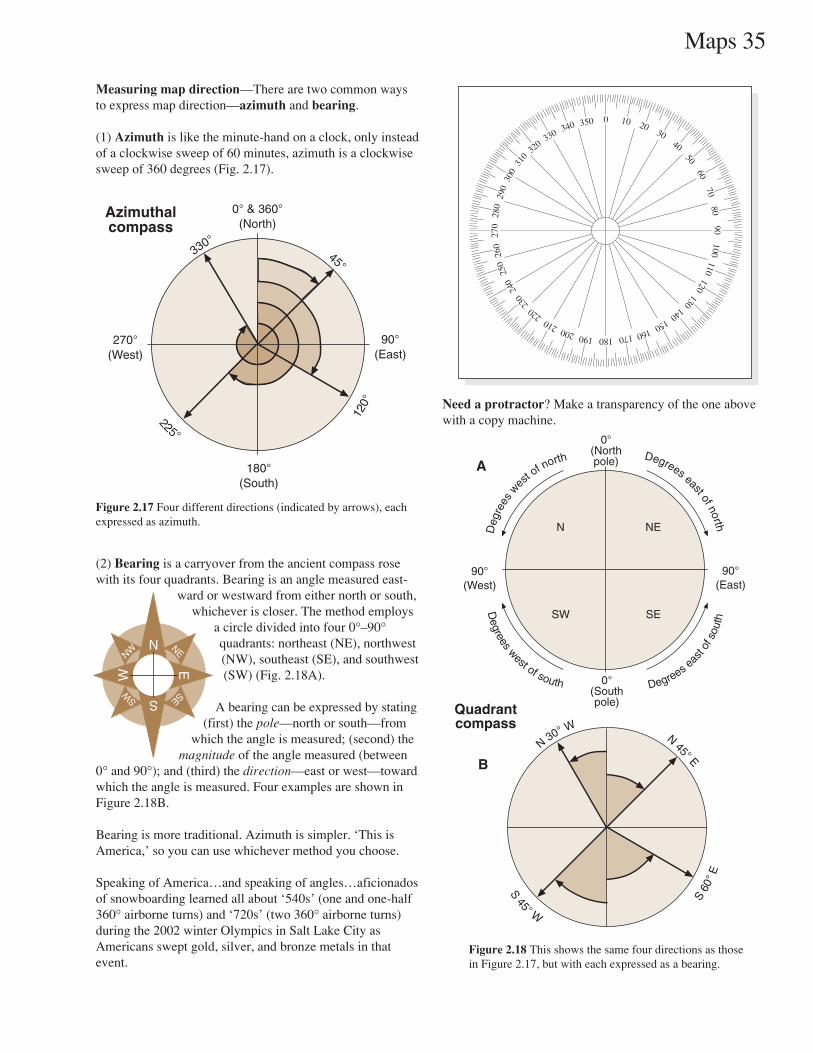
Measuring map direction—There are two common waysto express map direction—azimuth and bearing.
(1) Azimuth is like the minute-hand on a clock, only insteadof a clockwise sweep of 60 minutes, azimuth is a clockwisesweep of 360 degrees (Fig. 2.17).
Figure 2.17 Four different directions (indicated by arrows), eachexpressed as azimuth.
(2) Bearing is a carryover from the ancient compass rosewith its four quadrants. Bearing is an angle measured east-
ward or westward from either north or south,whichever is closer. The method employs
a circle divided into four 0°–90°quadrants: northeast (NE), northwest(NW), southeast (SE), and southwest(SW) (Fig. 2.18A).
A bearing can be expressed by stating(first) the pole—north or south—from
which the angle is measured; (second) themagnitude of the angle measured (between
0° and 90°); and (third) the direction—east or west—towardwhich the angle is measured. Four examples are shown inFigure 2.18B.
Bearing is more traditional. Azimuth is simpler. ‘This isAmerica,’ so you can use whichever method you choose.
Speaking of America…and speaking of angles…aficionadosof snowboarding learned all about ‘540s’ (one and one-half360° airborne turns) and ‘720s’ (two 360° airborne turns)during the 2002 winter Olympics in Salt Lake City asAmericans swept gold, silver, and bronze metals in thatevent.
Figure 2.18 This shows the same four directions as thosein Figure 2.17, but with each expressed as a bearing.
Need a protractor? Make a transparency of the one abovewith a copy machine.
180
90
190200210220
230
240
250
260
270
100110
120130
140150160170
0 10 2030
40
5060
7080
280
290
300
310
320330 340 350
NE
S
W
NE
SESW
NW
270°(West)
330°45
°
90°(East)
0° & 360°(North)
180°(South)
225°
120°
Azimuthalcompass
90°(West)
90°(East)
0°(Northpole)
N NE
SW SE
A
Deg
rees
west of north Degrees east of north
Degrees ea
stof
sout
h
Degrees
west of south
BN
30°W
N45
° E
S60°
E
S45
°W
Quadrantcompass
0°(Southpole)
36 Maps
USGS topographic mapping home page is at http://mac.usgs.gov/isb/pubs/booklets/topo/topo.html.
(Conventional map symbols appear on facing pages 38 and 39.)
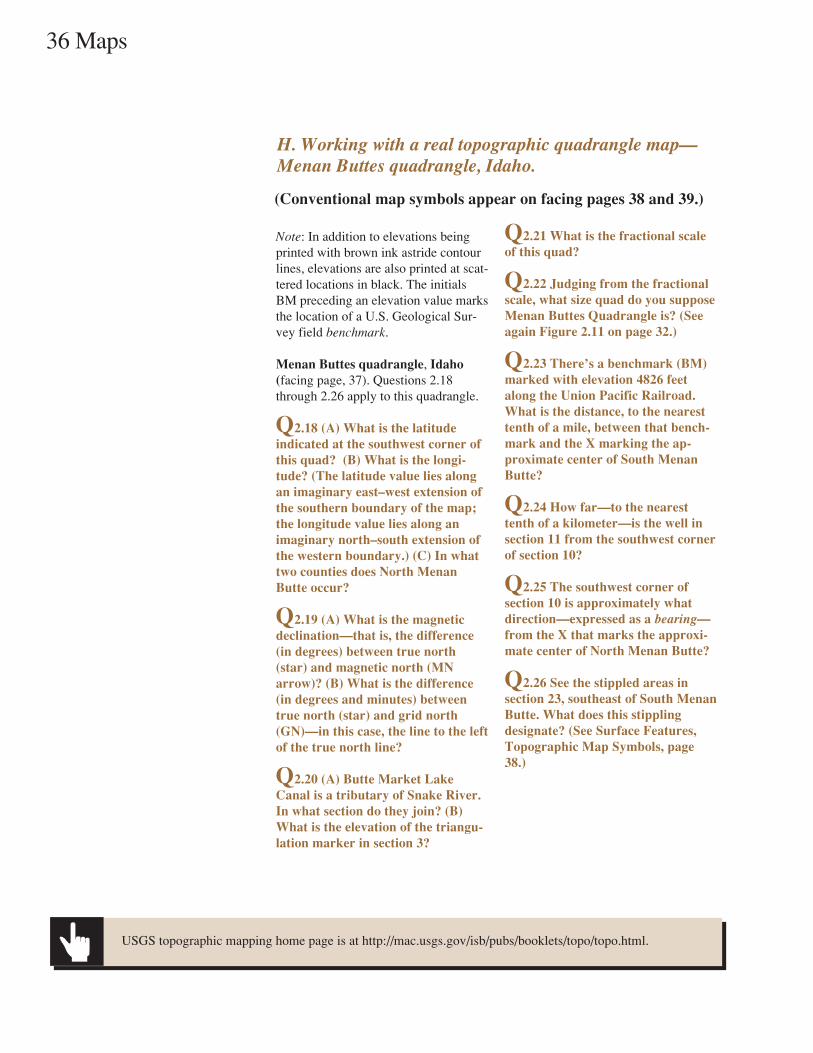
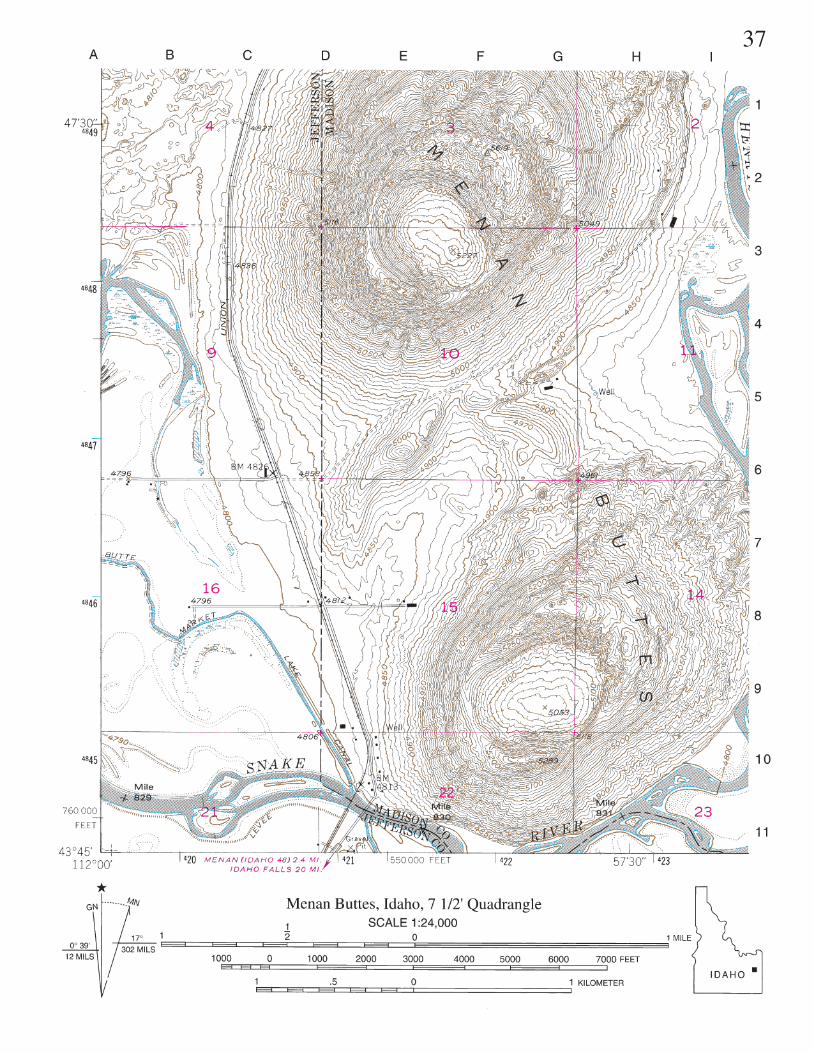
H. Working with a real topographic quadrangle map—Menan Buttes quadrangle, Idaho.
Note: In addition to elevations beingprinted with brown ink astride contourlines, elevations are also printed at scat-tered locations in black. The initialsBM preceding an elevation value marksthe location of a U.S. Geological Sur-vey field benchmark.
Menan Buttes quadrangle, Idaho(facing page, 37). Questions 2.18through 2.26 apply to this quadrangle.
Q2.18 (A) What is the latitudeindicated at the southwest corner ofthis quad? (B) What is the longi-tude? (The latitude value lies alongan imaginary east–west extension ofthe southern boundary of the map;the longitude value lies along animaginary north–south extension ofthe western boundary.) (C) In whattwo counties does North MenanButte occur?
Q2.19 (A) What is the magneticdeclination—that is, the difference(in degrees) between true north(star) and magnetic north (MNarrow)? (B) What is the difference(in degrees and minutes) betweentrue north (star) and grid north(GN)—in this case, the line to the leftof the true north line?
Q2.20 (A) Butte Market LakeCanal is a tributary of Snake River.In what section do they join? (B)What is the elevation of the triangu-lation marker in section 3?
Q2.21 What is the fractional scaleof this quad?
Q2.22 Judging from the fractionalscale, what size quad do you supposeMenan Buttes Quadrangle is? (Seeagain Figure 2.11 on page 32.)
Q2.23 There’s a benchmark (BM)marked with elevation 4826 feetalong the Union Pacific Railroad.What is the distance, to the nearesttenth of a mile, between that bench-mark and the X marking the ap-proximate center of South MenanButte?
Q2.24 How far—to the nearesttenth of a kilometer—is the well insection 11 from the southwest cornerof section 10?
Q2.25 The southwest corner ofsection 10 is approximately whatdirection—expressed as a bearing—from the X that marks the approxi-mate center of North Menan Butte?
Q2.26 See the stippled areas insection 23, southeast of South MenanButte. What does this stipplingdesignate? (See Surface Features,Topographic Map Symbols, page38.)
37
38
39
40 Maps
N.J.
MD.
A
C
B
N
500 m
2,000 f t
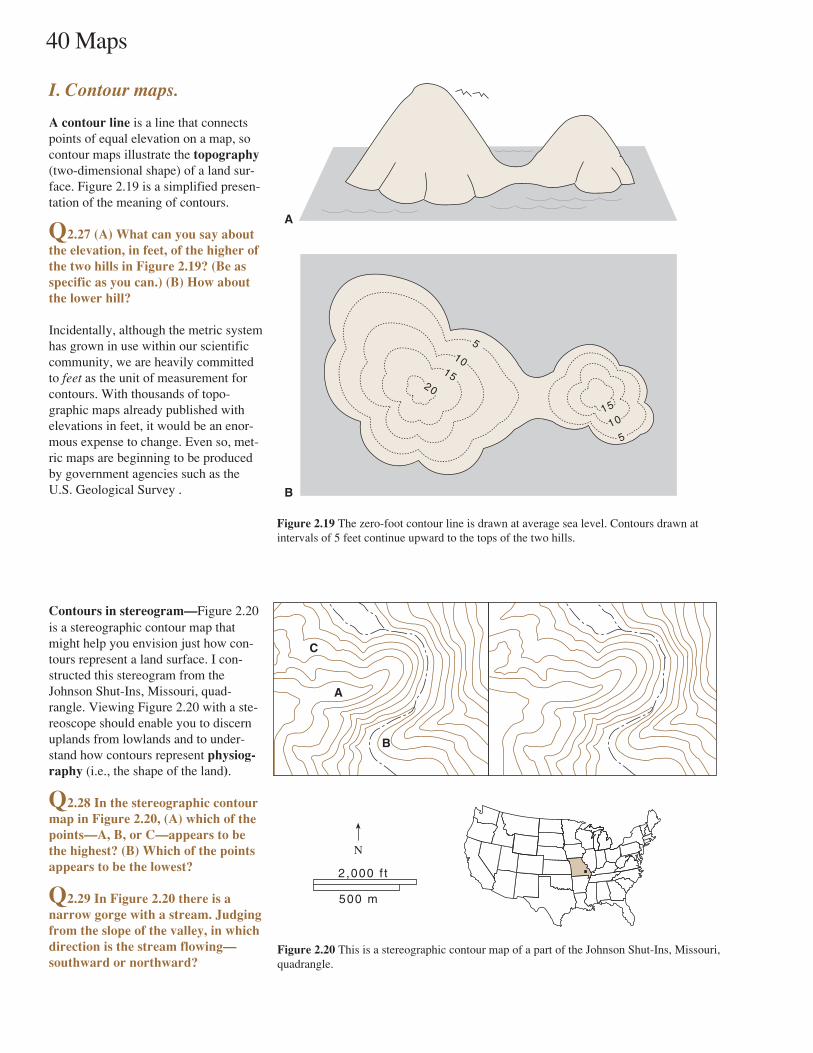
I. Contour maps.
Figure 2.19 The zero-foot contour line is drawn at average sea level. Contours drawn atintervals of 5 feet continue upward to the tops of the two hills.
A contour line is a line that connectspoints of equal elevation on a map, socontour maps illustrate the topography(two-dimensional shape) of a land sur-face. Figure 2.19 is a simplified presen-tation of the meaning of contours.
Q2.27 (A) What can you say aboutthe elevation, in feet, of the higher ofthe two hills in Figure 2.19? (Be asspecific as you can.) (B) How aboutthe lower hill?
Incidentally, although the metric systemhas grown in use within our scientificcommunity, we are heavily committedto feet as the unit of measurement forcontours. With thousands of topo-graphic maps already published withelevations in feet, it would be an enor-mous expense to change. Even so, met-ric maps are beginning to be producedby government agencies such as theU.S. Geological Survey .
Contours in stereogram—Figure 2.20is a stereographic contour map thatmight help you envision just how con-tours represent a land surface. I con-structed this stereogram from theJohnson Shut-Ins, Missouri, quad-rangle. Viewing Figure 2.20 with a ste-reoscope should enable you to discernuplands from lowlands and to under-stand how contours represent physiog-raphy (i.e., the shape of the land).
Q2.28 In the stereographic contourmap in Figure 2.20, (A) which of thepoints—A, B, or C—appears to bethe highest? (B) Which of the pointsappears to be the lowest?
Q2.29 In Figure 2.20 there is anarrow gorge with a stream. Judgingfrom the slope of the valley, in whichdirection is the stream flowing—southward or northward?
Figure 2.20 This is a stereographic contour map of a part of the Johnson Shut-Ins, Missouri,quadrangle.
10
5
10
5
1520
15
A
B
Maps 41
B
1. Contour values are repeated on either sideof a depression that occurs on a hilltop.(Depressions are indicated by hachures
pointing inward from contours.)
5. Contour values arerepeated on either side
of a valley.
8. Gentler slopesare represented bymore widely spaced
contours.
9. Steeper slopesare represented by
more closely spacedcontours.
2. Contourvalue is notrepeatedup-slopefrom a
depression.
3. Contourvalue is
repeateddown-slope
from adepression.
4. V’s formedby contours
pointupstream.
140
120
100
80
100
100
Str
eam
80
120
140
180
160
160
100
120
6. A contour closes(i.e., connects with itself)
around a hill or depression.
A
Depression on hilltop
Depression on slope
140
160
80160
7. Contour value isrepeated up-slope from
a hill down-slope.
Small hill
N
N
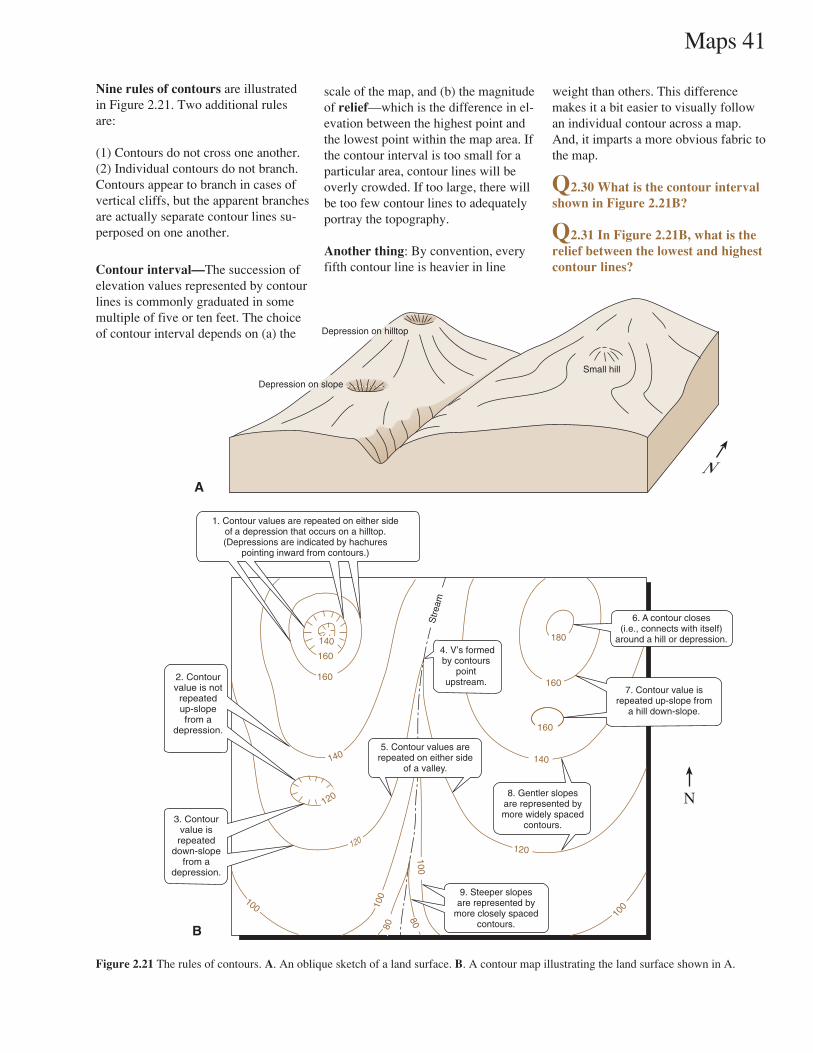
Figure 2.21 The rules of contours. A. An oblique sketch of a land surface. B. A contour map illustrating the land surface shown in A.
weight than others. This differencemakes it a bit easier to visually followan individual contour across a map.And, it imparts a more obvious fabric tothe map.
Q2.30 What is the contour intervalshown in Figure 2.21B?
Q2.31 In Figure 2.21B, what is therelief between the lowest and highestcontour lines?
scale of the map, and (b) the magnitudeof relief—which is the difference in el-evation between the highest point andthe lowest point within the map area. Ifthe contour interval is too small for aparticular area, contour lines will beoverly crowded. If too large, there willbe too few contour lines to adequatelyportray the topography.
Another thing: By convention, everyfifth contour line is heavier in line
Nine rules of contours are illustratedin Figure 2.21. Two additional rulesare:
(1) Contours do not cross one another.(2) Individual contours do not branch.Contours appear to branch in cases ofvertical cliffs, but the apparent branchesare actually separate contour lines su-perposed on one another.
Contour interval—The succession ofelevation values represented by contourlines is commonly graduated in somemultiple of five or ten feet. The choiceof contour interval depends on (a) the
42 Maps
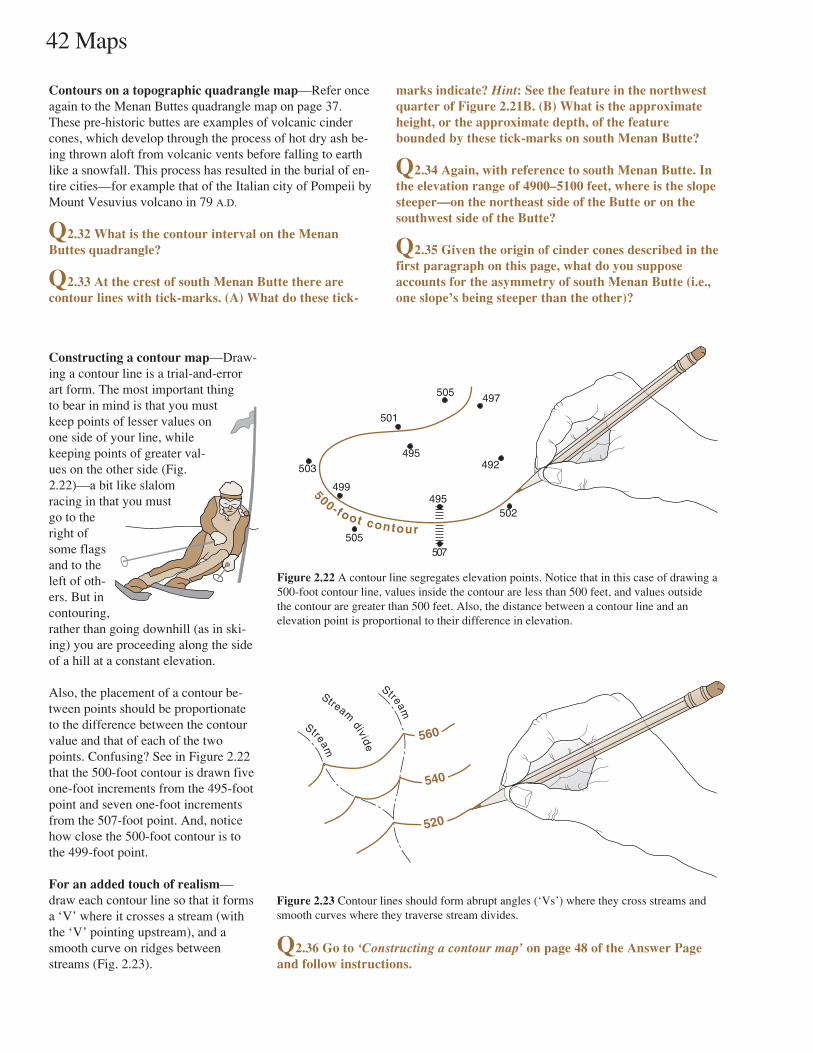
Constructing a contour map—Draw-ing a contour line is a trial-and-errorart form. The most important thingto bear in mind is that you mustkeep points of lesser values onone side of your line, whilekeeping points of greater val-ues on the other side (Fig.2.22)—a bit like slalomracing in that you mustgo to theright ofsome flagsand to theleft of oth-ers. But incontouring,rather than going downhill (as in ski-ing) you are proceeding along the sideof a hill at a constant elevation.
Also, the placement of a contour be-tween points should be proportionateto the difference between the contourvalue and that of each of the twopoints. Confusing? See in Figure 2.22that the 500-foot contour is drawn fiveone-foot increments from the 495-footpoint and seven one-foot incrementsfrom the 507-foot point. And, noticehow close the 500-foot contour is tothe 499-foot point.
For an added touch of realism—draw each contour line so that it formsa ‘V’ where it crosses a stream (withthe ‘V’ pointing upstream), and asmooth curve on ridges betweenstreams (Fig. 2.23).
Figure 2.23 Contour lines should form abrupt angles (‘Vs’) where they cross streams andsmooth curves where they traverse stream divides.
Q2.36 Go to ‘Constructing a contour map’ on page 48 of the Answer Pageand follow instructions.
Contours on a topographic quadrangle map—Refer onceagain to the Menan Buttes quadrangle map on page 37.These pre-historic buttes are examples of volcanic cindercones, which develop through the process of hot dry ash be-ing thrown aloft from volcanic vents before falling to earthlike a snowfall. This process has resulted in the burial of en-tire cities—for example that of the Italian city of Pompeii byMount Vesuvius volcano in 79 A.D.
Q2.32 What is the contour interval on the MenanButtes quadrangle?
Q2.33 At the crest of south Menan Butte there arecontour lines with tick-marks. (A) What do these tick-
marks indicate? Hint: See the feature in the northwestquarter of Figure 2.21B. (B) What is the approximateheight, or the approximate depth, of the featurebounded by these tick-marks on south Menan Butte?
Q2.34 Again, with reference to south Menan Butte. Inthe elevation range of 4900–5100 feet, where is the slopesteeper—on the northeast side of the Butte or on thesouthwest side of the Butte?
Q2.35 Given the origin of cinder cones described in thefirst paragraph on this page, what do you supposeaccounts for the asymmetry of south Menan Butte (i.e.,one slope’s being steeper than the other)?
Figure 2.22 A contour line segregates elevation points. Notice that in this case of drawing a500-foot contour line, values inside the contour are less than 500 feet, and values outsidethe contour are greater than 500 feet. Also, the distance between a contour line and anelevation point is proportional to their difference in elevation.
500-foot contour
507
502495
497505
503
505
501
495
499
492
560
540
520
Stream
Stream
Stream
divide

Maps 43
1,000 ft.
500 ft.
0 ft.
200
A
1,000 ft.
500 ft.
0 ft.
B
300
400
500
1,000 ft.
500 ft.
0 ft.
Important (Fig. 2.26): For maximumauthenticity, where your profile crossesa valley or a hilltop, you should extendyour profile toward—but not all theway to—the next contour value. Afterall, it’s not likely that the bottom of avalley or the top of a hill would be pre-cisely at a contour-interval value—thereby indicating that the valley or thehilltop is perfectly flat.
Step 2 (Fig. 2.25)—Connect the dotson your profile graph. Voilá! You haveconstructed a topographic profile.
Constructing a topographic profile—Drawing a topographic profile—a sideview of a landscape—along profile lineA-B in Figure 2.24.
The base for a topographic profile con-sists of two graphic elements:
(1) A vertical scale appropriate to therelief (i.e., the range of elevations). InFigure 2.24 the vertical scale is 1,000feet per inch.
(2) Horizontal guidelines on a gradu-ated profile grid as per the contour in-terval. In Figure 2.24 the contour inter-val is 100 feet.
Step 1 (Fig. 2.24)—Where a contourline intersects the profile line A-B onthe map, project the value of that con-tour straight down to the guideline ofthat same value on your profile grid.You can orient a straight-edge perpen-dicular to the profile line to use as aguide in placing points on your profile.)
Q2.37 Go to ‘Constructing a topo-graphic profile’ (Fig. 2.34) across BigIsland, Hawaii, on page 49 of theAnswer Page and follow instructions.
Figure 2.26 The bottoms of valleys typically extenda bit below the lowest elevation points, and thecrests of hilltops typically extend a bit above thehighest elevation points.
Figure 2.24 Points where the line of profile (A–B) intersects contour lines should beprojected straight down onto a profile graph. (Here a transparent ruler serves as a guidefor plotting points directly beneath the line of profile.)
Figure 2.25 Connecting points that were plotted in Figure 2.24.
44 Maps
Viewing a stereogram—In order to view a stereogram (Fig. 2.30), you must ori-ent your manual so that the seam between photos is parallel to the bridge of yournose. In cases where the seam runs across the page, rather than up-and-down, youmust turn your manual clockwise or counterclock-wise 90°. A sketch of your stereoscope ac-companies each stereogram to serve as aguide to orienting your stereoscope.
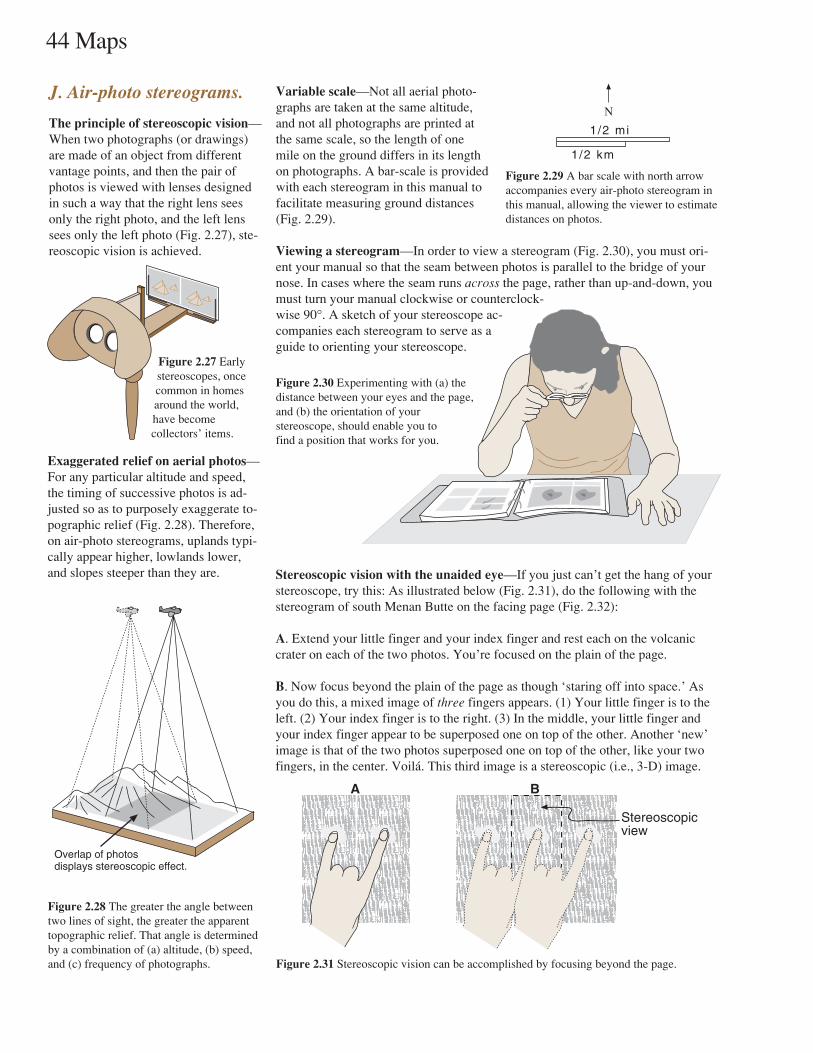
J. Air-photo stereograms.
Figure 2.27 Earlystereoscopes, oncecommon in homesaround the world,have becomecollectors’ items.
The principle of stereoscopic vision—When two photographs (or drawings)are made of an object from differentvantage points, and then the pair ofphotos is viewed with lenses designedin such a way that the right lens seesonly the right photo, and the left lenssees only the left photo (Fig. 2.27), ste-reoscopic vision is achieved.
Figure 2.28 The greater the angle betweentwo lines of sight, the greater the apparenttopographic relief. That angle is determinedby a combination of (a) altitude, (b) speed,and (c) frequency of photographs.
Figure 2.30 Experimenting with (a) thedistance between your eyes and the page,and (b) the orientation of yourstereoscope, should enable you tofind a position that works for you.
Overlap of photosdisplays stereoscopic effect.
Exaggerated relief on aerial photos—For any particular altitude and speed,the timing of successive photos is ad-justed so as to purposely exaggerate to-pographic relief (Fig. 2.28). Therefore,on air-photo stereograms, uplands typi-cally appear higher, lowlands lower,and slopes steeper than they are.
Variable scale—Not all aerial photo-graphs are taken at the same altitude,and not all photographs are printed atthe same scale, so the length of onemile on the ground differs in its lengthon photographs. A bar-scale is providedwith each stereogram in this manual tofacilitate measuring ground distances(Fig. 2.29).
1/2 km
1/2 mi
N
Figure 2.29 A bar scale with north arrowaccompanies every air-photo stereogram inthis manual, allowing the viewer to estimatedistances on photos.
Stereoscopic vision with the unaided eye—If you just can’t get the hang of yourstereoscope, try this: As illustrated below (Fig. 2.31), do the following with thestereogram of south Menan Butte on the facing page (Fig. 2.32):
A. Extend your little finger and your index finger and rest each on the volcaniccrater on each of the two photos. You’re focused on the plain of the page.
B. Now focus beyond the plain of the page as though ‘staring off into space.’ Asyou do this, a mixed image of three fingers appears. (1) Your little finger is to theleft. (2) Your index finger is to the right. (3) In the middle, your little finger andyour index finger appear to be superposed one on top of the other. Another ‘new’image is that of the two photos superposed one on top of the other, like your twofingers, in the center. Voilá. This third image is a stereoscopic (i.e., 3-D) image.
A
Stereoscopicview
B
Figure 2.31 Stereoscopic vision can be accomplished by focusing beyond the page.
Maps 45
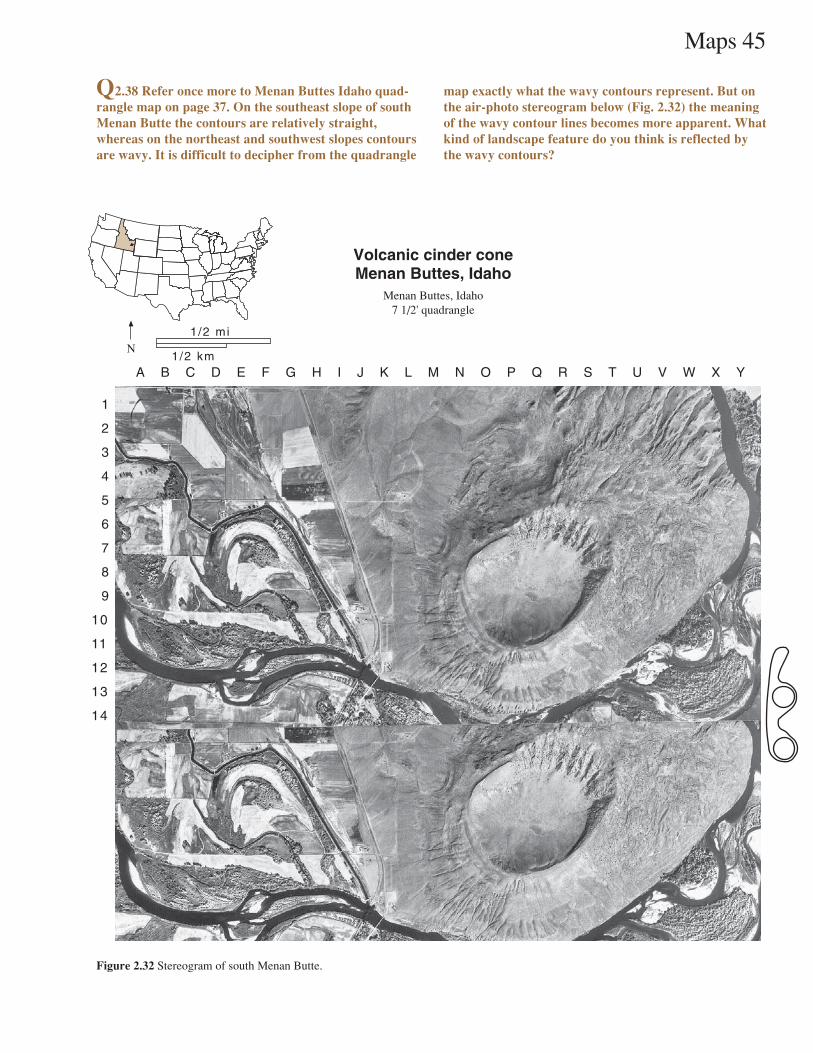
Q2.38 Refer once more to Menan Buttes Idaho quad-rangle map on page 37. On the southeast slope of southMenan Butte the contours are relatively straight,whereas on the northeast and southwest slopes contoursare wavy. It is difficult to decipher from the quadrangle
map exactly what the wavy contours represent. But onthe air-photo stereogram below (Fig. 2.32) the meaningof the wavy contour lines becomes more apparent. Whatkind of landscape feature do you think is reflected bythe wavy contours?
Figure 2.32 Stereogram of south Menan Butte.
Volcanic cinder coneMenan Buttes, Idaho
Menan Buttes, Idaho7 1/2' quadrangle
A B C D E F G H I J K L M N O P Q R S T U V W X Y
1
2
3
4
5
6
7
8
9
10
11
12
13
14
N1/2 km
1/2 mi
MD.
46 Maps
Intentionally Blank
Maps 47
2.12 (A)
(B)
(C)
(D)
2.13
2.14
2.15
2.16
2.17
2.18 (A) (B)
(C)
2.19 (A) (B)
2.20 (A) (B)
2.21
2.1
2.2
2.3
2.4
2.5
2.6
2.7 (A) (B)
2.8
2.9
2.10 (A) (B) (C)
2.11 (A)
(B)
(Student’s name) (Day) (Hour)
(Lab instructor’s name)
ANSWER PAGE
48 Maps
2.29
2.30
2.31
2.32
2.33 (A) (B)
2.34
2.35
2.38
2.22
2.23
2.24
2.25
2.26
2.27 (A)
(B)
2.28 (A) (B)
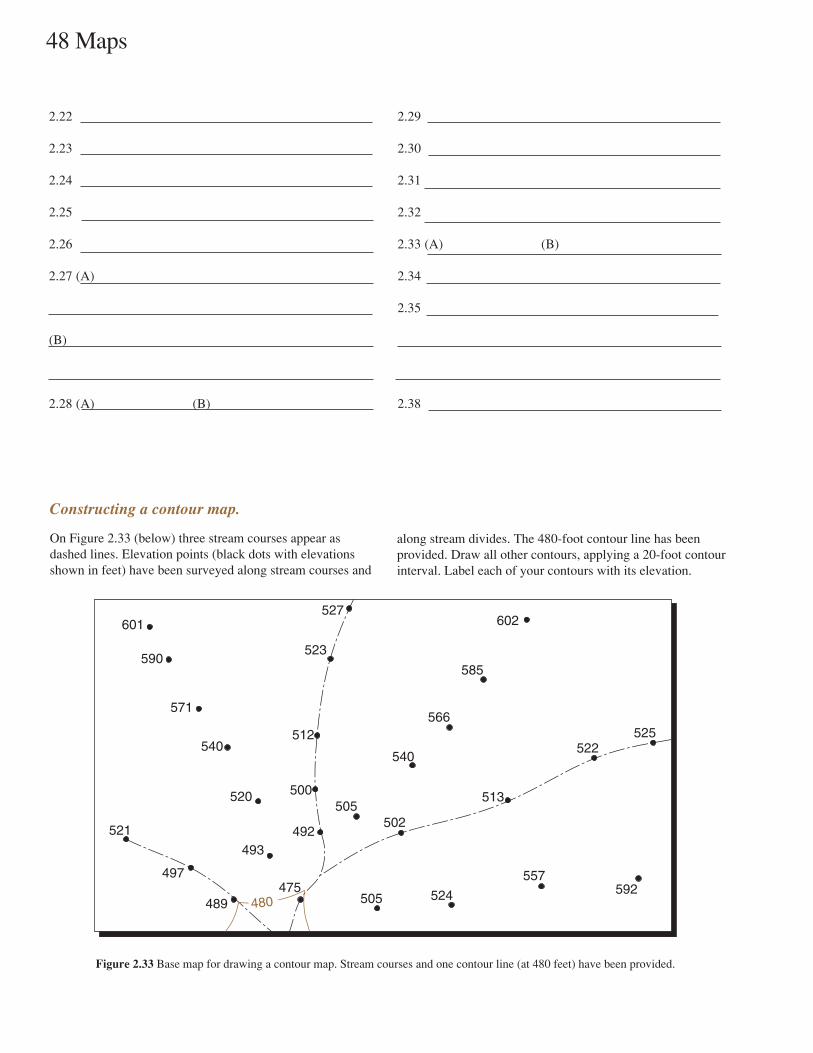
Figure 2.33 Base map for drawing a contour map. Stream courses and one contour line (at 480 feet) have been provided.
On Figure 2.33 (below) three stream courses appear asdashed lines. Elevation points (black dots with elevationsshown in feet) have been surveyed along stream courses and
along stream divides. The 480-foot contour line has beenprovided. Draw all other contours, applying a 20-foot contourinterval. Label each of your contours with its elevation.
Constructing a contour map.
601
590
571
540
520
521
497
489475
505 524
557592
525522
513
502492
540
566
585
602527
500
512
523
505
493
480
Maps 49
Kohala
Mauna Kea (highest pt. in Hawaii)
Hualalai
Kailuha Kona
Mauna Loa
Kilauea
10,000
5,000
5,000
10,000
Big IslandHAWAII
Hawaii Volcanoes National Park
A B
Hilo
10 mi0
10 km0N
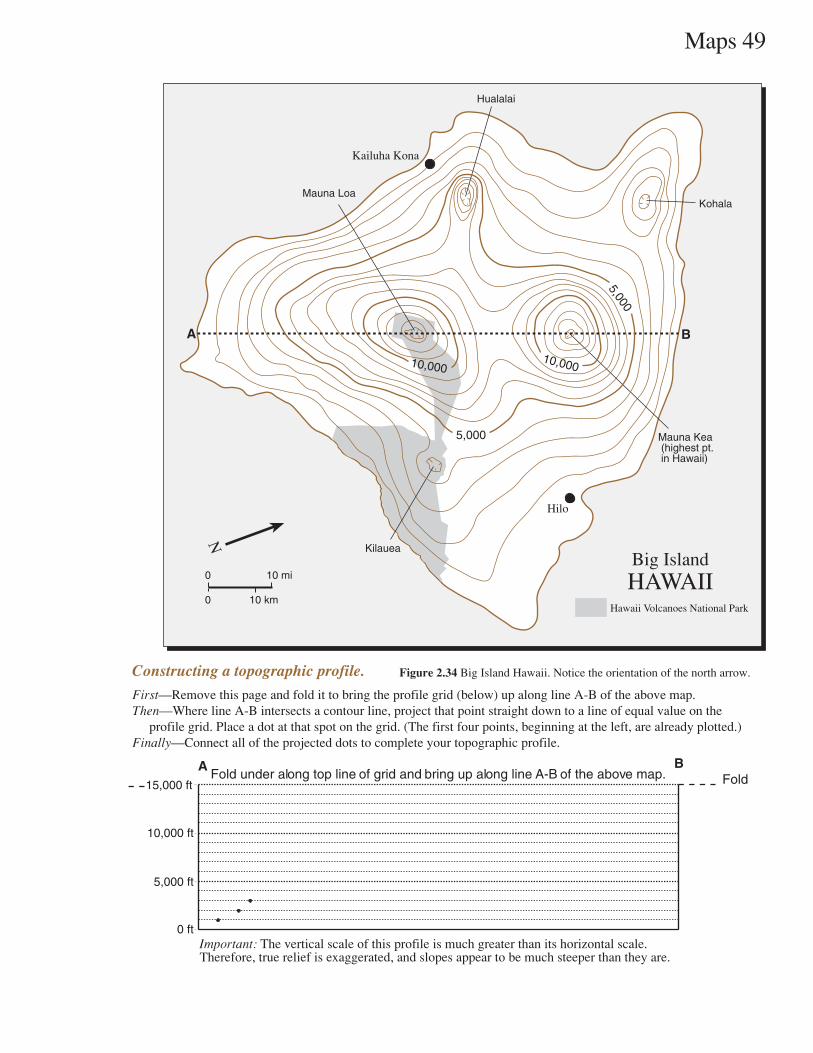
Constructing a topographic profile.
First—Remove this page and fold it to bring the profile grid (below) up along line A-B of the above map.Then—Where line A-B intersects a contour line, project that point straight down to a line of equal value on the profile grid. Place a dot at that spot on the grid. (The first four points, beginning at the left, are already plotted.)Finally—Connect all of the projected dots to complete your topographic profile.
Figure 2.34 Big Island Hawaii. Notice the orientation of the north arrow.
A B
10,000 ft
5,000 ft
0 ft
Fold under along top line of grid and bring up along line A-B of the above map. Fold
Important: The vertical scale of this profile is much greater than its horizontal scale.Therefore, true relief is exaggerated, and slopes appear to be much steeper than they are.
15,000 ft

50 Maps
Intentionally Blank