1q results presentation may 15, 2018bvb.ro/infocont/infocont18/wine_conference_call_ q1_...
TRANSCRIPT

Page 1
Purcari Wineries Plc
1Q results presentation
May 15, 2018

Page 2
Disclaimer
THIS PRESENTATION IS MADE AVAILABLE ON THIS WEBSITE BY PURCARI WINERIES PUBLIC COMPANY LIMITED (the Company) AND IS FOR INFORMATION PURPOSES ONLY.
This presentation and its contents do not, and are not intended to, constitute or form part of, and should not be construed as, constituting or forming part of, any actual offer or invitation to sell or issue, or any
solicitation of any offer to purchase or subscribe for, any shares issued by the Company and its subsidiary undertakings (the Group) in any jurisdiction, or any inducement to enter into any investment activity
whatsoever; nor shall this document or any part of it, or the fact of it being made available, form the basis of an offer to purchase or subscribe for shares issued by the Company, or be relied on in any way
whatsoever.
No part of this presentation, nor the fact of its distribution, shall form part of or be relied on in connection with any contract for acquisition of or investment in any member of the Group, nor does it constitute a
recommendation regarding the securities issued by the Company, nor does it purport to give legal, tax or financial advice. The recipient must make its own independent assessment and such investigations as it
deems necessary.
The information herein, which does not purport to be comprehensive, has not been independently verified by or on behalf of the Group, nor does the Company or its directors, officers, employees, affiliates, advisers
or agents accepts any responsibility or liability whatsoever for / or make any representation or warranty, either express or implied, in relation to the accuracy, completeness or reliability of such information, which is
not intended to be a complete statement or summary of the business operations, financial standing, markets or developments referred to in this presentation. No reliance may be placed for any purpose whatsoever
on the information contained in this presentation. Where this presentation quotes any information or statistics from any external source, it should not be interpreted that the Company has adopted or endorsed such
information or statistics as being accurate. Neither the Company, nor its directors, officers, employees or agents accepts any liability for any loss or damage arising out of the use of any part of this material.
This presentation may contain statements that are not historical facts and are “forward-looking statements”, which include, without limitation, any statements preceded by, followed by or that include the words
"may", "will", "would", "should", "expect", "intend", "estimate", "forecast", "anticipate", "project", "believe", "seek", "plan", "predict", "continue", "commit", "undertake" and, in each case, similar expressions or their
negatives. These forward-looking statements include all matters that are not historical facts. Such forward-looking statements involve known and unknown risks, uncertainties and other important factors beyond the
Company's control, and relate to events and depend on circumstances that may or may not occur in the future, which could cause the Company's actual results, performance or achievements to be materially
different from future results, performance or achievements expressed or implied by such forward-looking statements. The forward-looking statements included herein are based on numerous assumptions and are
intended only to illustrate hypothetical results under those assumptions. As a result of these risks, uncertainties and assumptions, you should in particular not place reliance on these forward-looking statements as
a prediction of actual results, or a promise or representation as to the past or future, nor as an indication, assurance or guarantee that the assumptions on which such future projections, expectations, estimates or
prospects have been prepared or the information or statements herein are accurate or complete. Past performance of the Group cannot be relied on as a guide to future performance. No statement in this
presentation is intended to be a profit forecast. This presentation does not purport to contain all information that may be necessary in respect of the Company or its Group and in any event each person receiving
this presentation needs to make an independent assessment.
This presentation contains references to certain non-IFRS financial measures and operating measures. These supplemental measures should not be viewed in isolation or as alternatives to measures of the
Company’s financial condition, results of operations or cash flows as presented in accordance with IFRS in its consolidated f inancial statements. The non-IFRS financial and operating measures used by the
Company may differ from, and not be comparable to, similarly titled measures used by other companies.
The information presented herein is as of this date and the Company undertakes no obligation to update or revise it to reflect events or circumstances that arise after the date made or to reflect the occurrence of
unanticipated events.
The distribution of this presentation in certain jurisdictions may be restricted by law and persons who come into possession of it are required to inform themselves about and to observe such restrictions and
limitations. Neither the Company, nor its directors, officers, employees, affiliates, advisers or agents accepts any liability to any person in relation to the distribution or possession of the presentation in or from any
jurisdiction.
Investments in the Company’s shares are subject to certain risks. Any person considering an investment in the Company’s shares should consult its own legal, accounting and tax advisors in order to make an
independent determination of the suitability and consequences of such an investment

Page 3
TODAY’S PRESENTERS
Founded the Group
in 2002
Over 35 years of
experience in wine
industry
Built and exited one
of the largest wine
companies in RU
Technical University,
Oenology
Speaks FR, RO, RU
Victor BostanCEO, Founder
Victor ArapanCFO
20 years of experience
in banking, audit,
corporate finance
10+ years experience
in wine making
companies
Ex-PWC, Acorex
Wineries
International
Management Institute,
finance
Speaks EN, RO, RU
Vasile TofanChairman
Over 10 years
experience in FMCG
Partner at Horizon
Capital, $700m+ AUM
Ex- Monitor Group,
Philips
MBA Harvard
Business School
Speaks EN, RO, RU,
FR, NL
John MaxemchukCOO
20 years of
management
experience, including
over 10 years in
Moldova
Ex-MetroMedia,
Sun/Orange, AT&T
Wharton, MBA Harvard
Business School
Speaks EN, RO
Diana DurnescuIR Manager
Over 5 years of
experience in
business development
and FDI attraction
Ex-Prime Minister's
office for FDI
Academy of Economic
Studies
Speaks EN, RO, RU

Page 4
AGENDA
1 Our GroupRose de Purcari,
90 points by
Wine Enthusiast,
#1 premium Rosé in
Romania2 1Q2018 Operational Results
3 Update on 2018 Outlook
4 Q&A

Page 5
OUR GROUP: COMPETITIVE ADVANTAGE IN A GREAT MARKET1
Attractive
market
Competitive
advantage
#1 premium wine
brand in
Romania
#1 most awarded
CEE winery at
Decanter, “wine
Olympics”
#1 fastest growing
large winery in
Romania
#2 EBITDA
margin among
global publicly
traded wine peers
#1 on Instagram,
Vivino engaging
millennials in
Romania
Secular shift from
beer, spirits to
wine, especially
in CEE
Plenty to catch up:
wine consumption
in Poland = ¼
Germany, per cap.
Shrinking vine
plantations,
create shortage,
push prices up
Romania+Moldova
undisputable #1
vineyards size in
CEE, 5x vs #2
Wine growth ’16-
’20F in Romania
9.0% vs. 1.9% for
beer

Page 6
OUR BUSINESS MODEL: AFFORDABLE LUXURY
Modern,
cost-competitive
winemaking
Affordable
Luxury
Differentiated
marketing
Purcari is positioned at the
intersections of three themes:
Modern winemaking: the
company is brand, as opposed
to appellation centric and runs a
cost-efficient business
Affordable luxury: as an
aspirational brand, Purcari
wines are an example of
affordable luxury, building on a
heritage dating back to 1827
and ranking among most
awarded wineries in Europe
Differentiated marketing: the
company is not afraid to be
quirky about the way it
approaches marketing,
prioritizing digital channels and
focusing on engaging content as
opposed to traditional
advertising
1

Page 7
Our mission
Our vision
Our values
To become the undisputable wine
champion in CEE, acting as a
consolidator of a fragmented industry
To bring joy in people’s lives, by
offering them high quality, inspiring,
ethical wines and excellent value for
money.
HungryWe win in the marketplace because we want it more
EthicalAlways do the right thing and the money will follow
ThriftyThe only way we can offer better value for money
DifferentWe proud ourselves on taking a fresh look on things
BetterWe keep improving – both our wines and our people
1 OUR MISSION, VISION AND VALUES

Page 8
VISION: BE THE CONSOLIDATOR OF A FRAGEMENTED MARKET
Volume share top-3 players by country, %
As wine market moves from terroir- to brand-centric and leaders build scale /
sophistication, the market is ripe for consolidation
#1
#2
#3
Source: Euromoniitor 2016, market share for top-3 players in the still wine category; *excludes Murfatlar, in insolvency
1
Beer
68
Spirits Wine
18
82
Beer
79
Spirits Wine
4139*
10
Beer Spirits Wine
74
63
77
Beer Spirits
36
Wine
67

Page 9
CLEAR #1 IN PREMIUM IN ROMANIA, KEEP GAINING SHARE
Notes: (1) period from December 2017 to January 2018; (2) period from February 2017 to January 2018
Sources: Nielsen report; Purcari Group = Purcari, Crama Ceptura and Bostavan brands; Lacrima lui Ovidiu brand
1616
1615
1111
12
12
11
12 1211
56
6
88
34
5
7
9
2014 2015 2016 2017 2018
6
4
8
2
10
14
16
12
18
11
13
10
Overall, Purcari has tripled MS in 4 years….
Cotnari
Cramele Recas
Purcari (Group)
Vincon
Jidvei
Value share of TOTAL retail market, Romania, % Value share of Premium (RON 30+/liter) retail market, %
…while becoming a clear #1 in Premium
19
23
9
14
16
13
7
5 5 5
16
11
2
5
0
2
4
6
8
10
12
14
16
18
20
22
24
2014 2015 2016 2017
12
87
13
4
12
Segarcea
Purcari (Brand)
Crama Ceptura
Samburesti
Murfatlar* 27% MS in
Premium for
Group, with 2
brands in top-5
(2)(1)

Page 10
TOPPING ROMANIAN WINERIES AT ENGAGEMENT, QUALITY
Note: Purcari - #purcari, Cramele Recas - #recas, Jidvei - #jidvei, Cotnari - #cotnari, Budureasca - #budureasca, Samburesti - #samburesti, Segarcea - #segarcea
Sources: Instagram, Vivino as of May 11 2018
Aspirational brand which consumers like sharing about
Number of #brand uses on Instagram, by key Romanian brands
Highest number of ratings and highest scores on Vivino
X axis – number of Vivino ratings; Y axis – average Vivino score
7,360
3,362 3,308
1,279
649 607267
3.0
3.1
3.2
3.3
3.4
3.5
3.6
3.7
3.8
3.9
4.0
0 5,000 10,000 15,000 20,000

Page 11
EBITDA margin – global peer group
33%32%
29%
21%
18% 18%
16%
14%13% 13%
10% 10%
6%
4%
15%
EBITDA margin 2017, %Median
Source: IFRS Consolidated Financial Statements of the Group, Capital IQ data as of 11 May 2018 ; all figures are based on data in the functional currency of each company
(1) Financial year ends as of 06/30; e.g. for 2016, financial statements as of 06/30/2017 were taken into account
(2) Financial year ends as of 03/31; e.g. for 2016, financial statements as of 03/31/2017 were taken into account
(3) Financial statements as of 12/31/2016 were taken into account, as FY2017 financial statements are not yet available
TOP OF PEER GROUP MARGIN WISE; STILL ROOM TO GROW
(1)(1)
(1)(2)
Zhejiang
Guyuelongshan
Shaoxing Wine
(3)

Page 12
AGENDA
1 Our Group
2 1Q2018 Operational Results
3 Update on 2018 Outlook
4 Q&A
Crama Ceptura –
Astrum, the latest
introduction in the
Ceptura line-up,
targeting the 15-20
RON/bottle segment,
which accounts for
circa 20% of market
sales, which the
Group started
pursuing only in
2017
Page 13
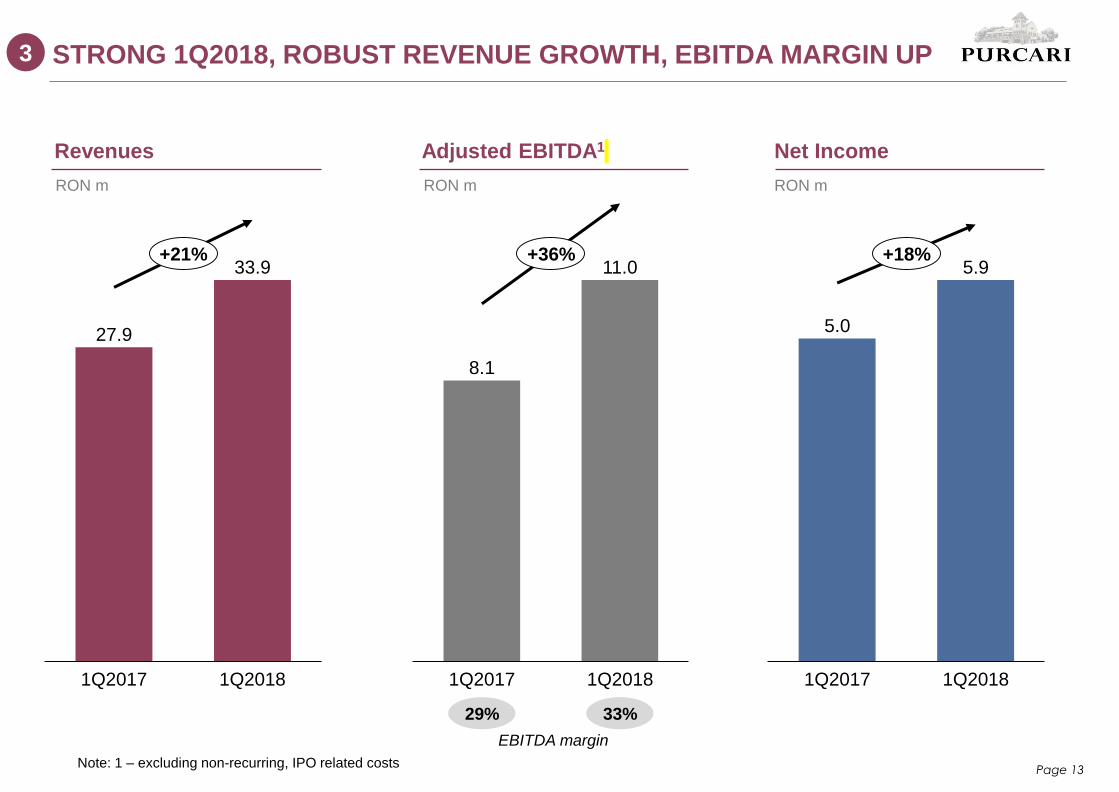
STRONG 1Q2018, ROBUST REVENUE GROWTH, EBITDA MARGIN UP3
27.9
33.9
1Q20181Q2017
+21%
8.1
11.0
1Q2017 1Q2018
+36%
5.0
5.9
1Q2017 1Q2018
+18%
Revenues Adjusted EBITDA1 Net Income
RON m RON m RON m
Note: 1 – excluding non-recurring, IPO related costs
29% 33%
EBITDA margin

Page 14
1 KEY OPERATIONAL HIGHLIGHTS FOR 1Q18
Solid revenue
growth
Strong margins,
despite adverse Fx
Excellent traction
on sparkling
Ready for summer
with top whites,
rosés
Maintain outlook
for 2018
• Sales up 21% yoy, to RON 33.9m; strong shipments in 4Q17, put some pressure on 1Q deliveries
• Romania remains largest growth driver, up 32% yoy
• Maintained premiumization trend, with Purcari, Bardar, Ceptura growing much faster than Bostavan
• Gross margin up 2.3pp vs 1Q17, to 46%, on improved mix, prices and despite adverse FX
• SG&A costs up 34% on increased legal, administrative and travel costs, as well as expansion of
management team; management closely watches the costs looking for optimization.
• Adj. EBITDA up 36% to RON 11m; adj EBITDA margin up 3.4pp to 32.6%
• Strong consumer & critics reception for Sparling launch (1 gold, 2 silvers at Effervescents du Monde)
• Sparkling now ~2% of our sales in 1Q, despite seasonality strongly skewed to 4Q
• The 2017 white and rose 2017 vintages, already released, are arguably the best we’ve had
• Puts us in strong position to compete vs. other wines (and beer) as the refreshing drink of choice
• Optimistic outlook on 2018, on favorable pricing environment, strong 2017 harvest
• Organic revenues growth guidance +24-28%
• EBITDA margin 33-36% and Net Income margin 23-26%, assuming no Fx improvements

Page 15
MARKETS: ROMANIA LARGEST AND HIGHEST GROWTH MARKET3
Market Share of sales, 1Q18, % Growth, 1Q18 yoy, % Comments
RO
MD
PL
ASI
CZ
SK
UA
RoW
43%
20%
11%
5%
5%
3%
14%
+32%
+48%
16%1
-40%
-11%
-25%
+59%
• RO: Crama Ceptura brand main growth driver up +37%;
Purcari brand up +26%.
• MD: very strong growth across brand portfolio, pushed in
particular by successful introduction of sparkling, and great
traction of brandy
• PL: good traction with all key partners, including Partner
Center, Eurocash and Tim; push on premium Purcari brand
• ASIA: overhang from 4Q18 shipments, which arrived late to
China (12 containers took circa 70 days to arrive instead of
customary 40), pushing back the follow on orders from largest
distributor
• CZ,SK: strong traction in Czechia offset by financially
stretched distributor in Slovakia. Shipments stopped as
exceeding credit limits. Contract signed with new distributor.
Sales expected to recover swiftly.
• UA: delay of a large shipment to 2Q affected 1Q results.
Sellout from distributors, retail good. Market performs in line
with expectations.
Note: 1 – like for like sales, adjusting for moving out the (pan-CEE) Tesco account sales, previously reported under Poland; now Tesco sales are
not broken down by country anymore.

Page 16
BRANDS: PREMIUM PURCARI MAIN GROWTH DRIVER3
Brand Share of sales, 2017, % Growth, 2017 yoy, % Comments
37%
31%
18%
14%
+14%
+3%
+31%
+108%
• PURCARI: solid traction across markets, including key
market of Romania. Lower volumes to Asia, on
overhang from 4Q17
• BOSTAVAN: underwhelming performance, mainly due
to lower shipments to Slovakia (distressed distributor)
and Romania (brand deprioritized as focus on Purcari,
Ceptura) though strong traction in Czechia, Poland
• CRAMA CEPTURA: strong traction across range
including excellent off-take of the Astrum series
positioned in the strategic 15-20 RON bottle segment,
previously not targeted by the company
• BARDAR: continued shift from bulk to bottled brandy,
started in 2015; expect to remain fastest growing brand
in company portfolio

Page 17
MARGINS: SOLID DESPITE ADVERSE FX EFFECTS3
Comments
• Gross margin up 2.3pp, on improved mix given ongoing
premiumization of portfolio and select price increases
‒ Improvement in margin despite adverse Fx effect, given MDL
appreciated 6.4% vs. 1Q17. MDL rate significantly affects
COGS given wine inventories from 2017 harvest are kept on
balance largely in MDL
• SG&A costs up 34% on increased legal, administrative and
travel costs, as well as expansion of management team.
• Adj. EBITDA up 36%, to RON 11.0m and Net Income up 18% to
RON 5.9m
Note: (1) Adj. EBITDA is gross of non-recurrent, one-off IPO related expenses accrued in 2017
RON m 1Q17 1Q18∆
’18/’17
Revenue 27.9 33.9 21%
Cost of Sales (15.7) (18.3) 16%
Gross Profit 12.2 15.6 28%
Gross Profit margin 44% 46% -
SG&A (5.4) (7.3) 34%
Marketing and selling (2.2) (3.3) 54%
General and Administrative (4.3) (6.1) 42%
Other income/(expense) 1.0 2.1 112%
EBITDA 8.1 10.2 26%
Adj. EBITDA1 8.1 11.0 36%
Adj. EBITDA margin 29% 33% -
Net Profit 5.0 5.9 18%
Net Profit Margin 18% 17% -
Net profit after minorities 4.2 4.9 18%
Net profit margin, after min 15% 15%

Page 18
MDL APPRECIATED STRONGLY, ADVERSELY IMPACTING MARGINS
15
16
17
18
19
20
21
2016 2017 2018
MDL vs USD: 2016 – 2018 FX evolutionMDL vs EUR: 2016 – 2018 FX evolutionMDL vs RON: 2016 – 2018 FX evolution
17
18
19
20
21
22
23
24
2016 2017 2018
4
4.2
4.4
4.6
4.8
5
5.2
2016 2017 2018
Sources: National Bank of Moldova as of May 11 2018
11.4% 7.5% 19.9%
6.4% 3.3% 19.2%
MDL appreciation vs. 1Q16
MDL appreciation vs. 1Q17

Page 19
Challenge International du Vin’s leading medal-winning winery in CEE
# of medals at 2018 competition
9
5 5
4 4
3 3 3 3
#1
Note: (1) Purcari Group (ie Purcari, Crama Ceptura & Bostavan brands)
Sources: Challenge International du Vin
(1
)
WINES – OFF TO A GREAT START IN 2018
Page 20
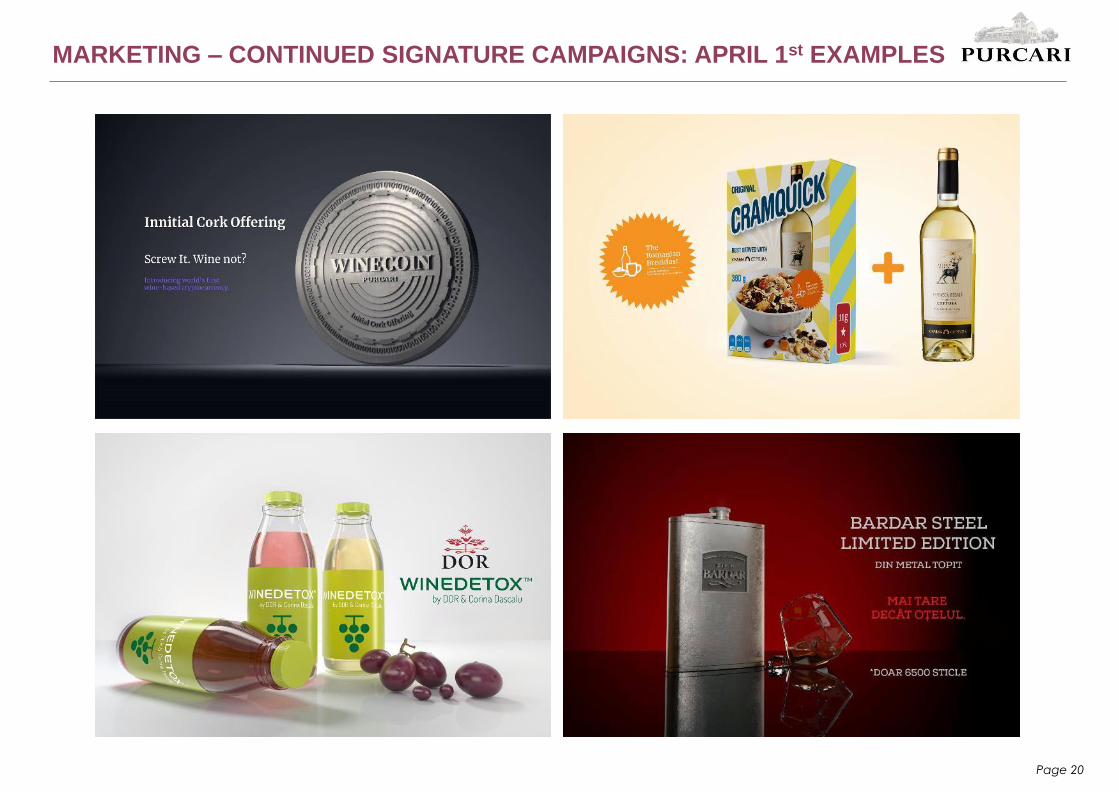
MARKETING – CONTINUED SIGNATURE CAMPAIGNS: APRIL 1st EXAMPLES

Page 21
AGENDA
1 Our Group
2 1Q2018 Operational Results
3 Update on 2018 Outlook
4 Q&A
Negru de Purcari
2013, 4.4 score on
Vivino, top 1% wine
globally

Page 22
WE MAINTAIN OUR GUIDANCE FOR 20183
Target FY18 1Q18 Status Comments
Organic revenue growth
EBITDA margin1
Net Income margin
+24-28% 21%
33-36% 33%
23-26% 17%
• Strong shipments in 4Q17, mainly Asia,
limited somewhat primary sales in 1Q18
• We stick to 24-28% guidance for FY18,
given 1Q seasonally smallest quarter and
79-82% of sales are done in 2Q-4Q2
• Good EBITDA margin despite ongoing
adverse Fx on MDL appreciation
• EBITDA margin typically higher in quarters
with larger sales (disproportionate EBITDA
is made in Q3-Q4)
• 1Q margin affected by higher interest
expense on MDL appreciation, ROBOR rise
• Net Income margin typically higher in
quarters with larger sales (disproportionate
Net Income is made in Q3-Q4)
Note: 1 – excluding non-recurring, IPO related costs; 2 – quarterly seasonality based on 2014-2016 data, as shared in IPO Prospectus

Page 23
READY FOR SUMMER: SUPERB 2017 VINTAGE WHITES; CHEERS!
Vivino: among the top 7% wines in the world
Very very very good rose! Full of fruits and
flavors! And fresh at the sane time!
Good summer wine, fresh and rich aromas,
mostly floral and citric aromas, citrus is well
incorporated in the taste too, well balanced, it
goes even with a splash of water. I enjoyed it.
Fresh and crisp, very floral nose, new world
style, citric and elderflower taste. Very good
value for money
Bags of fruitiness predominated by notes of
pear drops. A light and refreshing summer
wine.
Source: Vivino

Page 24
AGENDA
1 Our Group
2 1Q2018 Operational Results
3 Update on 2018 outlook
4 Q&A
Cuvée de Purcari,
the extension to
sparkling
launched in 2017.
Made according to
the traditional,
Champenoise
method, with in-
bottle fermentation

Page 25
Thank
you.