1q fy2013/14 3q fy2011/12 financial results presentation...
TRANSCRIPT
3Q FY2011/12 Investor Presentation ASEAN Stars Conference 2012 1 March 2012
Asia’s First Listed Indian Property Trust
1Q FY2013/14 Financial Results Presentation
22 July 2013
Asia’s First Listed Indian Property Trust
2
This presentation on a-iTrust’s results for the financial quarter ended 30 June 2013 (“1Q FY13/14”) should be read in conjunction with a-iTrust’s full financial statements, a copy of which is available on www.sgx.com or www.a-iTrust.com.
This presentation may contain forward-looking statements that involve risks and uncertainties. Actual future performance, outcomes and results may differ materially from those expressed in forward-looking statements as a result of a number of risks, uncertainties and assumptions. Representative examples of these factors include (without limitation) general industry and economic conditions, interest rate trends, cost of capital and capital availability, competition from other developments or companies, shifts in expected levels of property rental income and occupancy rate, changes in operating expenses (including employee wages, benefits and training, property expenses), governmental and public policy changes and the continued availability of financing in the amounts and the terms necessary to support future business. Investors are cautioned not to place undue reliance on these forward-looking statements.
All measurements of floor area are defined herein as “Super Built-up Area” or “SBA”, which is the sum of the floor area enclosed within the walls, the area occupied by the walls, and the common areas such as the lobbies, lift shafts, toilets and staircases of that property, and in respect of which rent is payable.
The Indian Rupee and Singapore Dollar are defined herein as “INR” and “SGD” respectively.
Any discrepancy between individual amounts and total shown in this presentation is due to rounding.
Disclaimer
3
• Financial review
Agenda
3
4
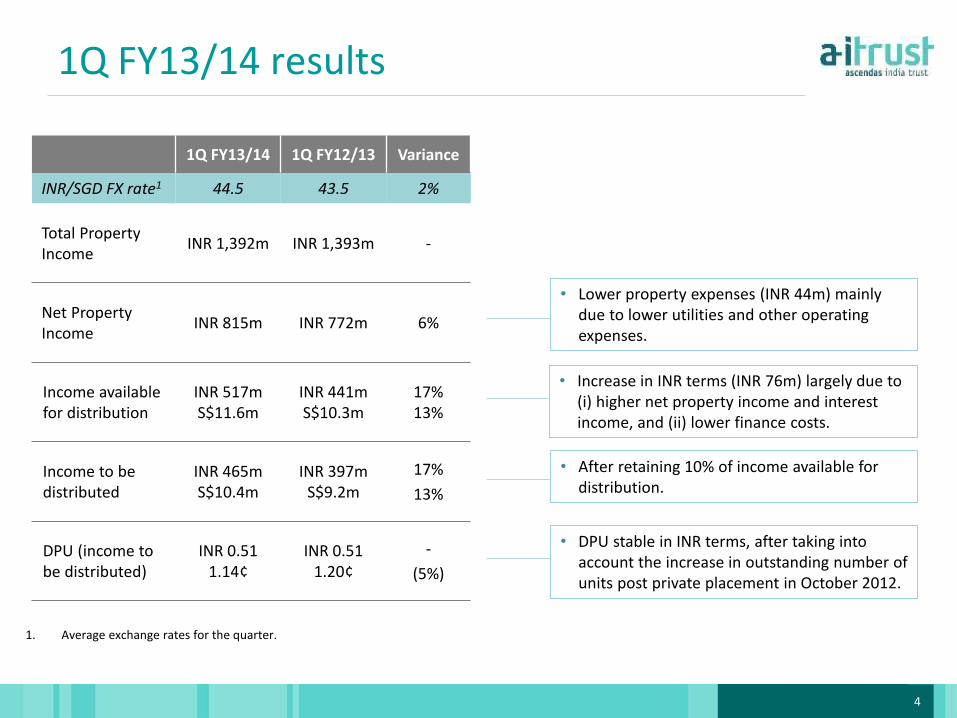
1Q FY13/14 1Q FY12/13 Variance
INR/SGD FX rate1 44.5 43.5 2%
Total Property Income
INR 1,392m INR 1,393m -
Net Property Income
INR 815m INR 772m 6%
Income available for distribution
INR 517m S$11.6m
INR 441m S$10.3m
17% 13%
Income to be distributed
INR 465m S$10.4m
INR 397m S$9.2m
17%
13%
DPU (income to be distributed)
INR 0.51 1.14¢
INR 0.51 1.20¢
-
(5%)
1Q FY13/14 results
• Increase in INR terms (INR 76m) largely due to (i) higher net property income and interest income, and (ii) lower finance costs.
• DPU stable in INR terms, after taking into account the increase in outstanding number of units post private placement in October 2012.
• Lower property expenses (INR 44m) mainly due to lower utilities and other operating expenses.
• After retaining 10% of income available for distribution.
1. Average exchange rates for the quarter.
5
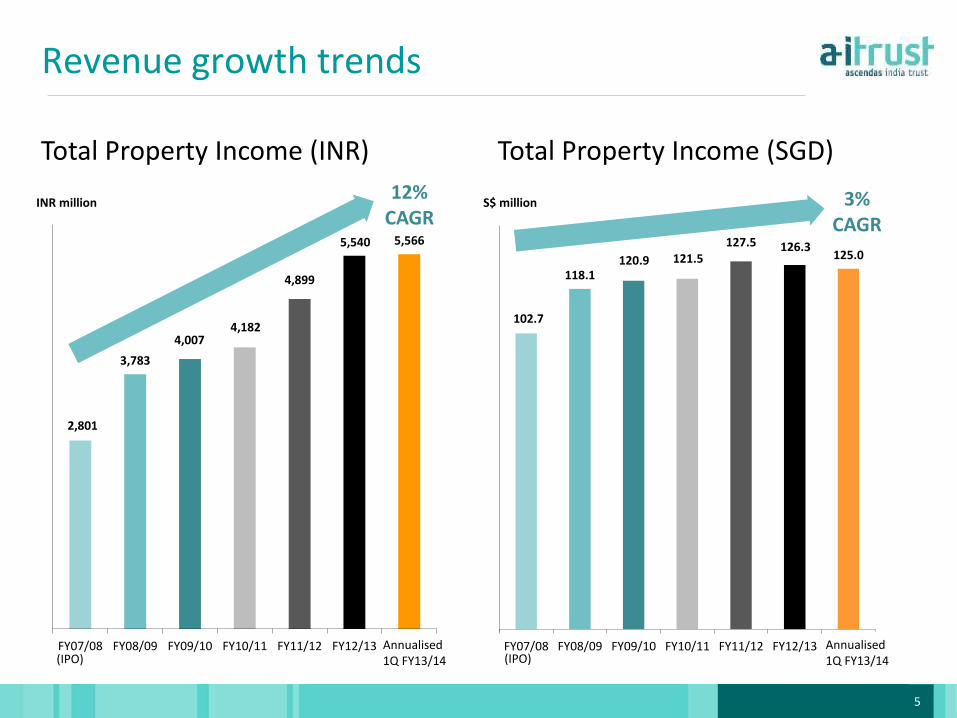
2,801
3,783
4,007 4,182
4,899
5,540 5,566
FY07/08 FY08/09 FY09/10 FY10/11 FY11/12 FY12/13 FY13/14
INR million
102.7
118.1 120.9 121.5
127.5 126.3 125.0
FY07/08 FY08/09 FY09/10 FY10/11 FY11/12 FY12/13 FY13/14
S$ million
Total Property Income (INR)
12% CAGR
Revenue growth trends
Total Property Income (SGD)
3% CAGR
(IPO) (IPO) Annualised 1Q FY13/14
Annualised 1Q FY13/14
6
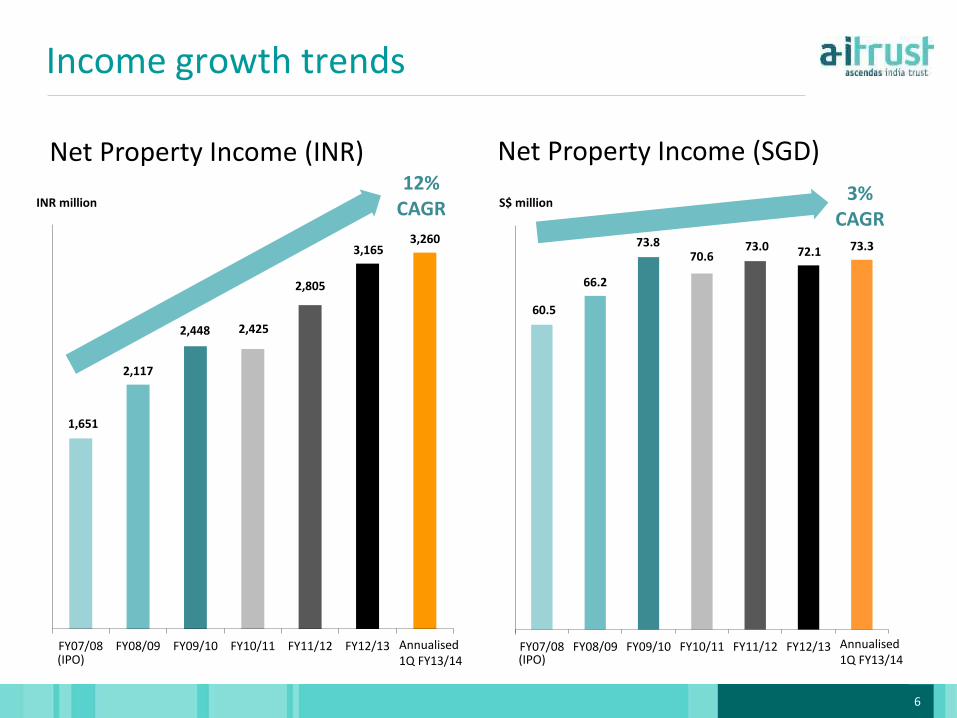
1,651
2,117
2,448 2,425
2,805
3,165 3,260
FY07/08 FY08/09 FY09/10 FY10/11 FY11/12 FY12/13 FY13/14
INR million
60.5
66.2
73.8 70.6
73.0 72.1 73.3
FY07/08 FY08/09 FY09/10 FY10/11 FY11/12 FY12/13 FY13/14
S$ million
Net Property Income (SGD)
Income growth trends
Net Property Income (INR) 12%
CAGR 3%
CAGR
(IPO) (IPO) Annualised 1Q FY13/14
Annualised 1Q FY13/14
7
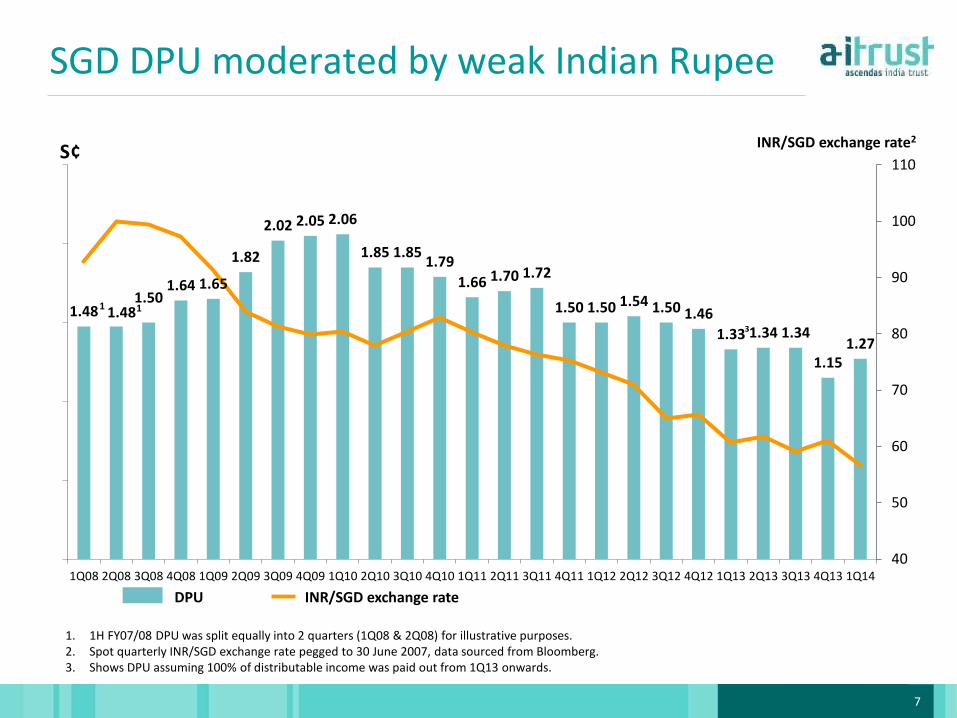
1.48 1.48 1.50
1.64 1.65
1.82
2.02 2.05 2.06
1.85 1.85 1.79
1.66 1.70 1.72
1.50 1.50 1.54 1.50 1.46
1.33 1.34 1.34
1.15 1.27
40
50
60
70
80
90
100
110
1Q08 2Q08 3Q08 4Q08 1Q09 2Q09 3Q09 4Q09 1Q10 2Q10 3Q10 4Q10 1Q11 2Q11 3Q11 4Q11 1Q12 2Q12 3Q12 4Q12 1Q13 2Q13 3Q13 4Q13 1Q14
S¢
1 1
DPU
SGD DPU moderated by weak Indian Rupee
INR/SGD exchange rate
1. 1H FY07/08 DPU was split equally into 2 quarters (1Q08 & 2Q08) for illustrative purposes. 2. Spot quarterly INR/SGD exchange rate pegged to 30 June 2007, data sourced from Bloomberg. 3. Shows DPU assuming 100% of distributable income was paid out from 1Q13 onwards.
3
INR/SGD exchange rate2
8
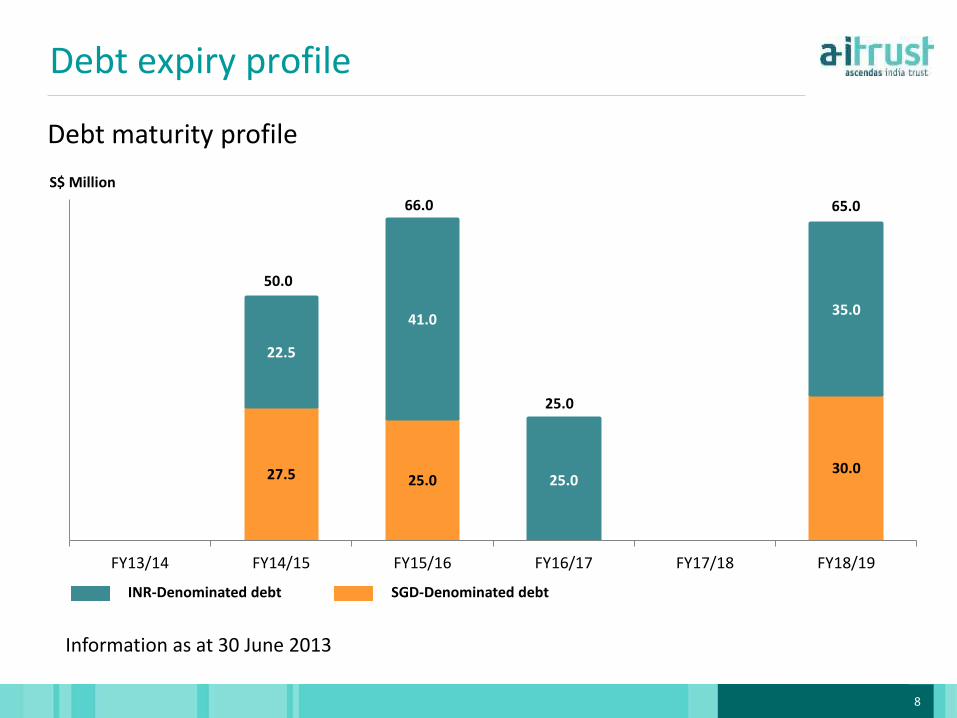
27.5 25.0 25.0 30.0
22.5
41.0 35.0
FY13/14 FY14/15 FY15/16 FY16/17 FY17/18 FY18/19
SGD-Denominated debt INR-Denominated debt
S$ Million
Information as at 30 June 2013
Debt maturity profile
Debt expiry profile
50.0
66.0
25.0
65.0
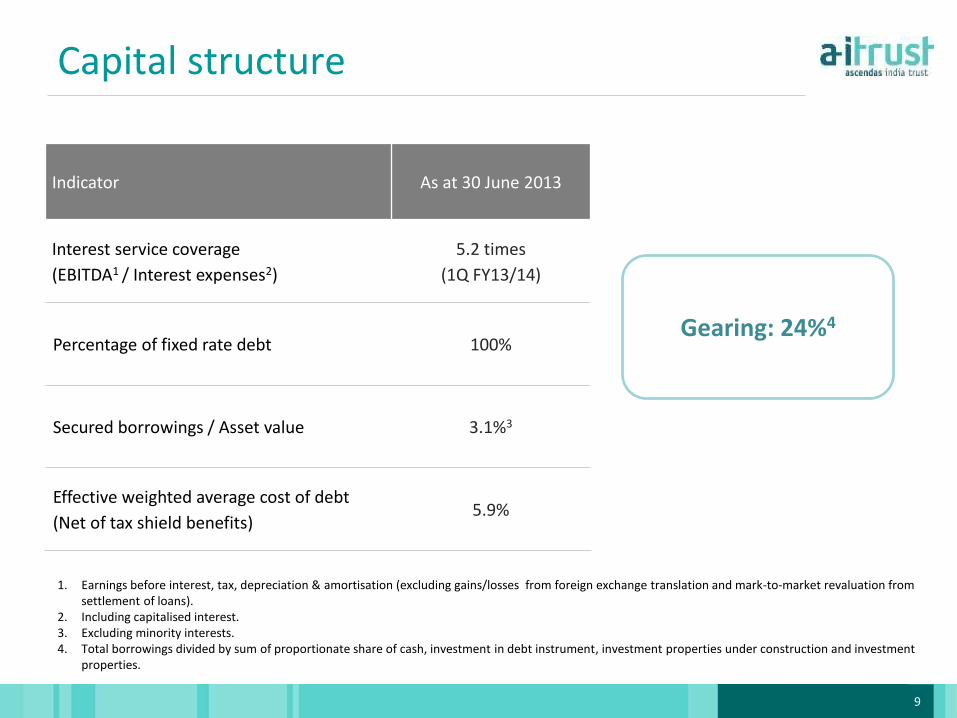
9
1. Earnings before interest, tax, depreciation & amortisation (excluding gains/losses from foreign exchange translation and mark-to-market revaluation from settlement of loans).
2. Including capitalised interest. 3. Excluding minority interests. 4. Total borrowings divided by sum of proportionate share of cash, investment in debt instrument, investment properties under construction and investment
properties.
Indicator As at 30 June 2013
Interest service coverage
(EBITDA1 / Interest expenses2)
5.2 times
(1Q FY13/14)
Percentage of fixed rate debt 100%
Secured borrowings / Asset value 3.1%3
Effective weighted average cost of debt
(Net of tax shield benefits) 5.9%
Capital structure
Gearing: 24%4
10
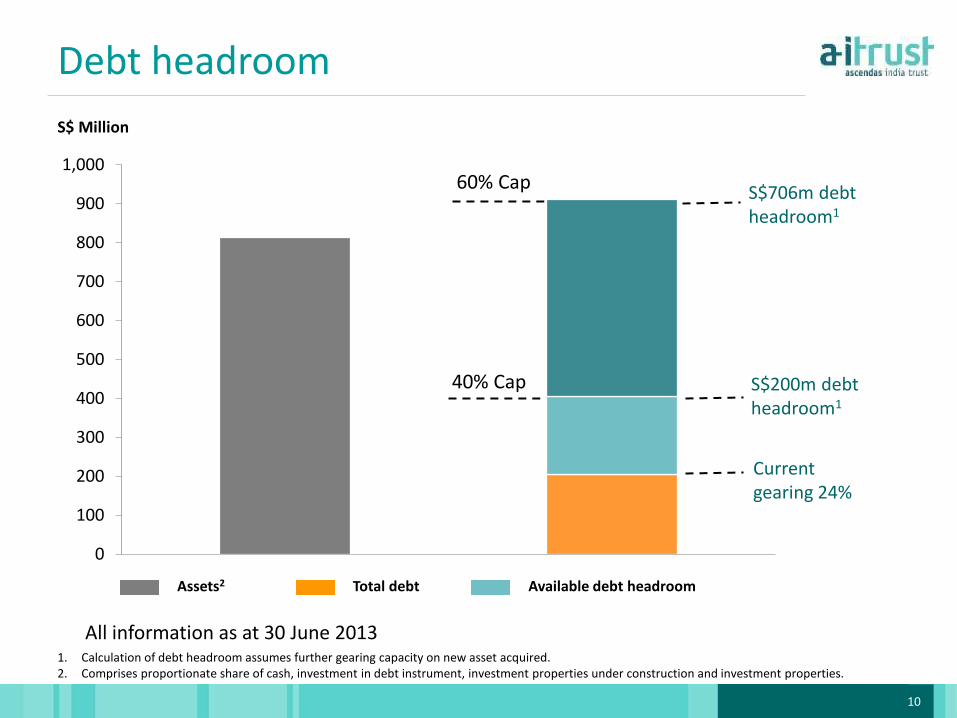
0
100
200
300
400
500
600
700
800
900
1,000
S$200m debt headroom1
S$706m debt headroom1
Current gearing 24%
S$ Million
Total debt Assets2 Available debt headroom
40% Cap
60% Cap
1. Calculation of debt headroom assumes further gearing capacity on new asset acquired. 2. Comprises proportionate share of cash, investment in debt instrument, investment properties under construction and investment properties.
Debt headroom
All information as at 30 June 2013
11
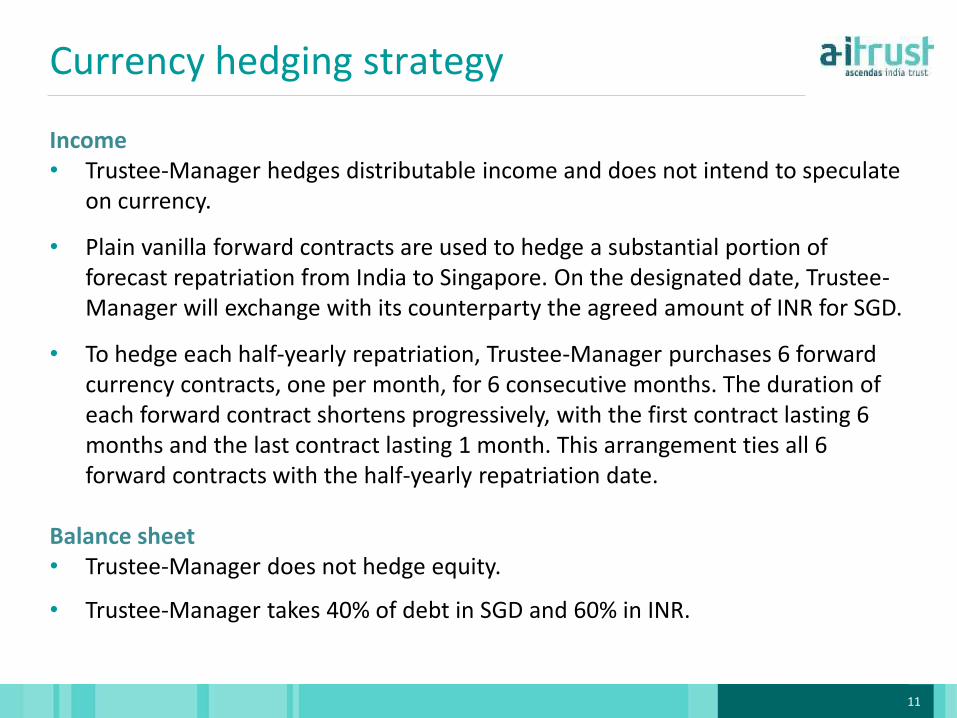
Currency hedging strategy
Income • Trustee-Manager hedges distributable income and does not intend to speculate
on currency.
• Plain vanilla forward contracts are used to hedge a substantial portion of forecast repatriation from India to Singapore. On the designated date, Trustee-Manager will exchange with its counterparty the agreed amount of INR for SGD.
• To hedge each half-yearly repatriation, Trustee-Manager purchases 6 forward currency contracts, one per month, for 6 consecutive months. The duration of each forward contract shortens progressively, with the first contract lasting 6 months and the last contract lasting 1 month. This arrangement ties all 6 forward contracts with the half-yearly repatriation date.
Balance sheet • Trustee-Manager does not hedge equity.
• Trustee-Manager takes 40% of debt in SGD and 60% in INR.
12
• Operational review
Agenda
12
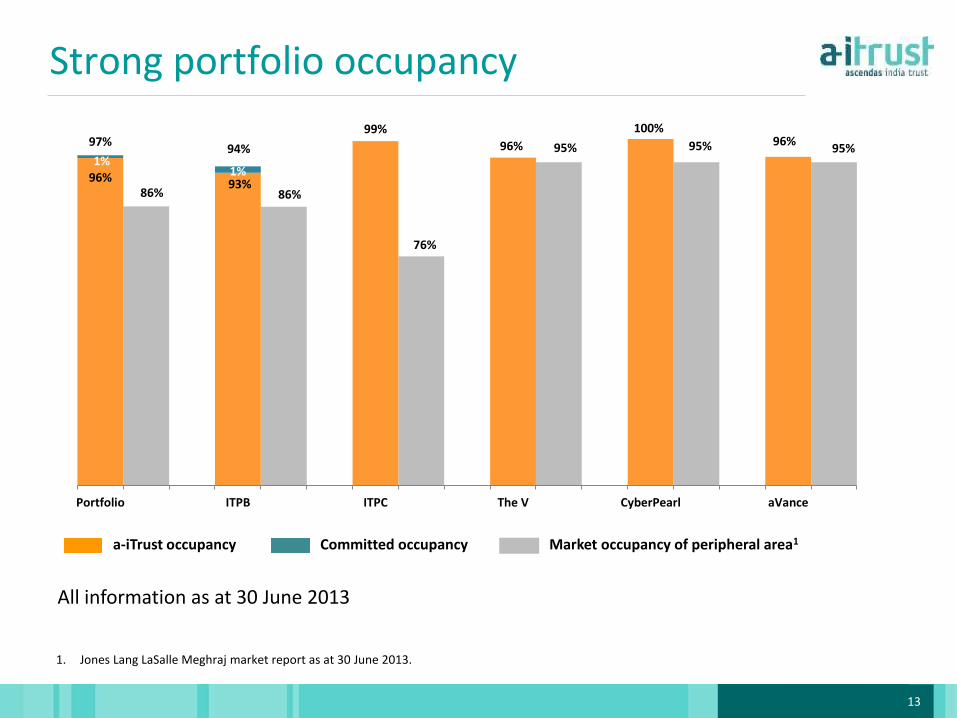
13
1. Jones Lang LaSalle Meghraj market report as at 30 June 2013.
Strong portfolio occupancy
All information as at 30 June 2013
a-iTrust occupancy Market occupancy of peripheral area1 Committed occupancy
96% 86%
93% 86%
99%
76%
96% 95%
100%
95% 96% 95%
1% 1%
97% 94%
Portfolio ITPB ITPC The V CyberPearl aVance
14
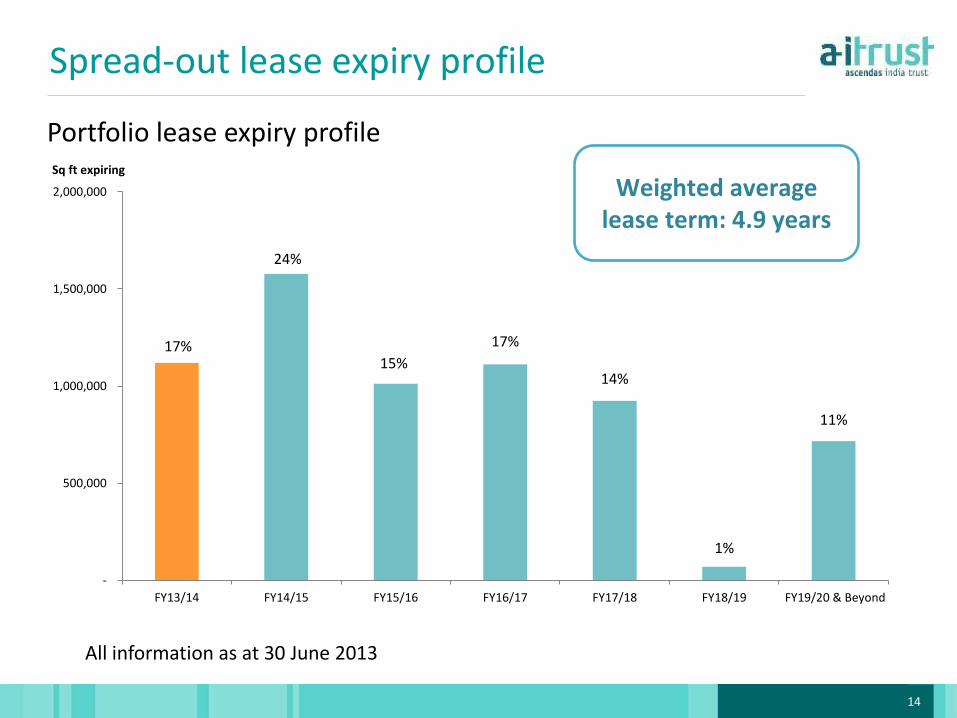
17%
24%
15%
17%
14%
1%
11%
0%
5%
10%
15%
20%
25%
30%
-
500,000
1,000,000
1,500,000
2,000,000
FY13/14 FY14/15 FY15/16 FY16/17 FY17/18 FY18/19 FY19/20 & Beyond
Sq ft expiring
Portfolio lease expiry profile
Spread-out lease expiry profile
All information as at 30 June 2013
Weighted average lease term: 4.9 years
15
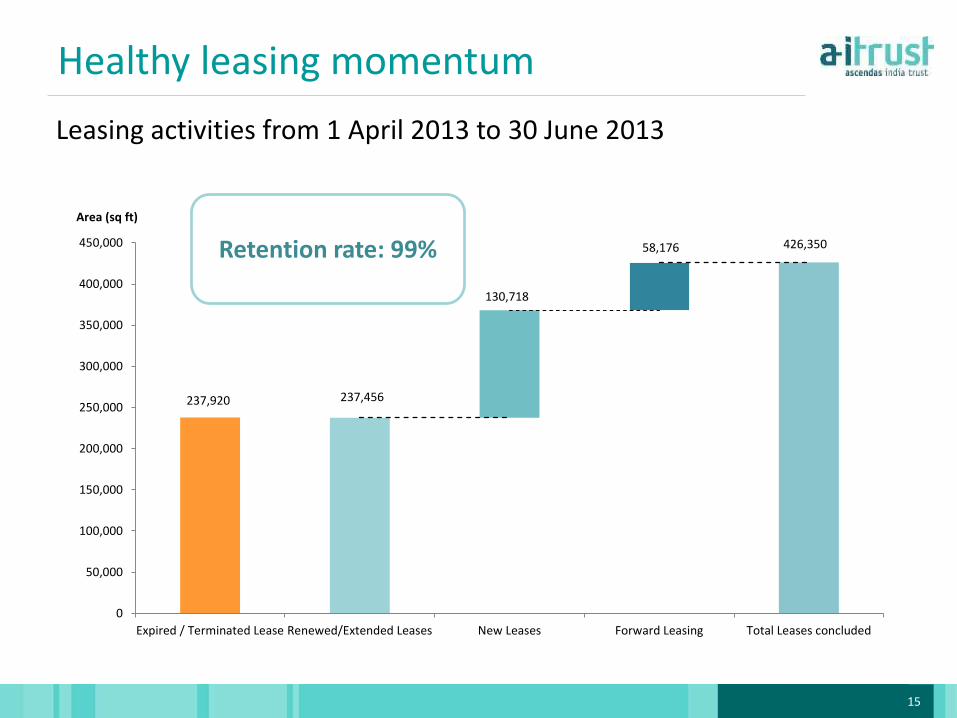
Leasing activities from 1 April 2013 to 30 June 2013
Healthy leasing momentum
237,920 237,456
130,718
58,176 426,350
0
50,000
100,000
150,000
200,000
250,000
300,000
350,000
400,000
450,000
Expired / Terminated Lease Renewed/Extended Leases New Leases Forward Leasing Total Leases concluded
Area (sq ft)
Retention rate: 99%
16
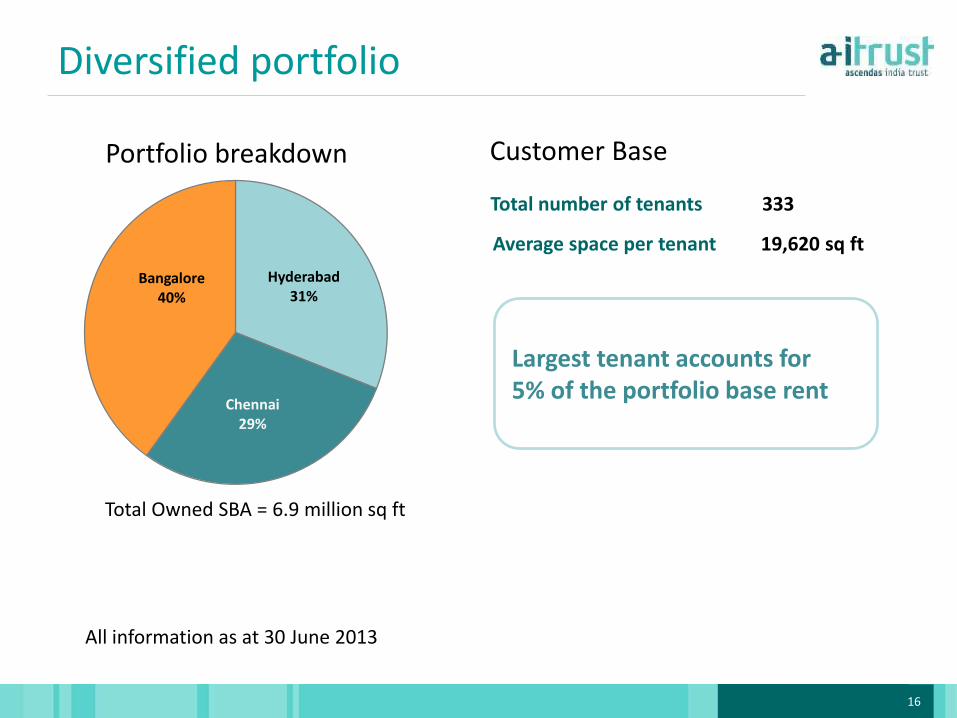
Total Owned SBA = 6.9 million sq ft
Average space per tenant 19,620 sq ft
All information as at 30 June 2013
Portfolio breakdown
Total number of tenants 333
Diversified portfolio
Customer Base
Largest tenant accounts for 5% of the portfolio base rent
Hyderabad 31%
Chennai 29%
Bangalore 40%
17
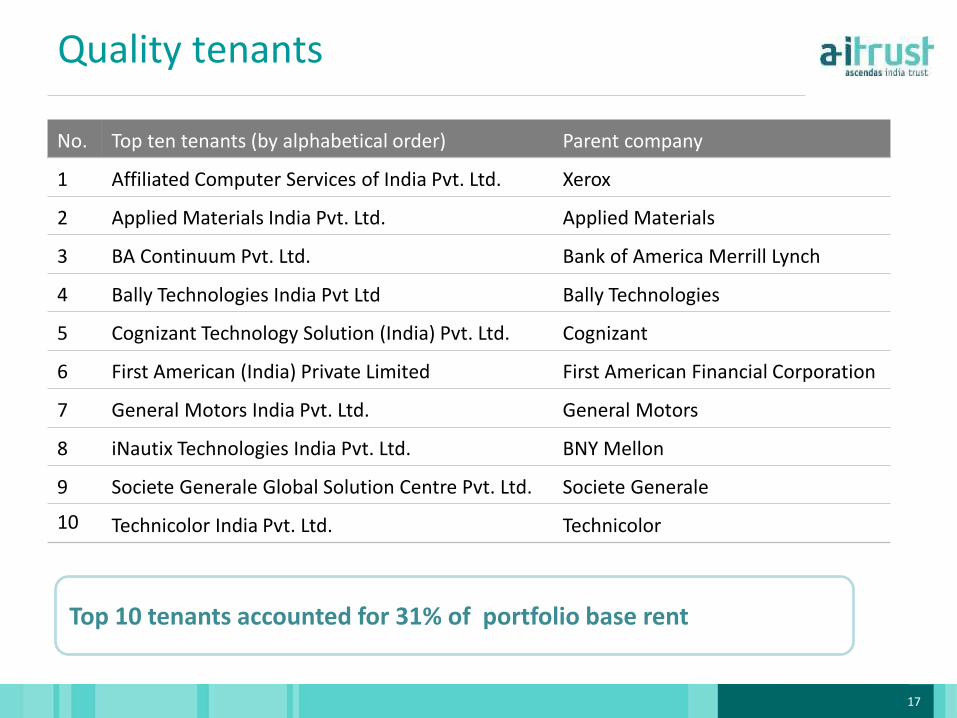
No. Top ten tenants (by alphabetical order) Parent company
1 Affiliated Computer Services of India Pvt. Ltd. Xerox
2 Applied Materials India Pvt. Ltd. Applied Materials
3 BA Continuum Pvt. Ltd. Bank of America Merrill Lynch
4 Bally Technologies India Pvt Ltd Bally Technologies
5 Cognizant Technology Solution (India) Pvt. Ltd. Cognizant
6 First American (India) Private Limited First American Financial Corporation
7 General Motors India Pvt. Ltd. General Motors
8 iNautix Technologies India Pvt. Ltd. BNY Mellon
9 Societe Generale Global Solution Centre Pvt. Ltd. Societe Generale
10 Technicolor India Pvt. Ltd. Technicolor
Quality tenants
Top 10 tenants accounted for 31% of portfolio base rent
18
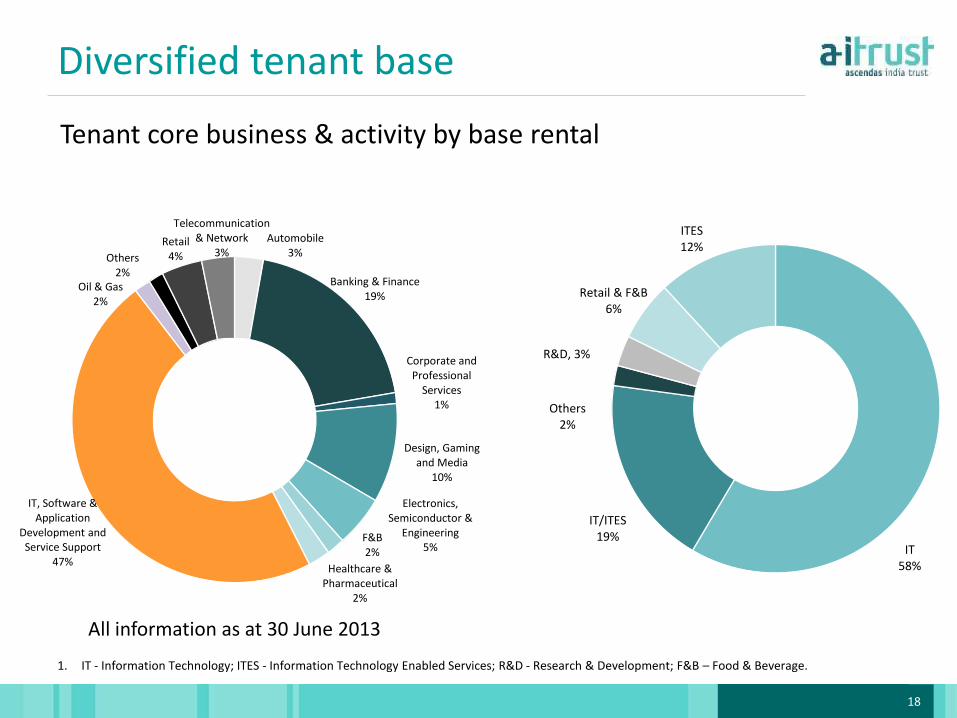
IT 58%
IT/ITES 19%
Others 2%
R&D, 3%
Retail & F&B 6%
ITES 12%
Tenant core business & activity by base rental
1. IT - Information Technology; ITES - Information Technology Enabled Services; R&D - Research & Development; F&B – Food & Beverage.
Diversified tenant base
All information as at 30 June 2013
Automobile 3%
Banking & Finance 19%
Corporate and Professional
Services 1%
Design, Gaming and Media
10%
Electronics, Semiconductor &
Engineering 5%
F&B 2%
Healthcare & Pharmaceutical
2%
IT, Software & Application
Development and Service Support
47%
Oil & Gas 2%
Others 2%
Retail 4%
Telecommunication & Network
3%
19
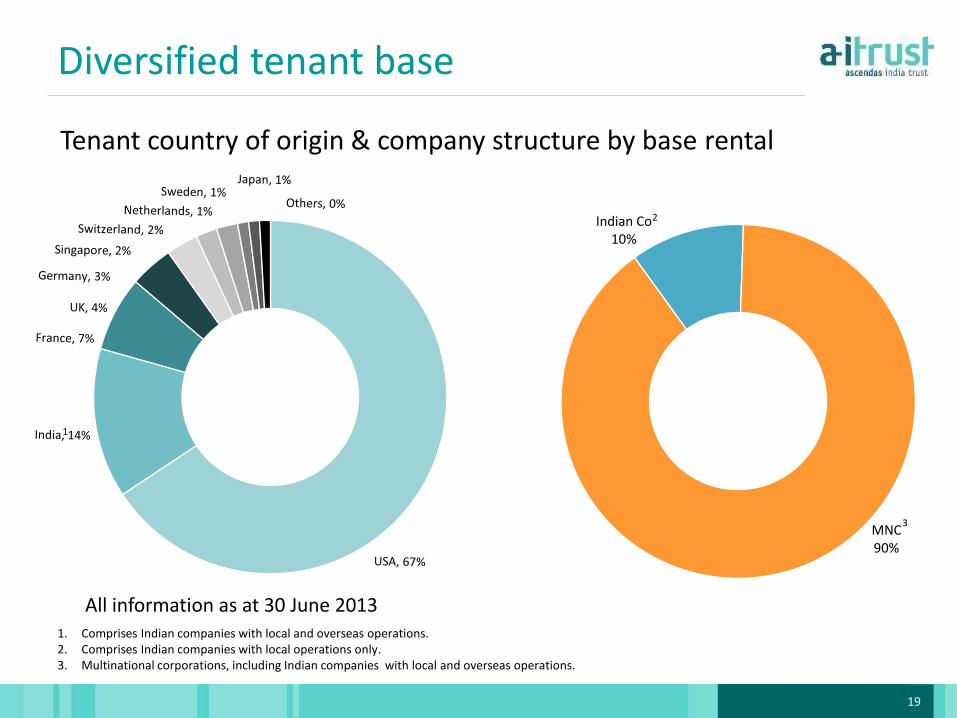
Indian Co 10%
MNC 90%
Tenant country of origin & company structure by base rental
1
2
3
1. Comprises Indian companies with local and overseas operations. 2. Comprises Indian companies with local operations only. 3. Multinational corporations, including Indian companies with local and overseas operations.
Diversified tenant base
All information as at 30 June 2013
20
Livewire @ Hyderabad
21
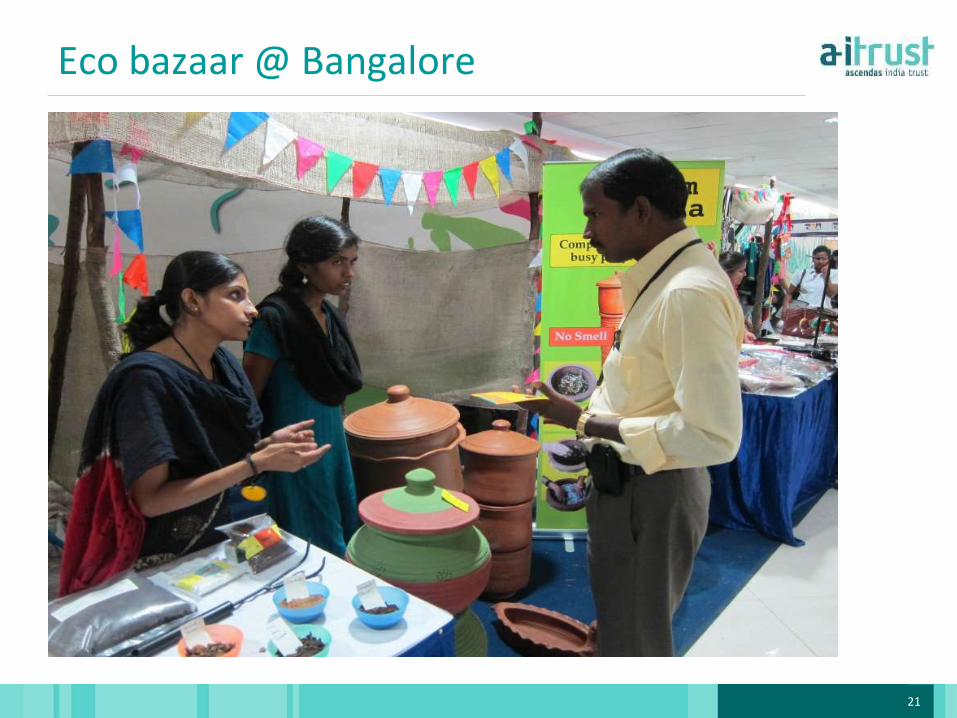
Eco bazaar @ Bangalore
22
• Growth strategy
Agenda
22 22
23
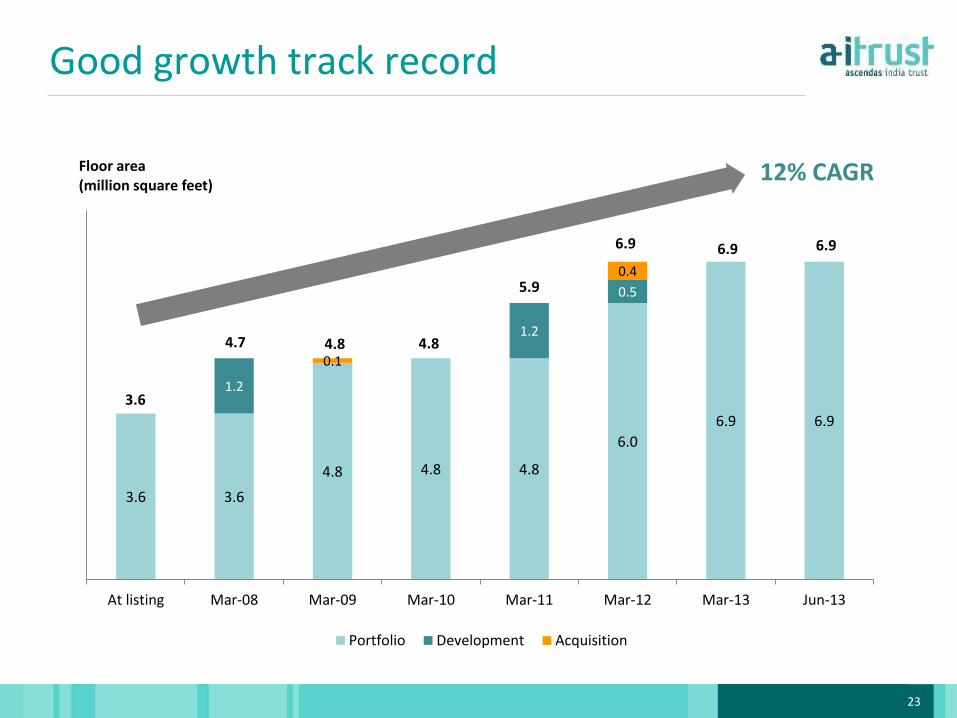
3.6 3.6
4.8 4.8 4.8
6.0
6.9 6.9
1.2
1.2
0.5
0.1
0.4
At listing Mar-08 Mar-09 Mar-10 Mar-11 Mar-12 Mar-13 Jun-13
Floor area (million square feet)
Portfolio Development Acquisition
3.6
4.7 4.8 4.8
5.9
6.9 6.9 6.9
Good growth track record
12% CAGR
24
Growth strategy
Development pipeline
Sponsor assets
3rd party acquisitions
Clear growth strategy
• Completions added 2.9 million sq ft to portfolio
• Constructing 0.6 million sq ft
• Land for 1.9 million sq ft of space available for development
• Acquisitions added 0.5 million sq ft to portfolio
• From market
• aVance Business Hub
• Right of first refusal from Ascendas Land International Pte Ltd
• Right of first refusal from Ascendas India Development Trust
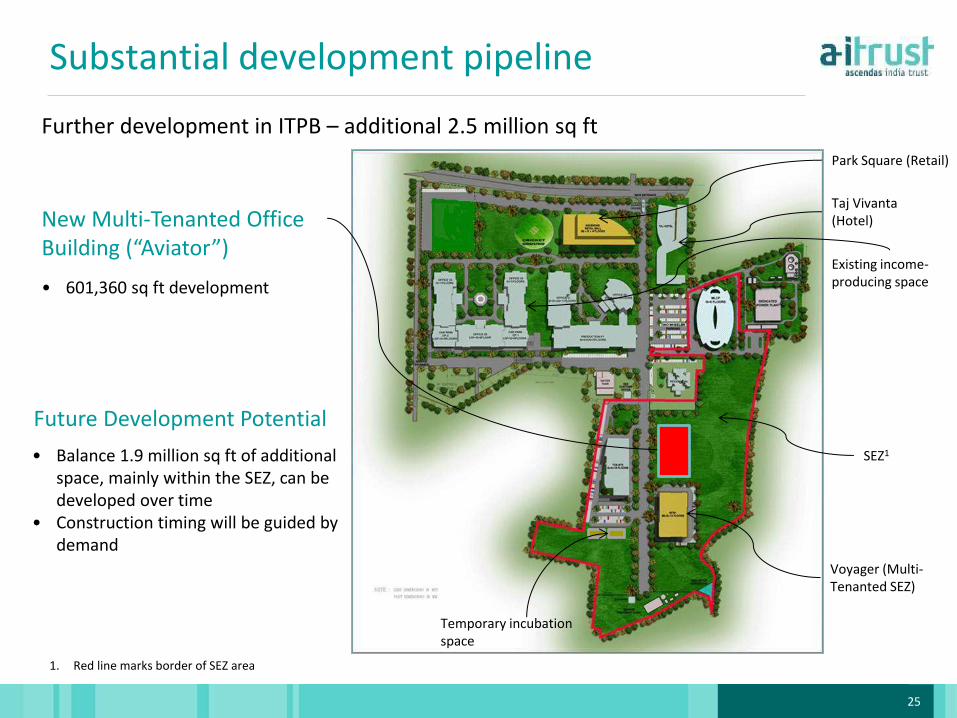
25
Existing income-producing space
SEZ1
Voyager (Multi-Tenanted SEZ)
Taj Vivanta (Hotel)
Park Square (Retail)
Temporary incubation space
• Balance 1.9 million sq ft of additional space, mainly within the SEZ, can be developed over time
• Construction timing will be guided by demand
Substantial development pipeline
Future Development Potential
New Multi-Tenanted Office Building (“Aviator”)
Further development in ITPB – additional 2.5 million sq ft
• 601,360 sq ft development
1. Red line marks border of SEZ area
26
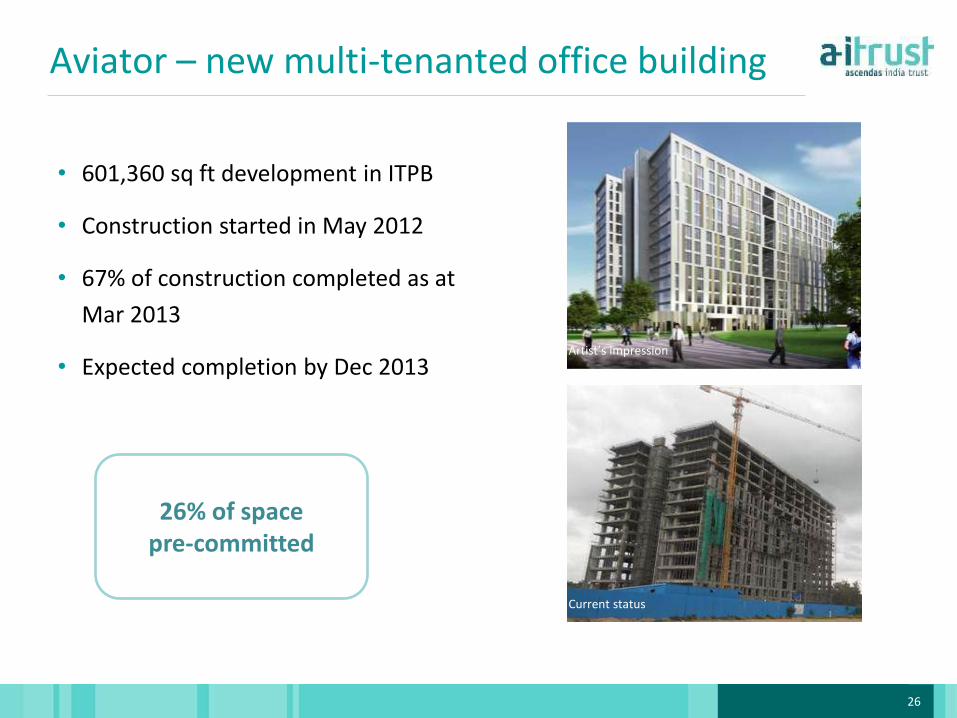
Aviator – new multi-tenanted office building
• 601,360 sq ft development in ITPB
• Construction started in May 2012
• 67% of construction completed as at
Mar 2013
• Expected completion by Dec 2013 Artist’s impression
26% of space pre-committed
Current status
27
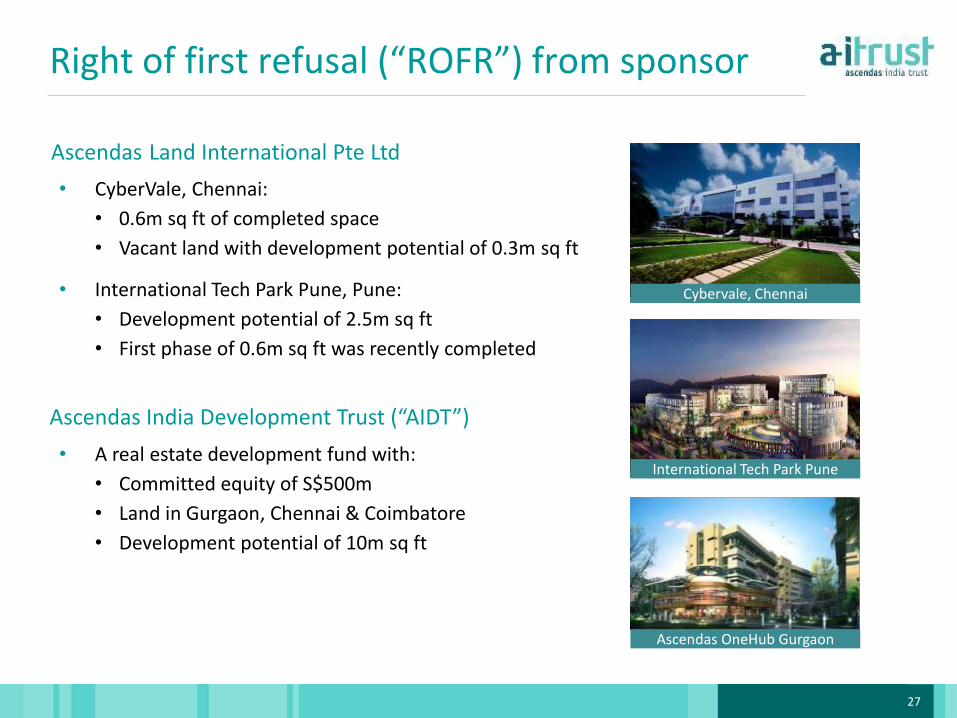
International Tech Park Pune
• CyberVale, Chennai:
• 0.6m sq ft of completed space
• Vacant land with development potential of 0.3m sq ft
• International Tech Park Pune, Pune:
• Development potential of 2.5m sq ft
• First phase of 0.6m sq ft was recently completed
Right of first refusal (“ROFR”) from sponsor
Ascendas Land International Pte Ltd
Ascendas India Development Trust (“AIDT”)
• A real estate development fund with:
• Committed equity of S$500m
• Land in Gurgaon, Chennai & Coimbatore
• Development potential of 10m sq ft
Ascendas OneHub Gurgaon
Cybervale, Chennai
28
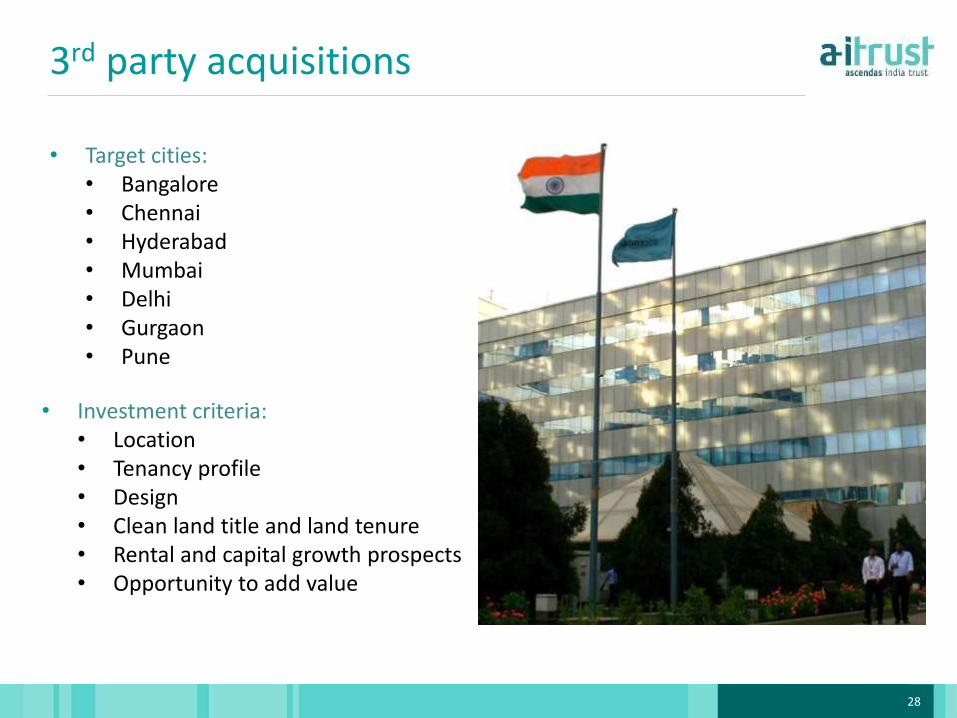
• Target cities:
• Bangalore • Chennai • Hyderabad • Mumbai • Delhi • Gurgaon • Pune
3rd party acquisitions
• Investment criteria:
• Location • Tenancy profile • Design • Clean land title and land tenure • Rental and capital growth prospects • Opportunity to add value
29
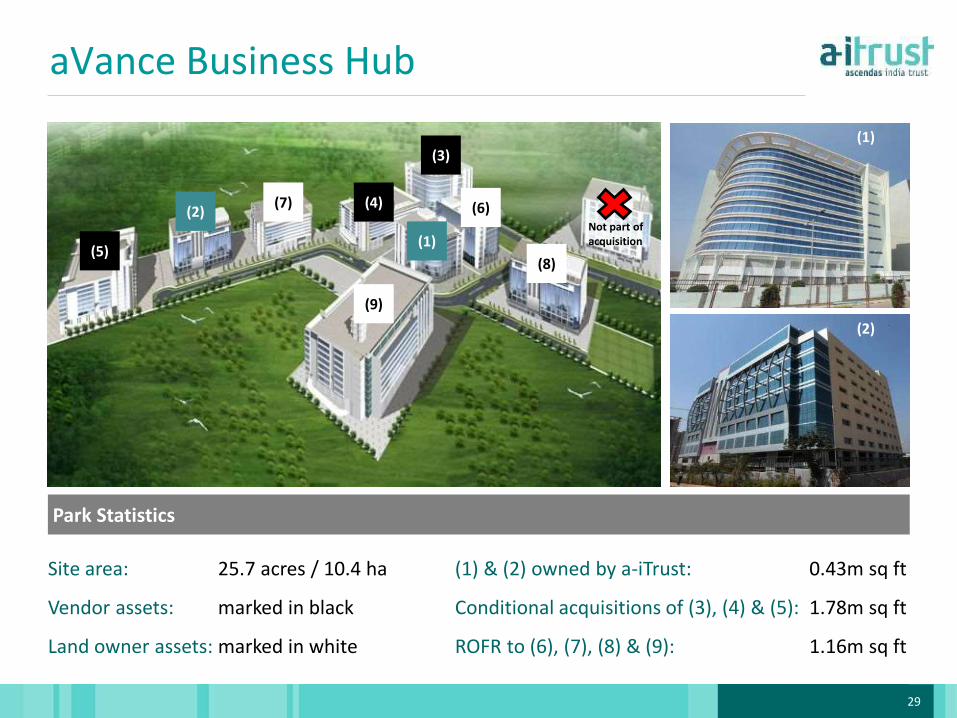
Park Statistics
(1)
(2)
aVance Business Hub
(5)
(2)
(1)
(4)
(3)
(7)
(9)
(8)
(6) Not part of acquisition
Site area: 25.7 acres / 10.4 ha (1) & (2) owned by a-iTrust: 0.43m sq ft
Vendor assets: marked in black Conditional acquisitions of (3), (4) & (5): 1.78m sq ft
Land owner assets: marked in white ROFR to (6), (7), (8) & (9): 1.16m sq ft
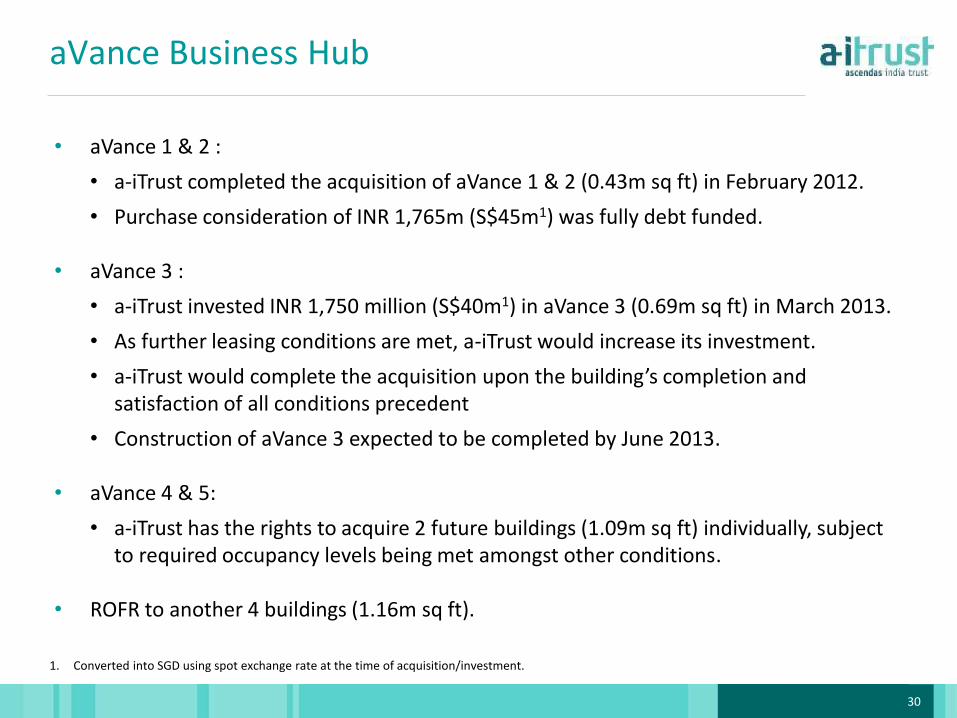
30
• aVance 1 & 2 :
• a-iTrust completed the acquisition of aVance 1 & 2 (0.43m sq ft) in February 2012.
• Purchase consideration of INR 1,765m (S$45m1) was fully debt funded.
• aVance 3 :
• a-iTrust invested INR 1,750 million (S$40m1) in aVance 3 (0.69m sq ft) in March 2013.
• As further leasing conditions are met, a-iTrust would increase its investment.
• a-iTrust would complete the acquisition upon the building’s completion and satisfaction of all conditions precedent
• Construction of aVance 3 expected to be completed by June 2013.
• aVance 4 & 5:
• a-iTrust has the rights to acquire 2 future buildings (1.09m sq ft) individually, subject to required occupancy levels being met amongst other conditions.
• ROFR to another 4 buildings (1.16m sq ft).
aVance Business Hub
1. Converted into SGD using spot exchange rate at the time of acquisition/investment.
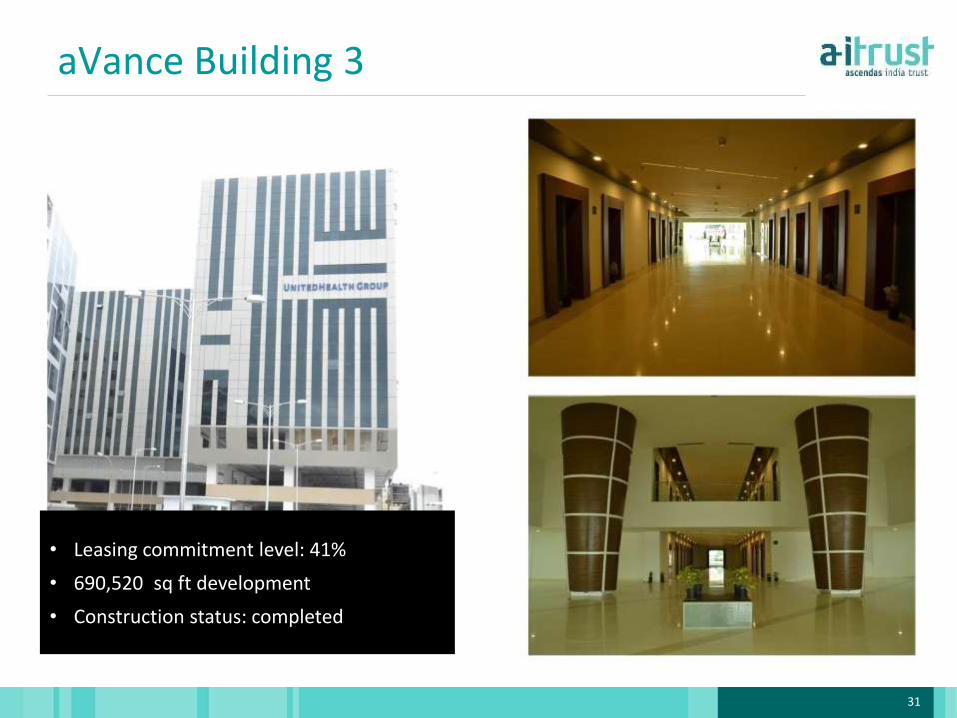
31
aVance Building 3
• Leasing commitment level: 41%
• 690,520 sq ft development
• Construction status: completed

32
• Summary
Agenda
32
33
0
25
50
75
100
125
150
175
200
225
250
IPO
De
c 0
7
Jun
08
De
c 0
8
Jun
09
De
c 0
9
Jun
10
De
c 1
0
Jun
11
De
c 1
1
Jun
12
De
c 1
2
Jun
13
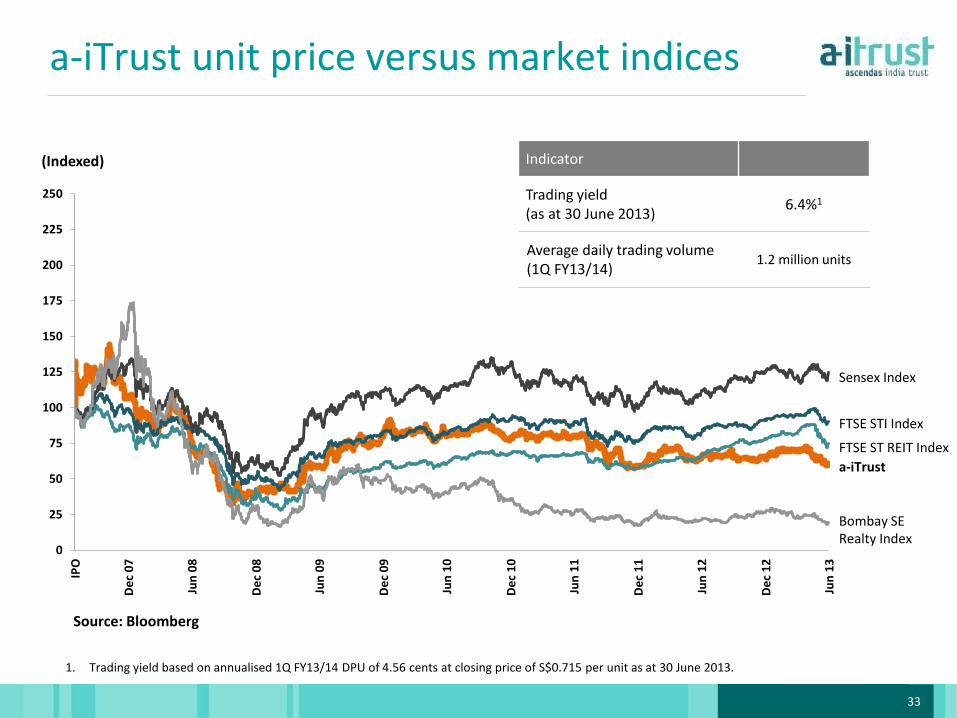
a-iTrust unit price versus market indices
Source: Bloomberg
(Indexed) Indicator
Trading yield (as at 30 June 2013)
6.4%1
Average daily trading volume (1Q FY13/14)
1.2 million units
1. Trading yield based on annualised 1Q FY13/14 DPU of 4.56 cents at closing price of S$0.715 per unit as at 30 June 2013.
a-iTrust
FTSE STI Index
FTSE ST REIT Index
Sensex Index
Bombay SE Realty Index
34
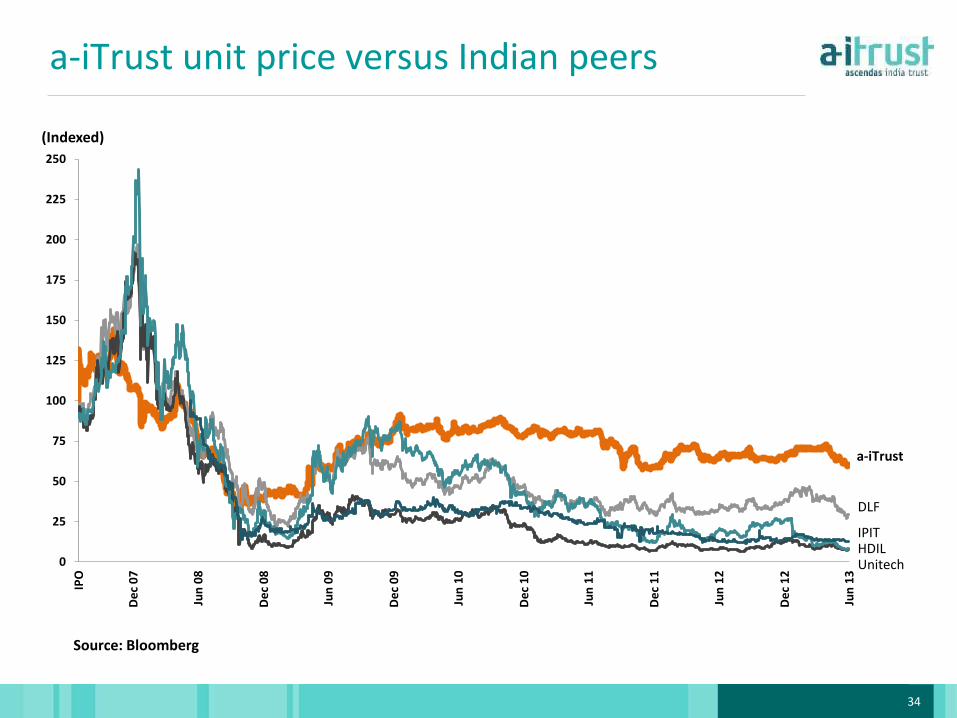
a-iTrust unit price versus Indian peers
Source: Bloomberg
(Indexed)
a-iTrust
IPIT
DLF
Unitech HDIL
0
25
50
75
100
125
150
175
200
225
250
IPO
De
c 0
7
Jun
08
De
c 0
8
Jun
09
De
c 0
9
Jun
10
De
c 1
0
Jun
11
De
c 1
1
Jun
12
De
c 1
2
Jun
13
35
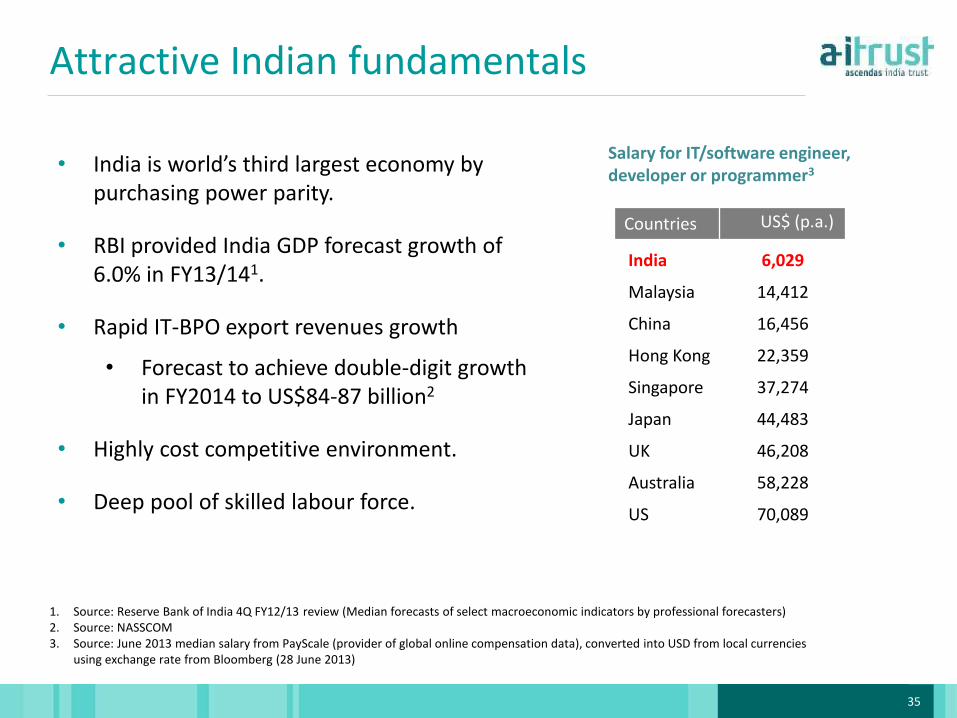
Attractive Indian fundamentals
• India is world’s third largest economy by purchasing power parity.
• RBI provided India GDP forecast growth of 6.0% in FY13/141.
• Rapid IT-BPO export revenues growth
• Forecast to achieve double-digit growth in FY2014 to US$84-87 billion2
• Highly cost competitive environment.
• Deep pool of skilled labour force.
1. Source: Reserve Bank of India 4Q FY12/13 review (Median forecasts of select macroeconomic indicators by professional forecasters) 2. Source: NASSCOM 3. Source: June 2013 median salary from PayScale (provider of global online compensation data), converted into USD from local currencies
using exchange rate from Bloomberg (28 June 2013)
Salary for IT/software engineer, developer or programmer3
Countries US$ (p.a.)
India 6,029
Malaysia 14,412
China 16,456
Hong Kong 22,359
Singapore 37,274
Japan 44,483
UK 46,208
Australia 58,228
US 70,089

36
Appendix
Appendix
37
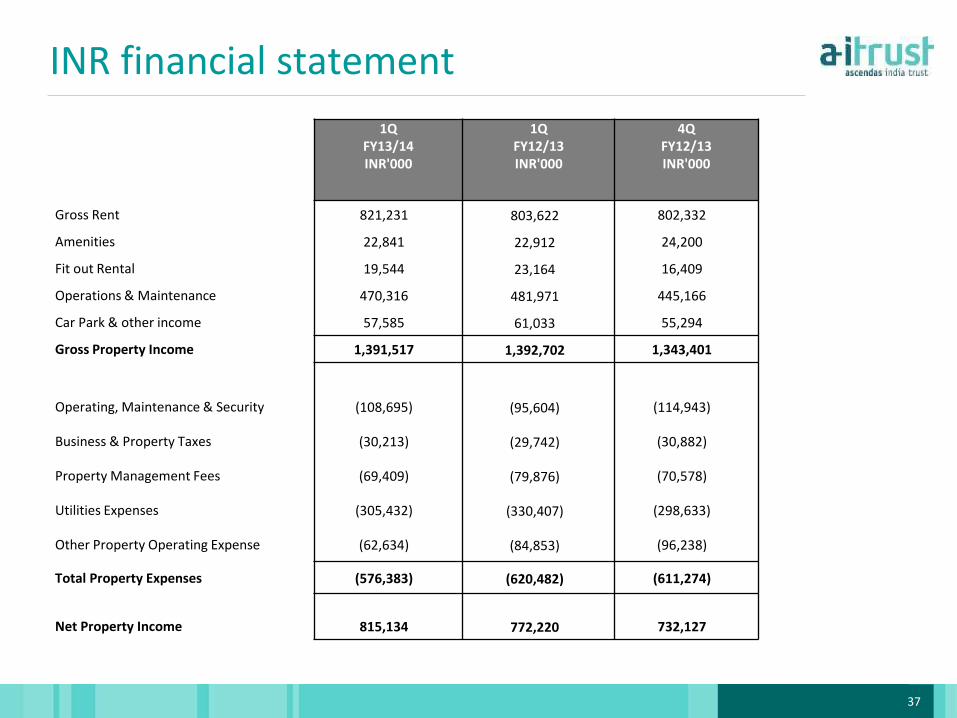
1Q FY13/14 INR'000
1Q FY12/13 INR'000
4Q FY12/13 INR'000
Gross Rent 821,231 803,622 802,332
Amenities 22,841 22,912 24,200
Fit out Rental 19,544 23,164 16,409
Operations & Maintenance 470,316 481,971 445,166
Car Park & other income 57,585 61,033 55,294
Gross Property Income 1,391,517 1,392,702 1,343,401
Operating, Maintenance & Security (108,695) (95,604) (114,943)
Business & Property Taxes (30,213) (29,742) (30,882)
Property Management Fees (69,409) (79,876) (70,578)
Utilities Expenses (305,432) (330,407) (298,633)
Other Property Operating Expense (62,634) (84,853) (96,238)
Total Property Expenses (576,383) (620,482) (611,274)
Net Property Income 815,134 772,220 732,127
INR financial statement
38
Balance sheet
As at 30 June 2013 INR SGD
Total assets INR 46.3 billion S$990 million
Total borrowings INR 9.59 billion S$205 million
Fully & compulsorily convertible debentures
- Intercompany
- aVance 3
INR 4.93 billion
INR 1.75 billion
S$105.5 million
S$37.45 million
Net asset value INR 28 per unit S$0.60 per unit
39
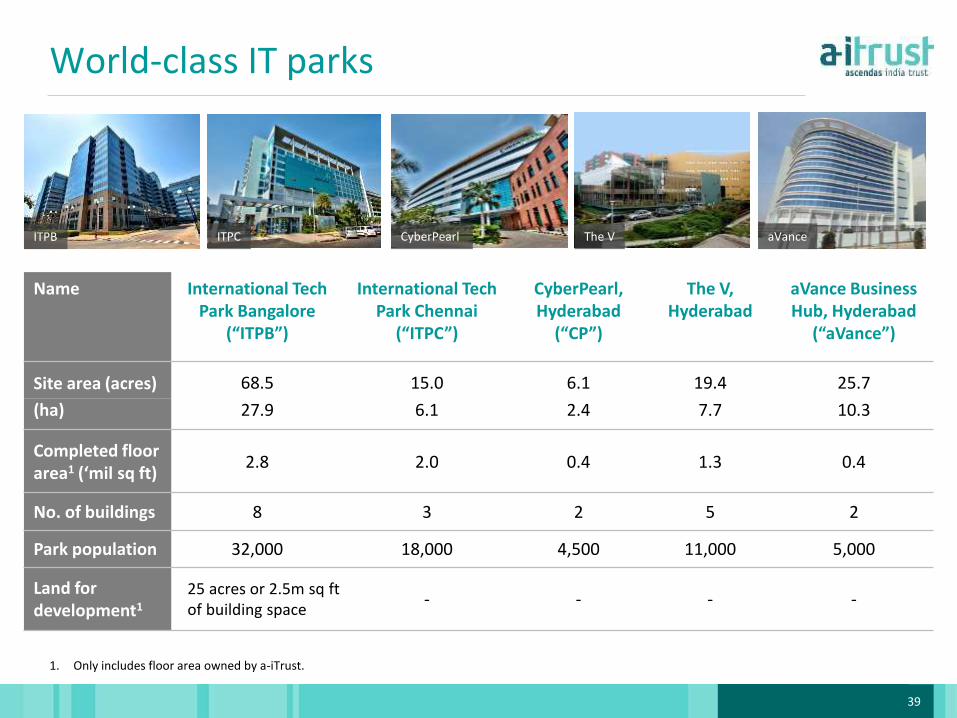
1. Only includes floor area owned by a-iTrust.
World-class IT parks
Name International Tech Park Bangalore
(“ITPB”)
International Tech Park Chennai
(“ITPC”)
CyberPearl, Hyderabad
(“CP”)
The V, Hyderabad
aVance Business Hub, Hyderabad
(“aVance”)
Site area (acres) 68.5 15.0 6.1 19.4 25.7
(ha) 27.9 6.1 2.4 7.7 10.3
Completed floor area1 (‘mil sq ft)
2.8 2.0 0.4 1.3 0.4
No. of buildings 8 3 2 5 2
Park population 32,000 18,000 4,500 11,000 5,000
Land for development1
25 acres or 2.5m sq ft of building space
- - - -
ITPB ITPC CyberPearl The V aVance
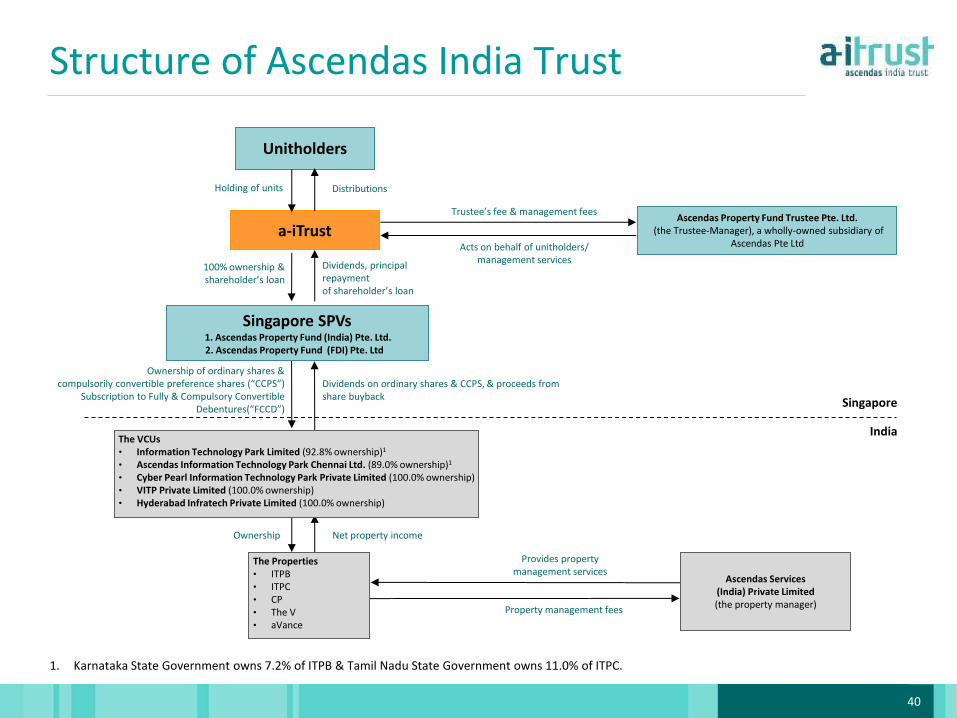
40
Unitholders
a-iTrust Ascendas Property Fund Trustee Pte. Ltd.
(the Trustee-Manager), a wholly-owned subsidiary of Ascendas Pte Ltd
Singapore SPVs 1. Ascendas Property Fund (India) Pte. Ltd.
2. Ascendas Property Fund (FDI) Pte. Ltd
The VCUs • Information Technology Park Limited (92.8% ownership)1
• Ascendas Information Technology Park Chennai Ltd. (89.0% ownership)1
• Cyber Pearl Information Technology Park Private Limited (100.0% ownership) • VITP Private Limited (100.0% ownership) • Hyderabad Infratech Private Limited (100.0% ownership)
Ascendas Services (India) Private Limited (the property manager)
Holding of units Distributions
Trustee’s fee & management fees
Acts on behalf of unitholders/ management services
100% ownership & shareholder’s loan
Dividends, principal repayment of shareholder’s loan
Ownership of ordinary shares & compulsorily convertible preference shares (“CCPS”)
Subscription to Fully & Compulsory Convertible Debentures(“FCCD”)
Dividends on ordinary shares & CCPS, & proceeds from share buyback
The Properties • ITPB • ITPC • CP • The V • aVance
Property management fees
Provides property management services
Ownership
Net property income
Singapore
India
1. Karnataka State Government owns 7.2% of ITPB & Tamil Nadu State Government owns 11.0% of ITPC.
Structure of Ascendas India Trust
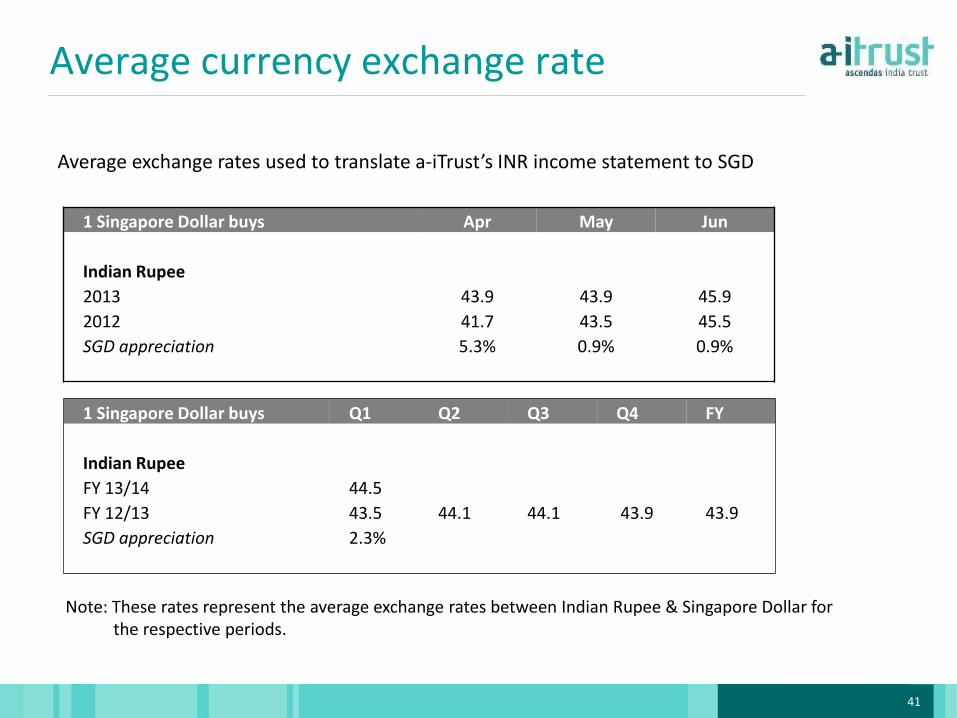
41
Average exchange rates used to translate a-iTrust’s INR income statement to SGD
Note: These rates represent the average exchange rates between Indian Rupee & Singapore Dollar for the respective periods.
Average currency exchange rate
1 Singapore Dollar buys Apr May Jun
Indian Rupee
2013 43.9 43.9 45.9
2012 41.7 43.5 45.5
SGD appreciation 5.3% 0.9% 0.9%
1 Singapore Dollar buys Q1 Q2 Q3 Q4 FY
Indian Rupee
FY 13/14 44.5
FY 12/13 43.5 44.1 44.1 43.9 43.9
SGD appreciation 2.3%

42
James Goh, CFA
Investor Relations
Ascendas Property Fund Trustee Pte Ltd
(Trustee-Manager of a-iTrust)
Office: +65 6774 1033
Email: [email protected]
Website: www.a-iTrust.com
Investor contact