1h 2016 strategy & results presentation - iliad.fr · kpis robust financial ... new epon...
TRANSCRIPT
1H 2016 Strategy & Results Presentation
August 31, 2016
1
This document has been prepared by Iliad S.A. (the
"Company”) and is being furnished to you solely for your
information and personal use.
This presentation includes only summary information and
does not purport to be comprehensive.
The information contained in this presentation has not been
subject to independent verification.
No representation, warranty or undertaking, express or
implied, is made as to, and no reliance should be placed on,
the fairness, accuracy, completeness or correctness of the
information or opinions contained herein.
None of Iliad S.A., its affiliates or its advisors, nor any
representatives of such persons, shall have any liability
whatsoever (in negligence or otherwise) for any loss arising
from any use of this document or its contents or otherwise
arising in connection with this document or any other
information or material discussed.
This presentation contains forward-looking statements
relating to the business, financial performance and results of
Iliad S.A. These statements are based on current beliefs,
expectations or assumptions and involve unknown risks and
uncertainties that could cause actual results, performance or
events to differ materially from those described in such
statements. Factors that could cause such differences in
actual results, performance or events include changes in
demand and technology, as well as the ability of Iliad S.A. to
effectively implement its strategy.
Any forward-looking statements contained in this
presentation speak only as of the date of this presentation.
Iliad S.A. expressly disclaims any obligation or undertaking to
update or revise any forward-looking statements contained in
this presentation to reflect any change in events, conditions,
assumptions or circumstances on which any such statements
are based unless so required by applicable law.
2
Disclaimer
3
1H 2016 Highlights
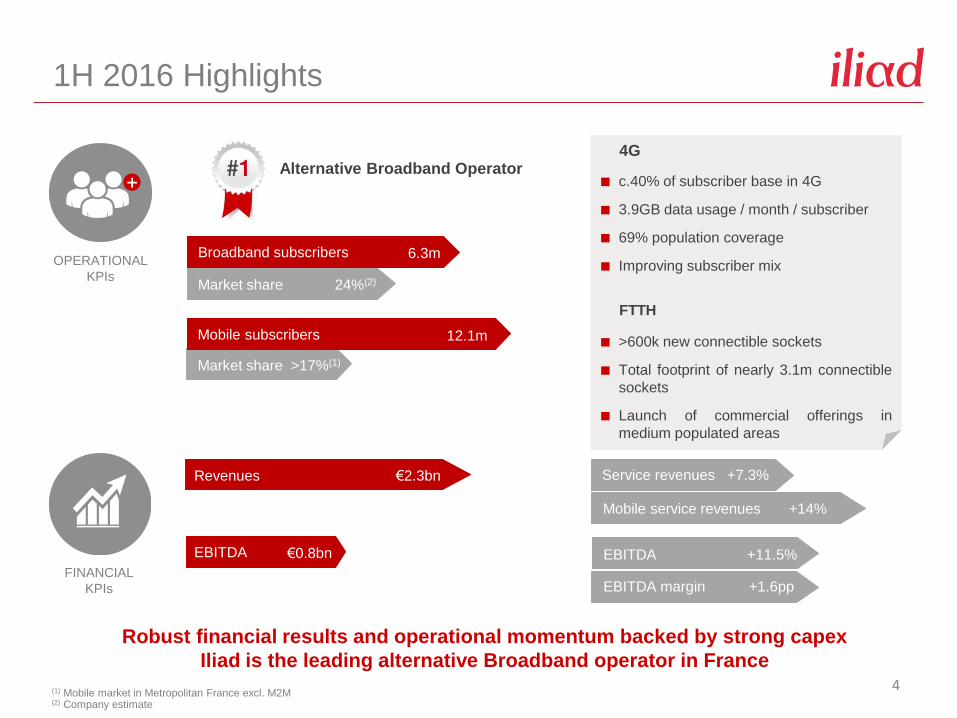
EBITDA margin +1.6pp
EBITDA +11.5%
Mobile service revenues +14%
Service revenues +7.3%
Market share 24%(2)
Market share >17%(1)
4
1H 2016 Highlights
(1) Mobile market in Metropolitan France excl. M2M(2) Company estimate
OPERATIONAL
KPIs
FINANCIAL
KPIs
Robust financial results and operational momentum backed by strong capex
Iliad is the leading alternative Broadband operator in France
Broadband subscribers 6.3m
Mobile subscribers 12.1m
Mobile services revenues +19%
EBITDA €0.8bn
Revenues €2.3bn
4G
c.40% of subscriber base in 4G
3.9GB data usage / month / subscriber
69% population coverage
Improving subscriber mix
FTTH
>600k new connectible sockets
Total footprint of nearly 3.1m connectible
sockets
Launch of commercial offerings in
medium populated areas
Alternative Broadband Operator
5
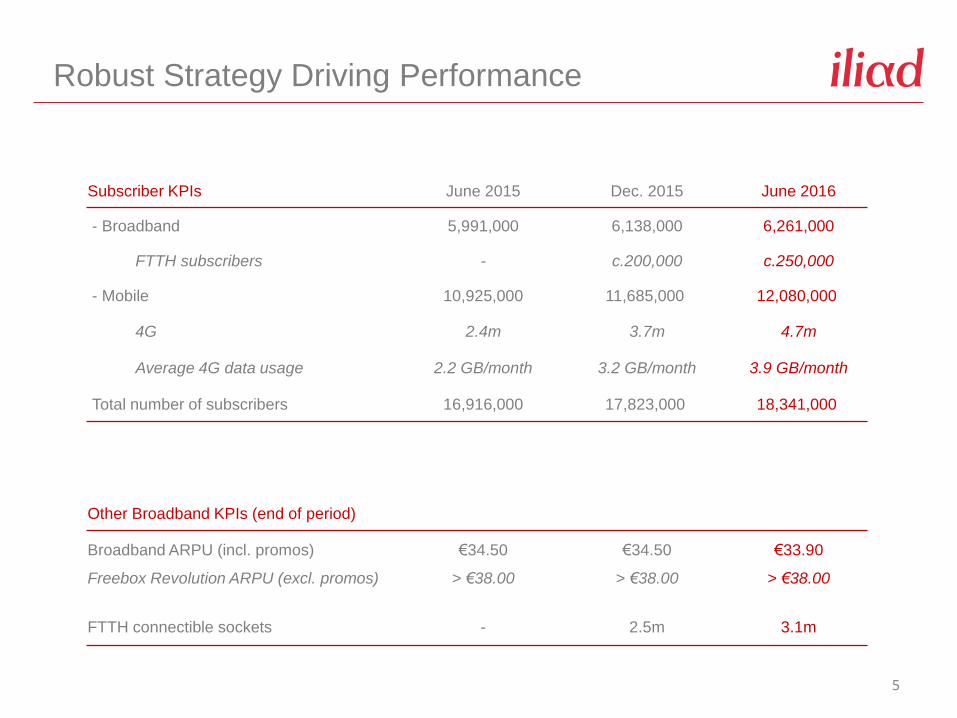
Robust Strategy Driving Performance
Subscriber KPIs June 2015 Dec. 2015 June 2016
- Broadband 5,991,000 6,138,000 6,261,000
FTTH subscribers - c.200,000 c.250,000
- Mobile 10,925,000 11,685,000 12,080,000
4G 2.4m 3.7m 4.7m
Average 4G data usage 2.2 GB/month 3.2 GB/month 3.9 GB/month
Total number of subscribers 16,916,000 17,823,000 18,341,000
Other Broadband KPIs (end of period)
Broadband ARPU (incl. promos) €34.50 €34.50 €33.90
Freebox Revolution ARPU (excl. promos) > €38.00 > €38.00 > €38.00
FTTH connectible sockets - 2.5m 3.1m
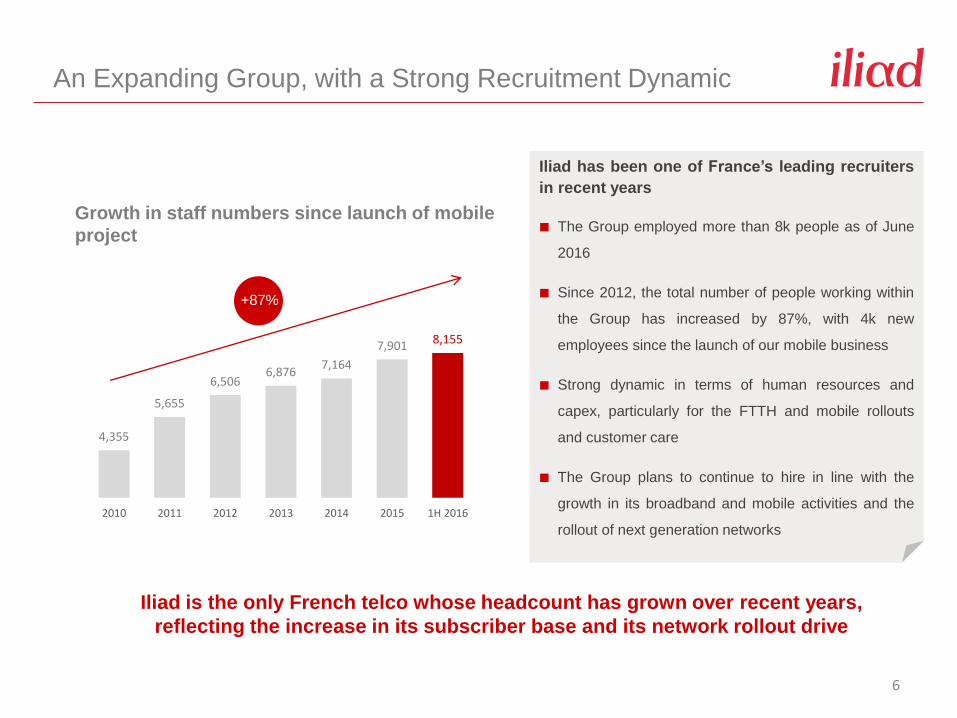
4,355
5,655
6,5066,876
7,164
7,901 8,155
2010 2011 2012 2013 2014 2015 1H 2016
6
An Expanding Group, with a Strong Recruitment Dynamic
Growth in staff numbers since launch of mobile
project
Iliad is the only French telco whose headcount has grown over recent years,
reflecting the increase in its subscriber base and its network rollout drive
Iliad has been one of France’s leading recruiters
in recent years
The Group employed more than 8k people as of June
2016
Since 2012, the total number of people working within
the Group has increased by 87%, with 4k new
employees since the launch of our mobile business
Strong dynamic in terms of human resources and
capex, particularly for the FTTH and mobile rollouts
and customer care
The Group plans to continue to hire in line with the
growth in its broadband and mobile activities and the
rollout of next generation networks
+87%
7
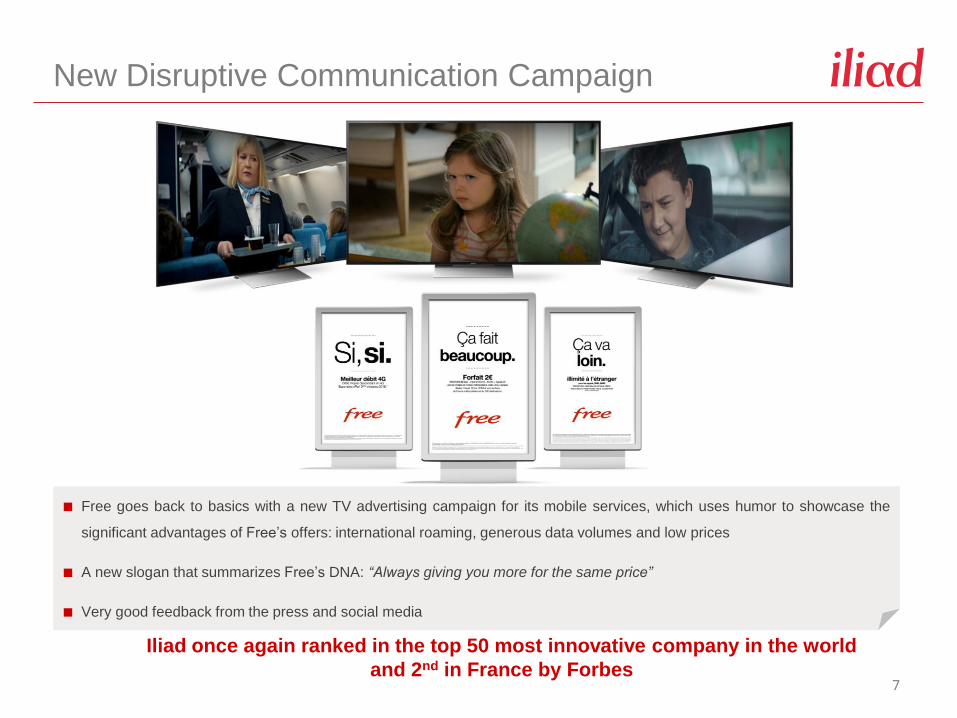
New Disruptive Communication Campaign
Free goes back to basics with a new TV advertising campaign for its mobile services, which uses humor to showcase the
significant advantages of Free’s offers: international roaming, generous data volumes and low prices
A new slogan that summarizes Free’s DNA: “Always giving you more for the same price”
Very good feedback from the press and social media
Iliad once again ranked in the top 50 most innovative company in the world
and 2nd in France by Forbes
8
Broadband Business
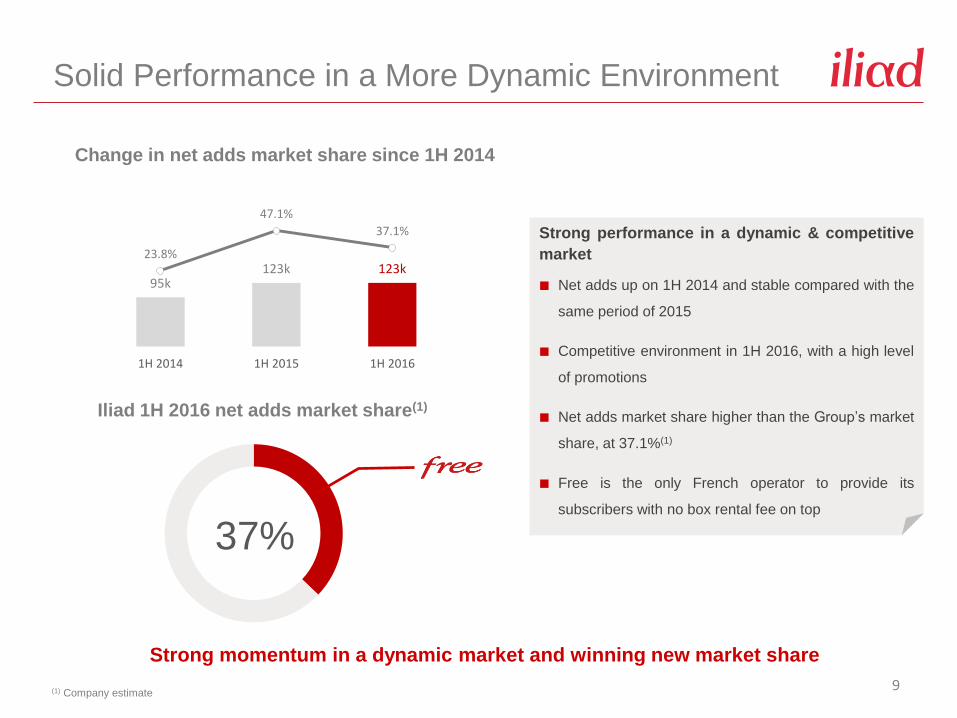
95k123k 123k
23.8%
47.1%
37.1%
1H 2014 1H 2015 1H 2016
9
Solid Performance in a More Dynamic Environment
37%
Iliad 1H 2016 net adds market share(1)
Change in net adds market share since 1H 2014
Strong momentum in a dynamic market and winning new market share
(1) Company estimate
Strong performance in a dynamic & competitive
market
Net adds up on 1H 2014 and stable compared with the
same period of 2015
Competitive environment in 1H 2016, with a high level
of promotions
Net adds market share higher than the Group’s market
share, at 37.1%(1)
Free is the only French operator to provide its
subscribers with no box rental fee on top
10
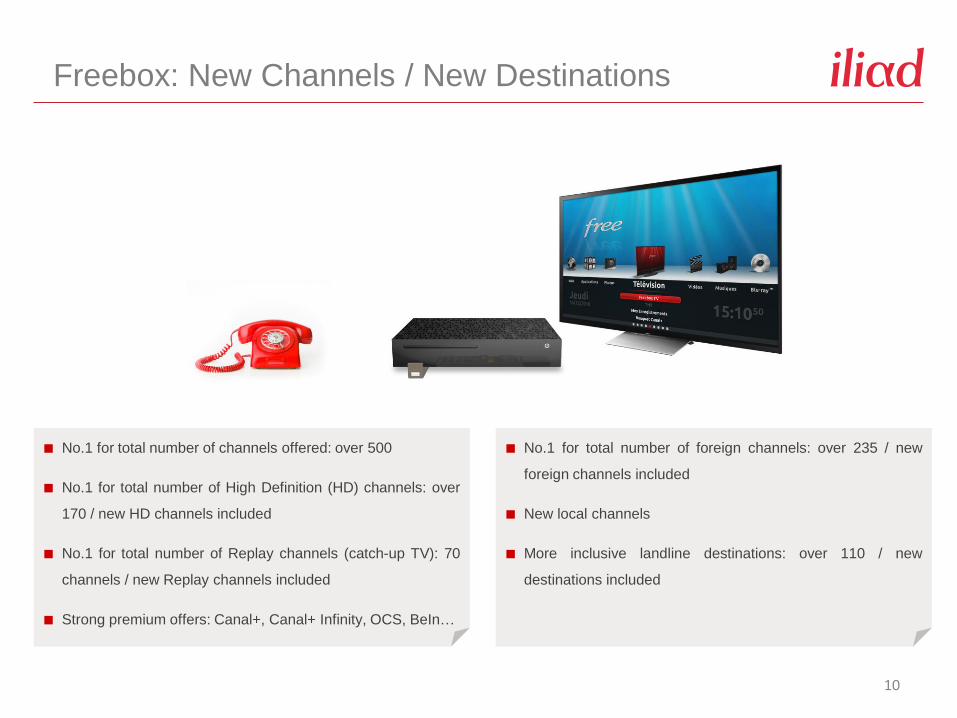
Freebox: New Channels / New Destinations
No.1 for total number of channels offered: over 500
No.1 for total number of High Definition (HD) channels: over
170 / new HD channels included
No.1 for total number of Replay channels (catch-up TV): 70
channels / new Replay channels included
Strong premium offers: Canal+, Canal+ Infinity, OCS, BeIn…
No.1 for total number of foreign channels: over 235 / new
foreign channels included
New local channels
More inclusive landline destinations: over 110 / new
destinations included
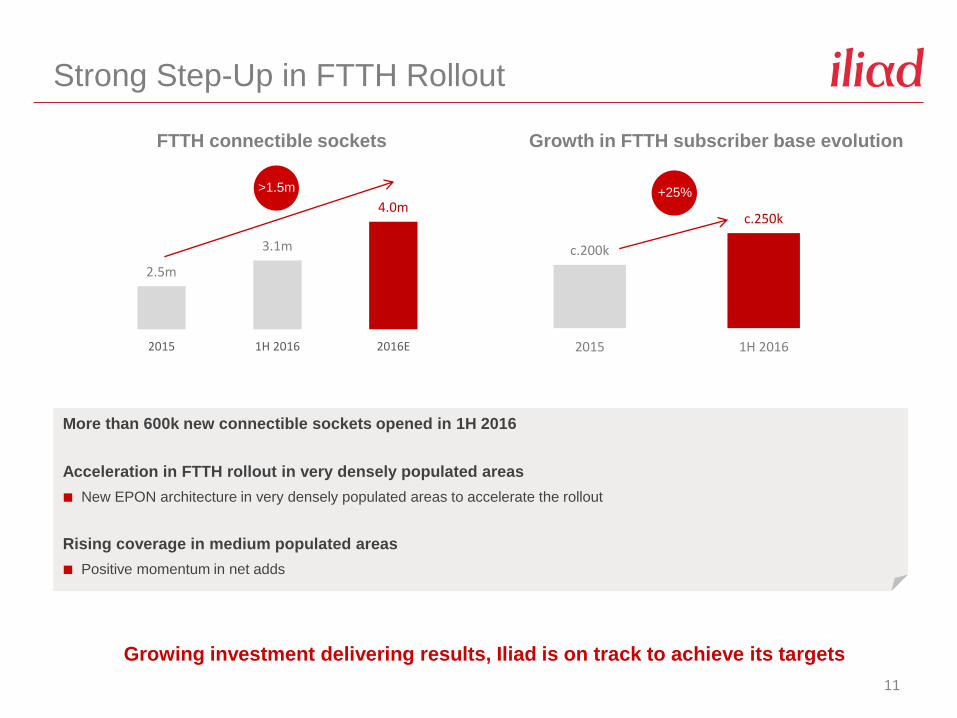
2.5m
3.1m
4.0m
2015 1H 2016 2016E
c.200k
c.250k
2015 1H 2016
11
Strong Step-Up in FTTH Rollout
More than 600k new connectible sockets opened in 1H 2016
Acceleration in FTTH rollout in very densely populated areas
New EPON architecture in very densely populated areas to accelerate the rollout
Rising coverage in medium populated areas
Positive momentum in net adds
FTTH connectible sockets
Growing investment delivering results, Iliad is on track to achieve its targets
>1.5m
Growth in FTTH subscriber base evolution
+25%
12
Mobile Business
3,600
5,205
6,7958,040
9,09510,105
10,92511,685 12,080
5.6%
7.9%
10.3%12.0%
13.4%14.6%
16.0%16.8% 17.4%
Jun-12 Dec-12 Jun-13 Dec-13 Jun-14 Dec-14 Jun-15 Dec-15 Jun-16
13
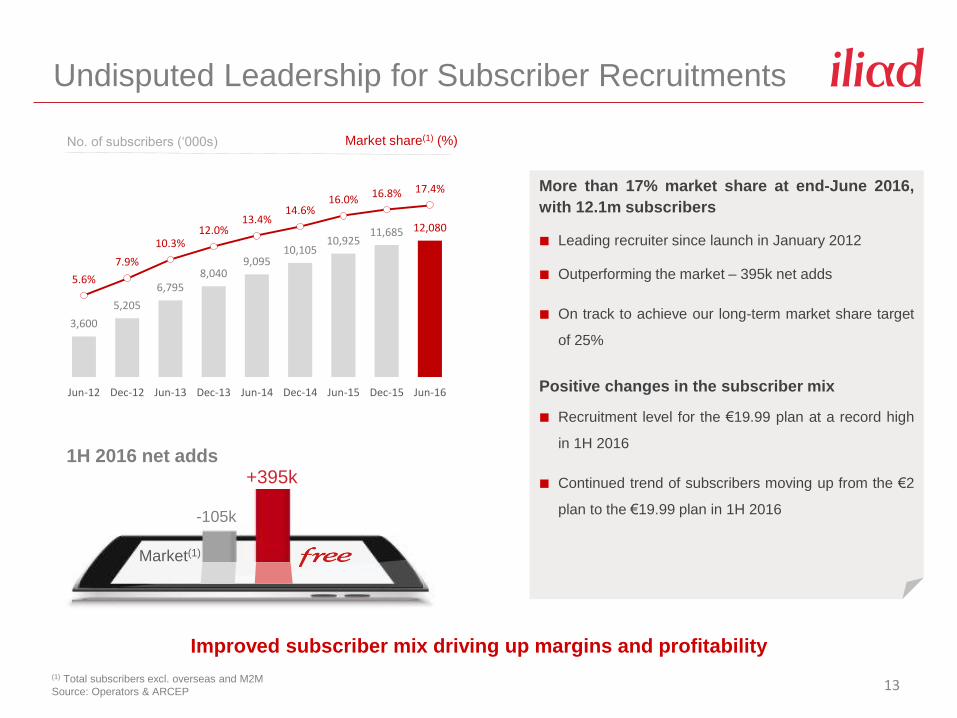
Undisputed Leadership for Subscriber Recruitments
No. of subscribers (‘000s) Market share(1) (%)
(1) Total subscribers excl. overseas and M2M
Source: Operators & ARCEP
Improved subscriber mix driving up margins and profitability
+395k
-105k
1H 2016 net adds
Market(1)
More than 17% market share at end-June 2016,
with 12.1m subscribers
Leading recruiter since launch in January 2012
Outperforming the market – 395k net adds
On track to achieve our long-term market share target
of 25%
Positive changes in the subscriber mix
Recruitment level for the €19.99 plan at a record high
in 1H 2016
Continued trend of subscribers moving up from the €2
plan to the €19.99 plan in 1H 2016
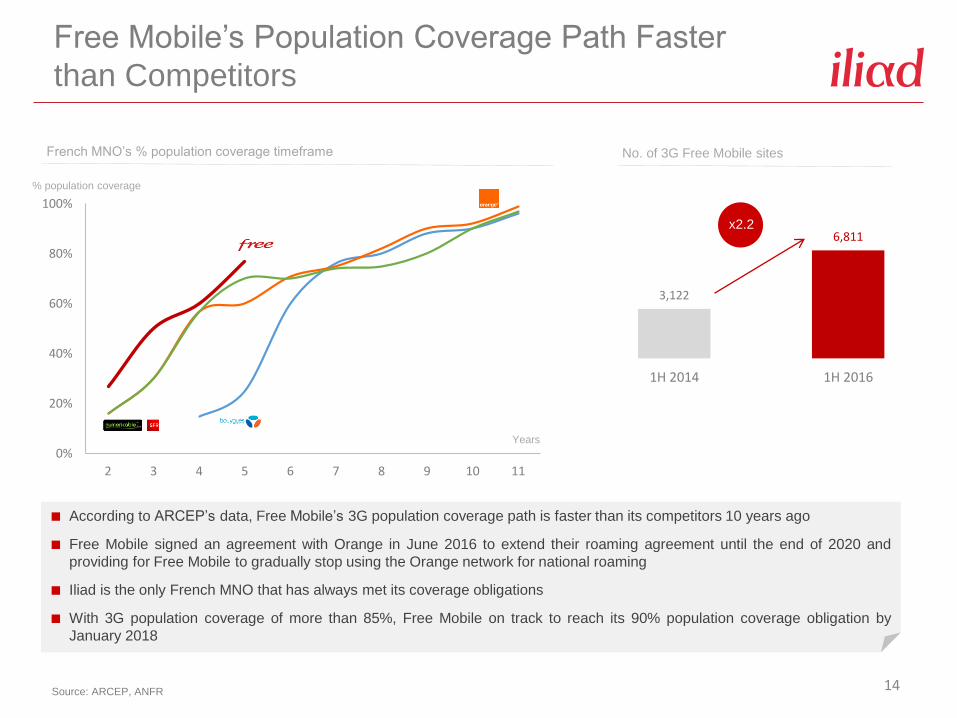
3,122
6,811
1H 2014 1H 2016
0%
20%
40%
60%
80%
100%
2 3 4 5 6 7 8 9 10 11
According to ARCEP’s data, Free Mobile’s 3G population coverage path is faster than its competitors 10 years ago
Free Mobile signed an agreement with Orange in June 2016 to extend their roaming agreement until the end of 2020 and
providing for Free Mobile to gradually stop using the Orange network for national roaming
Iliad is the only French MNO that has always met its coverage obligations
With 3G population coverage of more than 85%, Free Mobile on track to reach its 90% population coverage obligation by
January 2018
Free Mobile’s Population Coverage Path Faster
than Competitors
French MNO’s % population coverage timeframe
14Source: ARCEP, ANFR
% population coverage
Years
No. of 3G Free Mobile sites
x2.2
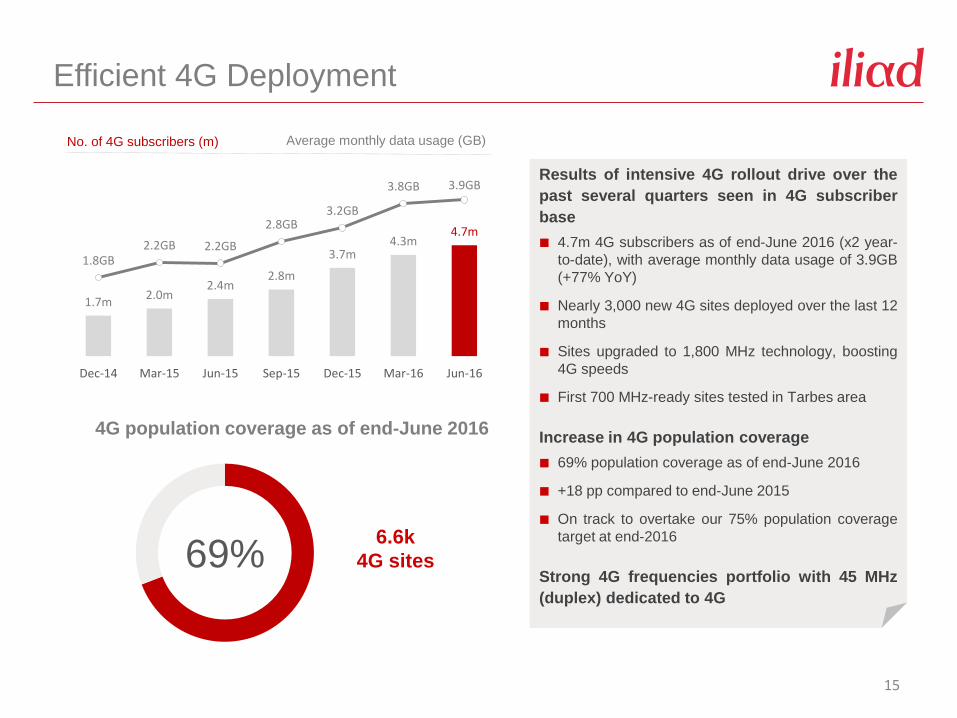
1.7m2.0m
2.4m2.8m
3.7m4.3m
4.7m
1.8GB2.2GB 2.2GB
2.8GB3.2GB
3.8GB 3.9GB
Dec-14 Mar-15 Jun-15 Sep-15 Dec-15 Mar-16 Jun-16
15
Efficient 4G Deployment
No. of 4G subscribers (m) Average monthly data usage (GB)
Results of intensive 4G rollout drive over the
past several quarters seen in 4G subscriber
base
4.7m 4G subscribers as of end-June 2016 (x2 year-
to-date), with average monthly data usage of 3.9GB
(+77% YoY)
Nearly 3,000 new 4G sites deployed over the last 12
months
Sites upgraded to 1,800 MHz technology, boosting
4G speeds
First 700 MHz-ready sites tested in Tarbes area
Increase in 4G population coverage
69% population coverage as of end-June 2016
+18 pp compared to end-June 2015
On track to overtake our 75% population coverage
target at end-2016
Strong 4G frequencies portfolio with 45 MHz
(duplex) dedicated to 4G
69%
4G population coverage as of end-June 2016
6.6k
4G sites
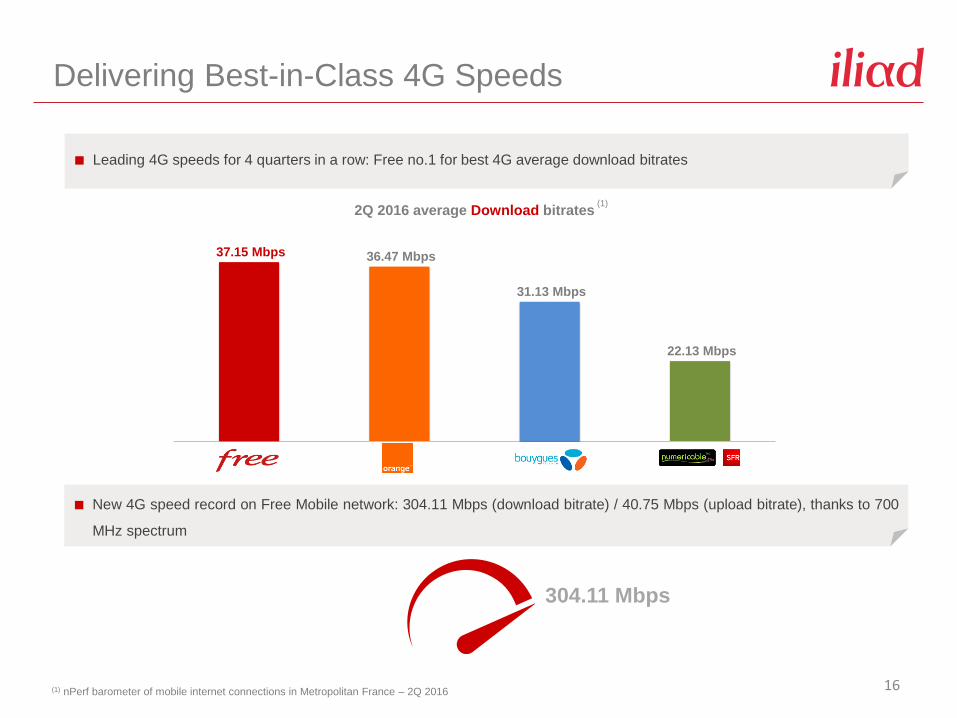
37.15 Mbps 36.47 Mbps
31.13 Mbps
22.13 Mbps
2Q 2016 average Download bitrates
New 4G speed record on Free Mobile network: 304.11 Mbps (download bitrate) / 40.75 Mbps (upload bitrate), thanks to 700
MHz spectrum
16
Delivering Best-in-Class 4G Speeds
(1) nPerf barometer of mobile internet connections in Metropolitan France – 2Q 2016
304.11 Mbps
Leading 4G speeds for 4 quarters in a row: Free no.1 for best 4G average download bitrates
(1)

17
Focus on the Italian Project
18
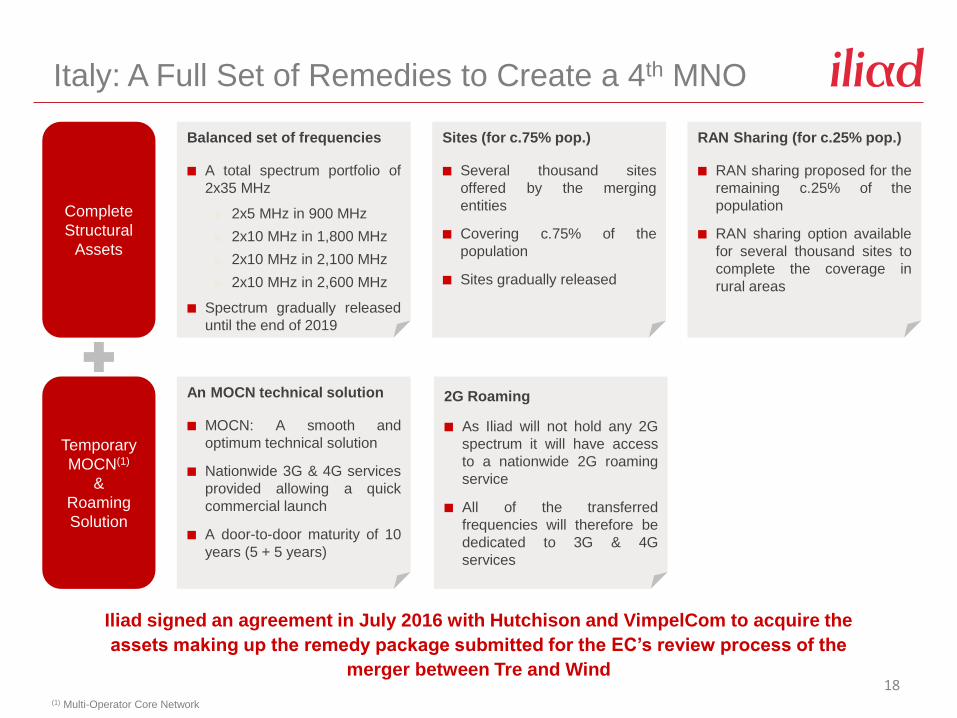
Italy: A Full Set of Remedies to Create a 4th MNO
Balanced set of frequencies
A total spectrum portfolio of
2x35 MHz
2x5 MHz in 900 MHz
2x10 MHz in 1,800 MHz
2x10 MHz in 2,100 MHz
2x10 MHz in 2,600 MHz
Spectrum gradually released
until the end of 2019
Complete
Structural
Assets
An MOCN technical solution
MOCN: A smooth and
optimum technical solution
Nationwide 3G & 4G services
provided allowing a quick
commercial launch
A door-to-door maturity of 10
years (5 + 5 years)
Temporary
MOCN(1)
&
Roaming
Solution
2G Roaming
As Iliad will not hold any 2G
spectrum it will have access
to a nationwide 2G roaming
service
All of the transferred
frequencies will therefore be
dedicated to 3G & 4G
services
Sites (for c.75% pop.)
Several thousand sites
offered by the merging
entities
Covering c.75% of the
population
Sites gradually released
RAN Sharing (for c.25% pop.)
RAN sharing proposed for the
remaining c.25% of the
population
RAN sharing option available
for several thousand sites to
complete the coverage in
rural areas
(1) Multi-Operator Core Network
Iliad signed an agreement in July 2016 with Hutchison and VimpelCom to acquire the
assets making up the remedy package submitted for the EC’s review process of the
merger between Tre and Wind
19
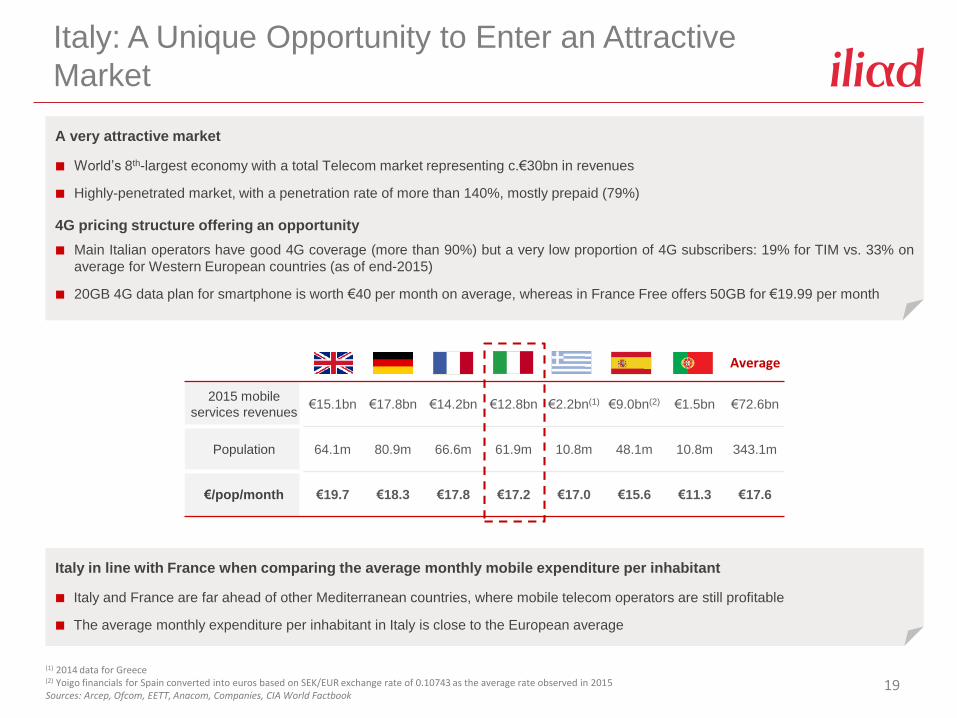
Italy: A Unique Opportunity to Enter an Attractive
Market
(1) 2014 data for Greece(2) Yoigo financials for Spain converted into euros based on SEK/EUR exchange rate of 0.10743 as the average rate observed in 2015Sources: Arcep, Ofcom, EETT, Anacom, Companies, CIA World Factbook
Italy in line with France when comparing the average monthly mobile expenditure per inhabitant
Italy and France are far ahead of other Mediterranean countries, where mobile telecom operators are still profitable
The average monthly expenditure per inhabitant in Italy is close to the European average
2015 mobile
services revenues€15.1bn €17.8bn €14.2bn €12.8bn €2.2bn(1) €9.0bn(2) €1.5bn €72.6bn
Population 64.1m 80.9m 66.6m 61.9m 10.8m 48.1m 10.8m 343.1m
€/pop/month €19.7 €18.3 €17.8 €17.2 €17.0 €15.6 €11.3 €17.6
Average
A very attractive market
World’s 8th-largest economy with a total Telecom market representing c.€30bn in revenues
Highly-penetrated market, with a penetration rate of more than 140%, mostly prepaid (79%)
4G pricing structure offering an opportunity
Main Italian operators have good 4G coverage (more than 90%) but a very low proportion of 4G subscribers: 19% for TIM vs. 33% on
average for Western European countries (as of end-2015)
20GB 4G data plan for smartphone is worth €40 per month on average, whereas in France Free offers 50GB for €19.99 per month

20
Financial Performance
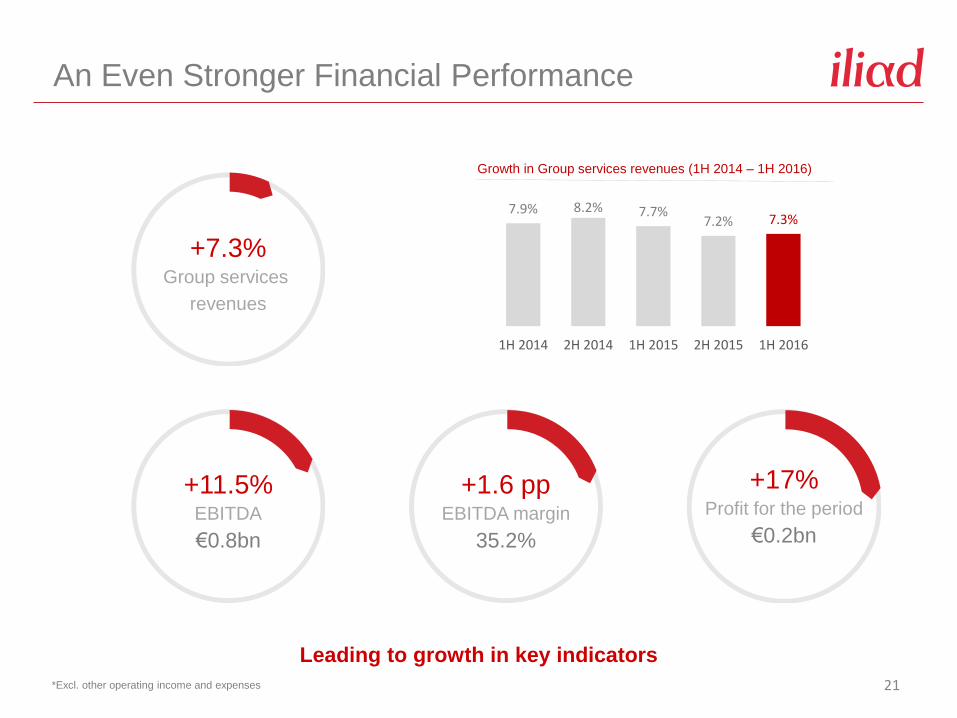
7.9% 8.2% 7.7%7.2% 7.3%
1H 2014 2H 2014 1H 2015 2H 2015 1H 2016
21
An Even Stronger Financial Performance
Leading to growth in key indicators
*Excl. other operating income and expenses
+7.3%Group services
revenues
+11.5%EBITDA
€0.8bn
+1.6 ppEBITDA margin
35.2%
+17%Profit for the period
€0.2bn
Growth in Group services revenues (1H 2014 – 1H 2016)
22
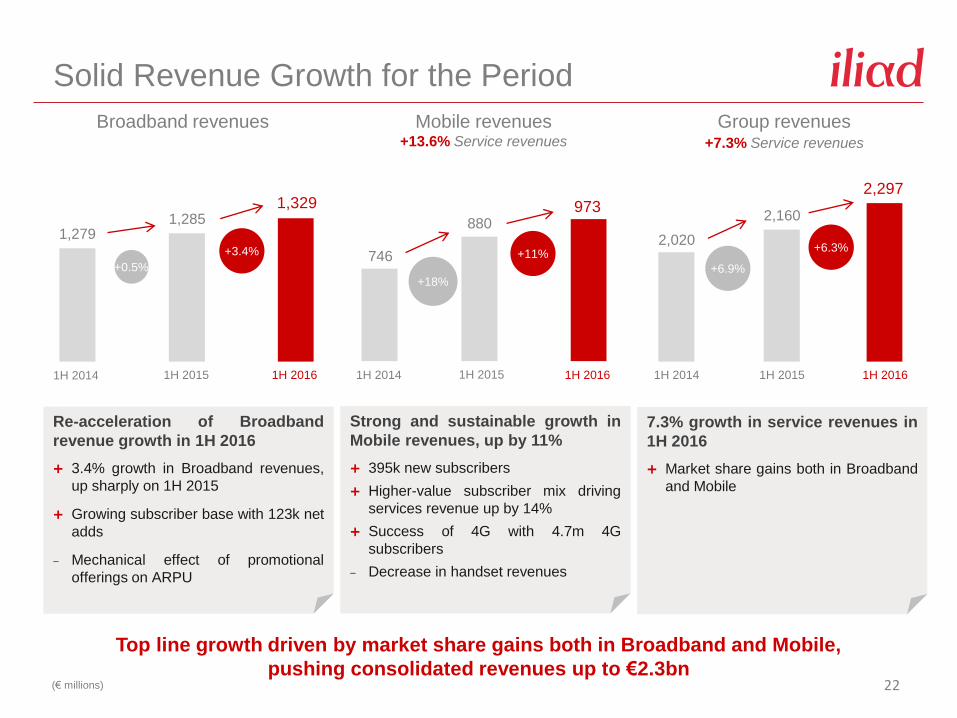
Solid Revenue Growth for the Period
(€ millions)
Broadband revenues Mobile revenues+13.6% Service revenues
1H 2015 1H 2016
1,2851,329
1H 2014 1H 2016
746
973
1H 2014 1H 2016
2,020
2,297
+3.4% +11%+6.3%
Group revenues+7.3% Service revenues
Re-acceleration of Broadband
revenue growth in 1H 2016
3.4% growth in Broadband revenues,
up sharply on 1H 2015
Growing subscriber base with 123k net
adds
‒ Mechanical effect of promotional
offerings on ARPU
Strong and sustainable growth in
Mobile revenues, up by 11%
395k new subscribers
Higher-value subscriber mix driving
services revenue up by 14%
Success of 4G with 4.7m 4G
subscribers
‒ Decrease in handset revenues
7.3% growth in service revenues in
1H 2016
Market share gains both in Broadband
and Mobile
Top line growth driven by market share gains both in Broadband and Mobile,
pushing consolidated revenues up to €2.3bn
1H 2014
1,279
+0.5%
1H 2015
880
+18%
1H 2015
2,160
+6.9%
23
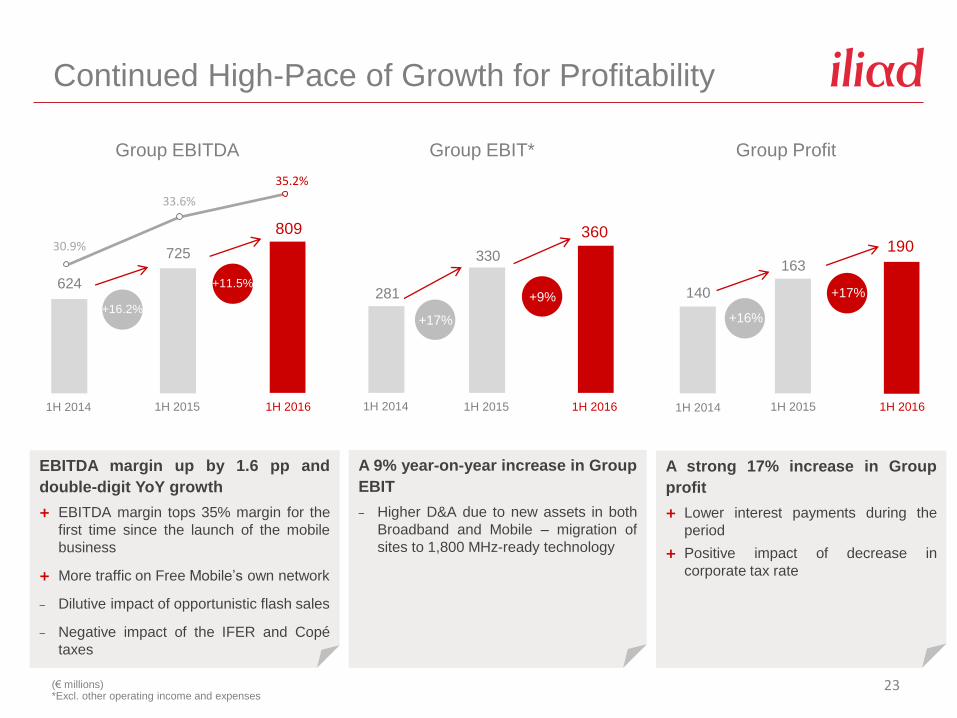
Continued High-Pace of Growth for Profitability
(€ millions)*Excl. other operating income and expenses
Group EBITDA Group EBIT* Group Profit
1H 2015 1H 2016
725
809
1H 2015 1H 2016
330
360
1H 2015 1H 2016
163
190
+11.5%
+9% +17%
35.2%
33.6%
EBITDA margin up by 1.6 pp and
double-digit YoY growth
EBITDA margin tops 35% margin for the
first time since the launch of the mobile
business
More traffic on Free Mobile’s own network
‒ Dilutive impact of opportunistic flash sales
‒ Negative impact of the IFER and Copé
taxes
A 9% year-on-year increase in Group
EBIT
‒ Higher D&A due to new assets in both
Broadband and Mobile – migration of
sites to 1,800 MHz-ready technology
A strong 17% increase in Group
profit
Lower interest payments during the
period
Positive impact of decrease in
corporate tax rate
1H 2014
624
+16.2%
30.9%
1H 2014
281
+17%
1H 2014
140
+16%
24
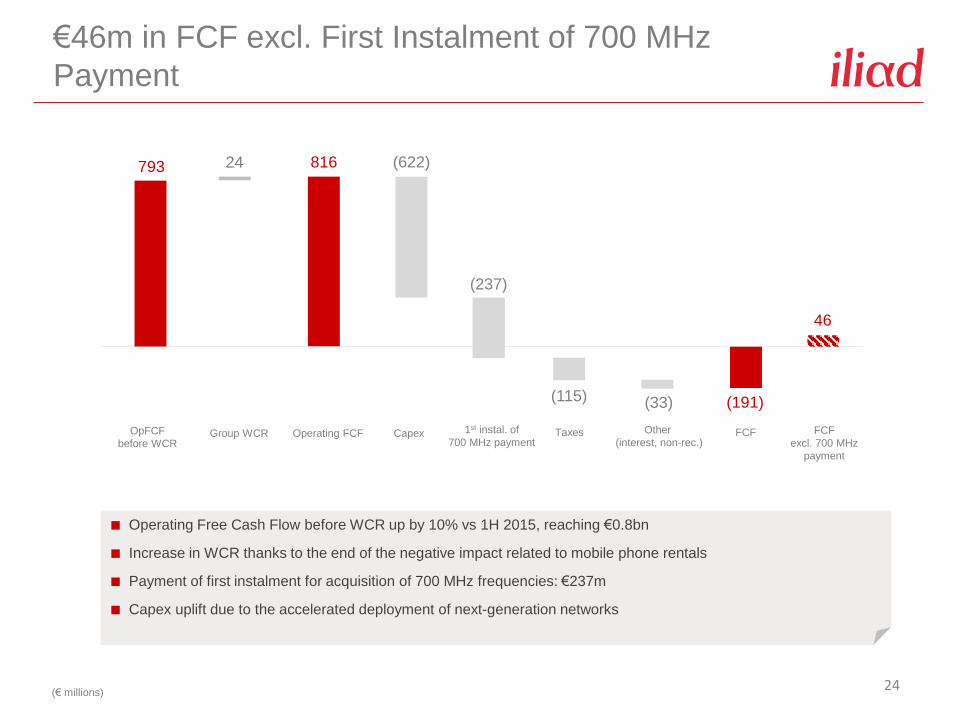
€46m in FCF excl. First Instalment of 700 MHz
Payment
793 816
OpFCF
before WCRGroup WCR
(115)
Operating FCF Capex Taxes Other
(interest, non-rec.)FCF
24 (622)
(33) (191)
(€ millions)
46
FCF
excl. 700 MHz
payment
Operating Free Cash Flow before WCR up by 10% vs 1H 2015, reaching €0.8bn
Increase in WCR thanks to the end of the negative impact related to mobile phone rentals
Payment of first instalment for acquisition of 700 MHz frequencies: €237m
Capex uplift due to the accelerated deployment of next-generation networks
(237)
1st instal. of
700 MHz payment
(€ millions)Source: ANFR
25
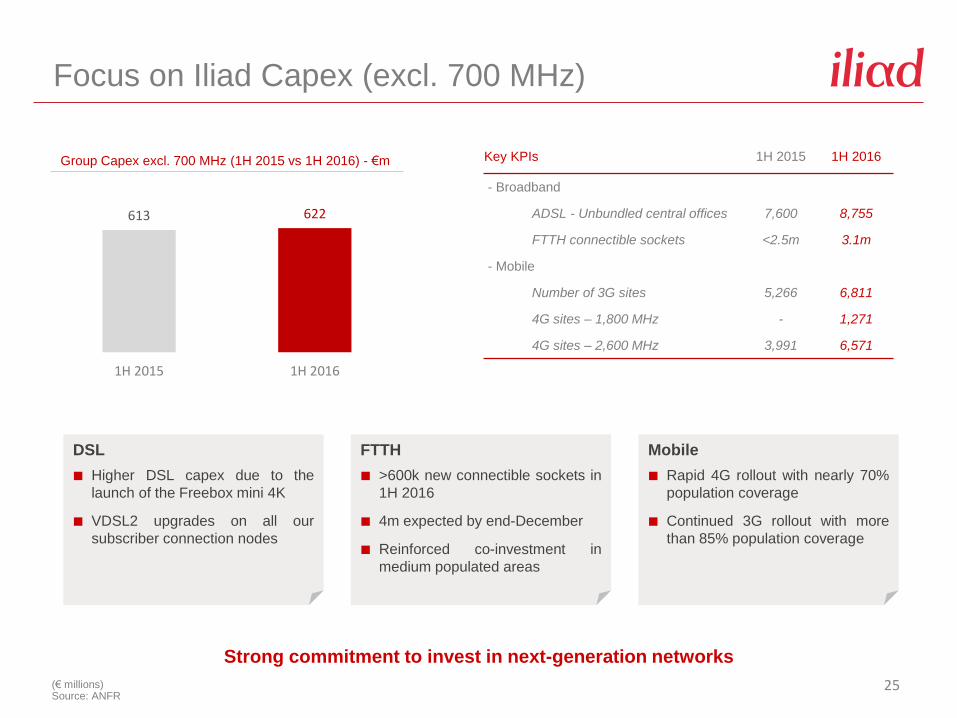
Focus on Iliad Capex (excl. 700 MHz)
DSL
Higher DSL capex due to the
launch of the Freebox mini 4K
VDSL2 upgrades on all our
subscriber connection nodes
FTTH
>600k new connectible sockets in
1H 2016
4m expected by end-December
Reinforced co-investment in
medium populated areas
Mobile
Rapid 4G rollout with nearly 70%
population coverage
Continued 3G rollout with more
than 85% population coverage
Strong commitment to invest in next-generation networks
613 622
1H 2015 1H 2016
Group Capex excl. 700 MHz (1H 2015 vs 1H 2016) - €m Key KPIs 1H 2015 1H 2016
- Broadband
ADSL - Unbundled central offices 7,600 8,755
FTTH connectible sockets <2.5m 3.1m
- Mobile
Number of 3G sites 5,266 6,811
4G sites – 1,800 MHz - 1,271
4G sites – 2,600 MHz 3,991 6,571
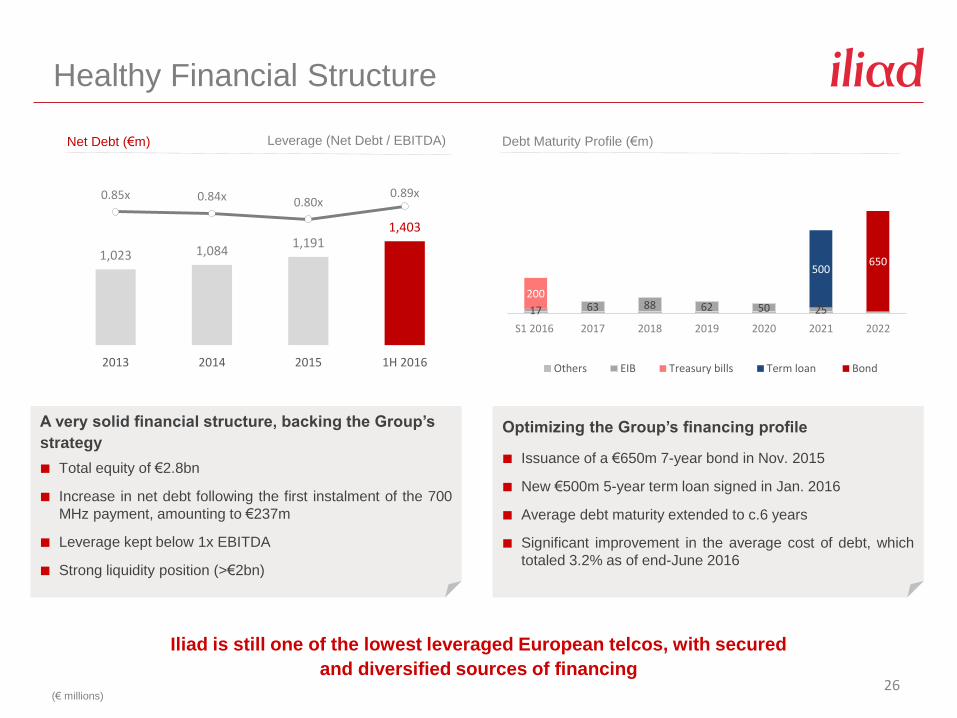
1,023 1,0841,191
1,403
0.85x 0.84x 0.80x0.89x
2013 2014 2015 1H 2016
26
Healthy Financial Structure
Iliad is still one of the lowest leveraged European telcos, with secured
and diversified sources of financing
A very solid financial structure, backing the Group’s
strategy
Total equity of €2.8bn
Increase in net debt following the first instalment of the 700
MHz payment, amounting to €237m
Leverage kept below 1x EBITDA
Strong liquidity position (>€2bn)
Optimizing the Group’s financing profile
Issuance of a €650m 7-year bond in Nov. 2015
New €500m 5-year term loan signed in Jan. 2016
Average debt maturity extended to c.6 years
Significant improvement in the average cost of debt, which
totaled 3.2% as of end-June 2016
17 63 88 62 50 25
200
500650
S1 2016 2017 2018 2019 2020 2021 2022
Others EIB Treasury bills Term loan Bond
Net Debt (€m) Leverage (Net Debt / EBITDA) Debt Maturity Profile (€m)
(€ millions)

27
Focus on the Italian Project
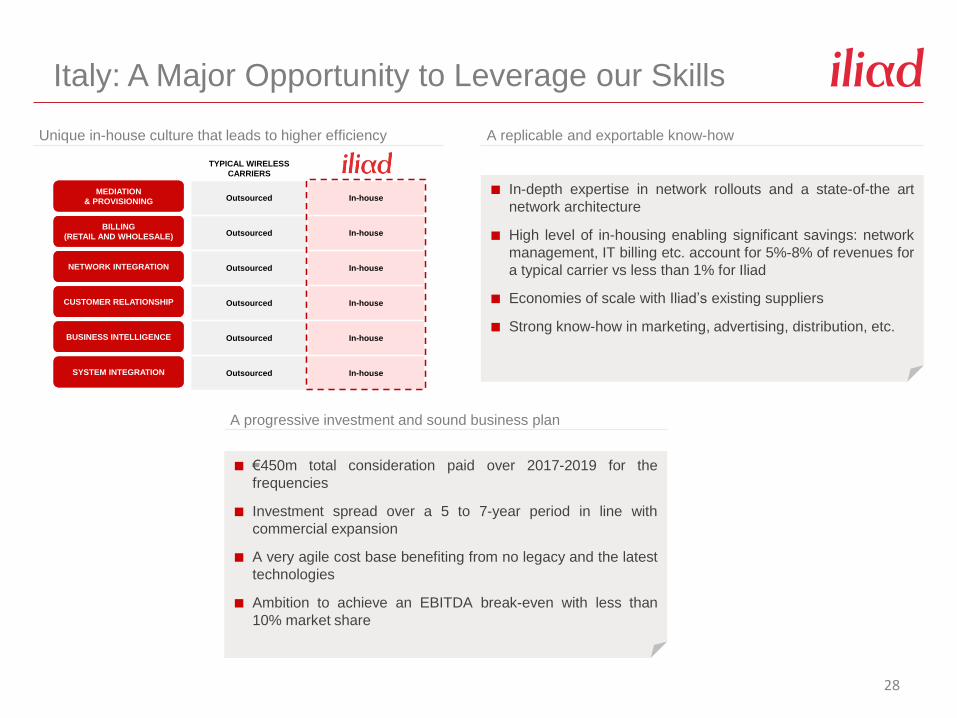
Unique in-house culture that leads to higher efficiency A replicable and exportable know-how
A progressive investment and sound business plan
In-depth expertise in network rollouts and a state-of-the art
network architecture
High level of in-housing enabling significant savings: network
management, IT billing etc. account for 5%-8% of revenues for
a typical carrier vs less than 1% for Iliad
Economies of scale with Iliad’s existing suppliers
Strong know-how in marketing, advertising, distribution, etc.
Italy: A Major Opportunity to Leverage our Skills
€450m total consideration paid over 2017-2019 for the
frequencies
Investment spread over a 5 to 7-year period in line with
commercial expansion
A very agile cost base benefiting from no legacy and the latest
technologies
Ambition to achieve an EBITDA break-even with less than
10% market share
28
TYPICAL WIRELESS
CARRIERS
Outsourced In-house
Outsourced In-house
Outsourced In-house
Outsourced In-house
Outsourced In-house
Outsourced In-house
MEDIATION
& PROVISIONING
BILLING
(RETAIL AND WHOLESALE)
NETWORK INTEGRATION
CUSTOMER RELATIONSHIP
BUSINESS INTELLIGENCE
SYSTEM INTEGRATION
29
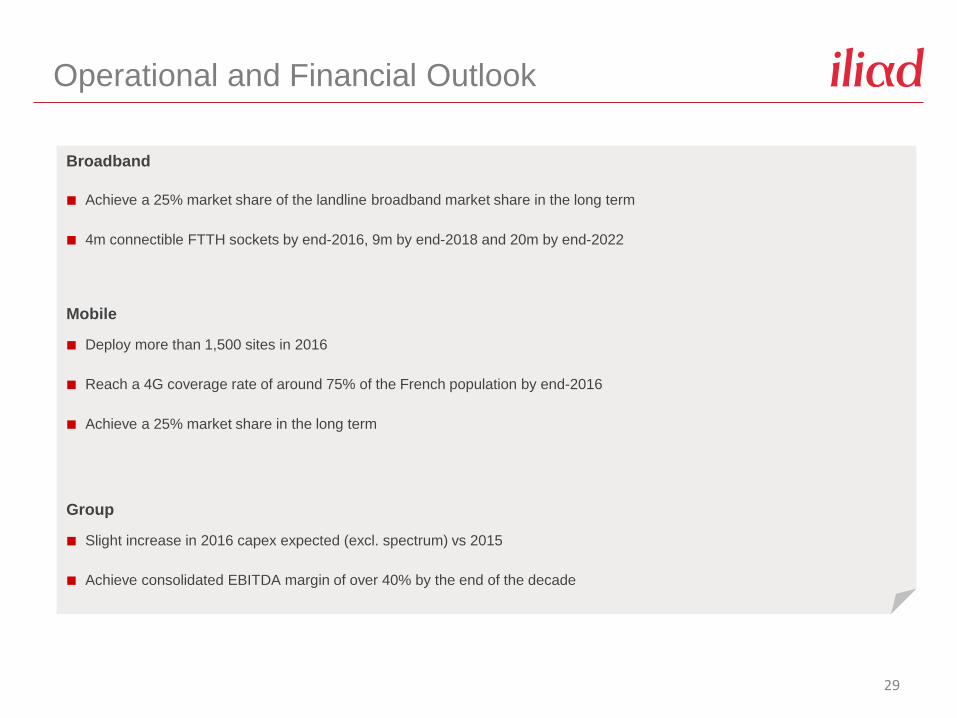
Operational and Financial Outlook
Broadband
Achieve a 25% market share of the landline broadband market share in the long term
4m connectible FTTH sockets by end-2016, 9m by end-2018 and 20m by end-2022
Mobile
Deploy more than 1,500 sites in 2016
Reach a 4G coverage rate of around 75% of the French population by end-2016
Achieve a 25% market share in the long term
Group
Slight increase in 2016 capex expected (excl. spectrum) vs 2015
Achieve consolidated EBITDA margin of over 40% by the end of the decade