1996 review of the - atlantic states marine fisheries ... · review of the atlantic states marine...
TRANSCRIPT

REVIEW OF THE ATLANTIC STATES MARINE FISHERIES COMMISSION
FISHERY MANAGEMENT PLAN FOR
TAUTOG (Tautoga onitis)
2015 and 2016 Fishing Years
(January 1 – December 31)
Prepared by the Tautog Plan Review Team Caitlin Starks, ASMFC, Chair
Nichole Ares, RI DEM Linda Barry, NJ DEP
Colleen Giannini, CT DEEP Nichola Meserve, MA DMF
Sabrina Lovell, NOAA
October 2017

Review of the ASMFC Tautog FMP and State Compliance: 2015 and 2016 Fishing Years 1
2017 REVIEW OF THE ASMFC FISHERY MANAGEMENT PLAN FOR
TAUTOG (Tautoga onitis) Fishing Years 2015 and 2016
I. Status of Fishery Management Plan Date of FMP Approval March 1996 Amendments None Addenda Addendum I (May 1997) Addendum II (November 1999) Addendum III (February 2002) Addendum IV (January 2007) Addendum V (August 2007) Addendum VI (March 2011, revised March 2012) Stock Assessments Benchmark: 1999, 2005, 2015 Update: 2011 (revised in 2012), 2016 Management Unit US state waters from Massachusetts through North
Carolina. States with Declared Interest Massachusetts
Rhode Island Connecticut New York New Jersey Delaware Maryland Virginia
Active Boards/Committees Tautog Management Board (Board) Tautog Plan Development Team (PDT)
Tautog Plan Review Team (PRT) Tautog Technical Committee (TC) Tautog Stock Assessment Subcommittee (SAS) Tautog Advisory Panel (AP)

Review of the ASMFC Tautog FMP and State Compliance: 2015 and 2016 Fishing Years 2
History of Management
Fishery Management Plan for Tautog The FMP established the following goals and objectives: Goals To perpetuate and enhance stocks of tautog through interstate fishery management so as to
allow a recreational and commercial harvest consistent with the long term maintenance of self-sustaining spawning stocks.
To maintain recent (i.e. 1982 – 1991) utilization patterns and proportions of catch taken by commercial and recreational harvesters.
To provide for the conservation, restoration and enhancement of tautog critical habitat for all life history stages.
To maintain a healthy age structure.
To conserve the tautog resource along the Atlantic coast to preserve ecological benefits such as biodiversity and reef community stability, while maintaining the social and economic benefits of commercial and recreational utilization.
Objectives To establish criteria, standards, and procedures for plan implementation as well as
determination of states’ compliance with management plan provisions.
To allow harvest that maintains spawning stock biomass in a condition that provides for perpetuation of self-sustaining spawning stocks in each spawning area, based on maintaining young-of-the-year indices, SSB, size and age structure, or other measures of spawning success at or above historical levels as established in the plan.
To achieve compatible equitable management measures among jurisdictions throughout the fishery management unit.
To enact management recommendations which apply to fish landed in each state, so that regulations apply to fish caught both inside and outside of state waters.
To promote cooperative interstate biological, social, and economic research, monitoring and law enforcement.
To encourage sufficient monitoring of the resource and collection of additional data, particularly in the southern portion of the species range, that are necessary for development of effective long-term management strategies and evaluation of the management program. Effective stock assessment and population dynamics modeling require more information on the status of the resource and the biology/community ecology of tautog than is currently available, in particular to facilitate calculation of F and stock trends.

Review of the ASMFC Tautog FMP and State Compliance: 2015 and 2016 Fishing Years 3
To identify critical habitats and environmental factors that support or limit long term maintenance and productivity of sustainable tautog populations.
To adopt and promote standards of environmental quality necessary to the long term maintenance and productivity of tautog throughout their range.
To develop strategies that reduce fishing mortality, restore size competition and the historical recreational/commercial split, consider ecological and socio-economic impacts and identify problems associated with the offshore fishery. Compatible regulations between the states and the EEZ are essential.
The FMP adopted a fishing mortality rate (F) target of 0.15 to rebuild the stocks and prevent overfishing; however, an interim target of 0.24 would apply for two years (1997–1998). States were required to implement state-specific, Board-approved plans to reduce F from the coastwide average of 0.58 (i.e., a 55% reduction), or an alternative state-specific F, if it could be demonstrated as equivalent. Recreational and commercial minimum size limits of 13” in 1997 and 14” beginning in 1998 were required. Tautog pots and traps were also required to have degradable fasteners on one panel or door. Addendum I Addendum I modified the FMP’s compliance schedule to allow all states until April 1, 1998 to implement management measures to reach the interim F target. Several states were having difficulty determining a state-specific F to meet the original compliance schedule due to data deficiencies. In addition, the compliance schedule implemented the interim F target one year earlier in the area north of Delaware Bay (April 1, 1997) than further to the south (April 1, 1998). The addendum also delayed the implementation of management measures to achieve the permanent F target from April 1, 1999 to April 1, 2000. Finally, the Addendum included de minimis requirements and corrected several typographical errors in the FMP. Addendum II Addendum II further extended the compliance schedule to achieve the permanent F target until April 1, 2002 because the effects of the regulations to achieve the interim F target were uncertain. It also listed four issues to be considered in subsequent revisions of the FMP: (1) development of alternative F targets that will allow states to quantify harvest reductions associated with a variety of management approaches, (2) clarification of the F targets to be met by sector or overall state program, (3) monitoring requirements to improve fisheries and biological data collection, and (4) data requirements to analyze management options by fishing modes within commercial and recreational fisheries. Addendum III and Technical Addendum I Addendum III addressed the four issues listed in Addendum II. It adopted a new F target based on achieving 40% of the spawning stock biomass (F40% SSB), which was estimated at 0.29 (compared to the coastwide average F estimate of 0.41). The addendum required states to maintain current or more restrictive measures for 2002 and implement measures to achieve the new F target—a 48% reduction through restrictions in the recreational fishery only—by April 1, 2003. It also updated information on tautog habitat and established monitoring requirements to

Review of the ASMFC Tautog FMP and State Compliance: 2015 and 2016 Fishing Years 4
support stock assessments. Technical Addendum 1 corrected a typographical error in Addendum III. Addendum IV Addendum IV established SSB target and threshold reference points based on a benchmark stock assessment completed in 2005. The target was set as the average SSB over 1982–1991, and the threshold at 75% of this value. It also set a new F target of 0.20 to initiate rebuilding. States were required to implement recreational management programs to achieve a 28.6% reduction in F relative to 2005 (and maintain existing commercial management programs) by January 1, 2008. Addendum V As individual states developed management proposals to comply with Addendum IV’s mandated reduction in fishing mortality, it became apparent that commercial harvest of tautog had grown in proportion to the recreational fishery in some states. The Board approved Addendum V to give states flexibility for implementing reductions in their recreational and/or commercial fisheries to reach the fishing mortality target rate of F = 0.20 established in Addendum IV by January 1, 2008. Addendum VI Based on the 2011 stock assessment update indicating that tautog were still overfished and experiencing overfishing, Addendum VI reduced the F target to 0.15 to rebuild the stock. States were required to implement Board-approved regulations in their commercial and/or recreational fisheries to reduce harvest by 39%. The addendum also allowed for regional considerations if a state or group of states could demonstrate that the local F is below the rates indicated in the stock assessment update.
II. Status of Stocks
A benchmark stock assessment with data through 2013 was completed and peer-reviewed in 2014. The assessment proposed regional stock definitions based on life history characteristics and harvest patterns. While several stock structures were modeled, the Technical Committee preferred the following three-region breakdown: Southern New England (MA-CT), New Jersey-New York (NJ-NY), and Delaware-Maryland-Virginia (DMV). Each region was assessed independently using the statistical catch-at-age model ASAP. The Board accepted the benchmark stock assessment for management use and initiated Draft Amendment 1 in May 2015 to develop regional management alternatives. To further develop a range of regional alternatives for Draft Amendment 1, the Board requested additional spatial resolution in the Mid-Atlantic region, specifically development of a separate assessment for Long Island Sound that includes Connecticut plus New York’s north shore of Long Island (LIS), and an assessment for the rest of New York through New Jersey (NJ-NYB). ASAP assessments for these two regions were conducted in early 2016 and subsequently accepted for management use. This resulted in the northernmost region including only Maryland and Rhode Island (MARI).

Review of the ASMFC Tautog FMP and State Compliance: 2015 and 2016 Fishing Years 5
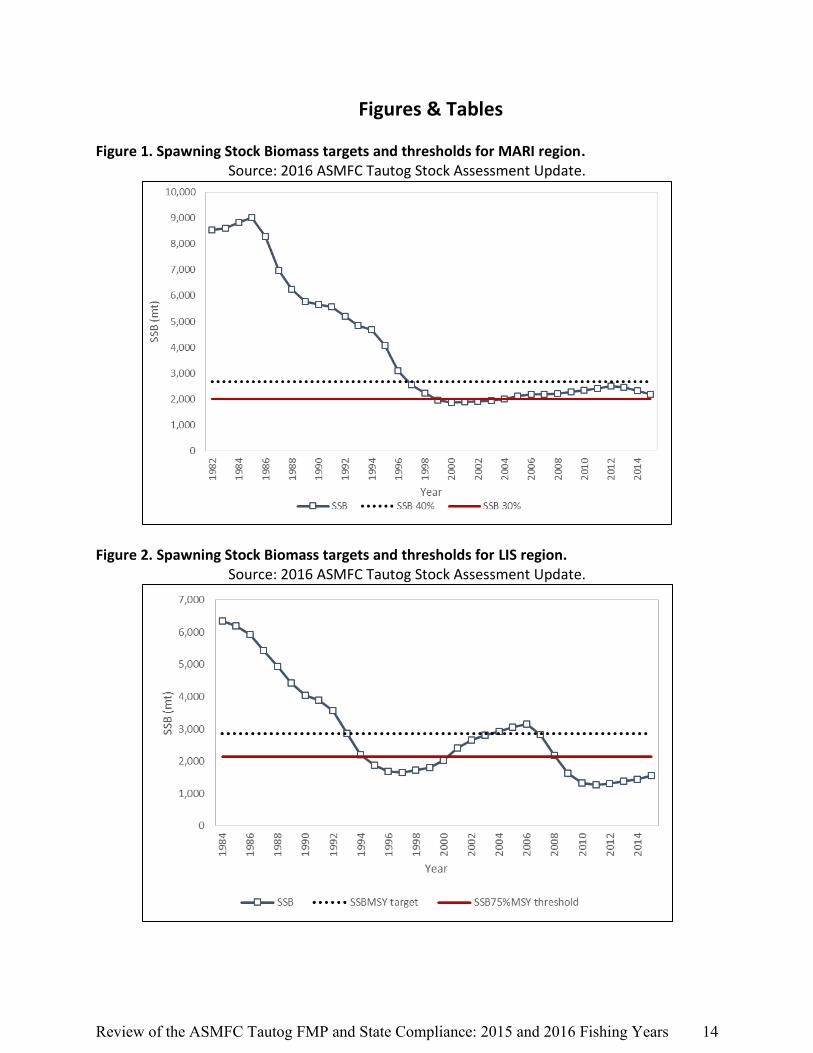
In 2016 a stock assessment update was completed in which all four regions (MARI, LIS, NJ-NYB, and DMV) were updated incorporating landings and index data through 2015. The assessment update indicated that all regions except MARI were overfished in 2015. It also found overfishing was occurring in the LIS and NJ-NYB regions in 2015. Overfishing was not occurring in the MARI nor DMV regions, although F was still above the target in the MARI region. F was at the target in the DMV region. The current overfishing and overfished definitions for management use are shown in Table 1, and spawning stock biomass (SSB) for each region relative to the respective targets and thresholds are shown in Figures 1-4. It is important to note that the status determinations were made using SPR reference points for the MARI and DMV regions, and MSY reference points for the LIS and NJ-NYB regions.
III. Status of Assessment Advice The current reference points for this fishery are based on a regional stock assessment update that includes data through 2015. The peer review panel in the 2005 and 2015 benchmark stock assessments advised a regional approach for tautog because of the potential for sub-stock structure; this species does not appear to make north-south migrations. The 2015 benchmark stock assessment peer review panel endorsed the use of estimates from the ASAP regional model and believes the new reference points should be used in conjunction with a regional management approach. The Board has approved the benchmark stock assessment and subsequent assessment updates for management use, but the regional reference points have not been adopted. Regional management alternatives are included in Draft Amendment 1, which went out for public comment in early 2017 and will be reviewed by the Tautog management board for approval in late 2017. The next assessment (update or benchmark) has not been scheduled.
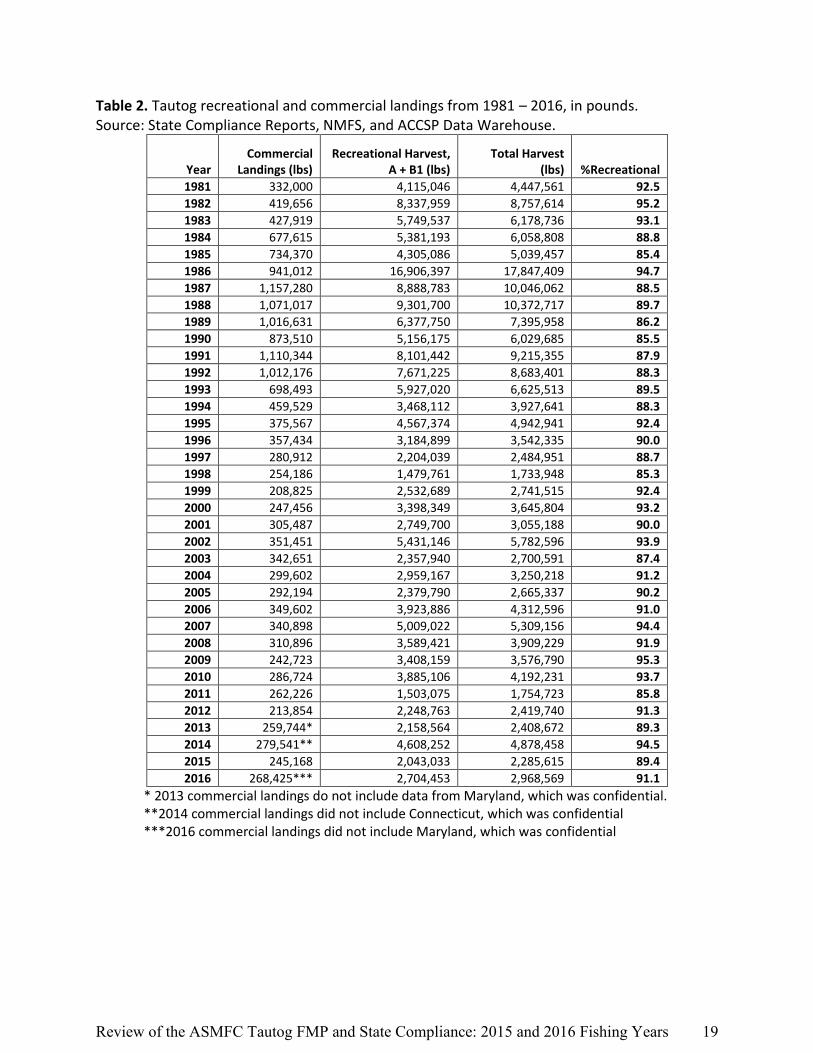
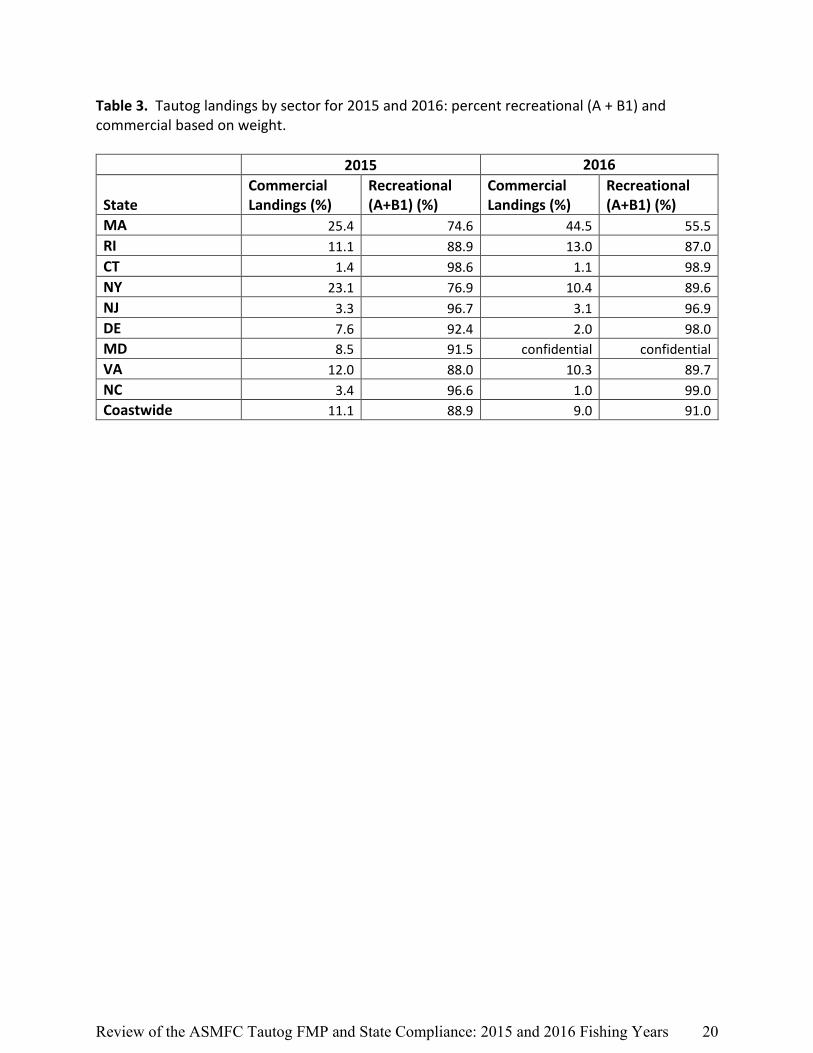
IV. Status of the Fishery Total Harvest Between 1981 and 20161, the total coastwide harvest (recreational harvest + commercial landings) for tautog peaked at 17.8 million pounds in 1986. Landings have significantly declined, even before state regulations were implemented to restrict landings. Since the Tautog FMP was implemented in 1996, the highest total harvest was in 2002 at nearly 5.8 million pounds, which is about 32% of the historic peak. Total harvest during the managed period from 1996-2016 averaged 3.3 million pounds per year (Figure 6). Recreational Harvest Tautog is predominantly taken by the recreational fishery, which accounts for a consistent average of 90% of coastwide landings by weight from 1981 to 2016 (Table 2). Coastwide, anglers caught a historic high of 16.9 million pounds of tautog in 1986 (Figure 6, Table 2). However, 1986
1 Systematic recreational data collection for tautog began in 1981, while commercial data exists back to 1950.
Review of the ASMFC Tautog FMP and State Compliance: 2015 and 2016 Fishing Years 6
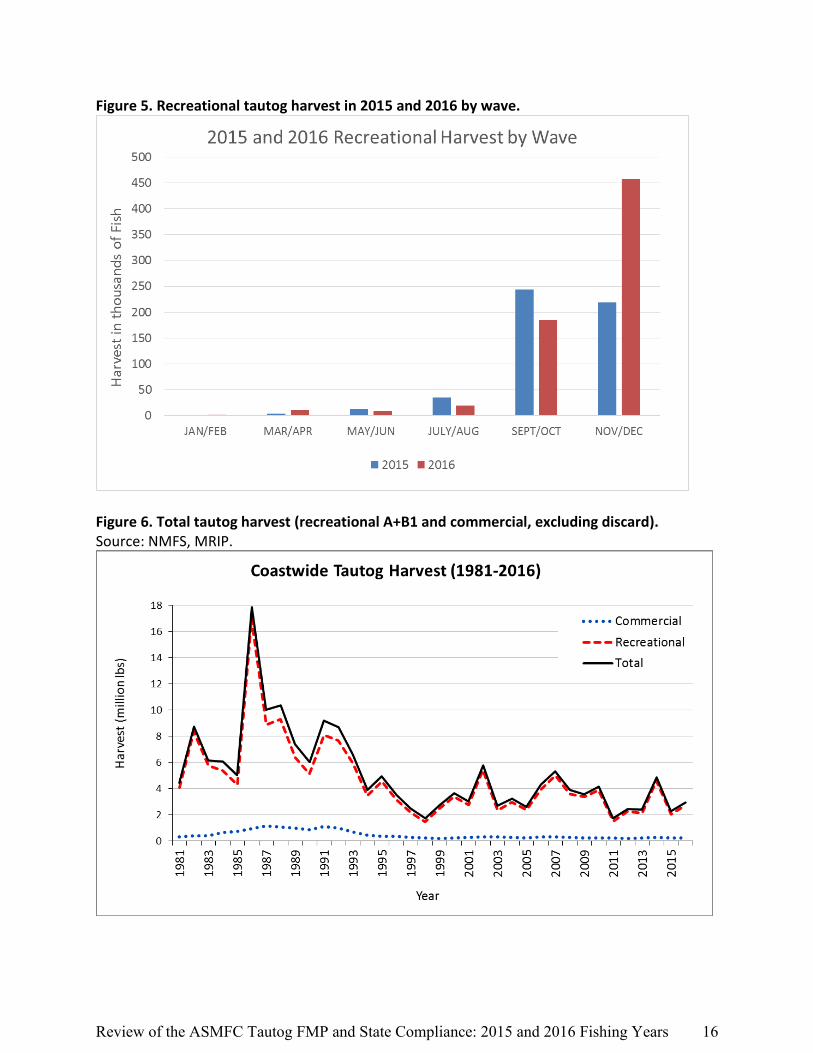
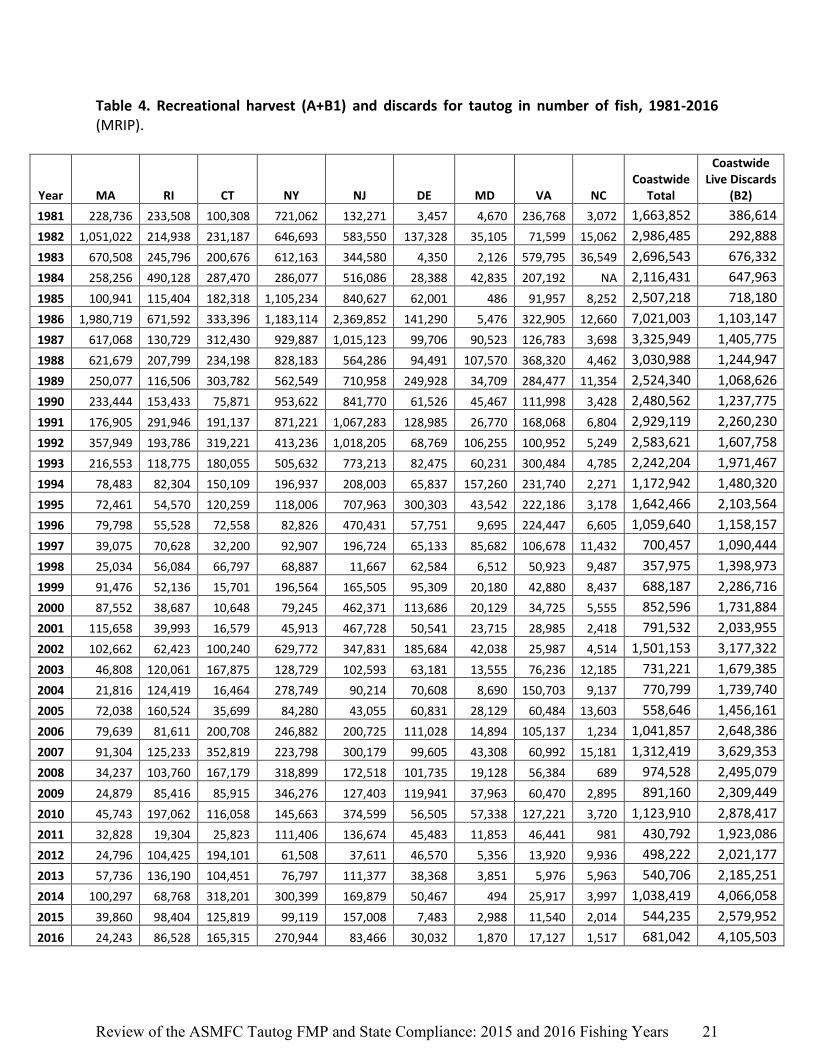
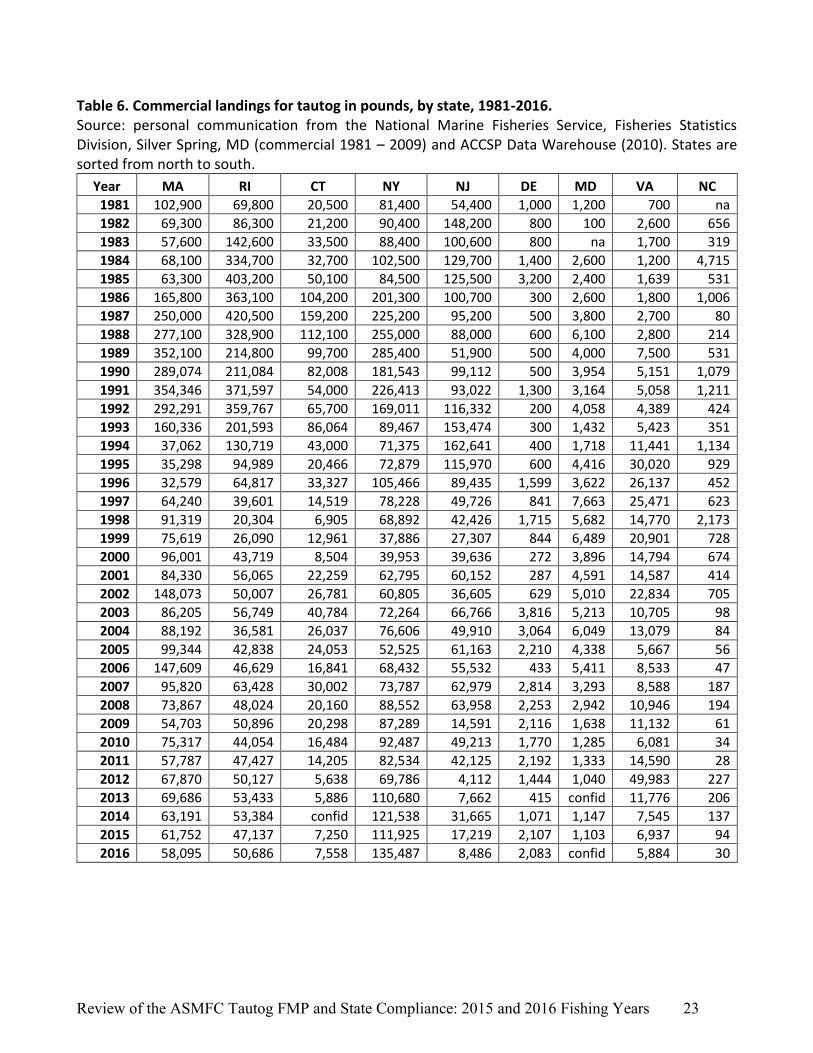
was a unique year in which recreational harvest in Massachusetts was unusually high. Since then, harvest has generally declined. The smallest harvests occurred in both 1998 and 2011, at 1.5 million pounds each year, which equal 9% of the historic high and 31% of the time series average. Recreational harvest increased from 2015 to 2016, with totals of 2.0 and 2.7 million lbs in each respective year. The time series average for recreational harvest from 1981-2016 is 4.7 million pounds per year. At the state level, Connecticut and New York anglers harvested the most tautog in 2015 and 2016, respectively (Tables 4 and 5). Recreational live discards have generally increased relative to harvest over the time series. Prior to the FMPs implementation in 1996, discards were usually less than harvest, but since 1996 the estimated number of fish discarded annually has generally been 2-3 times greater than the harvested number (Table 4). In 2015 and 2016, live discards were 4.8 and 6 times the estimated harvest, respectively. Recreational discard mortality for tautog is estimated in the 2016 stock assessment update at 2.5%. Commercial Landings Historically, tautog was considered a “trash fish” until the late 1970s, when demand increased and directed fishery developed. Landings quickly rose, peaking in 1987 with nearly 1.2 million pounds, then quickly began to decline. In 1992, states began to implement regulations, which contributed to a decline in landings (Figure 7, Table 2). The value (dollars per pound) for tautog has increased since the late 1970s, coinciding with the increase of landings. In 2015, the value reached $3.76 per pound (Figure 7). Commercial landings accounted for only 11% and 9% of all total landings coastwide in 2015 and 2016, respectively. Yet, in some states commercial landings were more significant; 2016 Massachusetts commercial landings made up 44.5% of total tautog landings by weight (Table 3). At the state level, New York’s commercial tautog fishery landed the greatest amount in both 2015 and 2016, with Massachusetts landing the second greatest amount in these years (Table 6). Data on commercial discards are not available.
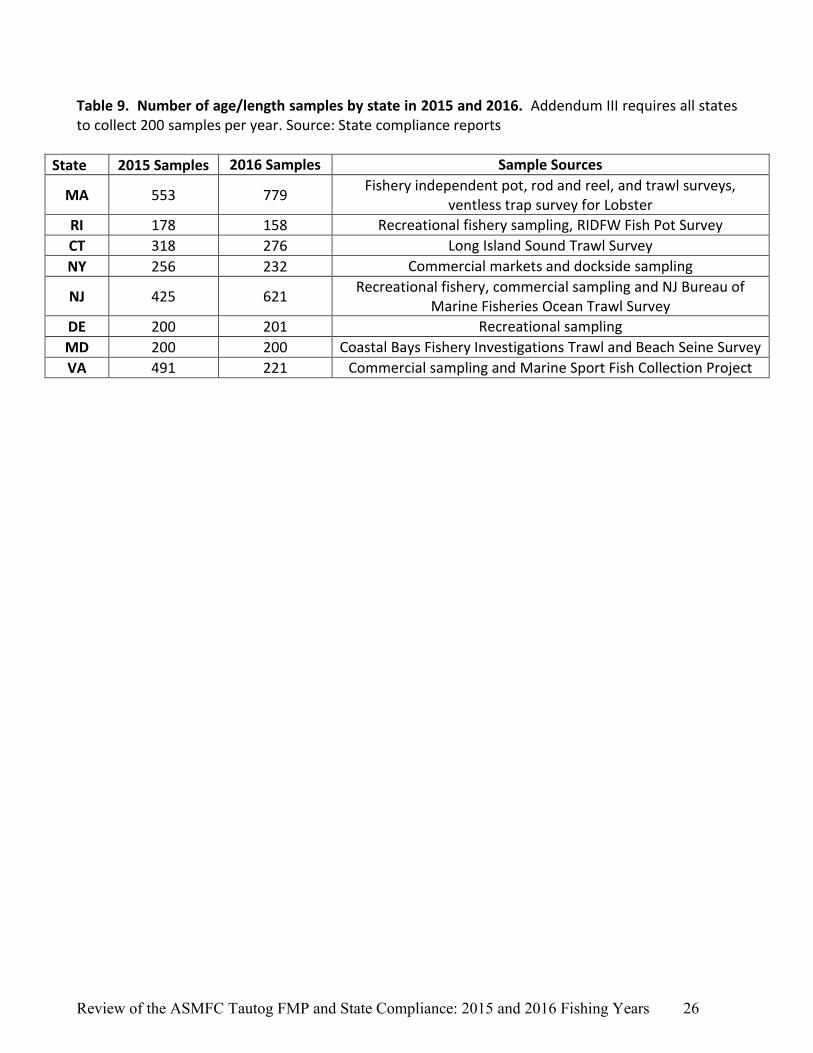
V. Status of Research and Monitoring Addendum III requires all states to collect the following data to continue support of a coast-wide stock assessment: commercial and recreational catch estimates and 200 age and length samples per state, within the range of lengths commonly caught by the fisheries2. Table 9 lists number and source of samples collected by states in 2015 and 2016. A list of monitoring programs performed by each state is given below. Details of monitoring results are found in the state compliance reports.
2 Addendum III also required a suitable time series of fisheries independent indices of abundance as determined by
the Tautog Technical Committee; however the TC has not defined this and as such there are no fishery independent
monitoring requirements

Review of the ASMFC Tautog FMP and State Compliance: 2015 and 2016 Fishing Years 7
Massachusetts Fishery-independent:
Directed sampling of pots and rod and reel for age and growth parameters
Spring and fall coast-wide resource assessment trawl surveys
Saltonstall-Kennedy grant through NOAA Fisheries to evaluate the efficacy of a rod and reel survey for tautog; pilot study began in 2016 and will evaluate a rod and reel survey’s ability to address limitations in generating reliable indices of abundance from our trawl survey
Tautog samples also obtained in ventless trap survey that is used primarily to assess lobster
Fishery-dependent:
Commercial landings data are collected at the trip level from harvesters and primary buyers
Market sampling for length data
Rhode Island Fishery-independent:
Narragansett Bay monthly trawl survey
Narragansett Bay beach seine survey
RI coastal ponds beach seine survey Fishery-dependent:
Fall recreational fishery sampling for age and length
Fish Pot Survey collects age data
Commercial landings monitored by the Standard Atlantic Fisheries Information System (SAFIS). Recreational fishery monitored by Marine Recreational Information Program (MRIP) calculation methodology.
Connecticut Fishery-independent:
Tautog abundance monitored since 1984 via Connecticut's Long Island Sound Trawl Survey.
Fishery-dependent:
Mandatory commercial fishery reporting requirements include monthly logbooks of daily fishing activity and sales from fishermen and monthly reports of individual purchase transactions from dealers; reported annually to the ACCSP SAFIS Data Warehouse
Review of the ASMFC Tautog FMP and State Compliance: 2015 and 2016 Fishing Years 8
New York Fishery-independent:
Finfish Trawl Survey: since 1987 (except for 2005 and 2006, when there were no data) uses small-mesh trawls to sample 60 to 80 randomly chosen stations each month from May through October.
Long Island Sound Tautog Study: 35 fish traps were deployed between June 16 and November 1, 2016 between Mattituck Inlet, Mattituck NY, and Rocky Point in East Marion, NY. Traps were placed near submerged rocks where blackfish would be expected to be found. Traps were checked and all fish measured weekly.
Fishery-dependent:
Samples collected from commercial markets and dockside in April, May, July, September, October and November 2016; Age data used to obtain an age-length key.
New Jersey Fishery-independent:
Five near shore (within the 15 fathom isobath boundary) trawl surveys are conducted each year in January/February, April, June, August, and October. All tautog are weighed and measured, and catch per unit effort (CPUE) in number of fish per tow and biomass (kilograms) per tow is calculated each year.
Fishery-dependent:
Ongoing biological data collection since 1993 with emphasis in recent years of encompassing the entire year and seasonality of the fishery while amassing length, weight, sex and age data.
Sampling from the commercial fishery and the party/charter boat sector of the recreational fishery.
o Sampling on the commercial vessels focus on the collection of live length, weight and sex data from fish retained for sale in the live fish market
o Age data from undersize fish donated to onboard New Jersey Atlantic Coastal Cooperative Statistical Program (ACCSP) staff members for biological sampling.
o From the recreational fishery, length, sex and age data are collected strictly from fish retained for harvest
Delaware Fishery-independent:
Delaware Bay and Inland Bay surveys from April through October o Juvenile 16 ft. trawl surveyconducted monthly from April through October o 30 ft. adult finfish abundance trawl conducted from March to December.

Review of the ASMFC Tautog FMP and State Compliance: 2015 and 2016 Fishing Years 9
Fishery-dependent:
Mandatory, fisherman-reported, monthly logbook submissions to the State of Delaware.
100 operculum bones were collected in the spring recreational season and 101 operculum bones were collected in the fall season for constructing age-length keys.
Maryland Fishery-independent:
Maryland Department of Natural Resources (MDNR) Coastal Bays Fishery Investigations (CBFI) Trawl and Beach Seine Survey. CBFI SAV Habitat Survey was conducted in Sinepuxent Bay in 2016
Fishery-dependent:
Sampling for aging structures was conducted by hook and line during two charter boat trips in the spring of 2016.
Virginia Fishery-independent:
None Fishery-dependent:
Biological Sampling Program collects biological data (lengths, weights, otoliths) from Virginia’s commercial and recreational fisheries.
Samples are collected from commercial hook-and-line gear, haul seines, pots and traps, and pound nets.
Virginia’s recreational fishery participates in the MRIP biological sampling program, Virginia Game Fish Tagging Program, and VMRC Marine Sport Fish Collection Project.
VI. Status of Management Measures and Issues Draft Amendment 1 was initiated by the Management Board in May 2015. The amendment updates the 1996 FMP with new fishery management principles and consolidates associated addenda into a single document. The document proposes regional management for tautog to address the overfishing stock status present in some regions. In addition, a commercial harvest tagging program is proposed to address an illegal, unreported and undocumented fishery that has persisted for more than a decade. If approved, Draft Amendment 1 would be the comprehensive management document for tautog management in state waters. The amendment went out for public comment in June and July 2017. The Board will consider final approval of Draft Amendment 1 at the October 2017 meeting.

Review of the ASMFC Tautog FMP and State Compliance: 2015 and 2016 Fishing Years 10
VII. Implementation of FMP Compliance Requirements A. Submission of Compliance Report
All states in the tautog management unit submitted state compliance reports for fishing years 2015 and 2016.
B. De Minimis Status Requests Addendum I established qualifications for de minimis status. A state must prove that its commercial landings in the most recent year for which data are available did not exceed the greater of 10,000 pounds or 1% of the coastwide commercial landings, whichever is greater. States must request de minimis status each year and requests for de minimis status will be reviewed by the PRT as part of the annual FMP review process. A state that is granted de minimis status is still required to implement the 14” minimum size limit for the commercial fishery, the pot and trap degradable fastener provisions, and regulations in the commercial fishery that are consistent with those in the recreational fishery. If granted de minimis status, a state must continue to collect 200 age/length samples as required in Addendum III. De minimis status does not impact a state’s compliance requirements in the recreational fishery. The commercial landings threshold for de minimis status for both 2015 and 2016 is 10,000 pounds. The states of Delaware and Maryland qualify for and have requested continued de minimis status for the commercial sector. The PRT recommends that the Board approve the states of Delaware, Maryland, and North Carolina’s requests.
C. Regulatory Requirements: 14” minimum size limit for recreational and commercial fisheries
(FMP); degradable fasteners on one panel or door in fish pots and traps (FMP); and state-specific management programs to achieve the target F of 0.15 (Addendum VI).
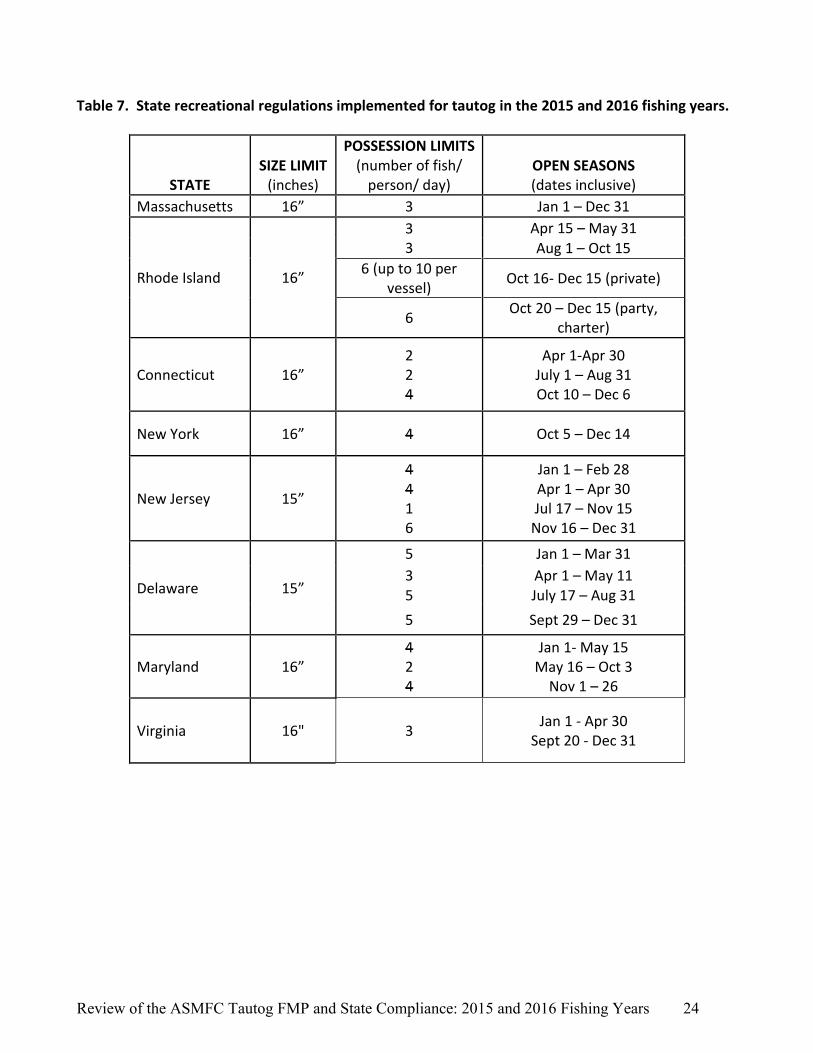
State regulations are summarized in Tables 7 and 8. The PRT finds that each state has met the regulatory requirements and recommends that Board find all states in compliance with the regulatory requirements.
D. Biological Sampling Requirements: commercial and recreational catch estimates; and 200
age/length samples (Addendum III)
Most states collected 200 or more age/length samples in 2015 and 2016 as required by Addendum III (Table 9). Rhode Island fell short with 178 and 158 samples. Sampling is dependent on the donation of tautog racks from the recreational fishery, and sampling on board recreational charter vessels. Staff were unable to obtain 200 samples due to low participation of recreational fishers. Additionally, in 2016 the Fish Pot Survey ended early due to vessel problems and therefore only a limited number of samples were obtained.

Review of the ASMFC Tautog FMP and State Compliance: 2015 and 2016 Fishing Years 11
The PRT finds that all states meet (or tried to meet) the intent of the Addendum III sampling requirements and recommends the Board find all states in compliance with the sampling requirements of the FMP . As some states are unable to meet the 200 age/length sample requirement, the PRT suggests that the required number of samples should be proportional to a state’s harvest up to 200 samples, rather than set at a fixed number. The PRT recommends that the TC be tasked with evaluating the biological sampling needs to support continued regional stock assessments for tautog, and recommending any revisions to the biological sampling requirements.
VIII. Prioritized Research Needs The Technical Committee identified the following research recommendations to improve the stock assessment and our understanding of tautog population and fishery dynamics. Research recommendations are organized by topic and level of priority. Research recommendations that should be completed before the next benchmark assessment are underlined. The Technical Committee will update these recommendations as part of the next benchmark stock assessment. 8.1 Fishery-Dependent Priorities High
Expand biological sampling of the commercial catch for each gear type over the entire range of the stock (including weight, lengths, age, sex, and discards).
Continue collecting operculum from the tautog catch as the standard for biological sampling in addition to collecting paired sub-samples of otoliths and operculum.
Increase catch and discard length sampling from the commercial and recreational fishery for all states from Massachusetts through Virginia.
Increase collection of effort data for determining commercial and recreational CPUE.
Increase MRIP sampling levels to improve recreational catch estimates by state and mode. Current sampling levels are high during times of the year when more abundant and popular species are abundant in catches, but much lower in early spring and late fall when tautog catches are more likely.
8.2 Fishery-Independent Priorities
Review of the ASMFC Tautog FMP and State Compliance: 2015 and 2016 Fishing Years 12
High
Conduct workshop and pilot studies to design a standardized, multi-state fishery independent survey for tautog along the lines of MARMAP and the lobster ventless trap survey.
Establish standardized multi-state long-term fisheries-independent surveys to monitor tautog abundance and length-frequency distributions, and to develop YOY indices.
Enhance collection of age information for smaller fish (<20 cm) to better fill in age-length keys.
8.3 Life History, Biological, and Habitat Priorities Moderate
Define local and regional movement patterns and site fidelity in the southern part of the species range. This information may provide insight into questions of aggregation versus recruitment to artificial reef locations, and to clarify the need for local and regional assessment.
Assemble regional reference collections of paired operculum and otolith samples and schedule regular exchanges to maintain and improve the precision of age readings between states that will be pooled in the regional age-length keys.
Calibrate age readings every year by re-reading a subset of samples from previous years before ageing new samples. States that do not currently assess the precision of their age readings over time should do so by re-ageing a subset of their historical samples.
Low
Evaluate the potential impacts of climate change on tautog range, life history, and productivity.
Conduct a tag retention study to improve return rates, particularly in the northern region.
Define the status (condition and extent) of optimum or suitable juvenile habitats and trends in specific areas important to the species. It is critical to protect these habitats or to stimulate restoration or enhancement, if required.
Define the specific spawning and pre-spawning aggregating areas and wintering areas of juveniles and adults used by all major local populations, as well as the migration routes used by tautog to get to and from spawning and wintering areas and the criteria or times of use. This information is required to protect these areas from damage and overuse or excessive exploitation.

Review of the ASMFC Tautog FMP and State Compliance: 2015 and 2016 Fishing Years 13
Define larval diets and prey availability requirements. This information can be used as determinants of recruitment success and habitat function status. Information can also be used to support aquaculture ventures with this species.
Define the role of prey type and availability in local juvenile/adult population dynamics over the species range. This information can explain differences in local abundance, movements, growth, fecundity, etc. Conduct studies in areas where the availability of primary prey, such as blue mussels or crabs, is dependent on annual recruitment, the effect of prey recruitment variability as a factor in tautog movements (to find better prey fields), mortality (greater predation exposure when leaving shelter to forage open bottom), and relationship between reef prey availability/quality on tautog condition/fecundity.
Define the susceptibility of juveniles to coastal/anthropogenic contamination and resulting effects. This information can explain differences in local abundance, movements, growth, fecundity, and serve to support continued or increased regulation of the inputs of these contaminants and to assess potential damage. Since oil spills seem to be a too frequent coastal impact problem where juvenile tautog live, it may be helpful to conduct specific studies on effects of various fuel oils and typical exposure concentrations, at various seasonal temperatures and salinities. Studies should also be conducted to evaluate the effect of common piling treatment leachates and common antifouling paints on YOY tautog. The synergistic effects of leaked fuel, bilge water, treated pilings, and antifouling paints on tautog health should also be studied.
Define the source of offshore eggs and larvae (in situ or washed out coastal spawning).
Confirm that tautog, like cunner, hibernate in the winter, and in what areas and temperature thresholds, for how long, and if there are special habitat requirements during these times that should be protected or conserved from damage or disturbance. This information will aid in understanding behavior variability and harvest availability.
8.4 Management, Law Enforcement, and Socioeconomic Priorities Moderate
Collect data to assess the magnitude of illegal harvest of tautog and the efficacy of the tagging program.
Low
Collect basic sociocultural data on tautog user groups including demographics, location, and aspects of fishing practices such as seasonality.
Review of the ASMFC Tautog FMP and State Compliance: 2015 and 2016 Fishing Years 14
Figures & Tables Figure 1. Spawning Stock Biomass targets and thresholds for MARI region.
Source: 2016 ASMFC Tautog Stock Assessment Update.
Figure 2. Spawning Stock Biomass targets and thresholds for LIS region.
Source: 2016 ASMFC Tautog Stock Assessment Update.

Review of the ASMFC Tautog FMP and State Compliance: 2015 and 2016 Fishing Years 15
Figure 3. Spawning Stock Biomass targets and thresholds for NJ-NYB region. Source: 2016 ASMFC Tautog Stock Assessment Update.
Figure 4. Spawning Stock Biomass targets and thresholds for DMV region.
Source: 2016 ASMFC Tautog Stock Assessment Update.
Review of the ASMFC Tautog FMP and State Compliance: 2015 and 2016 Fishing Years 16
Figure 5. Recreational tautog harvest in 2015 and 2016 by wave.
Figure 6. Total tautog harvest (recreational A+B1 and commercial, excluding discard). Source: NMFS, MRIP.

Review of the ASMFC Tautog FMP and State Compliance: 2015 and 2016 Fishing Years 17
Figure 7. Changes in tautog commercial landings (lbs) and value ($/lb) over time. Source: NMFS. Values unadjusted for inflation.

Review of the ASMFC Tautog FMP and State Compliance: 2015 and 2016 Fishing Years 18
Table 1. Current fishing mortality and biomass targets and thresholds for each region. Source: 2016 Tautog Assessment Update (ASMFC).
Region Ftarget Fthreshold F3yravg SSBtarget SSBthreshold SSB2015 MSY or
SPR Status
MARI 0.28 0.49 0.23 3,631 mt 2,723 mt 2,196 mt SPR Not overfished, overfishing not occurring
LIS 0.28 0.49 0.51 2,865 mt 2,148 mt 1,603 mt MSY Overfished, overfishing
NJ-NYB 0.20 0.34 0.54 3,154 mt 2,351 mt 1,809 mt MSY Overfished, overfishing
DMV 0.16 0.24 0.16 1,919 mt 1,447 mt 621 mt SPR Overfished, overfishing not occurring
Review of the ASMFC Tautog FMP and State Compliance: 2015 and 2016 Fishing Years 19
Table 2. Tautog recreational and commercial landings from 1981 – 2016, in pounds. Source: State Compliance Reports, NMFS, and ACCSP Data Warehouse.
Year Commercial
Landings (lbs) Recreational Harvest,
A + B1 (lbs) Total Harvest
(lbs) %Recreational
1981 332,000 4,115,046 4,447,561 92.5
1982 419,656 8,337,959 8,757,614 95.2
1983 427,919 5,749,537 6,178,736 93.1
1984 677,615 5,381,193 6,058,808 88.8
1985 734,370 4,305,086 5,039,457 85.4
1986 941,012 16,906,397 17,847,409 94.7
1987 1,157,280 8,888,783 10,046,062 88.5
1988 1,071,017 9,301,700 10,372,717 89.7
1989 1,016,631 6,377,750 7,395,958 86.2
1990 873,510 5,156,175 6,029,685 85.5
1991 1,110,344 8,101,442 9,215,355 87.9
1992 1,012,176 7,671,225 8,683,401 88.3
1993 698,493 5,927,020 6,625,513 89.5
1994 459,529 3,468,112 3,927,641 88.3
1995 375,567 4,567,374 4,942,941 92.4
1996 357,434 3,184,899 3,542,335 90.0
1997 280,912 2,204,039 2,484,951 88.7
1998 254,186 1,479,761 1,733,948 85.3
1999 208,825 2,532,689 2,741,515 92.4
2000 247,456 3,398,349 3,645,804 93.2
2001 305,487 2,749,700 3,055,188 90.0
2002 351,451 5,431,146 5,782,596 93.9
2003 342,651 2,357,940 2,700,591 87.4
2004 299,602 2,959,167 3,250,218 91.2
2005 292,194 2,379,790 2,665,337 90.2
2006 349,602 3,923,886 4,312,596 91.0
2007 340,898 5,009,022 5,309,156 94.4
2008 310,896 3,589,421 3,909,229 91.9
2009 242,723 3,408,159 3,576,790 95.3
2010 286,724 3,885,106 4,192,231 93.7
2011 262,226 1,503,075 1,754,723 85.8
2012 213,854 2,248,763 2,419,740 91.3
2013 259,744* 2,158,564 2,408,672 89.3
2014 279,541** 4,608,252 4,878,458 94.5
2015 245,168 2,043,033 2,285,615 89.4
2016 268,425*** 2,704,453 2,968,569 91.1
* 2013 commercial landings do not include data from Maryland, which was confidential. **2014 commercial landings did not include Connecticut, which was confidential ***2016 commercial landings did not include Maryland, which was confidential
Review of the ASMFC Tautog FMP and State Compliance: 2015 and 2016 Fishing Years 20
Table 3. Tautog landings by sector for 2015 and 2016: percent recreational (A + B1) and commercial based on weight.
2015 2016
State Commercial Landings (%)
Recreational (A+B1) (%)
Commercial Landings (%)
Recreational (A+B1) (%)
MA 25.4 74.6 44.5 55.5
RI 11.1 88.9 13.0 87.0
CT 1.4 98.6 1.1 98.9
NY 23.1 76.9 10.4 89.6
NJ 3.3 96.7 3.1 96.9
DE 7.6 92.4 2.0 98.0
MD 8.5 91.5 confidential confidential
VA 12.0 88.0 10.3 89.7
NC 3.4 96.6 1.0 99.0
Coastwide 11.1 88.9 9.0 91.0
Review of the ASMFC Tautog FMP and State Compliance: 2015 and 2016 Fishing Years 21
Table 4. Recreational harvest (A+B1) and discards for tautog in number of fish, 1981-2016 (MRIP).
Year MA RI CT NY NJ DE MD VA NC Coastwide
Total
Coastwide Live Discards
(B2)
1981 228,736 233,508 100,308 721,062 132,271 3,457 4,670 236,768 3,072 1,663,852 386,614
1982 1,051,022 214,938 231,187 646,693 583,550 137,328 35,105 71,599 15,062 2,986,485 292,888
1983 670,508 245,796 200,676 612,163 344,580 4,350 2,126 579,795 36,549 2,696,543 676,332
1984 258,256 490,128 287,470 286,077 516,086 28,388 42,835 207,192 NA 2,116,431 647,963
1985 100,941 115,404 182,318 1,105,234 840,627 62,001 486 91,957 8,252 2,507,218 718,180
1986 1,980,719 671,592 333,396 1,183,114 2,369,852 141,290 5,476 322,905 12,660 7,021,003 1,103,147
1987 617,068 130,729 312,430 929,887 1,015,123 99,706 90,523 126,783 3,698 3,325,949 1,405,775
1988 621,679 207,799 234,198 828,183 564,286 94,491 107,570 368,320 4,462 3,030,988 1,244,947
1989 250,077 116,506 303,782 562,549 710,958 249,928 34,709 284,477 11,354 2,524,340 1,068,626
1990 233,444 153,433 75,871 953,622 841,770 61,526 45,467 111,998 3,428 2,480,562 1,237,775
1991 176,905 291,946 191,137 871,221 1,067,283 128,985 26,770 168,068 6,804 2,929,119 2,260,230
1992 357,949 193,786 319,221 413,236 1,018,205 68,769 106,255 100,952 5,249 2,583,621 1,607,758
1993 216,553 118,775 180,055 505,632 773,213 82,475 60,231 300,484 4,785 2,242,204 1,971,467
1994 78,483 82,304 150,109 196,937 208,003 65,837 157,260 231,740 2,271 1,172,942 1,480,320
1995 72,461 54,570 120,259 118,006 707,963 300,303 43,542 222,186 3,178 1,642,466 2,103,564
1996 79,798 55,528 72,558 82,826 470,431 57,751 9,695 224,447 6,605 1,059,640 1,158,157
1997 39,075 70,628 32,200 92,907 196,724 65,133 85,682 106,678 11,432 700,457 1,090,444
1998 25,034 56,084 66,797 68,887 11,667 62,584 6,512 50,923 9,487 357,975 1,398,973
1999 91,476 52,136 15,701 196,564 165,505 95,309 20,180 42,880 8,437 688,187 2,286,716
2000 87,552 38,687 10,648 79,245 462,371 113,686 20,129 34,725 5,555 852,596 1,731,884
2001 115,658 39,993 16,579 45,913 467,728 50,541 23,715 28,985 2,418 791,532 2,033,955
2002 102,662 62,423 100,240 629,772 347,831 185,684 42,038 25,987 4,514 1,501,153 3,177,322
2003 46,808 120,061 167,875 128,729 102,593 63,181 13,555 76,236 12,185 731,221 1,679,385
2004 21,816 124,419 16,464 278,749 90,214 70,608 8,690 150,703 9,137 770,799 1,739,740
2005 72,038 160,524 35,699 84,280 43,055 60,831 28,129 60,484 13,603 558,646 1,456,161
2006 79,639 81,611 200,708 246,882 200,725 111,028 14,894 105,137 1,234 1,041,857 2,648,386
2007 91,304 125,233 352,819 223,798 300,179 99,605 43,308 60,992 15,181 1,312,419 3,629,353
2008 34,237 103,760 167,179 318,899 172,518 101,735 19,128 56,384 689 974,528 2,495,079
2009 24,879 85,416 85,915 346,276 127,403 119,941 37,963 60,470 2,895 891,160 2,309,449
2010 45,743 197,062 116,058 145,663 374,599 56,505 57,338 127,221 3,720 1,123,910 2,878,417
2011 32,828 19,304 25,823 111,406 136,674 45,483 11,853 46,441 981 430,792 1,923,086
2012 24,796 104,425 194,101 61,508 37,611 46,570 5,356 13,920 9,936 498,222 2,021,177
2013 57,736 136,190 104,451 76,797 111,377 38,368 3,851 5,976 5,963 540,706 2,185,251
2014 100,297 68,768 318,201 300,399 169,879 50,467 494 25,917 3,997 1,038,419 4,066,058
2015 39,860 98,404 125,819 99,119 157,008 7,483 2,988 11,540 2,014 544,235 2,579,952
2016 24,243 86,528 165,315 270,944 83,466 30,032 1,870 17,127 1,517 681,042 4,105,503

Review of the ASMFC Tautog FMP and State Compliance: 2015 and 2016 Fishing Years 22
Table 5. Recreational harvest (A + B1) for tautog in pounds, by state, 1981-2016. Source: MRFSS/MRIP, State Compliance Reports.
Year MA RI CT NY NJ DE MD VA NC 1981 790,610 664,568 242,337 1,496,039 161,423 6,584 10,296 742,653 536 1982 3,226,868 777,930 610,608 1,674,949 1,241,155 428,036 90,645 271,919 15,849 1983 1,837,262 615,595 458,582 1,124,844 414,957 4,437 6,551 1,267,165 20,144 1984 733,876 1,809,822 733,710 541,805 717,261 95,740 79,110 669,869 NA 1985 328,041 277,384 471,185 2,034,903 741,656 144,859 1,107 298,797 7,154 1986 7,862,584 2,042,584 838,346 2,833,208 2,132,571 264,744 10,049 918,138 4,173 1987 1,751,372 507,424 1,106,606 2,288,076 2,130,955 387,075 266,094 442,751 8,430 1988 2,255,930 612,123 610,171 2,380,285 1,331,833 249,803 446,947 1,410,003 4,605 1989 1,076,366 296,889 1,038,217 1,018,015 1,289,185 743,339 78,391 806,336 31,012 1990 895,327 389,579 200,000 1,980,289 1,256,488 142,627 59,720 229,442 2,703 1991 798,889 1,007,549 648,634 2,352,646 2,189,144 354,498 106,223 619,214 24,645 1992 1,668,485 656,712 1,048,639 1,199,558 2,485,693 183,854 159,730 255,995 12,559 1993 752,598 389,733 531,023 1,800,794 1,361,612 217,881 105,231 758,410 9,738 1994 373,189 328,668 417,438 585,037 330,551 152,033 177,358 1,101,130 2,708 1995 309,224 237,093 402,616 369,643 1,722,713 793,339 115,993 613,348 3,405 1996 397,284 248,840 245,816 193,045 1,123,174 158,751 26,483 778,315 13,191 1997 166,042 301,109 84,297 331,529 483,639 204,419 182,995 391,258 58,751 1998 96,695 316,339 231,622 208,743 41,431 257,348 27,648 273,515 26,420 1999 363,471 223,763 61,142 761,446 511,673 358,328 37,677 203,249 11,940 2000 442,816 203,602 58,475 258,100 1,812,960 373,581 56,126 188,187 4,502 2001 502,247 165,380 63,157 171,927 1,482,613 159,961 72,357 127,555 4,503 2002 521,611 265,116 447,140 2,135,221 1,184,560 652,007 104,246 116,797 4,448 2003 221,843 479,345 603,861 315,384 164,327 200,618 43,212 308,838 20,512 2004 104,513 682,329 77,219 965,837 276,724 243,467 21,633 553,866 33,579 2005 376,624 815,377 148,564 310,961 145,311 221,132 89,237 242,590 29,994 2006 296,636 380,140 842,213 782,424 734,509 406,336 47,463 430,157 4,008 2007 349,950 635,094 1,383,278 823,475 1,065,237 301,005 144,111 246,827 60,045 2008 106,871 491,403 715,317 1,094,903 518,813 365,619 62,710 232,557 1,228 2009 70,806 322,955 305,077 1,478,263 414,249 400,120 130,369 268,314 18,006 2010 163,057 918,693 409,370 508,487 1,044,598 151,793 201,769 477,734 9,605 2011 129,669 80,300 88,728 450,171 381,449 152,899 33,859 184,445 1,555 2012 94,699 534,716 982,891 252,745 133,048 171,329 17,670 49,988 11,677 2013 197,775 629,896 389,918 355,232 395,539 138,051 18,681 23,836 9,636
2014 399,812 297,955 1,643,470 1,365,338 579,934 187,915 3,004 121,352 9,472
2015 181,119 376,395 512,650 373,240 508,685 25,580 11,897 50,787 2,680
2016 72,342 338,501 705,146 1,162,729 262,665 100,253 7,708 52,236 2,873
Review of the ASMFC Tautog FMP and State Compliance: 2015 and 2016 Fishing Years 23
Table 6. Commercial landings for tautog in pounds, by state, 1981-2016. Source: personal communication from the National Marine Fisheries Service, Fisheries Statistics Division, Silver Spring, MD (commercial 1981 – 2009) and ACCSP Data Warehouse (2010). States are sorted from north to south.
Year MA RI CT NY NJ DE MD VA NC
1981 102,900 69,800 20,500 81,400 54,400 1,000 1,200 700 na
1982 69,300 86,300 21,200 90,400 148,200 800 100 2,600 656
1983 57,600 142,600 33,500 88,400 100,600 800 na 1,700 319
1984 68,100 334,700 32,700 102,500 129,700 1,400 2,600 1,200 4,715
1985 63,300 403,200 50,100 84,500 125,500 3,200 2,400 1,639 531
1986 165,800 363,100 104,200 201,300 100,700 300 2,600 1,800 1,006
1987 250,000 420,500 159,200 225,200 95,200 500 3,800 2,700 80
1988 277,100 328,900 112,100 255,000 88,000 600 6,100 2,800 214
1989 352,100 214,800 99,700 285,400 51,900 500 4,000 7,500 531
1990 289,074 211,084 82,008 181,543 99,112 500 3,954 5,151 1,079
1991 354,346 371,597 54,000 226,413 93,022 1,300 3,164 5,058 1,211
1992 292,291 359,767 65,700 169,011 116,332 200 4,058 4,389 424
1993 160,336 201,593 86,064 89,467 153,474 300 1,432 5,423 351
1994 37,062 130,719 43,000 71,375 162,641 400 1,718 11,441 1,134
1995 35,298 94,989 20,466 72,879 115,970 600 4,416 30,020 929
1996 32,579 64,817 33,327 105,466 89,435 1,599 3,622 26,137 452
1997 64,240 39,601 14,519 78,228 49,726 841 7,663 25,471 623
1998 91,319 20,304 6,905 68,892 42,426 1,715 5,682 14,770 2,173
1999 75,619 26,090 12,961 37,886 27,307 844 6,489 20,901 728
2000 96,001 43,719 8,504 39,953 39,636 272 3,896 14,794 674
2001 84,330 56,065 22,259 62,795 60,152 287 4,591 14,587 414
2002 148,073 50,007 26,781 60,805 36,605 629 5,010 22,834 705
2003 86,205 56,749 40,784 72,264 66,766 3,816 5,213 10,705 98
2004 88,192 36,581 26,037 76,606 49,910 3,064 6,049 13,079 84
2005 99,344 42,838 24,053 52,525 61,163 2,210 4,338 5,667 56
2006 147,609 46,629 16,841 68,432 55,532 433 5,411 8,533 47
2007 95,820 63,428 30,002 73,787 62,979 2,814 3,293 8,588 187
2008 73,867 48,024 20,160 88,552 63,958 2,253 2,942 10,946 194
2009 54,703 50,896 20,298 87,289 14,591 2,116 1,638 11,132 61
2010 75,317 44,054 16,484 92,487 49,213 1,770 1,285 6,081 34
2011 57,787 47,427 14,205 82,534 42,125 2,192 1,333 14,590 28
2012 67,870 50,127 5,638 69,786 4,112 1,444 1,040 49,983 227
2013 69,686 53,433 5,886 110,680 7,662 415 confid 11,776 206
2014 63,191 53,384 confid 121,538 31,665 1,071 1,147 7,545 137
2015 61,752 47,137 7,250 111,925 17,219 2,107 1,103 6,937 94
2016 58,095 50,686 7,558 135,487 8,486 2,083 confid 5,884 30
Review of the ASMFC Tautog FMP and State Compliance: 2015 and 2016 Fishing Years 24
Table 7. State recreational regulations implemented for tautog in the 2015 and 2016 fishing years.
STATE SIZE LIMIT
(inches)
POSSESSION LIMITS (number of fish/
person/ day) OPEN SEASONS (dates inclusive)
Massachusetts 16” 3 Jan 1 – Dec 31
Rhode Island 16”
3 3
Apr 15 – May 31 Aug 1 – Oct 15
6 (up to 10 per vessel)
Oct 16- Dec 15 (private)
6 Oct 20 – Dec 15 (party,
charter)
Connecticut 16” 2 2 4
Apr 1-Apr 30 July 1 – Aug 31 Oct 10 – Dec 6
New York 16” 4 Oct 5 – Dec 14
New Jersey 15”
4 4 1 6
Jan 1 – Feb 28 Apr 1 – Apr 30 Jul 17 – Nov 15
Nov 16 – Dec 31
Delaware 15”
5 Jan 1 – Mar 31
3 Apr 1 – May 11 5 July 17 – Aug 31
5 Sept 29 – Dec 31
Maryland 16” 4 2 4
Jan 1- May 15 May 16 – Oct 3
Nov 1 – 26
Virginia 16" 3 Jan 1 - Apr 30
Sept 20 - Dec 31

Review of the ASMFC Tautog FMP and State Compliance: 2015 and 2016 Fishing Years 25
Table 8. State commercial regulations implemented for tautog in the 2015 and 2016 fishing years.
STATE SIZE
LIMIT
POSSESSION LIMITS (number
of fish) OPEN SEASONS QUOTA
(pounds) GEAR
RESTRICTIONS
Massachusetts 16”
40
April 16-28% Quota Sept 1-100% of
Quota*
54,984, 57,985
Mandatory pot requirements.
Limited entry and area/time closures
for specific gear types.
Rhode Island 16” 10 Apr 15 - May 31 Aug 1 - Sept 15 Oct 15 - Dec 31
51,348** Harvest allowed by
permitted gear types only.
Connecticut 16” 4 (restricted
licenses) 10 (all other)
Apr 1- Apr 30 Jul 1 - Aug 31 Oct 8 - Dec 24
- Mandatory pot requirements.
New York 15”
25 (10 fish w/ lobster gear and when 6
lobsters are in possession)
Jan 1 - Feb 28 Apr 8 –Dec 31
-
Mandatory pot requirements. Gill or
trammel net is prohibited.
New Jersey 15” > 100 lbs requires
directed fishery permit
Jan 1 - 15 June 11 - 30
Nov 9 - Dec 31 103,000
Mandatory pot requirements.
Delaware 15”
5 3 5 5
Jan 1 - Mar 31 Apr 1 - May 11 July 17 - Aug 31 Sept 29 - Dec 31
- Mandatory pot requirements.
Maryland 16”
4 Jan 1- May 15 May 16 - Oct 31
Nov 1 - 26 -
Mandatory pot requirements.
2
4
Virginia 15” - Jan 1 – Jan 21
Mar 1 – Apr 30 Nov 1 – Dec 31
-
Mandatory pot requirements. Pots prohibited in tidal
waters. * Massachusetts’ spring open season closes when the Director projects that 28% of the quota is taken, and fall season
closes when the Director projects 100% of the quota is taken. ** Rhode Island’s quota of 51,438 lbs is divided equally among the three sub-periods.
Review of the ASMFC Tautog FMP and State Compliance: 2015 and 2016 Fishing Years 26
Table 9. Number of age/length samples by state in 2015 and 2016. Addendum III requires all states to collect 200 samples per year. Source: State compliance reports
State 2015 Samples 2016 Samples Sample Sources
MA 553 779 Fishery independent pot, rod and reel, and trawl surveys,
ventless trap survey for Lobster
RI 178 158 Recreational fishery sampling, RIDFW Fish Pot Survey
CT 318 276 Long Island Sound Trawl Survey
NY 256 232 Commercial markets and dockside sampling
NJ 425 621 Recreational fishery, commercial sampling and NJ Bureau of
Marine Fisheries Ocean Trawl Survey
DE 200 201 Recreational sampling
MD 200 200 Coastal Bays Fishery Investigations Trawl and Beach Seine Survey
VA 491 221 Commercial sampling and Marine Sport Fish Collection Project