1986 microgravity crystallization of …...december 1986 ~- ~~~ ~~ ~ microgravity crystallization of...
TRANSCRIPT
December 1986
~- ~~~ ~~
~
Microgravity Crystallization of Macromolecules: An Interirn Report and Proposal for Continued Research
~
1 Benjamin E. Go1dbcr-T c ~
I
https://ntrs.nasa.gov/search.jsp?R=19870010990 2020-06-06T21:22:16+00:00Z

~~~~
NASA Technica I Paper 2671
1986
National Aeronautics
Scientific and Technical Information Branch
and Space Administrz!lon
Microgravity Crystallization of Macromolecules: An Interim Report and Proposal for Continued Research
Benjamin E. Goldberg George C. Marshall Space Flight Center Marshall Space Flight Center, Alabama
AC KNOW L E DGM ENTS
The author would like to acknowledge the clerical and technical support of co-investigator Dr. R. Clinton and Mr. B. Shurney from MSFC. Without their technical expertise this investigation could not have been performed. Further, the author would like to thank Ms. D. Deboar, from Northwestern University, for performing the X-ray and FTIR experiments. Finally, the modification work of Vashow Scientific Company that allowed use of the microscope under microgravity conditions must be cited.
The funding for this research was provided by the Marshall Space Flight Center Director's Discretionary Fund.
iii

TABLE OF CONTENTS
Page
I. INTRODUCTION/BACKGROUND . . . . . . . . . . . . . . . . . . . . . . . . . . . . . . . . . . . . . . . . . . . .
General . . . . . . . . . . . . . . . . . . . . . . . . . . . . . . . . . . . . . . . . . . . . . . . . . . . . . . . . . . . . . . . . . . Convection . . . . . . . . . . . . . . . . . . . . . . . . . . . . . . . . . . . . . . . . . . . . . . . . . . . . . . . . . . . . . . .
11. COMPLETED STUDIES.. . . . . . . . . . . . . . . . . . . . . . . . . . . . . . . . . . . . . . . . . . . . . . . . . . . .
Background . . . . . . . . . . . . . . . . . . . . . . . . . . . . . . . . . . . . . . . . . . . . . . . . . . . . . . . . . . . . . . . Experimental . . . . . . . . . . . . . . . . . . . . . . . . . . . . . . . . . . . . . . . . . . . . . . . . . . . . . . . . . . . . . . Results . . . . . . . . . . . . . . . . . . . . . . . . . . . . . . . . . . . . . . . . . . . . . . . . . . . . . . . . . . . . . . . . . . Discussion . . . . . . . . . . . . . . . . . . . . . . . . . . . . . . . . . . . . . . . . . . . . . . . . . . . . . . . . . . . . . . . .
REFERENCES . . . . . . . . . . . . . . . . . . . . . . . . . . . . . . . . . . . . . . . . . . . . . . . . . . . . . . . . . . . . . . . . . . .
APPENDIX . . . . . . . . . . . . . . . . . . . . . . . . . . . . . . . . . . . . . . . . . . . . . . . . . . . . . . . . . . . . . . . . . . . . . .
I
V
1
1 2
3
9
11

LIST OF ILLUSTRATIONS
Figure
1.
2.
3.
4.
5.
6.
7.
8.
9.
10.
11.
12.
13 1
I 13 1
14
14
. . . . . . . . . . . . . . . . . . . . . . . . . . . . . . . . Marangoni versus buoyancy driven convection.
Microgravity float zone apparatus . . . . . . . . . . . . . . . . . . . . . . . . . . . . . . . . . . . . . . . . . .
Sample configuration . . . . . . . . . . . . . . . . . . . . . . . . . . . . . . . . . . . . . . . . . . . . . . . . . . . .
Differential scanning calorimetry traces. . . . . . . . . . . . . . . . . . . . . . . . . . . . . . . . . . . . . .
Flight cart configuration for microgravity crystallization/nucleation studies. . . . . . . . . .
15 Idealized strip chart record of KC- 135 flight experiment . . . . . . . . . . . . . . . . . . . . . . . .
16 i X-ray traces . . . . . . . . . . . . . . . . . . . . . . . . . . . . . . . . . . . . . . . . . . . . . . . . . . . . . . . . . . . .
16 Representative light scattering images . . . . . . . . . . . . . . . . . . . . . . . . . . . . . . . . . . . . . . . Morphology traces 17
18
. . . . . . . . . . . . . . . . . . . . . . . . . . . . . . . . . . . . . . . . . . . . . . . . . . . . . .
Photographic montage of an entire sample . . . . . . . . . . . . . . . . . . . . . . . . . . . . . . . . . . .
19 High gravity scenario . . . . . . . . . . . . . . . . . . . . . . . . . . . . . . . . . . . . . . . . . . . . . . . . . . . .
19 Microgravity scenario . . . . . . . . . . . . . . . . . . . . . . . . . . . . . . . . . . . . . . . . . . . . . . . . . . . .
Vi
I LIST OF TABLES
1 1 Table Title
I 1. Birefringence . . . . . . . . . . . . . . . . . . . . . . . . . . . . . . . . . . . . . . . . . . . . . . . . . . . . . . . . . . . . . I
. . . . . . . . . . . . . . . . . . . . . . . . . . . . . . . . . . . . . . . . . . . . . . . . . . . . . . . . . . I 2. Light Scattering
3. Optical Microscopy . . . . . . . . . . . . . . . . . . . . . . . . . . . . . . . . . . . . . . . . . . . . . . . . . . . . . . . . i I
. . . . . . . . . . . . . . . . . . . . . . . . . . . . . . . . . . . I 4. Marangoni Number Variation with Gravity. , I
Page
5
6
7
8
v i i

TECHNICAL PAPER
1
M I CROG R AVI T Y C R Y STA L L I ZAT ION 0 F MAC ROMOL ECU L ES : AN I N TE R I M R EPORT AND PROPOSAL FOR CONTINUED RESEARCH
I. INTRODUCTION/BACKGROUND
General
While major resources have been applied and research efforts conducted to exploit crystalline metallic and ceramic materials’ advantageous microgravity processing capabilities, little effort has been made for organic, macromolecular or biochemical materials [ 1-31. The crystalline polymer systems are not, in general, as dimensionally uniform as non-macromolecular crystals; as such they attenuate trans- mission of both acoustic and electromagnetic waves to a higher, less desirable degree. As the theoretical capability for molecular engineering of polymer systems is far superior to that of other materials, a need clearly exists for investigation and determination of processing methods designed to promote forma- tion of more ordered crystals.
As solidification from the melt is affected by convective motion, understanding and control of the forces acting on the melt is necessary before improved fabrication techniques can properly be designed [4]. This can be accomplished either by reduction of convection or transformation to a mode in which it is easily controlled. Reduction of buoyancy-driven convection using a low gravity environment may permit production of larger and more nearly perfect crystals, The determination of the viability of a low gravity environment as a preferred processing condition is the goal of this proposed research.
The crystallization process may be divided into two major subprocesses: nucleation and growth. Use of a microgravity environment will permit “containerless” processing that, clearly, will reduce impurity driven heterogeneous nucleation. Far less clear are the effects of gravity reduction on the con- vective fields in a non-Newtonian liquid, and the subsequent growth of crystals in this type of melt.
The growth process of the macromolecular crystals will be separated from nucleation effects throughout the majority of the recommended research through use of directional solidification tech- niques. This report details studies dealing qualitatively with the reduction of impurity induced nuclea- tion. With the reduction/elimination of this kinetically controlled process, the effects of gravity on growth may be singled out and quantified, both in-vitro and post-process.
Prior studies by Lovinger and Gryte have centered on attempts to remove random spherulitic structure in favor of unidirectional solidification [ 5-8 1. They processed poly(ethy1ene oxide) and poly- (propylene) in temperature gradient stage furnaces, minimizing nucleation by translating the sample at speeds 2 3pm/min. Thin capillaries have been used by Price and Kilb (PeO) [9] , Fujiwara (PP) [ 101, and Crissman (PE,PP) [ 1 1 ] to minimize nucleation, Stein, et al. unidirectionally crystallized thin films of poly(butene-1) in a thermal gradient [ 121.
While their research has proven that nucieation is minimized through these processing techniques, little has been determined concerning the effect of thermal gradients and convection on morphology at the growth interface, Lovinger’s models do not address these concerns at all. Further, proof of expected nucleation reduction through use of microgravity processing has yet to be demonstrated for polymer systems. The recommended research will center upon characterization of the thermal gradients, both with and without convective forces. These parameters will then be introduced into crystallization models. A thermal gradient stage will be designed and fabricated for this investigation.
Convection
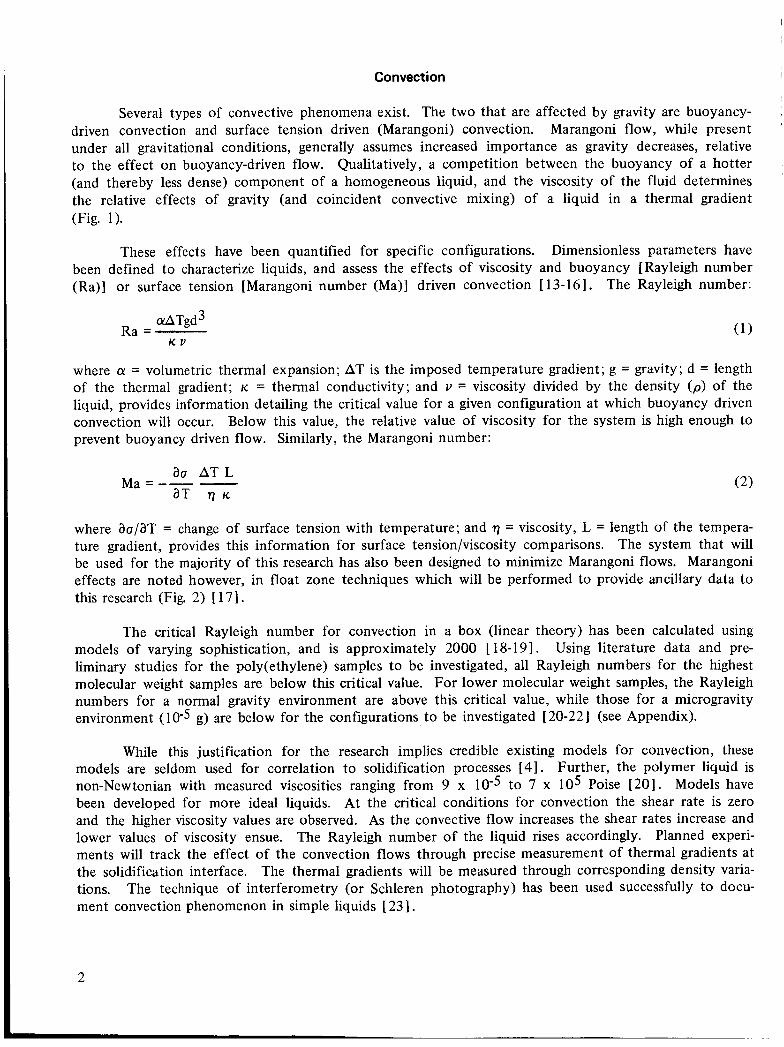
Several types of convective phenomena exist. The two that are affected by gravity are buoyancy- driven convection and surface tension driven (Marangoni) convection. Marangoni flow, while present under all gravitational conditions, generally assumes increased importance as gravity decreases, relative to the effect on buoyancy-driven flow. Qualitatively, a competition between the buoyancy of a hotter (and thereby less dense) component of a homogeneous liquid, and the viscosity of the fluid determines the relative effects of gravity (and coincident convective mixing) of a liquid in a thermal gradient (Fig. 1).
These effects have been quantified for specific configurations. Dimensionless parameters have been defined to characterize liquids, and assess the effects of viscosity and buoyancy [Rayleigh number (Ra)] or surface tension [Marangoni number (Ma)] driven convection [ 13-16]. The Rayleigh number:
a!ATgd3 Ra =
K V
where a = volumetric thermal expansion; AT is the imposed temperature gradient; g = gravity; d = length of the thermal gradient; K = thermal conductivity; and v = viscosity divided by the density ( p ) of the liquid, provides information detailing the critical value for a given configuration at which buoyancy driven convection will occur. Below this value, the relative value of viscosity for the system is high enough to prevent buoyancy driven flow. Similarly, the Marangoni number:
where ao/aT = change of surface tension with temperature; and q = viscosity, L = length of the tempera- ture gradient, provides this information for surface tension/viscosity comparisons. The system that will be used for the majority of this research has also been designed to minimize Marangoni flows. Marangoni effects are noted however, in float zone techniques which will be performed to provide ancillary data to this research (Fig. 2) [ 171.
The critical Rayleigh number for convection in a box (linear theory) has been calculated using models of varying sophistication, and is approximately 2000 [ 18-19]. Using literature data and pre- liminary studies for the poly(ethy1ene) samples to be investigated, all Rayleigh numbers for the highest molecular weight samples are below this critical value. For lower molecular weight samples, the Rayleigh numbers for a normal gravity environment are above this critical value, while those for a microgravity environment (10-5 g) are below for the configurations to be investigated [20-221 (see Appendix).
While this justification for the research implies credible existing models for convection, these models are seldom used for correlation to solidification processes [4 ] . Further, the polymer liquid is non-Newtonian with measured viscosities ranging from 9 x 10⁻⁵ to 7 x lo5 Poise [20]. Models have been developed for more ideal liquids. At the critical conditions for convection the shear rate is zero and the higher viscosity values are observed. As the convective flow increases the shear rates increase and lower values of viscosity ensue. Planned experi- ments will track the effect of the convection flows through precise measurement of thermal gradients at the solidification interface. The thermal gradients will be measured through corresponding density varia- tions. The technique of interferometry (or Schleren photography) has been used successfully to docu- ment convection phenomenon in simple liquids [ 231.
The Rayleigh number of the liquid rises accordingly.
2
The system is further complicated by the shear forces present at the solidification front. The proposed experimental system has been designed to allow translation of the macromolecules, thereby keeping the zone stationary and allowing continuous optical monitoring of the solidification front. This experimental information is necessary for proper modeling and understanding of the non-ideal process of polymer crystallization.
11. COMPLETED STUDIES
Background
Completed studies were centered upon qualitative determination of gravitational effects upon melt- solidified thin films of linear polyethylene. These data encompass, qualitatively and semi-quantitatively, the reduction of heterogeneous nucleation with reduced gravitational forces. Further, characterization data for linear polyethylene has been obtained, allowing calculation of Rayleigh and Marangoni numbers, necessary to assess the feasibility of observing microgravity effects. Finally, a preliminary design for the major experimental apparatus has been prepared, and fabrication is scheduled. Related research, centered upon zone refining of macromolecular systems in reduced gravity environments is also proceeding.
Experimental
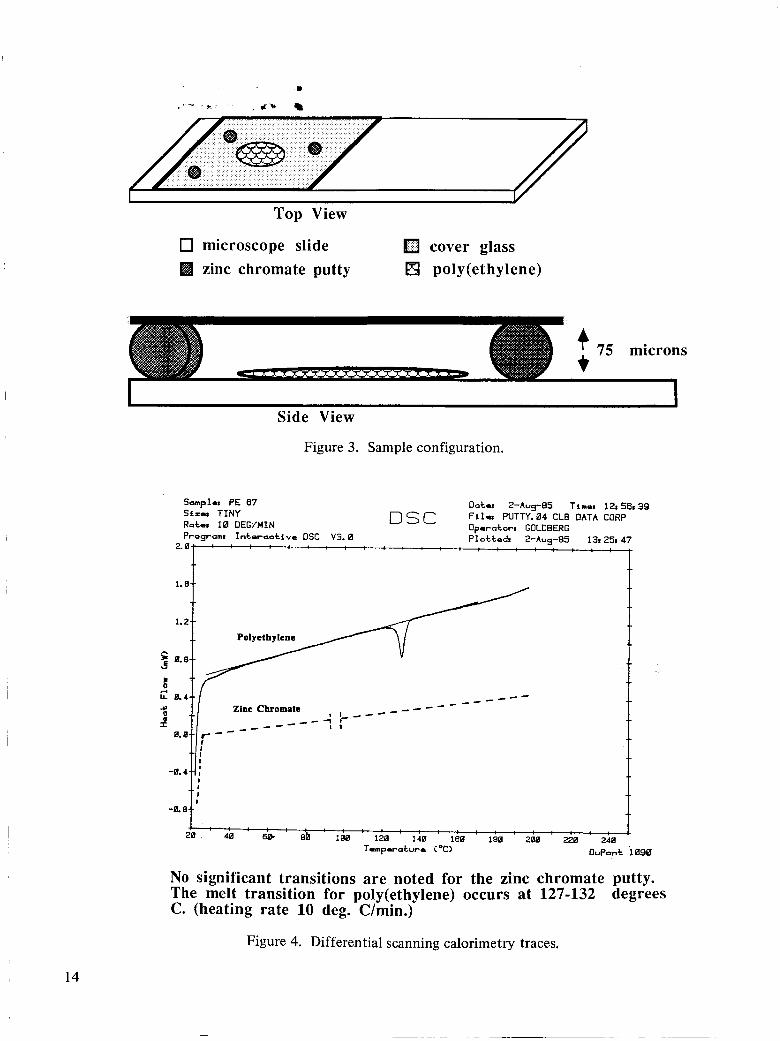
Linear polyethylene (M.W. = 48,000, Mw/Mn = 1) was sectioned into 9 micron thick films using a liquid nitrogen cooled microtome. The samples (pellets) were cut from as-cast pellets of unknown thermal history. The samples were affixed to clean microscope slides. The cleaning procedure involved an initial cleaning with toluene, then acetone, and wiping and drying with dust free laboratory towels. Immediately after cleaning, three zinc chromate dots were placed in equidistant positions on the slide, the sample was centered between the dots and a cover glass (cleaned identically to the slides) was placed, with a 75 k 10 micron spacing, above. The zinc chromate putty acted as a glue to hold the cover glass position and spacing; DSC and TGA testing indicated no decomposition/deterioration in the thermal region of interest (Figs. 3,4).
The cutting temperature was approximately -38'F.
The NASA KC-135 aircraft was employed to provide both high (1.8 to 1.9 g's) and micro (0) gravity environments for melt-solidification studies of the polymer films. An experiment cart was designed and fabricated for this portion of the research. All equipment was fastened to this cart, which was in turn bolted to the floor of the aircraft (Fig. 5). The KC-135 makes parabolic arcs which provide microgravity conditions for up to 28 sec.
The cart was designed to allow optical microscopy of the melt-solidification processes. A Mettler hot stage appratus was used; a video tape camera and recorder were also included. An optical photometer, Leitz microscope, an accelerometer and a chart recorder completed the initial cart. The samples were optically monitored during the melt phase transition; these data were later correlated to thermal and gravitational environments. The samples were then air quenched in various gravitational environments; solidification time was experimentally determined to be 1 5 seconds. All data presented herein are for samples that had a minimum of 20 seconds in a specific gravitational environment during the initial quench period. Finally, the samples were characterized post-flight to determine morphology and subsequently, gravity induced defects.
The characterization effort for the samples consisted of:
3
1. Correlation of melt kinetics to gravity environment.
2. Correlation of crystallization time to gravity environment.
I 3. Correlation of sample thickness to crystallization environment.
4. Correlation of optical retardation to crystallization environment.
5. Correlation of relative birefringence to crystallization environment.
6. Correlation of spherulite type to crystallization environment.
7. Correlation of spherulite size to crystallization environment.
8. Correlation of degree of crystallinity to crystallization environment.
The techniques used included:
1. Low angle light scattering (method of Stein [24-251).
2. Optical microscopy (polarized visual mapping, measuring, Ehringhouse compensator waveplate, depth of focus measurements).
3. Differential scanning calorimetry (Dupont 1090 DSC, method of Mandelkern [ 26-27] ),
4. Fourier transform infrared (Nielsen and Holland [ 281 ).
5. X-ray diffraction (data reduction method of Welcher [29]).
Results
Over one hundred samples were investigated, in both ground and flight tests, to optimize the procedure. The samples were selected based upon the singularity of gravitational environments during both melt and crystallization processes. Any significant variation in gravitation fields during phase transitions disqualified the sample from statis- tical consideration. The variation in gravitational field was determined through correlation of strip chart data, recorded in-flight, of gravity (uni-axial accelerometer aligned perpendicular to ground), photocell response (mounted on the tri-ocular port of the microscope, provided quantitative data for loss of birefringence during melt/solid transition), and temperature (of the hot stage, from an in-situ thermo- couple). Measurements were recorded as a function of time. The removal of the melted samples from the hot stage for the air quench solidification was documented by the photocell response (Fig. 6).
Forty-three samples were judged suitable for statistical analysis. ,
i
Four major types of accelerational environments were employed in this research: earth normal (1 g, stationary); high gravity (ranging from 1.7 to 1.9 g, non-quantified lateral accelerations); micro- gravity (ranging from -0.02 to 0.02 g, non-quantified lateral accelerations); and microgravity (ranging from -0.02 to 0.02 g, negligible lateral accelerations), The lateral accelerations were not recorded on the master strip chart for this research, as such this data cannot be correlated for this research. However, other experimenters on the plane did record this information for all three directions; the accelerations
I 4

were quite low, not rising above the 0.1 g range. The empirical results indicate that, under microgravity conditions, lateral accelerations affect the final morphology. No lateral acceleration correlations are observed under high gravity conditions.
Number Comparative Samples Tested Data
High gravity 15 1.80 1 One gravity 3 1 .BO7 Zero gravity La. 21 1.813 Zero gravity n.a. 6 1.817
I
The effects of gravitational accelerations were manifested both macro- and microscopically. Samples recrystallized in a microgravity environment were thicker (48 to 60 microns) than those fabri- cated in a high gravity environment (20 to 37 microns). Those fabricated in a normal earth environment fell between these extremes (39 to 49 microns). These data were determined through optical focusing, retardation and optical measurement techniques.
Standard Deviation
0.006 0.006 0.007 0.005
Due to the character of the Ehringhouse compensator method, a specific site in the optical field, common to all samples, had to be selected for normalized data gathering. This site corresponded to the cross-hairs of an optical micrometer. The size of the spherulite selected for retardation measurement was also kept approximately constant through careful selection and optical measurement. All data repre- sent the average of at least four readings per sample. Retardation is inversely related to thickness through birefringence, a measure of the microscopic order present in a sample.
White light was used for the retardation measurements, therefore only comparative data - rather than absolute numbers - are presented for the birefringence determinations (Table 1) (see Appendix).
TABLE 1. BIREFRINGENCE
These data indicate that (a) a higher degree of order exists in either the amorphous or crystalline regions of the microgravity samples, or (b) the microgravity samples have a higher percent crystallinity than the higher gravity condition samples. Neither X-ray data, nor DSC data were able to determine a correlation between degree of crystallinity and gravity environment during crystallization.
The X-ray experiments were performed on a Rigaku unit at 32 kV, 20 mA, scan speed of 0.25 deg (two theta)/min from 10 to 30 deg (two theta), with a time constant of 5 sec. A silicon standard was used to calibrate the diffractometer. Samples were mounted on glass fibers with trace amounts of vacuum grease. Because the thin films were only 1 to 2 mm in diameter and variable in shape, the X-ray focussing problems were severe. These problems were addressed by examining the samples in groups of 8, divided according to crystallization gravity (c.g.) conditions (Fig. 7).
The DSC samples were weighed to 0.00001 grams. Sample pans were matched with reference pans to reduce weight effects in experimental error. Although the results for five samples in zero gravity n.a. indicated a degree of crystallization of 91.5 to 93.7 percent, and five high gravity samples displayed numbers from 89.8 to 91.1 percent, the degree of error within the experimental technique makes this
5
data too close to be statistically significant. No decomposition was noted for any of the samples within the investigated temperature range (20 to 150°C at 10 deg per minute).
As a check on the purity and degree of crystallization of the samples, FTIR investigations were performed. Although slight variations from sample to sample were noted, no clear correlation to c.g. conditions was determined. Only one potential correlatable band was seen; the 1260 cm-l band was more pronounced for the high gravities sample spectra (compared to the peaks at 1352 and 1368 cm-1). One possible explanation for this is a silicone contaminant from the vacuum grease used in the X-ray experiments. This might manifest itself more strongly in the thinner, high gravity samples.
Low angle light scattering was performed to determine the average size of the spherulites present in the samples. Further, this technique allows ranking of the supermolecular ordering, averaged over the beam spot size [ 24-25] . As several types of supermolecular morphologies were observed microscopically, a normalization methodology had to be developed for the light scattering experiments. For each sample, the best light scattering pattern was photographed, and this was used to determine the spherulite type and size. Sizes were measured using a photodensitometer on the Polaroid negatives; all sample data represents at least four separate data values averaged per sample (Fig. 8).
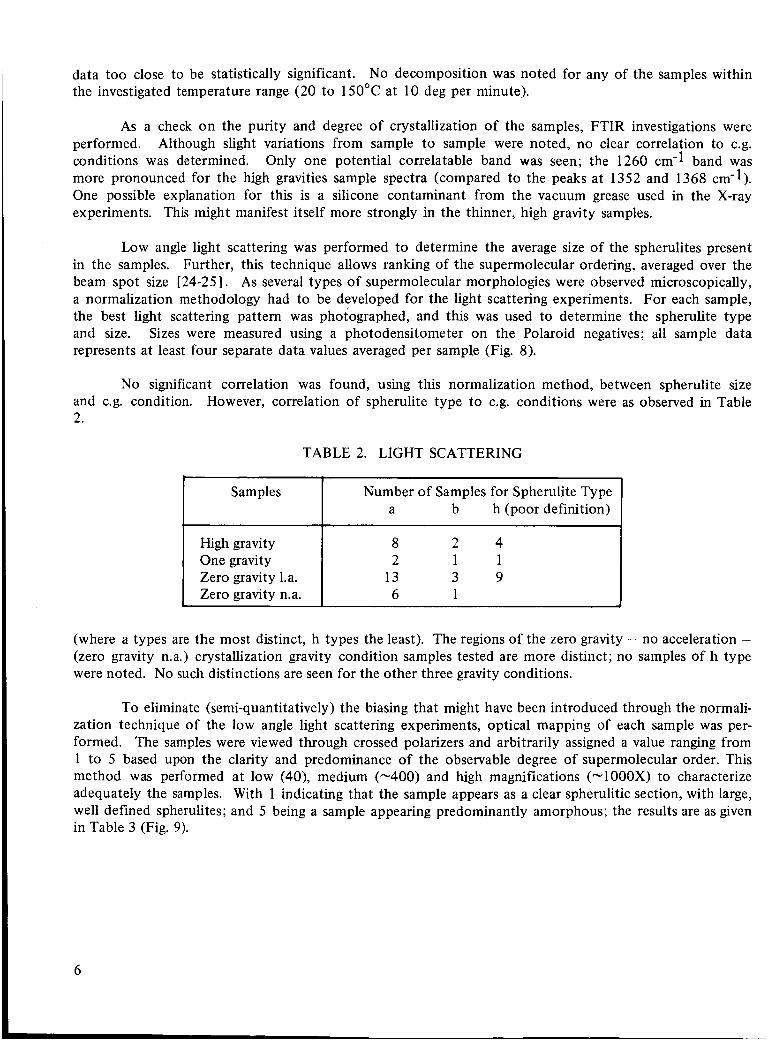
No significant correlation was found, using this normalization method, between spherulite size and c.g. condition. However, correlation of spherulite type to c.g. conditions were as observed in Table 2.
TABLE 2. LIGHT SCATTERING
Samples
High gravity One gravity Zero gravity 1.a. Zero gravity n.a.
Number of Samples for Spherulite Type a b h (poor definition)
8 2 4 2 1 1
13 3 9 6 1
(where a types are the most distinct, h types the least). The regions of the zero gravity - no acceleration - (zero gravity n.a.) crystallization gravity condition samples tested are more distinct; no samples of h type were noted. No such distinctions are seen for the other three gravity conditions.
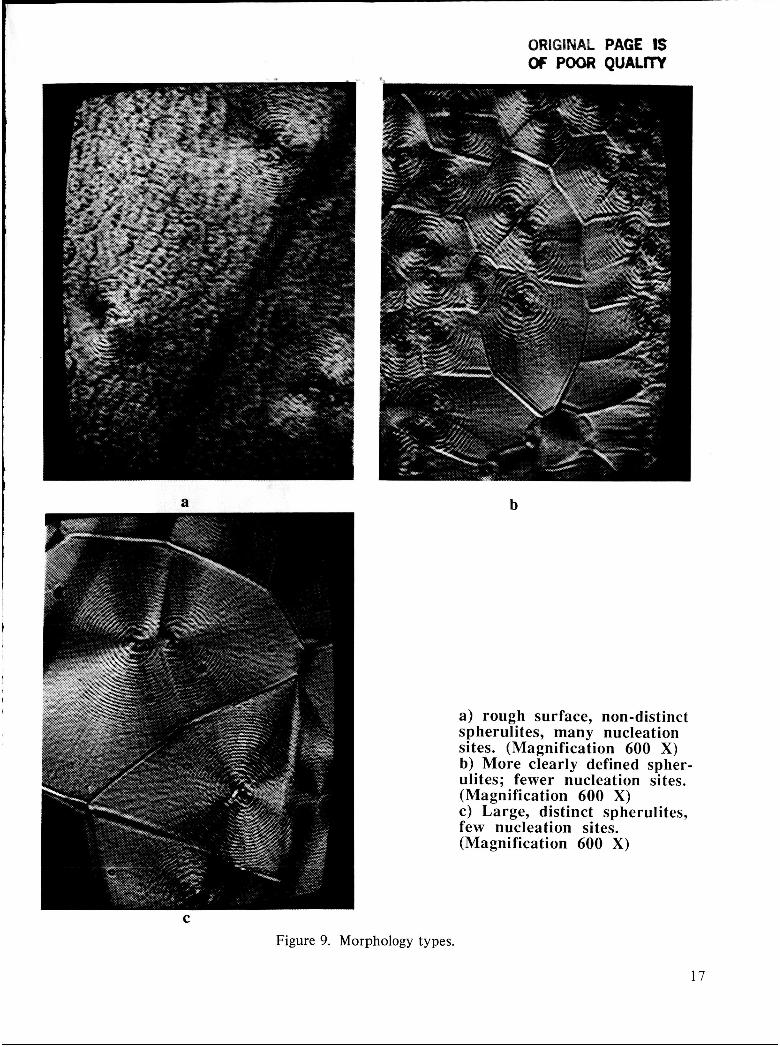
To eliminate (semi-quantitatively) the biasing that might have been introduced through the normali- zation technique of the low angle light scattering experiments, optical mapping of each sample was per- formed. The samples were viewed through crossed polarizers and arbitrarily assigned a value ranging from 1 to 5 based upon the clarity and predominance of the observable degree of supermolecular order. This method was performed at low (40), medium (-400) and high magnifications (“1 OOOX) to characterize adequately the samples. With 1 indicating that the sample appears as a clear spherulitic section, with large, well defined spherulites; and 5 being a sample appearing predominantly amorphous; the results are as given in Table 3 (Fig. 9).
6
Samples
High gravity Zero gravity 1.a. Zero gravity n.a.
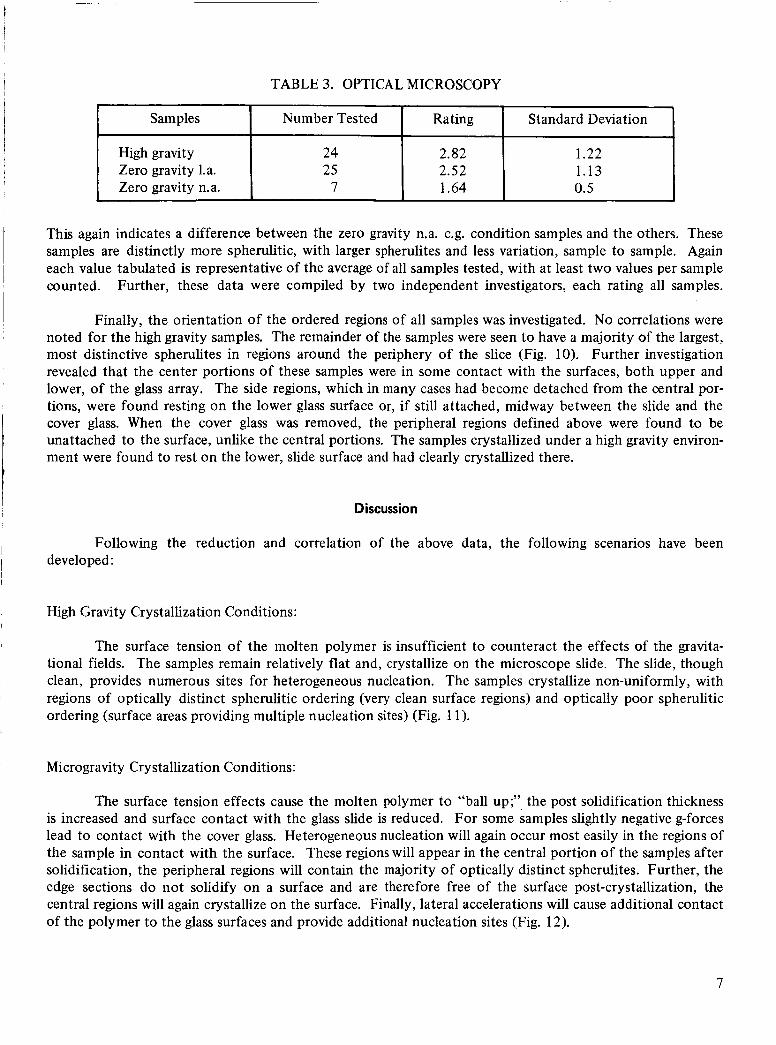
This again indicates a difference between the zero gravity n.a. c.g. condition samples and the others. These samples are distinctly more spherulitic, with larger spherulites and less variation, sample to sample. Again each value tabulated is representative of the average of all samples tested, with at least two values per sample counted. Further, these data were compiled by two independent investigators, each rating all samples.
Number Tested Rating Standard Deviation
24 2.82 1.22 25 2.52 1.13
7 1.64 0.5
Finally, the orientation of the ordered regions of all samples was investigated. No correlations were noted for the high gravity samples. The remainder of the samples were seen to have a majority of the largest, most distinctive spherulites in regions around the periphery of the slice (Fig. 10). Further investigation revealed that the center portions of these samples were in some contact with the surfaces, both upper and lower, of the glass array. The side regions, which in many cases had become detached from the central por- tions, were found resting on the lower glass surface or, if still attached, midway between the slide and the cover glass. When the cover glass was removed, the peripheral regions defined above were found to be unattached to the surface, unlike the central portions. The samples crystallized under a high gravity environ- ment were found to rest on the lower, slide surface and had clearly crystallized there.
I Discussion
Following the reduction and correlation of the above data, the following scenarios have been
I developed: i
High Gravity Crystallization Conditions:
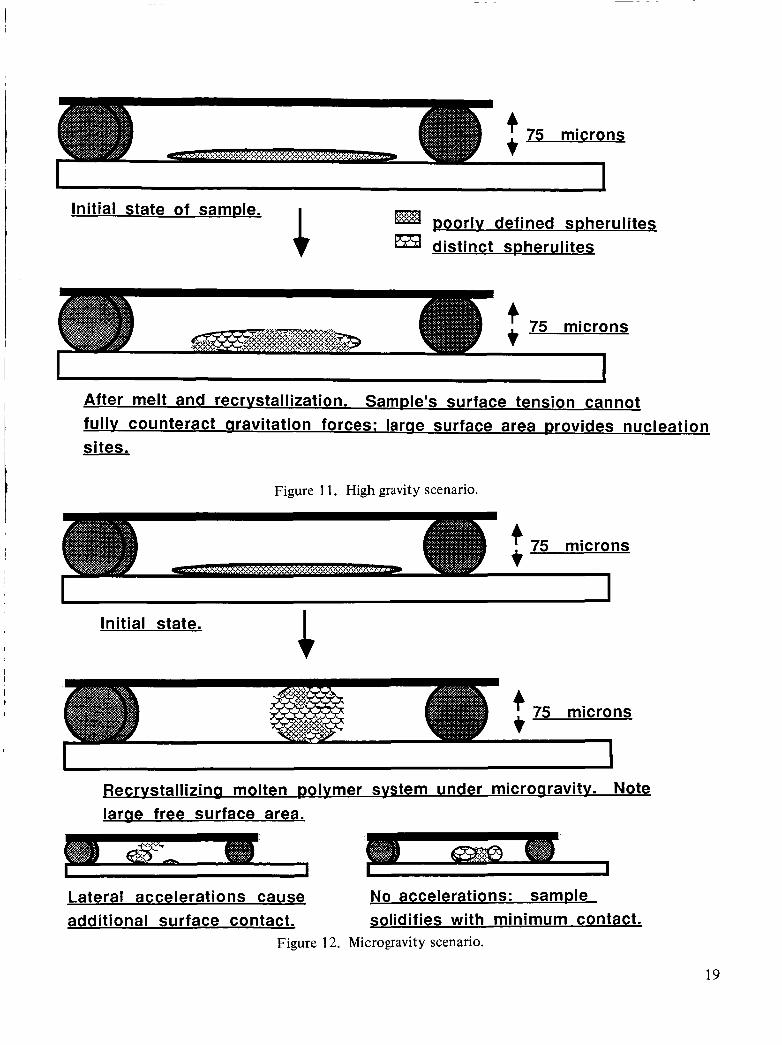
I The surface tension of the molten polymer is insufficient to counteract the effects of the gravita- tional fields. The samples remain relatively flat and, crystallize on the microscope slide. The slide, though clean, provides numerous sites for heterogeneous nucleation. The samples crystallize non-uniformly, with regions of optically distinct spherulitic ordering (very clean surface regions) and optically poor spherulitic ordering (surface areas providing multiple nucleation sites) (Fig. 1 1).
I
Microgravity Crystallization Conditions:
The surface tension effects cause the molten polymer to “ball up;” the post solidification thickness is increased and surface contact with the glass slide is reduced. For some samples slightly negative g-forces lead to contact with the cover glass. Heterogeneous nucleation will again occur most easily in the regions of the sample in contact with the surface. These regions will appear in the central portion of the samples after solidification, the peripheral regions will contain the majority of optically distinct spherulites. Further, the edge sections do not solidify on a surface and are therefore free of the surface post-crystallization, the central regions will again crystallize on the surface. Finally, lateral accelerations will cause additional contact of the polymer to the glass surfaces and provide additional nucleation sites (Fig. 12).
7
These scenarios are fully compatible with all the data, and explain all but one of the observations. This observation, the birefringence results, requires further discussion and investigation. All the other data has been related to nucleation effects, and subsequent reduction of surface related nucleation in micro- gravity. The birefringence data, however, indicates a variation in the growth behavior which may correlate with crystallization gravity conditions. This reveals that, while surface nucleation is reduced in microgravity, other significant gravitation related effects are occurring.
-~ ~~~ ~
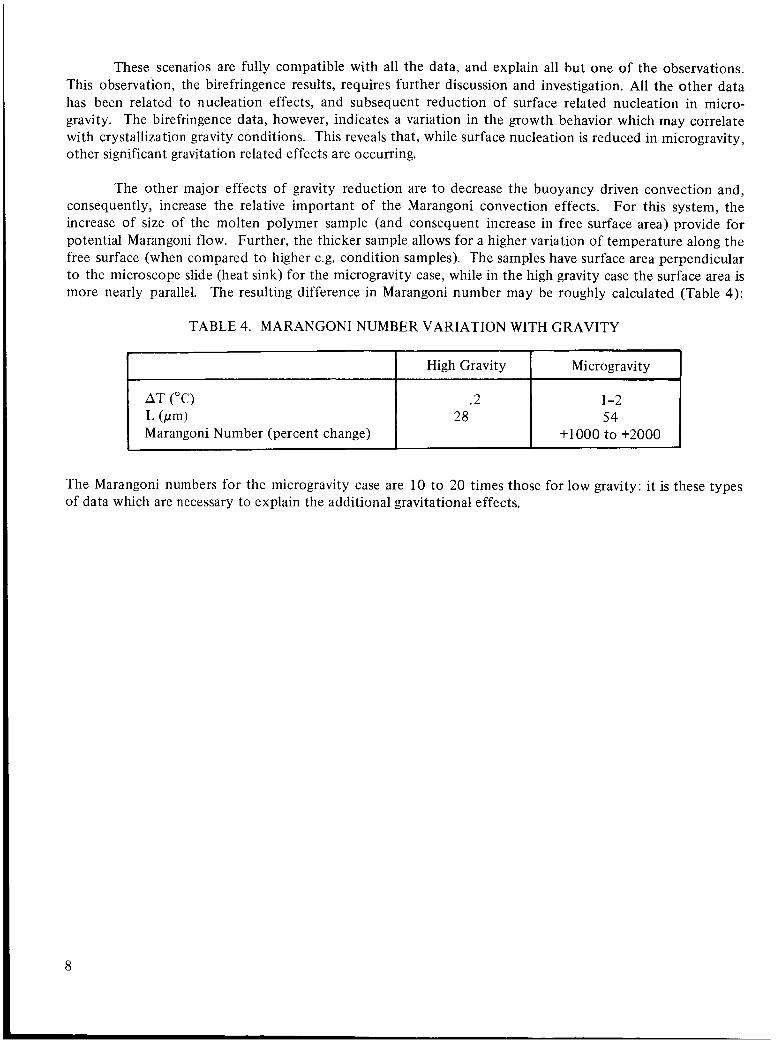
AT ("C) .2 1-2 L (Pm> 28 54 Marangoni Number (percent change) +loo0 to +2000
The other major effects of gravity reduction are to decrease the buoyancy driven convection and, consequently, increase the relative important of the Marangoni convection effects. For this system, the increase of size of the molten polymer sample (and consequent increase in free surface area) provide for potential Marangoni flow. Further, the thicker sample allows for a higher variation of temperature along the free surface (when compared to higher c.g. condition samples). The samples have surface area perpendicular to the microscope slide (heat sink) for the microgravity case, while in the high gravity case the surface area is more nearly parallel. The resulting difference in Marangoni number may be roughly calculated (Table 4):
The Marangoni numbers for the microgravity case are 10 to 20 times those for low gravity: it is these types of data which are necessary to explain the additional gravitational effects.

REFERENCES
I
1.
2.
3.
4.
5.
6.
7.
8.
9.
10.
11.
12.
13.
14.
15.
16.
17.
18.
19.
20.
21.
22.
Pentecost, E. (Compiler): Microgravity Science and Applications Bibliography- 1984 Revision. NASA TM 8665 1, September 1984.
Pentecost, E. (Compiler): 82507, January 1983.
Materials Processing In Space Bibliography- 1983 Revision. NASA TM
Pentecost, E. (Compiler): Materials Processing In Space Bibliography. NASA TM 82466, March 1982.
Ostrach, S.: J. Fluids Engr., Vol. 105, March 1983, p. 5.
Lovinger, A., Chua, J., and Gryte, C.: J. Poly. Sci.: Poly. Phys. Ed., Vol. 15, 1977, p. 641.
Lovinger, A. and Gryte, C.: J. Appl. Phys., Vol. 47, No. 5, May 1976, p. 1999.
Lovinger, A. and Gryte, C.: Macromol., Vol. 9, No. 2, March-April 1976, p. 247.
Lovinger, A,, Lau, C., and Gryte, C.: Polymer, Vol. 17, July 1976, p. 581.
Price, F. and Kilb, R.: J. Poly. Sci., Vol. 56, 1962, p. 395.
Fujiwara, Y.: Kolloid Z.Z. Polym., Vol. 226, 1968, p. 135.
Crissman, J. and Passaglia, E.: J. Res. Natl. Bur. Stand., Sec. A, Vol. 70, 1966, p. 225.
Sasaguri, K., Yamada, R., and Stein, R. : J. Appl. Phys., Vol. 35, 1964, p. 3 188.
Chandrasekhar, S. : “Hydrodynamic and Hydromagnetic Stability.” Oxford at Clarendon Press, 196 1.
Lord Rayleigh: Phil. Mag., Vol. 32, 1916, p. 529.
Schwabe, D. : Physiochemical Hydrodynamics, Vol. 2, No. 4, 198 1, p. 263.
Hurle, D. and Jakeman, E., eds. : Physiochemical Hydrodynamics, Vol. 2, No. 4, I98 1, p. 237.
Goldberg, B. : NASA Internal Memo No. EH34(85-5 l) , July 1985.
Davis, S.: J. Fluid Mech., Vol. 30, part 3, 1967, p. 465.
Drazin, P.: ZAMP, Vol. 26, 1975, p. 239.
Purdue University Ed. Staff, “Thermophysical Properties of Matter - The TPRC Data Series - Ther- mal Expansion: Nonmetallic Solids,’’ Vol. 13, IFI/Plenum, 1977, p. 1427-1433.
Purdue University Ed. Staff, “Thermophysical Properties of Matter - The TPRC Data Series - Ther- mal Conductivity: Nonmetallic Solids,” IFI/Plenum, 1977, p. 956.
Gaines, G., Jr.: Polym,, Eng. Sci., Vol. 12, 1972, p. 1.
9

23.
24.
25.
26.
27.
28.
29.
Howes, W.: Appl. Optics, Vol. 23, No. 10, 1984, p. 1467.
Prud’homme, R., Yoon, D., and Stein, R.: J. Poly. Sci.: Poly. Phys. Ed., Vol. 11, 1973, p. 1047.
Mandelkern, L., Go, S., Peiffer, D., and Stein, R.: J. Poly. Sci.: Poly. Phys. Ed., Vol. 15, 1977, p. 1189.
Mandelkern, L., Fatou, J., Denison, R., and Justin, J.: Polymer Letters, Vol. 3, 1965, p. 803.
Mandelkern, L., Allou, A., Jr., and Gopalan, M.: J. of Phys. Chem., Vol. 72, No. 1, 1968, p. 309.
Nielsen, J. and Holland, R.: J. Molecular Spec., Vol. 6, 1961, p. 394.
Welcher, F.: Standard Methods of Chemical Analysis, Vol. 3, 1964, p. 1583.
10
APPENDIX
I
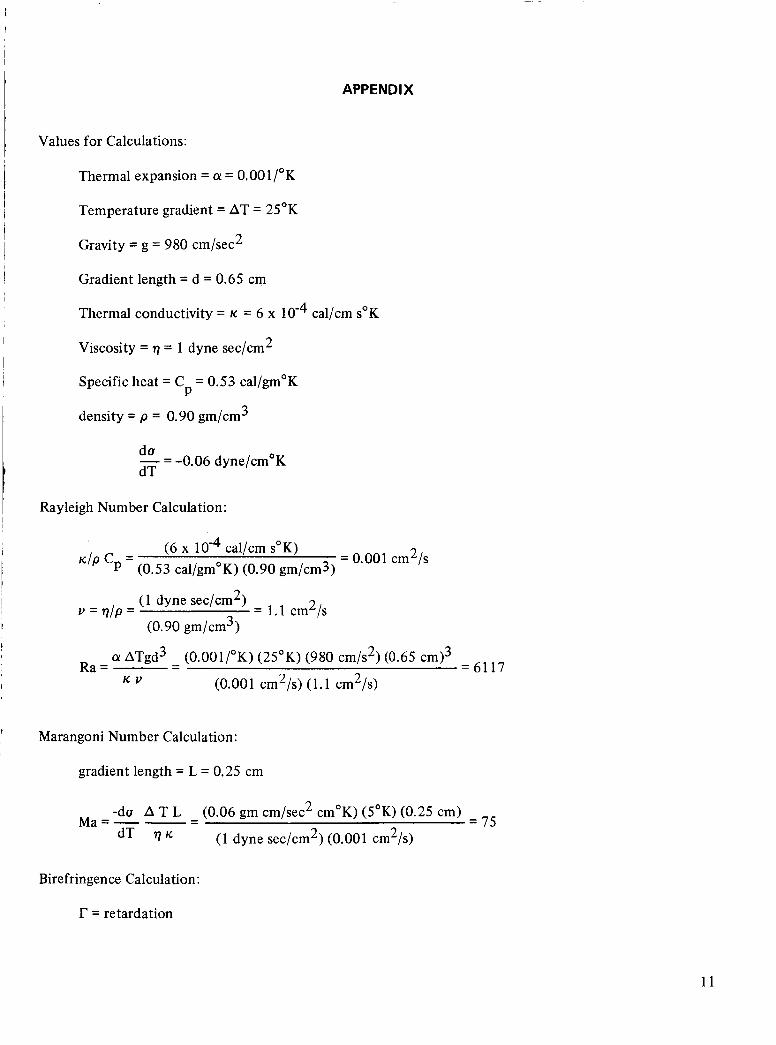
Values for Calculations:
Thermal expansion = a = 0.001/"K
Temperature gradient = AT = 25°K
Gravity = g = 980 cm/sec 2
Gradient length = d = 0.65 cm
Thermal conductivity = K = 6 x cal/cm s"K
Viscosity = q = 1 dyne sec/cm 2
Specific heat = C = 0.53 cal/gm"K P
density = p = 0.90 gm/cms
d a - = -0.06 dyne/cm"K dT
Rayleigh Number Calculation:
(6 x cal/cm s"K) K I P c = = 0.001 cm2/s
p (0.53 cal/gm"K) (0.90 gm/cm3)
(1 dyne sec/cmZ)
(0.90 gm/crn3) v = q / p = = 1.1 cm2/s
a ATgd3 (O.OOl/"K) (25°K) (980 cm/s2) (0.65 ~ m ) ~ =6117 - Ra = -
K V (0.001 cm2/s) (1.1 cm2/s)
Marangoni Number Calculation:
gradient length = L = 0.25 cm
-da A T L (0.06 gm cm/sec2 cm"K) (5'K) (0.25 cm) Ma=--- - dT q~ (1 dyne sec/cm2) (0.001 crn2/s)
= 75
Birefringence Calculation :
r = retardation
11
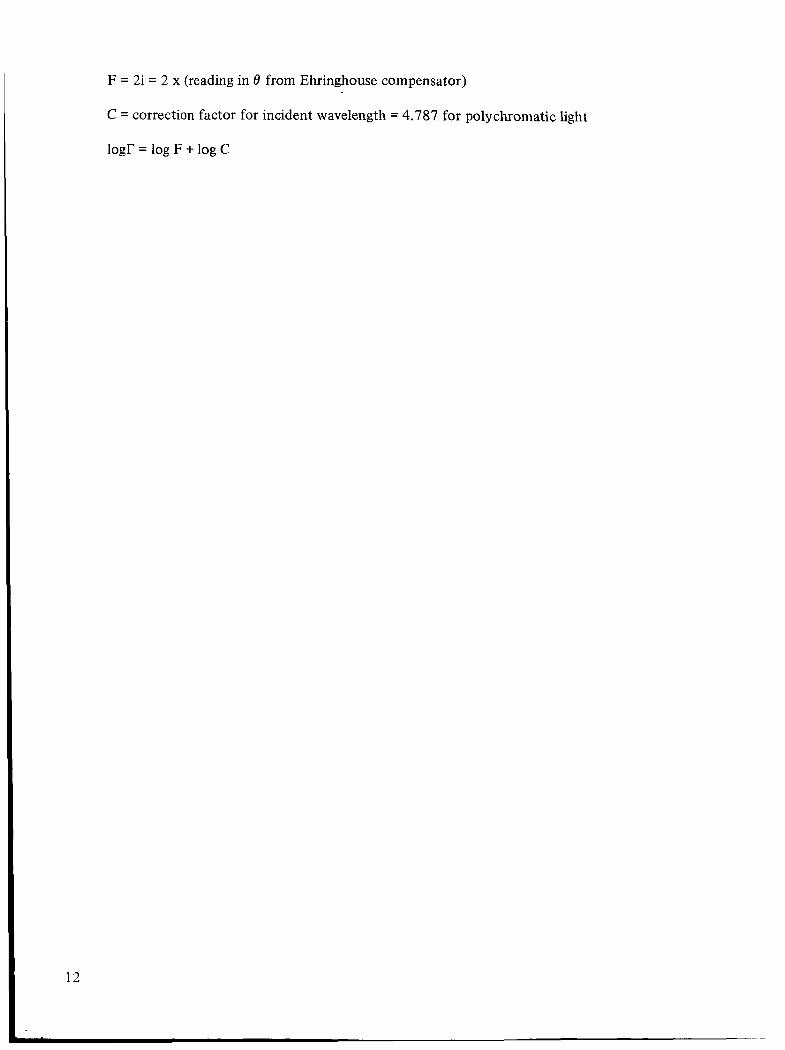
F = 2i = 2 x (reading in 8 from Ehringhouse compensator)
C = correction factor for incident wavelength = 4.787 for polychromatic light
iogr = log F + log c
12

Marangoni
ORIGINAL PAGE ts OF POOR QUALrrV
Buoyancy
Figure 1. Marangoni versus buoyancy driven convection.
The Rockwell hardware, initially constructed for a student flight experiment, is being modified for low temperature, macromolecular float zone experiments. This work may provide additional infor- mation for the proposed dissertation research.
Figure 2. Microgravity float zone apparatus.
13
I V
Top View
I -8. e
[II microscope slide cover glass zinc chromate putty poly(ethy1ene)
Side View
Figure 3. Sample configuration.
Sampla: PE 67 Date: 2-Aug-85 Time: 12: 56: 39 S izes TINY Rate: 10 DEG/MIN Operator: GOLDBERG Program: I n t e r a o t i v e DSC V3.0 P l a t t e d : 2-Aug-85 13: 25: 47
D S C Filer PUTTY. 04 CLB DATA CORP
2.0 : : : : : : : : : : : : : : ; . : . . . . .
t
Polyethylene /
NO significant transitions are noted for the zinc chromate putty. The melt transition for poly(ethy1ene) occurs at 127-132 degrees C. (heating rate 10 deg. C/min.)
Figure 4. Differential scanning calorimetry traces.
14

ORIGINAL PAGE rs Of POOR QUALrrV
Pictured: B. Goldberg and B. Shurney exchanging samples during microgravity period. Cart must be left untouched during melt cycle to prevent lateral accelerations.
Figure 5. Flight cart configuration for microgravity crystallization/nucleation studies.
These traces have been smoothed and offset to correct for instabilities and pen locations on actual record.
Figure 6. Idealized strip chart record of KC-135 flight experiment.
15

X-ray traces, presented for high and low gravity environment samples display no significant variations. Each trace represents an average over eight samples.
Figure 7. X-ray traces.
(h) are distinctlv different. Measurements The images denoted as (a) and (h)
of highest intensity for each figure were made with an optical photo- densitometer.
Figure 8. Representative light scattering images.
a
C
ORIGINAL PAGE IS O f POOR QUALITY
b
a) rough surface, non-distinct spherulites, many nucleation sites. (Magnification 600 X) b) More clearly defined spher- ulites; fewer nucleation sites. (Magnification 600 X) c) Large, distinct spherulites, few nucleation sites. (Magnification 600 X)
Figure 9. Morphology types.
17

18
While several, distinct optical morphologies are present in one sample, the trend for the regions of distinct spherulitic ordering is toward the edges of the sample. The blown up regions ( 330 X), taken from the sites noted on the sample ( 30 X) are representative for microgravity (no acceleration) processed samples. (See Figure 12)
Figure 10. Photographic montage of an entire sample.
Initial state of sample.
I
poorlv defined mherulites distinct spherulites
After melt and recrvstallization. SamDle's surface tension cannot fullv counteract aravitation forces: larae surface area Drovides nucleation sites.
Figure 1 1. High gravity scenario.
Initial state.
Recrvstallizina molten Dolvmer svstem under microaravitv. Note larae free surface area.
I L I ~
Lateral accelerations cause No accelerations: sample additional surface contact. solidifies with minimum contact.
Figure 12. Microgravity scenario.
19
1. REPORT NO. 12. G O V E R N m N T ACCESSION NO. 13. RECIP IENT*S CATALOG NO.
NASA T P - 2 6 7 1 I 4. T I T L E AND SUBTITLE 5. REPORT DATE
Microgravity Crystallization of Macromolecules: An Interim Report and Proposal for Continued Research
C 6. PERFORMlNG ORGANIZATION CODE
I DECEMBER 1986
7 . AUTHOR(S)
Benjamin E. Goldberg 9. PERFORMING ORGANIZATION NAME AND ADDRESS
George C. Marshall Space Flight Center Marshall Space Flight Center, Alabama 358 12
12. SPONSORING AGENCY NAME AND ADDRESS
8 . PERFORMING ORGANIZATION REPOR r ,?
1 0 . WORK UNIT NO.
M-543 11 . CONTRACT OR GRANT NO.
r
13. TYPE OF REPORi 8 PERIOD COVER€[
Technical Paper
19. SECURITY CLASSIF. (ofthi.
Unclassified
National Aeronautics and Space Administration Washington, D.C. 20546
20. SECURITY CLASSIF. (of t h h pmge) 21. NO. OF PAGES 22. PRICE
2 4 A 0 2 Unclassified
I
15. SUPPLEMENTARY NOTES Prepared by Materials and Processes Laboratory, Science and Engineering Directorate.
16. ABSTRACT
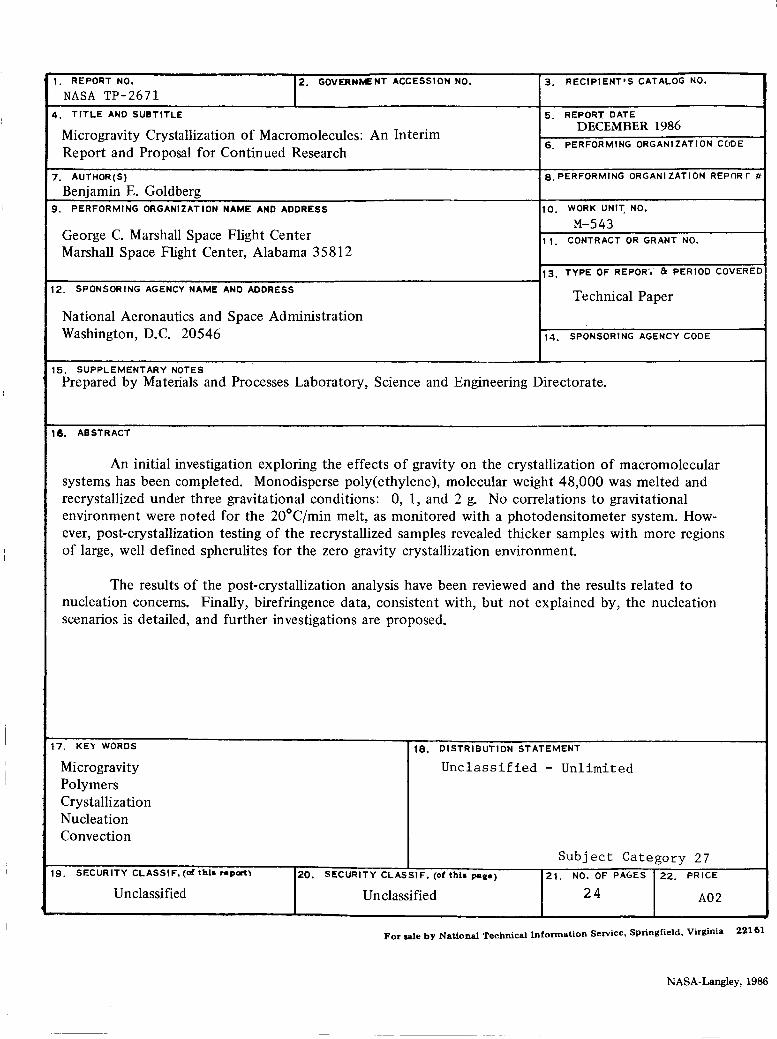
An initial investigation exploring the effects of gravity on the crystallization of macromolecular systems has been completed. Monodisperse poly(ethylene), molecular weight 48,000 was melted and recrystallized under three gravitational conditions: 0, 1 , and 2 g. No correlations to gravitational environment were noted for the 20°C/min melt, as monitored with a photodensitometer system. How- ever, post-crystallization testing of the recrystallized samples revealed thicker samples with more regions of large, well defined spherulites for the zero gravity crystallization environment.
The results of the post-crystallization analysis have been reviewed and the results related to nucleation concerns. Finally, birefringence data, consistent with, but not explained by, the nucleation scenarios is detailed, and further investigations are proposed.
17. KEL WORDS 18. 01 STR I BUT1 ON STATEMENT
Microgravi ty Polymers Crystallization Nucleation Convection
I Unclassified - Unlimited
For aale by National Technical Information Service, Springfield. Virginia 22161
NASA-Langley, 1986