1980bssa_pga, pgv, pgd
TRANSCRIPT

Bulletin of the Seismological Society of America, Vol. 70, No. 1, pp. 305-321, February 1980
PEAK ACCELERATION, VELOCITY, AND DISPLACEMENT FROM STRONG-MOTION RECORDS
BY DAVID M. BOORE, WILLIAM B. JOYNER, ADOLPH A. OLIVER, III, AND ROBERT A. PAGE
ABSTRACT
Strong-motion data from earthquakes of western North America are examined to provide the basis for estimating peak acceleration, velocity, and displacement as a function of distance for three magnitude classes, 5.0 to 5.7, 6.0 to 6.4, and 7.1 to 7.6. Analysis of a subset of the data from the San Fernando earthquake shows that small but statistically significant differences exist between peak values of horizontal acceleration, velocity, and displacement recorded on soil at the base of small structures and values recorded at the base of large structures. The peak acceleration tends to be less and the peak velocity and displacement to be greater at the base of large structures than at the base of small structures. In the distance range used in the regression analysis (15 to 100 km), the values of peak horizontal acceleration recorded at soil sites in the San Fernando earthquake are not significantly different from the values recorded at rock sites, but values of peak horizontal velocity and displacement are significantly greater at sol
/ I INTRODUCTION / Peak horizontal acceleratior, is commonly used to scale response spectra or
ground-motion/time histories for use in earthquake resistant design, particularly for nuclear poSeUr plant facilities (Newmarket al, 1973). Methods have been proposed (Newmark and Hall, 1969) for constructing design spectra using three peak param- eters-horizontal acceleration, velocity, and displacement--the advantage of using all three parameters being that together they convey some information concerning the shape of the spectrum as well as the amplitude level. In this paper, an analysis of a large number of earthquake data is presented as a basis for estimating the peak acceleration, velocity, and displacement for a hypothetical earthquake of a pre- scribed magnitude at a prescribed distance from the causative fault. This work is a continuation of that reported by Page et al. (1972) and Page et al. (1975); it is a condensation of U.S. Geological Survey Circular 795 by Boore et al. (1978), hereafter referred to as USGS Circular 795, which should be consulted for further details.
It is not our purpose to advocate the use of peak parameters in scaling design motions. We look forward to the development of new methods for prescribing design motions, methods more firmly based in the physics that govern faulting and wave propagation. Pending the development of such methods, we recognize widespread current practice and attempt to present the available strong-motion data in a compact and useful form for estimating peak parameters.
DATA CHARACTERISTICS AND METHODS OF PRESENTATION
Sources of data. The data set includes 204 recordings from 19 earthquakes of western North America, taken primarily from volumes I and II of the series "Strong- motion Earthquake Accelerograms" published by the Earthquake Engineering Research Laboratory of the California Institute of Technology. The data set used is tabulated in USGS Circular 795; a listing of the events used is given in Table 1.
3o5

306 D . M . BOORE, W, B. JOYNER, A. A. OLIVER, AND R. A. PAGE
Distances. In all cases, the distance used is the shortest distance between the surface of fault slippage and the recording point. This would clearly be the preferred measure of distance if equal areas of the fault emit ted equal amounts of seismic energy and if the surface were known. The second condition is sometimes not met; the first is probably never met. Other measures of distance have been used in analysis of s trong-motion data, particularly epicentral distance, hypocentra l dis- tance, and distance from the center of energy release (Duke et al., 1972). The use of epicentral distance or hypocentra l distance has the advantage tha t these measures are more commonly known and special studies are not required to determine them. In some cases, however, these measures are clearly inappropriate, as for a long fault rupture with the epicentral at one end and recording stations at the other. The use
TABLE 1 EARTHQUAKES PROVIDING DATA USED IN THIS PAPER
Date Origin Time (y/m/d) (h:min UTC) Location Magnitude
72/02/24 15:56 Bear Valley, California 5.0 74/11/28 23:01 Bear Valley, California 5.2 75/06/07 08:46 Ferndale, California 5.2 57/03/22 19:44 Daly City, California 5.3 70/09/12 14:30 Lytle Creek, California 5.4 66/06/28 04:26 Parkfield, California 5.5 67/06/21 18:04 Fairbanks, Alaska 5.6 69/10/02 04:56 Santa Rosa, California 5.6 69/10/02 06:19 Santa Rosa, California 5.7 75/08/01 20:20 Oroville, California 5.7 73/02/21 14:45 Point Mugu, California 6.0 72/12/23 06:29 Managua, Nicaragua 6.2 40/05/19 04:36 Imperial Valley, California 6.4 68/04/09 02:28 Borrego Mtn., California 6.4 71/02/09 14:00 San Fernando, California 6.4 49/04/13 19:55 Puget Sound, Washington 7.1 59/08/18 06:37 Hebgen Lake, Montana 7.1 52/07/21 I1:52 Kern County, California 7.2 72/07/30 21:45 Sitka, Alaska 7.6
of distance to the center of energy release is a way of avoiding the assumption of uniform radiat ion over the rupture surface, but for long ruptures this measure, too, may be inappropriate. In our opinion the best choice for general purposes is the closest distance to the rupture surface, but the uncertaint ies resulting from nonuni- form radiat ion over the surface should be kept in mind. An illustration of those uncertaint ies is provided by the Pacoima Dam recording of the San Fernando ear thquake of 1971. By interpretat ions of a number of seismological data (e.g., Hanks, 1974; Boore and Zoback, 1974), the sources for the peak velocity and the peak acceleration on the record are thought to come from different regions of the fault separated by perhaps 20 km; nei ther region contains the closest point to the instrument.
In order to avoid obscuring the a t tenuat ion relation, we generally exclude data where the uncer ta inty in distance is large. Following Page et al. (1972), the distances are classified as A, B, or C, according to the uncer ta inty (less than 2 km, 2 to 5 kin, and 5 to 25 km, respectively). C-quality data are used only for the magnitude 7.1 Puget Sound ear thquake and the magnitude 7.1 Hebgen Lake earthquake. In the plots to follow, the uncer ta inty class A, B, or C is indicated by the size of the symbol, the largest for class A and the smallest for class C.

ESTIMATING PEAK ACCELERATION, VELOCITY, AND DISPLACEMENT 307
Classification of data. The data have been divided into classes according to magnitude, site geology, and size of associated structure. The data were divided into three magnitude classes (5.0 to 5.7, 6.0 to 6.4, and 7.1 to 7.6) on the basis of the Richter local magnitude (Richter, 1958), if available; otherwise surface-wave mag- nitude was used. (Sources of data for assigning magnitudes are included in USGS Circular 795.) The Imperial Valley earthquake was assigned a magnitude of 6.4 in accordance with a determination by Trifunac and Brune (1970) and in contrast to the value 7.1 that is commonly given.
Kanamori and Jennings (1978) have recently developed a method of determining Richter local magnitude from strong-motion records. Their magnitude assignments are in general agreement with ours. The largest difference is for the Puget Sound earthquake of 1949, for which their value is 6.5 and our value is 7.1.
Recording sites are assigned to one of two categories, "rock" or "soil", by applying our best judgment to the available site descriptions. Stations are assigned to the rock category if they are underlain by material described by such terms as granite, diorite, gneiss, chert, graywacke, limestone, sandstone, siltstone, or shale. Stations are assigned to the soil category if they are underlain by a sufficient thickness of material described by such terms as alluvium, sand, gravel, clay, silt, mud, fill, or glacial outwash. If, from the site description, soil material overlying rock is judged to be less than 4 to 5 m thick, the site is assigned to the rock category. (Sources for site descriptions are given in USGS Circular 795.) Because considerable uncertainty and ambiguity attends the geological classification of recording sites, conclusions that rely on the validity of the classification of a single station are omitted. Only trends revealed by comparing whole classes of data are considered.
Many of the data come from the basement or ground floor of buildings or from the abutments of dams. In the analysis of strong-motion data, it is commonly assumed that (he influence of the structure on the motion of the base can be ignored and that the data as recorded represent free-field ground motion. A limited test of this assumption has been attempted by classifying recording sites in accordance with the size of the associated structure, one class for sites at the base of one- to two-story buildings and another for sites at the base of taller buildings or on dam abutments. Comparison of the two classes using data from the San Fernando earthquake is described in a subsequent section.
One would expect the velocity and displacement data from small structures to be more representative of free-field motion. The transfer functions relating motion at the base of structures to free-field motion tend toward unity for frequencies that are small relative to the fixed-base natural frequencies of the structure. (For examples of theoretical and empirical transfer functions, see Duke et al., 1970; Crouse and Jennings, 1975.) Small structures generally have natural frequencies in the range 2 to 10 Hz, which iz significantly above the range of frequencies dominant in the velocity and displacement time histories. The case of acceleration is more compli- cated. For large buildings, the dominant acceleration frequencies will be higher than the fundamental structtiral resonant frequencies, and here the transfer functions tend to fall below unity. The natural frequencies of the small structures, however, are in the same range as the frequencies dominant in the acceleration time histories, and the effect of the structure may be to raise or lower the peak acceleration, depending on the spectrum of the earthquake and the details of the transfer function. We would expect the acceleration values for the large structures to be systematically biased downward, but the values for the smaller structures may be either increased or decreased. In fact, comparison of San Fernando data shows smaller accelerations on the average for the large structures. Therefore, focus is placed on the data from

308 D . M . BOORB, W. B. JOYNER, A. A. OLIVER, AND R. A. PAGE
the small structures as a basis for estimating free-field motion. Geographic distribution. In an attempt to keep the data sample reasonably
homogeneous, only records obtained in the western part of North America were included. In order to avoid bias from the extremely dense cluster of instruments in downtown Los Angeles, a special selection procedure was used in the area between latitude 34.00 ° and 34.11°N and longitude 118.24 ° and 118.45°W. Within each of the two geological site categories, only one recording per earthquake was allowed for each structure category, making a maximum of four possible recordings from the designated area for one earthquake. Selection was made by choosing the station with the smallest identification number of all eligible stations.
Presentation of data. Peak horizontal acceleration, velocity, and displacement are plotted against distance on log-log grids for each magnitude class. The peak values for horizontal motion are taken from the component with the larger peak.
Statistics. The nature of the strong-motion data set is not such as to bear the weight of elaborate or subtle statistical inferences. For that reason, plots showing the individual data points are emphasized. We do, however, indulge in statistical analysis to the extent of fitting least-squares straight lines relating the logarithm of the peak parameters to the logarithm of distance and determining the confidence limits for the prediction of a single value of the dependent variable (Dixon and Massey, 1957); the 70 and 95 per cent prediction intervals are shown by the pairs of curved lines. The equations used in the statistical analysis and the coefficients for the regression lines shown in the plots are contained in USGS Circular 795. An attempt has been made to avoid bias in the regression analysis by not including points that are either too close or too far from the fault. For close points, the data are too sparse to indicate the proper functional form for the regression; for far points, the data set is incomplete because not all instruments were triggered by the motion. The straight lines clearly fit the data as well as would any other simple relation. Curvature that might be caused by anelastic attenuation is completely obscured by the scatter in the data.
The scatter is approximately constant independent of distance. This constancy suggests that it was correct to fit a straight-line relation to the logarithms of variables rather than fit a power-law relation to the variables themselves.
ANALYSIS OF THE WHOLE DATA SET
Data from horizontal components for all the earthquakes are presented in this section, using the data from small structures because, for the reasons given previ- ously, those data are considered to be a better guide to free-field motion. (Data from larger buildings and vertical component data are contained in USGS Circular 795.) Coefficients from the regression analyses are contained in Table 2.
Horizontal acceleration. Peak horizontal acceleration data for the three magni- tude classes (Figure 1) show that acceleration clearly increases with magnitude in those distance ranges for which there is overlap of data between the magnitude classes. The scatter for the magnitude 5.0 to 5.7 data is significantly greater than that for either of the other two classes. This difference may arise partly because a number of different earthquakes contribute substantially to the data set for the 5.0 to 5.7 class, whereas the 6.0 to 6.4 class is dominated by data from the 1971 San Fernando earthquake and the 7.1 to 7.6 class is dominated by data from the 1952 Kern County earthquake.
The rate of attenuation of acceleration with distance for the magnitude 5.0 to 5.7

ESTIMATING PEAK ACCELERATION, VELOCITY, AND DISPLACEMENT 309
class appears to be greater than indicated by the slope of -0.9 for the mean regression line in Figure 1. This is suggested by the systematic tendency for the data points at distances beyond 30 km to lie below an extension of the mean regression line. As previously explained, we have chosen to exclude from the regression analysis data beyond the distance at which all instruments can be presumed to have triggered. The distance range for which a reasonably complete data set is available is not adequate for a good determination of slope; the standard error of the slope for the magnitude 5.0 to 5.7 class is 0.5. Judging from the data at greater distances, the slope of -1.2 + 0.3 for the mean line for the magnitude 6.0 - 6.4 class appears to be a better estimate of the rate of attenuation to distances of at least 100 km for that data set. The slope of -2.0 + 0.4 for the magnitude 7.1 to 7.6 class may overestimate the rate of attenuation, but the data are scanty.
Horizontal velocity. The peak horizontal velocity data for the three magnitude classes are presented in Figure 2. There are fewer points of velocity than acceleration
T A B L E 2
STATISTICAL PARAMETERS OF LoG-LOG ATTENUATION RELATIONS*
Distance Range b :i: Magnitude Range (km) a Standard Error Data Pointa
Accelerat ion (Figure 1)
5.0 to 5.7 5 to 30 0.2 - 0 . 9 + 0.5 19
6.0 to 6.4 15 to 55 1.0 -1 .2 + 0.3 16
7.1 to 7.6 40 to 150 2.6 -2 .0 + 0.4 9
Velocity (Figure 2) 5.3 to 5.7 5 to 30 2.4 -1 .2 +_ 0.6 11 6.4 15 to 55 1.9 -0 .6 _+ 0.4 14
Disp lacement {Figure 3) 5.3 to 5.7 5 to 30 1.8 -1 .2 + 0.6 11
6.4 15 to 55 1.5 -0 .6 + 0.5 14
* Form of regression equation: logl0(amplitude) = a - b log~o(distance).
because integrations were not available for all the accelerograms. There are so few points for the magnitude 7.1 to 7.2 class that regression lines are not included. As with acceleration, the peak velocity at a given distance tends to increase with magnitude.
The slope of -0.6 _+ 0.4 for the mean regression lines for the magnitude 6.4 data appears to underestimate the rate of attenuation if one considers the San Fernando data {described in the next section), which give better determinations because the distance range extends to 100 km. We were confident that all the instruments out to 100 km were triggered in the San Fernando earthquake, but this confidence does not apply to the whole magnitude class.
Horizontal displacement. The peak horizontal displacements for the three mag- nitude classes are given in Figure 3. The scatter of the data is larger than for acceleration or velocity in each magnitude class, and the standard errors of the slopes of the mean regression lines exceed 0.5. The displacements are derived from double integration of high-pass filtered accelerograms and therefore represent high- pass filtered versions of the true ground displacement. The longer periods, which are contaminated by processing noise, are removed.
Hanks (1975), in studying the errors in displacement records derived by double

310
C~
z
~E O I I.--
0.1 _.1 L.LJ u u
7 © N 0.01 r v O
0.001
D. M. BOORE, W. B. JOYNER , A. A. OLIVER~ AND R. A. PAGE
MAGNITUDE 5.0 - 5.7 SMALL STRUCTURE I [ I I I ~ I I I I [ F I ~ - I I
\ 0 :
E X P L A N A T I O N X 0 X
X Rock site
O Soi l s i te ~
I ~ I I l l l~ l I I I I ] l l l l I ~ 10 100
DISTANCE, IN KILOMETERS
MAGNITU DE 6 . 0 - 6.4 SMALL STRUCTU RES [ I I I I I I I I I 1 I l l l l l I I I
1 .0 '
O'1
z__ o e g
~ 0.1 g
N g ×go
0.001 I I I I I l l i I I l l l l l l I 1 10 100
DISTANCE, IN KILOMETERS
O0
Z
z O
0 . 1
o u
0 S o.oi
0 "I-
MAGNITUDE 7 . 1 - 7 . 6 SMALL STRUCTURES 70-PERCENT PREDICTION INTERVALS
].o - ~.o 5.0 - 5.7 _ ~ 6 . 0 - 6.4 : \ ,X 7.6 i \1 \ o g ,,
) .1
<~
0 ~) 001
0.001 I I I I I I I l l I L I J l l l l l I I ~ 0.1p01 I I I I I I l l l I [ I I I I I l l I I 10 1 0 0 1 0 1 0 0
DISTANCE, IN KILOMETERS DISTANCE, IN KILOMETERS
Fro. 1. Peak horizontal acceleration recorded at base of small structures versus distance to slipped fault for three magnitude ranges. Center line, mean regression line. Outer pair of lines represents 95 per cent prediction interval; inner pair, 70 per cent prediction interval. Length of lines represents distance interval considered in regression analysis. Uncertainty in distance is inversely related to symbol size (see text). Lower right figure shows a comparison of the 70 per cent prediction intervals for the three magnitude ranges.
integration of filtered accelerograms, found that the errors are typically less than 1 cm in the period range 5 to 8 sec, 1 to 2 cm at periods near 10 sec, and 2 to 4 cm in the period range 10 to 15 sec. These findings raise the possibility that some of the low-amplitude data points in Figure 3 may be influenced by noise and may represent

ESTIMATING PEAK ACCELERATION, VELOCITY, AND DISPLACEMENT 311
MAGNITUDE 5.3 - 5.7 ,SMALL STRUCTURES r ~ Z O U 1 0 0 . 0
rv
I.-- 10.0 Z M.I u
z
O ._.1 ~ 1.0
g z O N
O
r i i p i l i t ~ [ i i i i : T
)< EXPLANATION
x Rock s i t e
O Soi l s i t e
I I Z O U 100.0
r v
r v
10.0 Z ii,iII ¢D
Z i
>i- I (,D 0 ,i-ii ~.o
i:- © N
O 112 0.1
MAGNITUDE 6.4 SMALL STRUCTURES I I I I I I I I I I I I l l l l l I [ J
X
I I I I t l i l d I I ] i i i 1 [ I I I I I I I I I I l [ [ I [ l l l l l [ I J 10 100 10 100
DISTANCE, IN KILOMETERS DISTANCE, IN KILOMETERS
MAGNITUDE 7.1-7.2 SMALL STRUCTURES I I I I ] l l l I l I I I F l l l 1 I I
Z 0 ,i(J 1 0 0 . 0 -
i 'v
~-- O
t - - 10.0 Z ~ @ I.l.I u
z
>i.- i i I u 0
1.o
z O N
O - r
0.1
Z 0 ,,u, c,O
~0
Z
Z
0 o
0 N
0 "1-
1 0 0 . 0
10.0
1.0
70-PERCENT PREDICTION INTERVALS I I F I I l l l I I [ [ I l l l l E [ I
5.3 -5.7
~,xT.1- 7 .2
q
I I I I I I I I I I I I I I P I I 0.1 I t I I r l l ~ l I I I I I I l l 10 100 10 100
DISTANCE, IN KILOMETERS DISTANCE, IN KILOMETERS
1 Fro. 2. Peak horizontal velocity. See Figure 1 for explanation of symbols and curves. Dashed curves
in the lower right figure for class 7.1 to 7.2 emphasize uncertainty in slope.
upper bounds to the actual ground displacement. The character of some of the low amplitude records resembles noise rather than signal. Nevertheless, we have pro- ceeded in the analysis with the understanding that the results may be compromised to some extent by the effect of noise on the weaker motions.
The peak displacement at a given distance increases with magnitude in a manner similar to that observed in the acceleration and velocity data.

312
r-v
Z ]o.o u 7
Z
u <
u) 1.0 ~
Z o 0 - r
D. M. BOORE, W. B. JOYNER, A. A. OLIVER, AND R. A. PAGE
MAGNITUDE 5.3-5.7 SMALL STRUCTURES
\ \
\
EYSo il sile
0.1
O
X
~ _ l l l l l i i i I I I L 2 / _ _ _ L I 10 loo
DISTANCE, IN KILOMETERS
Z lO.O u
z
~.~ 1.0
Z 0 N
0
0.1
MAGNITUDE 6.4 SMALL STRUCTURES ? ~ I I I l i i l j I I I q l i l l I I I
1 I I I I I I l l I I I I l t l l l I I 10 100
DISTANCE, IN KILOMETERS
MAGNITUDE 7.1- 7.2 SMALL STRUCTURES ~_ I I I I11111 I i i q q q T ~ - - T ~ m ~
l,o
~'---~ 10.0~- 0 0
0
N
7
N o
0.1
70-PERCENT PREDICTION INTERVALS I I ] l l l l l I ~ I I l i l l L I I I
5 . 3 - 5 . 7
7 . 1 - 7 . 2 \6<:,, \L "-.< \ , \ I 7 \
~ \ kt I
I " I \ \
\
~7 10.0 --
U z
Z u..i
u <
~ 1.0
N
0 N N © I
0.1 10 100 10 100
DISTANCE, IN KILOMETERS DISTANCE, IN KILOMETERS
FIG. 3. Peak horizontal displacement. See Figure 1 for explanation of symbols and curves.
ANALYSIS OF DATA FROM THE SAN FERNANDO EARTHQUAKE
The San Fernando earthquake supplied more than one-quarter of the total data points in our sample. The large number of data points from a single event provides the best basis for examining the effects of structures and local site conditions. The San Fernando earthquake also gives more accurate values than the whole magnitude 6.0 to 6.4 data set for the slopes of the regression lines for peak parameters against

ESTIMATING PEAK ACCELERATION, VELOCITY, AND DISPLACEMENT 313
d i s t ance . T h i s a c c u r a c y is poss ib l e because , as m e n t i o n e d p rev ious ly , t h e s t a t i s t i c a l ana lys i s can b e ca r r i ed o u t ove r a g r e a t e r r a n g e of d i s t a n c e for t h e S a n F e r n a n d o e a r t h q u a k e . As d i scus sed ear l ie r , to a v o i d b i a s n o t a l l t h e r e c o r d s f rom d o w n t o w n Los A n g e l e s a re i n c l u d e d in t h e d a t a set . T h e coef f ic ien ts f rom the r eg re s s ion a n a l y s e s a re g iven in T a b l e s 3 a n d 4; for m o r e de t a i l see USGS Circular 795.
In c o m p a r i n g p e a k p a r a m e t e r s for d i f fe ren t s izes of s t r u c t u r e s a n d s i te cond i t ions ,
TABLE 3 STATISTICAL PARAMETERS OF LoG-Lo6 ATTENUATION RELATIONS
FOR THE SAN FERNANDO EARTHQUAKE DATA*
b± [dentification a Data Points
Standard Error
Acceleration Small structures 1.1 -1.3 + 0.2 12 Large structures 0.9 -1.3 _+ 0.2 18
Velocity Small structures 3.1 -1.3 + 0.2 11 Large structures 2.6 -1.0 + 0.1 18
Displacement Small structures 2.1 -0.9 + 0.4 11 Large structures 2.1 -0.8 + 0.2 18
* Soil sites, comparison of recordings at base of small and large structures (Figure 4).
TABLE 4 STATISTICAL PARAMETERS OF Lo~-Loo REGRESSION RELATIONS FOR
THE SAN FERNANDO EARTHQUAKE DATA*
b± Identification a Data Points
Standard Error
Acceleration Rock sites 1.4 -1.6 + 0.2 l0 Soil sites 1.1 -1.3 _+ 0.2 12
Velocity Rock sites 3.1 -1.5 _+ 0.4 9 Soil sites 3.1 -1.3 + 0.2 11
Displacement Rock sites 2.7 -1.5 _+ 0.;4 9 Soil sites 2.1 -0.9 _+ 0.4 11
* Small structures, comparison of recordings on rock and soil {Figure 5).
an a n a l y s i s - o f - v a r i a n c e t e c h n i q u e is u sed (Acton, 1959, p. 80-83) to t e s t t h e s t a t i s t i c a l s ign i f icance of t h e r e d u c t i o n in v a r i a n c e t h a t occurs w h e n d i f f e ren t r e g r e s s ion l ines a re f i t to t h e two d i f fe ren t d a t a sets . In genera l , t h e a n a l y s i s - o f - v a r i a n c e t e s t s e n a b l e us to see h o w t h e d i f fe rences b e t w e e n d a t a se t s c o m p a r e w i th t h o s e t h a t m i g h t be caused b y r a n d o m s a m p l i n g error . T h e r e s h o u l d b e no sense of conf idence , however , t h a t t h e s t r o n g - m o t i o n d a t a se t s r e p r e s e n t r a n d o m samples ; in a n y case, t h e s t a t i s t i c a l t e s t s s a y n o t h i n g a b o u t t he r ea l p h y s i c a l m e a n i n g of t h e d i f f e rences b e t w e e n d a t a sets .
Effect of structure. F i g u r e 4 c o m p a r e s p e a k hol~.,zontal acce l e r a t i on , ve loc i ty , a n d d i s p l a c e m e n t va lue s r e c o r d e d on soi l a t t h e ba se of s m a l l s t r u c t u r e s (one- a n d two-

314 D . M . B O O R E , W . B . J O Y N E R , A . A . O L I V E R , A N D R . A . P A G E
Z m ] .0--
z" O t--
o o ~: 0.1
7 0 S
© T
o.o1
u
~- 1 Q O . O - -
(D Z
>i-
(.i) 0
10.0
Z © N
(3
1.0
u.I
b - ~u~ 1 0 . 0 - -
z
Z
k)
N
Z 0 U N 0 "1-
0 . 1 ! I
SAN FERNANDO SOIL SITES SAN FERNANDO SOIL SITES - - T - ~ ] ~ l 1 1 1 1 1 I I I L I I I I j I I I I[I I I I i I I I I I I
I I I [ l l l l L I
@
I r . l l ~ l , ~ i , ~ I ,
O ~
@
EXPLANATION @ Small structure
Large structure
I I
r
- - ~ r - I i ~ il I L I I L I I I I
] I [ I I I I ] I 1 I Ell111
\ \ - .
EXPLANATION ~ Small structures
- - ~ Large structures
I I I I I E I I I I I I 1 1 1 1 1 I I I I q l l l l l ~ . l I I I l l l 1o 100 10 100
DISTANCE, IN KILOMETERS DISTANCE, IN KILOMETERS
I
I I I
i i
L I
I
FIG. 4. (Left) Peak mot ions versus dis tance to sl ipped faul t at soil si tes in San Fe rnando ear thquake. (Right) Compar i son of m e a n regression lines and 70 per cent predict ion intervals for smal l s t ruc tu res (solid lines) and large s t ruc tures (dashed lines).

ESTIMATING PEAK ACCELERATION, VELOCITY, AND DISPLACEMENT 315
story buildings) and large structures (buildings with more than two stories, or dams). For acceleration, the mean regression line for data from small structures lies above that for large structures, and the analysis-of-variance tests indicate that the differ- ence is significant at the 90 per cent level. The difference in slope is not significant. For velocity, the mean regression line for small structures generally lies below that for large structures, although the lines cross. The difference in level is statistically significant at the 98 per cent level, although unimpressive to the eye. The small- structures line is steeper, and the difference in slope is significant at the 90 per cent level. For horizontal displacement, the mean regression line for small structures lies below that for large structures, and the difference is significant at the 99 per cent level. The difference in slope is not significant.
In summary, for most of the distance range covered by the regression analysis peak horizontal acceleration is less and peak horizontal velocity and displacement are greater, on the average, at the base of large structures than at the base of small structures. The attenuation with distance is greater for the small structures for all three parameters, but the difference is statistically significant only for peak velocity. The result that acceleration values from the large structures are lower on the average is expected from considerations of soil-structure interaction and is consistent with the findings of Crouse (1978). The data shown in Figure 4 encourage us in our preference for the data from small structures as a basis for estimating free-field ground motion. In general, however, the differences between the data from large and small structures are relatively small compared with the range of either data set, and we do not believe that firm conclusions are warranted solely on the basis of formal statistical tests. The differences may be caused by soil-structure interaction, but more study would be required to confirm this.
Effect of site geology. Figure 5 compares peak horizontal acceleration, velocity, and displacement recorded at the base of small structures on rock and soil. For acceleration, the analysis-of-variance tests indicate that the differences in the regression lines are not significant in either slope or level. For velocity the mean regression line is higher for soil, and the difference is significant at the 98 per cent level. The difference in slope is not significant. For displacement the mean regression line for soil is higher; the difference is significant at the 98 per cent level. The difference in slope is not significant even at the 75 per cent level.
Peak horizontal acceleration appears to be nearly the same, on the average, on rock and soil sites, whereas both peak horizontal, velocity and displacement are larger on soil sites. This relation is not the result of any obvious bias in the data. No gross effect is evident from bias in the distribution of stations with distance. To test for bias due to the nonuniform azimuthal distribution of the data (Hanks, 1975), the azimuth of each station was determined with respect to a point in the center of the zone of fault rupture (latitude 34.37°N, longitude 118.42°W). A mean regression line against distance was determined for all the peak-horizontal-motion data for small structures in the distance range 15 to 100 km (with distance measured to the closest point on the rupture surface, as before). Residuals to the regression line are plotted against azimuth in a polar diagram (Figure 6), the circle representing zero residual. For acceleration data, no strong systematic difference is apparent between rock and soil. Although the azimuthal coverage is far from complete, it can be said that in any range of azimuth for which both rock and soil points are present, the soil residuals for velocity and displacement data are more positive.
It is tentatively concluded that amplification of velocity and displacement is a real effect associated with soil sites; presumably, for the soil sites, some sort of

316 D . M . BOORI% W. B. J O Y N E R , A. A. O L I V E R s A N D R. A. PAGE
Z 1.0
z" 0 i i - < r~
u u
0A
p - z 0 N
0 "1-
0 . 0 I
U
I O0.O u
z
i.- U 0
SAN FERNANDO SMALL STRUCTURES SAN FERNANDO SMALL STRUCTURES i I I I I l l I I I 1 1 1 1 1 1 I I I I I I l l I I I I I I I I I I I
xx
XO00 0 0
© @0
> I 0,0
Z © U
0 "t"
1.0
F-- Z 10.0 (D
Z
z
U <
z 0 N
© T
- - ~ [ t t L I I T ] l l I T ~ - -
X x% X ©
X 0 o
X O0 0 X X x6o x>o
X
I I I I I I l I I l l l l l I I
<>
xx o
× 0
o°<> x X ©
X ° 0 E X P L A N A T I O N
X Rock s i t e
0 SOil s i t e
E 7 I t I [ I
~ - [ I l l l l m
I [ I 1 4 1 1 [ I
T i I i 1 1 1 1 1
E X P L A N A T I O N
Rock s i t e
~ S o i l s i t e
\
X \
X
\
\ 0 . 1 _ .~ -L I I 1 1 1 1 1 ] I I 1 1 1 1 1 1 1 I I I I I t l i l l l ! I I I I 1 1 1 1 l
10 100 10 100
DISTANCE, IN KILOMETERS DISTANCE, IN KILOMETERS
Fro. 5. (Left) Peak motions recorded at base of small structures versus distance to slipped fault in San Fernando earthquake. (Right) Mean regression lines and 70 per cent prediction intervals.

ESTIMATING PEAK ACCELERATION, VELOCITY, AND DISPLACEMENT
SAN FERNANDO SAN FERNANDO SMALL STRUCTURES ACCELERATION SMALL STRUCTURES VELOCITY
317
A FACTOR OF TWO
©
©
A FACTOR OF TWO
SAN FERNANDO SMALL STRUCTURES DISPLACEMENT
©
0 A FACTOR OF TWO
EXPLANATION
X Rock site
~> Soil site
Fro. 6. Azimuthal dependence of residuals from mean regression lines for acceleration, velocity, and displacement. X and diamond represent rock and soil sites, respectively.
amplif icat ion mechan i sms are operat ing on the longer periods tha t are dominant on velocity and d isplacement records. For the shor ter periods dominant on accelerat ion records, these mechan i sms are counterbalanced by anelastic a t tenuat ion. The re will be no speculat ion here on the nature of the amplif ication mechanisms. S imi la r conclusions on the effect of site conditions on strong mot ion in the San Fernando ea r thquake were repor ted by Duke et al. (1972); Tr i funac (1976); Arnold et al. (1976).
318 D.M. BOORE, W. B. JOYNER, A. A. OLIVER, AND R. A. PAGE
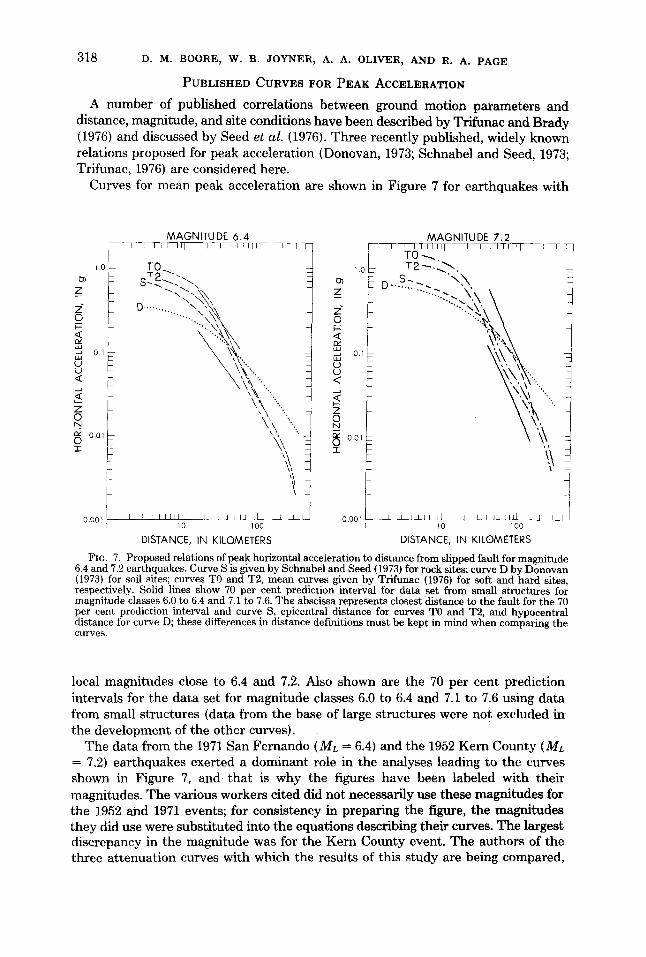
PUBLISHED CURVES FOR PEAK ACCELERATION
A n u m b e r of publ ished correlat ions between ground mot ion pa rame te r s and distance, magni tude, and site conditions have been described by Tri funac and Brady (1976) and discussed by Seed et aL (1976). Three recent ly published, widely known relations proposed for peak accelerat ion (Donovan, 1973; Schnabel and Seed, 1973; Trifunac, 1976) are considered here.
Curves for mean peak accelerat ion are shown in Figure 7 for ea r thquakes with
1.0 b~
Z
z" © i---
-.J 0.1
U L)
© n
0.01 "1-
0,001 f 1
MAGNITUDE 6.4 I I i l i l l i l I I I ~ I
O ....... " ~ , ' , ............
1,0
Z
z" ©
~ 0.1
U U
Z o N
O.Ol
-r
MAGNITUDE 7.2 - - F ~ ~ I L I l l 1 I
"10-~.. T P__ ~ ..,,,~
S~ "\,"'x . . . . . . ~. .~ . .
"i
I I E P I I I I I P I I I h i l l ] I I 0.001 I I I I L ~ J _ _ ~ i I l l l J I I 10 100 10 100
DISTANCE, IN KtLOMETERS DISTANCE, IN KILOMETERS
FIG. 7. Proposed relations of peak horizontal acceleration to distance from slipped fault for magnitude 6.4 and 7.2 earthquakes. Curve S is given by Schnabel and Seed (1973} for rock sites; curve D by Donovan (1973) for soil sites; curves TO and T2, mean curves given by Trifunac (1976) for soft and hard sites, respectively. Solid lines show 70 per cent prediction interval for data set from small structures for magnitude classes 6.0 to 6.4 and 7.1 to 7.6. The abscissa represents closest distance to the fault for the 70 per cent prediction interval and curve S, epicentral distance for curves TO and T2, and hypocentral distance for curve D; these differences in distance definitions must be kept in mind when comparing the curves.
local magni tudes close to 6.4 and 7.2. Also shown are the 70 per cent predict ion intervals for the da ta set for magni tude classes 6.0 to 6.4 and 7.1 to 7.6 using da ta f rom small s t ructures (data f rom the base of large s t ructures were not excluded in the deve lopment of the other curves).
T h e data f rom the 1971 San Fernando (ML = 6.4) and the 1952 Kern County (ML = 7.2) ea r thquakes exerted a dominan t role in the analyses leading to the curves shown in Figure 7, a n d tha t is why the figures have been labeled with their magni tudes. The var ious workers cited did not necessari ly use these magni tudes for the 1952 and 1971 events; for consistency in prepar ing the figure, the magni tudes they did use were subs t i tu ted into the equat ions describing their curves. T h e largest discrepancy in the magni tude was for the Kern County event. T h e authors of the three a t tenua t ion curves with which the results of this s tudy are being compared,

ESTIMATING PEAK ACCELERATION, VELOCITY, AND DISPLACEMENT 319
used a surface-wave magnitude of 7.6 or 7.7; it was not until 1978 that the Richter local magnitude of 7.2 was published (Bolt, 1978; Kanamori and Jennings, 1978). This is a good example of the problems that can arise when magnitude is used as an independent variable in the specification of peak motions. It should be noted that the commonly used magnitudes will saturate as the size of the earthquake increases. A number of recent papers have discussed this important point, e.g., Brune (1970); Geller (1976); Kanamori (1977); Hanks and Kanamori (1979).
The curve labeled "S" was developed by Schnabel and Seed (1973) for rock sites and is based on strong-motion data extended to distances nearer the fault with the help of theoretical attenuation curves. Because the theoretical curves are based on the conservation of radiated energy, however, they apply strictly to quantities based on an integral measure of the ground motion over the duration of the seismic record rather than an isolated peak value. Application of the curves to peak parameters is an approximation of uncertain accuracy. The measure of distance used by Schnabel and Seed is the shortest distance to the rupture surface, the measure used in this paper.
The curves labeled "TO" and "T2" are the mean curves given by Trifunac (1976) for soft and hard sites, respectively. These curves are based on a data set very similar to the one used in this report, including data from both large and small structures. The distance measure used by Trifunac is epicentral distance. His curves were fitted to the data on the assumption that the distance dependence of peak acceleration is that of the function given by Richter (1958) for the decay with distance of the maximum motion of a Wood-Anderson seismograph (free period = 0.8 sec, damping = 0.8). In the absence of more data close to large earthquakes, the accuracy of Trifunac's assumption is difficult to evaluate. Even if valid, however, it should be noted that Richter's attenuation function was not well constrained by data for distances between 0 and 20 km, which is the range most critical for strong- motion predictions. Kanamori and Jennings' analysis of local magnitudes from a few close-in strong-motion recordings (Kanamori and Jennings, 1978) appears to support the use of Richter's attenuation function, but small residuals in estimated magnitudes can correspond to large factors of uncertainty in peak motions, and Kanamori and Jennings interpreted the distance in Richter's attenuation relation to be distance to the surface projection of the center of faulting rather than epicentral distance.
The curve labeled "D", developed by Donovan (1973) for soil sites, was obtained by fitting 678 data points by a function of the form
y = bleb2m(R + 25)-b~
where y is peak acceleration; m, magnitude; R, hypocentral distance in kilometers; and bl, b2, and b3, adjustable constants. The arbitrary constant 25 is added to the distance for the purpose of reducing the predicted values at small distances. The size of the constant has a very large influence on the values at small distances, but data points at these distances are not sufficient to determine the appropriate size. Donovan states that the function fits the data better when the arbitrary constant is 25 than when it is zero, but why it should be 25 rather than any other number is unclear.
The amount of disagreement shown in Figure 7 is not surprising in view of the different assumptions, different measures of distance, and different data sets used in

320 D . M . BOORE, W. B. JOYNER, A. A. OLIVER, AND R. A. PAGE
arriving at the different curves. As might be expected, the disagreement is the greatest at short distances.
CONCLUSIONS
The regression lines given here for peak horizontal acceleration, velocity, and displacement from the data of earthquakes of western North America provide the means for estimating peak ground-motion parameters at distances greater than about 5 km for magnitude 5.0 to 5.7 earthquakes, 15 km for magnitude 6.0 to 6.4 earthquakes, and 40 krn for magnitude 7.1 to 7.6 earthquakes. Unfortunately, most damage can be expected to occur at shorter distances. As shown, attempts have been made to provide curves for estimating peak accelerations at such distances. We do not have complete confidence in those curves. The main goal of this paper has been a careful analysis of existing strong-motion data; the difficult problem of predicting the ground motion at short distances is being attacked from a number of angles by us and by other workers. The synthesis of this work into attenuation laws and the subsequent confirmation of these laws lies in the future.
ACKNOWLEDGMENTS
We are grateful to R, P. Maley for assistance in obtaining information on strong-motion recording site conditions and to A. G. Brady for unpublished strong-motion data from the February 21, 1973, Point Mugu, California, earthquake. R. B. Matthiesen and B. A. Bolt made useful suggestions on earlier versions of the paper. This work was done in cooperation with the Nuclear Regulatory Commission.
REFERENCES
Acton, F. S. (1959). Analysis of Straight-Line Data, Dover, New York, 267 pp. Arnold, P., E. H. Vanmarcke, and G. Gazetas {1976}. Frequency content of ground motions during the
1971 San Fernando earthquake: Massachusetts Institute of Technology, Department of Civil Engi- neering, Publication R76-3, 73 pp.
Bolt, B. A. {1978). The local magnitude ML of the Kern County earthquake of July 21, 1952, Bull. Seism. Soc. Am. 68, 513-515.
Boore, D, M. and M. D. Zoback {1974). Two-dimensional kinematic fault modeling of the Pacoima Dam strong-motion recording of the February 9, 1971, San Fernando earthquake, Bull. Seism. Soc. Am. 64, 555-570.
Boore, D. M., W. B. Joyner, A. A. Oliver, III, and R. A. Page (1978). Estimation of ground motion parameters, U.S. Geol. Surv., Circular 795, 43 pp.
Brune, J. N. (1970). Tectonic stress and the spectra of seismic shear waves from earthquakes, J. Geophys. Res. 75, 4997-5009.
Crouse, C. B. (1978). Prediction of free-field earthquake ground motions, Proc. ASCE Geotech. Eng. Div. Specialty Conf. Earthquake Eng. Soil Dynamics. Pasadena, Ca., 1, 359-379.
Crouse, C. B. and P. C. Jennings (1975). Soil-structure interaction during the San Fernando earthquake: Bull. Seism. Soc. Am. 65, 13-36.
Dixon, W. J. and F. J. Massey, Jr. (1957). Introduction of Statistical Analyses, McGraw-Hill, New York, 488 pp.
Donovan, N. C. (1973). A statistical evaluation of strong motion data including the February 9, 1971 San Fernando earthquake, Proc. Worm Conf. Earthquake Eng., 5th, Rome, 1, 1252-1261.
Duke, C. M., J. E. Luco, A. R. Carrivean, P. J. Hradilek, R. Lastrico, and D. Ostrom (1970). Strong earthquake motion and site conditions, Hollywood, Bull. Seism. Soc. Am. 60, 1271-1289.
Duke, C. M., K. E. Johnsen, L. E. Larson, and D. C. Engman (1972). Effects of site classification and distance on instrumental indices in the San Fernando earthquake: University of California. Los Angeles, School of Engineering and Applied Science, UCLA-ENG-7247, 29 pp.
Geller, R. J. (1976). Scaling relations for earthquake source parameters and magnitudes, Bull. Seism. Soc. Am. 66, 1501-1523.
Hanks, T. C. (1974). The faulting mechanism of the San Fernando earthquake, J. Geophys. Res. 79, 1215-1229.
Hanks, T. C. {1975). Strong ground motion of the San Fernando, California, earthquake, ground displacements, Bull. Seism. Soc. Am. 65, 193-225.
ESTIMATING PEAK ACCELERATION, VELOCITY, AND DISPLACEMENT 321
Hanks, T. C. and H. Kanamori (1979). A moment magnitude scale, J. Geophys. Res. 84, 2348-2350. Kanarnori, H. (1977). The energy release in great earthquakes, J. Geophys. Res. 82, 2981-2987. Kanamori, H. and P. C. Jennings (1978). Determination of local magnitude, ML, from strong-motion
accelerograms, Bull. Seism. Soc. Am. 68, 471-485. Newmark, N. M. and W. J. Hall (1969). Seismic design criteria for nuclear reactor facilities, Proc. World
Conf. Earthquake Eng., 4th, Santiago, 2, B4-37-B4-50. Newmark, N. M., J. A. Blume, and K. K. Kapur (1973). Seismic design spectra for nuclear power plants,
Proc. Am. Soc. Civil Eng. J. Power Div. 99, 287-303. Page, R. A., D. M. Boore, W. B. Joyner, and H. W. Coulter (1972). Ground motion values for use in the
seismic design of the trans-Alaska pipeline system, U.S. Geol. Surv., Circular 672, 23 pp. Page, R. A., D. M. Boore, and J. H. Dieterich (1975). Estimation of bedrock motion at the ground surface,
in Studies for Seismic Zonation of the San Francisco Bay Region, R. D. Borcherdt, Editor, U.S. Ge¢)l. Surv., Profess. Paper 941-A, A31-A38.
Richter, C. F. (1958). Elementary Seismology, W. H. Freeman, San Francisco. 768 pp. Schnabel, P. B. and H. B. Seed, (1973). Accelerations in rock for earthquakes in the western United
States, Bull. Seism. Soc. Am. 63, 501-516. Seed, H. B., R. Murarka, J. Lysmer, and I. M. Idriss {1976). Relationships of maximum acceleration,
maximum velocity, distance from source, and local site conditions for moderately strong earthquakes, Bull. Seism. Soc. Am. 66, 1323-1342.
Trifunac, M. D. (1976). Preliminary analysis of the peaks of strong earthquake ground motion-- dependence of peaks on earthquake magnitude, epicentral distance, and recording site conditions, Bull. Seism. Soc. Am. 66, 189-219.
Trifunac, M. D. and J. N. Brune (1970), Complexity of energy release during the Imperial Valley, California, earthquake of 1940, Bull. Seism. Soc. Am. 60, 137-160.
Trifunac, M. D. and A. G. Brady (1976). Correlations of peak acceleration, velocity, and displacement with earthquake magnitude, distance, and site conditions, Earthquake Eng. Structural Dyn. 4, 455- 471.
U.S. GEOLOGICAL SURVEY 345 ]~_.IDDLEFIELD ROAD MENLO PARK, CALIFORNIA 94025
Manuscript received May 14, 1979
NOTE ADDED IN PROOF
Several recent ear thquakes in the western United States have provided data which can be used to test our conclusions concerning the prediction of peak motions in various distance ranges for different magnitude classes. In a note in preparation, Boore and Porcella have compared the peak accelerations from the 1978 Santa Barbara (ML ~- 5.1), 1979 Coyote Lake (ML = 5.9), and 1979 Imperial Valley (ML
= 6.4) ear thquakes with the regression curves in Figure 1 of this paper. They find that in the distance range over which the regression lines are defined the agreement in each case is excellent. For the combined Coyote Lake and Santa Barbara ear thquake data, 9 out of 10 values are within the 70 per cent prediction intervals, and 12 out of 17 points (71 per cent) from the Imperial Valley earthquake fall within the corresponding 70 per cent prediction intervals and all 17 points fall within the 95 per cent prediction intervals. The Imperial Valley earthquake provided 19 data points at distances less than 15 km (compared to only 2 values for the analysis in this paper), and thus will help extend to closer distances our ability to predict ground motions. Boore and Porcella find that the close-in points from the Imperial Valley ear thquake fall below a linear extrapolation of the mean regression line for the 15 to 55 km distance range.