18 kgi-toronto marketing-m_partners-26may15
TRANSCRIPT

A PROFITABLE FUTURE
TORONTO MARKETING May 26/28, 2015
A RICH HISTORY
TSX/AIM:KGI

Forward Looking Statements Cautionary Note Regarding Forward Looking Statements.
This presentation contains statements which constitute ”forward-looking statements”, including statements regarding
the plans, intentions, beliefs and current expectations of the Company with respect to the future business activities
and operating performance of the Company. The words “may”, “would”, “could”, “should”, “will”, “intend”, “plan”,
“anticipate”, “believe”, “estimate”, “expect” and similar expressions, as they relate to the Company, are intended to
identify such forward-looking statements. Forward-looking statements used in this Presentation include, but
may not be limited to; statements regarding the Company’s guidance for fiscal 2015 including ounces
produced and grade assumptions, cash operating cost per ounce and AICC, sustaining capital, revenue,
operating cash flow and free cash flow generation; the ability to bring more higher grade stopes online from
the 5400 level and access to the 5600 level and the timing thereof; the exploration programs and the results
and timing thereof. Investors are cautioned that forward-looking statements are based on the opinions, assumptions
and estimates of management considered reasonable at the date the statements are made such as, without
limitation, opinion, assumptions and estimates of management regarding the Company’s business, its ability to
increase its production capacity and decrease its production cost. Such opinions, assumptions and estimates, are
inherently subject to a variety of risks and uncertainties and other known and unknown factors that could cause
actual events or results to differ materially from those projected in the forward-looking statements. These factors are
discussed in length in the Company's annual Management's Discussion and Analysis and Annual Information Form
for the year ended April 30, 2014. and the Company’s Management's Discussion and Analysis for the interim period
ended January 31, 2015 filed with the securities regulatory authorities in certain provinces of Canada and available at
www.sedar.com.
Should one or more of these risks or uncertainties materialize, or should assumptions underlying the forward-looking
statements prove incorrect, actual results may vary materially from those described herein as intended, planned,
anticipated, believed, estimated or expected. Although the Company has attempted to identify important risks, uncertainties
and factors which could cause actual results to differ materially, there may be others that cause results not to be as
anticipated, estimated or intended. The Company does not intend, and does not assume any obligation, to update these
forward-looking statements except as otherwise required by applicable law.
TSX/AIM:KGI www.klgold.com 2

Investment Highlights
Located in Ontario, one of the safest and lowest risk mining jurisdictions globally
Attractive NI43-101 high grade reserve and resource profile with a long mine life
Growing annual production, declining cost base and improving unit costs
Company returning to profitability and free cash flow
Significant exploration potential with organic growth
Potential upside with a higher gold price and a weaker Canadian dollar
www.klgold.com 3 TSX/AIM:KGI
Experienced and Diverse Board of Directors and Management Team

Experienced Team
Eric Sprott, Chairman of the Board (Non-executive Director)
Barry Cooper, B.Sc., MBA (Non-executive Director)
Pamela Klessig, P.Geo (Non-executive Director)
Barry Olson, M.Sc. (Non-executive Director)
Jeffrey Parr, CA, BA, MBA (Non-executive Director)
Dawn Whittaker, LLB (Non-executive Director)
www.klgold.com 4 TSX/AIM:KGI
George Ogilvie, P.Eng. (Director, President & CEO)
John Thomson, CA (Director, Executive VP & CFO)
Chris Stewart, P.Eng. – VP Operations
Suzette N Ramcharan, CPIR – Director, Investor Relations
Board of Directors
Senior Management

Financial Position
CASH C$80.3 million 1
DEBT C$115 million convertible debentures
KGI.DB: 6% coupon/ $15.00 strike
C$54.5MM mature Jun/2017
KGI.DB.A: 7.5% coupon/ $13.70 strike
C$60.5MM* mature Dec/2017
*In F2015, KGI purchased C$5MM of the 7.5%
3
ROYALTY 2.5% NSR Franco Nevada Corporation
option to buyback 1% by October 31, 2016, at a cost
of US$36MM less any money paid against the 1%
52 Week Performance 2
HIGH C$6.88
LOW C$2.51
www.klgold.com 5 TSX/AIM:KGI
1As at April 30, 2015; 2 As at May 12, 2015 3 See press release dated April 1, 2015, for details on the NCIB
CAPITAL STRUCTURE 1
ISSUED SHARES 80,306,617
Stock Options 4,107,300
Convertible Debentures 8,536,495 3
FULLY DILUTED 92,950,412
MARKET CAP ~488 Million 2
Major Shareholders (~50%) 1
Resolute Funds (10%)
Eric Sprott (10%)
Columbia Wanger Asset Management LLC (8%)
Equinox Partners (7%)
Van Eck Associates Corporation (5%)
Harry Dobson (4%)
ABC Funds (4%)

KGI Share Price Performance
KGI Share Price Vs Gold Price (C$)
Over a 12 month Period
(May 2014 – May 2015)
• KGI share price has outperformed
the POG by 80%
• Steady increase in KGI share price
since January 2015
KGI Share Price Vs Select
Group of Peers (2015 YTD,
as of May 6, 2015)
• KGI share price has
increase by 73% relative
to its peers
• Share price has also
remained above issue
price of bought deal*
www.klgold.com 6 TSX/AIM:KGI
* See press release dated February 18, 2015
Source: Bloomberg as at May 5, 2015

Kirkland Lake Camp
www.klgold.com 7 TSX/AIM:KGI
KGI owns five former
producing high grade mines
Historical production of
~22 Moz’s of gold
Average head grade of
0.44 opt or 15.1 g/t
The Kirkland Lake gold camp
has been producing gold for
over 100 years.
Almost 25 Moz’s has been
produced to date, from
seven mines.
Based on grade, it is one of
the richest gold camps in
the world.

One of the Highest Grade Gold Mines In The World Select Group of Producing Assets with +1Moz’s in Reserves
Mine Operator Location Gold Grade Reserves MRMR
g/t Au Date
Macassa Mine Complex Kirkland Lake Gold Canada (Ontario) (0.56 opt) 19.2 1.5 Moz Dec/2014
Turquoise Ridge Barrick USA (Nevada) 16.9 4.5 Moz Dec/2014
Pogo Gold Sumitomo Corp. USA 12.5 4.9Moz Dec/2013
Gosowong Newcrest Indonesia 12.0 1.2Moz Dec/2014
Moab Khotsong AngloGold Ashanti South Africa 10.0 6.1Moz Dec/2013
Mponeng AngloGold Ashanti South Africa 10.0 14.6Moz Dec/2013
Red Lake Gold Goldcorp Canada 10.0 2.1Moz Dec/2014
TauTona AngloGold Ashanti South Africa 9.1 1.4Moz Dec/2013
Kupol/Dvoinoye Kinross Russia 8.5 2.1Moz Dec/2014
19.2 16.9 12.5 12.0
10.0 10.0 10.0 9.1 8.5
0.05.0
10.015.020.025.0
Gra
de g
/t
Reserve Grades
www.klgold.com 8 TSX/AIM:KGI
Company Source – This is a select group of Companies that illustrate producing mines only with mineral reserves in excess of 1Moz’s (gold only, no equivalent Au ounces shown)

Reserves & Resources (Resources are Exclusive of Reserves)
See Appendix for more disclosure on MRMR statement which is as of December 31 ,2014.
Based on current level of Reserves and 70% conversion of Resources
(@ 200,000 oz p.a), KGI has a 14 year Mine Life
www.klgold.com 9 TSX/AIM:KGI
Property Wide
Mineral Reserves (P&P) Includes the ‘04 & Main Break and SMC
1.5 Moz’s 2.6M tons @ 0.56 opt
(19.2 g/t )
Mineral Resources (M&I) Includes the ‘04 & Main Break, SMC, Near Surface and other
2.0 Moz’s 4.2 M tons @ 0.49 opt
(16.8 g/t )
Mineral Resources (Inferred) Includes the ‘04 & Main Break, SMC, Near Surface and other
1.2 Moz’s 2.1 M tons @ 0.56 opt
(19.2 g/t)
SMC
0.9 Moz’s 1.5 M tons @ 0.65 opt
(22.3 g/t )
0.9 Moz’s 1.4 M tons @ 0.66 opt
(22.6 g/t )
0.9 Moz’s 1.4 M tons @ 0.65 opt
(22.3 g/t )
Breakout of SMC only

South Mine Complex
• Access from 5400L and 5600L allows delineation drilling of
resources, especially below 5600L
• Remains Open at Depth and Across Strike
5025 Level
P+P 28,000 Tons @ 0.48 oz/ton 14,000 Oz’s
M+I 74,000 Tons @ 0.42 oz/ton 32,000 Oz’s
5300 Level
P+P 561,000 Tons @ 0.47 oz/ton 261,000 Oz’s
M+I 245,000 Tons @ 0.43 oz/ton 107,000 Oz’s
5400 Level
P+P 370,000 Tons @ 0.61 oz/ton 226,000 Oz’s
M+I 174,000 Tons @ 0.42 oz/ton 72,000 Oz’s
5600 Level
P+P 239,000 Tons @ 0.77 oz/ton 183,000 Oz’s
M+I 186,000 Tons @ 0.63 oz/ton 117,000 Oz’s
Original Two
Mining Horizons
Third Level
Started May 2014
Developing to
Gain Access
for F2016
OPEN
#3 S
HA
FT
#2 W
INZ
E
www.klgold.com 10 TSX/AIM:KGI
Development Legend
Completed
F2016 Development
F2017 Development
OPEN
OPEN
5700 Level
P+P 202,000 Tons @ 1.03 oz/ton 208,000 Oz’s
M+I 164,000 Tons @ 0.91 oz/ton 96,000 Oz’s
5800 to 6600 Level
P+P 50,000 Tons @ 0.83 oz/ton 41,000 Oz’s
M+I 551,000 Tons @ 0.91 oz/ton 499,000 Oz’s *Drawing not to scale

Reserve Grade Vs Head Grade
0.46 OPT
15.8 GPT
0.65 OPT
22.3 GPT
0.56 OPT
19.2 GPT
0.35 OPT
12.0 GPT
0.46 OPT
15.8 GPT
0.44 OPT
15.1 GPT
Takes into account all proven and probable material from the ‘04 & Main Break, plus all proven and
probable material from all levels of the South Mine Complex.
December 31, 2014 Reserve Calculation
Assumes ~30% of Ore Tons from ‘04 & Main Break, and ~70% of Ore Tons from the 5025, 5300
and 5400 Levels in the South Mine Complex.
F2015 Mine Plan
www.klgold.com 11 TSX/AIM:KGI

F2015 Production Update
Q1 F2015
38,543
93,880
0.45
Q2 F2015
38,335
92,146
0.41
Q3 F2015
39,722
91,148
0.44
Q4 F2015
39,109
92,532
0.42
YTD F2015
155,709
369,706
0.43
Ounces
Sold
Tons
Milled
Head Grade
(opt)
• Fourth stope brought into production on 5400 level during Q4
• 2 Electric Hydraulic Jumbo’s fully operational
• Main ramp towards the 5600 level progressing well and is on schedule
www.klgold.com 12 TSX/AIM:KGI
* Production guidance revised upwards from 140,000 – 155,000 ounces to 153,000 – 157,000 ounces on March 11, 2015

Monthly Production Profile
• Cut-off Grades Raised from 0.18 opt to 0.22 opt.
• Stopped Mining “Incremental Tons”
• Implemented Strict Ore/ Waste Segregation UG
• Increasing UG Delineation Drilling in SMC
• Employing more UG Geologists
• Assay Lab is Manned 24/7
• Restructuring Organization
• Implementing Leadership Training
• Looking to Upgrade MIS
www.klgold.com 13 TSX/AIM:KGI
0.34
0.31 0.30
0.26
0.29
0.45
0.39
0.34
0.37
0.34
0.47
0.51
0.39
0.43
0.41
0.47
0.44
0.42
0.52
0.40
0.35
-
0.10
0.20
0.30
0.40
0.50
0
5,000
10,000
15,000
20,000
Aug Sep Oct Nov Dec Jan Feb Mar Apr May Jun Jul Aug Sep Oct Nov Dec Jan Feb Mar Apr
Oz Recovered
Head Grade
F2015
F2015 YTD Average 0.43 opt
Hea
d G
rad
e (
Ou
nc
es
Pe
r To
n)
Go
ld P
rod
ucti
on
(O
un
ce
s)

0.37
0.40
0.37
0.32
0.41 0.37
0.31
0.33
0.43
0.00
0.05
0.10
0.15
0.20
0.25
0.30
0.35
0.40
0.45
0.50
-
50,000
100,000
150,000
200,000
250,000
07 08 09 10 11 12 13 14 15 16
Go
ld O
un
ce
s
Oz Recovered Guidance Head Grade Linear (Oz Recovered)
Fiscal Year
Previous Guidance
0.43
Annual Production Profile
Expectation Gap
• Fiscal 2015 YTD Actual Head Grade is 0.43 opt Vs guided grade of 0.37 opt
• F2016 Production Guidance increased grade to 0.43 opt from 0.39 opt, assumes 96% recovery and average
throughput of 1,070 tpd. F2017 guidance is as stated in press release dated June 24, 2014
www.klgold.com 14 TSX/AIM:KGI
Hea
d G
rad
e (
Ou
nc
es
Pe
r To
n)
= 200 employees
Gu
ida
nce fo
r F
20
17
an
d F
20
18
will
be
rele
ase
d a
fte
r F
20
15
YE
ea
rnin
gs

Q3 Results
Q3/15 Vs Q3/14
YTD Results
F2015 Vs F2014
CO
ST
S
Cash Cost Per Ton $328
US$281
-5%
-13%
$340
US$302
0%
-7%
Cash Operating Cost Per
Ounce
$766
US$656
-30%
-36%
$813
US$728
-26%
-32%
All-In Cash Costs $1,249
US$1,070
-35%
-40%
$1,289
US$1,153
-38%
-42%
SA
LES
Gold Sales 39,722 +18% 116,600 +23%
Average Sales Price $1,371 0% $1,389 0%
Revenues $54.5MM +18% $161.9MM +24%
CA
SH
FLO
W
Cash Flow from Operations $23.7MM +85% $57.3MM +59%
Free Cash Flow $11.6MM NA $22.8MM NA
Q3 & YTD F2015 Financial Highlights
- All US$ equivalents are converted at the average CAD to USD exchange rate during the reporting period.
- See Pg. 23 for fiscal 2015 guidance on certain financial metrics provided above and Pg.24 in the appendix for further financial results.
www.klgold.com 15 TSX/AIM:KGI
CO
ST
S
SA
LES
C
AS
H
FLO
W
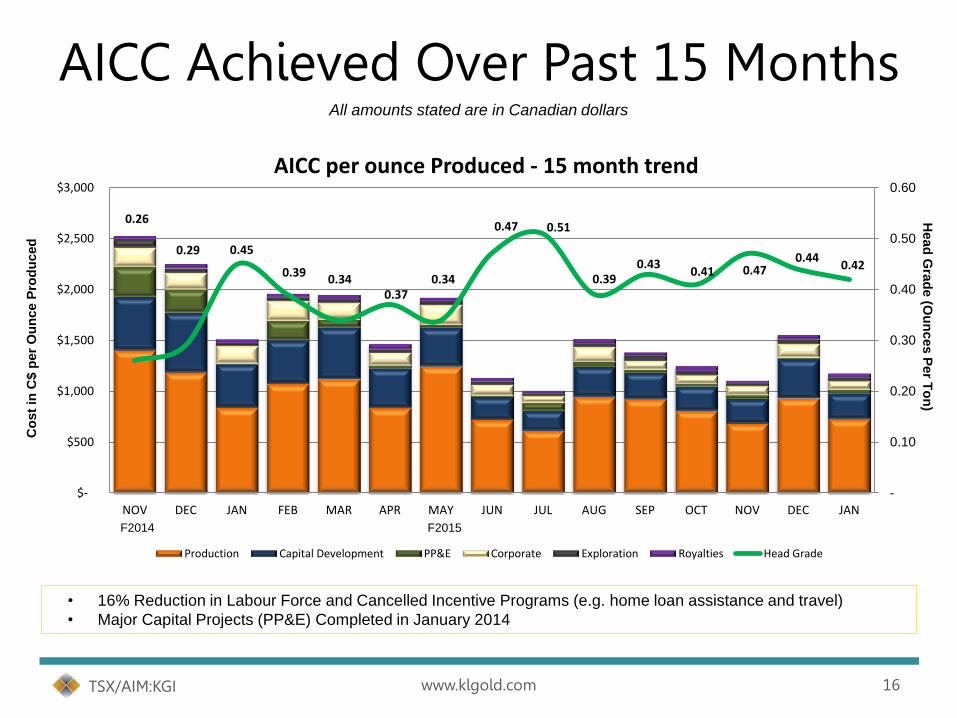
0.26
0.29 0.45
0.39 0.34
0.37 0.34
0.47 0.51
0.39 0.43
0.41 0.47 0.44
0.42
-
0.10
0.20
0.30
0.40
0.50
0.60
$-
$500
$1,000
$1,500
$2,000
$2,500
$3,000
NOV DEC JAN FEB MAR APR MAY2014
JUN JUL AUG SEP OCT NOV DEC JAN
AICC per ounce Produced - 15 month trend
Production Capital Development PP&E Corporate Exploration Royalties Head Grade
AICC Achieved Over Past 15 Months All amounts stated are in Canadian dollars
• 16% Reduction in Labour Force and Cancelled Incentive Programs (e.g. home loan assistance and travel)
• Major Capital Projects (PP&E) Completed in January 2014
www.klgold.com 16 TSX/AIM:KGI
Co
st
in C
$ p
er
Ou
nce P
rod
uced
H
ead
Gra
de (O
un
ces P
er T
on
)
F2014 F2015
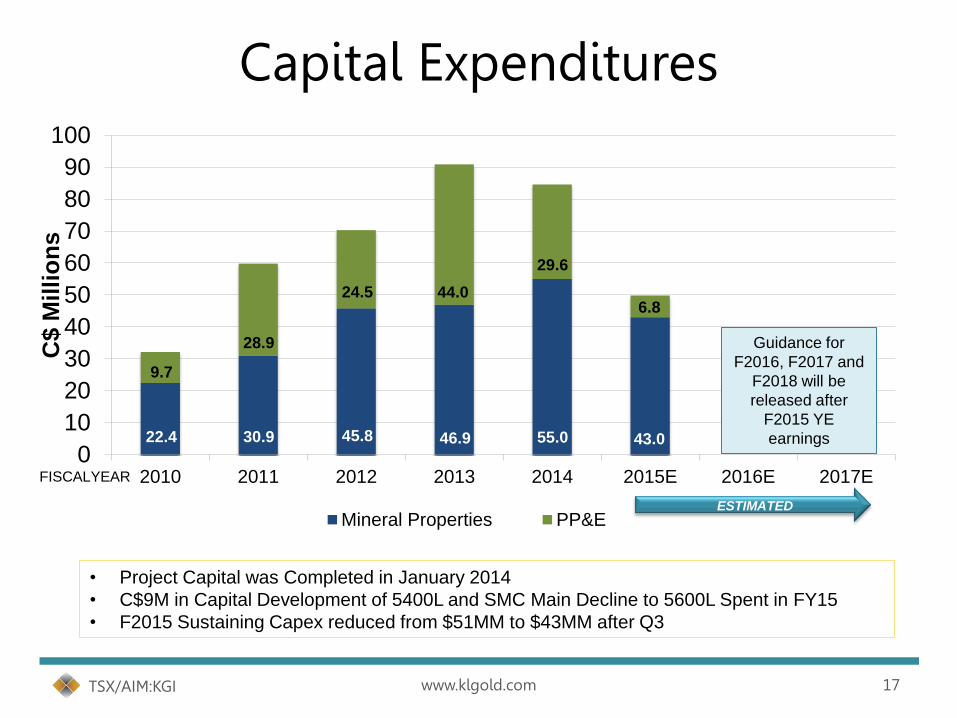
Capital Expenditures
• Project Capital was Completed in January 2014
• C$9M in Capital Development of 5400L and SMC Main Decline to 5600L Spent in FY15
• F2015 Sustaining Capex reduced from $51MM to $43MM after Q3
0
10
20
30
40
50
60
70
80
90
100
2010 2011 2012 2013 2014 2015E 2016E 2017E
C$ M
illi
on
s
Mineral Properties PP&EESTIMATED
9.7
22.4 30.9 45.8 46.9 55.0 43.0 51.0 51.0
28.9
24.5 44.0
29.6
6.8
www.klgold.com 17 TSX/AIM:KGI
FISCALYEAR
Guidance for
F2016, F2017 and
F2018 will be
released after
F2015 YE
earnings

Exploration Potential In A Historic Camp
www.klgold.com 18 TSX/AIM:KGI
Current Underground and
Surface Drilling Targets
Currently mining and
exploring on one of
these five targets.
Three main areas
currently being
explored from
surface and
underground.
Regional exploration
to test eastwards
along the Main Break
will be next phase of
drilling.

SMC Underground Drilling
www.klgold.com 19 TSX/AIM:KGI
UG DRILLING • SMC continues to be expanded
• Multi-ounce intersections
• 3 drills turning underground
• Open in multiple directions
53-2493 (NSZ)
1.85 opt/ 11.6 feet (63.43 gpt/ 3.5 metres)
53-2597 (NSZ)
0.36 opt/14.7 feet (12.34 gpt/ 4.5 metres)
53-2595 (NFZ)
3.55 opt/ 11.4 feet (121.72 gpt/ 3.5 metres)
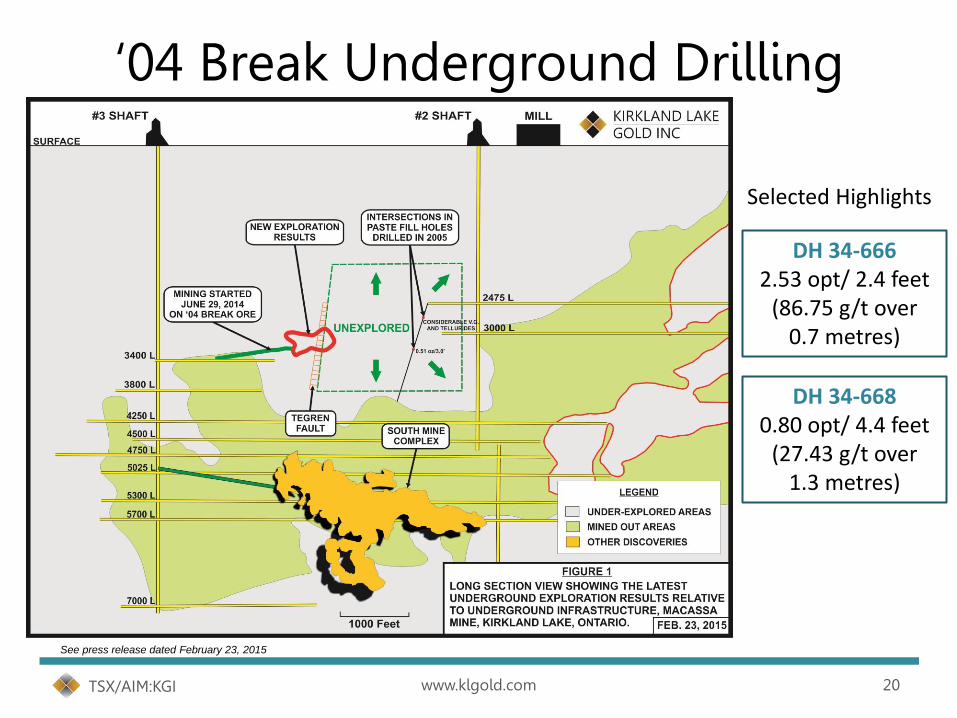
‘04 Break Underground Drilling
www.klgold.com 20 TSX/AIM:KGI
Selected Highlights
DH 34-666 2.53 opt/ 2.4 feet
(86.75 g/t over 0.7 metres)
DH 34-668 0.80 opt/ 4.4 feet
(27.43 g/t over 1.3 metres)
See press release dated February 23, 2015

Near Surface Exploration Target
• Near surface mineralization is within 2 Km’s of mill
• Mill has excess capacity of +/- 1,000 tpd
• Mineralization from 100’ to 1,000’ below surface
• Open across strike
• M&I 330,000 tons @0.34opt (11.7gpt) 112,000 oz
• Infer 100,000 tons @0.42opt (14.4gpt) 42,000 oz
www.klgold.com 21 TSX/AIM:KGI

Outlook for F2015
Guidance Metric YTD 2015
Actual
Revised
Guidance
$800 – 850/ Oz Cash Operating Cost Per Ounce $813
US$723 No Change
$1,250 - 1,350/ Oz AICC Per Ounce Produced $1,289
US$1,144 No Change
$58 million* Capital Expenditures $36 million $43 million
$200 million Revenue $162 million $218 - $222 million
$50 - 60 million Cash Flow from Operations $57 million $73 - $78 million
$15 - 20 million Free Cash Flow Generation $22 million $30 - $35 million
All amounts stated are in Canadian dollars
www.klgold.com 22 TSX/AIM:KGI
* Capital was revised from $58 million to $53 million on October 31, 2014, and revised to $50 million on January 31, 2015

APPENDIX
Notes, additional disclosure and other information
www.klgold.com 23 TSX/AIM:KGI

Analyst Coverage
Firm Analyst
Dundee Securities Joe Fazzini
CIBC World Markets Cosmos Chiu
Macquarie Capital Markets Michael Siperco
National Bank Financial Raj Ray
BMO Capital Markets Brian Quast
Clarus Securities Jamie Spratt
PI Financial Philip Ker
Firm Analyst
M Partners Derek Macpherson
Pareto Securities John McClintock
Mirabaud Securities Richard Morgan
Panmure Gordon & Co Alison Turner
Investec Bank Hunter Hillcoat
Very Independent Research John Tumazos
KIRKLAND LAKE GOLD IS FOLLOWED BY THE ANALYSTS LISTED ABOVE. THIS LIST IS PROVIDED FOR INFORMATION PURPOSES ONLY AND IS
SUBJECT TO CHANGE AS COVERAGE IS ADDED OR DROPPED BY A FIRM.
OPINIONS, ESTIMATES OR FORECASTS REGARDING KIRKLAND LAKE GOLD'S PERFORMANCE THAT ARE MADE BY THESE ANALYSTS ARE THEIRS
ALONE AND DO NOT REPRESENT THE OPINIONS, ESTIMATES OR FORECASTS OF KIRKLAND LAKE GOLD OR ITS MANAGEMENT.
KIRKLAND LAKE GOLD DOES NOT IMPLY ITS ENDORSEMENT OF, OR CONCURRENCE WITH, SUCH INFORMATION, CONCLUSIONS OR
RECOMMENDATIONS AND TAKES NO RESPONSIBILITY FOR MONITORING, SUPPLEMENTING OR CORRECTING ANY INFORMATION OR FORECASTS
PROVIDED BY THE ANALYSTS.
www.klgold.com 24 TSX/AIM:KGI

F2014 & Q3 F2015 Financial Results
Financial FY2015
YTD
FY2014
YTD Y/Y
Change Q3/15 Q2/15 Q3/14
Q3/15
vs.
Q2/15
Q3/15
vs.
Q3/14
Gold Sales
(ounces) 116,600 94,502 +23% 39,722 38,335 33,719 +4% +18%
Average Price Sold
(per ounce)
$1,389
US$1,243
$1,385
US$1,348
0%
- 6%
$1,371
US$1,175
$1,395
US$1,262
$1,369
US$1,280
-2%
-7%
0%
-8%
Revenue (000’s) 161,953 84,737 +24% 54,471 53,479 46,165 +2% +18%
Cash Operating
Cost per Ton
Produced
$340
US$302
$340
US$324
0%
-7%
$328
US$281
$350
US$317
$347
US$324
-6%
-11%
-5%
-13%
Cash Operating
Cost per Ounce
Produced
$813
US$723
$1,109
US$1,073
-26%
-32%
$766
US$656
$889
US$804
$1,094
US$1,023
-14%
-18%
-30%
-36%
All-in Cash Cost
(“AICC”) per Ounce
Produced
$1,289
US$1,144
$2,102
US$2,033
-38%
-42%
$1,249
US$1,070
$1,374
US$1,243
$1,923
US$1,797
-9%
-14%
-35%
-40%
All amounts stated are in Canadian dollars unless otherwise stated
www.klgold.com 25 TSX/AIM:KGI
- All US$ equivalents are converted at the average CAD to USD exchange rate during the reporting period.
- See Pg. 23 for fiscal 2015 guidance on certain financial metrics provided above

$1,073 $1,119
$836
$1,244
$720 $614
$947 $924 $809
$684
$931
$728
$1,250
$-
$200
$400
$600
$800
$1,000
$1,200
$1,400
$1,600
$1,800
$2,000
$2,200
FEB MAR APR MAY JUN JUL AUG SEP OCT NOV DEC JAN Q4E
Production Capital Development PP&E Corporate Exploration Royalties
AICC Projection for F2015 All amounts stated are in Canadian dollars
• Projection Based on Assumptions of 1,150 tpd, 0.37 opt and 96% Mill Recovery
• KGI now has three consecutive quarters of Free Cash Flow generation
• AICC excludes any mining and income tax (of which the Company only pays a nominal amount in mining taxes)
www.klgold.com 26 TSX/AIM:KGI
F2015
Co
st
in C
$ p
er
Ou
nce P
rod
uced
F2015_YTD Average Sales Price C$1,389
F2015_YTD AICC C$1,289

C$35MM Bought Deal Offering
www.klgold.com 27 TSX/AIM:KGI
Shares Issued Price
Gross Proceeds
C$30MM Offering 6,900,000 $4.35 $30MM
Over-allotment* 1,035,000 $4.35 $ 5MM
Total 7,935,000 $4.35 $35MM
Notes: - Over-allotment was exercised in full upon closing - Proceeds will be used to strengthen the balance sheet and for general
corporate purposes.

Expansion Capital
• Hoisting system capable of hoisting 3,600 tpd
• Mary-Anne Compartment installed in Shaft providing service cage
• Mill upgraded to handle 2,200 tpd
• Underground infrastructure and battery equipment in place for SMC
www.klgold.com 28 TSX/AIM:KGI

Reserve & Resource Estimates Resources are exclusive of Reserves
Grade Grade Au Grade Grade Au Grade Grade Au
opt g/t (000's) opt g/t (000's) opt g/t (000's)
'04 & Main Break 545 0.43 494 14.7 236 583 0.48 529 16.5 278 1,128 0.46 1023 15.8 514
South Mine Complex 346 0.51 314 17.5 177 1,120 0.69 1016 23.7 773 1,467 0.65 1,331 22.3 949
Macassa Mine Complex 891 0.46 808 15.8 412 1,703 0.62 1,545 21.3 1,051 2,595 0.56 2,354 19.2 1,463
Proven
Tonnes
(000's)
Tons
(000's)
Tonnes
(000's)
ZoneProbable Proven & Probable
Tons
(000's)
Tonnes
(000's)
Tons
(000's)
MINERAL RESERVES - As at December 31, 2014
Note: Columns may not add due to rounding. Macassa Mine Complex reserves the ’04 & Main Break and the SMC.
MINERAL RESOURCES - As at December 31, 2014
Grade Grade Au
opt g/t (000's)
04 & Main Break 485 0.41 440 14.1 201
SMC 1,358 0.65 1,232 22.3 876
Near Surface Target 100 0.42 91 14.4 42
Property Wide 2,114 0.56 1,918 19.2 1,777
ZoneTons (000's) Tonnes (000's)
InferredNote: Columns may not add due to rounding. Property Wide resources include the ’04 &
Main Break, SMC, Near Surface Target, as well as peripheral resources blocks (such as
the Lakeshore Ramp).
www.klgold.com 29 TSX/AIM:KGI
Grade Grade Au Grade Grade Au Grade Grade Au
opt g/t (000's) opt g/t (000's) opt g/t (000's)
04 & Main Break 1063 0.4 964 13.7 430 1148 0.42 1041 14.4 483 2,211 0.41 2006 14.1 913
SMC 33 0.37 30 12.7 12 1377 0.67 1249 23.0 917 1,410 0.66 1279 22.6 929
Near Surface Target - - - - - 330 0.34 299 11.7 112 330 0.34 299 11.7 112
Property Wide 1106 0.4 1003 13.7 447 3,096 0.52 2,809 17.8 1,599 4,202 0.49 3,812 16.8 2,047
Measured
Tons
(000's)
Tonnes
(000's)
ZoneIndicated Measured & Indicated
Tons
(000's)
Tonnes
(000's)
Tons
(000's)
Tonnes
(000's)

QP Info and Notes to Reserves & Resources The reserve and resource estimates have been audited and verified, and the technical disclosure in thie press release dated April 13, 2015, has been
approved, by the Company’s independent reserve and resource engineer, Glenn R. Clark, P. Eng., of Glenn R. Clark & Associates Limited. Mr. Clark
is a ‘qualified person’ under National Instrument 43-101, Standards of Disclosure for Mineral Projects, of the Canadian Securities Administrators. The
report detailing the December 31, 2014, reserve and resource estimates will be filed on SEDAR (www.sedar.com) within 45 days of this press release.
See ‘Notes for Reserves and Resources’ below for key assumptions, parameters and methods used to estimate the foregoing reserves and
resources.
Notes for Reserves and Resources:
The reserves and resources have been classified according to the Canadian Institute of Mining, Metallurgy and Petroleum (CIM) Standards on
Mineral Resources and Reserves: Definition and Guidelines (December 2005).
1. The reserves and resources are estimated using the polygonal method.
2. Resources do not include reserves.
3. All intersections are calculated to a 6.0 foot minimum horizontal mining width for structures dipping at greater than 45 degrees. The minimum
mining height for structures dipping less than 45 degrees is 9.0 feet.
4. Dilution is added to reserves at varying rates depending on the mining method, and the width of the ore. The average dilution of the reserves at
December 31, 2014, is 27% at 0.02 opt, marginally up from an average of 24.0% the previous year. Long-hole stopes are diluted by anywhere
between 50-100% (mostly 50%). Cut and fill stopes are diluted by anywhere between 10-50%.
5. All higher grades are cut to 3.50 opt. Based on a statistical analysis completed by Scott Wilson Roscoe Postle Associates Inc. in 2007, the
Company has implemented various higher grade cutting factors for four zones in the South Mine Complex. These four zones are the New South
Zone (7.20 opt), Lower D North (9.30 opt), Lower D North Footwall (4.80 opt), and the #7 and #7 HW Zones (6.40 opt). Cut-off grades of 0.22 opt
and 0.18 opt are used for reserve and resource calculations respectively, depending on the location, and economics of the block. Generally, a cut-
off of 0.22 opt is required on a whole-block basis to achieve profitability and reserve classification. It is possible to have sub-blocks within an ore
reserve block that assay less than any cut-off which have been incorporated for mining or geotechnical reasons. Ore blocks that grade between
0.18 opt and the cut-off of 0.22 opt have been classified as resource. The cut-off grade for near-surface resources (surface to -1,000 foot
elevation) is 0.12 opt. An internal report completed by Roscoe Postle and Associates in October 2014, suggest that the cutting factor for
mineralization on the Amalgamated Trend be set at 2.50 opt. This grade capping was implemented by the Company and incorporated in the
estimates for 2014.
6. The area of influence of the proven and measured categories are 30 feet from development chip samples, probable and indicated categories are
50 feet of radius from a known sample point (drill holes) and inferred is another 50 feet of influence (between 50 – 100 feet).
7. A 94.2% tonnage recovery is used. Continuity of the veins appears very good.
8. The assumptions used include CAD$1,350.00 (US$1,200) per ounce of gold.
9. The Company is not aware of any environmental, permitting, legal, title, taxation, socio-political, marketing or other issue that may materially affect
its estimate of mineral resources.
10. Mineral resources which are not mineral reserves do not have demonstrated economic viability.
www.klgold.com 30 TSX/AIM:KGI

WWW.KLGOLD.COM
Suzette N Ramcharan, CPIR
Director of Investor Relations
+1-416-840-7884
Mobile: +1-647-284-5315
Tim Blythe / Halimah Hussain
(Blytheweigh)
Investor Relations / PR
+44-207-138-3204
TSX /AIM: KGI