17 04 04 european gold forum - zurich
TRANSCRIPT
POSITIONINGFOR
SUSTAINABLEGROWTH
European Gold Forum, Zurich April 4-6, 2017
2RIC: TSX NYSE
2
RICHMONT MINESFORWARD-LOOKING STATEMENTSSafe Harbor Statement & Cautionary Note to U.S. Investors Concerning Resources Estimates
This presentation contains forward-looking statements that include risks and uncertainties. When used in this presentation, thewords “estimate”, “projects”, “anticipate”, “expects”, “intend”, “believe”, “hope”, “may”, and similar expressions, as well as “will”, “shall”,and other indications of future tense, are intended to identify forward-looking statements. The forward-looking statements are based oncurrent expectations and apply only as of the date on which they were made. Except as required by law or regulation, Richmontundertakes no obligation and disclaims any responsibility to publicly update or revise any forward-looking statements of information,whether as a result of new information, future events or otherwise. The factors that could cause actual results to differ materially fromthose indicated in such forward-looking statements include changes in the prevailing price of gold, the Canadian-U.S. exchange rate,grade of ore mined and unforeseen difficulties in mining operations that could affect revenue and production costs. Other factors suchas uncertainties regarding government regulations could also affect the results. Other risks may be detailed from time to timein Richmont Mines Inc.’s Annual Information Form and other public disclosure.
The resource estimates in this presentation were prepared in accordance with National Instrument 43-101 Standards of Disclosure ofMineral Projects (“NI 43-101”) adopted by the Canadian Securities Administrators. The requirements of NI 43-101 differ significantlyfrom the requirements of the United States Securities and Exchange Commission (the “SEC”). In this presentation, we use the terms“Measured”, “Indicated” and “Inferred” Resources. Although these terms are recognized and required to be used in Canada, theSEC does not recognize them. The SEC permits U.S. mining corporations, in their filings with the SEC, to disclose only those mineraldeposits that constitute “Reserves”. Under United States standards, mineralization may not be classified as a Reserve unless thedetermination has been made that the mineralization could be economically and legally extracted at the time the determination ismade. United States investors should not assume that all or any portion of a Measured or Indicated Resource will ever beconverted into “Reserves”. Furthermore, “Inferred Resources” have a great amount of uncertainty as to their existence and whetherthey can be mined economically or legally, and United States investors should not assume that “Inferred Resources” exist or can belegally or economically mined, or that they will ever be upgraded to a more certain category.
For additional information regarding the Mineral Reserves and Resources referred to in this presentation, please refer to the pressrelease dated Jan. 31, 2017 reporting Richmont Mines Mineral Reserve and Resource estimates as of Dec. 31, 2016.
U.S. Investors are urged to consider the disclosure in our annual report on Form 20-F, File No. 001-14598, which may be obtained fromus or from the SEC’s web site: http://sec.gov/edgar.shtml.
(All amounts are in Canadian dollars, unless otherwise indicated.)
3RIC: TSX NYSE
3
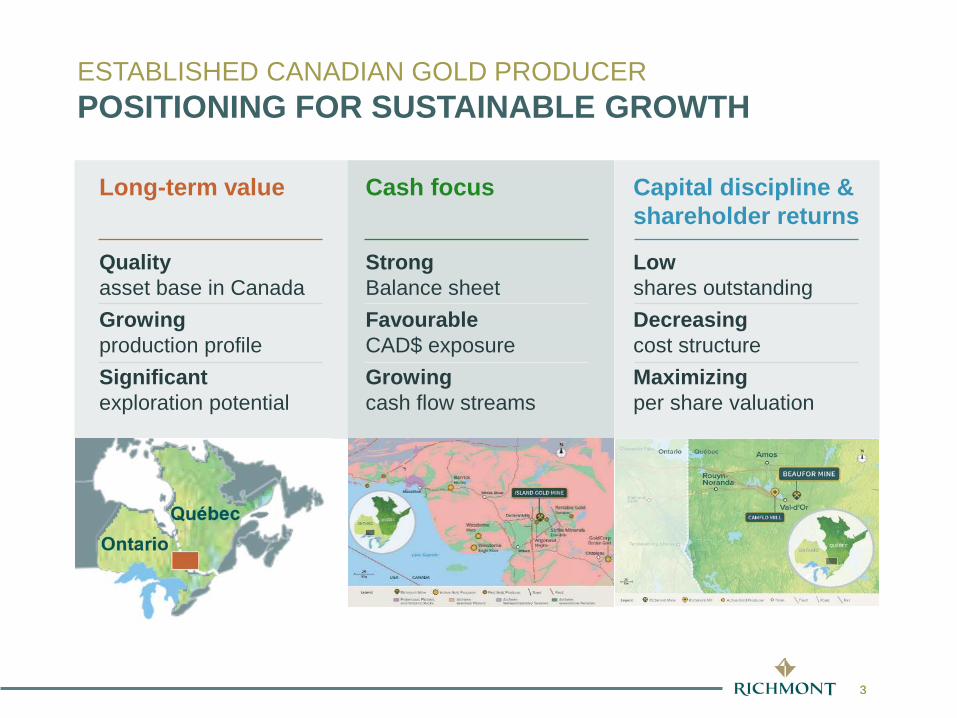
Long-term value
Quality asset base in CanadaGrowingproduction profileSignificant exploration potential
Capital discipline & shareholder returns
Lowshares outstandingDecreasingcost structureMaximizing per share valuation
Cash focus
Strong Balance sheetFavourableCAD$ exposureGrowingcash flow streams
ESTABLISHED CANADIAN GOLD PRODUCERPOSITIONING FOR SUSTAINABLE GROWTH
ontario
4RIC: TSX NYSE
4
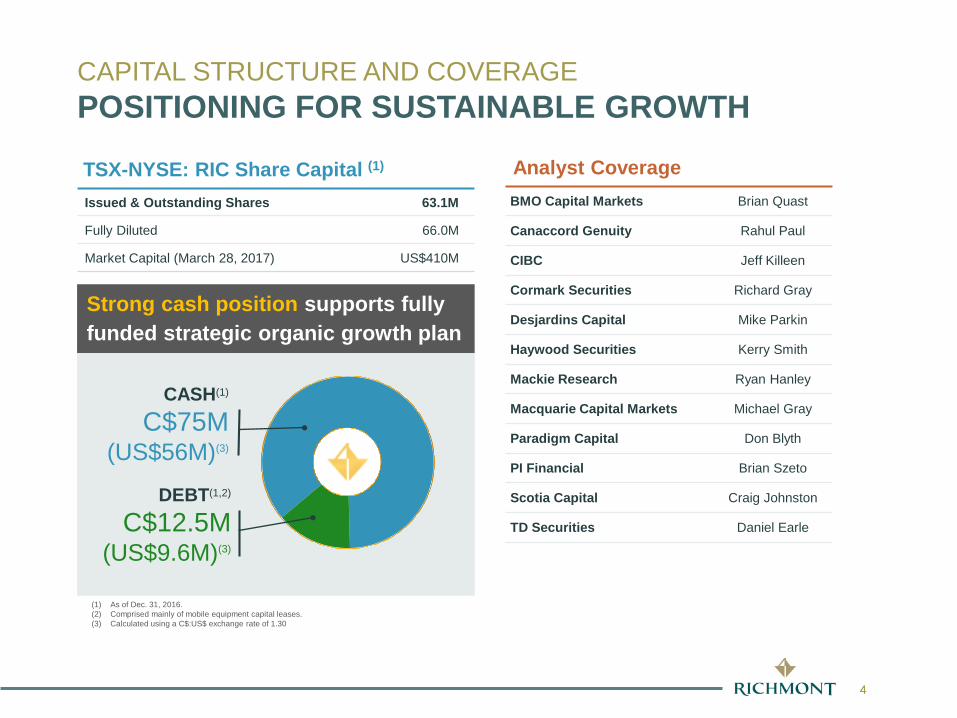
Strong cash position supports fully funded strategic organic growth plan
(1) As of Dec. 31, 2016.(2) Comprised mainly of mobile equipment capital leases.(3) Calculated using a C$:US$ exchange rate of 1.30
Analyst CoverageBMO Capital Markets Brian Quast
Canaccord Genuity Rahul Paul
CIBC Jeff Killeen
Cormark Securities Richard Gray
Desjardins Capital Mike Parkin
Haywood Securities Kerry Smith
Mackie Research Ryan Hanley
Macquarie Capital Markets Michael Gray
Paradigm Capital Don Blyth
PI Financial Brian Szeto
Scotia Capital Craig Johnston
TD Securities Daniel Earle
CAPITAL STRUCTURE AND COVERAGEPOSITIONING FOR SUSTAINABLE GROWTH
TSX-NYSE: RIC Share Capital (1)
Issued & Outstanding Shares 63.1M
Fully Diluted 66.0M
Market Capital (March 28, 2017) US$410M
CASH(1)
C$75M(US$56M)(3)
DEBT(1,2)
C$12.5M(US$9.6M)(3)

5RIC: TSX NYSE
5
• Permit amendments for 1,100 tpd expansion at Island Gold• Appointed Rob Chausse as CFO (March 2017)
RICHMONT OPERATIONS2016 HIGHLIGHTS
FOCUSED ON TARGETS2016
Results2016
Guidance(1) Scorecard
Gold produced (oz) 104,050 98,000-106,000 high end
Cash cost per oz (2) $908 $885-$945 in lineAISC per oz (2) $1,272 $1,230-$1,335 in lineCash cost per oz (2,3) $685 $675-$720 in lineAISC per oz (2,3) $960 $935-$1,015 in line
(1) 2016 guidance revised positively driven by significantly better than expected performance from the Island Gold Mine (refer to Press Release of September 12, 2016).(2) Refer to the Non-IFRS performance measures contained in the 2016 MD&A.(3) Assuming an exchange rate of 1.30 Canadian dollars to 1.0 US dollar.(4) Before changes in non-cash working capital.
C$
US$
2016 Full-Year Financial Results C$ US$
Revenue from mining operations $168.7 M $127.3 M
Adj. Operating cash flow, per share(2,4) $0.80 $0.62
Net earnings per share, basic $0.20 $0.15
6RIC: TSX NYSE
6
2012 2013 2014 2015 2016
Min
eral
Res
erve
s (0
00’s
oun
ces)
Monique Beaufor Island Gold
Island Gold
752 koz
Beaufor45 koz
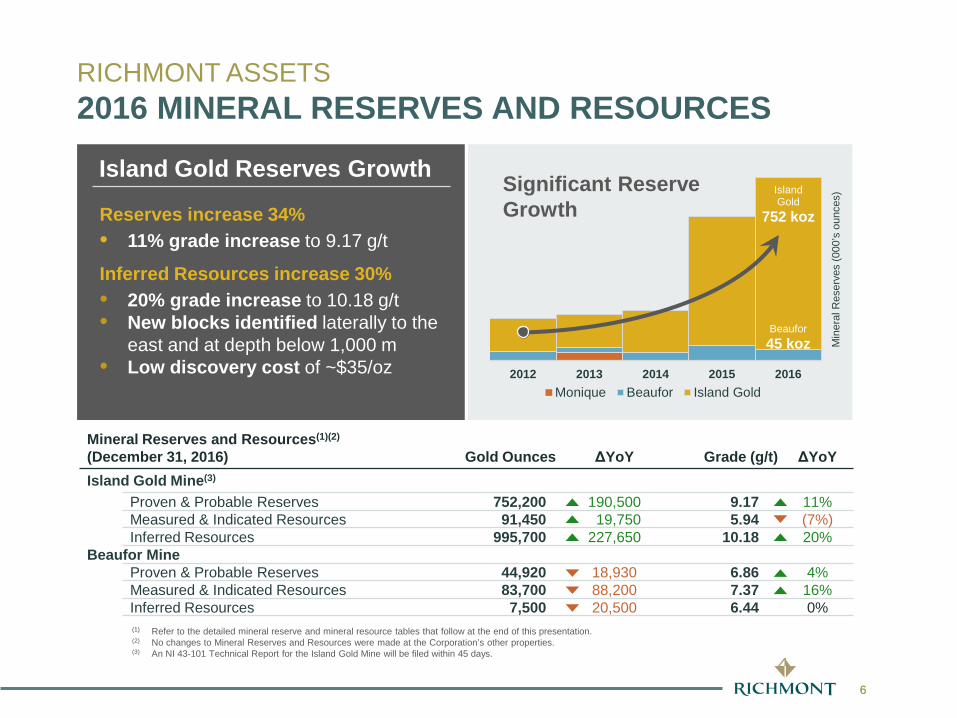
RICHMONT ASSETS2016 MINERAL RESERVES AND RESOURCES
Mineral Reserves and Resources(1)(2)
(December 31, 2016) Gold Ounces ΔYoY Grade (g/t) ΔYoYIsland Gold Mine(3)
Proven & Probable Reserves 752,200 190,500 9.17 11%Measured & Indicated Resources 91,450 19,750 5.94 (7%)Inferred Resources 995,700 227,650 10.18 20%
Beaufor MineProven & Probable Reserves 44,920 18,930 6.86 4%Measured & Indicated Resources 83,700 88,200 7.37 16%Inferred Resources 7,500 20,500 6.44 0%(1) Refer to the detailed mineral reserve and mineral resource tables that follow at the end of this presentation.(2) No changes to Mineral Reserves and Resources were made at the Corporation’s other properties.(3) An NI 43-101 Technical Report for the Island Gold Mine will be filed within 45 days.
Reserves increase 34%• 11% grade increase to 9.17 g/t
Inferred Resources increase 30%• 20% grade increase to 10.18 g/t• New blocks identified laterally to the
east and at depth below 1,000 m• Low discovery cost of ~$35/oz
Island Gold Reserves Growth Significant Reserve Growth
7RIC: TSX NYSE
7
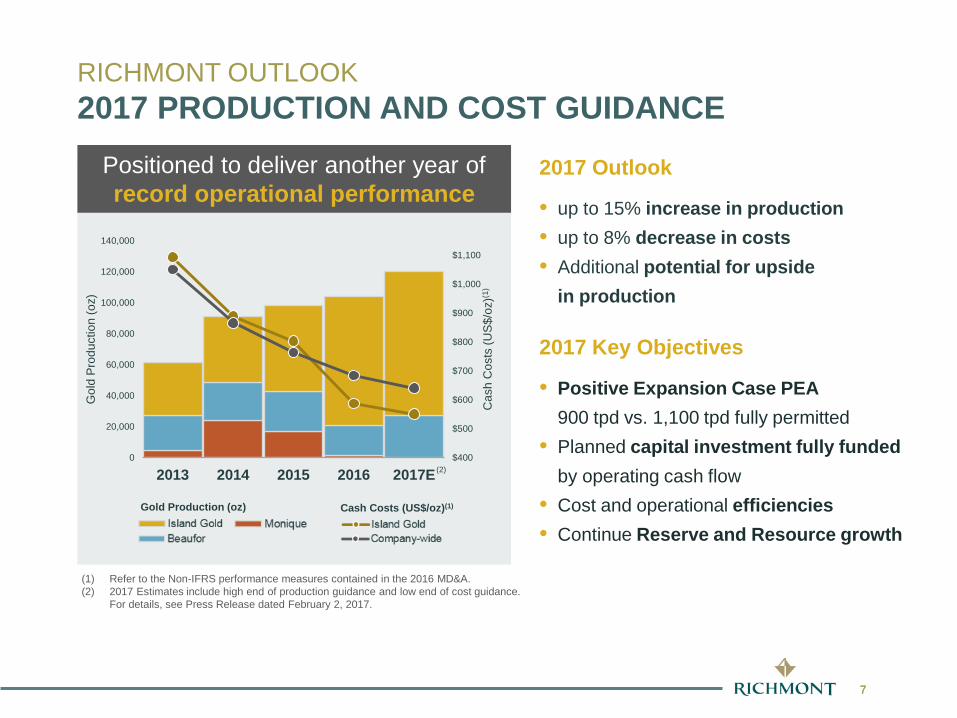
RICHMONT OUTLOOK2017 PRODUCTION AND COST GUIDANCE
(1) Refer to the Non-IFRS performance measures contained in the 2016 MD&A.(2) 2017 Estimates include high end of production guidance and low end of cost guidance.
For details, see Press Release dated February 2, 2017.
2017 Outlook
• up to 15% increase in production• up to 8% decrease in costs • Additional potential for upside
in production
2017 Key Objectives
• Positive Expansion Case PEA 900 tpd vs. 1,100 tpd fully permitted
• Planned capital investment fully funded by operating cash flow
• Cost and operational efficiencies• Continue Reserve and Resource growth
$400
$500
$600
$700
$800
$900
$1,000
$1,100
0
20,000
40,000
60,000
80,000
100,000
120,000
140,000
2013 2014 2015 2016 2017EC
ash
Cos
ts (U
S$/
oz)(1
)
Gol
d P
rodu
ctio
n (o
z)
Positioned to deliver another year of record operational performance
(2)
Cash Costs (US$/oz)(1)Gold Production (oz)
8RIC: TSX NYSE
8
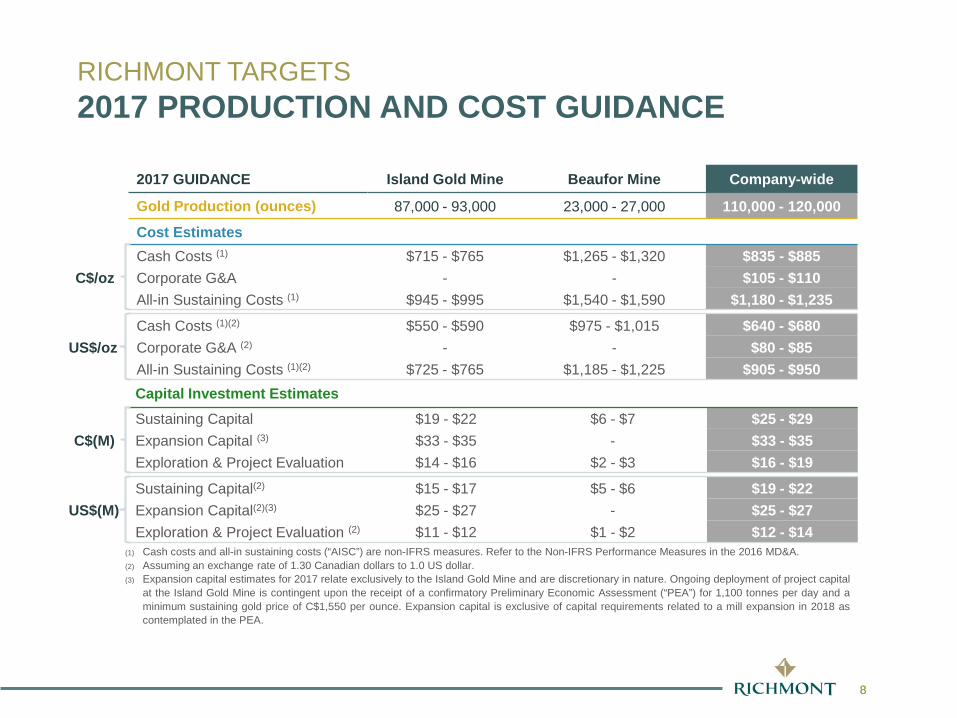
2017 GUIDANCE Island Gold Mine Beaufor Mine Company-wide
Gold Production (ounces) 87,000 - 93,000 23,000 - 27,000 110,000 - 120,000
Cost Estimates
C$/ozCash Costs (1) $715 - $765 $1,265 - $1,320 $835 - $885Corporate G&A - - $105 - $110All-in Sustaining Costs (1) $945 - $995 $1,540 - $1,590 $1,180 - $1,235
US$/ozCash Costs (1)(2) $550 - $590 $975 - $1,015 $640 - $680Corporate G&A (2) - - $80 - $85All-in Sustaining Costs (1)(2) $725 - $765 $1,185 - $1,225 $905 - $950Capital Investment Estimates
C$(M)Sustaining Capital $19 - $22 $6 - $7 $25 - $29Expansion Capital (3) $33 - $35 - $33 - $35Exploration & Project Evaluation $14 - $16 $2 - $3 $16 - $19
US$(M)Sustaining Capital(2) $15 - $17 $5 - $6 $19 - $22Expansion Capital(2)(3) $25 - $27 - $25 - $27Exploration & Project Evaluation (2) $11 - $12 $1 - $2 $12 - $14
(1) Cash costs and all-in sustaining costs (“AISC”) are non-IFRS measures. Refer to the Non-IFRS Performance Measures in the 2016 MD&A.(2) Assuming an exchange rate of 1.30 Canadian dollars to 1.0 US dollar.(3) Expansion capital estimates for 2017 relate exclusively to the Island Gold Mine and are discretionary in nature. Ongoing deployment of project capital
at the Island Gold Mine is contingent upon the receipt of a confirmatory Preliminary Economic Assessment (“PEA”) for 1,100 tonnes per day and aminimum sustaining gold price of C$1,550 per ounce. Expansion capital is exclusive of capital requirements related to a mill expansion in 2018 ascontemplated in the PEA.
RICHMONT TARGETS2017 PRODUCTION AND COST GUIDANCE
9RIC: TSX NYSE
9
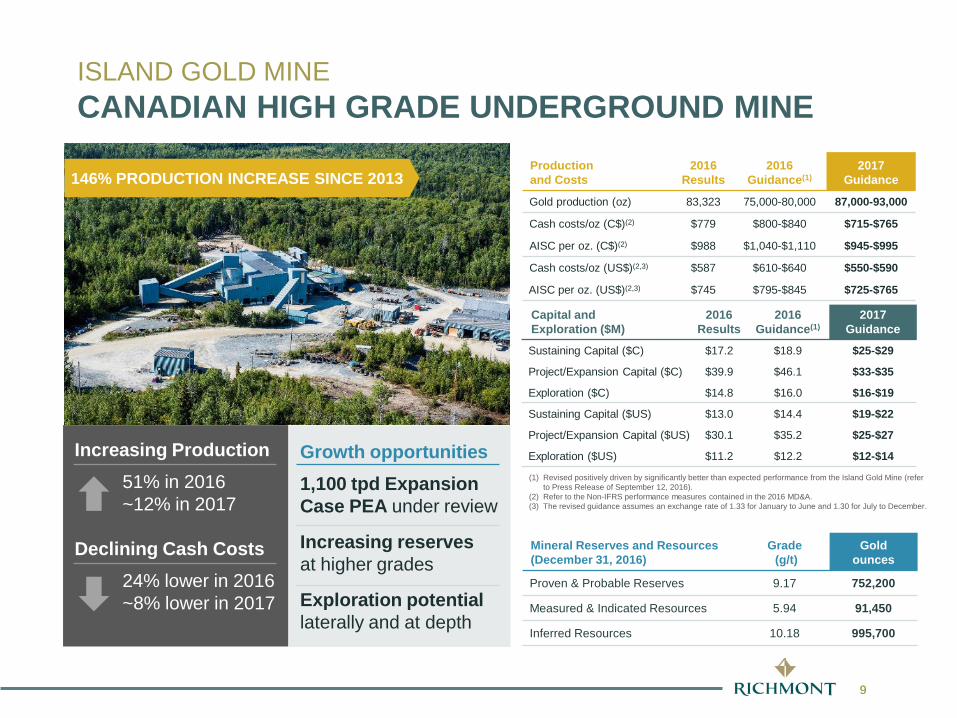
146% PRODUCTION INCREASE SINCE 2013
(1) Revised positively driven by significantly better than expected performance from the Island Gold Mine (refer to Press Release of September 12, 2016).
(2) Refer to the Non-IFRS performance measures contained in the 2016 MD&A.(3) The revised guidance assumes an exchange rate of 1.33 for January to June and 1.30 for July to December.
Productionand Costs
2016Results
2016Guidance(1)
2017Guidance
Gold production (oz) 83,323 75,000-80,000 87,000-93,000
Cash costs/oz (C$)(2) $779 $800-$840 $715-$765
AISC per oz. (C$)(2) $988 $1,040-$1,110 $945-$995
Cash costs/oz (US$)(2,3) $587 $610-$640 $550-$590
AISC per oz. (US$)(2,3) $745 $795-$845 $725-$765
Capital andExploration ($M)
2016Results
2016Guidance(1)
2017Guidance
Sustaining Capital ($C) $17.2 $18.9 $25-$29
Project/Expansion Capital ($C) $39.9 $46.1 $33-$35
Exploration ($C) $14.8 $16.0 $16-$19
Sustaining Capital ($US) $13.0 $14.4 $19-$22
Project/Expansion Capital ($US) $30.1 $35.2 $25-$27
Exploration ($US) $11.2 $12.2 $12-$14Increasing Production51% in 2016~12% in 2017
Declining Cash Costs24% lower in 2016~8% lower in 2017
ISLAND GOLD MINECANADIAN HIGH GRADE UNDERGROUND MINE
Growth opportunities1,100 tpd Expansion Case PEA under review
Increasing reservesat higher grades
Exploration potentiallaterally and at depth
Mineral Reserves and Resources (December 31, 2016)
Grade(g/t)
Gold ounces
Proven & Probable Reserves 9.17 752,200
Measured & Indicated Resources 5.94 91,450
Inferred Resources 10.18 995,700
10RIC: TSX NYSE
10
0.01.02.03.04.05.06.07.08.09.010.0
0
200
400
600
800
1,000
1,200
Gra
de (g
/t)
Und
ergr
ound
pro
duct
ivity
(tp
d)
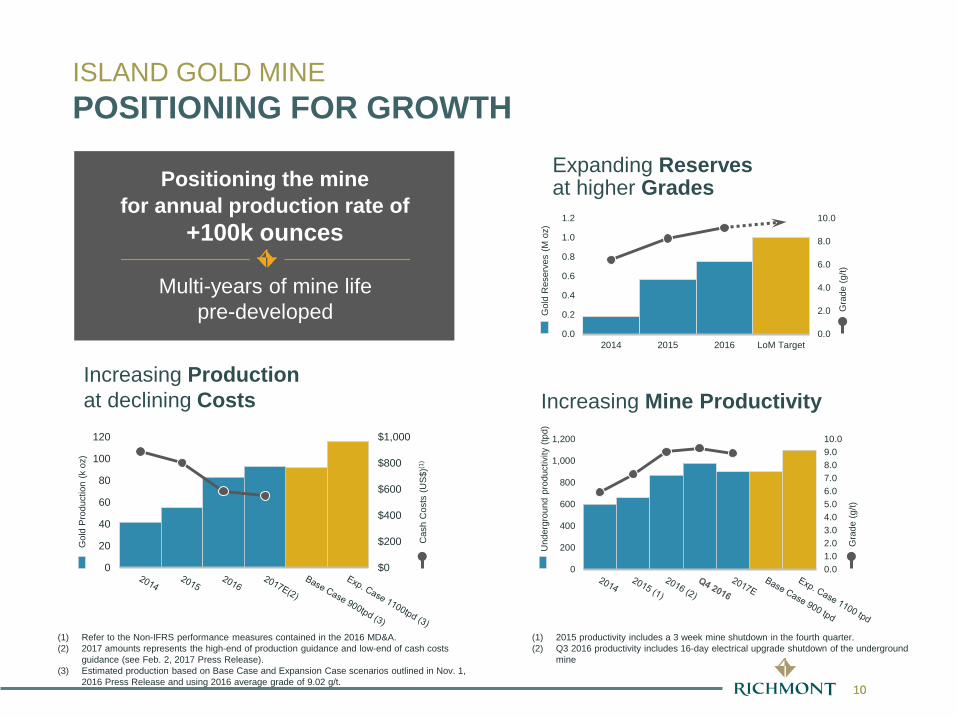
Positioning the mine for annual production rate of
+100k ounces
Multi-years of mine life pre-developed
Increasing Production at declining Costs
(1) Refer to the Non-IFRS performance measures contained in the 2016 MD&A.(2) 2017 amounts represents the high-end of production guidance and low-end of cash costs
guidance (see Feb. 2, 2017 Press Release). (3) Estimated production based on Base Case and Expansion Case scenarios outlined in Nov. 1,
2016 Press Release and using 2016 average grade of 9.02 g/t.
Increasing Mine Productivity
$0
$200
$400
$600
$800
$1,000
0
20
40
60
80
100
120C
ash
Cos
ts (U
S$)
(1)
Gol
d P
rodu
ctio
n (k
oz)
0.0
2.0
4.0
6.0
8.0
10.0
0.0
0.2
0.4
0.6
0.8
1.0
1.2
2014 2015 2016 LoM Target
Gra
de (g
/t)
Gol
d R
eser
ves
(M o
z)
Expanding Reserves at higher Grades
(1) 2015 productivity includes a 3 week mine shutdown in the fourth quarter.(2) Q3 2016 productivity includes 16-day electrical upgrade shutdown of the underground
mine
ISLAND GOLD MINEPOSITIONING FOR GROWTH
11RIC: TSX NYSE
11
GOUDREAULOCHALSH ISLAND EXT1
EXT2
- 500 m
340 m Level
190 m Level
W E
Crown pillar
Surface
EXPANSION CASE PEA AREA
1000 m Level
635 m Level
740 m Level
860 m Level
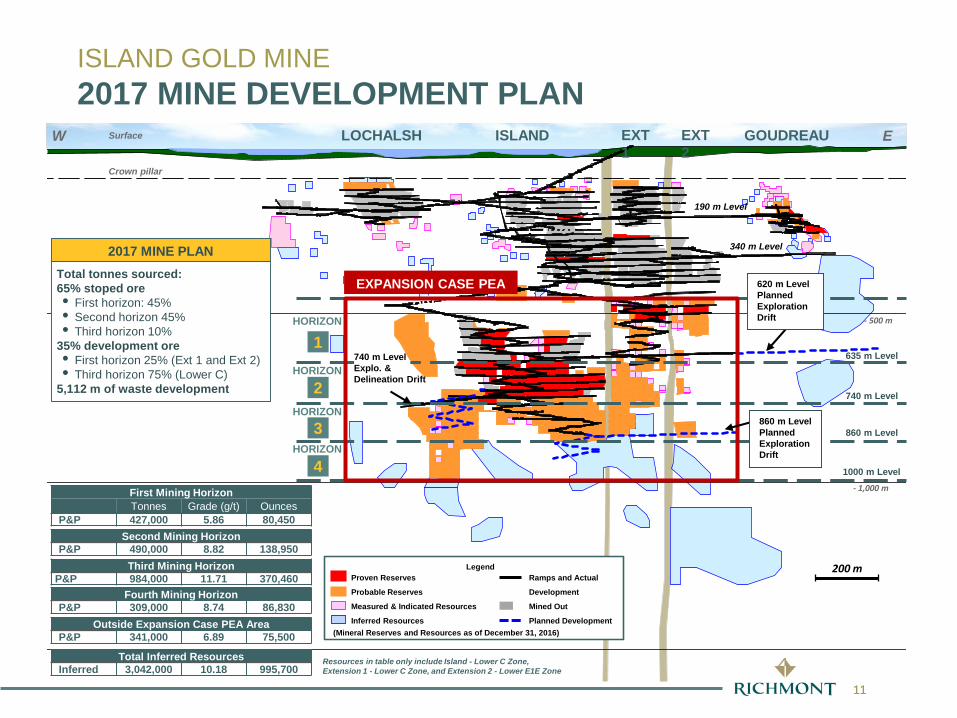
Third Mining Horizon P&P 984,000 11.71 370,460
Fourth Mining Horizon P&P 309,000 8.74 86,830
- 1,000 m
LegendProven Reserves
Probable Reserves
Measured & Indicated Resources
Inferred Resources
Ramps and Actual
Development
Mined Out
Planned Development
Resources in table only include Island - Lower C Zone, Extension 1 - Lower C Zone, and Extension 2 - Lower E1E Zone
200 m
620 m LevelPlannedExploration Drift
Total tonnes sourced:65% stoped ore• First horizon: 45%• Second horizon 45%• Third horizon 10%
35% development ore• First horizon 25% (Ext 1 and Ext 2)• Third horizon 75% (Lower C)
5,112 m of waste development
2017 MINE PLAN
860 m LevelPlannedExploration Drift
(Mineral Reserves and Resources as of December 31, 2016)
First Mining Horizon Tonnes Grade (g/t) Ounces
P&P 427,000 5.86 80,450
1740 m LevelExplo. & Delineation Drift
HORIZON
2
3
4
HORIZON
HORIZON
HORIZON
Outside Expansion Case PEA AreaP&P 341,000 6.89 75,500
Total Inferred ResourcesInferred 3,042,000 10.18 995,700
Second Mining HorizonP&P 490,000 8.82 138,950
ISLAND GOLD MINE2017 MINE DEVELOPMENT PLAN
12RIC: TSX NYSE
12
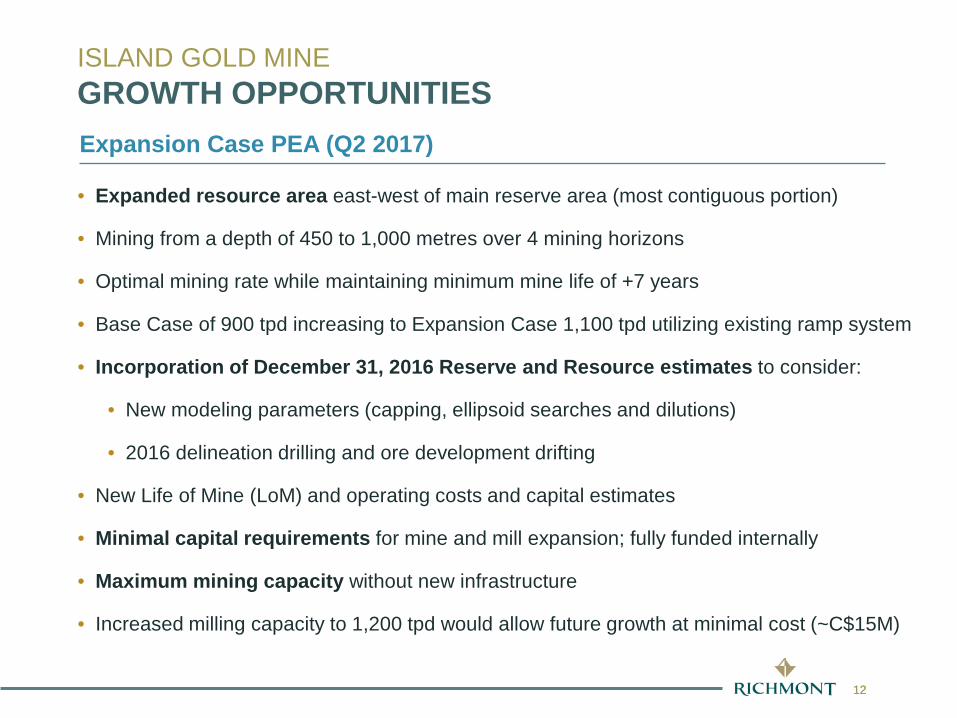
• Expanded resource area east-west of main reserve area (most contiguous portion)
• Mining from a depth of 450 to 1,000 metres over 4 mining horizons
• Optimal mining rate while maintaining minimum mine life of +7 years
• Base Case of 900 tpd increasing to Expansion Case 1,100 tpd utilizing existing ramp system
• Incorporation of December 31, 2016 Reserve and Resource estimates to consider:
• New modeling parameters (capping, ellipsoid searches and dilutions)
• 2016 delineation drilling and ore development drifting
• New Life of Mine (LoM) and operating costs and capital estimates
• Minimal capital requirements for mine and mill expansion; fully funded internally
• Maximum mining capacity without new infrastructure
• Increased milling capacity to 1,200 tpd would allow future growth at minimal cost (~C$15M)
Expansion Case PEA (Q2 2017)
ISLAND GOLD MINEGROWTH OPPORTUNITIES
13RIC: TSX NYSE
13
ISLAND GOLD MINE2017 DRILLING PROGRAM
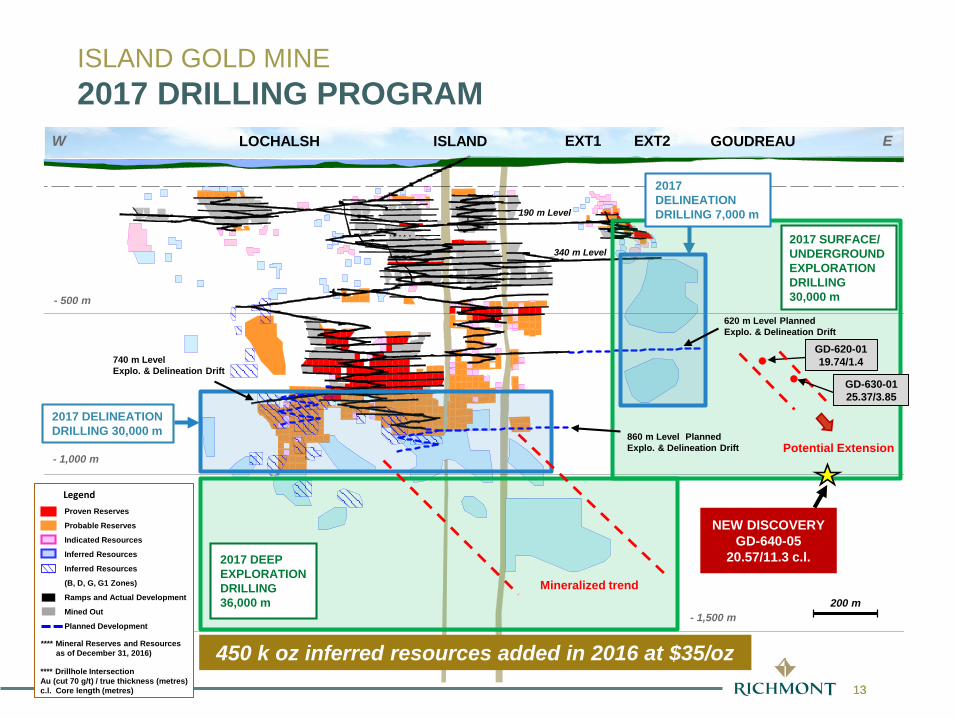
620 m Level PlannedExplo. & Delineation Drift
860 m Level PlannedExplo. & Delineation Drift
GOUDREAULOCHALSH ISLAND EXT1 EXT2
- 500 m
- 1,500 m
W E
340 m Level
190 m Level
740 m LevelExplo. & Delineation Drift
- 1,000 m
200 mMineralized trend
2017 DELINEATION DRILLING 30,000 m
2017 DEEP EXPLORATION DRILLING 36,000 m
Proven Reserves
Probable Reserves
Indicated Resources
Inferred Resources
Inferred Resources
(B, D, G, G1 Zones)
Ramps and Actual Development
Mined Out
Planned Development
Legend
**** Mineral Reserves and Resources as of December 31, 2016)
2017 DELINEATION DRILLING 7,000 m
2017 SURFACE/ UNDERGROUNDEXPLORATION DRILLING 30,000 m
450 k oz inferred resources added in 2016 at $35/oz
GD-630-0125.37/3.85
GD-620-0119.74/1.4
NEW DISCOVERYGD-640-05
20.57/11.3 c.l.
Potential Extension
**** Drillhole IntersectionAu (cut 70 g/t) / true thickness (metres)c.l. Core length (metres)
14RIC: TSX NYSE
14
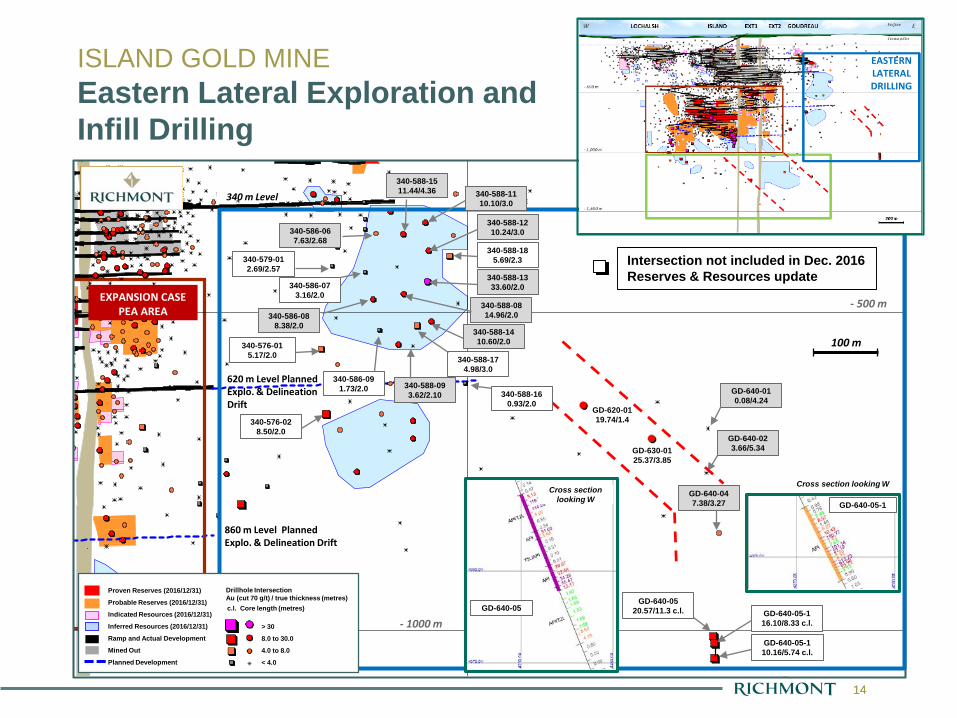
340 m Level
- 500 m
340-588-093.62/2.10
340-588-1110.10/3.0
340-588-1210.24/3.0
340-588-1333.60/2.0
340-588-1410.60/2.0
340-588-1511.44/4.36
GD-640-047.38/3.27
340-588-185.69/2.3
340-588-174.98/3.0
EXPANSION CASE PEA AREA
620 m Level PlannedExplo. & DelineationDrift
860 m Level PlannedExplo. & Delineation Drift
- 1000 m
GD-640-0520.57/11.3 c.l.
340-576-028.50/2.0
340-576-015.17/2.0
340-586-091.73/2.0
340-586-088.38/2.0
340-579-012.69/2.57
340-586-067.63/2.68
340-586-073.16/2.0
340-588-0814.96/2.0
GD-640-05-110.16/5.74 c.l.
GD-620-0119.74/1.4
GD-630-0125.37/3.85
GD-640-05-1
Cross section looking W
GD-640-05-116.10/8.33 c.l.
GD-640-05
GD-640-023.66/5.34
GD-640-010.08/4.24
Cross section looking W
EASTERN LATERALDRILLING
ISLAND GOLD MINEEastern Lateral Exploration andInfill Drilling
Proven Reserves (2016/12/31)
Probable Reserves (2016/12/31)
Indicated Resources (2016/12/31)
Inferred Resources (2016/12/31)
Ramp and Actual Development
Mined Out
Planned Development
Intersection not included in Dec. 2016 Reserves & Resources update
340-588-160.93/2.0
100 m
> 30
8.0 to 30.0
4.0 to 8.0
< 4.0
Drillhole IntersectionAu (cut 70 g/t) / true thickness (metres)c.l. Core length (metres)
15RIC: TSX NYSE
15
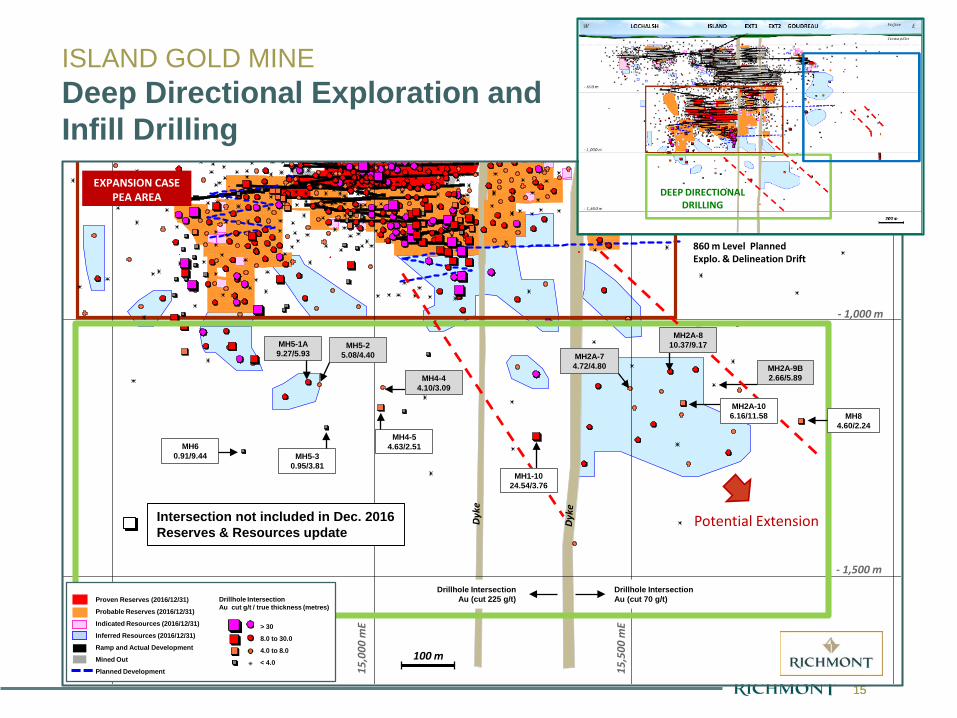
15,5
00 m
E
15,0
00 m
E
Dyke
MH5-1A9.27/5.93
MH4-44.10/3.09
MH5-25.08/4.40
MH4-54.63/2.51
MH2A-74.72/4.80
- 1,500 m
- 1,000 m
100 m
EXPANSION CASE PEA AREA
860 m Level PlannedExplo. & Delineation Drift
MH2A-9B2.66/5.89
MH84.60/2.24
MH5-30.95/3.81
MH60.91/9.44
Drillhole IntersectionAu (cut 225 g/t)
Drillhole IntersectionAu (cut 70 g/t)
Potential Extension
MH1-1024.54/3.76
MH2A-810.37/9.17
MH2A-106.16/11.58
DEEP DIRECTIONAL DRILLING
ISLAND GOLD MINEDeep Directional Exploration andInfill Drilling
Proven Reserves (2016/12/31)
Probable Reserves (2016/12/31)
Indicated Resources (2016/12/31)
Inferred Resources (2016/12/31)
Ramp and Actual Development
Mined Out
Planned Development
> 30
8.0 to 30.0
4.0 to 8.0
< 4.0
Drillhole IntersectionAu cut g/t / true thickness (metres)
Intersection not included in Dec. 2016 Reserves & Resources update
16RIC: TSX NYSE
16
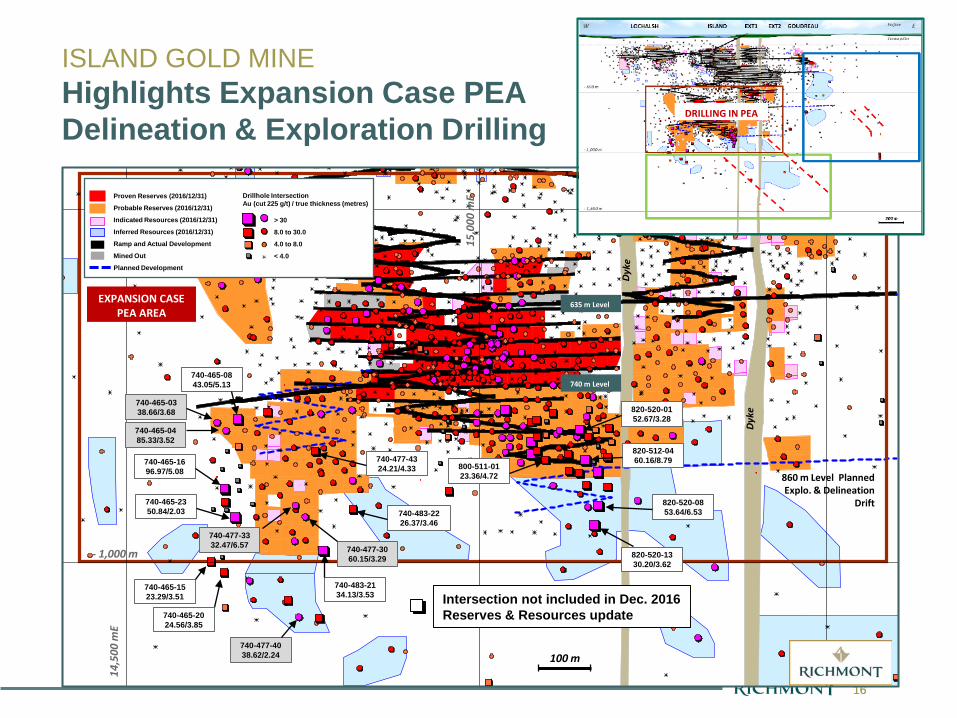
14,5
00 m
E
15,0
00 m
E
Dyke
- 1,000 m
100 m
EXPANSION CASE PEA AREA
860 m Level PlannedExplo. & Delineation
Drift
740-477-4038.62/2.24
740-465-1523.29/3.51
740-465-0338.66/3.68
740-465-0485.33/3.52
740-465-0843.05/5.13
740-477-3060.15/3.29
740-477-4324.21/4.33
820-520-1330.20/3.62
820-520-0853.64/6.53
820-512-0460.16/8.79
820-520-0152.67/3.28
800-511-0123.36/4.72
740-477-3332.47/6.57
740-465-2024.56/3.85
740-483-2134.13/3.53
740-483-2226.37/3.46
740-465-1696.97/5.08
740-465-2350.84/2.03
635 m Level
740 m Level
DRILLING IN PEA
ISLAND GOLD MINEHighlights Expansion Case PEADelineation & Exploration Drilling
Proven Reserves (2016/12/31)
Probable Reserves (2016/12/31)
Indicated Resources (2016/12/31)
Inferred Resources (2016/12/31)
Ramp and Actual Development
Mined Out
Planned Development
> 30
8.0 to 30.0
4.0 to 8.0
< 4.0
Drillhole IntersectionAu (cut 225 g/t) / true thickness (metres)
Intersection not included in Dec. 2016 Reserves & Resources update
17RIC: TSX NYSE
17
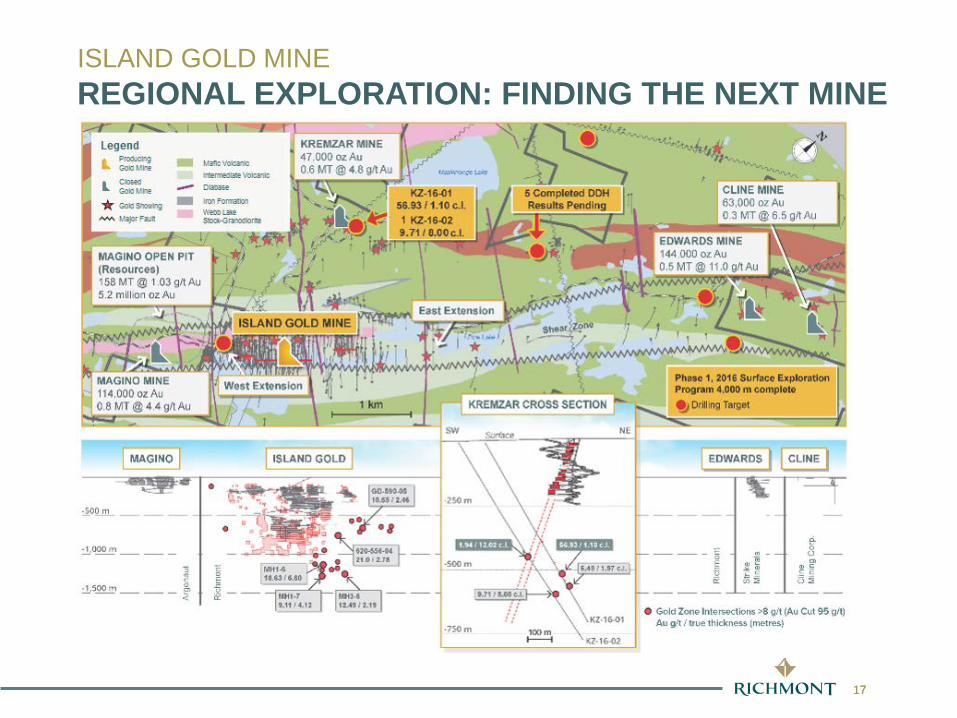
ISLAND GOLD MINEREGIONAL EXPLORATION: FINDING THE NEXT MINE
18RIC: TSX NYSE
18
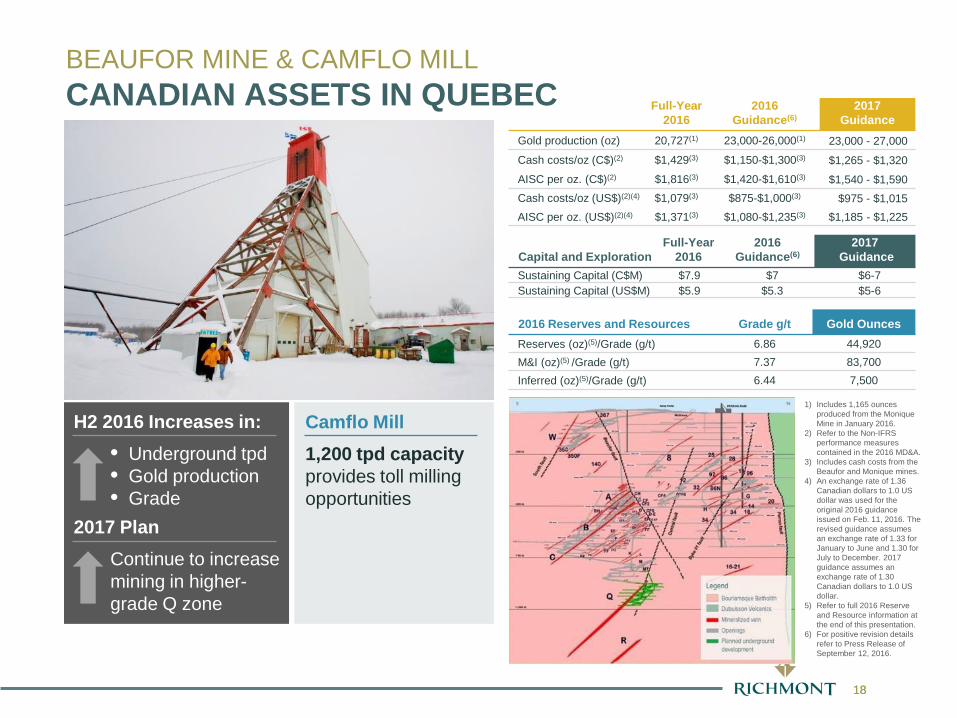
1) Includes 1,165 ounces produced from the Monique Mine in January 2016.
2) Refer to the Non-IFRS performance measures contained in the 2016 MD&A.
3) Includes cash costs from the Beaufor and Monique mines.
4) An exchange rate of 1.36 Canadian dollars to 1.0 US dollar was used for the original 2016 guidance issued on Feb. 11, 2016. The revised guidance assumes an exchange rate of 1.33 for January to June and 1.30 for July to December. 2017 guidance assumes an exchange rate of 1.30 Canadian dollars to 1.0 US dollar.
5) Refer to full 2016 Reserve and Resource information at the end of this presentation.
6) For positive revision details refer to Press Release of September 12, 2016.
Full-Year2016
2016Guidance(6)
2017Guidance
Gold production (oz) 20,727(1) 23,000-26,000(1) 23,000 - 27,000
Cash costs/oz (C$)(2) $1,429(3) $1,150-$1,300(3) $1,265 - $1,320
AISC per oz. (C$)(2) $1,816(3) $1,420-$1,610(3) $1,540 - $1,590Cash costs/oz (US$)(2)(4) $1,079(3) $875-$1,000(3) $975 - $1,015AISC per oz. (US$)(2)(4) $1,371(3) $1,080-$1,235(3) $1,185 - $1,225
Capital and ExplorationFull-Year
20162016
Guidance(6)2017
GuidanceSustaining Capital (C$M) $7.9 $7 $6-7Sustaining Capital (US$M) $5.9 $5.3 $5-6
2016 Reserves and Resources Grade g/t Gold OuncesReserves (oz)(5)/Grade (g/t) 6.86 44,920M&I (oz)(5) /Grade (g/t) 7.37 83,700Inferred (oz)(5)/Grade (g/t) 6.44 7,500
BEAUFOR MINE & CAMFLO MILLCANADIAN ASSETS IN QUEBEC
H2 2016 Increases in:• Underground tpd• Gold production• Grade
2017 PlanContinue to increase mining in higher-grade Q zone
Camflo Mill1,200 tpd capacity provides toll milling opportunities
19RIC: TSX NYSE
19
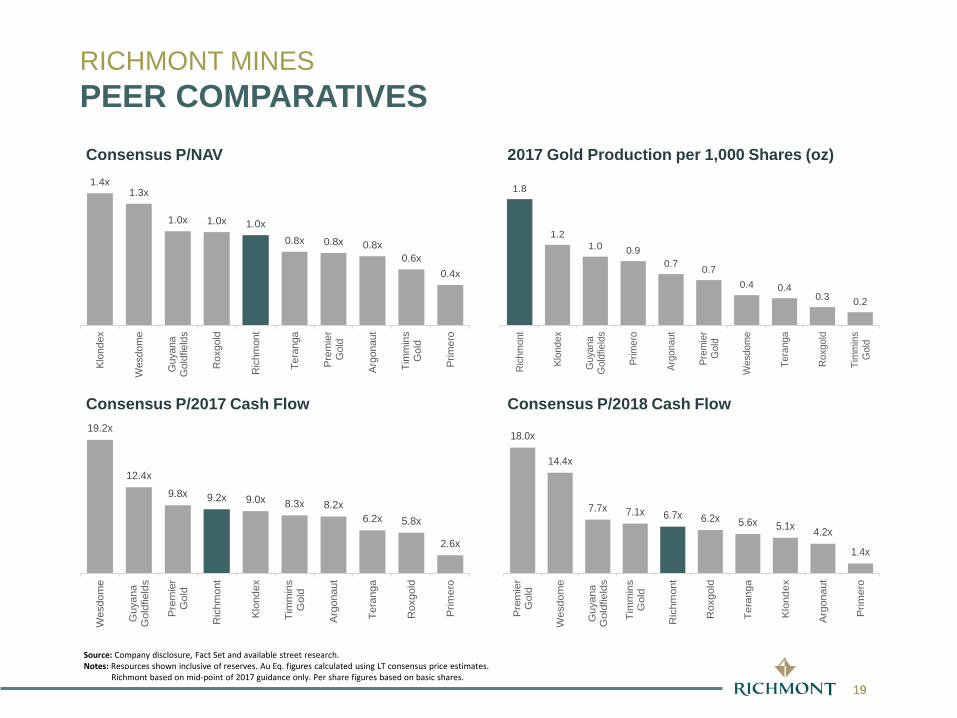
Source: Company disclosure, Fact Set and available street research.Notes: Resources shown inclusive of reserves. Au Eq. figures calculated using LT consensus price estimates.
Richmont based on mid-point of 2017 guidance only. Per share figures based on basic shares.
RICHMONT MINESPEER COMPARATIVES
19.2x
12.4x
9.8x 9.2x 9.0x 8.3x 8.2x6.2x 5.8x
2.6x
Wes
dom
e
Guy
ana
Gol
dfie
lds
Pre
mie
rG
old
Ric
hmon
t
Klo
ndex
Tim
min
sG
old
Arg
onau
t
Tera
nga
Rox
gold
Prim
ero
18.0x
14.4x
7.7x 7.1x 6.7x 6.2x 5.6x 5.1x 4.2x
1.4x
Pre
mie
rG
old
Wes
dom
e
Guy
ana
Gol
dfie
lds
Tim
min
sG
old
Ric
hmon
t
Rox
gold
Tera
nga
Klo
ndex
Arg
onau
t
Prim
ero
Consensus P/2017 Cash Flow Consensus P/2018 Cash Flow
1.4x1.3x
1.0x 1.0x 1.0x0.8x 0.8x 0.8x
0.6x0.4x
Klon
dex
Wes
dom
e
Guy
ana
Gol
dfie
lds
Rox
gold
Ric
hmon
t
Tera
nga
Prem
ier
Gol
d
Argo
naut
Tim
min
sG
old
Prim
ero
2017 Gold Production per 1,000 Shares (oz) Consensus P/NAV
1.8
1.21.0 0.9
0.7 0.70.4 0.4
0.3 0.2
Ric
hmon
t
Klon
dex
Guy
ana
Gol
dfie
lds
Prim
ero
Argo
naut
Prem
ier
Gol
d
Wes
dom
e
Tera
nga
Rox
gold
Tim
min
sG
old
20RIC: TSX NYSE
20
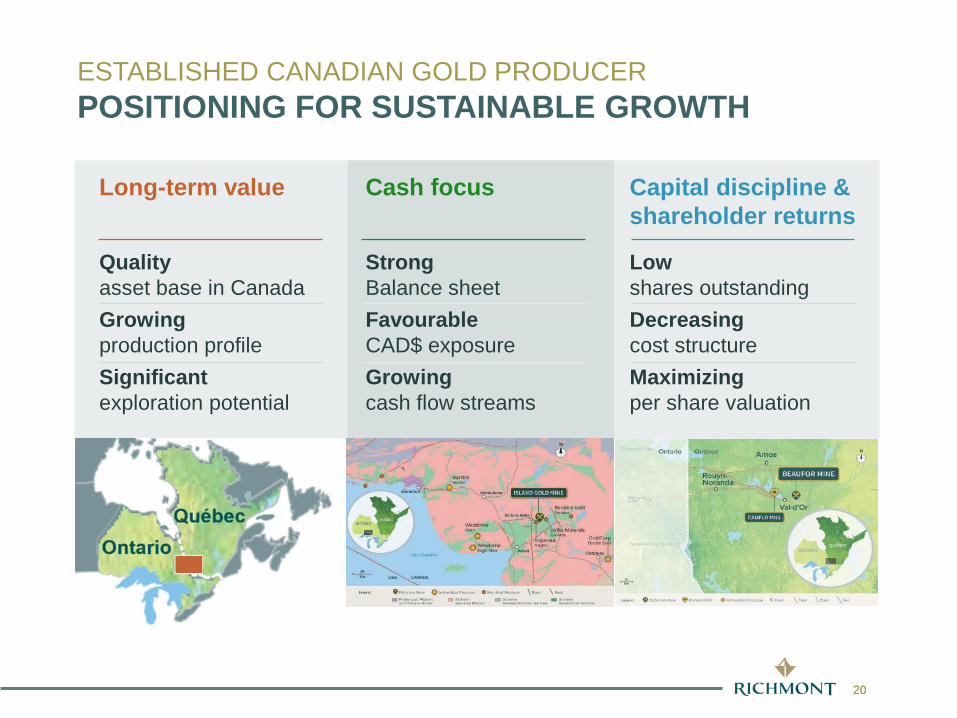
Long-term value
Quality asset base in CanadaGrowingproduction profileSignificant exploration potential
Capital discipline & shareholder returns
Lowshares outstandingDecreasingcost structureMaximizing per share valuation
Cash focus
Strong Balance sheetFavourableCAD$ exposureGrowingcash flow streams
ESTABLISHED CANADIAN GOLD PRODUCERPOSITIONING FOR SUSTAINABLE GROWTH
ontario
www.richmont-mines.com
APPENDIX
22RIC: TSX NYSE
22
MÉLISSA TARDIFLLB
Lawyer and Corporate Secretary
RICHMONT MINESMANAGEMENT TEAM
RENAUD ADAMSP. ENGPresident andChief Executive Officer
STEVE BURLETONCFA, MBA
Vice-President,Business Development
ROB CHAUSSECPA, CA
Chief Financial Officer
CHRISTIAN BOURCIERP. ENGVice-President,Operations
NICOLE VEILLEUXCPA, CAVice-PresidentFinance
ANNE DAYMBA, ICD.DSenior Vice-President,Investor Relations
DANIEL ADAMGEO PHDVice-PresidentExploration
23RIC: TSX NYSE
23
RENÉ MARIONP. ENG
Chairman of the Board and Chair of the Technical and Corporate Responsibility Committee
MICHAEL PESNERCA
Director and Chairof the Audit Committee
RENAUD ADAMSP. ENG
Director, President andChief Executive Officer
PETER BARNESCA
Director and Chair of the Human Resources and Compensation Committee
ELAINE ELLINGHAMP. Geo., MBA
Director and Chair of the Governance and Nominating Committee
RICHMONT MINESBOARD OF DIRECTORS
24RIC: TSX NYSE
24
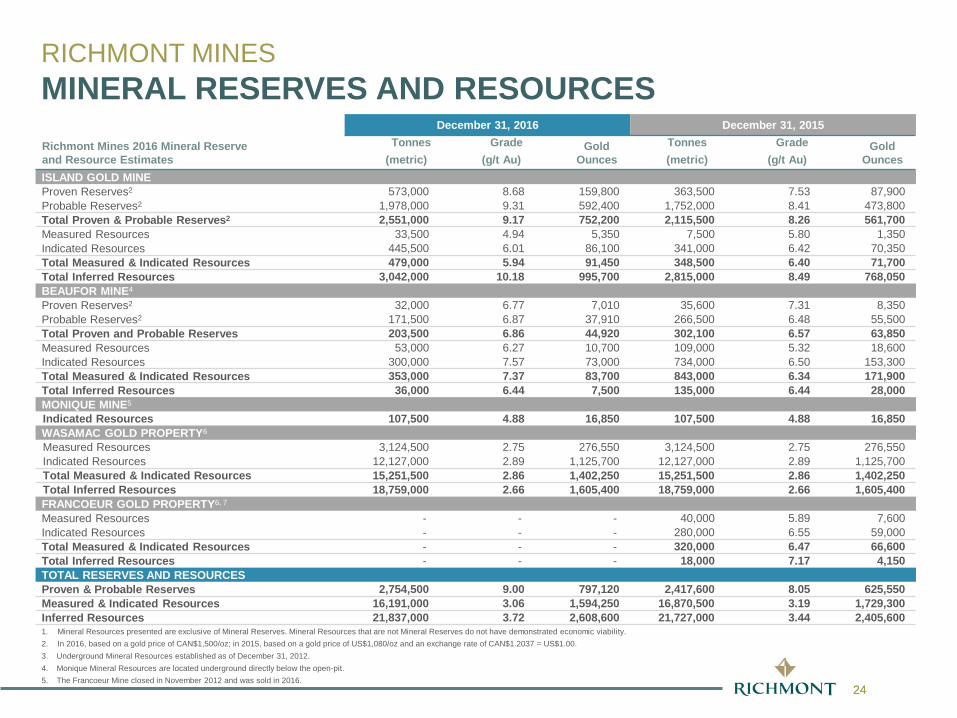
1. Mineral Resources presented are exclusive of Mineral Reserves. Mineral Resources that are not Mineral Reserves do not have demonstrated economic viability.2. In 2016, based on a gold price of CAN$1,500/oz; in 2015, based on a gold price of US$1,080/oz and an exchange rate of CAN$1.2037 = US$1.00.3. Underground Mineral Resources established as of December 31, 2012.4. Monique Mineral Resources are located underground directly below the open-pit.5. The Francoeur Mine closed in November 2012 and was sold in 2016.
Richmont Mines 2016 Mineral Reserve and Resource Estimates
December 31, 2016 December 31, 2015Tonnes Grade Gold
OuncesTonnes Grade Gold
Ounces(metric) (g/t Au) (metric) (g/t Au)ISLAND GOLD MINEProven Reserves2 573,000 8.68 159,800 363,500 7.53 87,900Probable Reserves2 1,978,000 9.31 592,400 1,752,000 8.41 473,800Total Proven & Probable Reserves2 2,551,000 9.17 752,200 2,115,500 8.26 561,700Measured Resources 33,500 4.94 5,350 7,500 5.80 1,350Indicated Resources 445,500 6.01 86,100 341,000 6.42 70,350Total Measured & Indicated Resources 479,000 5.94 91,450 348,500 6.40 71,700Total Inferred Resources 3,042,000 10.18 995,700 2,815,000 8.49 768,050BEAUFOR MINE4
Proven Reserves2 32,000 6.77 7,010 35,600 7.31 8,350Probable Reserves2 171,500 6.87 37,910 266,500 6.48 55,500Total Proven and Probable Reserves 203,500 6.86 44,920 302,100 6.57 63,850Measured Resources 53,000 6.27 10,700 109,000 5.32 18,600Indicated Resources 300,000 7.57 73,000 734,000 6.50 153,300Total Measured & Indicated Resources 353,000 7.37 83,700 843,000 6.34 171,900Total Inferred Resources 36,000 6.44 7,500 135,000 6.44 28,000MONIQUE MINE5
Indicated Resources 107,500 4.88 16,850 107,500 4.88 16,850WASAMAC GOLD PROPERTY6
Measured Resources 3,124,500 2.75 276,550 3,124,500 2.75 276,550Indicated Resources 12,127,000 2.89 1,125,700 12,127,000 2.89 1,125,700Total Measured & Indicated Resources 15,251,500 2.86 1,402,250 15,251,500 2.86 1,402,250Total Inferred Resources 18,759,000 2.66 1,605,400 18,759,000 2.66 1,605,400FRANCOEUR GOLD PROPERTY6, 7
Measured Resources - - - 40,000 5.89 7,600Indicated Resources - - - 280,000 6.55 59,000Total Measured & Indicated Resources - - - 320,000 6.47 66,600Total Inferred Resources - - - 18,000 7.17 4,150TOTAL RESERVES AND RESOURCESProven & Probable Reserves 2,754,500 9.00 797,120 2,417,600 8.05 625,550Measured & Indicated Resources 16,191,000 3.06 1,594,250 16,870,500 3.19 1,729,300Inferred Resources 21,837,000 3.72 2,608,600 21,727,000 3.44 2,405,600
RICHMONT MINESMINERAL RESERVES AND RESOURCES
25RIC: TSX NYSE
25
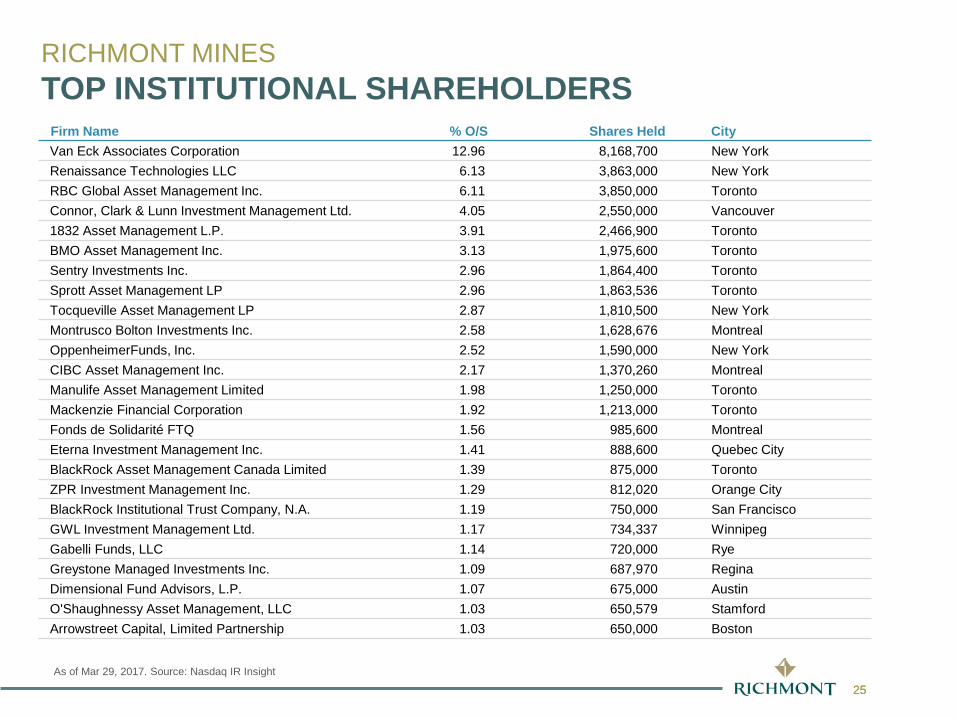
Firm Name % O/S Shares Held CityVan Eck Associates Corporation 12.96 8,168,700 New YorkRenaissance Technologies LLC 6.13 3,863,000 New YorkRBC Global Asset Management Inc. 6.11 3,850,000 TorontoConnor, Clark & Lunn Investment Management Ltd. 4.05 2,550,000 Vancouver1832 Asset Management L.P. 3.91 2,466,900 TorontoBMO Asset Management Inc. 3.13 1,975,600 TorontoSentry Investments Inc. 2.96 1,864,400 TorontoSprott Asset Management LP 2.96 1,863,536 TorontoTocqueville Asset Management LP 2.87 1,810,500 New YorkMontrusco Bolton Investments Inc. 2.58 1,628,676 MontrealOppenheimerFunds, Inc. 2.52 1,590,000 New YorkCIBC Asset Management Inc. 2.17 1,370,260 MontrealManulife Asset Management Limited 1.98 1,250,000 TorontoMackenzie Financial Corporation 1.92 1,213,000 TorontoFonds de Solidarité FTQ 1.56 985,600 MontrealEterna Investment Management Inc. 1.41 888,600 Quebec CityBlackRock Asset Management Canada Limited 1.39 875,000 TorontoZPR Investment Management Inc. 1.29 812,020 Orange CityBlackRock Institutional Trust Company, N.A. 1.19 750,000 San FranciscoGWL Investment Management Ltd. 1.17 734,337 WinnipegGabelli Funds, LLC 1.14 720,000 RyeGreystone Managed Investments Inc. 1.09 687,970 ReginaDimensional Fund Advisors, L.P. 1.07 675,000 AustinO'Shaughnessy Asset Management, LLC 1.03 650,579 StamfordArrowstreet Capital, Limited Partnership 1.03 650,000 Boston
As of Mar 29, 2017. Source: Nasdaq IR Insight
RICHMONT MINESTOP INSTITUTIONAL SHAREHOLDERS
26RIC: TSX NYSE
26
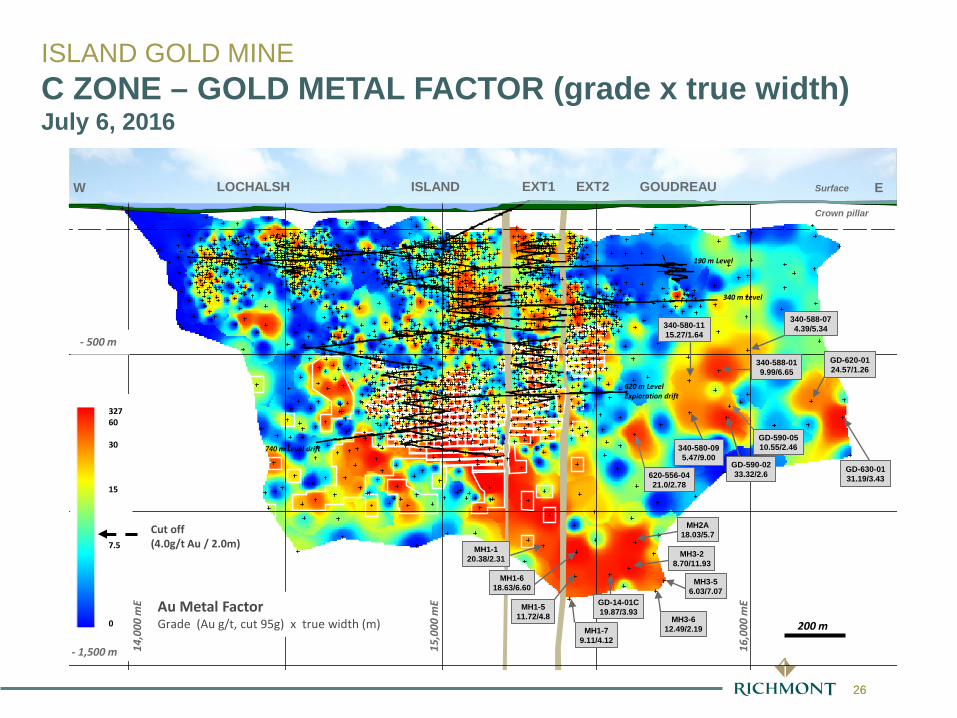
2000 100
meters
14000mE
4400m
4900m
3900m
W EGOUDREAULOCHALSH ISLAND EXT1 EXT2
- 1,000 m
- 500 m
Crown pillar
- 1,500 m 15,0
00 m
E
16,0
00 m
E
620 m LevelExploration drift
14,0
00 m
E
Surface
200 m
Cut off (4.0g/t Au / 2.0m)
32760
30
15
7.5
0
Au Metal FactorGrade (Au g/t, cut 95g) x true width (m)
GD-620-0124.57/1.26
GD-14-01C19.87/3.93
MH1-120.38/2.31 MH3-2
8.70/11.93
GD-630-0131.19/3.43
740 m Level driftGD-590-0510.55/2.46
620-556-0421.0/2.78
MH3-612.49/2.19
MH1-618.63/6.60
MH1-79.11/4.12
MH1-511.72/4.8
MH2A18.03/5.7
340-588-019.99/6.65
340-580-1115.27/1.64
MH3-56.03/7.07
340-588-074.39/5.34
340-580-095.47/9.00
GD-590-0233.32/2.6
190 m Level
340 m Level
ISLAND GOLD MINEC ZONE – GOLD METAL FACTOR (grade x true width)July 6, 2016
27RIC: TSX NYSE
27
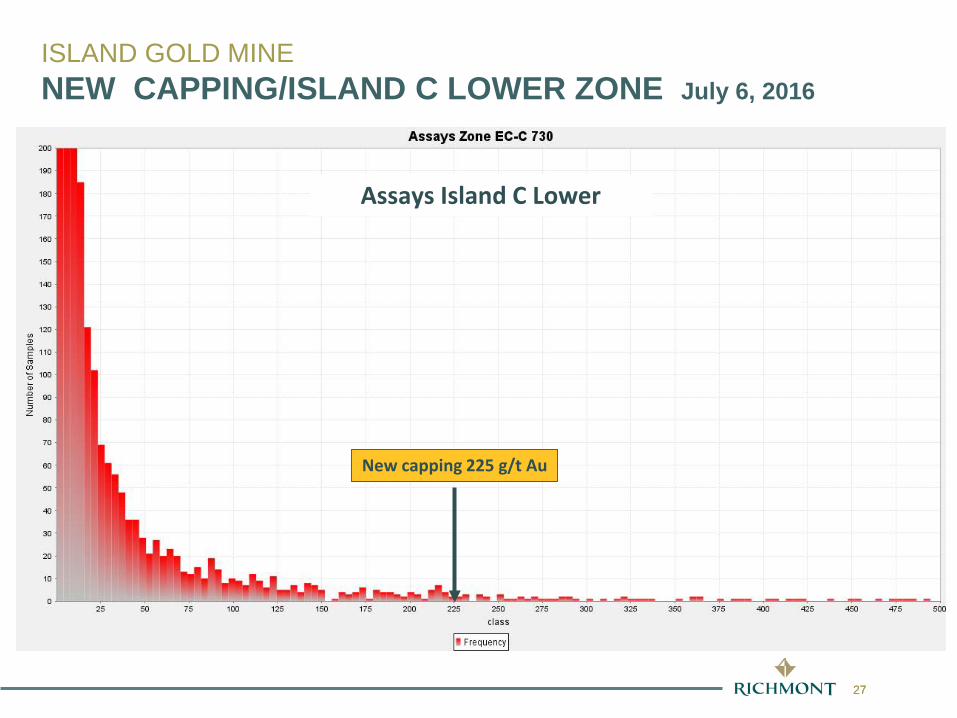
New capping 225 g/t Au
Assays Island C Lower
ISLAND GOLD MINENEW CAPPING/ISLAND C LOWER ZONE July 6, 2016
28RIC: TSX NYSE
28
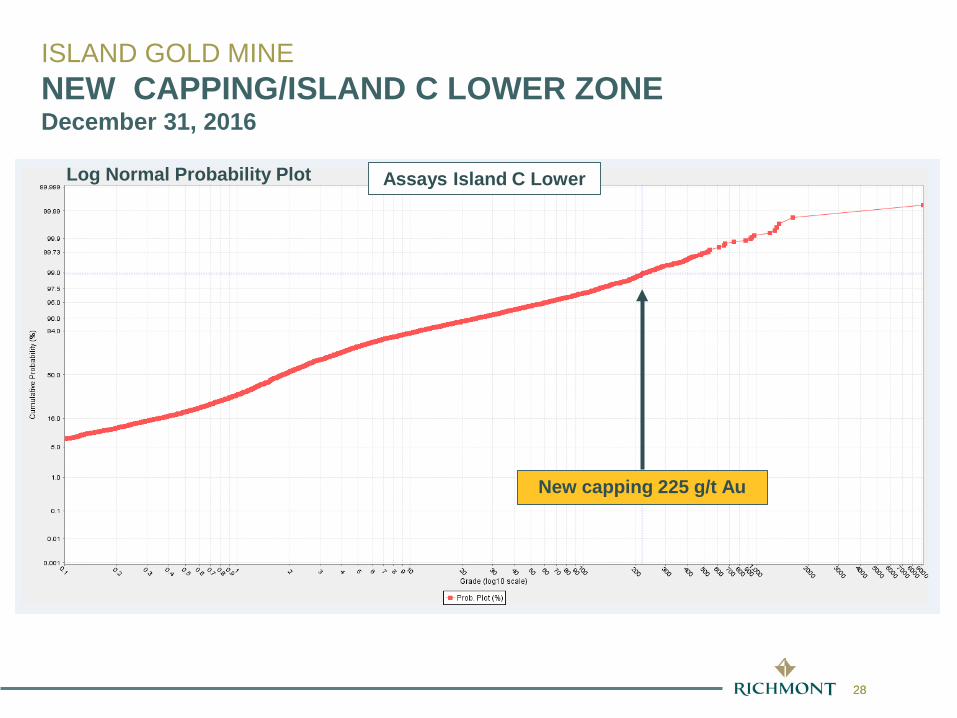
New capping 225 g/t Au
Assays Island C LowerLog Normal Probability Plot
ISLAND GOLD MINENEW CAPPING/ISLAND C LOWER ZONE December 31, 2016
29RIC: TSX NYSE
29
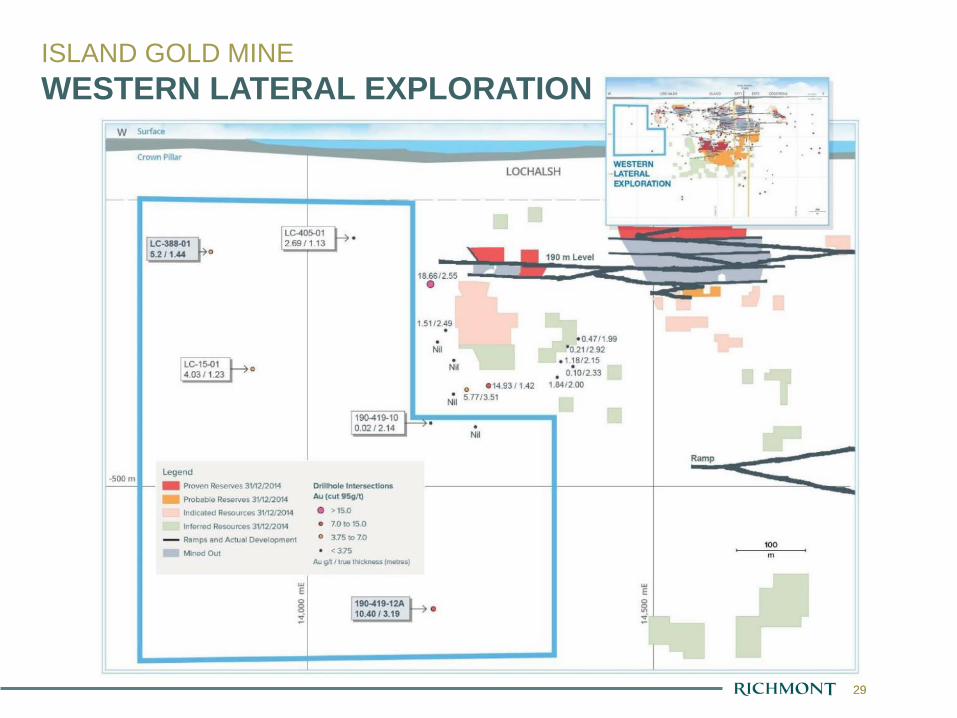
ISLAND GOLD MINEWESTERN LATERAL EXPLORATION
30RIC: TSX NYSE
30
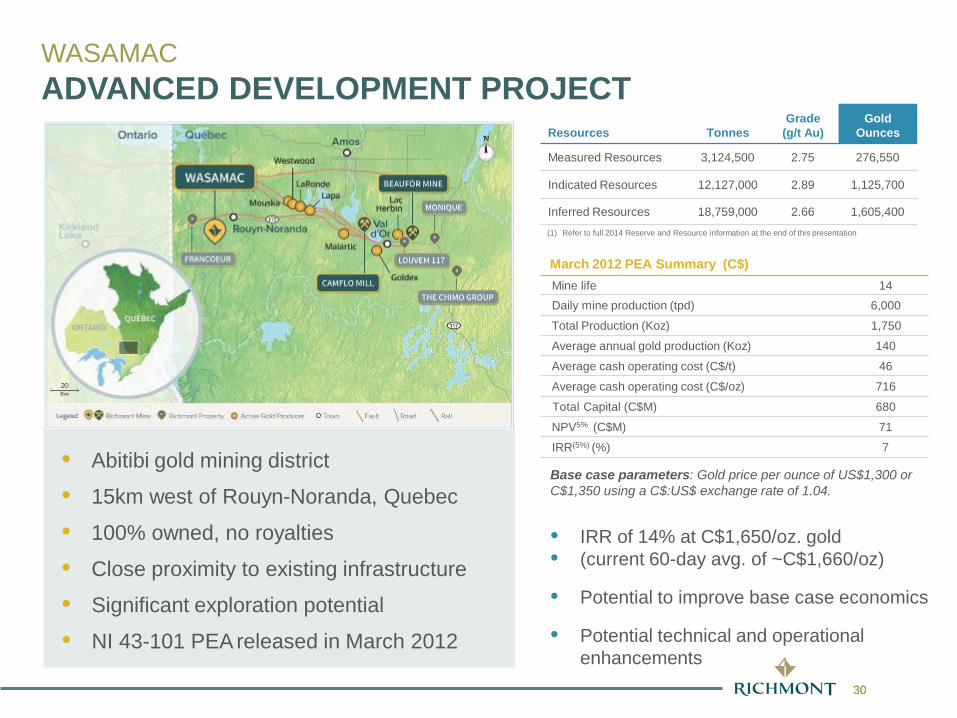
(1) Refer to full 2014 Reserve and Resource information at the end of this presentation
Resources TonnesGrade
(g/t Au)Gold
Ounces
Measured Resources 3,124,500 2.75 276,550
Indicated Resources 12,127,000 2.89 1,125,700
Inferred Resources 18,759,000 2.66 1,605,400
Base case parameters: Gold price per ounce of US$1,300 or C$1,350 using a C$:US$ exchange rate of 1.04.
March 2012 PEA Summary (C$)Mine life 14Daily mine production (tpd) 6,000
Total Production (Koz) 1,750
Average annual gold production (Koz) 140
Average cash operating cost (C$/t) 46
Average cash operating cost (C$/oz) 716
Total Capital (C$M) 680
NPV5% (C$M) 71
IRR(5%) (%) 7
• IRR of 14% at C$1,650/oz. gold • (current 60-day avg. of ~C$1,660/oz)
• Potential to improve base case economics
• Potential technical and operational enhancements
• Abitibi gold mining district
• 15km west of Rouyn-Noranda, Quebec
• 100% owned, no royalties
• Close proximity to existing infrastructure
• Significant exploration potential
• NI 43-101 PEA released in March 2012
WASAMACADVANCED DEVELOPMENT PROJECT
31RIC: TSX NYSE
31
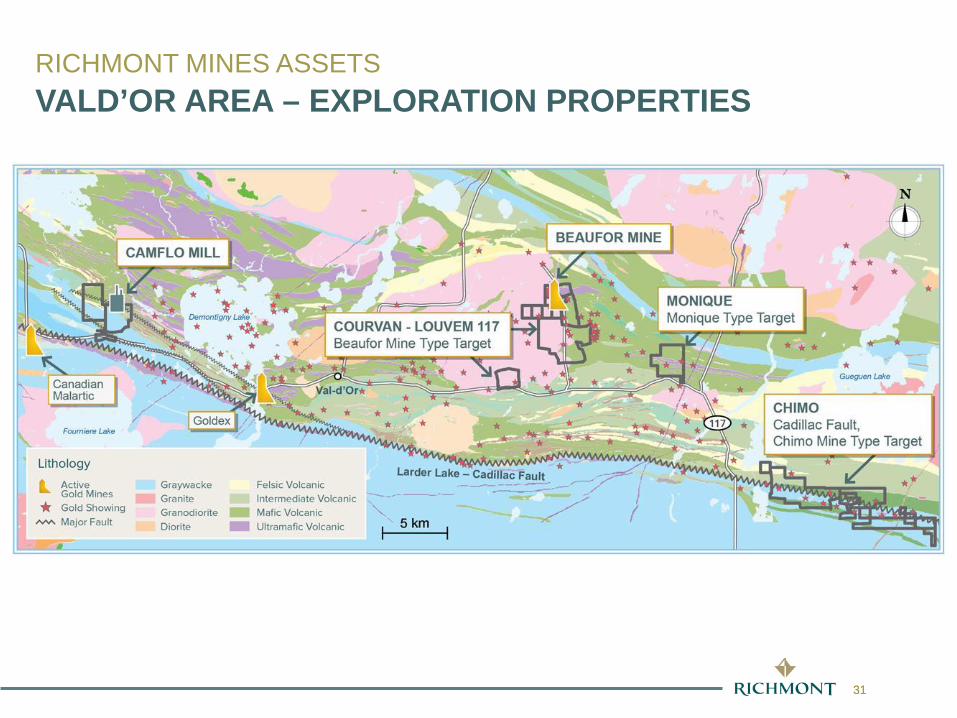
RICHMONT MINES ASSETSVALD’OR AREA – EXPLORATION PROPERTIES
32RIC: TSX NYSE
32
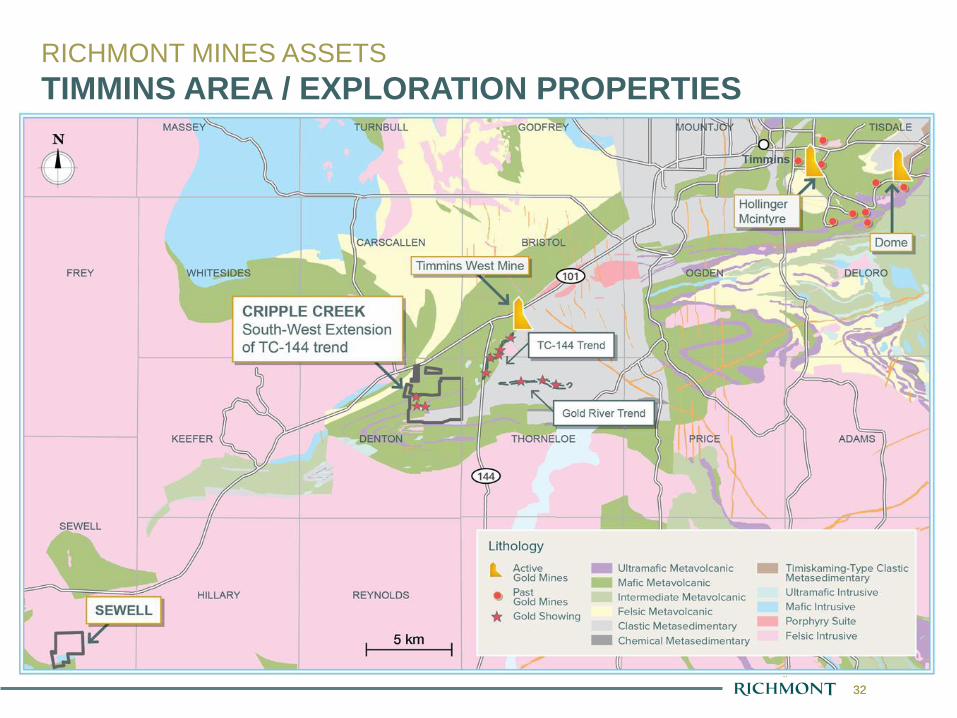
RICHMONT MINES ASSETSTIMMINS AREA / EXPLORATION PROPERTIES
33RIC: TSX NYSE
33
Our vision is to become a leading intermediate gold producer focused on the
Americas generating superior per share valuation. We are committed to a “SustainableBusiness Model” and a strategy of long-term growth, and will fully utilize theCorporation’s strong balance sheet, assets, cash flow, capital structure and theextensive experience of the Corporations’ Board of Directors and Management Team tobuild the next leading Canadian based intermediate gold company.
Our strategy in the short term, will focus on becoming a leading junior gold
producer by maintaining at all times a superior per share position on operational & financial metrics while maintaining a sustainable and risk adverse approach under a“Sustainable Business Model”.
We are guided by our core corporate values to achieve long term value for all of
our stakeholders. By cultivating a culture of responsible performance, we are focusedon operating in a sustainable manner while holding ourselves accountable to all of ourstakeholders.
RICHMONT MINESOUR VISION AND STRATEGY
34RIC: TSX NYSE
34
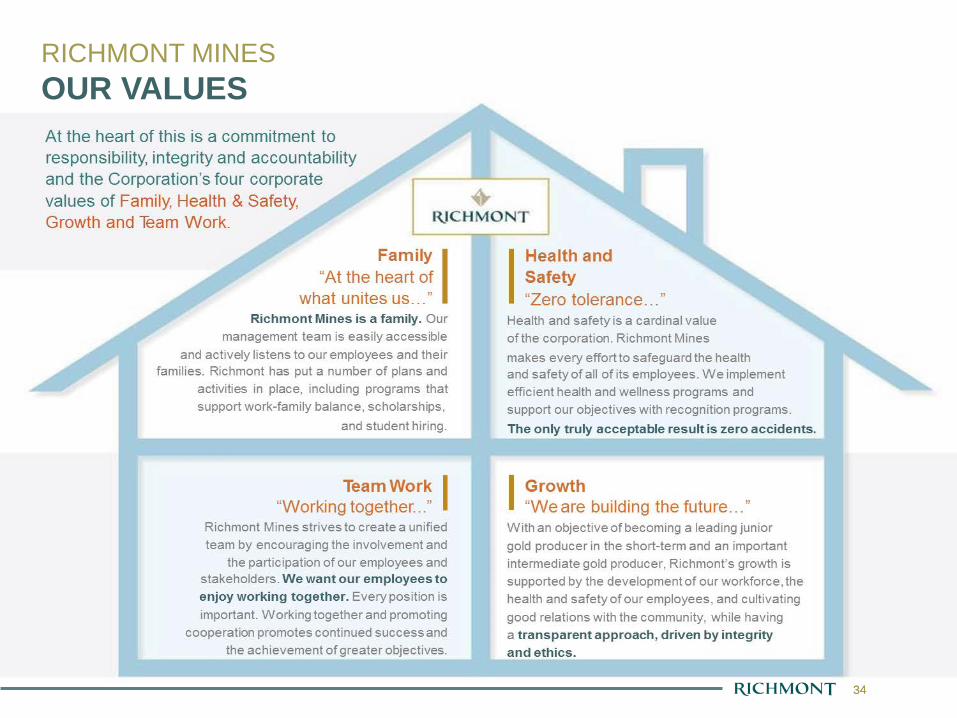
RICHMONT MINESOUR VALUES
35RIC: TSX NYSE
35
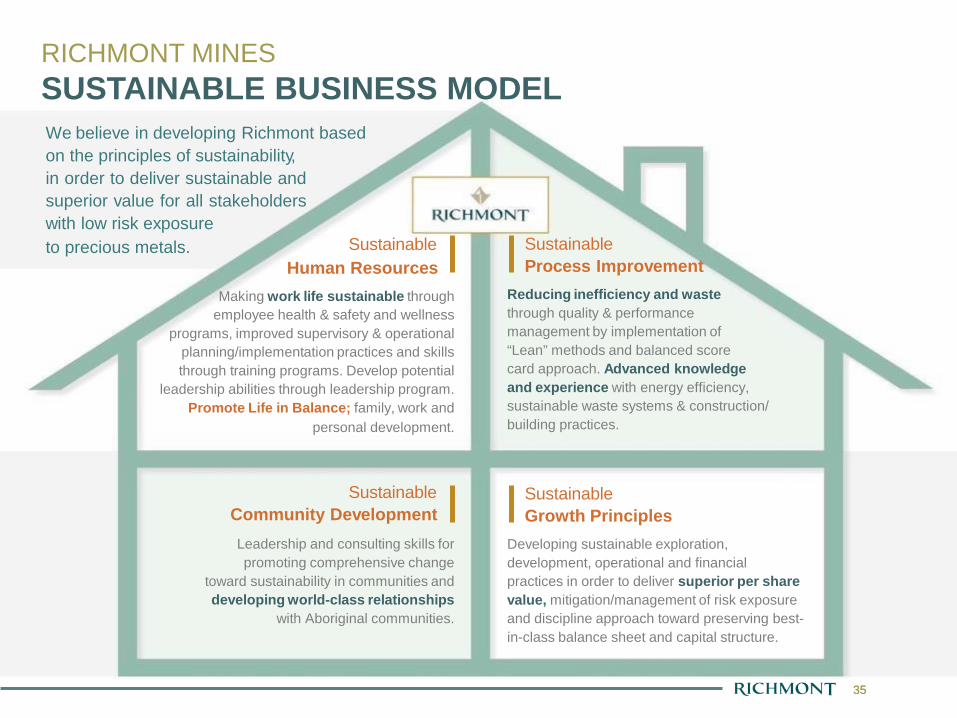
We believe in developing Richmont based on the principles of sustainability,in order to deliver sustainable andsuperior value for all stakeholderswith low risk exposureto precious metals.
Human ResourcesMaking work life sustainable through
employee health & safety and wellness programs, improved supervisory & operational
planning/implementation practices and skills through training programs. Develop potential
leadership abilities through leadership program. Promote Life in Balance; family, work and
personal development.
Sustainable
SustainableCommunity DevelopmentLeadership and consulting skills for promoting comprehensive change
toward sustainability in communities and developing world-class relationships
with Aboriginal communities.
SustainableProcess Improvement
Reducing inefficiency and waste through quality & performance management by implementation of “Lean” methods and balanced score card approach. Advanced knowledge and experience with energy efficiency,sustainable waste systems & construction/ building practices.
SustainableGrowth Principles
Developing sustainable exploration, development, operational and financial practices in order to deliver superior per share value, mitigation/management of risk exposure and discipline approach toward preserving best-in-class balance sheet and capital structure.
RICHMONT MINESSUSTAINABLE BUSINESS MODEL
www.richmont-mines.com