1620 ieee transactions on biomedical ... ieee transactions on biomedical engineering, vol. 59, no....
TRANSCRIPT

1620 IEEE TRANSACTIONS ON BIOMEDICAL ENGINEERING, VOL. 59, NO. 6, JUNE 2012
Automatic Detection and Quantification ofTree-in-Bud (TIB) Opacities From CT Scans
Ulas Bagci*, Member, IEEE, Jianhua Yao, Albert Wu, Jesus Caban, Tara N. Palmore, Anthony F. Suffredini,Omer Aras, and Daniel J. Mollura
Abstract—This study presents a novel computer-assisted detec-tion (CAD) system for automatically detecting and precisely quan-tifying abnormal nodular branching opacities in chest computedtomography (CT), termed tree-in-bud (TIB) opacities by radiol-ogy literature. The developed CAD system in this study is basedon 1) fast localization of candidate imaging patterns using localscale information of the images, and 2) Mobius invariant featureextraction method based on learned local shape and texture prop-erties of TIB patterns. For fast localization of candidate imagingpatterns, we use ball-scale filtering and, based on the observa-tion of the pattern of interest, a suitable scale selection is usedto retain only small size patterns. Once candidate abnormalitypatterns are identified, we extract proposed shape features fromregions where at least one candidate pattern occupies. The com-parative evaluation of the proposed method with commonly usedCAD methods is presented with a dataset of 60 chest CTs (labo-ratory confirmed 39 viral bronchiolitis human parainfluenza CTsand 21 normal chest CTs). The quantitative results are presentedas the area under the receiver operator characteristics curves anda computer score (volume affected by TIB) provided as an outputof the CAD system. In addition, a visual grading scheme is ap-plied to the patient data by three well-trained radiologists. Inter-observer and observer–computer agreements are obtained by therelevant statistical methods over different lung zones. Experimen-tal results demonstrate that the proposed CAD system can achievehigh detection rates with an overall accuracy of 90.96%. Moreover,correlations of observer–observer (R2 = 0.8848, p < 0.01) andobserver–CAD agreements (R2 = 0.824, p < 0.01) validate thefeasibility of the use of the proposed CAD system in detecting andquantifying TIB patterns.
Manuscript received October 13, 2011; revised January 11, 2012; acceptedMarch 7, 2012. Date of publication March 14, 2012; date of current version May18, 2012. This work was supported in part by the Imaging Sciences TrainingProgram, the Center for Infectious Disease Imaging, the Intramural Program ofthe National Institutes of Allergy and Infectious Diseases, and the IntramuralResearch Program of the National Institutes of Bio-imaging and Bioengineer-ing, National Institutes of Health. Asterisk indicates corresponding author.
∗U. Bagci is with the Center for Infectious Disease Imaging, Department ofRadiology and Imaging Sciences, National Institutes of Health, Bethesda, MD20892 USA (e-mail: [email protected]).
J. Yao is with the Department of Radiology and Imaging Sciences, NationalInstitutes of Health, Bethesda, MD 20892 USA (e-mail: [email protected]).
A. Wu and D. J. Mollura are with the Center for Infectious DiseaseImaging, Department of Radiology and Imaging Sciences, National Insti-tutes of Health, Bethesda, MD 20892 USA (e-mail: [email protected];[email protected]).
J. Caban is with the Naval Medical Center, Bethesda, MD 20889 USA(e-mail: [email protected]).
T. N. Palmore is with the Laboratory of Clinical Infectious Diseases, NationalInstitutes of Health, Bethesda, MD 20892 USA (e-mail: [email protected]).
A. F. Suffredini is with the Department of Critical Care Medicine, National In-stitutes of Health, Bethesda, MD 20892 USA (e-mail: [email protected]).
O. Aras is with the National Cancer Institutes, NIH, Bethesda, MD 20892USA (e-mail: [email protected]).
Color versions of one or more of the figures in this paper are available onlineat http://ieeexplore.ieee.org.
Digital Object Identifier 10.1109/TBME.2012.2190984
Index Terms—Computer-assisted detection (CAD), infectiousdiseases, lung, tree-in-bud (TIB), Willmore energy.
I. INTRODUCTION
INFECTIOUS lung diseases, such as novel swine-originH1N1 influenza, tuberculosis (TB), etc., are among the lead-
ing causes of disability and death all over the world [1]–[3], [5].Computed tomography (CT) examination of the lungs duringacute respiratory tract infections has become an important partof patient care, both at diagnosis and monitoring progressionor response to therapy. Although CT examination serves as aprimary (imaging) diagnostic tool for assessing lung infections,visual analysis of CT images is restricted by low specificityfor causal infectious organisms and a limited capacity to assessseverity and predict patient outcomes [2].
Common CT findings associated with respiratory tract infec-tions include tree-in-bud (TIB) nodularity, ground-glass opac-ities (GGO), random distribution of pulmonary nodules, linearinterstitial/bronchovascular thickening, and consolidations [6].Although none of these visual patterns are specific for onepathogen, the amount of lung volume exhibiting these featurescould provide insights into the extent or severity of infection.Among these patterns, TIB opacities, represented by thickenedbronchial structures surrounded locally by clusters of 2–3 mmmicronodules, are associated with inflammation of the smallairways (bronchioles), such as in viral or bacterial bronchiolitis,and the increasing sizes of abnormal regions on CT can suggestthe progression of disease [6]. Often considered to have a limiteddifferential diagnosis-M TB infection, infection with nontuber-culous mycobacteria, viral infection, cystic fibrosis, this patternis recognized as a CT appearance of many different entities.Unlike the other imaging patterns such as GGO and consolida-tions, it is an extremely challenging task to detect and quantifythe regions with TIB opacities due to interobserver variationsand inconsistent visual scoring methods [2]. Therefore, an accu-rate method for detecting TIB is a critical in computer-assisteddetection (CAD) schemes from chest CT. Although the correctdiagnosis for TIB pattern is very important, it is also one ofthe most difficult tasks for radiologists because the contrast oflesions is often low and the disease patterns are very complex.All these limitations suggest that CAD could make a valuablecontribution to the management of respiratory tract infectionsby assisting in the early recognition of pulmonary parenchymallesions and providing quantitative measures of disease severity.
0018-9294/$31.00 © 2012 IEEE

BAGCI et al.: AUTOMATIC DETECTION AND QUANTIFICATION OF TREE-IN-BUD (TIB) OPACITIES FROM CT SCANS 1621
Fig. 1. Single-axial CT slice with a significant amount of TIB patterns and anexample labeling process of TIB patterns (blue) on the right lung are shown.
A. Respiratory Tract Infections and TIB Patterns
Respiratory tract infections, caused by viruses, bacteria,fungi, and parasites, are a major component of global infectiousdisease mortality. TIB patterns, in particular, usually representthe disease of the small airways such as infectious-inflammatorybronchiolitis as well as bronchiolar luminal impaction with mu-cus, pus, cells, or fluid causing normally invisible peripheralairways to become visible on CT [7]. Fig. 1 shows typical TIBpatterns in a chest CT (Fig. 1 shows labeled TIB patterns withblue). As its name implies, this pattern resembles a budding treein CT due to the branching opacities with adjacent centrilobu-lar nodularity [2]. It is not specific for a single disease entity,but suggests pathology in the peripheral airways, which can beassociated with air trapping or subsegmental consolidation inthe surrounding alveolar airspaces. Because any organism thatinfects the small airways can cause a TIB pattern, pulmonaryinfections are its most common cause.
TIB is difficult to be detected with conventional CAD sys-tems due to high complexity of their irregular shapes, as well asstrong textural similarity of micronodules and thickened airwaysto other normal and abnormal lung structures. Currently, no re-ported CAD system is capable of automatically detecting a TIBpattern, therefore, which warrants a need for the developmentof such a system to improve the diagnostic decision process andquantitative measurement of respiratory tract infections. In thispaper, we develop a new CAD system to evaluate respiratorytract infections by automatically detecting and quantifying TIBpatterns on CT images.
B. Our Contributions
The main contributions of this study are twofold. 1) A can-didate selection method that locates possible abnormal patternsin the images. This process comes from a learning perspectivesuch that the size, shape, and textural characteristics of TIBpatterns are learned a priori. The candidate selection processremoves large homogeneous regions from consideration whichresults in a rapid localization of candidate TIB patterns. Thelocal regions enclosing candidate TIB patterns are then usedto extract shape and texture features for automatic detection;
Fig. 2. Flowchart of the proposed CAD system for automatic TIB detection.
2) another novel aspect in this study is to extract Mobius invari-ant local shape features (i.e., Willmore energy-based features).Extracted local shape features are combined with statistical tex-ture features to classify lung tissues. In addition, we also in-vestigate the extraction and use of different local shape featuresas compared to the proposed shape features to facilitate localstructure analysis. To the best of our knowledge, this is the firststudy that uses automatic detection of TIB patterns for a CADsystem in infectious lung diseases. Since there is no publishedwork on automatic detection of TIB patterns in the literature,we compare our proposed CAD system on the basis of differentfeature sets previously shown to be successful in detecting lungdiseases in general. Early version of this study appeared in [3],and can be accessed in [8].
This paper is organized as follows. Section II explains themethods of the proposed CAD system. We discuss our proposedand conventional feature extraction methods in Section III.Next, we present the feasibility of the proposed CAD systemby evaluating the detection and quantification performances inSection IV followed by a discussion and conclusion in Section Vand Section VI, respectively.
II. CAD METHODOLOGY
The proposed CAD methodology is illustrated in Fig. 2. First,lungs are segmented from chest CTs. Second, we use locallyadaptive scale-based filtering method to detect candidate TIBpatterns. Third, segmented lung is divided into local patches inwhich we extract Mobius invariant shape features and statisti-cal texture features followed by support vector machine (SVM)classification. We extract features from local patches of the seg-mented lung only if there are candidate TIB patterns in thepatches. The details of the proposed methods are described inthe following.

1622 IEEE TRANSACTIONS ON BIOMEDICAL ENGINEERING, VOL. 59, NO. 6, JUNE 2012
Fig. 3. (Left) Axial single chest CT and its (middle and right) FC delineationcorrespondence are seen.
A. Lung Segmentation
Prior to detection, segmentation is often the first step in CADsystems. In this study, fuzzy connectedness (FC) image segmen-tation algorithm is used to achieve successful delineations [9].In FC framework, as illustrated in Fig. 3, left and right lungs are“recognized” by user-defined or automatically assigned seeds,which initiate FC segmentation. In this study, one seed per lungvolume (i.e., left or right) is automatically set by only consid-ering the locations of small intensity valued voxels inside thebody region (see [9] for a detailed description of the use of FCin anatomy segmentation). Fig. 3 (middle and right) shows theresulting segmentation of the chest CT given on the left. Al-though we use FC algorithm to segment lung regions, there aremany well-established lung segmentation methods in the liter-ature [9]–[11], [29], and [41] such that they could possibly beused as well to accomplish the delineation step. In that sense, wedo not have any strict restriction on the choice of segmentationalgorithm prior to detection system as long as it successfullysegments the lung regions.
B. Learning Characteristics of TIB Patterns
The size/volume of a region occupied by a typical TIB pat-tern does not usually exceed a few mm2/mm3 . Together withthe fact that TIB pattern has a complex shape with varying in-tensities over discontinues branches (i.e., buds), TIB patternshave intensity characteristics with high variation toward nearbyvoxels (see Fig. 1). In other words, TIB patterns do not consti-tute sufficiently large homogeneous regions. Thus, TIB patternsare localized only in the vicinity of small homogeneous regions,and their boundaries have high curvatures due to the nature ofits complex shape. In the next section, we use these two ob-servations to extract novel characteristic features to detect TIBpatterns.
Our candidate selection method comes from a learning per-spective such that we assign every internal voxel of the lung amembership value reflecting the size (i.e., scale) of the homo-geneous region that the voxel belongs to. To do this, we use alocally adaptive scale-based filtering method called ball-scale(or b-scale for short) [9], [16], [17]. The b-scale is the simplestform of a locally adaptive scale where the scene is partitionedinto several scale levels. Every voxel in each scale is assignedthe size of the local structure it belongs. For instance, voxelswithin the large homogeneous objects have highest scale values,and the voxels nearby the boundary of objects have small-scalevalues. Voxels on the boundary of objects have smallest scalevalues. Because of these observations, we conclude that TIB
Fig. 4. (a) b-scale scene. (b) Thresholding via selecting small-scale valuesonly [i.e., a scale of 1 is selected as a threshold cutoff (red bar)]. (c) Thresholdedb-scale scene; local regions without any b-scale pattern and with b-scale patternsare shown in red and blue, respectively.
patterns constitute only small b-scale values; thus, it is reason-able to consider voxels with small b-scale values as candidateTIB patterns. Similarly, it is practical to discard voxels with highb-scale values from the candidate selection procedure. Figs. 2(candidate selection) and 4(a) show selected b-scale regions ascandidate TIB patterns. Once b-scale image correspondence ofsegmented chest CT is obtained as noted in Fig. 4(a), we onlyselect small b-scale values via thresholding the large b-scale val-ues [see Fig. 4(b)]. Justification of this selection procedure baseson the observations defined previously. Resultant candidate TIBpatterns are shown in Fig. 4(c). We describe the computationof b-scale patterns and the details of the candidate selectionprocess in the next section.
C. Candidate Pattern Selection Through B-Scale Encoding
There are several advantages to the local scale-based ap-proach. For instance, boundary- and region-based represen-tations of objects are explicitly contained in the scale-basedmethods. Based on continuity of homogeneous regions, geo-metric properties of objects (i.e., size information) can be iden-tified, and this new representation is called scale images, i.e.,b-scale, tensor-scale (t-scale), generalized-scale (g-scale) im-ages [16], [18], [19]. The b-scale model has been shown to beextremely useful in object recognition [17], image segmenta-tion [9], [41], filtering [16], inhomogeneity correction [20], andimage registration [20], [21]. In this study, on the other hand, weshow how to use b-scale encoding together with a proper scaleselection method for detecting candidate abnormality patterns.The main idea in b-scale encoding is to determine the size oflocal structures at every voxel as the radius of the largest ballcentered at the voxel within which intensities are homogeneousunder a prespecified region-homogeneity criterion.
Although the conventional b-scale encoding method is wellestablished for nD images (n ≥ 2), we use 2-D b-scale en-coding method in this study because low-resolution CT datado not allow continuous analysis of TIB patterns through low-resolution imaging direction. In the 2-D digital space (Z2 , ν),a scene C = (C, f) is represented by a pair where C is a rect-angular array of voxels, ν = (ν1 , ν2) indicates the size of thevoxels, and f is a function that assigns to every voxel an imageintensity value. A ball Bk (c) of radius k ≥ 0 and with center at

BAGCI et al.: AUTOMATIC DETECTION AND QUANTIFICATION OF TREE-IN-BUD (TIB) OPACITIES FROM CT SCANS 1623
a voxel c ∈ C in C is defined by
Bk (c) =
⎧⎨
⎩e ∈ C
∣∣∣∣∣
√√√√
n∑
i=1
(ci − ei)2 ≤ k
⎫⎬
⎭. (1)
The fraction of object is denoted by FOk (c) and indicates thefraction of the ball boundary occupied by a region which issufficiently homogeneous with c. FOk,ν (c) is defined as
FOk (c) =
∑e∈Bk (c)−Bk −1 (c) Wψ (|f(c) − f(e)|)
|Bk (c) − Bk−1(c)|(2)
where |Bk (c) − Bk−1(c)| is the number of voxels in Bk (c) −Bk−1(c) and Wψ is a homogeneity function [9]. In all experi-ments, we use a zero-mean unnormalized Gaussian function forWψ . The size of the local structure is estimated using appearanceinformation of the gray-level images, i.e., region-homogeneitycriterion; b-scale scenes contain rough geometric information.A detailed description of Wψ and FOk,ν is presented in [9].
The b-scale algorithm works as follows: the ball radius kis iteratively increased starting from one, and the algorithmchecks for FOk,ν (c), the fraction of the object containing cthat is contained in the ball. When this fraction falls below apredefined threshold, it is considered that the ball contains anobject region different from that to which c belongs [16]. Thisprocess is repeated for every voxel within the scene. Voxelsare assigned their b-scale values discreetly from 1 to rmax .1 Inprinciple, b-scale partitions the scene into several levels basedon the size of local structures from 1 to rmax . Computing b-scalevalues for every voxel leads b-scale scenes as shown in Fig. 4(a).Note also that locally adaptive scale in regions with fine detailsor in the vicinity of boundaries is small, while it is large in theinterior of large homogeneous objects.
III. CAD FEATURE EXTRACTION
Developing a successful CAD system for infectious lung dis-eases requires acquisition of representative features characteriz-ing shape and texture of TIB patterns efficiently. Since TIB is acomplex shape pattern consisting of curvilinear structures withnodular structures nearby, we propose to use local shape fea-tures (derived from geometry of the local structures) combinedwith gray-level statistics derived from a given local patch (i.e.,local window with a predefined size).
The shape operator is the second-order invariant (or curva-ture) which determines the original surface. Since it is usu-ally more convenient to work with scalar quantities rather thanvectorial shape quantities, symmetric functions of local Hes-sian matrices are usually used to extract geometric meaningof the surface/shape of interest. Therefore, curvatures play animportant role in the representation and recognition of intrin-sic shapes. However, similarity of curvature values may notnecessarily be equivalent to intrinsic shape similarities, whichcauses a degradation in recognition and matching performance.
1We set rm ax = 20 in all cases due to the fact that size of the largest ballfor one particular voxel rarely exceeds 15 voxels in length; see [16] for furtherdetails on the selection of maximum radius of the ball.
To overcome this difficulty, we propose to use Willmore en-ergy functional [22] and several different affine invariant shapefeatures parametrically related to the Willmore energy func-tional. While local shape features characterize the curvilinearand small nodular structures (via Willmore energy), gray-levelfeatures characterize background and foreground intensity vari-ation with objects’ pose and size for a given local window.Moreover, for comparison purpose, we use different feature setspreviously shown to be successful in detecting lung diseases ingeneral. Fig. 5 enlists all the features that we extracted for theproposed CAD system and for the experimental comparison.Details of extracted features are defined in the following.
A. Willmore Energy and Shape Features
The Willmore energy of surfaces plays an important role indigital geometry, elastic membranes, and image processing [23].It is closely related to Canham–Helfrich model [24], where asurface energy is defined as
S =∫
Σα + β(H)2 − γKdA. (3)
where α, β, and γ are some constants, H is the mean curvaturevector on Σ (area space), K is the Gaussian curvature on ∂Σ(boundary space), and dA is the induced area metrics on Σ. Thismodel is curvature driven, invariant under the group of Mobiustransformations (in particular, under rigid motions and scalingof the surface) and shown to be very useful in energy minimiza-tion problems [25]. Invariance of the energy under rigid motionsleads to conservation of linear and angular momenta, and invari-ance under scaling plays a role in setting the size of complexparts of the intrinsic shapes (i.e., corners, wrinkles, folds, etc.).In other words, the position, gray-level characteristics, size, andorientation of the pattern of interest have minimal effect on theextracted features as long as the suitable patch is reserved for theanalysis. In order to have simpler and more intuitive represen-tation of the given model, we simply set α = 0 and β = γ = 1,and the equation turns into Willmore energy functional
Sw =∫
Σ(H2 − K)dA =
∫
Σ|H|2dA −
∫
∂Σ|K|ds (4)
where ds is the length metric on ∂Σ. The resultant energy of asurface can be regarded as a function H and K, and capturesthe deviation of a surface from local sphericity [22] such that asphere has zero Willmore energy. Note also that the Willmoreenergy is always nonnegative. Since a homogeneity region thata typical TIB pattern appears is small in size, total curvature (orenergy) of that region is high and can be used as a discriminativefeature.
The main motivation in describing intrinsic shapes by Will-more energy is due to its ability to encode surface (i.e., imagearea in 2-D) with Mobius invariant features (translation, con-trast, rotation, and inversion invariant). In addition to Willmoreenergy features that we adapt from Canham–Helfrich surfacemodel, we have included seven different local shape features,which are parametrically related to Willmore energy formula-tion, into the proposed CAD system due to their some invari-ant properties and discriminative powers. Assume κ1 and κ2

1624 IEEE TRANSACTIONS ON BIOMEDICAL ENGINEERING, VOL. 59, NO. 6, JUNE 2012
Fig. 5. List of textural and shape features used to detect TIB patterns in the lungs.
indicate eigenvalues of the local Hessian matrix He for anygiven local patch L , the following shape features are extracted:1) shape index (SI), 2) Gaussian curvature, 3) mean curvature,4) elongation, 5) distortion, 6) shear, 7) compactness.
1) SI: The SI is a statistical measurement and used to de-fine intrinsic shape of the localized structure within the im-age [26], [27]. SI values are encoded as a continuous range ofvalues between−1 and 1, with zero SI indicates saddle-like localstructures, +1 and −1 SI values indicate umbilical minima andmaxima (i.e., cap and cup, respectively), and midpoints of thetwo half-intervals (+0.5 and −0.5) indicate concave and convexparabolic or line-like structures (i.e., rut and ridge, respectively).SI can simply be computed through principal curvatures (κ1 , κ2)as follows:
SI =2π
arctan(
κ1 + κ2
κ1 − κ2
)
∈ [−1, 1] (5)
where κ1 ≥ κ2 . As suggested in [26], we obtain principal cur-vatures from the eigenvalues of the local Hessian matrix (He)as
[κ1κ2
]
= eig (He) = eig([
Lxx Lxy
Lyx Lyy
])
(6)
where Lxx, Lxy = Lyx, and Lyy are second-order derivativesof local image patch L , and eig() denotes eigenvalue decom-position. We choose to use SI because of its invariance propertywith respect to rotation, absolute gray value, and translation.
2) Gaussian Curvature: Gaussian curvature (K) is an intrin-sic measure and simply the product of the principal curvaturesas K = κ1κ2 for a given point on a surface, equivalent to the de-terminant of local Hessian matrix He . Note that K is unchanged
even by bending the surface without stretching it, meaning thatthe Gaussian curvature is independent of the choice of unitnormal and it gives three types of classified local shapes: ellip-tic shape (K > 0), hyperbolic shape (K < 0), parabolic shape(K = 0) with one of the κ is equal to zero, planar shape (K = 0)with both κ are equal to zero. Gaussian curvature is translationand rotation invariant, but not scale invariant.
3) Mean Curvature: Mean curvature (H) is an extrinsicmeasure and it describes the curvature as H = (κ1 + κ2)/2.Unlike K, H is defined in the distributional sense. Note thatmean curvature measure is the trace of local Hessian matrixHe . Mean curvature can be thought as a negative gradient (asa Laplacian) of the area functional due to its nice variationalinterpretation over the surface. This does not only give insightsinto the size of the local shape but also into the total symmet-rical deviation from the sphere. Mean curvature is translationand rotation invariant, but not scale invariant.
4) Elongation: Shape elongation is one of the basic shapedescriptors and it indicates flatness measure of the local shape[28]. In this paper, we used the ratio of principal curvatures tomeasure elongation as κ2/κ1 with κ2 ≤ κ1 . Elongation mea-sure is invariant with respect to a similarity transformation, andtherefore, it is a robust feature that helps to identify curvilinearshapes. Elongation varies from −1 to +1, from hyperbolic toelliptic points.
5) Distortion: Distortion is an algebraic quantity defined asthe difference of eigenvalues (i.e., |κ1 − κ2 |) of the local Hes-sian matrix He . Distortion is a valuable image analysis propertyrevealed by magnitude difference of principal curvatures. Dis-tortion measure captures the deviation of principal curvatures,thus nonplanarity of a region. Together with Gaussian or mean

BAGCI et al.: AUTOMATIC DETECTION AND QUANTIFICATION OF TREE-IN-BUD (TIB) OPACITIES FROM CT SCANS 1625
Fig. 6. (a) Single-axial CT slice of the left lung. (b) Selected b-scale patterns.(c) Mean Curvature map (H ). (d) Gaussian curvature (K ). (e) Willmore energymap. (f) zoomed (e).
curvature, distortion measure brings further information intoencoding of local shape. Distortion measure is translation androtation invariant, but not scale invariant.
6) Shear: The shear is another algebraic distortion quan-tity defined as proportional to the normalized distortion: (κ1 −κ2)2/4. The physical information contained in the shear is basi-cally the same as that of the distortion; it is related to distortionwith powers of the difference of principal curvatures. Differ-ent than distortion, shear descriptor captures higher degree ofnonplanarity of a region due to having more robustness againstnoise.
7) Compactness: Compactness feature measures the simi-larity between shape of interest and a perfect ellipse, and isdefined as 1/(4π
√κ1κ2). Note that this ratio is a dimensionless
ratio between the area of the shape (1 for a normalized shape)and the area of the best ellipse fitting the shape. Note also thatthe compactness measure is invariant to affine transformationsand parametrically related to Gaussian curvature.
Given a single-axial CT slice of left lung, Fig. 6(b) indicatesa thresholded (i.e., selected candidate patterns) b-scale sceneencoded from the corresponding gray-level CT slice shown inFig. 6(a). Furthermore, Fig. 6(c) and (d) shows mean and Gaus-sian curvature maps from which all the other local shape featuresare extracted, respectively. In addition, Fig. 6(e) and (f) showsWillmore energy maps using both mean and Gaussian curvaturemaps as formulated in (4) and shown in Fig. 6(c) and (d).
Based on the observation in training step where we analyzedthe appearance and shape of TIB patterns, TIB patterns mostlikely occur in the regions inside the lung with high variability ofintensity values over a small number of voxels and with certainsize (i.e., a few millimeter in length). These observations (sizeand high intensity variation) facilitate one practically useful fact
Fig. 7. Local gradient maxima above different thresholds are shown.
in the algorithm that, in the feature extraction process, we onlyextract features if and only if at least “one” small b-scale patternexists in the local regions (i.e., blue local regions in Fig. 4).
B. Local Gradient Shape Statistics (LGS) and ConventionalShape Features
We also explore the use of alternative local shape featuresas a comparison to Willmore energy-based features. Based onthe observations of spatial properties of the selected candi-date patterns, it becomes apparent that instead of using con-ventional high-dimensional feature extraction methods such asGabor wavelets, steerable wavelets, etc., one may extract muchfewer and more reliable statistical features to discriminate thepattern of interest. Motivated from the fact that TIB patternsconsist of numerous small (or micro-) nodules nearby the maincurvilinear structure and those small structures have varyingopacities, the location and distribution of those small structurescan be obtained by simple thresholding method which has beenpopular in estimation for more than two decades [30]. How-ever, since the opacities are varying through different nodularstructures, it is challenging to find an optimum threshold value.Therefore, instead of using one single threshold level, we em-pirically choose n = 10 different threshold levels (λj ) to obtainlocal statistics of those structures in a hierarchical way, whereλj = 10j, 1 ≤ j ≤ 10 [31]. This process is named LGS be-cause we extract different statistical measurements in gradientof the images. Note also that we confine ourselves into the localpatches where at least one b-scale pattern occupies.
To obtain shape statistics over local patches, we use gradientfields because boundary information can be used much moreeffectively in that sense. Fig. 7 shows an example thresholdingprocess over a candidate TIB pattern centered at c (only for fourlevels are shown for demonstration purpose). After differentthreshold levels are applied over the local regions of b-scaleimages, resultant thresholded local patches are used to extractthe following features: mean SI values of the local patch foreach thresholding level (one feature), and the number of b-scale patterns left after thresholding process (one feature). Sincewe use ten different thresholding levels, we extract 20 featurestotally. Moreover, for a local region centered at a voxel c of acandidate TIB pattern, we extract one global feature as an SIvalue of the voxel c, three features as the maximum, minimum,
1626 IEEE TRANSACTIONS ON BIOMEDICAL ENGINEERING, VOL. 59, NO. 6, JUNE 2012
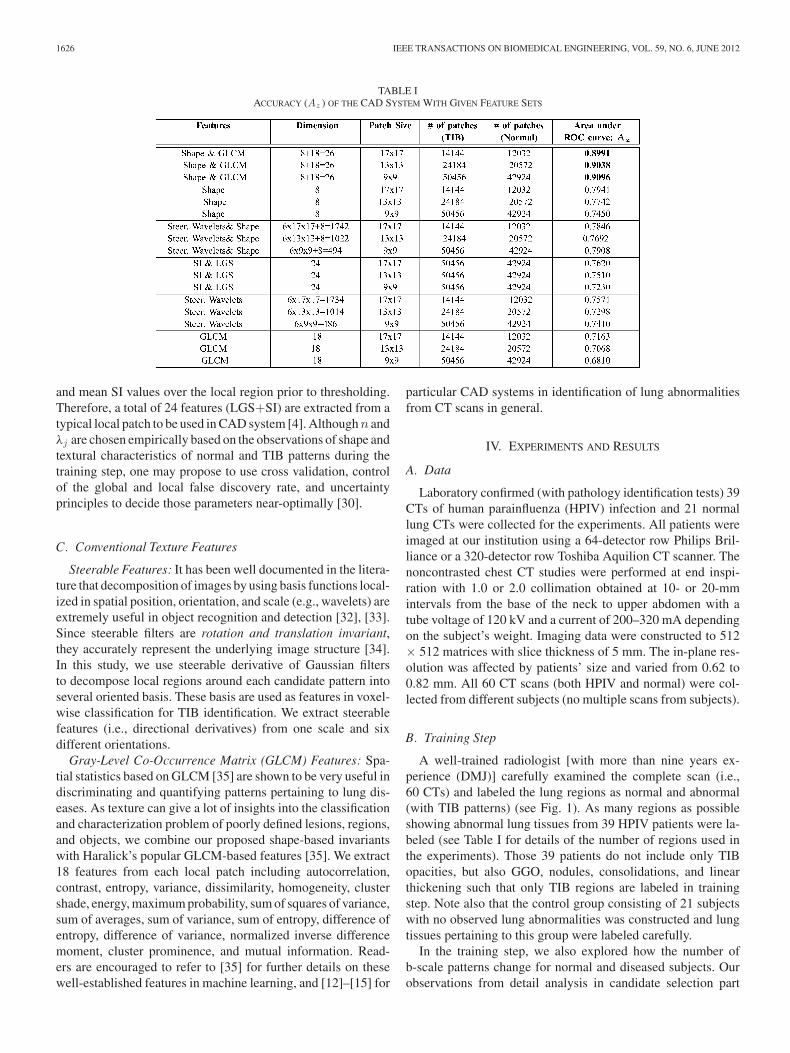
TABLE IACCURACY (Az ) OF THE CAD SYSTEM WITH GIVEN FEATURE SETS
and mean SI values over the local region prior to thresholding.Therefore, a total of 24 features (LGS+SI) are extracted from atypical local patch to be used in CAD system [4]. Although n andλj are chosen empirically based on the observations of shape andtextural characteristics of normal and TIB patterns during thetraining step, one may propose to use cross validation, controlof the global and local false discovery rate, and uncertaintyprinciples to decide those parameters near-optimally [30].
C. Conventional Texture Features
Steerable Features: It has been well documented in the litera-ture that decomposition of images by using basis functions local-ized in spatial position, orientation, and scale (e.g., wavelets) areextremely useful in object recognition and detection [32], [33].Since steerable filters are rotation and translation invariant,they accurately represent the underlying image structure [34].In this study, we use steerable derivative of Gaussian filtersto decompose local regions around each candidate pattern intoseveral oriented basis. These basis are used as features in voxel-wise classification for TIB identification. We extract steerablefeatures (i.e., directional derivatives) from one scale and sixdifferent orientations.
Gray-Level Co-Occurrence Matrix (GLCM) Features: Spa-tial statistics based on GLCM [35] are shown to be very useful indiscriminating and quantifying patterns pertaining to lung dis-eases. As texture can give a lot of insights into the classificationand characterization problem of poorly defined lesions, regions,and objects, we combine our proposed shape-based invariantswith Haralick’s popular GLCM-based features [35]. We extract18 features from each local patch including autocorrelation,contrast, entropy, variance, dissimilarity, homogeneity, clustershade, energy, maximum probability, sum of squares of variance,sum of averages, sum of variance, sum of entropy, difference ofentropy, difference of variance, normalized inverse differencemoment, cluster prominence, and mutual information. Read-ers are encouraged to refer to [35] for further details on thesewell-established features in machine learning, and [12]–[15] for
particular CAD systems in identification of lung abnormalitiesfrom CT scans in general.
IV. EXPERIMENTS AND RESULTS
A. Data
Laboratory confirmed (with pathology identification tests) 39CTs of human parainfluenza (HPIV) infection and 21 normallung CTs were collected for the experiments. All patients wereimaged at our institution using a 64-detector row Philips Bril-liance or a 320-detector row Toshiba Aquilion CT scanner. Thenoncontrasted chest CT studies were performed at end inspi-ration with 1.0 or 2.0 collimation obtained at 10- or 20-mmintervals from the base of the neck to upper abdomen with atube voltage of 120 kV and a current of 200–320 mA dependingon the subject’s weight. Imaging data were constructed to 512× 512 matrices with slice thickness of 5 mm. The in-plane res-olution was affected by patients’ size and varied from 0.62 to0.82 mm. All 60 CT scans (both HPIV and normal) were col-lected from different subjects (no multiple scans from subjects).
B. Training Step
A well-trained radiologist [with more than nine years ex-perience (DMJ)] carefully examined the complete scan (i.e.,60 CTs) and labeled the lung regions as normal and abnormal(with TIB patterns) (see Fig. 1). As many regions as possibleshowing abnormal lung tissues from 39 HPIV patients were la-beled (see Table I for details of the number of regions used inthe experiments). Those 39 patients do not include only TIBopacities, but also GGO, nodules, consolidations, and linearthickening such that only TIB regions are labeled in trainingstep. Note also that the control group consisting of 21 subjectswith no observed lung abnormalities was constructed and lungtissues pertaining to this group were labeled carefully.
In the training step, we also explored how the number ofb-scale patterns change for normal and diseased subjects. Ourobservations from detail analysis in candidate selection part

BAGCI et al.: AUTOMATIC DETECTION AND QUANTIFICATION OF TREE-IN-BUD (TIB) OPACITIES FROM CT SCANS 1627
Fig. 8. First row: lungs are divided into (left) three zones. Rough anatomicallocations separating zones are shown in (middle) coronal and (right) axial CTslices, respectively. Second row: visual grading scheme.
showed that only 21–40% of the segmented lung volumes werechosen as candidate TIB patterns. This interval was subjectto change based on the severity of the diseases. For patientswithout having infections (i.e., control group), for instance, thepercentage of the candidate regions was smaller than the pa-tients with infections; therefore, an increase in the amount ofsmall-sized b-scale patterns is observed. In any case, local scalecould be used as a quantitative measure validating the sensitiv-ity and specificity of the classification rates as we describe it inSection IV-E.
C. Visual Grading Scheme
Occurrences of TIB abnormality and normality of subjectswere noted for each CT scan. To analyze existence and severityof abnormality as well as normality of subjects, a visual gradingsystem was adapted from studies examining CT findings in otherinfections [36]–[38]. Each lung was divided into three zones (fora bilateral total of six) as shown in Fig. 8. Zone 1 included theapex to the carina. Zone 2 extended from the tracheal carina tothe left atrium’s junction with inferior pulmonary veins. Zone3 included the remainder of the lungs below the level of theinferior pulmonary veins atrial junction. A severity score (0 to 5such that 0 indicates no abnormality) was assigned to each zonebased on the percentage of the zone occupied as listed in Fig. 8(second row). A total score was also extracted by consideringall zones during visual grading. Consensus visual scores2 fromparticipating radiologists [one with more than nine years of ex-perience (DMJ) and one with more than one year of experience(AW)] on a scale of 0–5 over lungs were recorded and comparedwith computer scores (of the proposed CAD system). Followingthe same visual scoring scheme, another participating radiolo-gist [with more than seven years of experience (OA)], who wasblinded to the consensus visual scores previously obtained, wasinvolved in the visual grading process to provide informationon interobserver variability.
2Consensus visual scores were obtained when AW and DJM scored the casesby mutual agreement.
D. Quantitative Evaluations
To measure and evaluate the detection capabilities of a CADsystem quantitatively, the area under the receiver operator char-acteristic (ROC) curves is often used [39]. After the pro-posed CAD system was tested via twofold cross validationswith labeled dataset, we presented ROC curves of the systemperformances.
Table I summarizes the performance of the proposed CADsystem as compared to other feature sets. The performances arereported as the areas under the ROC curves (Az ). Note that pro-posed shape features (i.e., Willmore energy and parametricallyrelated local shape features) alone are superior to other meth-ods even though the dimension of the proposed shape featureis only 8. The best performance is obtained when we combinethe proposed shape and GLCM features. This is to be expectedbecause spatial statistics are incorporated into the shape featuressuch that texture and shape features are often complementary toeach other. On the other hand, compared to the proposed shapefeatures, the LGS and SI features have lower detection rates be-cause they are not affine (and Mobius) invariant and eventuallyhaving difficulty in appreciating the large amount of details ofTIB patterns. Another reason is that there is no optimal choiceof thresholding process and this may yield less remarkable sta-tistical measurements over local patches. However, the LGS andSI features alone perform better than the high-dimensional con-ventional features similar to the proposed shape features. Thisresult itself suggests the use of local shape features and theiradapted extensions in detection of TIB patterns.
In what follows, we selected the best window size for eachfeature set and plotted their ROC curves all in Fig. 9. Supe-riority of the proposed shape features is clear in all cases. Tohave a valid comparison, we repeated candidate selection stepfor all the methods because we observed that the CAD perfor-mances of compared conventional feature sets had much loweraccuracies if the candidate selection part was not applied (i.e.,proposed method’s accuracy was decreased to Az = 0.6803,while the best result of all compared methods were decreasedto Az < 0.5281). To show whether the proposed method wassignificantly different than the other methods, we compared theperformances through paired t-tests. p-values of the tests indi-cate that none of the feature set are significantly correlated withthe proposed CAD features such that highest and smallest p-values are reported as 0.0195 (p < 0.05) and 0.0053 (p < 0.01),respectively.
E. Qualitative Evaluations
Visual scoring by radiologists still lies at the heart of diagnos-tic decisions, and often used as a validation tool. In this section,we explore the correlation between computer score (i.e., CADscore) and visual scores by participating radiologists. Further-more, we investigate the effectiveness of the proposed method’sability to roughly discriminate normal and diseased patients byonly considering the size of the structures pertaining to lunganatomy.
Based on the visual grading scheme explained inSection IV-C, we compared the consensus reading of two expert

1628 IEEE TRANSACTIONS ON BIOMEDICAL ENGINEERING, VOL. 59, NO. 6, JUNE 2012
Fig. 9. Comparison of CAD performances via ROC curves of different feature sets.
Fig. 10. (a) Interobserver agreements given by Pearson product–moment correlation ratios. (b) Bland–Altman scatter plot is drawn for analysis of variability ofchange of scores between observers.
observers (AW and DJM) to another expert observer (OA),who was blinded to the consensus scores. We used Pearsonproduct–moment correlation coefficients to determine interob-server agreement over each zone, left, right, and all lung vol-umes. The reported correlation ratios are shown in Fig. 10(a).Note that interobserver agreement correlation values for all TIBmeasurements were high for all zones and the lung. The lowestagreement seen on the zone 1 may be because subtle abnor-malities in this zone may have been given greater visual assess-ment variance among the observers. Nevertheless, an overall
correlation coefficient of R2 = 0.8848 (p < 0.01) indicates anexcellent agreement on the existence of TIB patterns.
We further analyzed the variability of change of scores ofexpert radiologists for each subject. For this, we constructedBland–Altman plot [40] where the limits of observer agreementswere indicated by bias± 1.96 std (bias: average difference, std:standard deviation). In Bland–Altman plot, the difference of theperformances was plotted against the average of the perfor-mances as shown in Fig. 10(b). It was noted from this figurethat the largest disagreement of the scoring between observers

BAGCI et al.: AUTOMATIC DETECTION AND QUANTIFICATION OF TREE-IN-BUD (TIB) OPACITIES FROM CT SCANS 1629
Fig. 11. Visual grading versus computer evaluation. A Pearson product–moment correlation of R2 = 0.824 is reported.
never exceeded 1.2 over six levels of scores, validating thegood agreement shown by Pearson product–moment correlationcoefficients.
To obtain an overall computer score from the proposed CADsystem, on the other hand, TIB regions detected by the CADsystem were first labeled automatically during the detection pro-cess. Then, a computer score was calculated by averaging thevolume occupied by the labeled TIB regions over the whole lungvolume. Calculated computer score was then normalized to fitthe visual grading scheme explained in Section IV-C. Linear re-gression model was fitted to all subjects’ scores both from com-puter and the consensus scores of the participating radiologists(DMJ and AW) and Pearson product–moment correlation coef-ficient was computed for this model. A scatter plot of the linearregression model and the computer–observer agreement corre-lation is shown in Fig. 11. It is clear from this plot that visual andquantitative assessments correlate well as indicated by the Pear-son product–moment correlation of R2 = 0.824 (p < 0.01). Fi-nally, we illustrate an example of TIB and non-TIB region clas-sification by expert annotation and computer quantification byour proposed method in Fig. 12(a) and (b), respectively.
Scale-based analysis: In addition to visual scoring scheme,we also show the effectiveness of the proposed scale-basedmethod on quantification of the disease extent and identifica-tion. Scale-based analysis of the regions occupied by TIB pat-terns is illustrated in Fig. 13. A CT slice of a patient with HPIVshows fewer large homogeneous regions (green) with respectto a normal control. It also shows a greater number of smallhomogeneous regions (yellow and red).
Fig. 14, on the other hand, shows deviations of the numberof scale patterns over normal and disease cases. For each scale
Fig. 12. Random slice from an example HPIV case for quantification is shown.(a) Expert annotation of TIB (blue) and non-TIB (green) regions. (b) Computerquantification of TIB (blue) and non-TIB (green) regions.
Fig. 13. First column: segmented lungs. Second column: patterns occupyingin small homogeneous regions. Third column: patterns occupying in large homo-geneous regions. Note that patient with HPIV shows large number small-scalepatterns, and less number of large-scale patterns.
Fig. 14. Diseased with HPIV (in blue). Normal controls (in red). Curvesshow mean and standard deviation values of number of patterns in scales 1 to10. Patients with HPIV show more small-scale patterns and fewer number oflarge-scale patterns.
(from 1 to 10), we recorded the average number of b-scale pat-terns. As readily seen from both curves, the existence of TIB pat-terns was indicated through the small number of highly homoge-neous regions (i.e., small number of large b-scale patterns) andlarge number of less homogeneous regions (i.e., large numberof small b-scale patterns). This figure validated the qualitative

1630 IEEE TRANSACTIONS ON BIOMEDICAL ENGINEERING, VOL. 59, NO. 6, JUNE 2012
TABLE IICOMPUTATIONAL COST ANALYSIS OF THE METHODS
results shown in Fig. 13. The difference between two curveswas at statistically significant level (p < 0.01).
F. SVM Classification, Computational Cost, and AlgorithmDetails
All programs used in this study were developed using gcc4.5 (Copyrigth (C) 2010 Free Software Foundation) on a Linuxplatform (Pardus), and all statistical computations were pro-cessed in R (Version 2.12.2) and MATLAB (Copyright (C)2010 Mathworks). All the programs were executed on anIntel (R) Core(TM) i7 CPU 930 at 2.80 GHz with 12 GB RAMworkstation. While segmentation of lung regions from CT scanstakes only about 10 s, the b-scale encoding algorithm takes acouple of minutes (average 2 min, at most 5 min). The timerequired to compute b-scale scenes changes from patient topatient due to different number of slices in CT scans. Detailsof the computational cost analysis for segmentation of lungs,and feature extractions for particular algorithms are enlisted inTable II.
A further feature selection method such as a principal compo-nent analysis might be used to reduce the dimension of steerablefeatures that we used only for comparison purposes. Note thatthe proposed features are having a small number of dimensionper local patch; there is not necessarily an additional featureselection method needed; hence, it is outside the scope of thispaper.
Briefly, the whole dataset was randomly divided into train-ing and test sets of 30 CT scans (20 HPIV-10 Normal ver-sus 19 HPIV-11 Normal). Parameters of the SVM classifierwere learned based on the CT scans pertaining to training set.SVM regression was based on pixel-wise classification [42].Followed by feature extraction step, the trained SVM classifierwas applied to the test set. Note also that we have used twofoldcross-validation technique for training and testing; therefore, wechanged the role of training and testing dataset in the secondfold. We also noticed that there was no significant changes intraining and test performances of SVM classifications if twofoldcross validation was changed into n-fold cross-validation sys-tem with n > 2. In addition, we have used Efron’s bootstrap [43]method (i.e., repeating the experiments 100 times based on theactual data) to assess the variability of the estimated classifi-cations derived from SVM regressions, and provide confidenceintervals for ROC curves.
We used radial basis functions as kernel of SVM, and set toepsilon parameter of SVM as 0.1 [42]. Resulting SVM values of
pixels are ranging from 0 to 1. This value indicates the likelihoodof a local patch belonging to a certain class (TIB or non-TIB);low ratings indicate a non-TIB region, and high ratings indicatea TIB region. Soon after the SVM values were computed forthe entire lung, we changed the cutoff values of SVM (0.5 asdefault) several times to obtain ROC curves.
V. DISCUSSION
In this paper, we studied a very particular, yet important, pat-tern of lung abnormality observed in chest CTs. Our proposeddetection system is tuned to detect TIB regions from non-TIBregions; therefore, a multiclass classifier (with specifically tuneddetection filters for each abnormality class) might be needed asan extension of this study to detect as much abnormality as pos-sible in a whole system. Although such a system will bring itsunique challenges into the CAD platform, it would be a valu-able second opinion tool for radiologists. As a further step, weare currently investigating combining different imaging patternspertaining to lung abnormalities as well as clinical laboratoryinformation into our CAD system.
One question arises as to the use of high-resolution CT(HRCT) scans instead of conventional CT scans in detectingTIB patterns, as well as the effect of using HRCT scans in thisprocess. Although HRCT scans appreciate detection of smallnodular patterns, they have more noise and lungs might not befully covered due to large gaps between slices (i.e., 10–30 mm).Furthermore, at our institution and in many other institutions,the protocol for acute pulmonary infection is 5 mm contigu-ous slice images of the chest without IV contrast, for which weadapted our CAD method. Nevertheless, the method we presentis not data dependent and can be used for HRCT scans as well.
Considering 2-D computation of b-scale scenes, one maydoubt if the algorithm can be extended into 3-D. Based on ourobservations on appearance and location of TIB patterns overthe lung regions and experiences on feature extraction in 3-D,as we stated previously, TIB patterns rarely extend in depthdirection for more than a few slices due to constraints of low-resolution imaging direction. Therefore, there is no significantclassification rate changes in 3-D; however, there is an increasein computational cost. Nevertheless, 3-D b-scale encoding andfeature extraction for a similar pattern detection problem or thesame problem with high-resolution images (with thinner slicethickness compared to low-resolution CT images) can readilybe combined and used with similar accuracies reported in thisstudy.
Number of large and small b-scale patterns might perhapsbe used to identify other type of abnormality patterns such asGGO and consolidations where we expect to have more largeb-scale patterns than small b-scale patterns. Therefore, as anextension of this study, we will tune our proposed methodologywith different types of abnormalities to generalize the CADsystems for infectious lung diseases in general.
Our proposed method is capable of detecting and quantifyingTIB patterns very accurately as validated by the statistical testscompared to the expert annotations (i.e., ground truth). There-fore, both in detection and quantification steps, the proposed
BAGCI et al.: AUTOMATIC DETECTION AND QUANTIFICATION OF TREE-IN-BUD (TIB) OPACITIES FROM CT SCANS 1631
CAD system will highly possibly be helpful for clinicians as asecond opinion tool in routine clinical examinations.
VI. CONCLUDING REMARKS
In this study, we have proposed b-scale-based binary classifi-cation approach for automatic TIB pattern detection and quan-tification from chest CTs. The proposed system integrates 1) fastlocalization of candidate TIB patterns through b-scale filteringand scale selection, and 2) combined shape and textural featuresto identify TIB patterns. Note that texture-based recognitionmethods offer a complementary view to shape-based methods;therefore, the integration of spatial information and the pro-posed shape features achieves high detection rates. Moreover,our proposed local shape features illustrate the usefulness of theinvariant properties, Willmore energy in particular, to analyzeTIB patterns in chest CT. We have also compared computerscoring of the proposed CAD system with subjective visualgrading. A high correlation between objective (CAD) and sub-jective (visual grading) scores is obtained, which implies highlysatisfactory accuracy of the proposed CAD system.
REFERENCES
[1] D. M. Hansell, “Imaging the lungs with computed tomography,” IEEEEng. Med. Biol. Mag., vol. 19, no. 5, pp. 71–79, Sep./Oct. 2000.
[2] U. Bagci, M. Bray, J. Caban, J. Yao, and D. J. Mollura, “Computer-assisted detection of infectious lung diseases: A review,” Comput. Med.Imag. Graph., vol. 36, no. 1, pp. 72–84, 2011.
[3] U. Bagci, J. Yao, J. Caban, A. F. Suffredini, T. Palmore, and D. J. Mollura,“Learning shape and texture characteristics of CT tree-in-bud opacities forCAD systems,” in Proc. 14th Int. Conf. Med. Image Comput. Comput.-Assisted Intervention, 2011, vol. 14, pp. 215–222.
[4] U. Bagci, J. Yao, J. Caban, T. Palmore, A. F. Suffredini, and D. J. Mollura,“Automatic detection of tree-in-bud patterns for computer assisted diag-nosis of respiratory tract infections,” Proc. IEEE Eng. Med. Biol. Soc.,2011, 5096–5099.
[5] D. J. Mollura, D. S. Asnis, R. S. Crupi, R. Conetta, D. S. Feigin, M. Bray,J. K. Taubenberger, and D. A. Bluemke, “Imaging findings in a fatal caseof pandemic swine-origin influenza A (H1N1),” Amer. J. Roentgenol.,vol. 193, no. 6, pp. 1500–1503, 2009.
[6] D. M. Hansell, A. Bankier, H. MacMahon, T. C. McLoud, N. L. Muller,and J. Remy, “Fleischner society: Glossary of terms tor thoracic imaging,”Radiology, vol. 246, no. 3, pp. 697–722, 2008.
[7] E. Eisenhuber, “The tree-in-bud sign,” Radiology, vol. 222, no. 3, pp. 771–772, 2002.
[8] U. Bagci, J. Yao, J. Caban, T. Palmore, A. Suffredini, and D. J. Mollura,“Learning shape and texture characteristics of CT tree-in-bud opacitiesfor CAD systems,” ArXiv, 2011.
[9] P. K. Saha, J. K. Udupa, and D. Odhner, “Scale-based fuzzy connectedimage segmentation: Theory, algorithms, and validation,” Comput. Vis.Image Understand., vol. 77, pp. 145–174, 2000.
[10] S. Hu, E. A. Hoffman, and J. M. Reinhardt, “Automatic lung segmentationfor accurate quantification of volumetric X-ray CT images,” IEEE Trans.Med. Imag., vol. 20, no. 6, pp. 490–498, Jun. 2001.
[11] S. G. Armato and W. F. Sensakovic, “Automated lung segmentation forthoracic CT: Impact on computer-aided diagnosis,” Acad. Radiol., vol. 11,no. 9, pp. 1011–1021, 2004.
[12] V. A. Zavaletta, B. J. Bartholmai, and R. A. Robb, “High resolution mul-tidetector CT-aided tissue analysis and quantification of lung fibrosis,”Acad. Radiol., vol. 14, no. 7, pp. 772–787, 2007.
[13] P. D. Korfiatis, A. N. Karahaliou, A. D. Kazantzi, C. Kalogeropoulou,and L. Costaridou, “Texture-based identification and characterization ofinterstitial pneumonia patterns in lung multidetector CT,” IEEE Trans.Inf. Technol. Biomed., vol. 14, no. 3, pp. 675–680, May 2009.
[14] N. Kim, J. B. Seo, Y. Lee, J. G. Lee, S. S. Kim, and S. H. Kang, “Develop-ment of an automatic classification system for differentiation of obstructivelung disease using HRCT,” J. Digital Imag., vol. 22, no. 2, pp. 136–148,2009.
[15] J. H. Lim, N. Kim, J. B. Seo, Y. K. Lee, Y. Lee, and S. H. Kang, “Regionalcontext-sensitive support vector machine classifier to improve automatedidentification of regional pattern of diffuse interstitial lung disease,” J.Digital Imag., vol. 24, no. 6, pp. 1133–1140, 2011.
[16] P. K. Saha and J. K. Udupa, “Scale-based diffusive image filtering pre-serving boundary sharpness and fine structures,” IEEE Trans. Med. Imag.,vol. 20, no. 11, pp. 1140–1155, Nov. 2001.
[17] U. Bagci, X. Chen, and J. K. Udup, “Hierarchical scale based multiob-ject recognition of 3-D anatomical structures,” IEEE Trans. Med. Imag.,vol. 31, no. 3, pp. 777–789, Mar. 2012.
[18] P. K. Saha, “Tensor scale: A local morphometric parameter with appli-cations to computer vision and image processing,” Comput. Vis. ImageUnderstand., vol. 99, no. 3, pp. 384–413, 2005.
[19] A. Madabhushi, J. K. Udupa, and A. Souza, “Generalized scale: Theory,algorithms, and application to image inhomogeneity correction,” Comput.Vis. Image Understand., vol. 101, no. 2, pp. 100–121, 2005.
[20] J. Liu, J. Yao, and R. Summers, “Scale-based scatter correction forcomputer-aided polyp detection in CT colonography,” Med. Phys., vol. 35,no. 2, pp. 5664–5671, 2008.
[21] L. Nyul, J. K. Udupa, and P. K. Saha, “Incorporating a measure of localscale in voxel-based 3-D image registration,” IEEE Trans. Med. Imag.,vol. 22, no. 2, pp. 228–237, Feb. 2003.
[22] E. I. Bobenko and P. Shroder, “Discrete willmore flow,” in Proc. Euro-graph. Symp. Geom. Process., 2005, pp. 101–110.
[23] R. Bryant, “A duality theorem for Willmore surfaces,” J. DifferentialGeom., vol. 20, pp. 23–53, 1984.
[24] P. B. Canham, “The minimum energy of bending as a possible explanationof the biconcave shape of the human red blood cell,” J. Theor. Biol., vol. 26,pp. 61–76, 1970.
[25] M. Droske and M. Rumpf, “A level set formulation for Willmore flow,”Interface Free Boundaries, vol. 6, pp. 361–378, 2004.
[26] J. J. Koenderink and A. J. van Doorn, “Surface shape and curvature scales,”Image Vis. Comput., vol. 10, pp. 557–565, 1992.
[27] M. Lillholm and L. D. Griffin, “Statistics and category systems for theshape index descriptor of local 2nd order natural image structure,” ImageVis. Comput., vol. 27, no. 6, pp. 771–781, 2009.
[28] Z. Tu, S. Zheng, and A. Yuille, “Shape matching and registration by data-driven EM,” Comput. Vis. Image Understand., vol. 109, pp. 290–304,2007.
[29] I. B. Ayed, A. Mitiche, and Z. Belhadj, “Polarimetric image segmentationvia maximum-likelihood approximation and efficient multiphase level-sets,” IEEE Trans. Pattern Anal. Mach. Intell., vol. 28, no. 9, pp. 1493–1500, Sep. 2006.
[30] D. Donoho and I. Johnstone, “Minimax risk Ip-balls for Iq -error,”Probab. Theory Relat. Fields, vol. 2, pp. 277–303, 1994.
[31] A. Barbu, M. Shling, X. Xu, D. Liu, S. K. Zhou, and D. Comaniciu,“Automatic detection and segmentation of axillary lymph nodes,” in Proc.Med. Image Comput. Comput.-Assisted Intervention Conf., 2010, pp. 28–36.
[32] Y. Zheng, B. Georgescu, A. Barbu, M. Scheuering, and D. Comaniciu,“Four-chamber heart modeling and automatic segmentation for 3D cardiacCT volumes using marginal space learning and steerable features,” IEEETrans. Med. Imag., vol. 27, no. 11, pp. 1668–1681, Nov. 2008.
[33] U. Bagci and B. Li, “Parallel AdaBoost algorithm for Gabor wavelet se-lection in face recognition,” in Proc. 15th IEEE Int. Conf. Image Process.,2008, pp. 1640–1643.
[34] T. Freeman and E. H. Adelson, “The design and use of steerable filters,”IEEE Trans. Pattern Anal. Mach. Intell., vol. 13, no. 9, pp. 891–906, Sep.1991.
[35] R. M. Haralick, K. Shanmugam, and I. Dinstein, “Textural features forimage classification,” IEEE Trans. Syst., Man, Cybern., vol. 3, no. 6,pp. 610–621, Nov. 1973.
[36] P. P. Agarwal, S. Cinti, and E. A. Kazerooni, “Chest radiographic andCT findings in novel swine-origin influenza A (H1N1) virus (S-OIV)infection,” Amer. J. Roentgenol., vol. 193, pp. 1488–1493, 2009.
[37] F. Ors, O. Deniz, U. Bozlar, S. Gumus, M. Tasar, E. Tozkoparan, C. Tayfun,H. Bilgic, and B. J. Grant, “High-resolution CT findings in patients withpulmonary tuberculosis: Correlation with the degree of smear positivity,”J. Thoracic Imag., vol. 22, pp. 154–159, 2007.
[38] R. Eibel, P. Herzog, O. Dietrich, C. T. Rieger, H. Ostermann, M. F. Reiser,and S. O. Schoenberg, “Pulmonary abnormalities in immunocompromised

1632 IEEE TRANSACTIONS ON BIOMEDICAL ENGINEERING, VOL. 59, NO. 6, JUNE 2012
patients: Comparative detection with parallel acquisition MR imaging andthin-section helical CT,” Radiology, vol. 241, pp. 880–891, 2006.
[39] P. Khurd, B. Liu, and G. Gindi, “Ideal AFROC and FROC observers,”IEEE Trans. Med. Imag., vol. 29, no. 2, pp. 375–385, Feb. 2010.
[40] J. M. Bland and D. G. Altman, “Statistical methods for assessing agree-ment between two methods of clinical measurement,” Lancet, vol. 327,no. 8476, pp. 307–310, 1986.
[41] X. Chen and U. Bagci, “3D automatic anatomy segmentation based oniterative graph-cut-ASM,” Med. Phys., vol. 38, no. 8, pp. 4610–4622,2011.
[42] J. Yao, A. Dwyer, R. M. Summers, and D. J. Mollura, “Computer-aideddiagnosis of pulmonary infections using texture analysis and support vec-tor machine classification,” Acad. Radiol., vol. 18, no. 3, pp. 306–314,2011.
[43] B. Efron, The Jackknife, the bootstrap, and other resampling plans.Philadelphia, PA: SIAM, 1982.
Authors’ photographs and biographies not available at the time of publication.