16 annual report - nicgh.orgnicgh.org/wp-content/uploads/2018/02/nic_annual-report_2016.pdf · 2016...
TRANSCRIPT

& FINANCIAL STATEMENTSANNUAL REPORT16

National Insurance Commission2016 | Annual Report

National Insurance Commission
For More Information And Reservation, Please Call The Following Numbers 0302 238300 | 0302 238301
Location: Appiah-Ampofo House, Independence Ave, National Insurance CommissionTel: 233 302 238 300/1 | Fax: 233 302 237 248 | Email: [email protected] | Website: www.nicgh.Org
Ultra Modern Hall | Modern and State of the Art Facilities | Secured and Large Car Park | Central Location | Competitive Price | Spacious Lawns
NATIONAL INSURANCE COMMISSION Appiah-Ampofo House
Standard Conference Package Hall Rental (Seating Capacity 200)Power Point ProjectorP.A SystemOne Co�ee BreakBu�et Lunch Mineral WaterNote Pad, Folder And PenInternet Connectivity
Foreword 7
Chairman’s Report 8
The National Insurance CommissionCorporate Information 11
NIC’s Operations 12
Ghana Insurance Market Report2016 Economic Review 21
Ghana Insurance Market Report (2012 – 2016) 22
Financial & Ratio Analysis 36
Appendices2016 NIC Financial Reports 72
2016 Fire Maintenance Fund Financial Reports 86
List of Registered Insurance Companies 96
List of Registered Reinsurance Companies 103
List of Registered Broking Companies 104
Content
s

2016 Annual Report National Insurance Commission
6

2016 Annual Report National Insurance Commission
2016 Annual Report National Insurance Commission
7
FOREWORDIntroductionThe National Insurance Commission (NIC) issued the Governance and Risk Management framework in 2015. The activities of NIC in 2016 was geared at ensuring that the principles and values set out in the Governance and Risk Management framework are embedded in the regulated entities operations.
To this end, the NIC organised a number of workshops for key stakeholders in the insurance industry to educate them on what is expected of them in relation to the Governance and Risk Management framework.
In addition, the NIC worked to ensure that all the regulated entities were appropriately capitalised as per the NIC requirements. This was coupled with on-site inspections to ensure that firms have adequate measures in place to mitigate the risks inherent in their operations.
New Insurance Act
The NIC is in the process of reviewing the Insurance Act to make it more appropriate, given the changes witnessed in the insurance landscape. This will also ensure that the new Insurance bill, if passed into an Act, will be compliant with the most recent Insurance Core Principles (ICPs) of the International Association of Insurance Supervisors (IAIS).
The frameworks, directives and guidelines that the NIC has issued in the recent past will be included in the new Insurance Act. Other new areas to be included are as follows:
Group-Wide Supervision
It is generally accepted that the stand-alone view of an insurance company, which is part of a group of companies, does not give a full picture of the risks that policyholders are exposed to. This is the main risk that the following ICPs seeks to mitigate:
■ ICP 23: Group Wide Supervision
■ ICP 24: Macro Prudential Surveillance and Insurance Supervision
■ ICP 25 & 26: Cross Boarder Collaboration of the Supervision of Insurance Groups that are in more than one country.
However, a group-wide approach to the regulation of insurance groups is not currently part of the insurance regulations in Ghana. One of the key activities that the NIC will undertake in the coming years is to implement
a Group-wide supervisory framework.
Risk Based Capital Requirements
A key component of Risk Based Solvency Regime is Risk Based Capital Requirements. Risk Based Capital Requirement seeks to ensure that the capital requirement of an insurer is commensurate with the risks the insurer faces.
This will encourage robust risk management practices in (re) insurance companies in Ghana, as firms with robust risk management framework will hold less capital.
The introduction of the Risk Based Capital requirements will ensure that the regulation of insurance in Ghana is in line with international best practices such as Solvency II in EU, SAM in South Africa and C-ROSS in China. It will also make our regulations compliant with the ICPs.
Compulsory Insurance
There are currently two insurance products that are compulsory in Ghana. These are:
■ Third Party Motor Insurance
■ Fire Insurance for Private Commercial Buildings.
In addition to this, the NIC is considering other insurance products that should be compulsory. The aim of this exercise is to protect life and property as well as increase insurance penetration.

2016 Annual Report National Insurance Commission
8
1. INTRODUCTION
The National Insurance Commission (NIC) implemented various reforms in 2016. The Commission issued guidelines on Financial Conditions Reports, approval of Commission Rates, introduced the Risk Based Capital Requirement and Group-wide Supervision Framework. The Commission also organised workshops for key stakeholders to educate them on the corporate governance and risk management frameworks.
All the initiatives taken and directives or guidelines issued in 2016 were aimed at improving the operational efficiency of the regulated entities.
2. GUIDELINES ON COMMISSION RATES
The NIC in accordance with the requirements of section 77 of the Insurance Act 2006, Act 724 approved minimum commission rates payable to insurers and brokers for overseas facultative reinsurance placements of global multinational businesses by foreign intermediaries on the Ghanaian market.
3. ANTI-MONEY LAUNDERING AND COUNTER-ING THE FINANCING OF TERRORISM (AML/CFT)
Based on the Financial Action Task Force on Money Laundering (FATF) recommendations, the insurance industry was subjected to second round mutual evaluation in 2016. The Commission issued guidelines on Know Your Customer (KYC), Customer Due Diligence (CDD), Enhance Due Diligence (EDD), Beneficial Ownership, Independent Audit Assessment, Suspicious Transaction Reports, Record Keeping and Monitoring of Employee Conduct.
4. ENFORCEMENT OF COMPULSORY FIRE IN-SURANCE OF PRIVATE COMMERCIAL BUILD-INGS
The Compulsory Fire Insurance Task Force undertook several enforcement actions in Accra, Takoradi, Cape Coast, Tamale, Wa and Bolgatanga during the year under consideration. They inspected five hundred and seventy-three (573) Commercial buildings to demand evidence of compulsory fire insurance cover.
Out of the 573 buildings inspected 344 of them had procured compulsory fire insurance policies while the remaining 229 had not procured one as required under the Law.
The task force therefore arrested managers of the buildings and threatened to prosecute them if they failed to comply with the directive. They were further requested to report back to the various Police Headquarters with evidence of compliance.
Thereafter, managers of the 229 buildings had duly complied with the directive, with majority of them complying within 48 hours of arrest.
5. IMPLEMENTATION OF SOLVENCY FRAME-WORK
The New Solvency Frameworks for Life and Non-Life insurers were issued during the year after extensive consultations with all stakeholders on the Framework. This guideline uses a risk-sensitive approach to determining the solvency of insurance companies. The compliance date for the new solvency framework was 31st December, 2016.
In view of the above the commission issued a directive in 2016 to all life, non-life and reinsurance companies to maintain the recommended solvency levels.
6. IMPLEMENTATION OF GOVERNANCE AND RISK MANAGEMENT FRAMEWORK
The NIC as part of measures to adopt the Risk-Based approach to Supervision of Insurers, developed a Governance and Risk Management Framework to guide the operational activities of insurers as well as enhance the effective supervision of the Insurance and Reinsurance Companies.
Subsequent to the issuance of the frameworks the Commission organised capacity building seminars for Boards and Risk management control functions of all insurance and reinsurance companies to facilitate effective implementation. The Commission further issued directives on the requirements of the frameworks.
CHAIRMAN’S REPORTMr. Lionel Molbila

2016 Annual Report National Insurance Commission
2016 Annual Report National Insurance Commission
9
7. RISK BASED SUPERVISION AND LEGAL FRAME-WORK
Risk Based On-Site inspections: In line with the implementation of its Risk Based Supervision Framework, the NIC inspected a number of companies to enable it determine their Risk Rating and the way forward.
The Commission provided feedback on a set of the financial condition reports (FCR) submitted by companies. A key part was the need for regular stress and scenario testing.
The Commission issued a directive that set out the minimum set of stresses and scenarios that companies are required to undertake as part of the FCR reports.
8. INDUSTRY PERFORMANCE
Some key performance indicators of the industry is summarised below:
LIFE
2016 (GHS M) 2015 (GHS M) GROWTH RATE
TOTAL ASSETS 2241 1744 28%
TOTAL INVESTMENTS 1939 1465 32%
ACTUARIAL LIABILITIES 1434 1165 23%
TOTAL CAPITALIZATION 649 463 40%
NON-LIFE
2016 (GHS M) 2015 (GHS M) GROWTH RATE
TOTAL ASSETS 1506 1320 14%
TOTAL INVESTMENTS 886 620 43%
TECHNICAL PROVISIONS 547 566 (3.4)%
TOTAL CAPITALIZATION 704 545 29%
Industry gross premium amounted to GHC 1,929million at year end 2016. This represents a growth of 24% from GHC 1,560million over the same period in 2015. Total premium for life insurance stood at GHC 859m while non-life business amounted to GHC 1070m. This represented a contribution of 45% and 55% respectively in 2016 compares with a similar contribution of 45% and 55% in 2015.
YEAR PREMIUM INCOME(GHS M) GROWTH RATE
2016 1,928,838,573 24%
2015 1,560,679,185 26%
2014 1,239,853,442 17.8%
2013 1,052,090,981 23.6%
2012 850,657,054 35.3%
2011 628,528,775 37.2%
2010 458,117,746 33.5%
2009 342,973,719
9. INSURANCE PENETRATION
Insurance penetration is still very low in the country. Insurance penetration, which is defined as the contribution of total insurance premiums to Gross Domestic Product (GDP) is still less than 2%. Conscious efforts are being made to improve the penetration through the encouragement and development of microinsurance as well as the enforcement of compulsory insurances in the country.
10. CONCLUSION
The year 2016 was likewise interesting but challenging as many difficult decisions were made. It included Directives on the implementation of the New Solvency Requirements and Risk Based Onsite Inspections; implementation of Governance and Risk Management Framework; and Financial Condition Reports (FCR).
These developments and directives will assist to improve operational efficiency of the insurance industry.
2016 Annual Report National Insurance Commission
10
CORPORATE INFORMATION
2016 Annual Report National Insurance Commission
2016 Annual Report National Insurance Commission
11
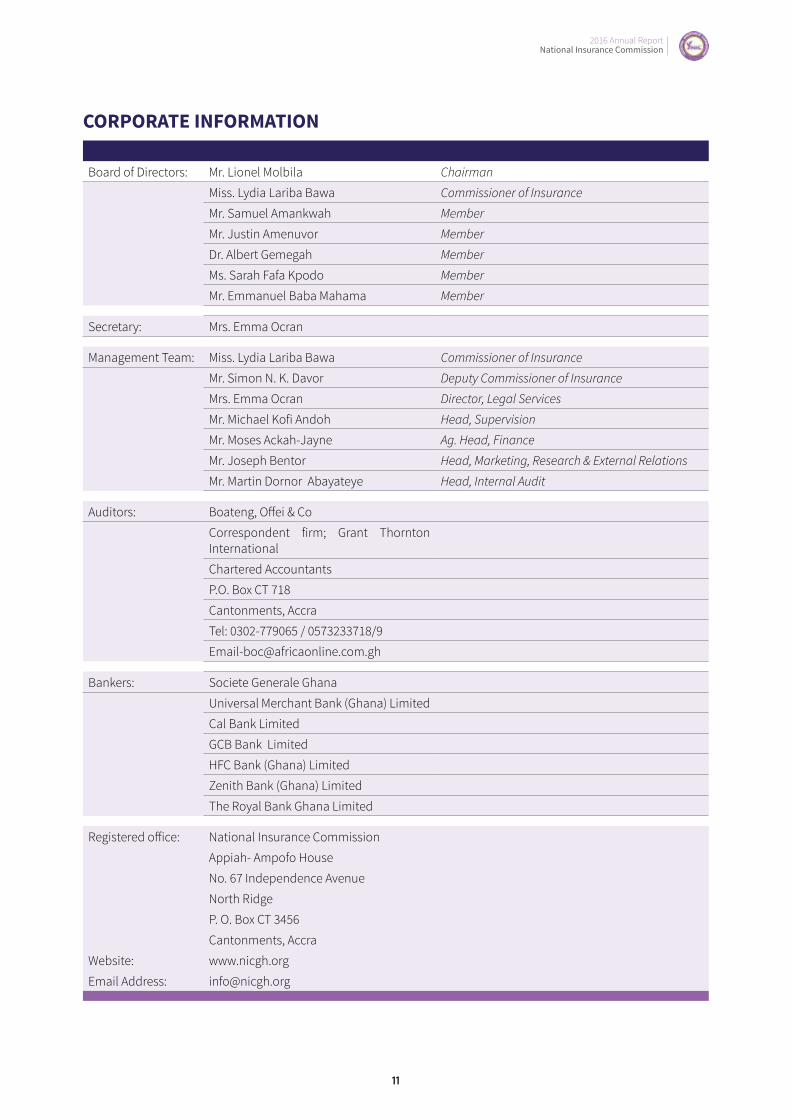
CORPORATE INFORMATION
Board of Directors: Mr. Lionel Molbila Chairman
Miss. Lydia Lariba Bawa Commissioner of Insurance
Mr. Samuel Amankwah Member
Mr. Justin Amenuvor Member
Dr. Albert Gemegah Member
Ms. Sarah Fafa Kpodo Member
Mr. Emmanuel Baba Mahama Member
Secretary: Mrs. Emma Ocran
Management Team: Miss. Lydia Lariba Bawa Commissioner of Insurance
Mr. Simon N. K. Davor Deputy Commissioner of Insurance
Mrs. Emma Ocran Director, Legal Services
Mr. Michael Kofi Andoh Head, Supervision
Mr. Moses Ackah-Jayne Ag. Head, Finance
Mr. Joseph Bentor Head, Marketing, Research & External Relations
Mr. Martin Dornor Abayateye Head, Internal Audit
Auditors: Boateng, Offei & Co
Correspondent firm; Grant Thornton International
Chartered Accountants
P.O. Box CT 718
Cantonments, Accra
Tel: 0302-779065 / 0573233718/9
Bankers: Societe Generale Ghana
Universal Merchant Bank (Ghana) Limited
Cal Bank Limited
GCB Bank Limited
HFC Bank (Ghana) Limited
Zenith Bank (Ghana) Limited
The Royal Bank Ghana Limited
Registered office: National Insurance Commission
Appiah- Ampofo House
No. 67 Independence Avenue
North Ridge
P. O. Box CT 3456
Cantonments, Accra
Website: www.nicgh.org
Email Address: [email protected]
2016 Annual Report National Insurance Commission
12
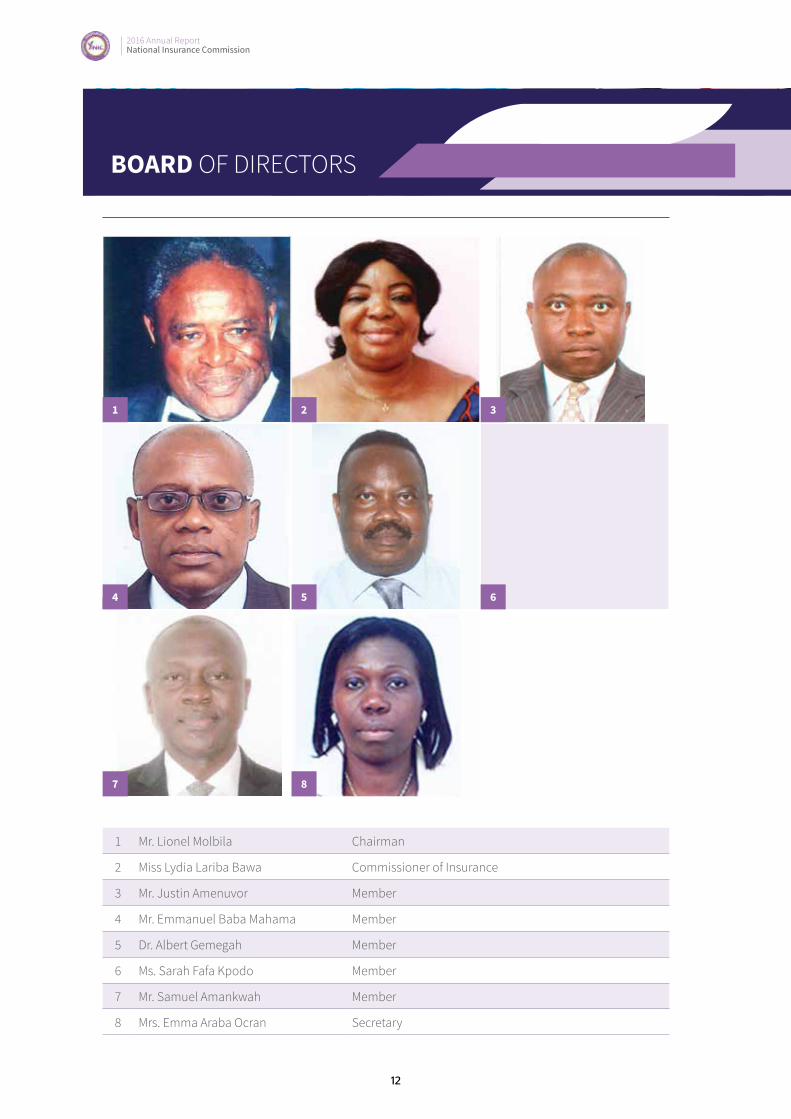
1 Mr. Lionel Molbila Chairman
2 Miss Lydia Lariba Bawa Commissioner of Insurance
3 Mr. Justin Amenuvor Member
4 Mr. Emmanuel Baba Mahama Member
5 Dr. Albert Gemegah Member
6 Ms. Sarah Fafa Kpodo Member
7 Mr. Samuel Amankwah Member
8 Mrs. Emma Araba Ocran Secretary
BOARD OF DIRECTORS
1
4
7
2
5
8
3
6

2016 Annual Report National Insurance Commission
2016 Annual Report National Insurance Commission
13
1
5
2
6
3 4
7
1 Miss Lydia Lariba Bawa Commissioner of Insurance
2 Mr. Simon N. K. Davor Deputy Commissioner of Insurance
3 Mrs. Emma Araba Ocran Director, Legal Services
4 Mr. Michael Kofi Andoh Head, Supervision
5 Mr. Joseph Bentor Head, Marketing, Research & External Relations
6 Mr. Martin Dornor Abayateye Head, Internal Audit
7 Mr. Moses Ackah-Jayne Acting Head, Finance and Administration
MANAGEMENT

2016 Annual Report National Insurance Commission
14
LICENSINGA total of fourteen (14) companies were licensed in 2016. One (1) Life, two (2) Non-Life companies, one (1) Loss Adjuster, and ten (10) Broking companies. The year ended with twenty-seven (27) Non-life, twenty-four (24) Life, three (3) Reinsurance and seventy-eight (78) Broking companies.
The 2 non-life companies were Loyalty Insurance Company Limited, located within the Shippers’ Authority building in Accra, and Multi Insurance Company Limited, with its head office in Kumasi. African Life Assurance Limited was also licensed within the year.
I AM Loss Adjusters & Surveyors Ghana Limited was the second loss adjusting company to be licensed since the inception of the Insurance Act, 2006 (Act 724).
The ten (10) new entrants to the broking sector are listed below:
i. Insurance Management Services Limited
ii. Worldwide Insurance Brokers Limited
iii. IRisk Management Limited
iv. Risk Partners Limited
v. Pacific Insurance Brokers Limited
vi. Strategic Insurance Consult Limited
vii. Anchor Premier Brokerage Limited
viii. Ideal Insurance Brokers Limited
ix. K & A Insurance Brokers Limited
x. Supreme Trust Insurance Brokers Limited
MergerThe NIC also approved a merger between Regency Alliance Insurance Limited and Nem Insurance Ghana Limited to form RegencyNem Insurance Ghana Limited. The Company’s equity is owned 60% and
40% between Regency Alliance and Nem Insurance respectively.
Regulatory DevelopmentsOne of the key objectives of the NIC in 2016 was the embedding of the Governance and Risk Management Frameworks into the operations of the regulated entities. As part of this, the National Insurance Commission (NIC) in Conjunction with the Ghana Insurance College (GIC) organised Directors’ Colleges for the Boards of Insurance and Reinsurance Companies. The purpose of this was to set out what was expected of the Board with regards to corporate governance and risk management.
In addition to the training for the Boards, the NIC also organised workshops for the following control functions:
1. Risk Management function
2. Internal audit function
3. Compliance function
4. Actuarial function
The purpose of these training programme was to expose the control functions to what is required of them as control functions and the tools they can use to achieve these objectives.
Risk based on-site inspectionsDuring the year 2016, the National Insurance Commission (NIC) undertook a number of risk based inspections. This assessed the risks inherent in the firms and the internal controls the firms had in place to mitigate these risks.
Circulars and Guidelines issued in the year 2016The table below summarises the Circulars and Guidance issued by the NIC in 2016.
NIC OPERATIONS

2016 Annual Report National Insurance Commission
2016 Annual Report National Insurance Commission
15
No Circulars and Guidelines Issued for year 2016
1 Guidelines on Financial Condition Reports
2 Approval of Commission Rates
3 Minimum Commission Rates for overseas facultative reinsurance placements
4 Exclusion of flood from fire policies
5 Implementation of corporate governance and risk management for life, non-life and reinsurers
6 Implementation of solvency framework for life, non-life and reinsurers
7 Indebtedness of insurers and reinsurers
8 Investment In microinsurance and non-bank financial institutions
9 Stress and Scenario Testing
10 Submission of Reinsurance Treaty Programe for 2017
11 Prohibition of unlicensed business as insurance intermediary
Compulsory Fire Insurance EnforcementThe Compulsory Fire Insurance task force undertook several enforcement actions in Accra, Takoradi, Cape Coast, Tamale, Wa and Bolgatanga during the year under consideration. They inspected five hundred and seventy-three (573) commercial buildings to demand evidence of compulsory fire insurance cover.
Out of the 573 buildings inspected 344 of them had procured compulsory fire insurance policies while the remaining 229 had not procured one as required under the Law.
The task force therefore arrested managers of the buildings and threatened to prosecute them if they failed to comply with the directive. They were further requested to report back to the various Police Headquarters with evidence of compliance.
Thereafter, managers of the 229 buildings had duly complied with the directive, with majority of them complying within 48 hours of arrest.
Penalties and Fines As part of efforts to ensure compliance with provisions of the Insurance Act 2006, Act 724 and Guidelines, the Commission levied penalties against four (4) insurance companies.
The breaches involved the placement of facultative reinsurances without approval, violation of market conduct rules in respect of motor insurance, resignation of a Board Chairman without informing the Commission and violation of the No Premium No Cover (NPNC) directive.
Regional OfficesThe NIC continued to oversee the activities of its Regional Offices in Kumasi, Takoradi and Tamale.
The Tamale office is responsible for the Northern sector of the country, Takoradi office serves the Western and Eastern sector of the country whilst the Kumasi office serves the Ashanti and Brong-Ahafo Regions of the country.
During the year under review a new office was opened in Ho to serve the Volta and Eastern Regions of the country.
The three (3) offices continued to carry out their core functions namely; to receive complaints from the public and to resolve the complaints, conduct branch inspections of insurance companies, undertake public education activities and enforcement actions to ensure compliance with compulsory fire insurance law. Where complaints were beyond their capabilities they were referred to the head office in Accra for resolution.
Court CasesIGI Life Assurance Company Limited (IGI Life) and Industrial & General Insurance Company Limited (IGI General)
Following the Fast Track High Court’s Order for the Official Liquidation of the two (2) companies the Official Liquidator proceeded with the sale of the companies’ assets.
The total amount realised from the sale of the assets is as follows;
IGI General - GHS2,300,000.00
IGI Life - GHS362,200.00
The amounts stated above were paid to IGI General and IGI Life claimants on a pro-rata basis as follows:
IGI General - 40% of actual claim
IGI Life - 70% of actual claim

2016 Annual Report National Insurance Commission
16
E & E Platinum Investment vrs SIC Insurance Company Ltd, Ecobank Ghana Limited, National Insurance CommissionThe plaintiff E & E Platinum Investments Limited proceeded to the Commercial Division of the High Court and secured an Order for Garnishee Nissi against Ecobank, GCB Bank and the NIC as custodians of monies held on behalf of SIC Insurance Company.
SIC Insurance Company issued a Credit Guarantee Bond on behalf of T-7 Enterprise in favour of E & E Platinum Investments Limited. T-7 Enterprise defaulted and E&E Platinum called on the bond but SIC failed to honour the claim on suspicion of fraud.
E & E Platinum Investments Limited sued SIC Insurance Company and secured judgement for an amount of Twenty-three thousand Ghana Cedis (GHS23,000.00) and One hundred and ninety-two thousand, eight hundred and seventy-four US dollars (USD192,874) respectively.
At the request of the Lawyers of SIC, the parties involved agreed to withdraw the application for an order for Garnishee proceedings and settled the matter out of Court amicably and the Court granted the request.
CONSUMER COMPLAINTS In 2016, the Commission received 354 complaints from
the public. One hundred and thirty-eight (138) complaints had been resolved as at the end of 2016.
As has been the case in previous years, most of the complaints received related to motor claims. The areas of common complaints from persons pursuing motor claims were as follows:
Repudiation of claim by insurers
Delay in settlement of claims
Dispute over quantum
Delay in payment of settled claims.
The complaints received from life policyholders centered on the following areas:
Benefits promised by insurers differ from benefits on policy documents.
Insurance company’s failure to cease deductions after policy had been surrendered
Payment of low surrender values
Delay in processing matured policies for payment
Delay in returning refund of wrongful deductions
Unauthorized premium deductions
Failure by insurance companies to submit policy documents
TYPE OF COMPLAINTS TOTALSBodily Injury 162
Death 45
Life 94
Own Damage 9
Third Party Property Damage (TPPD) 18
Bonds 8
Marine 1
Others* 17
Total 354 *Others: Employee Grievances and Broker/Agent Commissions

2016 Annual Report National Insurance Commission
2016 Annual Report National Insurance Commission
17
BodilyInjury45.8%
Death12.7%
Life26.6%
OwnDamage2.5%
TPPD5.1%
Bonds2.3%
Marine0.2%
Others4.8%
TYPEOFCOMPLAINTS(2016)
BodilyInjury Death Life OwnDamage TPPD Bonds Marine Others
Complaints and Settlement Bureau ProcedureCompanies, against whom complaints were made, were informed in writing.
Depending on the nature of the complaint, a company was either requested to react, or invited to meet with the complainant(s) and officers of the National Insurance commission (NIC) in an effort to resolve the complaint.
In some instances the “Bureau” referred cases to the Motor Compensation Fund Committee.
These included complaints from injured motor victims of uninsured vehicles, claims repudiated by insurers on grounds of change of ownership or for other breaches under the Motor Insurance Third Party Insurance Act and Hit and Run cases.
The Bureau received the necessary co-operation from insurers and petitioners during the year under review.
Written commendations were received from petitioners and companies expressing appreciation to the Commission for its mediation efforts.
Distribution of Complaints against Insurance CompaniesOut of the total number of complaints received, 258 were brought against non-life insurance companies, 94 against life insurance companies and two against brokers. Forty-Seven complaints were received in respect of uninsured vehicles.
The tables below reflect the trend of complaints brought against life and non-life insurance companies over the past five years.
CompaniesNumber of Complaints per Year
2012 2013 2014 2015 2016
Non-life insurance companies 165 199 193 217 258
Life insurance companies 67 113 327 222 94
Total 232 222 520 439 352
Others (including uninsured vehicles) 83 68 35 47 2

2016 Annual Report National Insurance Commission
18
Distribution of Complaints by Companies (Non-Life)
CompaniesYear
2012 2013 2014 2015 2016
1 Activa International Insurance Co. Ltd - 1 1 1 -
2 Allianz Insurance Co. Ltd 1 - 1 1 -
3 Best Assurance Company Limited - - - - -
4 Donewell Insurance Co. Ltd 9 21 19 15 16
5 Ecowas Brown Card 3
6 Enterprise Insurance Co. Ltd 2 2 3 8 6
7 Equity Assurance Co. Ltd 14 6 10 11 20
8 Ghana Union Assurance Co. Ltd 2 2 - - 1
9 Glico General Insurance Co. Ltd 2 1 - 1 5
10 Hollard Insurance Co. Ltd - - - - 7
11 Heritage Energy Insurance Co. Ltd (formally IEI) 2 - 3 4 3
12. IGI (Ghana) Insurance Co. Ltd* 11 - - - -
13. Metropolitan Insurance Co. Ltd - 4 3 4 -
14. Millennium Insurance Co. Ltd - - - 1 2
15. NEM Insurance (Ghana) Co. Ltd 1 1 8 15 -
16. NSIA Insurance (Ghana) Co. Ltd 3 2 5 3 2
17. Phoenix Insurance Co. Ltd 2 3 7 4 7
18. Provident Insurance Co. Ltd 10 12 2 13 8
19. Prime Insurance Co. Ltd - 2 - 3 1
20. Priority Insurance Company Limited - - - - -
21. Quality Insurance Co. Ltd 4 9 10 11 16
22. Regency Alliance Insurance Co. Ltd 1 2 2 1 -
23. RegencyNem Insurance Co. Ltd** 17
24. Saham Insurance Ghana Limited 1 2 8 6 2
25. SIC Insurance Co. Ltd 52 70 45 60 59
26. Star Insurance Co. Ltd 16 24 28 25 46
27. Unique Insurance Co. Ltd 20 16 20 15 11
28. Vanguard Assurance Co. Ltd 10 14 16 14 14
29. Wapic Insurance Co. Ltd 2 5 2 1 12
TOTALS 165 199 193 217 258* Under liquidation** merger Regency Insurance and NEM Insurance

2016 Annual Report National Insurance Commission
2016 Annual Report National Insurance Commission
19
Distribution of Complaints by Companies (Life)
CompaniesYear
2012 2013 2014 2015 20161 Adamas Life Insurance Company - - - - 1
2 A-Plus Assurance Company - - - - 1
3 Capital Express Life Insurance Co. Ltd 1 2 8 4 5
4 Donewell Life Insurance Co. Ltd 2 1 5 3 0
5 Esich Life Insurance Company Ltd - - - 3 8
6 Enterprise Life Assurance Co. Ltd 9 25 31 18 20
7 Prudential Life Insurance Co. Ltd 4 7 84 65 0
8 Ghana Life Insurance Co. Ltd 3 10 3 4 2
9 Glico Life Insurance Co. Ltd 8 18 29 10 2
10 IGI Life Insurance Co. Ltd 1 - - - 0
11 Metropolitan Life Insurance Co. Ltd 10 17 45 19 5
12 Old Mutual Life Insurance Co. Ltd* - - 6 3 13
13 Phoenix Life Insurance Co. Ltd 2 2 11 - 3
14 Provident Life Insurance Co. Ltd 3 2 3 - 0
15 Prudential Life Insurance Co Ltd - - - - 5
16 Quality Life Insurance Co. Ltd 2 2 8 4 3
17 Saham Life Insurance Co. Ltd 5 - 9 4 6
18 SIC Life Insurance Co. Ltd 6 18 42 52 6
19 Star Life Insurance Co. Ltd 6 5 16 12 3
20 Unique Life Insurance Co. Ltd 2 2 10 13 5
21 UT Life Insurance Co. Ltd 1 2 4 3 4
22 Vanguard Life Insurance Co. Ltd 2 - 13 5 2
TOTAL 67 113 327 222 94
*previously Provident Life
Distribution of Complaints by Companies (Brokers)
CompaniesYear
2012 2013 2014 2015 2016
1 Shield Insurance Brokers Limited - - - - 1
2 Tri-Star Insurance Brokers Limited - - - - 1
TOTAL - - - - 2
STATUTORY FUNDSMotor Compensation FundThe Motor Compensation Fund Committee continued with its mandate to achieve the object of the Fund as prescribed under section 192 of the Insurance Act 2006, (Act 724) namely:-
a. To compensate persons who suffer injury or death through a motor accident and who are unable to obtain compensation from an insurance company, and
2016 Annual Report National Insurance Commission
20
b. To promote public education on motor insurance in particular and insurance business in general.
The Committee desirous of streamlining the awards of Motor Insurance Compensation with the view to ensuring objectivity, uniformity, equity and fairness, developed new guidelines: “Motor Compensation Fund Guidelines for Computation of Awards” to aid the award of compensation.
Under the new guidelines the computation of the awards would be determined under six main headings as follows:
i. Medical Expenses
ii. Extent of Injuries
iii. Percentage Disability/ Deformity
iv. Residual Injuries
v. Period of Hospitalization
vi. Nursing Assistance
The aggregate of the awards calculated under all the headings constitutes the final award payable to an applicant.
The Awards Sub-committee held 10 sittings in the year 2016. In all, 105 applicants received approval from the Committee and were awarded a total GHS606,240.75. The 105 applications were made up of 82 injury cases and 23 death cases.
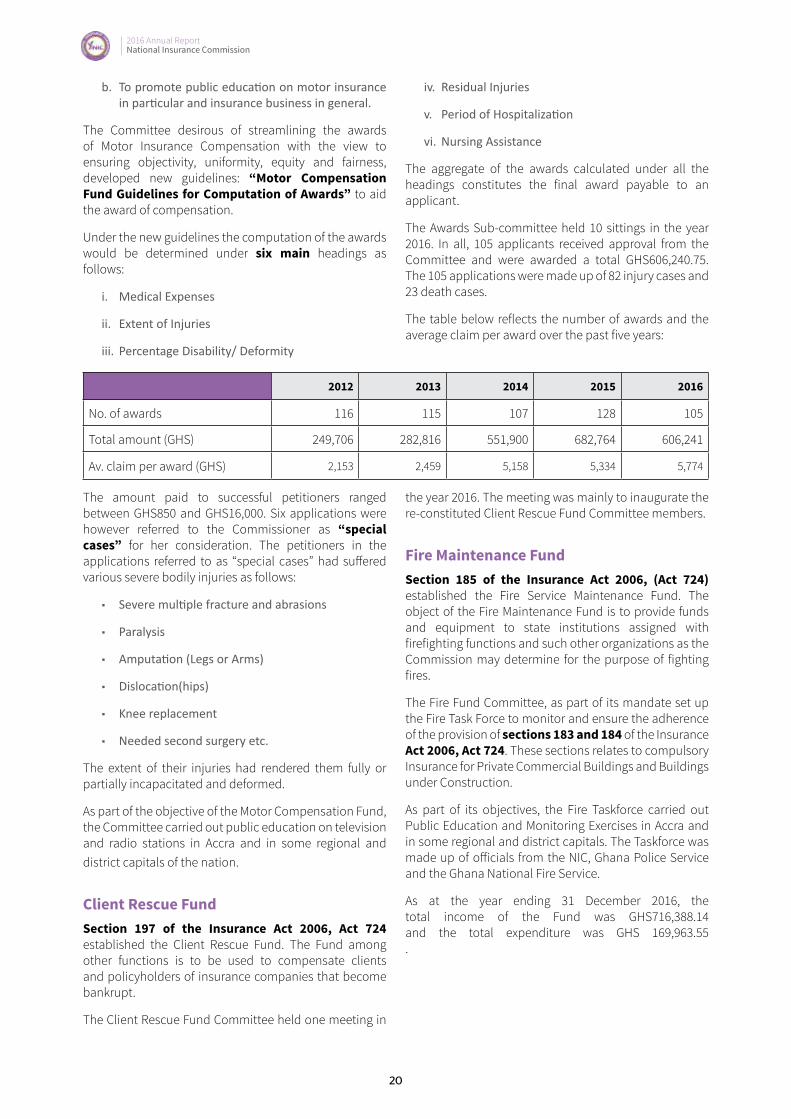
The table below reflects the number of awards and the average claim per award over the past five years:
2012 2013 2014 2015 2016
No. of awards 116 115 107 128 105
Total amount (GHS) 249,706 282,816 551,900 682,764 606,241
Av. claim per award (GHS) 2,153 2,459 5,158 5,334 5,774
The amount paid to successful petitioners ranged between GHS850 and GHS16,000. Six applications were however referred to the Commissioner as “special cases” for her consideration. The petitioners in the applications referred to as “special cases” had suffered various severe bodily injuries as follows:
■ Severe multiple fracture and abrasions
■ Paralysis
■ Amputation (Legs or Arms)
■ Dislocation(hips)
■ Knee replacement
■ Needed second surgery etc.
The extent of their injuries had rendered them fully or partially incapacitated and deformed.
As part of the objective of the Motor Compensation Fund, the Committee carried out public education on television and radio stations in Accra and in some regional and district capitals of the nation.
Client Rescue FundSection 197 of the Insurance Act 2006, Act 724 established the Client Rescue Fund. The Fund among other functions is to be used to compensate clients and policyholders of insurance companies that become bankrupt.
The Client Rescue Fund Committee held one meeting in
the year 2016. The meeting was mainly to inaugurate the re-constituted Client Rescue Fund Committee members.
Fire Maintenance FundSection 185 of the Insurance Act 2006, (Act 724) established the Fire Service Maintenance Fund. The object of the Fire Maintenance Fund is to provide funds and equipment to state institutions assigned with firefighting functions and such other organizations as the Commission may determine for the purpose of fighting fires.
The Fire Fund Committee, as part of its mandate set up the Fire Task Force to monitor and ensure the adherence of the provision of sections 183 and 184 of the Insurance Act 2006, Act 724. These sections relates to compulsory Insurance for Private Commercial Buildings and Buildings under Construction.
As part of its objectives, the Fire Taskforce carried out Public Education and Monitoring Exercises in Accra and in some regional and district capitals. The Taskforce was made up of officials from the NIC, Ghana Police Service and the Ghana National Fire Service.
As at the year ending 31 December 2016, the total income of the Fund was GHS716,388.14 and the total expenditure was GHS 169,963.55.
2016 Annual Report National Insurance Commission
2016 Annual Report National Insurance Commission
21
GHANA INSURANCE MARKET REPORT
ECONOMIC REVIEW
Overview of the EconomyPolitical uncertainty, unstable commodity prices and weak global demand characterised the global economy in 2016. The unexpected vote of the United Kingdom to exit the European Union (‘Brexit’) in June 2016 was a shock to many throughout the world and impacted on the financial markets greatly. Similarly, the expected elections in the US and many other parts of the world created political uncertainty that brought with it turbulence in the economic environment. The global economy therefore recorded a lower growth rate of 3.1% compared to the 3.4% recorded for 2015.
Generally, growth in the advanced economies was subdued, recording an average growth of 1.7% for 2016. The major economic powers in Europe recorded mixed growth in 2016. Germany and Italy recorded positive growth albeit marginally; Britain and France recorded a marginal drop in growth while growth in Spain was maintained. Generally, the euro zone growth dropped from 2.0% in 2015 to 1.7% in 2016. The United States recorded 1.6% growth in 2016 compared to the 2.6% achieved in 2015. The Asia region continue to be the fastest growing region in the world driven by strong domestic demand. Economic growth in South Asia rose by 6.7% in 2016 while the East Asia and Pacific region grew by 6.3% in 2016. Growth in China fell marginally from 6.9% to 6.7%. (Source: World Economic Outlook, April 2017)
Fall in commodity prices adversely affected the economies of Sub-Sahara African leading to revenue shortfalls. Fall in the price of crude oil for example significantly affected Ghana and Nigeria who are major economic brokers in Sub-Sahara Africa. The economy of Nigerian contracted by 1.5%, dropping from 2.7% in 2015.
Crude oil prices were quite low for most of the year. It started the year at $31.9 per barrel but ended the year at $54.9. Gold prices averaged a rise of 7.7% from $1,069.4 in 2015 to $1,151.2 in 2016. Cocoa prices fell from $3,301 in 2015 to $2,268 in 2016. (Source: MOF)
The Ghanaian Economy experienced subdued growth as a result of various challenges in 2016. While
low oil revenues led to revenue shortfalls, utility tariffs hike, transport cost and rising interest rate impacted heavily on inflation. The never ending power sector crisis and poor domestic demand coupled with the introduction of numerous taxes adversely affected disposable income especially as we got closer to the general elections in December.
Overall real GDP recorded a drop from the growth of 3.9% in 2015, achieving a growth of 3.5% against a target of 4.1%. Non-oil GDP achieved a growth of 4.6%. The 2016 GDP growth of 3.6% was mostly aided by the growth in the services sector of 5.9% and the Agriculture sector: 3.6%. (Source: MOF)
The year ended with a budget deficit of 7.8% of GDP with the debt stock rising marginally from 72.2% of GDP in 2015 to 72.5% of GDP at the end of 2016.
InflationHeadline inflation rose sharply from 17.7% in December 2015 to 19.0% in January 2016 and reached a high of 19.2% by March 2016. This was due mainly to upward adjustment in ex-pump prices of petroleum products and the utility tariff hikes introduced in the last quarter of 2015. Inflation however declined steadily to 15.4% by the end of the year. This was aided by the IMF extended credit facility programme which was aimed at restoring fiscal discipline and macroeconomic stability.
Interest RateThe Monetary Policy Committee of the Bank of Ghana maintained the Monetary Policy Rate at 26% for much of the year but eventually reduced it by 50 basis points to 25.5% in November, 2016. Short-term securities however, declined significantly during the course of the year with the benchmark 91-Day Treasury bill ending the year at 16.4% from 23.1% at the beginning of the year. The 182-Day Treasury bill also declined from 24.4% to 17.6%. The longer term securities such as the 1-Year and 2-Year Treasury notes on the other hand declined very marginally from 22.8% to 21.5% and 23.3% to 22.5% respectively.

2016 Annual Report National Insurance Commission
22
Exchange RateThe Ghana cedi did much better in 2016 than the previous year, depreciating by 9.6% against the US dollar as compared to 31.2% recorded in 2015. The US dollar ending the year at GHS4.2/USD. For the Euro the depreciated was 5.3% ending the year at GHS4.4/Euro while the Pound Sterling appreciated by as much as 10% ending the year at GHS5.2/GBP.
Developments on the Ghana Stock Market 2016 was a challenging year for the Ghana Stock Exchange as the high returns on short term securities was more attractive to most investors. The difficult economic environment characterized by poor industry performance and coupled with the tough tax regime all impacted negatively on most listed companies. The Composite Index (GSE-CI) declined during the year by 15.33% in 2016 compared with a loss of 11.7% in 2015. About 23 stocks recorded losses with only 6 gainers for the year. Market capitalisation also declined by 7.7% to GHS 52,910 at the
end of 2016 from GHS 57,116.8 million in 2015.
GHANA INSURANCE MARKET REPORT
Assets and Liabilities (excluding Reinsurance)Aggregate insurance industry assets stood at GHS 3.76bn as at the end of 2016, representing a growth of 23% from GHS 3.06bn in the prior year. Life’s contribution to total industry assets was GHS 2.25bn representing 60% as against Non-life’s contribution of GHS 1.51bn representing 40%.
Total assets mainly consist of Investments, Cash and Property, Plant and Equipment (PPE). Figures 1 (b) and (c) show that investments form the largest portion of total assets. It makes up about 87% of the assets of long-term insurers (Life) and 59% of the assets of the short-term insurers (Non-life).
Total Technical provision by the end of the year 2016, stood at GHS 1.98bn representing a growth of 14% from GHS 1.73bn in 2015. The figures below show pictorial analyses of Total Assets between Life and Non-life for the years under review.
Fig. 1(a)
0
500,000,000
1,000,000,000
1,500,000,000
2,000,000,000
2,500,000,000
2016 2015 2014
2,24
1,04
1,44
6
1,74
4,17
1,94
3
1,38
3,42
7,95
8
1,50
5,67
6,46
3
1,32
0,37
0,21
2
886,65
9,34
6
TotalAssets:YearlyAggregateIndustryContribution
Life Non-life
Source: Financial returns from regulated entities

2016 Annual Report National Insurance Commission
2016 Annual Report National Insurance Commission
23
Fig. 1(b) Composition of Total Life Industry Assets
87%
5%4%4%
Annual,2016
Investments Cash
Other Assets PPEor FixedAssets
83%
6% 6% 4%
Annual,2015
Investments Cash
OtherAssets PPEorFixedAssets
81%
7% 8% 5%
Annual,2014
Investments CashOtherAssets PPEorFixedAssets
Fig 1(c) Composition of Total Non-Life Industry Assets
59%
7%
24%
10%
Annual,2016
Investments Cash OtherAssets PPE
47%
10%
34%
9%
Annual,2015
Investments Cash OtherAssets PPE
2016 Annual Report National Insurance Commission
24
62% 11%
18%
9%
Annual,2014
Investments Cash OtherAssets PPE
Source: Based on data submitted to the NIC by licensed companies.
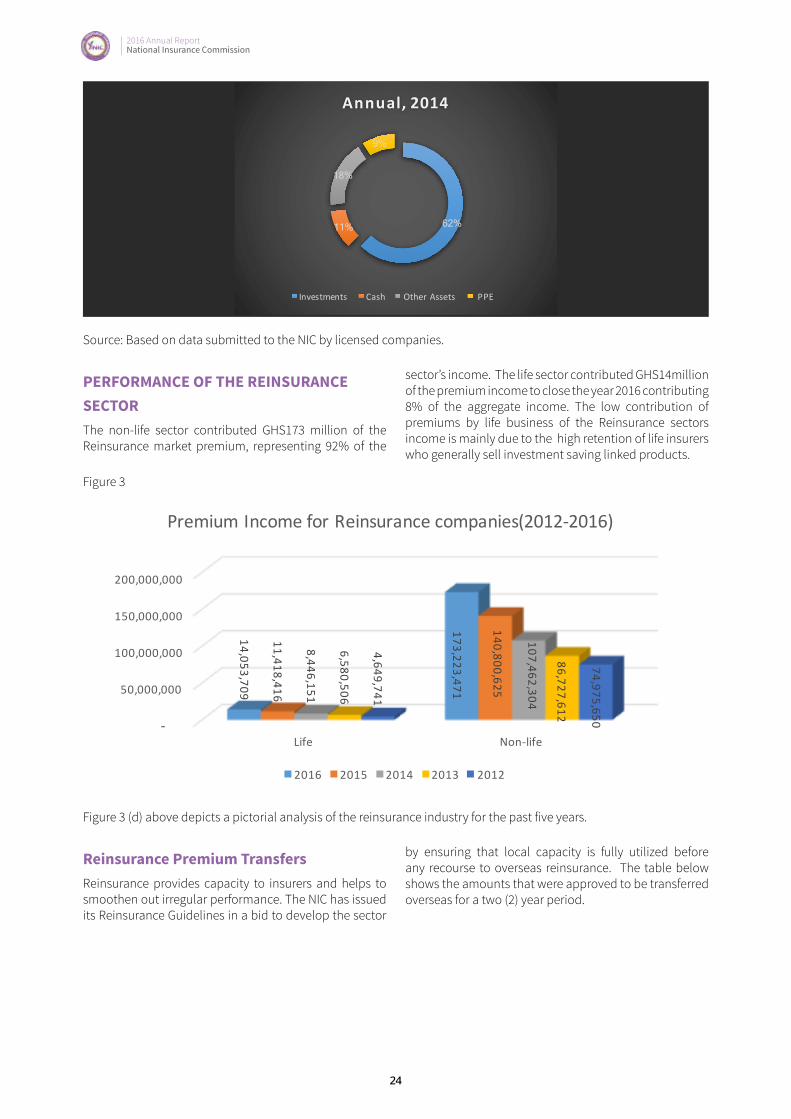
PERFORMANCE OF THE REINSURANCE SECTORThe non-life sector contributed GHS173 million of the Reinsurance market premium, representing 92% of the
sector’s income. The life sector contributed GHS14million of the premium income to close the year 2016 contributing 8% of the aggregate income. The low contribution of premiums by life business of the Reinsurance sectors income is mainly due to the high retention of life insurers who generally sell investment saving linked products.
Figure 3
-
50,000,000
100,000,000
150,000,000
200,000,000
Life Non-life
14,053,709
173,223,471
11,418,416
140,800,625
8,446,151
107,462,304
6,580,506
86,727,612
4,649,741
74,975,650
PremiumIncomeforReinsurancecompanies(2012-2016)
2016 2015 2014 2013 2012
Figure 3 (d) above depicts a pictorial analysis of the reinsurance industry for the past five years.
Reinsurance Premium TransfersReinsurance provides capacity to insurers and helps to smoothen out irregular performance. The NIC has issued its Reinsurance Guidelines in a bid to develop the sector
by ensuring that local capacity is fully utilized before any recourse to overseas reinsurance. The table below shows the amounts that were approved to be transferred overseas for a two (2) year period.

2016 Annual Report National Insurance Commission
2016 Annual Report National Insurance Commission
25
Overseas Reinsurance Premium Transfers
Currency 2016 2015
Dollars (US$) 9.72m 4.45m
Pounds Sterling (£) 862 4,568
Euros (€) 36,052 427,337
Ghana Cedis (GHS) 4.68m 18.1m
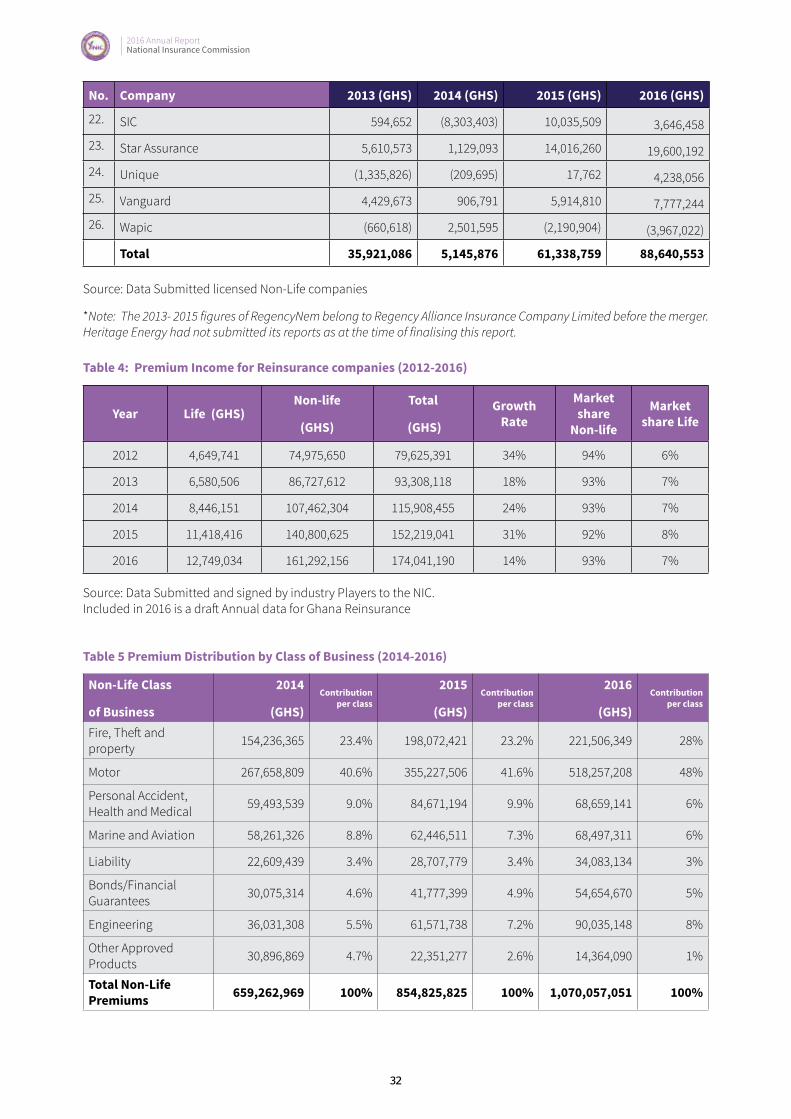
PREMIUM BY CLASS OF BUSINESS NON-LIFEThe motor class of business continued its dominance with a premium income of GHS 518m, contributing 48% of the overall premium income for 2016. It grew by 46% over the 2015 premium of GHS355m. Fire, Theft and Property contributed 21% of the total premium for 2016 and grew by 12% compared to the 2015 results. Marine & Aviation, and Personal Accident & Medical both came
third with an overall contribution of 6% of the total premium of GHS1.07bn in 2016. Engineering contributed a gross market premium of GHS90m and a market share of 8%.
Expectations for Marine to grow remain high due to the on-going enforcement of section 37 of Insurance Act, 2006 (Act 724). Importers are obliged to insure their goods locally for the industry to reap the benefits of an increase in premium income. Refer to Table 5 below for premiums per class of business.
Fig 4: Analysis of Non-Life Premiums by Class of Business
21%
48% 6%
6% 3%
5%8%
1%
2016:NonLifeClass ofbusiness
F,T&P Motor P,H&M M&A Liability FinancialLoss Engineering Others
Note:F, T & P - Fire, Theft and PropertyP, H &M - Personal Accident, Health and MedicalM & A - Marine and AviationFinancial Guarantee: Bonds

2016 Annual Report National Insurance Commission
26
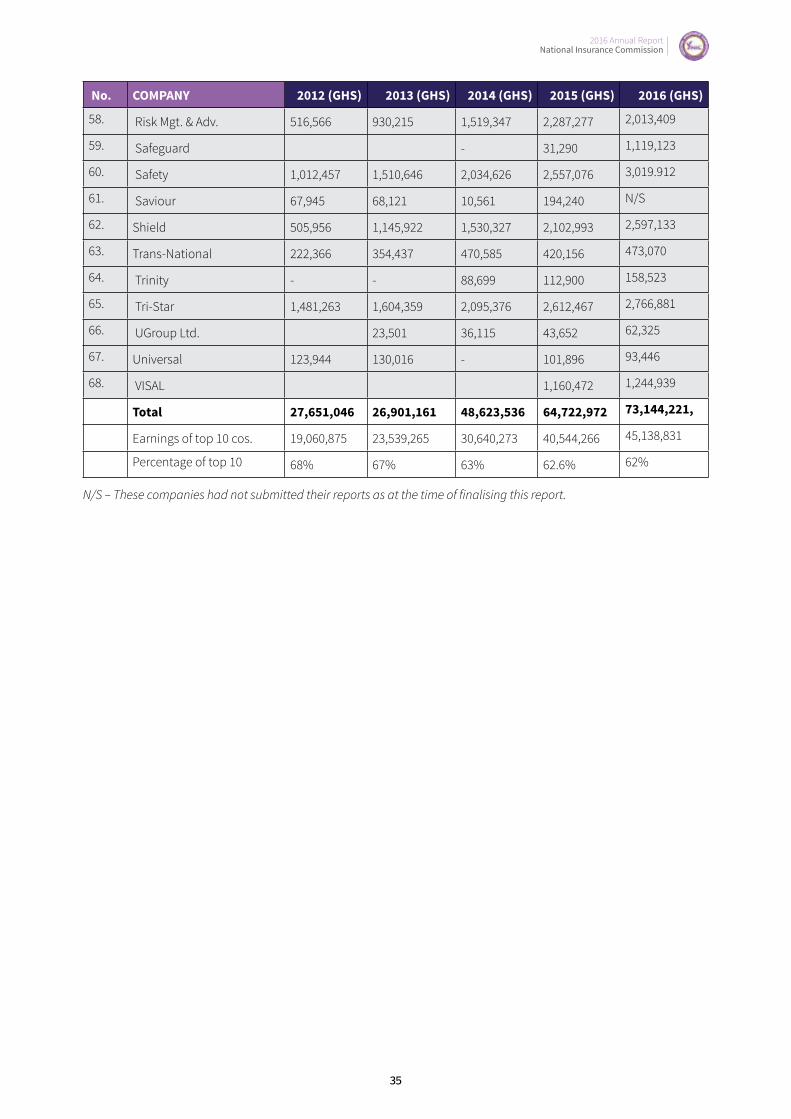
INSURANCE BROKING MARKETIn 2016, brokers received revenue amounting to GHS 72.5m representing a growth rate of 12%. As shown in Table 6 below, 64% of the total commission income was contributed by the top ten (10) brokers which stood at GHS 45.1m.
With a contribution of GHS 15m and GHS 6m representing 33% and 13%, KEK Insurance and Edward Mensah, Wood & Associates Limited maintained their respective positions as 1st and 2nd in the sector. Gras Savoye (now Willis Towers Watson Ghana limited), Safety, Shield and Crown improved to 3rd, 5th, 8th and 9th positions
respectively. However, KEK Reinsurance and Horizon declined to the 4th and 7th positions respectively. Midas Insurance made it to the 10th position with income in excess of GHS 2m representing 5% of the market share for 2016. Tri-Star and Crown Insurance Brokers Limited both maintained their respective 6th and 9th positions in 2016 as in prior year. This analysis does not include figures from the 10 newly licensed brokers because they are start-ups and were inactive during the year.
Below is the list of top ten brokers based on their market share /commission income:
NAME OF BROKER COMMISSION INCOME
1 KEK Insurance Brokers Limited 14,921,591
2 Edward Mensah, Wood & Associates Limited 6,031,736
3 Gras Savoye Ghana Limited (now Willis Watson Towers Gh.) 5,230,618
4 KEK Reinsurance Brokers (Africa) Limited 3,678,527
5 Safety Insurance Brokers Limited 3,019,912
6 Tri-star Insurance Services Limited 2,766,881
7 Horizon Insurance Brokers Limited 2,748,823
8 Shield Insurance & Risk Management Company Limited 2,597,133
9 Crown Insurance Brokers Limited 2,089,394
10 Midas Insurance Brokers Ltd 2,054,216
Total (GHS) 45,138,831
Fig. 4 Analysis of Brokerage Commission
2835
48
67
7135
26
3639
11
0
5
10
15
20
25
30
35
40
45
0
10
20
30
40
50
60
70
80
2012 2013 2014 2015 2016
Reve
nues(inGHSmillion)
Brokeragegrowthoverfiveyears(2012-2016)
Source: Data submitted by licensed Brokers
2016 Annual Report National Insurance Commission
2016 Annual Report National Insurance Commission
27
Figure 4 above shows a pictorial analysis of the growth of brokerage income over the past five years. As indicated, the rate of growth has been fluctuating. From 35% in 2012, the growth rate fell sharply to 26% in 2013. It then increased substantially in 2014 and 2015 partly due to the upward review in motor tariffs and then plummeted to 11% in 2016.
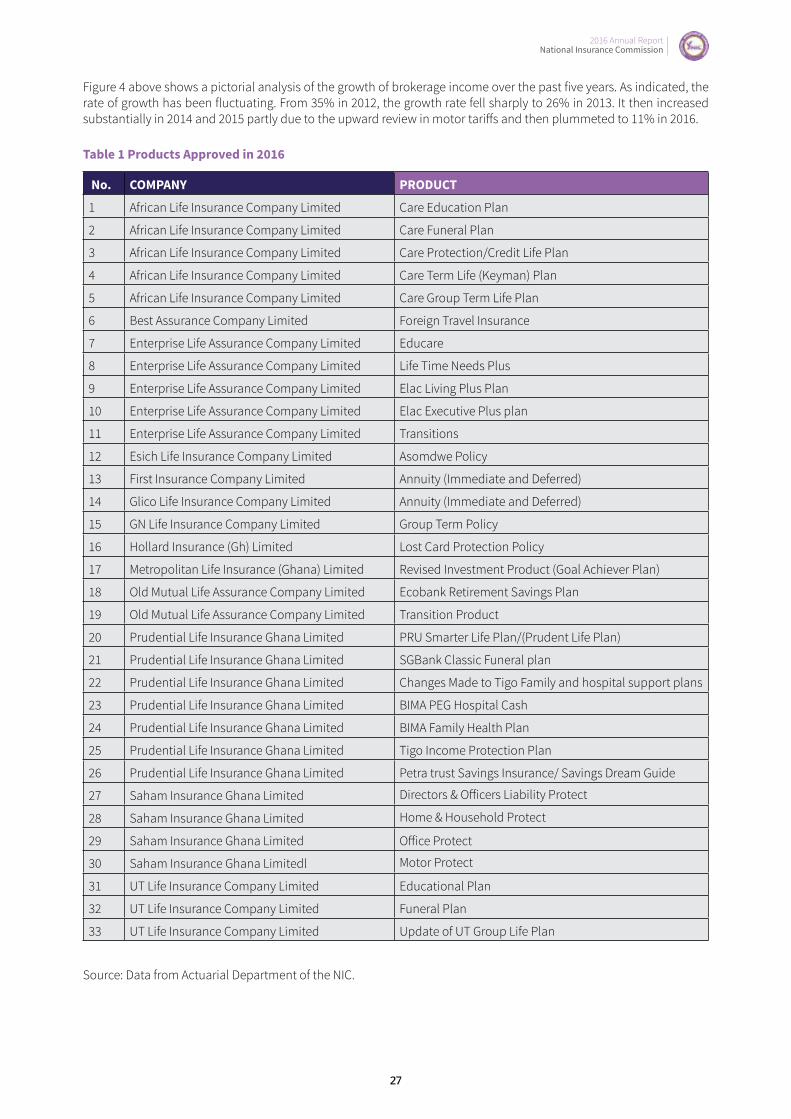
Table 1 Products Approved in 2016
No. COMPANY PRODUCT
1 African Life Insurance Company Limited Care Education Plan
2 African Life Insurance Company Limited Care Funeral Plan
3 African Life Insurance Company Limited Care Protection/Credit Life Plan
4 African Life Insurance Company Limited Care Term Life (Keyman) Plan
5 African Life Insurance Company Limited Care Group Term Life Plan
6 Best Assurance Company Limited Foreign Travel Insurance
7 Enterprise Life Assurance Company Limited Educare
8 Enterprise Life Assurance Company Limited Life Time Needs Plus
9 Enterprise Life Assurance Company Limited Elac Living Plus Plan
10 Enterprise Life Assurance Company Limited Elac Executive Plus plan
11 Enterprise Life Assurance Company Limited Transitions
12 Esich Life Insurance Company Limited Asomdwe Policy
13 First Insurance Company Limited Annuity (Immediate and Deferred)
14 Glico Life Insurance Company Limited Annuity (Immediate and Deferred)
15 GN Life Insurance Company Limited Group Term Policy
16 Hollard Insurance (Gh) Limited Lost Card Protection Policy
17 Metropolitan Life Insurance (Ghana) Limited Revised Investment Product (Goal Achiever Plan)
18 Old Mutual Life Assurance Company Limited Ecobank Retirement Savings Plan
19 Old Mutual Life Assurance Company Limited Transition Product
20 Prudential Life Insurance Ghana Limited PRU Smarter Life Plan/(Prudent Life Plan)
21 Prudential Life Insurance Ghana Limited SGBank Classic Funeral plan
22 Prudential Life Insurance Ghana Limited Changes Made to Tigo Family and hospital support plans
23 Prudential Life Insurance Ghana Limited BIMA PEG Hospital Cash
24 Prudential Life Insurance Ghana Limited BIMA Family Health Plan
25 Prudential Life Insurance Ghana Limited Tigo Income Protection Plan
26 Prudential Life Insurance Ghana Limited Petra trust Savings Insurance/ Savings Dream Guide
27 Saham Insurance Ghana Limited Directors & Officers Liability Protect
28 Saham Insurance Ghana Limited Home & Household Protect
29 Saham Insurance Ghana Limited Office Protect
30 Saham Insurance Ghana Limitedl Motor Protect
31 UT Life Insurance Company Limited Educational Plan
32 UT Life Insurance Company Limited Funeral Plan
33 UT Life Insurance Company Limited Update of UT Group Life Plan
Source: Data from Actuarial Department of the NIC.

2016 Annual Report National Insurance Commission
28
Table 2(a) Growth in Industry Gross Premium (2012 - 2016)
Year Premium Income (GHS) Growth Rate %
2012 850,679,973 -
2013 1,052,090,981 24
2014 1,239,853,442 18
2015 1,560,679,185 262016 1,928,838,573 24
Table 2(b) Growth in Gross premium for Non-Life Insurance (2012 -- 2016)
Year Premium Income (GHS) Growth Rate %
2012 494,891,864 -
2013 582,456,306 18
2014 659,262,969 13
2015 854,825,825 30
2016 1,070,057,051 25
Table 2(c) Growth in Gross Premium for Life Insurance (2012-2016)
Year Premium Income (GHS) Growth Rate %
2012 355,788,109 -
2013 469,634,675 32
2014 580,590,473 23
2015 705,853,360 22
2016 858,781,522 22
Table 2 (d) GROSS PREMIUMS OF NON-LIFE COMPANIES (2012 - 2016)
No COMPANY 2012 (GHS) 2013 (GHS) 2014 (GHS) 2015 (GHS) 2016 (GHS)
1. Activa Int. 16,066,559 21,720,151 26,900,589 38,268,180 40,818,428
2. Allianz Ins. 14,222,126 16,666,082 26,624,368 21,858,529 27,183,279
3. Best Ass. NA NA NA NA 4,918,453
4. Donewell Ins. 12,545,982 14,570,013 14,970,003 20,357,071 30,530,398
5. Enterprise Ins. 43,178,409 61,330,000 70,398,623 100,996,493 135,446,537
6. Equity Ass. 10,792,727 12,608,637 15,696,407 21,294,662 31,468,150
7. Ghana Union* 14,519,988 21,856,982 22,348,675 31,536, 467 33,526,207
8. Glico Gen. 31,905,202 39,691,703 46,397,194 68,638,428 69,660,874
9 Imperial Gen. NA 966,772 5,571,696 6,508,200 9,239,314
10 Heritage Energy 7,814,808 8,196,429 6,132,835 6,721,760 N/S
11. Hollard Ins. 44,405,519 53,899,625 63,307,559 77,273,501 84,094,685
12 Millennium Ins. 4,122,644 7,259,603 6,637,176 8,161,485 12,930,952

2016 Annual Report National Insurance Commission
2016 Annual Report National Insurance Commission
29
No COMPANY 2012 (GHS) 2013 (GHS) 2014 (GHS) 2015 (GHS) 2016 (GHS)
13 NSIA Ghana 7,234,632 8,157,332 5,428,571 7,948,287 10,998,238
14 Phoenix Ins. 20,908,895 24,296,304 25,178,385 34,770,287 46,278,553
15 Prime Ins. 575,000 2,163,114 5,306,379 12,158,093 29,389,566
16 Priority Ins. 27,888 2,135,922 2,597,458 3,872,158 8,940,836
17 Provident Ins. 9,842,235 9,793,754 10,462,289 14,952,407 20,364,746
18 Quality Ins. 15,520,067 17,170,940 19,356,125 23,090,012 30,946,446
19 RegencyNEM 6,323,879 8,382,758 12,476,495 17,807,025 28,733,674
20 Saham Ins. 4,940,299 8,308,085 10,221,468 12,913,133 11,207,580
21 SIC Ins. 109,965,628 111,897,149 113,069,892 138,984,920 160,111,229
22 Star Assurance 60,895,352 57,005,894 71,228,815 91,584,258 119,710,991
23 Unique Ins. 5,020,265 5,726,279 5,983,230 7,856,036 11,167,973
24 Vanguard Ass. 41,776,384 53,039,656 58,172,319 72,775,120 97,100,246
25 Wapic 8,536,786 9,409,454 8,013,773 11,211,667 15,289,696
TOTALS 494,891,864 582,456,306 659,262,969 854,825,825 1,070,057,051
Source: Data Submitted and signed by industry Players to the NIC
Note: ‘NA’ companies were either not licensed or yet to provide operational result ‘*’ means 4th Quarter data was used due to late submission of audited annual data N/S - Heritage Energy had not submitted its reports at the time this report was finalised.
Table 2(e) GROSS PREMIUM OF LIFE COMPANIES (2012 – 2016)
No. COMPANY 2012 (GHS) 2013 (GHS) 2014 (GHS) 2015 (GHS) 2016 (GHS)
1 A-Plus NA NA NA NA 56,742
2 Capital Express (Now Aviance Life) 812,057 809,346 580,154 477,366
3 Donewell Life 7,186,954 8,118,905 8,241,894 7,705,518 7,134,666
4 Enterprise Life 89,118,307 123,846,285 156,244,014 200,438,627 235,311,893
5 Esich Life* NA NA 1,663,326 8,200,464 12,375,460
6 First Insurance Comp. NA NA NA NA
7 Ghana Life Ins*. 8,278,234 10,533,661 12,731,893 14,740,234 17,911,223
8 Ghana Union Life* 2,498,486 4,724,564 5,014,211 7,395,373 7,636,506
9 Glico Life Ins. 36,022,000 55,546,000 59,654.05 64,926,000 82,733,226
10 GN Life Ass. NA NA NA 1,179,090 7,270,045
11 Metropolitan Life 19,642,000 21,574,030 26,344,298 29,924,473 31,595,032
12 Old Mutual Ass. 15,760,743 15,458,278 16,477,834 22,765,849 33,425,000
13 Phoenix Life Ins. 5,841,693 7,121,098 7,627,824 8,029,873 10,224,115
14 Prudential Life Ins. 1,781,307 5,378,355 11,722,469 20,720,285 33,814,009
2016 Annual Report National Insurance Commission
30
No. COMPANY 2012 (GHS) 2013 (GHS) 2014 (GHS) 2015 (GHS) 2016 (GHS)
15 Quality Life Ass. 5,863,825 7,021,932 8,480,291 8,972,136 9,424,765
16 Saham Life 130,406 906,352 2,550,358 4,563,663 5,999,595
17 SIC Life 100,301,526 127,244,626 158,323,730 181,272,376 212,960,892
18 Starlife Ass. 39,806,490 53,428,493 68,191,153 82,520,271 105,620,200
19 Unique Life (now Beige Assure) 3,475,538 3,798,298 4,834,636 5,022,477 3,700,690
20 UT Life 6,722,840 11,952,035 15,697,395 18,872,345 19,634,602
21 Vanguard Life 12,545,703 12,122,417 16,210,947 18,126,941 22,009,604
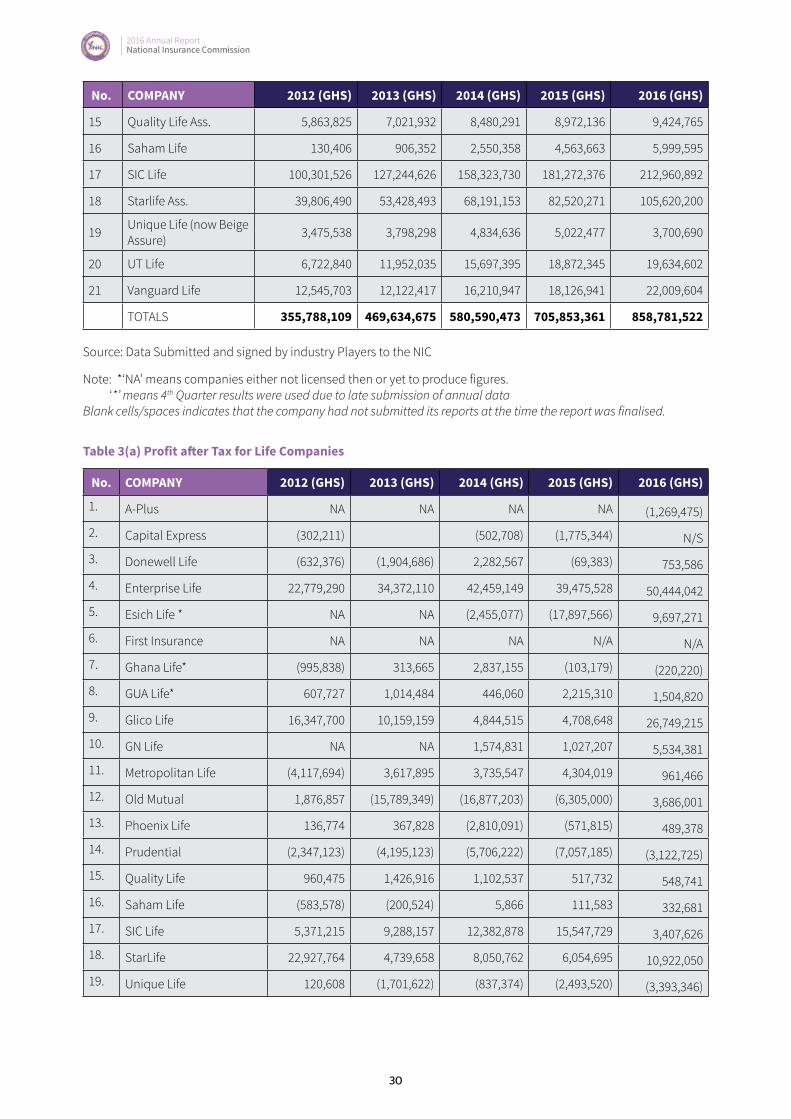
TOTALS 355,788,109 469,634,675 580,590,473 705,853,361 858,781,522 Source: Data Submitted and signed by industry Players to the NIC
Note: *‘NA’ means companies either not licensed then or yet to produce figures. ‘*’ means 4th Quarter results were used due to late submission of annual dataBlank cells/spaces indicates that the company had not submitted its reports at the time the report was finalised.
Table 3(a) Profit after Tax for Life Companies
No. COMPANY 2012 (GHS) 2013 (GHS) 2014 (GHS) 2015 (GHS) 2016 (GHS)
1. A-Plus NA NA NA NA (1,269,475)
2. Capital Express (302,211) (502,708) (1,775,344) N/S
3. Donewell Life (632,376) (1,904,686) 2,282,567 (69,383) 753,586
4. Enterprise Life 22,779,290 34,372,110 42,459,149 39,475,528 50,444,042
5. Esich Life * NA NA (2,455,077) (17,897,566) 9,697,271
6. First Insurance NA NA NA N/A N/A
7. Ghana Life* (995,838) 313,665 2,837,155 (103,179) (220,220)
8. GUA Life* 607,727 1,014,484 446,060 2,215,310 1,504,820
9. Glico Life 16,347,700 10,159,159 4,844,515 4,708,648 26,749,215
10. GN Life NA NA 1,574,831 1,027,207 5,534,381
11. Metropolitan Life (4,117,694) 3,617,895 3,735,547 4,304,019 961,466
12. Old Mutual 1,876,857 (15,789,349) (16,877,203) (6,305,000) 3,686,001
13. Phoenix Life 136,774 367,828 (2,810,091) (571,815) 489,378
14. Prudential (2,347,123) (4,195,123) (5,706,222) (7,057,185) (3,122,725)
15. Quality Life 960,475 1,426,916 1,102,537 517,732 548,741
16. Saham Life (583,578) (200,524) 5,866 111,583 332,681
17. SIC Life 5,371,215 9,288,157 12,382,878 15,547,729 3,407,626
18. StarLife 22,927,764 4,739,658 8,050,762 6,054,695 10,922,050
19. Unique Life 120,608 (1,701,622) (837,374) (2,493,520) (3,393,346)

2016 Annual Report National Insurance Commission
2016 Annual Report National Insurance Commission
31
No. COMPANY 2012 (GHS) 2013 (GHS) 2014 (GHS) 2015 (GHS) 2016 (GHS)
20.
21.UT Life 403,975 2,008,795 786,428 (3,980,163) (10,431,350)
22. Vanguard Life (662,411) 211,151 (466,020) (2,800,994) 373,524
Total By Year 61,891,154 43,728,514 50,853,600 30,908,304 98,237,141
Table 3(a) Profit After Tax for Life Companies
Source: Data Submitted by licensed Life companies
Note: N/A – A Plus Esich and First Insurance had not been licensed. N/S – Capital Express had not submitted their reports at the time of finalising this report‘*’ means 4th Quarter results were used due to late submission of annual data
Table 3(b) Profit After Tax for Non-Life Companies
No. Company 2013 (GHS) 2014 (GHS) 2015 (GHS) 2016 (GHS)
1. Activa 1,885,345 781,634 2,575,779 2,582,380
2. Allianz (469,397) (788,624) (2,512,678) (1,592,056)
3. Best Assurance NA NA N/A 439,553
4. Donewell 1,561,159 3,235,787 3,454,261 5,071,865
5. Enterprise 13,522,000 8,314,907 9,238,477 17,023,497
6. Equity 1,425,393 1,263,176 2,177,456 4,177,606
7. GUA* 1,024,264 1,221,690 3,388,629 913,913
8. Glico General 812,653 (3,489,527) (1,492,335) 3,813,043
9. Hollard 2,823,074 1,560,741 4,428,310 8,124,290
10. Imperial Gen. 220,543 228,339 122,011 (1,254,015)
11. IEI / Heritage (5,390,403) (3,281,638) 249,233 N/S
12. Millennium 1,621,823 601,201 (155,221) 1,828,426
13. NEM 261,515 329,888 542,667 N/A
14. NSIA (2,816,023) (3,623,029) 602,653 1,202,744
15. Phoenix (91,960) 2,011,860 1,701,742 5,752,775
16. Prime (1,204,301) (6,135,082) (889,655) 745,706
17. Priority 881,056 1,317,602 2,680,385 1,628,931
18. Provident 9,119,943 3,174,096 5,839,491 5,514,311
19. Quality 1,137,964 140,242 650,405 2,937,363
20. RegencyNem 784,781 2,135,023 529,167 2,725,976
21. Saham 173,203 123,209 414,546 (4,290,683)
2016 Annual Report National Insurance Commission
32
No. Company 2013 (GHS) 2014 (GHS) 2015 (GHS) 2016 (GHS)
22. SIC 594,652 (8,303,403) 10,035,509 3,646,458
23. Star Assurance 5,610,573 1,129,093 14,016,260 19,600,192
24. Unique (1,335,826) (209,695) 17,762 4,238,056
25. Vanguard 4,429,673 906,791 5,914,810 7,777,244
26. Wapic (660,618) 2,501,595 (2,190,904) (3,967,022)
Total 35,921,086 5,145,876 61,338,759 88,640,553 Source: Data Submitted licensed Non-Life companies
*Note: The 2013- 2015 figures of RegencyNem belong to Regency Alliance Insurance Company Limited before the merger. Heritage Energy had not submitted its reports as at the time of finalising this report.
Table 4: Premium Income for Reinsurance companies (2012-2016)
Year Life (GHS)Non-life
(GHS)
Total
(GHS)Growth
Rate
Market share
Non-life
Market share Life
2012 4,649,741 74,975,650 79,625,391 34% 94% 6%
2013 6,580,506 86,727,612 93,308,118 18% 93% 7%
2014 8,446,151 107,462,304 115,908,455 24% 93% 7%
2015 11,418,416 140,800,625 152,219,041 31% 92% 8%
2016 12,749,034 161,292,156 174,041,190 14% 93% 7%
Source: Data Submitted and signed by industry Players to the NIC.Included in 2016 is a draft Annual data for Ghana Reinsurance
Table 5 Premium Distribution by Class of Business (2014-2016)
Non-Life Class
of Business
2014
(GHS) Contribution
per class
2015
(GHS)Contribution
per class
2016
(GHS)Contribution
per class
Fire, Theft and property 154,236,365 23.4% 198,072,421 23.2% 221,506,349 28%
Motor 267,658,809 40.6% 355,227,506 41.6% 518,257,208 48%
Personal Accident, Health and Medical 59,493,539 9.0% 84,671,194 9.9% 68,659,141 6%
Marine and Aviation 58,261,326 8.8% 62,446,511 7.3% 68,497,311 6%
Liability 22,609,439 3.4% 28,707,779 3.4% 34,083,134 3%
Bonds/Financial Guarantees 30,075,314 4.6% 41,777,399 4.9% 54,654,670 5%
Engineering 36,031,308 5.5% 61,571,738 7.2% 90,035,148 8%
Other Approved Products 30,896,869 4.7% 22,351,277 2.6% 14,364,090 1%
Total Non-Life Premiums 659,262,969 100% 854,825,825 100% 1,070,057,051 100%

2016 Annual Report National Insurance Commission
2016 Annual Report National Insurance Commission
33
LIFE AND NON-LIFE 2014 Market share 2015 Market
Share 2016
Total Non-Life Premiums 659,262,969 53% 854,825,825 55%
1,070,057,051 55%
Life Business (All the classes) 580,590,473 47% 705,853,361 45%
858,781,522 45%
Grand Total (Life and Non-Life) 1,239,855,456 100% 1,560,681,201 100% 1,928,838,573 100%
Source: Data Submitted and signed by industry Players to the NIC
*The Non-Life product lines have been realigned, thus separating Bonds/Financial Guarantees, Engineering and Liability from Personal Accident line of business.
Table 6: Brokerage Commission for 2012 – 2016 expressed in Cedis
No. COMPANY 2012 (GHS) 2013 (GHS) 2014 (GHS) 2015 (GHS) 2016 (GHS)
1. AG & Assoc. 48,850 146,423 220,709 326,800 N/S
2. Akoto Risk 458,838 542,781 630,740 960,550 1,203,754
3. All Risks 742,283 689,827 721,166 763,677 879,618
4. AllStar - 415,953 538,093
5. Allied 59,645 52,343 134,279 75,579 110,051
6. Alpha 352,147 352,147 474,200 554,134 701,662
7. Apex 78,316 64,457 318,336 374,483 628,716
8. ARB 264,395 494,090 800,266
9. ARK 118,399 162,741 254,695 311,321 347,425
10. Arrowclass 774,653 999,791 1,324,991
11. Ascoma Ghana 416,587 679,537 1,225,130 1,134,591 1,401,987
12. Asterix 108,911 131,319 192,507 129,207 197,194
13. Baobab 9,682 36,185 103,687 188,203
14. Boaitey & Associates - 264,810 542,177
15. Byllwych - 3,694 N/S
16. Cardinal Brokers * - 193,340 363,280 273,582
17. Ceris Int’l 251,312 325,020 801,849 577,793 N/S
18. CLAIM Ltd. 354,390 242,468 511,109 483,781 340,547
19. Corporate Trust 162,367 542,789 249,279 982,734 N/S
20. Crown 1,016,883 1,165,184 1,611,389 1,874,542 2,089,394
21. Danniads 837,503 981,531 1,367,910 1,369,603 1,458,624
22. Dezag Insurance Brokers Limited 48,958 171,380 190,253
23. Double D & M 15,561 20,907 - 62,906 N/S

2016 Annual Report National Insurance Commission
34
No. COMPANY 2012 (GHS) 2013 (GHS) 2014 (GHS) 2015 (GHS) 2016 (GHS)
24. Dynamic 281,379 270,994 402,873 461,250 444,832
25. Edward Mensah, Wood & Associates. 3,472,549 3,718,846 4,060,201 6,596,403 6,031,736
26. Eureka 51,289 84,015 - N/S
27. Felin Brokers 147,350 427,251 592,832 905,780
28. First Anchor 588,822 638,421 1,195,548 1,478,209 1,424,594
29. Functions Risk 27,657 144,511 202,619
30. GBL Insurance Brokers Ltd. 3,694 23,270
31. Ghana Int’l Brokers 41,105 118,096 N/A N/A N/S
32. Global Impact 96,336 91,763 125,550 113,395 129,673
33. Goldlink 40,140 46,708 95,300
34. Goodwill - 2,704 73,442
35. Gras Savoye 1,618,102 2,091,824 2,229,774 3,232,346 5,230,618
36. Horizon 1,046,989 1,544,717 2,143,062 2,721,601 2,749,823
37. Insurance Centre 102,167 124,892 189,745 280,919 376,241
38. Insurance Consult. 380,056 232,232 204,661 193,349 295,054
39. Insurance Solutions 252,466 385,187 723,412 1,053,551 1,466,311
40. KAV 60,261 130,216 114,770 98,677 224,683
41. KEK 6,812,012 8.272,563 10,909,117 13,265,860 14,921,591
42. KEK Reins. 1,020,834 1,450,312 2,507,054 3,293,701 3,678,527
43. Khols & Hols 23,301 272,412
44. Liberty Brokers 78,117 171,056 191,365 277,784 229,930
45. Lordship 272,579 327,665 470,040 531,091 669,372
46. M & G Ins. Brok. 436,770 478,626 758,816 928,308 1,090,259
47. Maxpal Interm. 162,498 152,932 63,166 83,574 143,009
48. Metrix 90,330 218,222 328,624
49. Midas 664,353 1,034,889 1,474,030 1,802,416 2,054,216
50. Multinational 65,266 211,036 362,427
51. NDL Consult 69,400 206,702 230,157 232,442
52. Novelty - 144,950 152,198
53. OAK Brokers - 40,161 -
54. Premier Brokers 14,715 31,697 129,152 137,180 230, 211
55. Progressive 507,379 881,760 924,358 1,126,622 1,418,800
56. Prudent Ins. Brokers 301,714 320,226 324,768 270,249 302,425
57. Riscovery Ltd. 40,108 181,171 682,218 722,401 840,990
2016 Annual Report National Insurance Commission
2016 Annual Report National Insurance Commission
35
No. COMPANY 2012 (GHS) 2013 (GHS) 2014 (GHS) 2015 (GHS) 2016 (GHS)
58. Risk Mgt. & Adv. 516,566 930,215 1,519,347 2,287,277 2,013,409
59. Safeguard - 31,290 1,119,123
60. Safety 1,012,457 1,510,646 2,034,626 2,557,076 3,019.912
61. Saviour 67,945 68,121 10,561 194,240 N/S
62. Shield 505,956 1,145,922 1,530,327 2,102,993 2,597,133
63. Trans-National 222,366 354,437 470,585 420,156 473,070
64. Trinity - - 88,699 112,900 158,523
65. Tri-Star 1,481,263 1,604,359 2,095,376 2,612,467 2,766,881
66. UGroup Ltd. 23,501 36,115 43,652 62,325
67. Universal 123,944 130,016 - 101,896 93,446
68. VISAL 1,160,472 1,244,939
Total 27,651,046 26,901,161 48,623,536 64,722,972 73,144,221,
Earnings of top 10 cos. 19,060,875 23,539,265 30,640,273 40,544,266 45,138,831
Percentage of top 10 68% 67% 63% 62.6% 62%
N/S – These companies had not submitted their reports as at the time of finalising this report.

2016 Annual Report National Insurance Commission
36
LIFE COMPANIESThe Life sector grew by 21% in 2016 in terms of gross premium income. The analyses below do not include Adamas Life, First Insurance, Capital Express and Millennium Life Insurance Company. Companies with ratios out of range have not been included in determining the industry averages for the periods under review.
Key Income Statement Figures (2013-2015)
2016 2015 2014 2013
(GHS’m) (GHS’m) (GHS’m)
Gross Premium 858,781,522 705,853,360 578,927,147 469,825,330
Reinsurance 20,759,532 15,873,558 8,663,319 6,212,561
Net Premiums 838,021,990 688,003,933 571,818,794 462,612,769
Transfer to Life Fund (277,458,482) (268,854,540) (182,727,720) (210,035,111)
Underwriting Results (261,652,225) (312,247,111) (139,587,727) (23,352,153)
Net Policyholder Benefits Paid 443,544,001 392,832,147 305,093,314 213,783,081
Commissions 98,572,197 85,751,897 63,568,911 48,832,669
Management Expenses 253,938,737 252,806,835 169,075,741 114,070,306
Other Income 14,340,046 34,539,660 25,352,347 6,403,376
Investment Income 378,305,473 283,663,463 176,907,615 172,877,282
Net Profit after tax 98,237,141 (5,831,749) 54,648,759 46,298,727
Key Industry Average Ratios (2012-2016)
Life Ratios (%) 2012 2013 2014 2015 2016
Change in policyholder inflows 32 31 35 22 21
Policyholder Coverage (TP/Equity) 2.7x 2.6x 1.9x 1.8x 1.6x
Investment to Total Asset 70 70 78 84 84
Policyholder Benefits Cover (Inv./TP) 168 138 154 144 253
Retention Ratio 97 97 95 91 91
Investment Yield 12 19 18 17 16
Return on Equity 7.5 20 18 17 6
PERFORMANCE INDICATORS
2016 Annual Report National Insurance Commission
2016 Annual Report National Insurance Commission
37
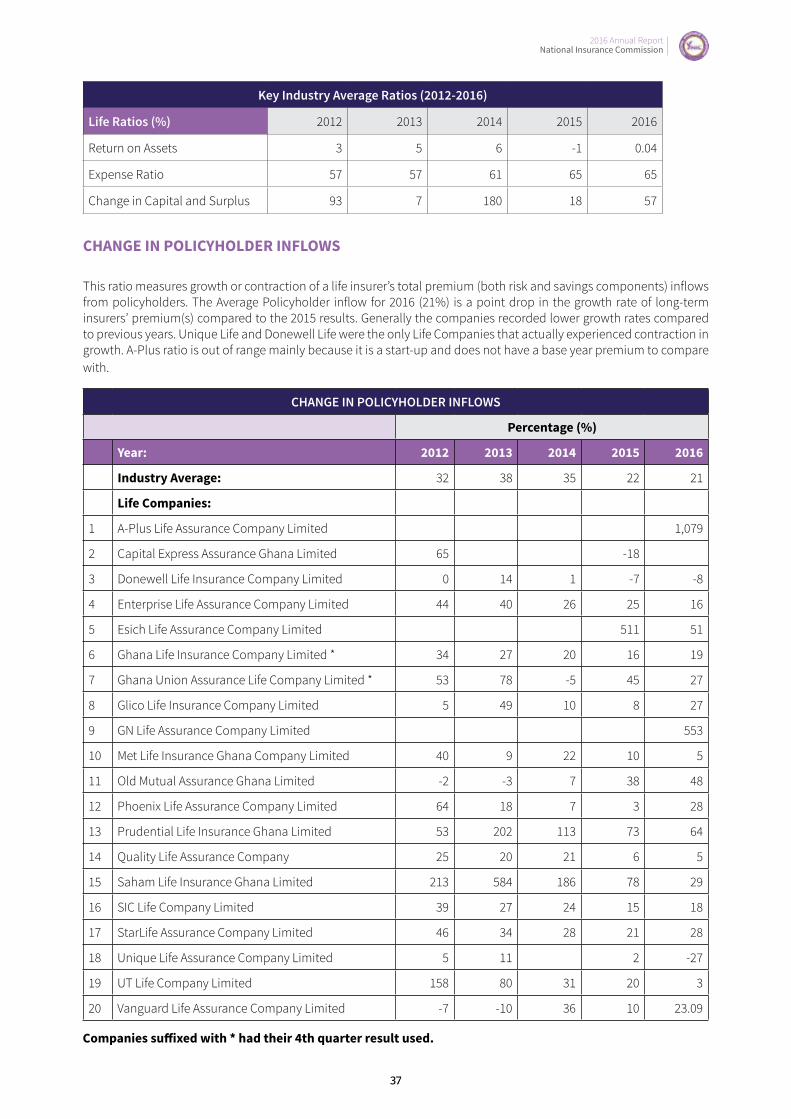
Key Industry Average Ratios (2012-2016)
Life Ratios (%) 2012 2013 2014 2015 2016
Return on Assets 3 5 6 -1 0.04
Expense Ratio 57 57 61 65 65
Change in Capital and Surplus 93 7 180 18 57
CHANGE IN POLICYHOLDER INFLOWS
This ratio measures growth or contraction of a life insurer’s total premium (both risk and savings components) inflows from policyholders. The Average Policyholder inflow for 2016 (21%) is a point drop in the growth rate of long-term insurers’ premium(s) compared to the 2015 results. Generally the companies recorded lower growth rates compared to previous years. Unique Life and Donewell Life were the only Life Companies that actually experienced contraction in growth. A-Plus ratio is out of range mainly because it is a start-up and does not have a base year premium to compare with.
CHANGE IN POLICYHOLDER INFLOWS
Percentage (%)
Year: 2012 2013 2014 2015 2016
Industry Average: 32 38 35 22 21
Life Companies:
1 A-Plus Life Assurance Company Limited 1,079
2 Capital Express Assurance Ghana Limited 65 -18
3 Donewell Life Insurance Company Limited 0 14 1 -7 -8
4 Enterprise Life Assurance Company Limited 44 40 26 25 16
5 Esich Life Assurance Company Limited 511 51
6 Ghana Life Insurance Company Limited * 34 27 20 16 19
7 Ghana Union Assurance Life Company Limited * 53 78 -5 45 27
8 Glico Life Insurance Company Limited 5 49 10 8 27
9 GN Life Assurance Company Limited 553
10 Met Life Insurance Ghana Company Limited 40 9 22 10 5
11 Old Mutual Assurance Ghana Limited -2 -3 7 38 48
12 Phoenix Life Assurance Company Limited 64 18 7 3 28
13 Prudential Life Insurance Ghana Limited 53 202 113 73 64
14 Quality Life Assurance Company 25 20 21 6 5
15 Saham Life Insurance Ghana Limited 213 584 186 78 29
16 SIC Life Company Limited 39 27 24 15 18
17 StarLife Assurance Company Limited 46 34 28 21 28
18 Unique Life Assurance Company Limited 5 11 2 -27
19 UT Life Company Limited 158 80 31 20 3
20 Vanguard Life Assurance Company Limited -7 -10 36 10 23.09
Companies suffixed with * had their 4th quarter result used.
2016 Annual Report National Insurance Commission
38
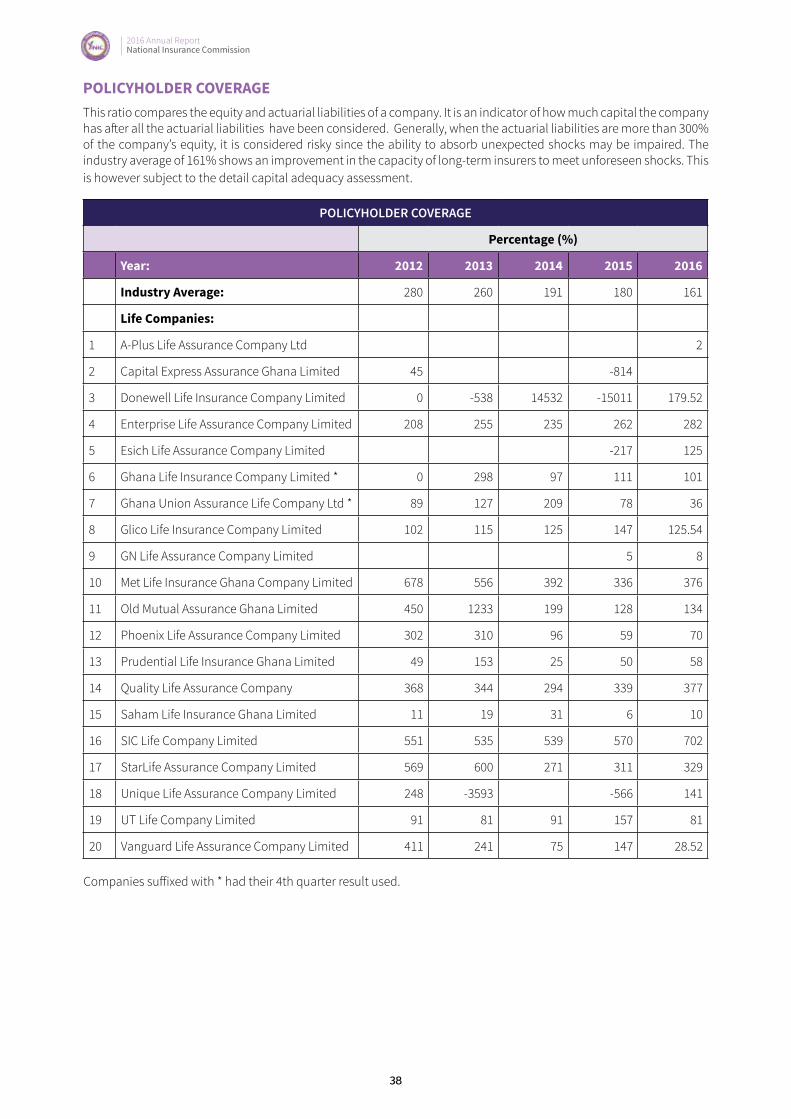
POLICYHOLDER COVERAGEThis ratio compares the equity and actuarial liabilities of a company. It is an indicator of how much capital the company has after all the actuarial liabilities have been considered. Generally, when the actuarial liabilities are more than 300% of the company’s equity, it is considered risky since the ability to absorb unexpected shocks may be impaired. The industry average of 161% shows an improvement in the capacity of long-term insurers to meet unforeseen shocks. This is however subject to the detail capital adequacy assessment.
POLICYHOLDER COVERAGE
Percentage (%)
Year: 2012 2013 2014 2015 2016
Industry Average: 280 260 191 180 161
Life Companies:
1 A-Plus Life Assurance Company Ltd 2
2 Capital Express Assurance Ghana Limited 45 -814
3 Donewell Life Insurance Company Limited 0 -538 14532 -15011 179.52
4 Enterprise Life Assurance Company Limited 208 255 235 262 282
5 Esich Life Assurance Company Limited -217 125
6 Ghana Life Insurance Company Limited * 0 298 97 111 101
7 Ghana Union Assurance Life Company Ltd * 89 127 209 78 36
8 Glico Life Insurance Company Limited 102 115 125 147 125.54
9 GN Life Assurance Company Limited 5 8
10 Met Life Insurance Ghana Company Limited 678 556 392 336 376
11 Old Mutual Assurance Ghana Limited 450 1233 199 128 134
12 Phoenix Life Assurance Company Limited 302 310 96 59 70
13 Prudential Life Insurance Ghana Limited 49 153 25 50 58
14 Quality Life Assurance Company 368 344 294 339 377
15 Saham Life Insurance Ghana Limited 11 19 31 6 10
16 SIC Life Company Limited 551 535 539 570 702
17 StarLife Assurance Company Limited 569 600 271 311 329
18 Unique Life Assurance Company Limited 248 -3593 -566 141
19 UT Life Company Limited 91 81 91 157 81
20 Vanguard Life Assurance Company Limited 411 241 75 147 28.52 Companies suffixed with * had their 4th quarter result used.
2016 Annual Report National Insurance Commission
2016 Annual Report National Insurance Commission
39
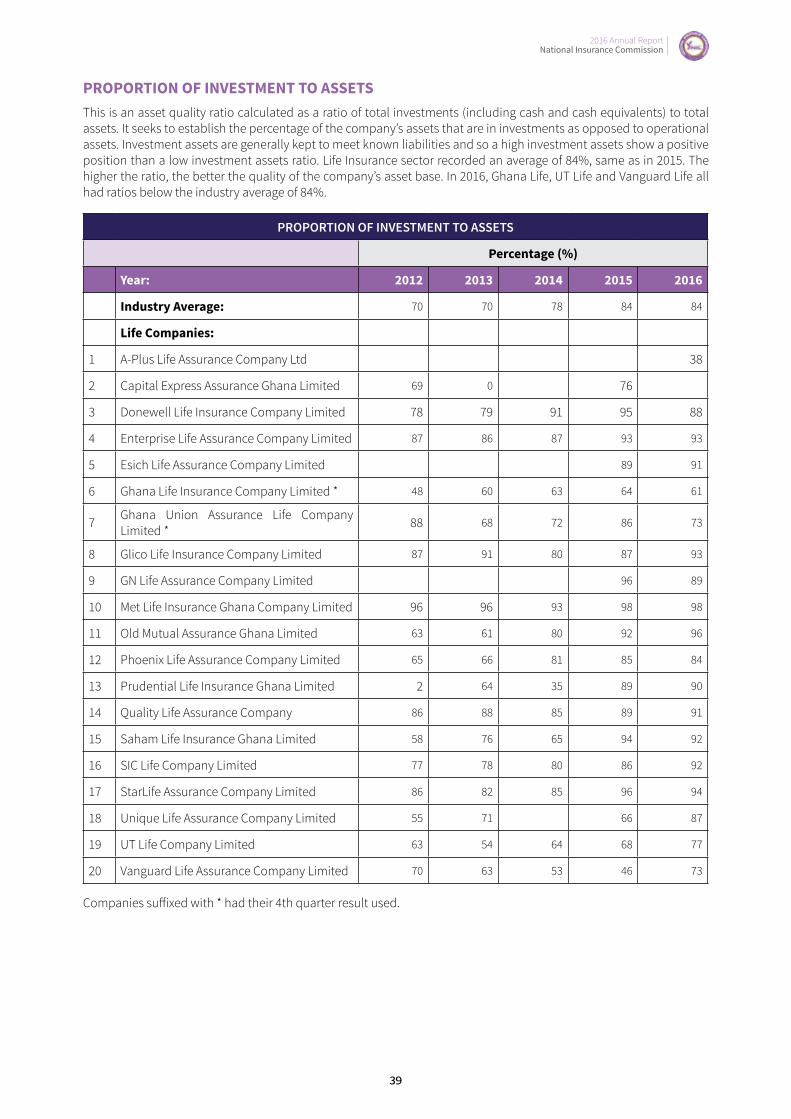
PROPORTION OF INVESTMENT TO ASSETSThis is an asset quality ratio calculated as a ratio of total investments (including cash and cash equivalents) to total assets. It seeks to establish the percentage of the company’s assets that are in investments as opposed to operational assets. Investment assets are generally kept to meet known liabilities and so a high investment assets show a positive position than a low investment assets ratio. Life Insurance sector recorded an average of 84%, same as in 2015. The higher the ratio, the better the quality of the company’s asset base. In 2016, Ghana Life, UT Life and Vanguard Life all had ratios below the industry average of 84%.
PROPORTION OF INVESTMENT TO ASSETS
Percentage (%)
Year: 2012 2013 2014 2015 2016
Industry Average: 70 70 78 84 84
Life Companies:
1 A-Plus Life Assurance Company Ltd 38
2 Capital Express Assurance Ghana Limited 69 0 76
3 Donewell Life Insurance Company Limited 78 79 91 95 88
4 Enterprise Life Assurance Company Limited 87 86 87 93 93
5 Esich Life Assurance Company Limited 89 91
6 Ghana Life Insurance Company Limited * 48 60 63 64 61
7 Ghana Union Assurance Life Company Limited * 88 68 72 86 73
8 Glico Life Insurance Company Limited 87 91 80 87 93
9 GN Life Assurance Company Limited 96 89
10 Met Life Insurance Ghana Company Limited 96 96 93 98 98
11 Old Mutual Assurance Ghana Limited 63 61 80 92 96
12 Phoenix Life Assurance Company Limited 65 66 81 85 84
13 Prudential Life Insurance Ghana Limited 2 64 35 89 90
14 Quality Life Assurance Company 86 88 85 89 91
15 Saham Life Insurance Ghana Limited 58 76 65 94 92
16 SIC Life Company Limited 77 78 80 86 92
17 StarLife Assurance Company Limited 86 82 85 96 94
18 Unique Life Assurance Company Limited 55 71 66 87
19 UT Life Company Limited 63 54 64 68 77
20 Vanguard Life Assurance Company Limited 70 63 53 46 73
Companies suffixed with * had their 4th quarter result used.

2016 Annual Report National Insurance Commission
40
POLICYHOLDER BENEFIT COVERThis is a measure of investment adequacy with respect to an insurer’s liability. It is calculated as a ratio of total investments to actuarial liabilities. It seeks to assess the adequacy of the company’s investments to cover the policyholder liabilities. The Life Sector recorded an average of 253% in 2016. This is the best in five years. The investment assets should, as a minimum, cover policyholder benefits. A ratio of less than 100% means that the company does not have enough investments to cover the policyholder liabilities. No company recorded a ratio below 100%. This ratio helps to analyse the adequacy of a company’s technical provisions and must be considered alongside policyholder benefit cover to ensure a company is not associated with the risk of under provisioning. A-Plus and GN Life ratios are out of range because it is a start-up.
POLICYHOLDER BENEFIT COVER
Percentage (%)
Year: 2012 2013 2014 2015 2016
Industry Average: 121 138 144 144 253
Life Companies:
1 A-Plus Life Assurance Company Ltd 1,796
2 Capital Express Assurance Ghana Limited 240 0 106
3 Donewell Life Insurance Company Limited 59 68 96 99 142
4 Enterprise Life Assurance Company Limited 138 132 134 135 134
5 Esich Life Assurance Company Limited 93 211
6 Ghana Life Insurance Company Limited * 72 91 146 135 135
7 Ghana Union Assurance Life Company Limited * 206 128 115 204 283
8 Glico Life Insurance Company Limited 183 180 150 158 194
9 GN Life Assurance Company Limited 2407 1353
10 Met Life Insurance Ghana Company Limited 121 128 122 135 131
11 Old Mutual Assurance Ghana Limited 77 69 132 175 178
12 Phoenix Life Assurance Company Limited 99 102 183 256 234
13 Prudential Life Insurance Ghana Limited 7 99 191 313 272
14 Quality Life Assurance Company 112 116 117 119 117
15 Saham Life Insurance Ghana Limited 815 702 393 1883 1,059
16 SIC Life Company Limited 96 97 99 103 109
17 StarLife Assurance Company Limited 104 101 123 134 131
18 Unique Life Assurance Company Limited 77 72 59 155
19 UT Life Company Limited 151 159 161 127 185
20 Vanguard Life Assurance Company Limited 89 96 145 103 407
Companies suffixed with * had their 4th quarter result used.
2016 Annual Report National Insurance Commission
2016 Annual Report National Insurance Commission
41
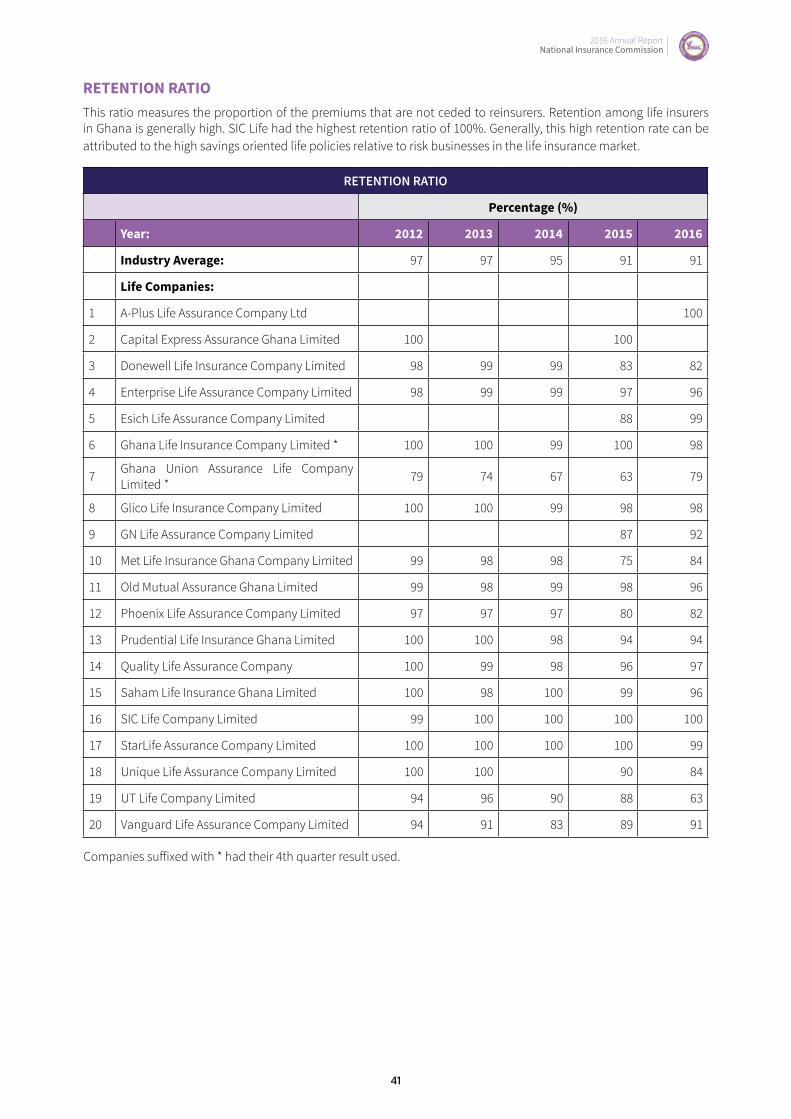
RETENTION RATIOThis ratio measures the proportion of the premiums that are not ceded to reinsurers. Retention among life insurers in Ghana is generally high. SIC Life had the highest retention ratio of 100%. Generally, this high retention rate can be attributed to the high savings oriented life policies relative to risk businesses in the life insurance market.
RETENTION RATIO
Percentage (%)
Year: 2012 2013 2014 2015 2016
Industry Average: 97 97 95 91 91
Life Companies:
1 A-Plus Life Assurance Company Ltd 100
2 Capital Express Assurance Ghana Limited 100 100
3 Donewell Life Insurance Company Limited 98 99 99 83 82
4 Enterprise Life Assurance Company Limited 98 99 99 97 96
5 Esich Life Assurance Company Limited 88 99
6 Ghana Life Insurance Company Limited * 100 100 99 100 98
7 Ghana Union Assurance Life Company Limited * 79 74 67 63 79
8 Glico Life Insurance Company Limited 100 100 99 98 98
9 GN Life Assurance Company Limited 87 92
10 Met Life Insurance Ghana Company Limited 99 98 98 75 84
11 Old Mutual Assurance Ghana Limited 99 98 99 98 96
12 Phoenix Life Assurance Company Limited 97 97 97 80 82
13 Prudential Life Insurance Ghana Limited 100 100 98 94 94
14 Quality Life Assurance Company 100 99 98 96 97
15 Saham Life Insurance Ghana Limited 100 98 100 99 96
16 SIC Life Company Limited 99 100 100 100 100
17 StarLife Assurance Company Limited 100 100 100 100 99
18 Unique Life Assurance Company Limited 100 100 90 84
19 UT Life Company Limited 94 96 90 88 63
20 Vanguard Life Assurance Company Limited 94 91 83 89 91
Companies suffixed with * had their 4th quarter result used.
2016 Annual Report National Insurance Commission
42
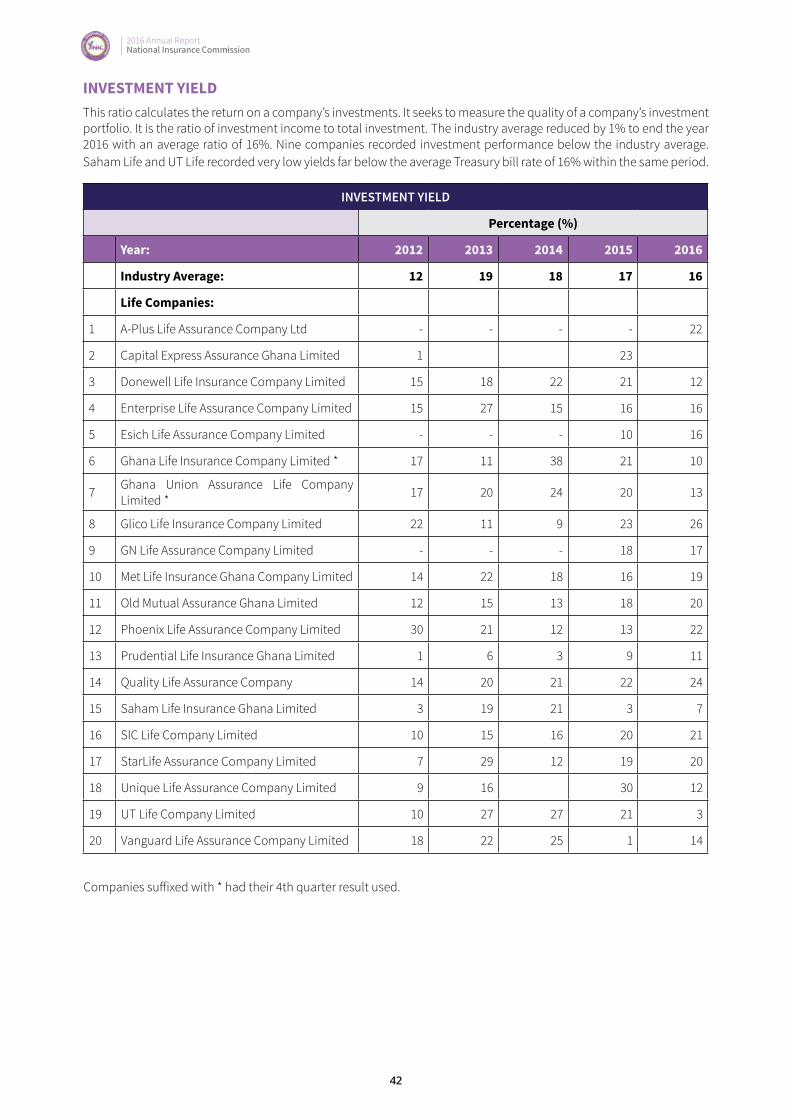
INVESTMENT YIELDThis ratio calculates the return on a company’s investments. It seeks to measure the quality of a company’s investment portfolio. It is the ratio of investment income to total investment. The industry average reduced by 1% to end the year 2016 with an average ratio of 16%. Nine companies recorded investment performance below the industry average. Saham Life and UT Life recorded very low yields far below the average Treasury bill rate of 16% within the same period.
INVESTMENT YIELD
Percentage (%)
Year: 2012 2013 2014 2015 2016
Industry Average: 12 19 18 17 16
Life Companies:
1 A-Plus Life Assurance Company Ltd - - - - 22
2 Capital Express Assurance Ghana Limited 1 23
3 Donewell Life Insurance Company Limited 15 18 22 21 12
4 Enterprise Life Assurance Company Limited 15 27 15 16 16
5 Esich Life Assurance Company Limited - - - 10 16
6 Ghana Life Insurance Company Limited * 17 11 38 21 10
7 Ghana Union Assurance Life Company Limited * 17 20 24 20 13
8 Glico Life Insurance Company Limited 22 11 9 23 26
9 GN Life Assurance Company Limited - - - 18 17
10 Met Life Insurance Ghana Company Limited 14 22 18 16 19
11 Old Mutual Assurance Ghana Limited 12 15 13 18 20
12 Phoenix Life Assurance Company Limited 30 21 12 13 22
13 Prudential Life Insurance Ghana Limited 1 6 3 9 11
14 Quality Life Assurance Company 14 20 21 22 24
15 Saham Life Insurance Ghana Limited 3 19 21 3 7
16 SIC Life Company Limited 10 15 16 20 21
17 StarLife Assurance Company Limited 7 29 12 19 20
18 Unique Life Assurance Company Limited 9 16 30 12
19 UT Life Company Limited 10 27 27 21 3
20 Vanguard Life Assurance Company Limited 18 22 25 1 14
Companies suffixed with * had their 4th quarter result used.
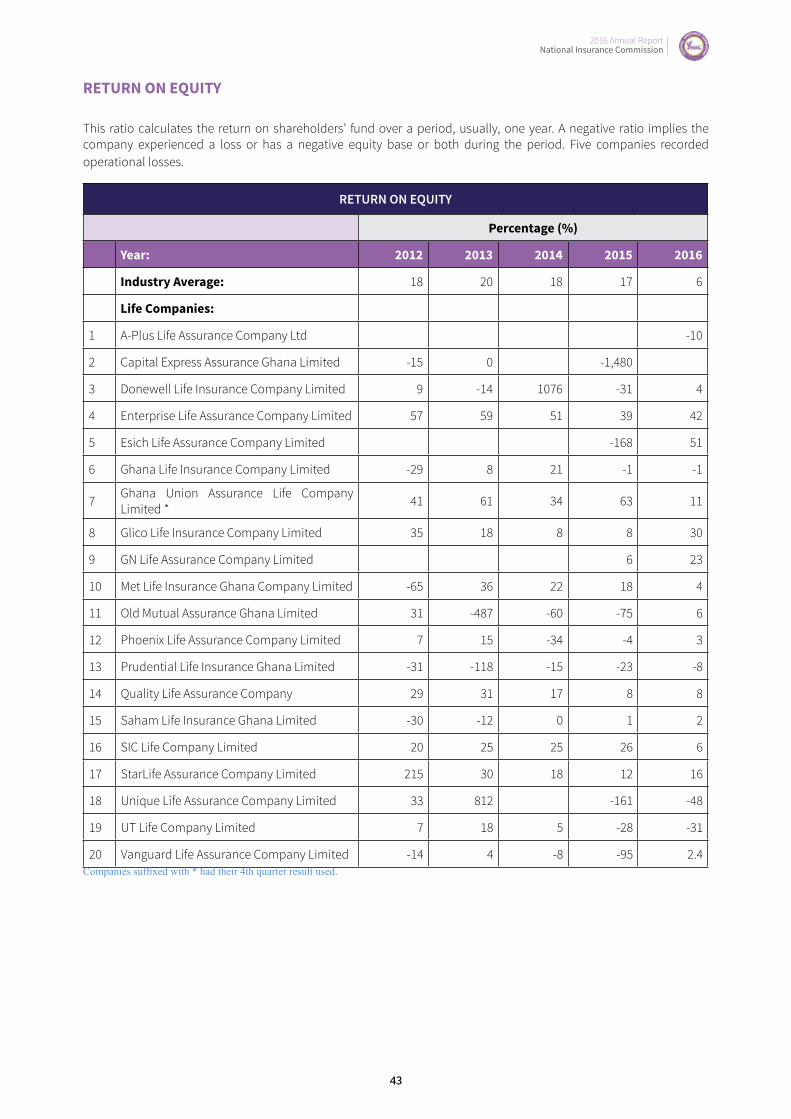
2016 Annual Report National Insurance Commission
2016 Annual Report National Insurance Commission
43
RETURN ON EQUITY
This ratio calculates the return on shareholders’ fund over a period, usually, one year. A negative ratio implies the company experienced a loss or has a negative equity base or both during the period. Five companies recorded operational losses.
RETURN ON EQUITY
Percentage (%)
Year: 2012 2013 2014 2015 2016
Industry Average: 18 20 18 17 6
Life Companies:
1 A-Plus Life Assurance Company Ltd -10
2 Capital Express Assurance Ghana Limited -15 0 -1,480
3 Donewell Life Insurance Company Limited 9 -14 1076 -31 4
4 Enterprise Life Assurance Company Limited 57 59 51 39 42
5 Esich Life Assurance Company Limited -168 51
6 Ghana Life Insurance Company Limited -29 8 21 -1 -1
7 Ghana Union Assurance Life Company Limited * 41 61 34 63 11
8 Glico Life Insurance Company Limited 35 18 8 8 30
9 GN Life Assurance Company Limited 6 23
10 Met Life Insurance Ghana Company Limited -65 36 22 18 4
11 Old Mutual Assurance Ghana Limited 31 -487 -60 -75 6
12 Phoenix Life Assurance Company Limited 7 15 -34 -4 3
13 Prudential Life Insurance Ghana Limited -31 -118 -15 -23 -8
14 Quality Life Assurance Company 29 31 17 8 8
15 Saham Life Insurance Ghana Limited -30 -12 0 1 2
16 SIC Life Company Limited 20 25 25 26 6
17 StarLife Assurance Company Limited 215 30 18 12 16
18 Unique Life Assurance Company Limited 33 812 -161 -48
19 UT Life Company Limited 7 18 5 -28 -31
20 Vanguard Life Assurance Company Limited -14 4 -8 -95 2.4Companies suffixed with * had their 4th quarter result used.

2016 Annual Report National Insurance Commission
44
RETURN ON ASSETThis is a ratio of profit after tax to total assets. It seeks to measure the efficiency with which management utilize the assets of the company to generate returns for its various stakeholders. Market performance for this ratio is on the decline in last three years. This can be attributed to the increasing volume of assets in the industry and the low profit base of the companies.
RETURN ON ASSET
Percentage (%)
Year: 2012 2013 2014 2015 2016
Industry Average: 3 7 6 -1 0.04
Life Companies:
1 A-Plus Life Assurance Company Ltd -0.09
2 Capital Express Assurance Ghana Limited -10 0 -131
3 Donewell Life Insurance Company Limited 3 7 -0.2 0.01
4 Enterprise Life Assurance Company Limited 17 15 14 10 0.10
5 Esich Life Assurance Company Limited -73 0.58
6 Ghana Life Insurance Company Limited 2 9 -0.3 -0.01
7 Ghana Union Assurance Life Company Limited * 20 25 10 34 0.08
8 Glico Life Insurance Company Limited 16 8 3 3 0.12
9 GN Life Assurance Company Limited 4 0.19
10 Met Life Insurance Ghana Company Limited -8 5 4 4 0.01
11 Old Mutual Assurance Ghana Limited 6 -35 (18) -31 0.02
12 Phoenix Life Assurance Company Limited 1 3 (16) -2 0.02
13 Prudential Life Insurance Ghana Limited -20 -39 (11) -13 -0.05
14 Quality Life Assurance Company 6 7 4 2 0.02
15 Saham Life Insurance Ghana Limited -20 -6 0 1 0.02
16 SIC Life Company Limited 3 4 4 4 0.01
17 StarLife Assurance Company Limited 31 4 5 3 0.04
18 Unique Life Assurance Company Limited 2 -22 (9) -32 -0.19
19 UT Life Company Limited 3 8 2 -10 -0.16
20 Vanguard Life Assurance Company Limited -3 1 (4) -29 0.02
Companies suffixed with * had their 4th quarter result used.
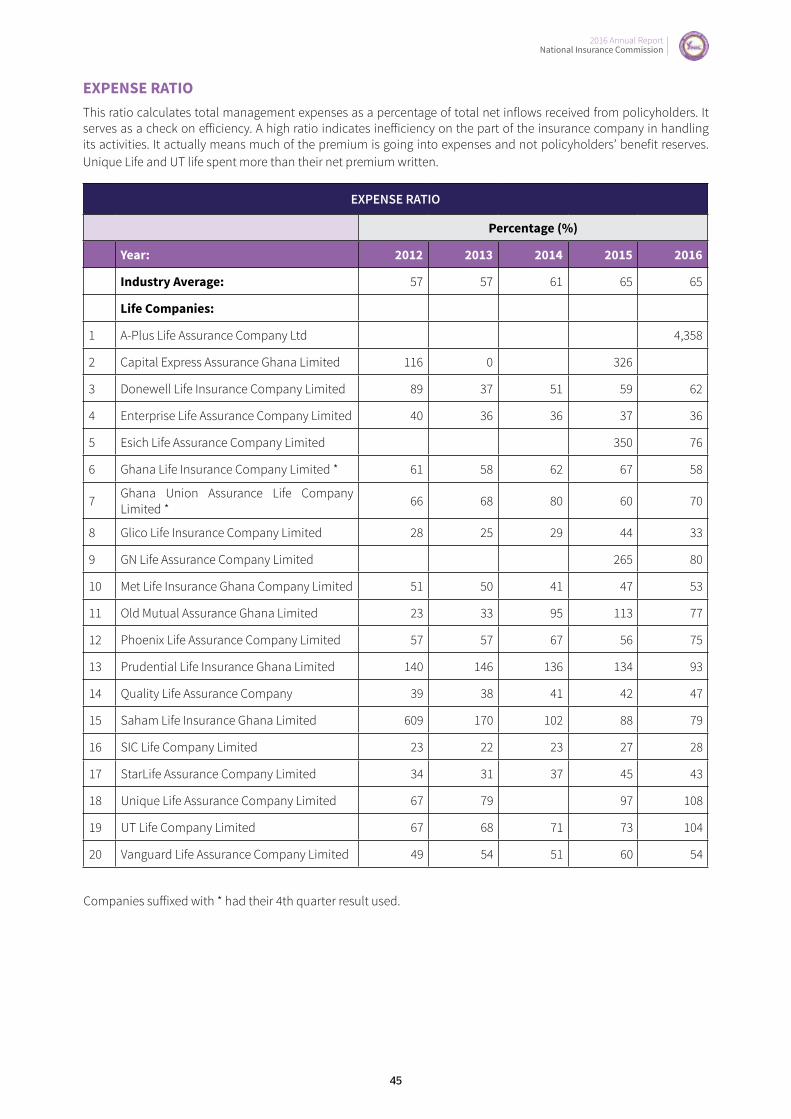
2016 Annual Report National Insurance Commission
2016 Annual Report National Insurance Commission
45
EXPENSE RATIOThis ratio calculates total management expenses as a percentage of total net inflows received from policyholders. It serves as a check on efficiency. A high ratio indicates inefficiency on the part of the insurance company in handling its activities. It actually means much of the premium is going into expenses and not policyholders’ benefit reserves. Unique Life and UT life spent more than their net premium written.
EXPENSE RATIO
Percentage (%)
Year: 2012 2013 2014 2015 2016
Industry Average: 57 57 61 65 65
Life Companies:
1 A-Plus Life Assurance Company Ltd 4,358
2 Capital Express Assurance Ghana Limited 116 0 326
3 Donewell Life Insurance Company Limited 89 37 51 59 62
4 Enterprise Life Assurance Company Limited 40 36 36 37 36
5 Esich Life Assurance Company Limited 350 76
6 Ghana Life Insurance Company Limited * 61 58 62 67 58
7 Ghana Union Assurance Life Company Limited * 66 68 80 60 70
8 Glico Life Insurance Company Limited 28 25 29 44 33
9 GN Life Assurance Company Limited 265 80
10 Met Life Insurance Ghana Company Limited 51 50 41 47 53
11 Old Mutual Assurance Ghana Limited 23 33 95 113 77
12 Phoenix Life Assurance Company Limited 57 57 67 56 75
13 Prudential Life Insurance Ghana Limited 140 146 136 134 93
14 Quality Life Assurance Company 39 38 41 42 47
15 Saham Life Insurance Ghana Limited 609 170 102 88 79
16 SIC Life Company Limited 23 22 23 27 28
17 StarLife Assurance Company Limited 34 31 37 45 43
18 Unique Life Assurance Company Limited 67 79 97 108
19 UT Life Company Limited 67 68 71 73 104
20 Vanguard Life Assurance Company Limited 49 54 51 60 54
Companies suffixed with * had their 4th quarter result used.

2016 Annual Report National Insurance Commission
46
CHANGE IN CAPITAL AND SURPLUSThis ratio measures the growth or decline in the equity of the insurer over the previous year’s. It is the general measure of improvement or deterioration of an insurer’s financial position. Some of the factors that could affect this ratio are after tax profits or losses, changes in unrealized gains or losses on assets, or actuarial liabilities valuation policies and assumptions and regulatory enforcement to inject capital.
CHANGE IN CAPITAL AND SURPLUS
Percentage (%)
Year: 2012 2013 2014 2015 2016
Industry Average: 93 7 180 18 57
Life Companies:
1 A-Plus Life Assurance Company Ltd 43
2 Capital Express Assurance Ghana Limited 487 -104
3 Donewell Life Insurance Company Limited 8 -28 -102 -207 -8595
4 Enterprise Life Assurance Company Limited 53 46 42 21 19
5 Esich Life Assurance Company Limited -246 -279
6 Ghana Life Insurance Company Limited * 4 11 253 7 21
7 Ghana Union Assurance Life Company Limited * 12 7 -21 167 463
8 Glico Life Insurance Company Limited 51 20 5 5 43
9 GN Life Assurance Company Limited 6 31
10 Met Life Insurance Ghana Company Limited 14 57 75 36 4
11 Old Mutual Assurance Ghana Limited 110 -47 749 102 7
12 Phoenix Life Assurance Company Limited 7 19 242 83 3
13 Prudential Life Insurance Ghana Limited 13671 -53 959 -19 28
14 Quality Life Assurance Company 62 38 42 3 5
15 Saham Life Insurance Ghana Limited 137 -10 0 782 2
16 SIC Life Company Limited 20 41 30 21 -3
17 StarLife Assurance Company Limited 29 48 185 17 27
18 Unique Life Assurance Company Limited -10 -143 -269 -556
19 UT Life Company Limited 410 84 41 -8 137
20 Vanguard Life Assurance Company Limited 8 25 0.1 -49 426
Companies suffixed with * had their 4th quarter result used.

2016 Annual Report National Insurance Commission
2016 Annual Report National Insurance Commission
47
AGGREGATED LIFE INDUSTRY BALANCE SHEET AS AT 31ST DECEMBER, 2016
ASSETS
2016 2015
GHS GHS
1. Cash 109,773,267 113,170,636
2. Investments:
Government of Ghana Securities 234,138,916 208,532,460
Bank of Ghana Securities 122,220,569 71,594,672
Statutory Deposits 21,026,008 11,096,574
Term deposits held at a licensed bank 938,217,992 674,016,790
Other term deposits 66,192,291 62,167,489
Corporate Debt 3,645,055 2,460,735
Securities listed on Ghana Stock Exchange 63,462,029 65,741,458
Other Securities 30,854,716 17,258,385
Equity backed mutual funds 59,019 2,379,928
Money market mutual funds 34,064,539 25,745,138
Land & building held as investment 363,313,109 266,855,868
Investments in, and subordinated loans to, connected persons 51,866,619 36,143,815
Other Investments 10,500,500 -
Total Investments 1,939,561,361 1,443,993,311
3. Receivables:
Policy Loans 49,082,582 65,473,120
Premium Debtors 5,194,420 1,308,882
Staff Loans and Advances 1,508,341 2,075,840
Due from reinsurers less than 3 months old 463,618 -
Due from reinsurers more than 3 months old 1,390,853 1,387,993
Due from other Insurers 93,997 -
Due from Agents and Brokers 2,442,070 1,414,214
Due from Connected Persons 4,888,174 9,366,955
Reinsurance Share of Insurance liabilities 847,691 703,144
Deferred Tax Assets 3,343,054 1,809,165
Other Receivables 27,261,181 27,743,977
Total Receivables 96,515,981 111,283,290
4. Property, Plant and Equipment
Lands and Buildings 45,141,749 36,663,852
Plant and Equipment 2,683,807 1,602,075

2016 Annual Report National Insurance Commission
48
AGGREGATED LIFE INDUSTRY BALANCE SHEET AS AT 31ST DECEMBER, 2016
ASSETS
2016 2015
GHS GHS
Computer Hardware and Software 4,221,114 5,721,084
Motor Vehicles 14,703,789 12,100,669
Furniture and Fittings 7,602,201 7,334,957
Other Assets 16,959,025 10,649,496
Total Property, Plant & Equipment 91,311,686 74,072,134
5. Intangible Assets
Goodwill, unless otherwise deducted 9,239 -
Other assets shown as intangible assets 3,217,216 1,388,451
Total Intangible Assets 3,226,455 1,388,451
6. Other assets
Capitalized research and development costs - -
Deferred acquisition costs - 37,108
Corporate stationery 563,133 211,014
Other assets not included above 89,563 16,000
Capitalized research and development costs 652,696 264,122
Deferred acquisition costs - -
TOTAL ASSETS 2,241,041,446 1,744,171,943
AGGREGATED LIFE INDUSTRY BALANCE SHEET AS AT 31ST DECEMBER, 2016
LIABILITIES AND EQUITY
2016 2015
GHS GHS
1. Technical Provisions
Actuarial Liabilities 1,434,015,816 1,164,899,813
Investment Contracts Liabilities 2,158,476 2,990,771
Other Provisions 239,088 310,562
Total Technical Provisions 1,436,413,380 1,168,201,146
2. Payables
Bank Overdrafts and Loans 6,328,963 3,426,881

2016 Annual Report National Insurance Commission
2016 Annual Report National Insurance Commission
49
AGGREGATED LIFE INDUSTRY BALANCE SHEET AS AT 31ST DECEMBER, 2016
LIABILITIES AND EQUITY
2016 2015
GHS GHS
Due to Reinsurers 3,806,279 2,195,238
Due to Agents and Brokers 5,149,729 3,342,505
Taxation 13,544,861 2,752,594
Deferred Taxation 37,061,128 22,065,638
Due to Related Parties 8,339,180 13,114,018
Other Accruals & Payables 80,363,164 62,184,367
Total Payables 154,593,304 109,081,242
3. Long Term Liabilities
Bank Loans 1,435,198 3,895,535
Debentures -
Subordinated Debts -
Other Borrowings -
Total Long-Term Liabilities 1,435,198 3,895,535
4. EQUITY
Paid up perpetual cumulative preference shares held as treasury 457,148,815 344,410,996
Contingency Reserves 30,104,842 -
Revaluation Reserves (Owned Land & Building) 0 -
Revaluation Reserves (Investments excluding items to be deducted from core capital) 0 -
Revaluation Reserves (Others) 0 -
Other Reserves(please specify) 0 -
Retained Earnings, as at end of previous financial year 30,104,842 21,132,218
Current year net earnings/deficit 23,342,261 16,251,865
“Others 15,130,512 42,819,092
Total Equity 648,599,561 462,994,020
TOTAL LIABILITIES AND EQUITY 2,241,041,444 1,744,171,943

2016 Annual Report National Insurance Commission
50
NON-LIFE COMPANIES
INTRODUCTIONThe Non-Life business grew by 28% in terms of gross premium income. The various growth and performance indicators have been summarized in the tables below.
2016 (GHS’ m) 2015 (GHS’ m) 2014 (GHS’ m) 2013 (GHS’ m)
Gross Premium 1,070 854 659, 582,
Reinsurance 402 355 272 204,
Net Written Premium 668 509 396 366
Net Earned Premium 597 475 394 325
Gross Claims Incurred 329 555 237 173
Management Expenses 445 273 274 210
Commissions 124 103 80 64
Underwriting Results (25) (65) (89) (24)
Investment Income 160 118 89 53
Other Income 25 30 22 20
Profit After Tax 88 61 22 73
Key Industry Average Ratios (2012 – 2015)
RATIO 2012 2013 2014 2015 2016
Change in Gross Written Premium (%) 38 18 13 32 28
Change in Net Written Premium (%) 43 14 13 43 41
Gross Insurance Risk Ratio 2.1x 2.2x 1.7x 1.7x 1.4x
Net Insurance Risk Ratio 1.4x 1.4x 1.1x 1.1x 0.7x
Change in Capital and Surplus (%) 12 25 76 48 45
Claims Reserve Ratio (%) 31 39 24 36 32
Retention Ratio (%) 71 71 68 68 68
Investments Yield (%) 10 16 16 16 16
PERFORMANCE INDICATORS

2016 Annual Report National Insurance Commission
2016 Annual Report National Insurance Commission
51
Key Industry Average Ratios (2012 – 2015)
RATIO 2012 2013 2014 2015 2016
Return on Assets (%) 5 5 4 3 4
Return on Equity (%) 12 11 6 16 9
Claims Ratio (%) 33 37 37 46 39
Expense Ratio (%) 78 75 92 89 94
Combined Ratio (%) 111* 112* 129* 135 133
Investments to Total Assets Ratio (%) 49 51 72 60 66
Technical Reserve Cover 160 141 70 76 64
CHANGES IN GROSS WRITTEN PREMIUMSThis measures growth or contraction in a company’s current gross premium relative to the prior year. In 2016 the industry recorded a ratio of 28%, a dip compared to 2015 growth rate of 32%. Nevertheless, the market continues to witness positive growth notwithstanding the cash requirement of the “No Premium No Cover” directive. While 11 insurance companies experienced some increase in growth, Activa, Ghana Union,Glico, Hollard and Saham saw their growth plummeting. Prime Insurance continue to show positive growth potential with ratios significantly above industry average in two years. Meanwhile Saham experienced contraction in growth to settle at -13%.
CHANGES IN GROSS WRITTEN PREMIUMS
Percentage (%)
Year: 2012 2013 2014 2015 2016
Industry Average: 38 18 13 32 28
Non-life Companies:
1. Activa International Insurance Company Limited 66 36 24 42 7
2. Allianz Insurance Company Limited 42 17 60 -18 24
3. Best Assurance Company Limited N/A N/A N/A N/A 0
4. Donewell Insurance Company Limited 6 16 3 36 50
5. Enterprise Insurance Company Limited 25 42 15 43 34
6. Equity Assurance Company Limited 66 17 24 36 48
7. Ghana Union Assurance Company Limited* 60 51 2 41 6
8. Glico General Insurance Company Limited 26 24 17 48 1
9. Heritage Insurance Company Limited -4 5 N/S N/S N/S
10. Hollard Insurance Company Limited 39 21 17 22 9
11. Imperial General Insurance Company Limited 0 0 420 20 42
12. Millennium Insurance Company Ltd 0 76 -9 23 58
13. NSIA Ghana Insurance Company 19 13 -33 46 38
14. Phoenix Insurance Company 45 16 4 38 33
15. Prime Insurance Company Limited 0 448 148 147 142
16. Priority Insurance Company Limited 0 7586 22 49 118
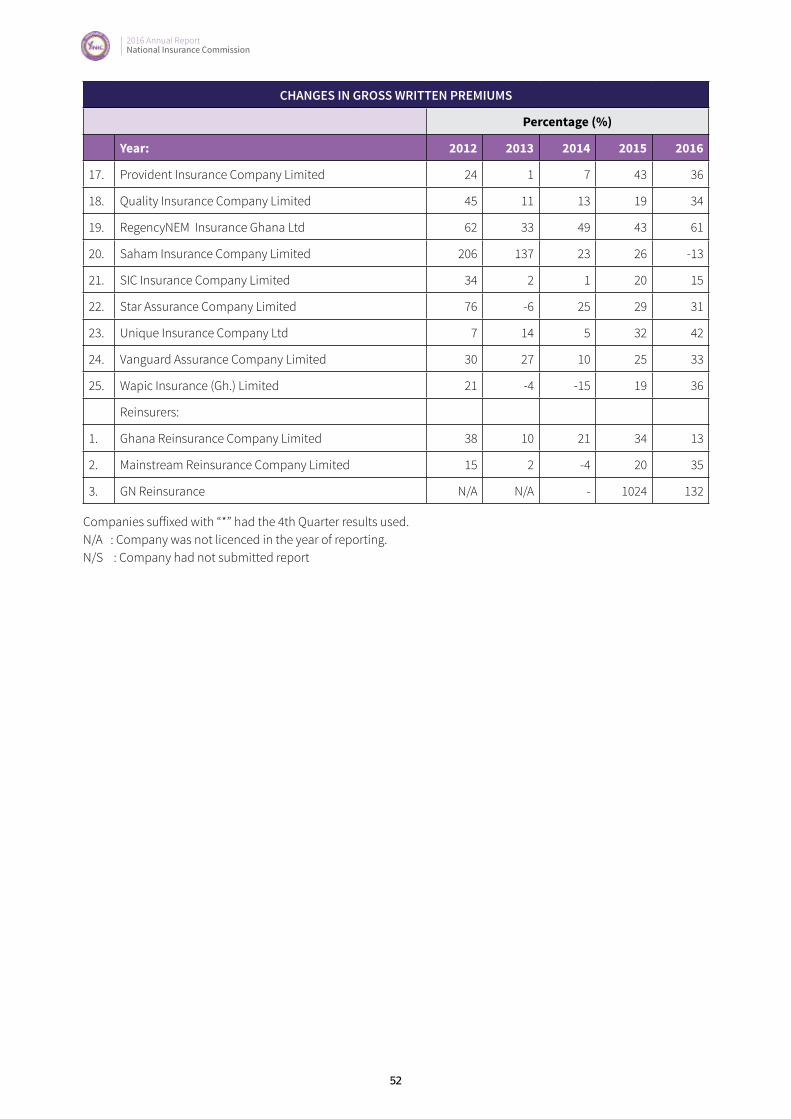
2016 Annual Report National Insurance Commission
52
CHANGES IN GROSS WRITTEN PREMIUMS
Percentage (%)
Year: 2012 2013 2014 2015 2016
17. Provident Insurance Company Limited 24 1 7 43 36
18. Quality Insurance Company Limited 45 11 13 19 34
19. RegencyNEM Insurance Ghana Ltd 62 33 49 43 61
20. Saham Insurance Company Limited 206 137 23 26 -13
21. SIC Insurance Company Limited 34 2 1 20 15
22. Star Assurance Company Limited 76 -6 25 29 31
23. Unique Insurance Company Ltd 7 14 5 32 42
24. Vanguard Assurance Company Limited 30 27 10 25 33
25. Wapic Insurance (Gh.) Limited 21 -4 -15 19 36
Reinsurers:
1. Ghana Reinsurance Company Limited 38 10 21 34 13
2. Mainstream Reinsurance Company Limited 15 2 -4 20 35
3. GN Reinsurance N/A N/A - 1024 132
Companies suffixed with “*” had the 4th Quarter results used.N/A : Company was not licenced in the year of reporting.N/S : Company had not submitted report

2016 Annual Report National Insurance Commission
2016 Annual Report National Insurance Commission
53
CHANGES IN NET WRITTEN PREMIUMThis measures growth or contraction in the company’s current net premiums over the previous year’s net premiums. A high growth/contraction rate that does not appear to be positively correlated to the gross premium growth rate may indicate significant changes in the companies’ reinsurance covers. Thus, any ratio greater or less than +or-33% reflects significant changes in reinsurance policy or volatility in premiums.
CHANGES IN NET WRITTEN PREMIUM
Percentage (%)
Year: 2012 2013 2014 2015 2016
Industry Average: 43 40 13 43 41
Non-life Companies:
1. Activa International Insurance Company Limited 32 17 29 15 31
2. Allianz Insurance Company Limited 59 34 54 36 18
3. Best Assurance Company Limited N/A N/A N/A N/A 0
4. Donewell Insurance Company Limited -10 22 20 29 51
5. Enterprise Insurance Company Limited 32 45 14 45 30
6. Equity Assurance Company Limited 68 14 23 30 49
7. Ghana Union Assurance Company Limited* 36 35 -7 46 36
8. Glico General Insurance Company Limited 21 43 -25 114 -9
9. Heritage Insurance Company Limited 0 4 N/S N/S N/S
10. Hollard Insurance Company Limited 46 38 -2 68 22
11. Imperial General Insurance Company Limited 68 79 361 22 53
12. Millennium Insurance Company Ltd 0 71 -15 24 47
13. NSIA Ghana Insurance Company 18 10 -34 27 32
14. Phoenix Insurance Company 35 21 0 34 22
15. Prime Insurance Company Limited 0 360 88 197 156
16. Priority Insurance Company Limited 0 7904 28 46 156
17. Provident Insurance Company Limited 26 -2 6 57 29
18. Quality Insurance Company Limited 77 16 6 22 36
19. RegencyNEM Insurance Ghana Ltd 51 35 42 36 87
20. Saham Insurance Company Limited 200 65 44 5 -22
21. SIC Insurance Company Limited 36 -9 -11 -8 40
22. Star Assurance Company Limited 70 2 14 37 33
23. Unique Insurance Company Ltd 8 17 -5 62 32
24. Vanguard Assurance Company Limited 35 41 9 14 22
25. Wapic Insurance (Gh.) Limited 16 -5 -11 17 28
Reinsurers:
1. Ghana Reinsurance Company Limited 33 6 41 10 21
2. Mainstream Reinsurance Company Limited 64 6 -14 30 19
3. GN Reinsurance N/A N/A - 706 115 Companies suffixed with “*” had the 4th Quarter results used.N/A : Company was not licenced in the year of reporting.
N/S : Company had not submitted report
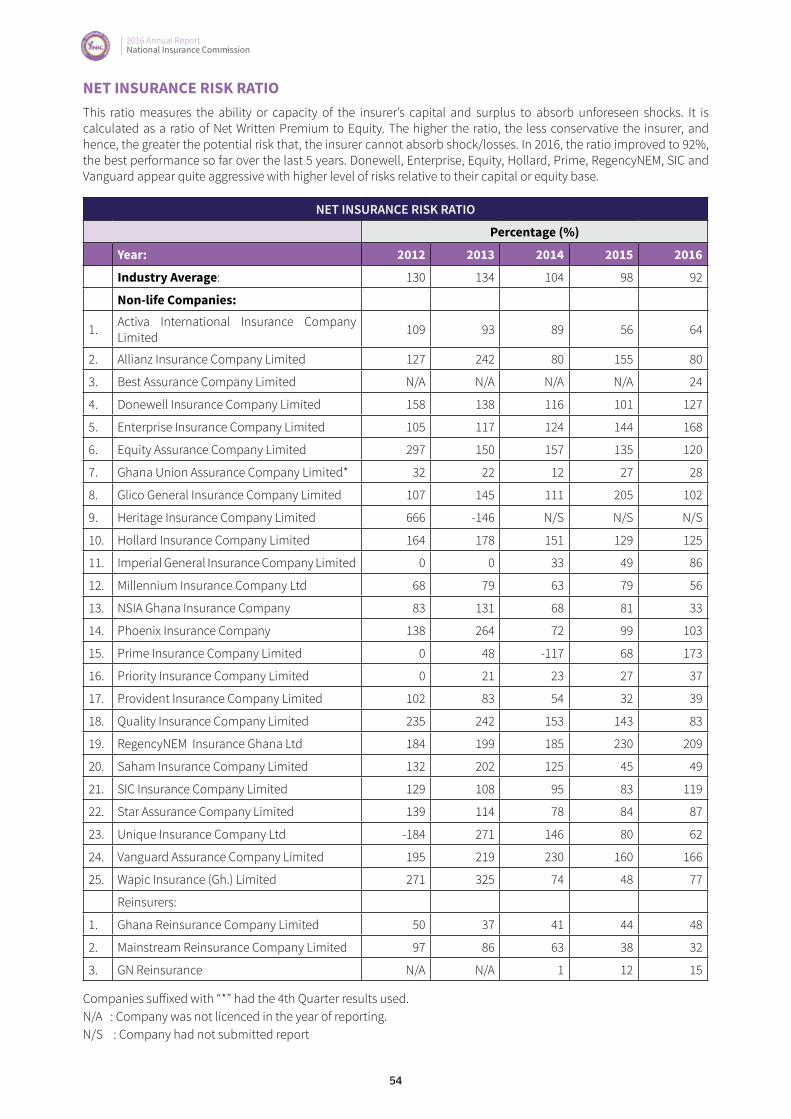
2016 Annual Report National Insurance Commission
54
NET INSURANCE RISK RATIOThis ratio measures the ability or capacity of the insurer’s capital and surplus to absorb unforeseen shocks. It is calculated as a ratio of Net Written Premium to Equity. The higher the ratio, the less conservative the insurer, and hence, the greater the potential risk that, the insurer cannot absorb shock/losses. In 2016, the ratio improved to 92%, the best performance so far over the last 5 years. Donewell, Enterprise, Equity, Hollard, Prime, RegencyNEM, SIC and Vanguard appear quite aggressive with higher level of risks relative to their capital or equity base.
NET INSURANCE RISK RATIO
Percentage (%)
Year: 2012 2013 2014 2015 2016
Industry Average: 130 134 104 98 92
Non-life Companies:
1. Activa International Insurance Company Limited 109 93 89 56 64
2. Allianz Insurance Company Limited 127 242 80 155 80
3. Best Assurance Company Limited N/A N/A N/A N/A 24
4. Donewell Insurance Company Limited 158 138 116 101 127
5. Enterprise Insurance Company Limited 105 117 124 144 168
6. Equity Assurance Company Limited 297 150 157 135 120
7. Ghana Union Assurance Company Limited* 32 22 12 27 28
8. Glico General Insurance Company Limited 107 145 111 205 102
9. Heritage Insurance Company Limited 666 -146 N/S N/S N/S
10. Hollard Insurance Company Limited 164 178 151 129 125
11. Imperial General Insurance Company Limited 0 0 33 49 86
12. Millennium Insurance Company Ltd 68 79 63 79 56
13. NSIA Ghana Insurance Company 83 131 68 81 33
14. Phoenix Insurance Company 138 264 72 99 103
15. Prime Insurance Company Limited 0 48 -117 68 173
16. Priority Insurance Company Limited 0 21 23 27 37
17. Provident Insurance Company Limited 102 83 54 32 39
18. Quality Insurance Company Limited 235 242 153 143 83
19. RegencyNEM Insurance Ghana Ltd 184 199 185 230 209
20. Saham Insurance Company Limited 132 202 125 45 49
21. SIC Insurance Company Limited 129 108 95 83 119
22. Star Assurance Company Limited 139 114 78 84 87
23. Unique Insurance Company Ltd -184 271 146 80 62
24. Vanguard Assurance Company Limited 195 219 230 160 166
25. Wapic Insurance (Gh.) Limited 271 325 74 48 77
Reinsurers:
1. Ghana Reinsurance Company Limited 50 37 41 44 48
2. Mainstream Reinsurance Company Limited 97 86 63 38 32
3. GN Reinsurance N/A N/A 1 12 15
Companies suffixed with “*” had the 4th Quarter results used.N/A : Company was not licenced in the year of reporting.N/S : Company had not submitted report
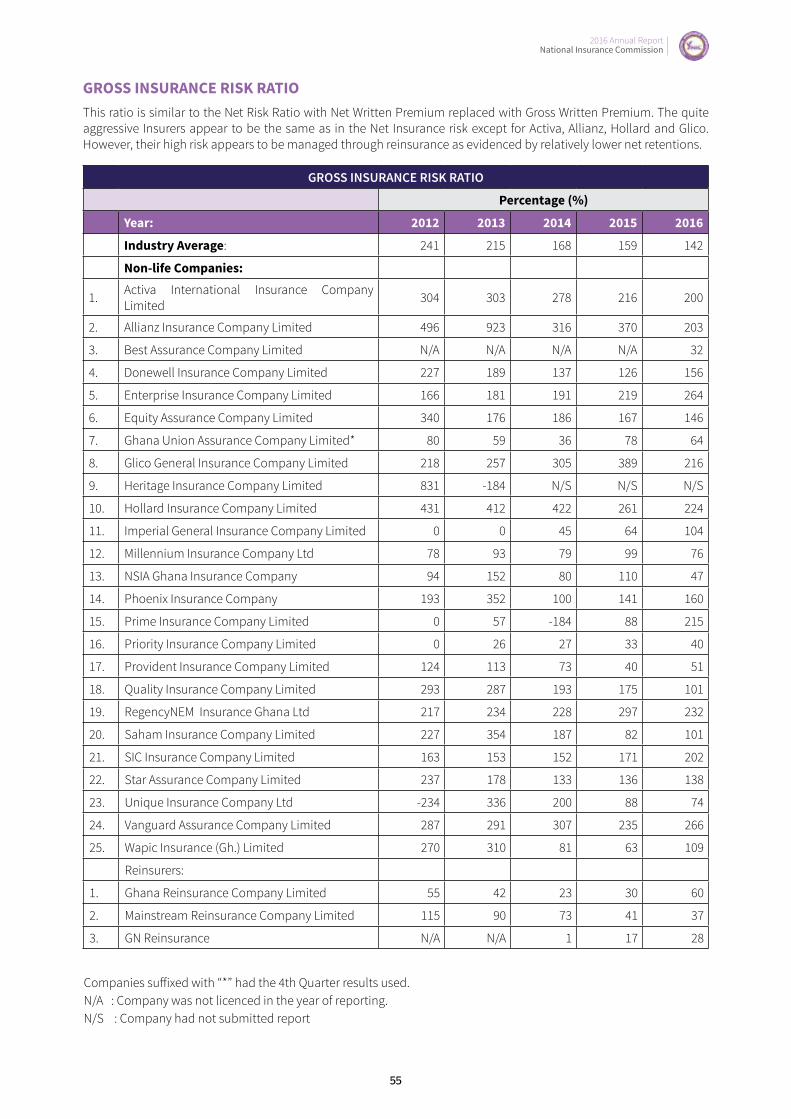
2016 Annual Report National Insurance Commission
2016 Annual Report National Insurance Commission
55
GROSS INSURANCE RISK RATIOThis ratio is similar to the Net Risk Ratio with Net Written Premium replaced with Gross Written Premium. The quite aggressive Insurers appear to be the same as in the Net Insurance risk except for Activa, Allianz, Hollard and Glico. However, their high risk appears to be managed through reinsurance as evidenced by relatively lower net retentions.
GROSS INSURANCE RISK RATIO
Percentage (%)
Year: 2012 2013 2014 2015 2016
Industry Average: 241 215 168 159 142
Non-life Companies:
1. Activa International Insurance Company Limited 304 303 278 216 200
2. Allianz Insurance Company Limited 496 923 316 370 203
3. Best Assurance Company Limited N/A N/A N/A N/A 32
4. Donewell Insurance Company Limited 227 189 137 126 156
5. Enterprise Insurance Company Limited 166 181 191 219 264
6. Equity Assurance Company Limited 340 176 186 167 146
7. Ghana Union Assurance Company Limited* 80 59 36 78 64
8. Glico General Insurance Company Limited 218 257 305 389 216
9. Heritage Insurance Company Limited 831 -184 N/S N/S N/S
10. Hollard Insurance Company Limited 431 412 422 261 224
11. Imperial General Insurance Company Limited 0 0 45 64 104
12. Millennium Insurance Company Ltd 78 93 79 99 76
13. NSIA Ghana Insurance Company 94 152 80 110 47
14. Phoenix Insurance Company 193 352 100 141 160
15. Prime Insurance Company Limited 0 57 -184 88 215
16. Priority Insurance Company Limited 0 26 27 33 40
17. Provident Insurance Company Limited 124 113 73 40 51
18. Quality Insurance Company Limited 293 287 193 175 101
19. RegencyNEM Insurance Ghana Ltd 217 234 228 297 232
20. Saham Insurance Company Limited 227 354 187 82 101
21. SIC Insurance Company Limited 163 153 152 171 202
22. Star Assurance Company Limited 237 178 133 136 138
23. Unique Insurance Company Ltd -234 336 200 88 74
24. Vanguard Assurance Company Limited 287 291 307 235 266
25. Wapic Insurance (Gh.) Limited 270 310 81 63 109
Reinsurers:
1. Ghana Reinsurance Company Limited 55 42 23 30 60
2. Mainstream Reinsurance Company Limited 115 90 73 41 37
3. GN Reinsurance N/A N/A 1 17 28
Companies suffixed with “*” had the 4th Quarter results used.N/A : Company was not licenced in the year of reporting.N/S : Company had not submitted report

2016 Annual Report National Insurance Commission
56
CHANGE IN CAPITAL AND SURPLUSThis ratio measures the growth or decline in the equity of the insurer over the previous year. It is the general measure of improvement or deterioration of an insurer’s financial position. Some of the factors that could affect this ratio are after tax profits or losses, changes in unrealized gains or losses on assets, or changes in the Technical Provision valuation policies and injection of capital. In 2016, the ratio declines marginally from 48% to 45%. We expect this ratio to further reduce mainly because the industry averages of 2014, 2015 and 2016 have been largely influenced by capital injections due to regulatory requirements. The acceptable threshold for this ratio is between 0 to 33%. The nature, scale, complexity as well as the risk appetite level of the insurer’s business is a useful indicator of the level of capital required.
CHANGE IN CAPITAL AND SURPLUSPercentage (%)
Year: 2012 2013 2014 2015 2016Industry Average: 25 24 76 48 45
Non-life Companies:
1. Activa International Insurance Company Limited 37 36 35 83 16
2. Allianz Insurance Company Limited 18 -20 366 -30 127
3. Best Assurance Company Limited N/A N/A N/A N/A 0
4. Donewell Insurance Company Limited -9 52 42 44 21
5. Enterprise Insurance Company Limited 19 15 9 25 11
6. Equity Assurance Company Limited 22 126 18 52 68
7. Ghana Union Assurance Company Limited* 30 103 67 -34 30
8. Glico General Insurance Company Limited 20 5 -2 16 83
9. Heritage Insurance Company Limited 116 -573 N/S N/S N/S
10. Hollard Insurance Company Limited 23 25 15 97 26
11. Imperial General Insurance Company Limited 0 0 3 1 -12
12. Millennium Insurance Company Ltd 15 47 8 -2 106
13. NSIA Ghana Insurance Company 30 -30 27 6 227
14. Phoenix Insurance Company 32 -1 265 8 17
15. Prime Insurance Company Limited 0 36 -177 -615 6
16. Priority Insurance Company Limited 0 11 16 29 87
17. Provident Insurance Company Limited -12 20 64 185 5
18. Quality Insurance Company Limited 72 13 203 31 153
19. RegencyNEM Insurance Ghana Ltd 104 23 53 10 96
20. Saham Insurance Company Limited 113 8 133 191 -28
21. SIC Insurance Company Limited -22 9 2 9 -2
22. Star Assurance Company Limited 94 25 66 26 29
23. Unique Insurance Company Ltd -222 -179 76 198 7
24. Vanguard Assurance Company Limited 37 25 4 64 17.76
25. Wapic Insurance (Gh.) Limited 11 -21 293 82 -21.28
Reinsurers:
1. Ghana Reinsurance Company Limited 49 27 23 3 9
2. Mainstream Reinsurance Company Limited 29 19 30 216 42
3. GN Reinsurance N/A N/A - -12 18
Companies suffixed with “*” had the 4th Quarter results used.N/A : Company was not licenced in the year of reporting.N/S : Company had not submitted report.

2016 Annual Report National Insurance Commission
2016 Annual Report National Insurance Commission
57
CLAIMS RESERVE RATIOThis ratio is calculated as the Provision for Outstanding Claims (including the IBNR) divided by the Net Earned Premiums. It compares the relationship of Provisions for Outstanding Claims to Net Earned Premiums, to determine whether or not the company is adequately reserving for claims in process. It is therefore an indication of the adequacy of the Outstanding Claims Provision. The internationally acceptable range for this ratio is between 25% and 50%. In 2016 the average ratio reduced to 32% from 36% in 2015. Glico, Millennium, Star, Unique Wapic, improved their ratios. The ratios for Activa, Hollard and Saham have improved relative to the 2015 high ratios. Allianz, Equity, Imperial, Phoenix, Prime, Priority, Quality, RegencyNem have their ratios being far below the thresholds.
CLAIMS RESERVE RATIO
Percentage (%)Year: 2012 2013 2014 2015 2016Industry Average: 32 38 24 36 32
Non-life Companies:
1. Activa International Insurance Company Limited 128 97 109 308 60
2. Allianz Insurance Company Limited 13 29 12 63 6
3. Best Assurance Company Limited N/A N/A N/A N/A 4
4. Donewell Insurance Company Limited 46 42 35 23 19
5. Enterprise Insurance Company Limited 4 11 14 70 21
6. Equity Assurance Company Limited 6 12 21 26 10
7. Ghana Union Assurance Company Limited* 86 74 67 290 176
8. Glico General Insurance Company Limited 45 49 42 32 44
9. Heritage Insurance Company Limited 12 48 N/S N/S N/S
10. Hollard Insurance Company Limited 31 32 42 149 75
11. Imperial General Insurance Company Limited 0 17 15 10
12. Millennium Insurance Company Ltd 35 15 15 26 40
13. NSIA Ghana Insurance Company 64 96 104 98 66
14. Phoenix Insurance Company 5 14 7 15 13
15. Prime Insurance Company Limited 80 86 14 13
16. Priority Insurance Company Limited 350 96 22 24 19
17. Provident Insurance Company Limited 65 46 43 62 50
18. Quality Insurance Company Limited 33 22 11 12 10
19. RegencyNEM Insurance Ghana Ltd 31 24 15 24 5
20. Saham Insurance Company Limited 17 34 13 148 75
21. SIC Insurance Company Limited 14 15 19 54 17
22. Star Assurance Company Limited 14 14 19 28 38
23. Unique Insurance Company Ltd 71 24 35 18 28
24. Vanguard Assurance Company Limited 15 9 13 22 17
25. Wapic Insurance (Gh.) Limited 26 41 34 86 100
Reinsurers:
1. Ghana Reinsurance Company Limited 24 36 42 45 36
2. Mainstream Reinsurance Company Limited 10 10 5 34 10
3. GN Reinsurance N/A N/A - 47 18
Companies suffixed with “*” had the 4th Quarter results used.N/A : Company was not licenced in the year of reporting.N/S : Company had not submitted report
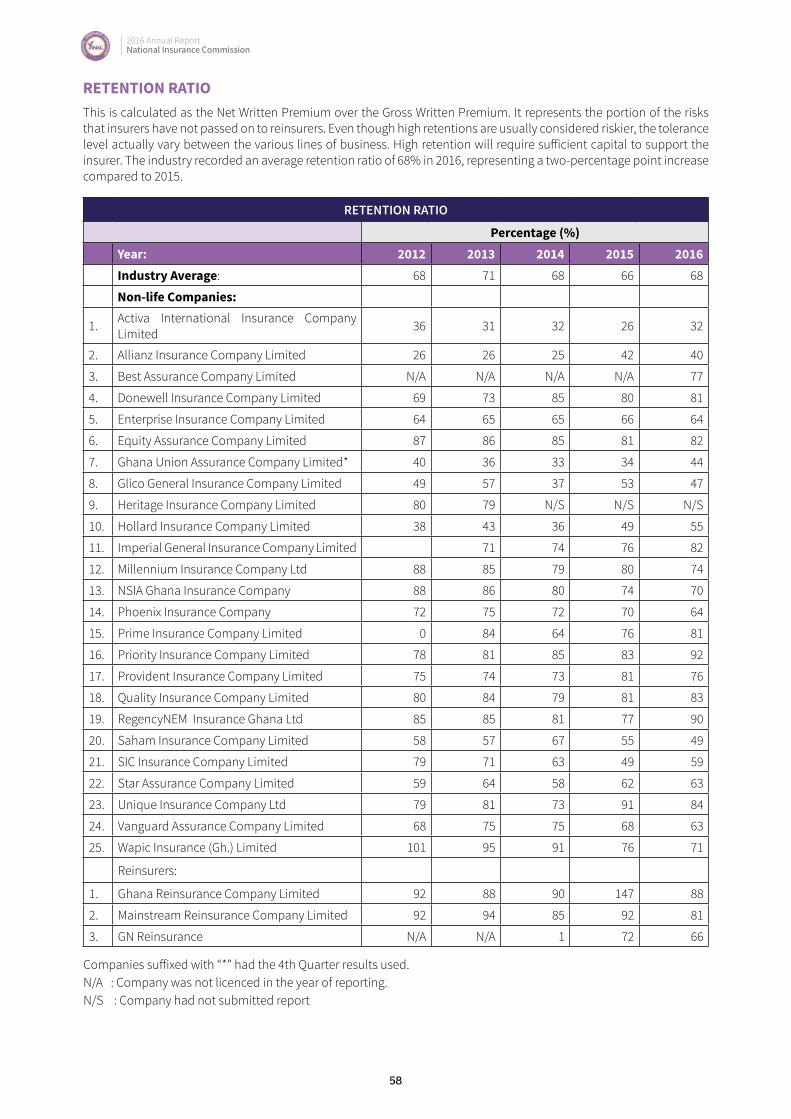
2016 Annual Report National Insurance Commission
58
RETENTION RATIOThis is calculated as the Net Written Premium over the Gross Written Premium. It represents the portion of the risks that insurers have not passed on to reinsurers. Even though high retentions are usually considered riskier, the tolerance level actually vary between the various lines of business. High retention will require sufficient capital to support the insurer. The industry recorded an average retention ratio of 68% in 2016, representing a two-percentage point increase compared to 2015.
RETENTION RATIO
Percentage (%)Year: 2012 2013 2014 2015 2016Industry Average: 68 71 68 66 68
Non-life Companies:
1. Activa International Insurance Company Limited 36 31 32 26 32
2. Allianz Insurance Company Limited 26 26 25 42 40
3. Best Assurance Company Limited N/A N/A N/A N/A 77
4. Donewell Insurance Company Limited 69 73 85 80 81
5. Enterprise Insurance Company Limited 64 65 65 66 64
6. Equity Assurance Company Limited 87 86 85 81 82
7. Ghana Union Assurance Company Limited* 40 36 33 34 44
8. Glico General Insurance Company Limited 49 57 37 53 47
9. Heritage Insurance Company Limited 80 79 N/S N/S N/S
10. Hollard Insurance Company Limited 38 43 36 49 55
11. Imperial General Insurance Company Limited 71 74 76 82
12. Millennium Insurance Company Ltd 88 85 79 80 74
13. NSIA Ghana Insurance Company 88 86 80 74 70
14. Phoenix Insurance Company 72 75 72 70 64
15. Prime Insurance Company Limited 0 84 64 76 81
16. Priority Insurance Company Limited 78 81 85 83 92
17. Provident Insurance Company Limited 75 74 73 81 76
18. Quality Insurance Company Limited 80 84 79 81 83
19. RegencyNEM Insurance Ghana Ltd 85 85 81 77 90
20. Saham Insurance Company Limited 58 57 67 55 49
21. SIC Insurance Company Limited 79 71 63 49 59
22. Star Assurance Company Limited 59 64 58 62 63
23. Unique Insurance Company Ltd 79 81 73 91 84
24. Vanguard Assurance Company Limited 68 75 75 68 63
25. Wapic Insurance (Gh.) Limited 101 95 91 76 71
Reinsurers:
1. Ghana Reinsurance Company Limited 92 88 90 147 88
2. Mainstream Reinsurance Company Limited 92 94 85 92 81
3. GN Reinsurance N/A N/A 1 72 66
Companies suffixed with “*” had the 4th Quarter results used.N/A : Company was not licenced in the year of reporting.N/S : Company had not submitted report
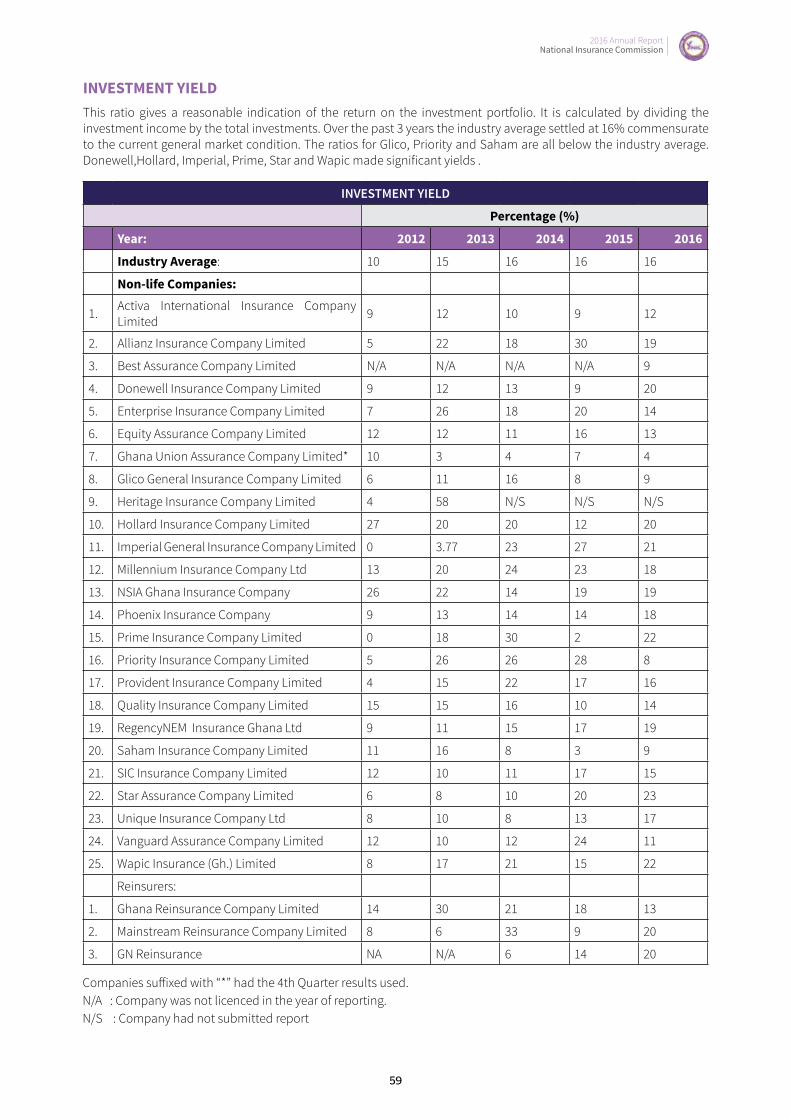
2016 Annual Report National Insurance Commission
2016 Annual Report National Insurance Commission
59
INVESTMENT YIELDThis ratio gives a reasonable indication of the return on the investment portfolio. It is calculated by dividing the investment income by the total investments. Over the past 3 years the industry average settled at 16% commensurate to the current general market condition. The ratios for Glico, Priority and Saham are all below the industry average. Donewell,Hollard, Imperial, Prime, Star and Wapic made significant yields .
INVESTMENT YIELD
Percentage (%)
Year: 2012 2013 2014 2015 2016
Industry Average: 10 15 16 16 16
Non-life Companies:
1. Activa International Insurance Company Limited 9 12 10 9 12
2. Allianz Insurance Company Limited 5 22 18 30 19
3. Best Assurance Company Limited N/A N/A N/A N/A 9
4. Donewell Insurance Company Limited 9 12 13 9 20
5. Enterprise Insurance Company Limited 7 26 18 20 14
6. Equity Assurance Company Limited 12 12 11 16 13
7. Ghana Union Assurance Company Limited* 10 3 4 7 4
8. Glico General Insurance Company Limited 6 11 16 8 9
9. Heritage Insurance Company Limited 4 58 N/S N/S N/S
10. Hollard Insurance Company Limited 27 20 20 12 20
11. Imperial General Insurance Company Limited 0 3.77 23 27 21
12. Millennium Insurance Company Ltd 13 20 24 23 18
13. NSIA Ghana Insurance Company 26 22 14 19 19
14. Phoenix Insurance Company 9 13 14 14 18
15. Prime Insurance Company Limited 0 18 30 2 22
16. Priority Insurance Company Limited 5 26 26 28 8
17. Provident Insurance Company Limited 4 15 22 17 16
18. Quality Insurance Company Limited 15 15 16 10 14
19. RegencyNEM Insurance Ghana Ltd 9 11 15 17 19
20. Saham Insurance Company Limited 11 16 8 3 9
21. SIC Insurance Company Limited 12 10 11 17 15
22. Star Assurance Company Limited 6 8 10 20 23
23. Unique Insurance Company Ltd 8 10 8 13 17
24. Vanguard Assurance Company Limited 12 10 12 24 11
25. Wapic Insurance (Gh.) Limited 8 17 21 15 22
Reinsurers:
1. Ghana Reinsurance Company Limited 14 30 21 18 13
2. Mainstream Reinsurance Company Limited 8 6 33 9 20
3. GN Reinsurance NA N/A 6 14 20
Companies suffixed with “*” had the 4th Quarter results used.N/A : Company was not licenced in the year of reporting.N/S : Company had not submitted report
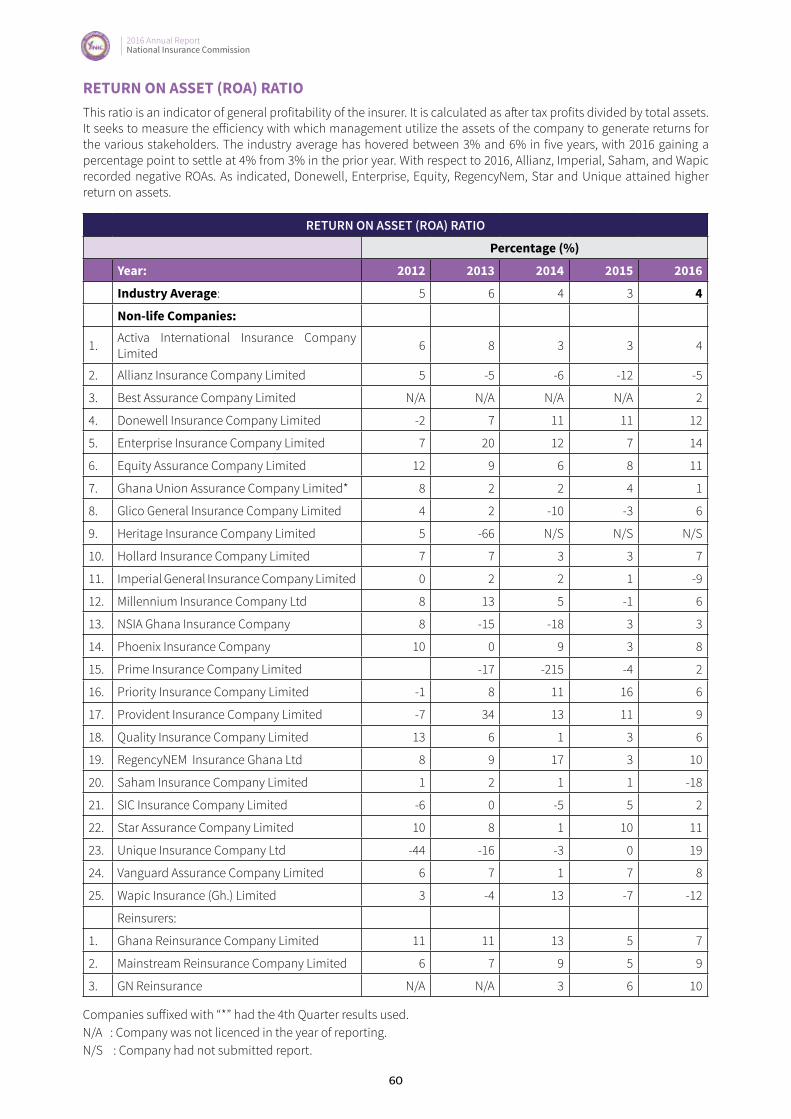
2016 Annual Report National Insurance Commission
60
RETURN ON ASSET (ROA) RATIOThis ratio is an indicator of general profitability of the insurer. It is calculated as after tax profits divided by total assets. It seeks to measure the efficiency with which management utilize the assets of the company to generate returns for the various stakeholders. The industry average has hovered between 3% and 6% in five years, with 2016 gaining a percentage point to settle at 4% from 3% in the prior year. With respect to 2016, Allianz, Imperial, Saham, and Wapic recorded negative ROAs. As indicated, Donewell, Enterprise, Equity, RegencyNem, Star and Unique attained higher return on assets.
RETURN ON ASSET (ROA) RATIO
Percentage (%)
Year: 2012 2013 2014 2015 2016
Industry Average: 5 6 4 3 4
Non-life Companies:
1. Activa International Insurance Company Limited 6 8 3 3 4
2. Allianz Insurance Company Limited 5 -5 -6 -12 -5
3. Best Assurance Company Limited N/A N/A N/A N/A 2
4. Donewell Insurance Company Limited -2 7 11 11 12
5. Enterprise Insurance Company Limited 7 20 12 7 14
6. Equity Assurance Company Limited 12 9 6 8 11
7. Ghana Union Assurance Company Limited* 8 2 2 4 1
8. Glico General Insurance Company Limited 4 2 -10 -3 6
9. Heritage Insurance Company Limited 5 -66 N/S N/S N/S
10. Hollard Insurance Company Limited 7 7 3 3 7
11. Imperial General Insurance Company Limited 0 2 2 1 -9
12. Millennium Insurance Company Ltd 8 13 5 -1 6
13. NSIA Ghana Insurance Company 8 -15 -18 3 3
14. Phoenix Insurance Company 10 0 9 3 8
15. Prime Insurance Company Limited -17 -215 -4 2
16. Priority Insurance Company Limited -1 8 11 16 6
17. Provident Insurance Company Limited -7 34 13 11 9
18. Quality Insurance Company Limited 13 6 1 3 6
19. RegencyNEM Insurance Ghana Ltd 8 9 17 3 10
20. Saham Insurance Company Limited 1 2 1 1 -18
21. SIC Insurance Company Limited -6 0 -5 5 2
22. Star Assurance Company Limited 10 8 1 10 11
23. Unique Insurance Company Ltd -44 -16 -3 0 19
24. Vanguard Assurance Company Limited 6 7 1 7 8
25. Wapic Insurance (Gh.) Limited 3 -4 13 -7 -12
Reinsurers:
1. Ghana Reinsurance Company Limited 11 11 13 5 7
2. Mainstream Reinsurance Company Limited 6 7 9 5 9
3. GN Reinsurance N/A N/A 3 6 10
Companies suffixed with “*” had the 4th Quarter results used.N/A : Company was not licenced in the year of reporting.N/S : Company had not submitted report.
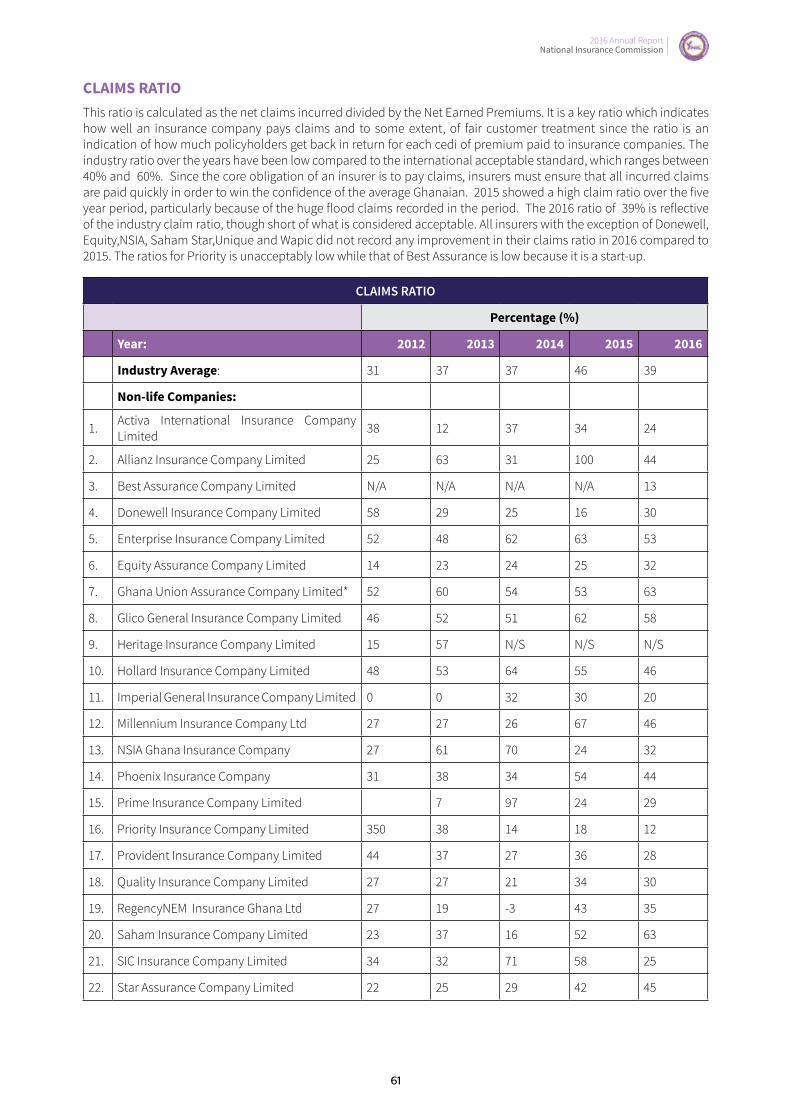
2016 Annual Report National Insurance Commission
2016 Annual Report National Insurance Commission
61
CLAIMS RATIOThis ratio is calculated as the net claims incurred divided by the Net Earned Premiums. It is a key ratio which indicates how well an insurance company pays claims and to some extent, of fair customer treatment since the ratio is an indication of how much policyholders get back in return for each cedi of premium paid to insurance companies. The industry ratio over the years have been low compared to the international acceptable standard, which ranges between 40% and 60%. Since the core obligation of an insurer is to pay claims, insurers must ensure that all incurred claims are paid quickly in order to win the confidence of the average Ghanaian. 2015 showed a high claim ratio over the five year period, particularly because of the huge flood claims recorded in the period. The 2016 ratio of 39% is reflective of the industry claim ratio, though short of what is considered acceptable. All insurers with the exception of Donewell, Equity,NSIA, Saham Star,Unique and Wapic did not record any improvement in their claims ratio in 2016 compared to 2015. The ratios for Priority is unacceptably low while that of Best Assurance is low because it is a start-up.
CLAIMS RATIO
Percentage (%)
Year: 2012 2013 2014 2015 2016
Industry Average: 31 37 37 46 39
Non-life Companies:
1. Activa International Insurance Company Limited 38 12 37 34 24
2. Allianz Insurance Company Limited 25 63 31 100 44
3. Best Assurance Company Limited N/A N/A N/A N/A 13
4. Donewell Insurance Company Limited 58 29 25 16 30
5. Enterprise Insurance Company Limited 52 48 62 63 53
6. Equity Assurance Company Limited 14 23 24 25 32
7. Ghana Union Assurance Company Limited* 52 60 54 53 63
8. Glico General Insurance Company Limited 46 52 51 62 58
9. Heritage Insurance Company Limited 15 57 N/S N/S N/S
10. Hollard Insurance Company Limited 48 53 64 55 46
11. Imperial General Insurance Company Limited 0 0 32 30 20
12. Millennium Insurance Company Ltd 27 27 26 67 46
13. NSIA Ghana Insurance Company 27 61 70 24 32
14. Phoenix Insurance Company 31 38 34 54 44
15. Prime Insurance Company Limited 7 97 24 29
16. Priority Insurance Company Limited 350 38 14 18 12
17. Provident Insurance Company Limited 44 37 27 36 28
18. Quality Insurance Company Limited 27 27 21 34 30
19. RegencyNEM Insurance Ghana Ltd 27 19 -3 43 35
20. Saham Insurance Company Limited 23 37 16 52 63
21. SIC Insurance Company Limited 34 32 71 58 25
22. Star Assurance Company Limited 22 25 29 42 45

2016 Annual Report National Insurance Commission
62
CLAIMS RATIO
Percentage (%)
Year: 2012 2013 2014 2015 2016
23. Unique Insurance Company Ltd 37 30 28 43 51
24. Vanguard Assurance Company Limited 33 35 42 58 40
25. Wapic Insurance (Gh.) Limited 32 51 15 76 81
Reinsurers:
1. Ghana Reinsurance Company Limited 20 46 56 67 30
2. Mainstream Reinsurance Company Limited 31 31 27 28 15
3. GN Reinsurance N/A N/A - 93 23
Companies suffixed with “*” had the 4th Quarter results used.N/A : Company was not licenced in the year of reporting.N/S : Company had not submitted report

2016 Annual Report National Insurance Commission
2016 Annual Report National Insurance Commission
63
TOTAL EXPENSE RATIOThe Total Expense ratio is another key indicator of profitability. It is calculated as Total Expense (Management Expense + Commission expense) as a percentage of the Net Earned Premium. The international acceptable ratio is <40%, the implication of a high ratio is that, the insurer is inefficient in discharging its insurance obligations and this is very likely to affect its ability to pay claims promptly. In 2016, the industry average worsened from 90% in 2015 to 94%. Activa, Allianz, Imperial, NSIA, Prime, Saham, SIC and Wapic all recorded ratios above 100%. Best is a start-up.
TOTAL EXPENSE RATIO
Percentage (%)
Year: 2012 2013 2014 2015 2016
Industry Average: 78 82 92 90 94
Non-life Companies:
1. Activa International Insurance Company Limited 68 95 107 117 118
2. Allianz Insurance Company Limited 124 91 139 97 114
3. Best Assurance Company Limited N/A N/A N/A N/A 138
4. Donewell Insurance Company Limited 74 78 72 64 68
5. Enterprise Insurance Company Limited 56 55 50 51 43
6. Equity Assurance Company Limited 78 68 74 78 66
7. Ghana Union Assurance Company Limited* 78 74 74 72 72
8. Glico General Insurance Company Limited 69 62 103 68 58
9. Heritage Insurance Company Limited 82 189 N/S N/S N/S
10. Hollard Insurance Company Limited 87 80 86 81 76
11. Imperial General Insurance Company Limited 160 220 136 133
12. Millennium Insurance Company Ltd 70 67 112 118 81
13. NSIA Ghana Insurance Company 70 117 115 116 144
14. Phoenix Insurance Company 66 113 88 83 97
15. Prime Insurance Company Limited 0 357 495 109 100
16. Priority Insurance Company Limited 0 137 117 91 88
17. Provident Insurance Company Limited 67 106 113 105 80
18. Quality Insurance Company Limited 67 81 83 75 76
19. RegencyNEM Insurance Ghana Ltd 68 76 92 75 71
20. Saham Insurance Company Limited 118 91 99 89 158
21. SIC Insurance Company Limited 100 100 87 79 133
22. Star Assurance Company Limited 79 83 106 88 83
23. Unique Insurance Company Ltd 132 120 91 85 68
24. Vanguard Assurance Company Limited 67 66 76 73 73
25. Wapic Insurance (Gh.) Limited 72 79 91 121 121
Reinsurers:
1. Ghana Reinsurance Company Limited 37 46 62 67 57
2. Mainstream Reinsurance Company Limited 62 60 90 64 69
3. GN Reinsurance N /A N/A 531 124 84 Companies suffixed with “*” had the 4th Quarter results used.N/A : Company was not licenced in the year of reporting.N/S : Company had not submitted report
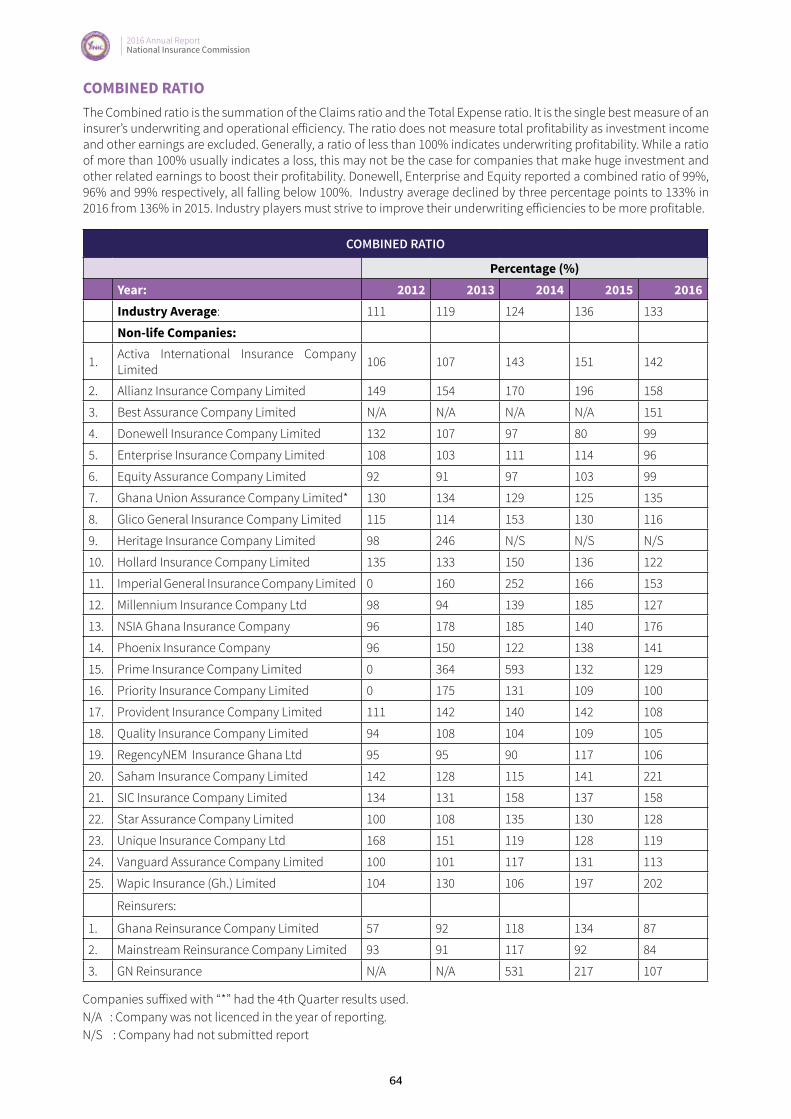
2016 Annual Report National Insurance Commission
64
COMBINED RATIOThe Combined ratio is the summation of the Claims ratio and the Total Expense ratio. It is the single best measure of an insurer’s underwriting and operational efficiency. The ratio does not measure total profitability as investment income and other earnings are excluded. Generally, a ratio of less than 100% indicates underwriting profitability. While a ratio of more than 100% usually indicates a loss, this may not be the case for companies that make huge investment and other related earnings to boost their profitability. Donewell, Enterprise and Equity reported a combined ratio of 99%, 96% and 99% respectively, all falling below 100%. Industry average declined by three percentage points to 133% in 2016 from 136% in 2015. Industry players must strive to improve their underwriting efficiencies to be more profitable.
COMBINED RATIO
Percentage (%)Year: 2012 2013 2014 2015 2016Industry Average: 111 119 124 136 133
Non-life Companies:
1. Activa International Insurance Company Limited 106 107 143 151 142
2. Allianz Insurance Company Limited 149 154 170 196 158
3. Best Assurance Company Limited N/A N/A N/A N/A 151
4. Donewell Insurance Company Limited 132 107 97 80 99
5. Enterprise Insurance Company Limited 108 103 111 114 96
6. Equity Assurance Company Limited 92 91 97 103 99
7. Ghana Union Assurance Company Limited* 130 134 129 125 135
8. Glico General Insurance Company Limited 115 114 153 130 116
9. Heritage Insurance Company Limited 98 246 N/S N/S N/S
10. Hollard Insurance Company Limited 135 133 150 136 122
11. Imperial General Insurance Company Limited 0 160 252 166 153
12. Millennium Insurance Company Ltd 98 94 139 185 127
13. NSIA Ghana Insurance Company 96 178 185 140 176
14. Phoenix Insurance Company 96 150 122 138 141
15. Prime Insurance Company Limited 0 364 593 132 129
16. Priority Insurance Company Limited 0 175 131 109 100
17. Provident Insurance Company Limited 111 142 140 142 108
18. Quality Insurance Company Limited 94 108 104 109 105
19. RegencyNEM Insurance Ghana Ltd 95 95 90 117 106
20. Saham Insurance Company Limited 142 128 115 141 221
21. SIC Insurance Company Limited 134 131 158 137 158
22. Star Assurance Company Limited 100 108 135 130 128
23. Unique Insurance Company Ltd 168 151 119 128 119
24. Vanguard Assurance Company Limited 100 101 117 131 113
25. Wapic Insurance (Gh.) Limited 104 130 106 197 202
Reinsurers:
1. Ghana Reinsurance Company Limited 57 92 118 134 87
2. Mainstream Reinsurance Company Limited 93 91 117 92 84
3. GN Reinsurance N/A N/A 531 217 107
Companies suffixed with “*” had the 4th Quarter results used.N/A : Company was not licenced in the year of reporting.N/S : Company had not submitted report

2016 Annual Report National Insurance Commission
2016 Annual Report National Insurance Commission
65
TECHNICAL RESERVE COVERThis is calculated by dividing the Technical Provisions by the liquid investments. It is an indicator of whether sufficient liquid assets are being held to cover the technical provisions, as claims should be paid as and when they fall due. Ratios above 100% mean that the companies do not have enough liquid investments backing their technical provisions. Hollard, Saham, and SIC reported ratios above 100%. GUA is too high because most of its investment are not considered as generally liquid. 2016 recorded a ratio of 64%, the best in five years. This also shows that the industry continues to improve on its liquidity and solvency position.
TECHNICAL RESERVE COVER
Percentage (%)
Year: 2012 2013 2014 2015 2016
Industry Average: 160 141 70 76 64
Non-life Companies:
1. Activa International Insurance Company Limited 147 111 104 224 90
2. Allianz Insurance Company Limited 47 195 27 207 85
3. Best Assurance Company Limited N/A N/A N/A N/A 7
4. Donewell Insurance Company Limited 220 127 92 118 59
5. Enterprise Insurance Company Limited 54 50 37 112 59
6. Equity Assurance Company Limited 105 112 91 97 52
7. Ghana Union Assurance Company Limited* 676 527 137 429 657
8. Glico General Insurance Company Limited 120 141 95 111 96
9. Heritage Insurance Company Limited 157 297 N/S N/S N/S
10. Hollard Insurance Company Limited 86 80 55 195 111
11. Imperial General Insurance Company Limited 3 38 51 60
12. Millennium Insurance Company Ltd 36 35 24 35 27
13. NSIA Ghana Insurance Company 142 205 95 79 27
14. Phoenix Insurance Company 66 97 55 52 57
15. Prime Insurance Company Limited 0 66 521 42 69
16. Priority Insurance Company Limited 0 23 15 18 61
17. Provident Insurance Company Limited 280 65 45 47 43
18. Quality Insurance Company Limited 191 209 153 128 53
19. RegencyNEM Insurance Ghana Ltd 113 90 68 88 72
20. Saham Insurance Company Limited 58 144 53 91 123
21. SIC Insurance Company Limited 198 240 97 147 101
22. Star Assurance Company Limited 152 125 36 61 68
23. Unique Insurance Company Ltd 518 311 138 43 41
24. Vanguard Assurance Company Limited 78 70 61 72 50
25. Wapic Insurance (Gh.) Limited 78 81 36 40 69
Reinsurers:
1. Ghana Reinsurance Company Limited 54 43 34 35 37
2. Mainstream Reinsurance Company Limited 331 78 69 41 42
3. GN Reinsurance N/A N/A 2 15 18
Companies suffixed with “*” had the 4th Quarter results used.N/A : Company was not licenced in the year of reporting.N/S : Company had not submitted report
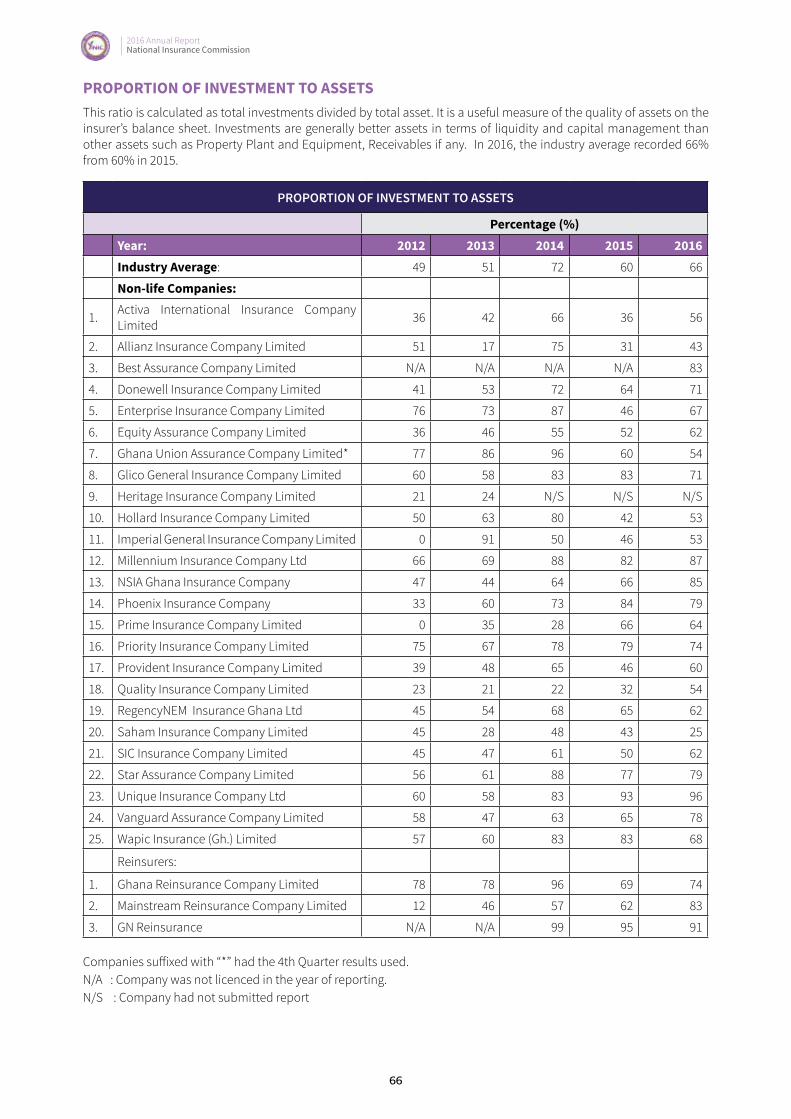
2016 Annual Report National Insurance Commission
66
PROPORTION OF INVESTMENT TO ASSETSThis ratio is calculated as total investments divided by total asset. It is a useful measure of the quality of assets on the insurer’s balance sheet. Investments are generally better assets in terms of liquidity and capital management than other assets such as Property Plant and Equipment, Receivables if any. In 2016, the industry average recorded 66% from 60% in 2015.
PROPORTION OF INVESTMENT TO ASSETS
Percentage (%)Year: 2012 2013 2014 2015 2016Industry Average: 49 51 72 60 66
Non-life Companies:
1. Activa International Insurance Company Limited 36 42 66 36 56
2. Allianz Insurance Company Limited 51 17 75 31 43
3. Best Assurance Company Limited N/A N/A N/A N/A 83
4. Donewell Insurance Company Limited 41 53 72 64 71
5. Enterprise Insurance Company Limited 76 73 87 46 67
6. Equity Assurance Company Limited 36 46 55 52 62
7. Ghana Union Assurance Company Limited* 77 86 96 60 54
8. Glico General Insurance Company Limited 60 58 83 83 71
9. Heritage Insurance Company Limited 21 24 N/S N/S N/S
10. Hollard Insurance Company Limited 50 63 80 42 53
11. Imperial General Insurance Company Limited 0 91 50 46 53
12. Millennium Insurance Company Ltd 66 69 88 82 87
13. NSIA Ghana Insurance Company 47 44 64 66 85
14. Phoenix Insurance Company 33 60 73 84 79
15. Prime Insurance Company Limited 0 35 28 66 64
16. Priority Insurance Company Limited 75 67 78 79 74
17. Provident Insurance Company Limited 39 48 65 46 60
18. Quality Insurance Company Limited 23 21 22 32 54
19. RegencyNEM Insurance Ghana Ltd 45 54 68 65 62
20. Saham Insurance Company Limited 45 28 48 43 25
21. SIC Insurance Company Limited 45 47 61 50 62
22. Star Assurance Company Limited 56 61 88 77 79
23. Unique Insurance Company Ltd 60 58 83 93 96
24. Vanguard Assurance Company Limited 58 47 63 65 78
25. Wapic Insurance (Gh.) Limited 57 60 83 83 68
Reinsurers:
1. Ghana Reinsurance Company Limited 78 78 96 69 74
2. Mainstream Reinsurance Company Limited 12 46 57 62 83
3. GN Reinsurance N/A N/A 99 95 91
Companies suffixed with “*” had the 4th Quarter results used.N/A : Company was not licenced in the year of reporting.N/S : Company had not submitted report
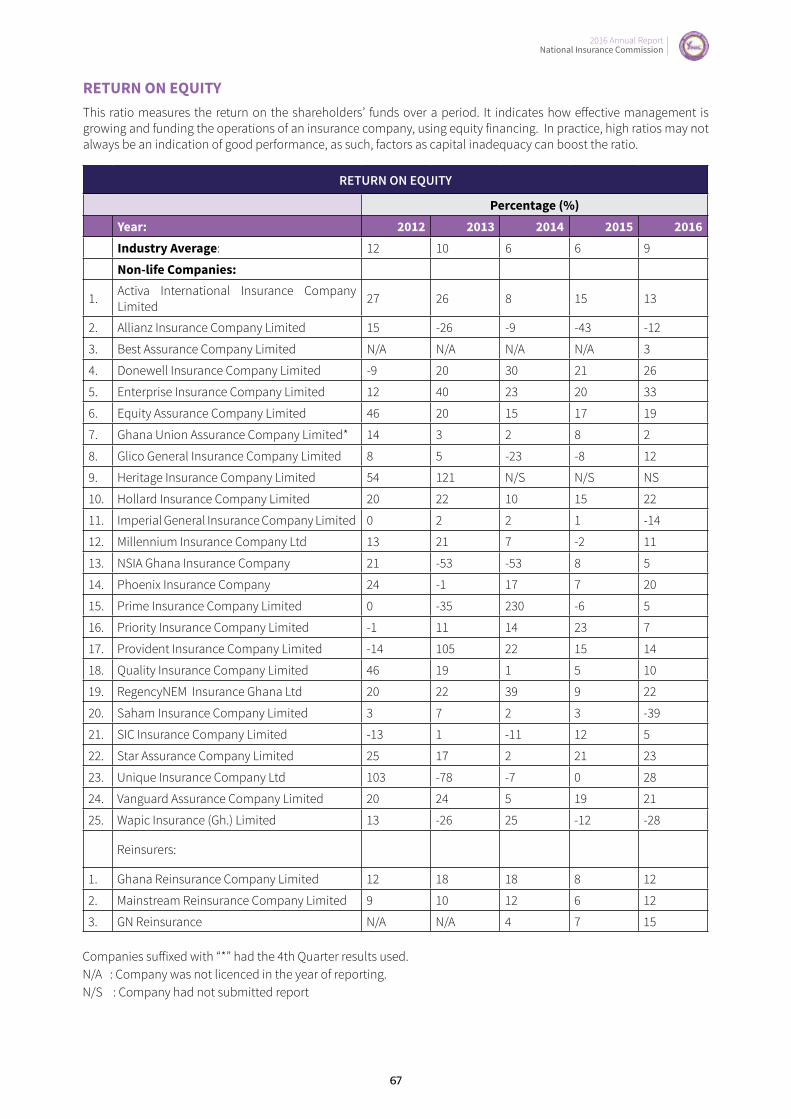
2016 Annual Report National Insurance Commission
2016 Annual Report National Insurance Commission
67
RETURN ON EQUITYThis ratio measures the return on the shareholders’ funds over a period. It indicates how effective management is growing and funding the operations of an insurance company, using equity financing. In practice, high ratios may not always be an indication of good performance, as such, factors as capital inadequacy can boost the ratio.
RETURN ON EQUITY
Percentage (%)Year: 2012 2013 2014 2015 2016Industry Average: 12 10 6 6 9
Non-life Companies:
1. Activa International Insurance Company Limited 27 26 8 15 13
2. Allianz Insurance Company Limited 15 -26 -9 -43 -12
3. Best Assurance Company Limited N/A N/A N/A N/A 3
4. Donewell Insurance Company Limited -9 20 30 21 26
5. Enterprise Insurance Company Limited 12 40 23 20 33
6. Equity Assurance Company Limited 46 20 15 17 19
7. Ghana Union Assurance Company Limited* 14 3 2 8 2
8. Glico General Insurance Company Limited 8 5 -23 -8 12
9. Heritage Insurance Company Limited 54 121 N/S N/S NS
10. Hollard Insurance Company Limited 20 22 10 15 22
11. Imperial General Insurance Company Limited 0 2 2 1 -14
12. Millennium Insurance Company Ltd 13 21 7 -2 11
13. NSIA Ghana Insurance Company 21 -53 -53 8 5
14. Phoenix Insurance Company 24 -1 17 7 20
15. Prime Insurance Company Limited 0 -35 230 -6 5
16. Priority Insurance Company Limited -1 11 14 23 7
17. Provident Insurance Company Limited -14 105 22 15 14
18. Quality Insurance Company Limited 46 19 1 5 10
19. RegencyNEM Insurance Ghana Ltd 20 22 39 9 22
20. Saham Insurance Company Limited 3 7 2 3 -39
21. SIC Insurance Company Limited -13 1 -11 12 5
22. Star Assurance Company Limited 25 17 2 21 23
23. Unique Insurance Company Ltd 103 -78 -7 0 28
24. Vanguard Assurance Company Limited 20 24 5 19 21
25. Wapic Insurance (Gh.) Limited 13 -26 25 -12 -28
Reinsurers:
1. Ghana Reinsurance Company Limited 12 18 18 8 12
2. Mainstream Reinsurance Company Limited 9 10 12 6 12
3. GN Reinsurance N/A N/A 4 7 15
Companies suffixed with “*” had the 4th Quarter results used.N/A : Company was not licenced in the year of reporting.N/S : Company had not submitted report
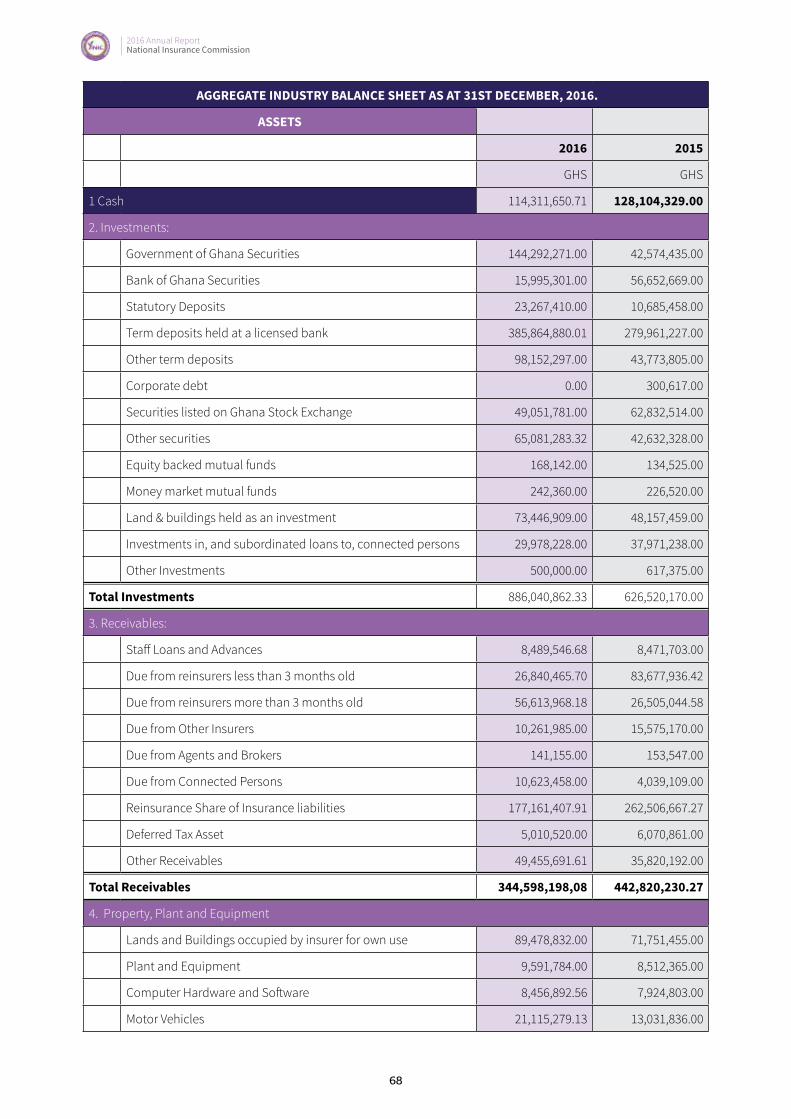
2016 Annual Report National Insurance Commission
68
AGGREGATE INDUSTRY BALANCE SHEET AS AT 31ST DECEMBER, 2016.
ASSETS
2016 2015
GHS GHS
1 Cash 114,311,650.71 128,104,329.00
2. Investments:
Government of Ghana Securities 144,292,271.00 42,574,435.00
Bank of Ghana Securities 15,995,301.00 56,652,669.00
Statutory Deposits 23,267,410.00 10,685,458.00
Term deposits held at a licensed bank 385,864,880.01 279,961,227.00
Other term deposits 98,152,297.00 43,773,805.00
Corporate debt 0.00 300,617.00
Securities listed on Ghana Stock Exchange 49,051,781.00 62,832,514.00
Other securities 65,081,283.32 42,632,328.00
Equity backed mutual funds 168,142.00 134,525.00
Money market mutual funds 242,360.00 226,520.00
Land & buildings held as an investment 73,446,909.00 48,157,459.00
Investments in, and subordinated loans to, connected persons 29,978,228.00 37,971,238.00
Other Investments 500,000.00 617,375.00
Total Investments 886,040,862.33 626,520,170.00
3. Receivables:
Staff Loans and Advances 8,489,546.68 8,471,703.00
Due from reinsurers less than 3 months old 26,840,465.70 83,677,936.42
Due from reinsurers more than 3 months old 56,613,968.18 26,505,044.58
Due from Other Insurers 10,261,985.00 15,575,170.00
Due from Agents and Brokers 141,155.00 153,547.00
Due from Connected Persons 10,623,458.00 4,039,109.00
Reinsurance Share of Insurance liabilities 177,161,407.91 262,506,667.27
Deferred Tax Asset 5,010,520.00 6,070,861.00
Other Receivables 49,455,691.61 35,820,192.00
Total Receivables 344,598,198,08 442,820,230.27
4. Property, Plant and Equipment
Lands and Buildings occupied by insurer for own use 89,478,832.00 71,751,455.00
Plant and Equipment 9,591,784.00 8,512,365.00
Computer Hardware and Software 8,456,892.56 7,924,803.00
Motor Vehicles 21,115,279.13 13,031,836.00
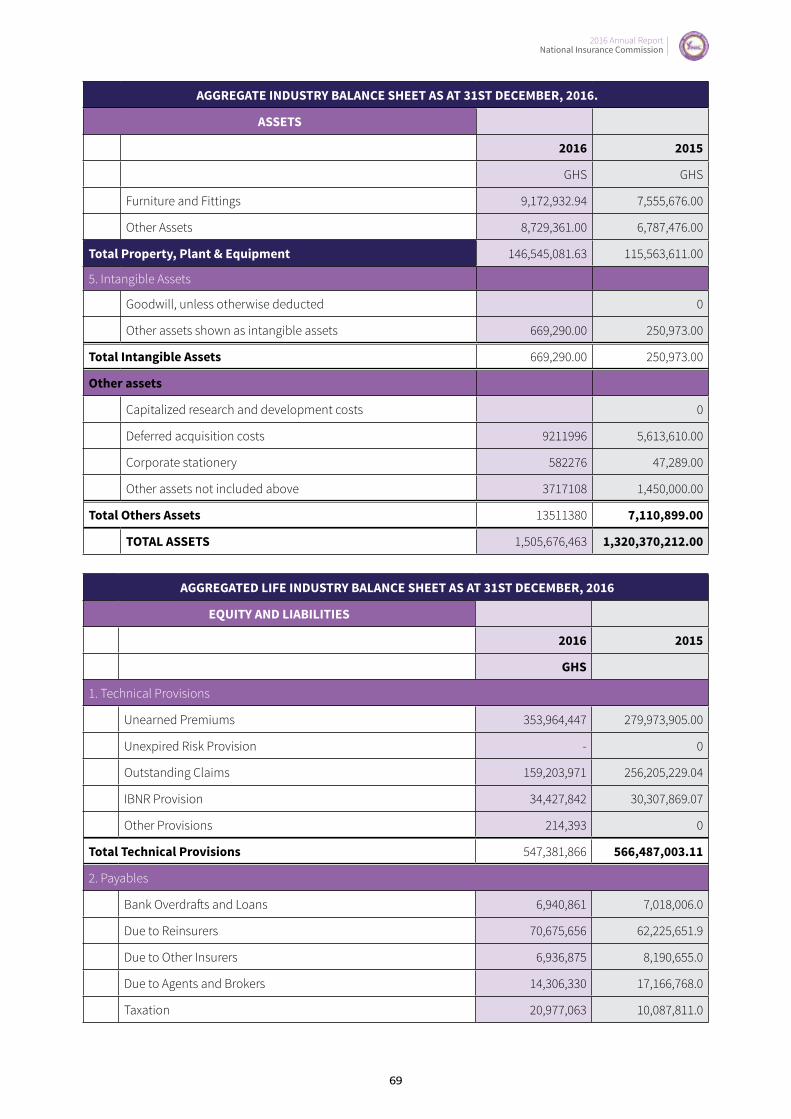
2016 Annual Report National Insurance Commission
2016 Annual Report National Insurance Commission
69
AGGREGATE INDUSTRY BALANCE SHEET AS AT 31ST DECEMBER, 2016.
ASSETS
2016 2015
GHS GHS
Furniture and Fittings 9,172,932.94 7,555,676.00
Other Assets 8,729,361.00 6,787,476.00
Total Property, Plant & Equipment 146,545,081.63 115,563,611.00
5. Intangible Assets
Goodwill, unless otherwise deducted 0
Other assets shown as intangible assets 669,290.00 250,973.00
Total Intangible Assets 669,290.00 250,973.00
Other assets
Capitalized research and development costs 0
Deferred acquisition costs 9211996 5,613,610.00
Corporate stationery 582276 47,289.00
Other assets not included above 3717108 1,450,000.00
Total Others Assets 13511380 7,110,899.00
TOTAL ASSETS 1,505,676,463 1,320,370,212.00
AGGREGATED LIFE INDUSTRY BALANCE SHEET AS AT 31ST DECEMBER, 2016
EQUITY AND LIABILITIES
2016 2015
GHS
1. Technical Provisions
Unearned Premiums 353,964,447 279,973,905.00
Unexpired Risk Provision - 0
Outstanding Claims 159,203,971 256,205,229.04
IBNR Provision 34,427,842 30,307,869.07
Other Provisions 214,393 0
Total Technical Provisions 547,381,866 566,487,003.11
2. Payables
Bank Overdrafts and Loans 6,940,861 7,018,006.0
Due to Reinsurers 70,675,656 62,225,651.9
Due to Other Insurers 6,936,875 8,190,655.0
Due to Agents and Brokers 14,306,330 17,166,768.0
Taxation 20,977,063 10,087,811.0

2016 Annual Report National Insurance Commission
70
AGGREGATED LIFE INDUSTRY BALANCE SHEET AS AT 31ST DECEMBER, 2016
EQUITY AND LIABILITIES
Deferred Tax 15,005,778 10,133,732.0
Due to Related Parties 9,807,927 12,719,946.0
Other Accruals & Payables 91,822,637 67,966,095.0
Total Payables 236,473,127 195,508,664.9
3. Long Term Liabilities
Bank Loans - 14,881
Debentures 11,812,416 13,454,193
Unsecured Subordinated Debts -
Perpetual - -
More than 4 years to maturity - -
More than 3 but 4 years or less to maturity - -
More than 2 but 3 years or less to maturity - -
More than 1 but 2 years or less to maturity - -
Other Borrowings 5,829,453 49,647
Total Long -Term Liabilities 17,641,869 13,518,721
4. EQUITY
Paid up ordinary shares 389,525,994 274,052,673
Ordinary shares held as treasury shares - 0
Paid up perpetual non-cumulative preference shares - 0
Paid up perpetual non-cumulative preference shares held as treasury shares - 0
Paid up perpetual cumulative preference shares 9,313,328 3,591,290
Paid up perpetual cumulative preference shares held as treasury shares - 0
Contingency Reserves 147,375,195 124,433,586
Revaluation reserve (owned land & buildings) 73,084,269 59,072,908
Revaluation reserve (investments - excluding items to be deducted from core 16,562,917 43,290,260
Revaluation reserve (other) -1,249,346 1,451,740
Other reserves (please specify) -560,857 -8,041,090
Retained earnings, as at end of previous financial year 31,303,503 -2,138,469
Current year net earnings/deficit 38,497,064 39,274,184
Others (please specify) 327,535 9,868,740
Total Equity 704,179,602 544,855,822
TOTAL LIABILITIES AND EQUITY 1,505,676,463 1,320,370,212
2016 Annual Report National Insurance Commission
2016 Annual Report National Insurance Commission
71
APPENDICES1. 2016 NIC Financial Reports
2. 2016 Fire Maintenance Fund Financial Reports
3. List of Registered Insurance Companies
4. List of Registered Reinsurance Companies
5. List of Registered Broking Companies

2016 Annual Report National Insurance Commission
72
NATIONAL INSURANCE COMMISSIONFINANCIAL STATEMENTS FOR THE YEAR ENDED 31ST DECEMBER, 2016
Report of the DirectorsThe Directors submit their report together with the audited Financial Statements of the National Insurance Commission (the Commission) for the year ended 31st December, 2016.
Statement of Directors’ ResponsibilitiesThe Directors are responsible for the preparation of the Financial Statements for each financial year which give a true and fair view of the state of affairs of the Commission and of the operating performance and Cash Flows for that period. In preparing these Financial Statements, the Directors have selected suitable accounting policies and then applied them consistently, made judgments and estimates that are reasonable and prudent and followed the Ghana National Accounting Reporting Standards.
The Directors are responsible for ensuring that the Commission keeps proper accounting records that disclose with reasonable accuracy at any time the financial position of the Commission. The Directors are also responsible for safeguarding the assets of the Commission and taking reasonable steps for the prevention and detection of fraud and other irregularities.
Principal Activities The object of the Commission is to ensure effective administration, supervision, regulation, monitoring and control of the business of insurance to protect insurance policy holders and the insurance industry in Ghana other than health insurance under the National Health Insurance Act, 2003 (Act 650).
Financial Results (Highlights)The Financial results of the Commission are as summarized below:
2016 2015
(GHS) (GHS)
Excess of Income over Expenditure 5,745,343 3,089,930
Total Assets 34,544,357 29,156,242
Accumulated Fund 15,515,137 9,769,794
By order of the Board
Dated June 20, 2017
……………………………………….
DIRECTOR
……………………………………….
DIRECTOR
2016 Annual Report National Insurance Commission
2016 Annual Report National Insurance Commission
73
NATIONAL INSURANCE COMMISSIONIndependent Auditor’s Report to the Honourable Minister of Finance
OpinionWe have audited the financial statements of the NIC which comprise the statement of financial position as at 31 December, 2016 Income and Expenditure Accounts and cash flow statement for the year then ended, and notes to the financial statements, including a summary of significant accounting policies and other explanatory notes as set out on pages 8 to 10.
In our opinion, the accompanying financial statements give a true and fair view of the financial position of the Fund as at 31 December, 2016 and of its financial performance and its cash flows for the year then ended in accordance with Ghana National Accounting Standards and in the manner required by the Insurance Act 2006 (Act 724).
Basis for Opinion We conducted our audit in accordance with International Standards on Auditing (ISAs). Our responsibilities under those standards are further described in the Auditor’s Responsibilities for the Audit of the Financial Statements section of our report. We are independent of the Fund in accordance with the International Ethics Standards Board for Accountants’ Code of Ethics for Professional Accountants (IESBA Code), and we have fulfilled our other ethical responsibilities in accordance with the IESBA Code. We believe that the audit evidence we have obtained is sufficient and appropriate to provide a basis for our opinion.
Responsibilities of the Board of Directors for the Financial StatementsThe Board of Directors are responsible for the preparation of the financial statements in accordance with Ghana National Accounting Standards and in the manner required by the Insurance Act 2006 (Act 724) and for such internal control as the Board of Directors determines is necessary to enable the preparation of financial statements that are free from material misstatement, whether due to fraud or error.
In preparing the financial statements, the Board of Directors are responsible for assessing the Fund’s ability to continue as a going concern, disclosing, as applicable, matters related to going concern and using the going concern basis of accounting unless the Board of
Directors either intends to liquidate the Fund or to cease operations, or has no realistic alternative but to do so. The Board of Directors are responsible for overseeing the Fund’s financial reporting process.
Auditor’s responsibilityOur objectives are to obtain reasonable assurance about whether the financial statements as a whole are free from material misstatement, whether due to fraud or error, and to issue an auditor’s report that includes our opinion. Reasonable assurance is a high level of assurance, but is not a guarantee that an audit conducted in accordance with ISAs will always detect a material misstatement when it exists. Misstatements can arise from fraud or error and are considered material if individually or in the aggregate, they could reasonably be expected to influence the economic decision of users taken on the basis of these financial statements.
As part of an audit in accordance with ISAs, we exercise professional judgement and maintain professional skepticism throughout the audit. We also;
■ Identify and assess the risks of material misstatement of the financial statements, whether due to fraud or error, design and perform audit procedures responsive to those risks, and obtain audit evidence that is sufficient and appropriate to provide a basis for our opinion.
■ The risk of not detecting a material misstatement resulting from fraud is higher than for one resulting from error, as fraud may involve collusion, forgery, intentional omissions, misrepresentations, or the override of internal control.
■ Evaluate the appropriateness of policies used and the reasonableness of accounting estimates and related disclosures made by the Board of Directors.
■ Conclude on the appropriateness of the Board of Director’s use of the going concern basis of accounting and, based on the audit evidence obtained, whether a material uncertainty exists related to events or conditions that may cast significant doubt on the Fund’s ability to continue as a going concern. If we conclude that a material uncertainty exists, we are required to draw attention in our auditor’s report to the related disclosures in the financial statements or, if such

2016 Annual Report National Insurance Commission
74
disclosures are inadequate, to modify our opinion. Our conclusions are based on the audit evidence obtained up to the date of our auditor’s report. However, future events or conditions may cause the Fund to cease to continue as a going concern.
■ Evaluate the overall presentation, structure and content of the financial statements, including the disclosures, and whether the financial statements represent the underlying transactions and events in a manner that achieves fair presentation.
We communicate with the Board of Directors regarding, among other matters, the planned scope and timing of the audit and significant audit findings, including any significant deficiencies in internal control that we identify during our audit.
The engagement Partner on the audit resulting in this independent auditor’s report is Emmanuel Offei – ICAG/P/1102.
For: Boateng, Offei & Co. – [ICAG/F/2017/108]
Chartered Accountants
Correspondent firm; Grant Thornton International
9 Bissau Avenue, East Legon
Accra-Ghana
June 20, 2017
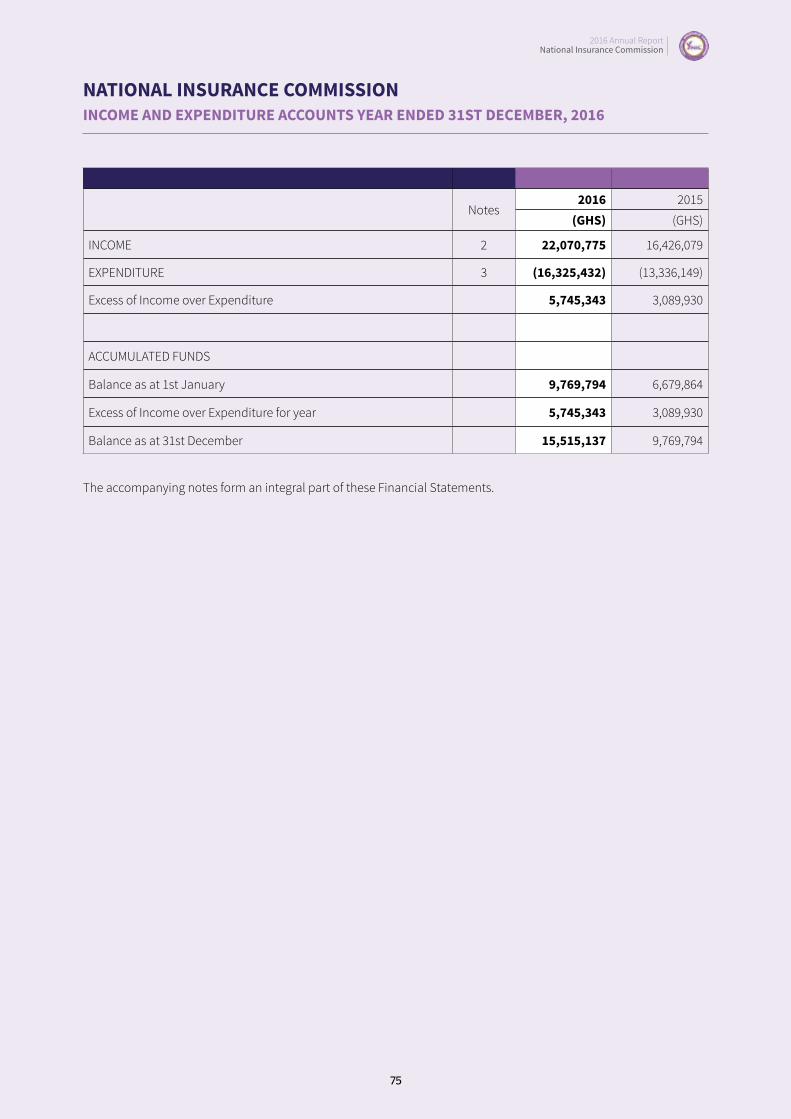
2016 Annual Report National Insurance Commission
2016 Annual Report National Insurance Commission
75
NATIONAL INSURANCE COMMISSIONINCOME AND EXPENDITURE ACCOUNTS YEAR ENDED 31ST DECEMBER, 2016
Notes2016 2015
(GHS) (GHS)
INCOME 2 22,070,775 16,426,079
EXPENDITURE 3 (16,325,432) (13,336,149)
Excess of Income over Expenditure 5,745,343 3,089,930
ACCUMULATED FUNDS
Balance as at 1st January 9,769,794 6,679,864
Excess of Income over Expenditure for year 5,745,343 3,089,930
Balance as at 31st December 15,515,137 9,769,794
The accompanying notes form an integral part of these Financial Statements.

2016 Annual Report National Insurance Commission
76
NATIONAL INSURANCE COMMISSIONSTATEMENT OF FINANCIAL POSITION AS AT 31ST DECEMBER, 2016
2016 2015
Notes (GHS) (GHS)
Non-Current AssetsProperty, Plant & Equipment 4a 17,732,302 18,445,455
Equity Shares 5 40,000 40,000
17,772,302 18,485,455
Long Term Security 6 1,727,605 1,520,000
Current AssetsAccounts Receivable 7 2,839,230 2,138,313
Short Term Investments 8 6,796,711 4,078,590
Cash & Bank Balances 9 5,408,509 2,933,884
15,044,450 9,150,787
Total Assets 34,544,357 29,156,242
Accumulated Fund and Deferred GrantAccumulated fund 15,515,137 9,769,794
Revaluation Reserve 4b 17,111,280 17,111,280
Deferred Grant 10b 249,449 274,884
32,875,866 27,155,958
Current Liabilities Accounts Payable and Accounts 11 1,668,491 2,000,284
Total Liabilities, Accumulated Fund & Grant 34,544,357 29,156,242
The Financial Statements on pages 75 to 85 were approved by the Board of Directors on June 20, 2017 and were signed on its behalf by:
……………………………………….
DIRECTOR
……………………………………….
DIRECTOR
The accompanying notes form an integral part of these Financial Statements.

2016 Annual Report National Insurance Commission
2016 Annual Report National Insurance Commission
77
NATIONAL INSURANCE COMMISSIONCASHFLOW STATEMENT FOR THE YEAR ENDED 31ST DECEMBER, 2016
2016 2015
Notes (GHS) (GHS)
Operating ActivitiesCash Generated from Operations 13 3,619,762 4,241,187Interest Received 421,080 164,449
Net Cash Generated from Operating Activities 4,040,842 4,405,636
Cash flow from Investing ActivitiesPurchase of Property, Plant and Equipment (401,820) (925,704)
Proceed from the Sale of Assets 2,771 5,450
Purchase of Investment (2,925,726) (2,840,395)
Investment Income Received 1,758,558 1,020,344
Net Cash used Investing Activities (1,566,217) (2,740,305)
Net increase/(decrease) in Cash and Cash Equivalents 2,474,625 1,665,331
Movement in Cash and Cash EquivalentsCash and Cash Equivalents at the beginning of the year 2,933,884 1,268,553
Increase/(Decrease) in Cash and Cash Equivalents 2,474,625 1,665,331
Cash and Cash Equivalents at the end of the year 5,408,509 2,933,884
The accompanying notes form an integral part of these Financial Statements.
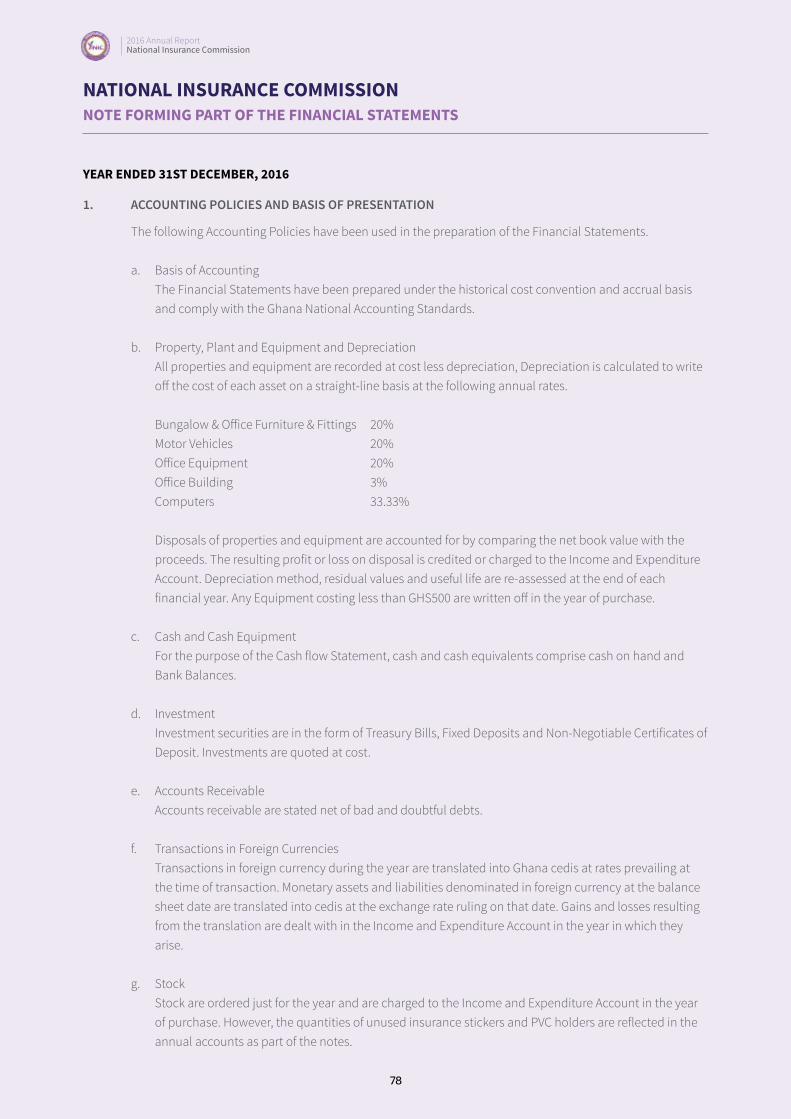
2016 Annual Report National Insurance Commission
78
NATIONAL INSURANCE COMMISSIONNOTE FORMING PART OF THE FINANCIAL STATEMENTS
YEAR ENDED 31ST DECEMBER, 2016
1. ACCOUNTING POLICIES AND BASIS OF PRESENTATION
The following Accounting Policies have been used in the preparation of the Financial Statements. a. Basis of Accounting
The Financial Statements have been prepared under the historical cost convention and accrual basis and comply with the Ghana National Accounting Standards.
b. Property, Plant and Equipment and DepreciationAll properties and equipment are recorded at cost less depreciation, Depreciation is calculated to write off the cost of each asset on a straight-line basis at the following annual rates.
Bungalow & Office Furniture & Fittings 20%Motor Vehicles 20%Office Equipment 20%Office Building 3%Computers 33.33%
Disposals of properties and equipment are accounted for by comparing the net book value with the proceeds. The resulting profit or loss on disposal is credited or charged to the Income and Expenditure Account. Depreciation method, residual values and useful life are re-assessed at the end of each financial year. Any Equipment costing less than GHS500 are written off in the year of purchase.
c. Cash and Cash Equipment For the purpose of the Cash flow Statement, cash and cash equivalents comprise cash on hand and Bank Balances.
d. Investment Investment securities are in the form of Treasury Bills, Fixed Deposits and Non-Negotiable Certificates of Deposit. Investments are quoted at cost.
e. Accounts ReceivableAccounts receivable are stated net of bad and doubtful debts.
f. Transactions in Foreign Currencies
Transactions in foreign currency during the year are translated into Ghana cedis at rates prevailing at the time of transaction. Monetary assets and liabilities denominated in foreign currency at the balance sheet date are translated into cedis at the exchange rate ruling on that date. Gains and losses resulting from the translation are dealt with in the Income and Expenditure Account in the year in which they arise.
g. Stock Stock are ordered just for the year and are charged to the Income and Expenditure Account in the year of purchase. However, the quantities of unused insurance stickers and PVC holders are reflected in the annual accounts as part of the notes.

2016 Annual Report National Insurance Commission
2016 Annual Report National Insurance Commission
79
NATIONAL INSURANCE COMMISSIONNOTES TO THE FINANCIAL STATEMENTS FOR THE YEAR ENDED 31 DECEMBER 2016
2. INCOME
This is made up as follows:
Notes2016 2013
(GHS) (GHS)
Levies on Life Insurers 2,685,025 2,082,335
Levies on Non-Life Insurers 5,982,605 4,771,200
Levies on Reinsurance 1,044,700 785,500
Levies on Brokers 579,866 448,616
Licensing/Renewal Income 1,214,680 1,193,864
Investment Income 1,758,558 1,020,344
Interest Received 2a 421,080 164,449
Motor Contribution 5,045,639 2,498,677
Sale of Fire Certificates 16,350 60,627
Grant Income 9a
Deferred Grant Income 9b 25,435 25,435
Rent Income/Fees - IITC 78,670 92,240
Mega Risk Income 2,230,961 2,902,062
Penalties 594,623 201,490
Exchange Gains 199,581 73,926
Training Fees 75,813 54,077
Other Income 2b
117,189
51,237
22,070,775 16,426,079
2a. Interest Received:
2016 2015(GHS) (GHS)
Call Accounts 420,875 163,526
Current Accounts 205 923
421,080 164,449

2016 Annual Report National Insurance Commission
80
2b. Other Income:
Notes2016 2015
(GHS) (GHS)
Year Book Sales 22,894 12,666
Interest on Loans 18,207 27,943
Gains on Sales of Assets 14 2,646
Insurance Claims 1,473 9,426
Others 2c 71,969 1,202
117,189 51,237
2c. This represents refund of utilities from tenants of the Commission
3. EXPENDITUREExpenditure is made up as follows:
Notes2016 2015
(GHS) (GHS)
Training/workshop/conferences/seminars 748,453 843,230
Directors’ Emoluments 1,548,012 767,615
Electricity & Water 333,163 218,715
General office expenses 1,262,473 1,169,753
Medical Expenses 94,316 122,263
Public Education 72,678 58,404
Repairs & Maintenance 241,509 388,682
Staff Cost 8,740,115 6,793,384
Staff Terminal Benefit Cost 1,046,020 745,645
Sticker & Adhesive Cost 229,848 232,832
Vehicle Running Cost 483,943 419,086
Telephone 75,036 88,092
Audit fees 23,500 17,500
25th Anniversary/Rebranding - 119,635
Depreciation 1,114,848 1,101,905
Insurance Premium 146,508 110,320
Internet Services/Subscription 71,353 58,546
Loss on Disposal of Assets - 1,950
Security services 93,657 78,592
16,325,432 13,336,149
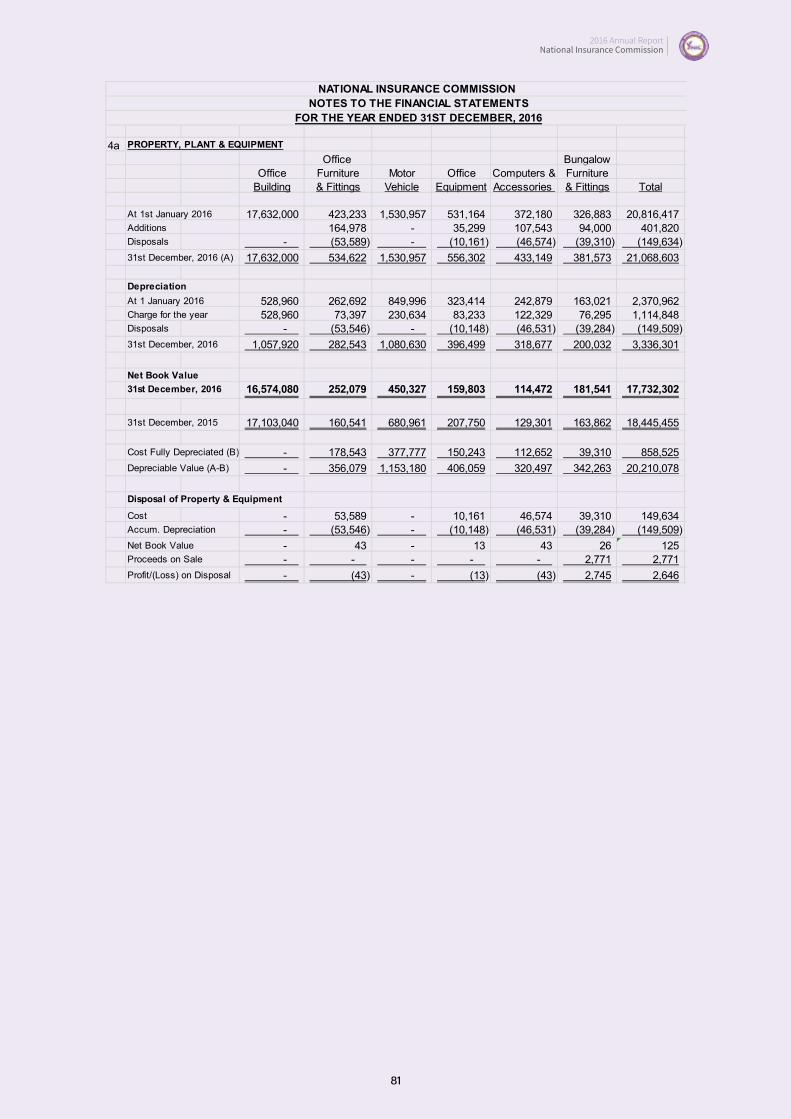
2016 Annual Report National Insurance Commission
2016 Annual Report National Insurance Commission
81
4a PROPERTY, PLANT & EQUIPMENT
Office BungalowOffice Furniture Motor Office Computers & Furniture
Building & Fittings Vehicle Equipment Accessories & Fittings Total
At 1st January 2016 17,632,000 423,233 1,530,957 531,164 372,180 326,883 20,816,417 Additions 164,978 - 35,299 107,543 94,000 401,820 Disposals - (53,589) - (10,161) (46,574) (39,310) (149,634) 31st December, 2016 (A) 17,632,000 534,622 1,530,957 556,302 433,149 381,573 21,068,603
Depreciation
At 1 January 2016 528,960 262,692 849,996 323,414 242,879 163,021 2,370,962 Charge for the year 528,960 73,397 230,634 83,233 122,329 76,295 1,114,848 Disposals - (53,546) - (10,148) (46,531) (39,284) (149,509) 31st December, 2016 1,057,920 282,543 1,080,630 396,499 318,677 200,032 3,336,301
Net Book Value
31st December, 2016 16,574,080 252,079 450,327 159,803 114,472 181,541 17,732,302
31st December, 2015 17,103,040 160,541 680,961 207,750 129,301 163,862 18,445,455
Cost Fully Depreciated (B) - 178,543 377,777 150,243 112,652 39,310 858,525 Depreciable Value (A-B) - 356,079 1,153,180 406,059 320,497 342,263 20,210,078
Disposal of Property & Equipment
Cost - 53,589 - 10,161 46,574 39,310 149,634 Accum. Depreciation - (53,546) - (10,148) (46,531) (39,284) (149,509) Net Book Value - 43 - 13 43 26 125 Proceeds on Sale - - - - - 2,771 2,771 Profit/(Loss) on Disposal - (43) - (13) (43) 2,745 2,646
NATIONAL INSURANCE COMMISSION NOTES TO THE FINANCIAL STATEMENTS
FOR THE YEAR ENDED 31ST DECEMBER, 2016

2016 Annual Report National Insurance Commission
82
4b. REVALUATION RESERVE
This represent surplus arising on the revaluation of the Commission’s property, plant and equipment
5. EQUITY SHARES – GHS40,000This represents 40% National Insurance Commission’s shareholding in the Ghana Insurance College (GIC). The book value of the investment on their balance sheet is GHS882,930 as at 31/12/2015.
6. LONG-TERM SECURITIESLong-Term Securities are Eurobonds held-to-maturity with a coupon of 8.5% maturing in 2017
7. ACCOUNTS RECEIVABLE AND PREPAYMENTS
2016 2015
(GHS) (GHS)
Levies Due from Insurers and Brokers 1,078,837 594,010
West African Insurance Institute 155,083 20,318
IITC Debtors 75,679 59,140
Staff Advances 506,906 627,569
Sundry Debtors 85,735 138,400
Accrued Investment Income 631,882 325,921
Prepaid Insurance Expense 109,775 91,612
Penalties Receivable 185,290 186,200
Rent Prepaid 10,043 95,143
2,839,230 2,138,313
8. SHORT TERM INVESTMENTS
2016 2015
(GHS) (GHS)
Treasury Bills 5,153,196 2,785,800
Fixed Deposits 1,643,515 1,292,790
6,796,711 4,078,590
Balance as at 1st January 4,078,590 2,758,195
Additions 2,718,121 1,588,852
6,796,711 4,347,047
Withdrawal (268,457)
Balance as at 31st December 6,796,711 4,078,590
Net Movement in Investments 2,718,121 1,320,395

2016 Annual Report National Insurance Commission
2016 Annual Report National Insurance Commission
83
9. CASH AND CASH EQUIVALENT
2016 2015
(GHS) (GHS)
Cash 40,937 37,305
Bank 5,367,572 2,896,579
5,408,509 2,933,884
10 a. GRANTS Grant income represents EMCB/FINSSP Grants received from the World Bank and Government of Ghana through the Ministry of Finance & Economic Planning for capacity building
2016 2015
(GHS) (GHS)
Grants Received
b. DEFERRED GRANTS
Deferred Grant Income represents grants for the construction and furnishing of the Insurance Industry Training Centre (IITC) building, which is being written-off over their respective depreciable life.
2016 2015
(GHS) (GHS)
Balance at 1st January 274,884 300,319
Transfer to Income and Expenditure Account (25,435) (25,435)
Balance at 31st December 249,449 274,884
11. ACCOUNTS PAYABLE AND ACCRUALSThis is made up as follows:
Notes2016 2015
(GHS) (GHS)
Accrued Expenses 12 209,671 448,795
West Africa Insurance Institute
Compensation Fund 141,616 189,860
Client Rescue Fund Payable
Fire Maintenance Fund Payable 58,076 38,171
Motor Contributions Payable 868,818 478,369
Fire Certificate Payable
PAYE Payable 189,914 94,558
SSF Payable 55,826 44,689
Occupational Pension Scheme Payable 15 113,441 684,335

2016 Annual Report National Insurance Commission
84
Notes2016 2015
(GHS) (GHS)
VAT Payable 1,050
Withholding Tax Payable 15,164 8,988
Sundry Creditors 14,915 12,519
1,668,491 2,00,284
12. ACCRUED EXPENSES
2016 2015
(GHS) (GHS)
Audit Fees 23,500 17,500
Consultancy - 172,966
Medicals 80 17,368
Repairs and Maintenance 23,513 86,010
Insurance Stickers 34,820 34,820
Telephone 13,771 15,793
Water & Electricity 40,639 39,135
Others 73,348 65,203
209,671 448,795
13. Reconciliation of excess of Income over Expenditure to Cash flow from Operating Activities
2016 2015
(GHS) (GHS)
Excess of Income over Expenditure 5,745,343 3,089,930
Amortization of Capital Grant (25,435) (25,435)
Depreciation 1,114,848 1,101,906
(Gain)/Loss on Disposal of Property & Equipment (2,646) 1,950
Interest Income (421,080) (164,449)
Investment Income (1,758,558) (1,020,344)
(Increase)/Decrease in Accounts Receivable and Prepayment (700,917) 135,361
Increase/(Decrease) in Accounts Payable and Accruals (331,793 1,122,268
Cash Generated from Operating Activities 3,619,762 4,241,187
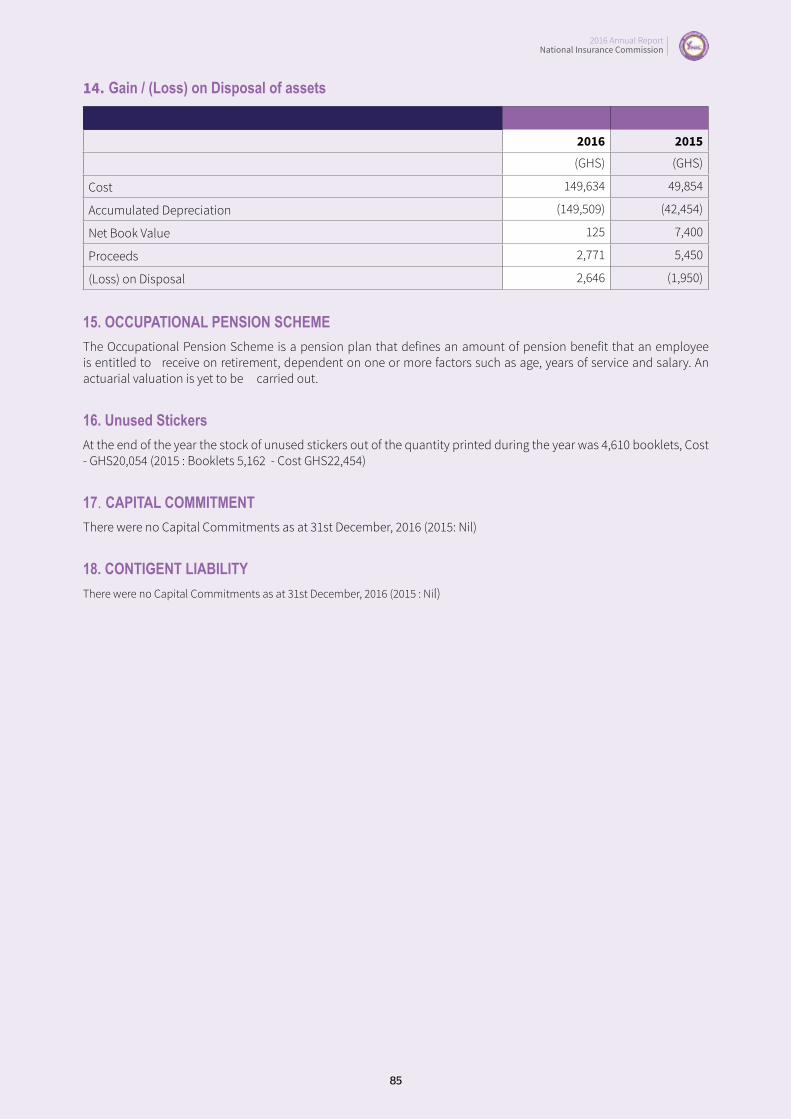
2016 Annual Report National Insurance Commission
2016 Annual Report National Insurance Commission
85
14. Gain / (Loss) on Disposal of assets
2016 2015(GHS) (GHS)
Cost 149,634 49,854
Accumulated Depreciation (149,509) (42,454)
Net Book Value 125 7,400
Proceeds 2,771 5,450
(Loss) on Disposal 2,646 (1,950)
15. OCCUPATIONAL PENSION SCHEMEThe Occupational Pension Scheme is a pension plan that defines an amount of pension benefit that an employee is entitled to receive on retirement, dependent on one or more factors such as age, years of service and salary. An actuarial valuation is yet to be carried out.
16. Unused StickersAt the end of the year the stock of unused stickers out of the quantity printed during the year was 4,610 booklets, Cost - GHS20,054 (2015 : Booklets 5,162 - Cost GHS22,454)
17. CAPITAL COMMITMENTThere were no Capital Commitments as at 31st December, 2016 (2015: Nil)
18. CONTIGENT LIABILITYThere were no Capital Commitments as at 31st December, 2016 (2015 : Nil)
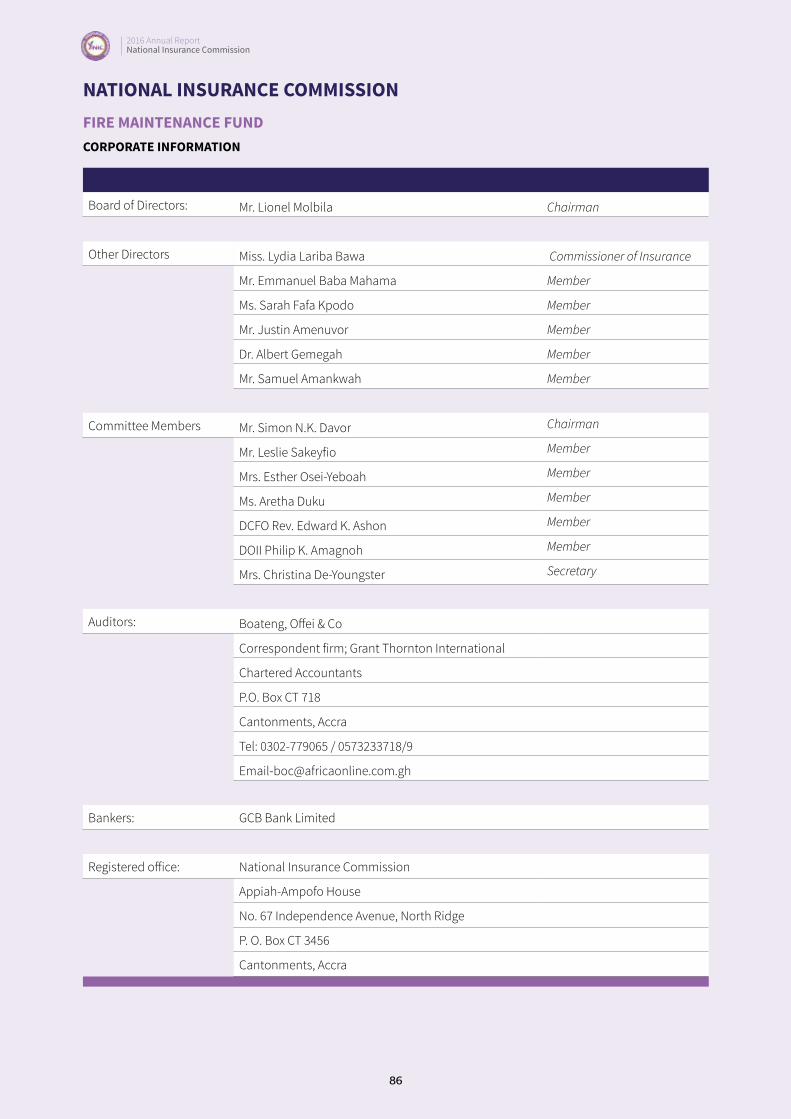
2016 Annual Report National Insurance Commission
86
NATIONAL INSURANCE COMMISSIONFIRE MAINTENANCE FUNDCORPORATE INFORMATION
Board of Directors: Mr. Lionel Molbila Chairman
Other Directors Miss. Lydia Lariba Bawa Commissioner of Insurance
Mr. Emmanuel Baba Mahama Member
Ms. Sarah Fafa Kpodo Member
Mr. Justin Amenuvor Member
Dr. Albert Gemegah Member
Mr. Samuel Amankwah Member
Committee Members Mr. Simon N.K. Davor Chairman
Mr. Leslie Sakeyfio Member
Mrs. Esther Osei-Yeboah Member
Ms. Aretha Duku Member
DCFO Rev. Edward K. Ashon Member
DOII Philip K. Amagnoh Member
Mrs. Christina De-Youngster Secretary
Auditors: Boateng, Offei & Co
Correspondent firm; Grant Thornton International
Chartered Accountants
P.O. Box CT 718
Cantonments, Accra
Tel: 0302-779065 / 0573233718/9
Bankers: GCB Bank Limited
Registered office: National Insurance Commission
Appiah-Ampofo House
No. 67 Independence Avenue, North Ridge
P. O. Box CT 3456
Cantonments, Accra
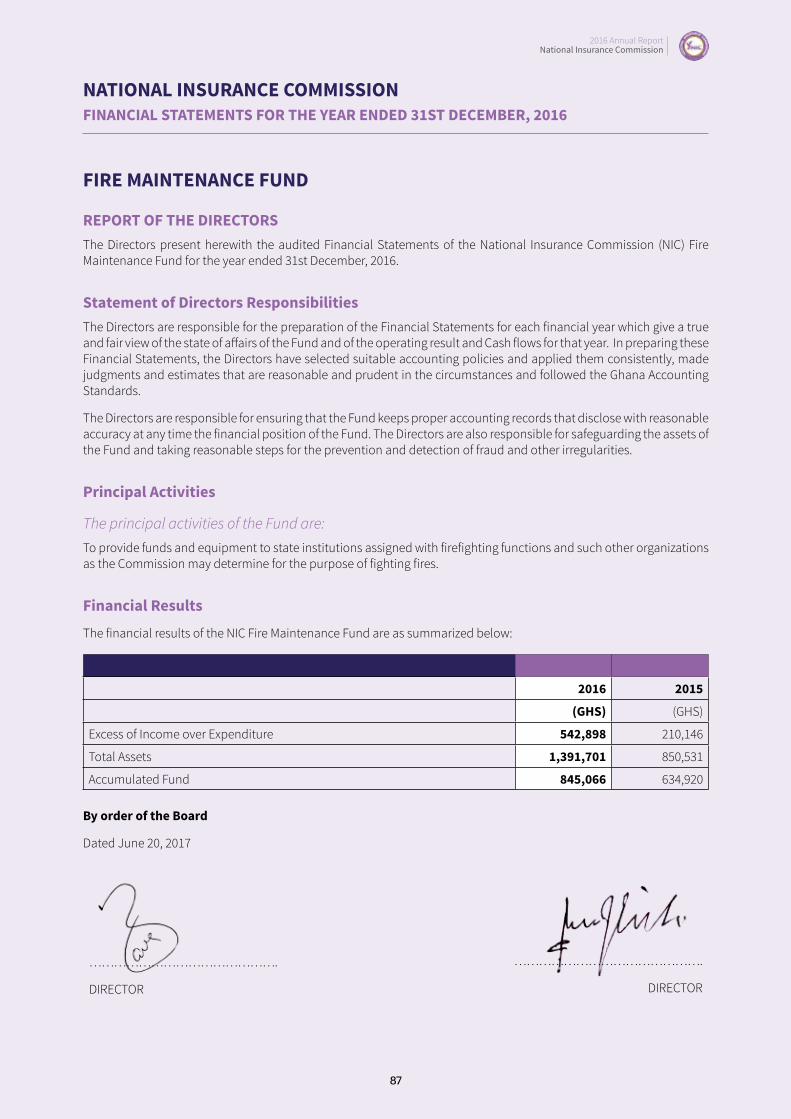
2016 Annual Report National Insurance Commission
2016 Annual Report National Insurance Commission
87
NATIONAL INSURANCE COMMISSIONFINANCIAL STATEMENTS FOR THE YEAR ENDED 31ST DECEMBER, 2016
FIRE MAINTENANCE FUND
REPORT OF THE DIRECTORSThe Directors present herewith the audited Financial Statements of the National Insurance Commission (NIC) Fire Maintenance Fund for the year ended 31st December, 2016.
Statement of Directors Responsibilities The Directors are responsible for the preparation of the Financial Statements for each financial year which give a true and fair view of the state of affairs of the Fund and of the operating result and Cash flows for that year. In preparing these Financial Statements, the Directors have selected suitable accounting policies and applied them consistently, made judgments and estimates that are reasonable and prudent in the circumstances and followed the Ghana Accounting Standards.
The Directors are responsible for ensuring that the Fund keeps proper accounting records that disclose with reasonable accuracy at any time the financial position of the Fund. The Directors are also responsible for safeguarding the assets of the Fund and taking reasonable steps for the prevention and detection of fraud and other irregularities.
Principal Activities
The principal activities of the Fund are: To provide funds and equipment to state institutions assigned with firefighting functions and such other organizations as the Commission may determine for the purpose of fighting fires.
Financial Results
The financial results of the NIC Fire Maintenance Fund are as summarized below:
2016 2015
(GHS) (GHS)
Excess of Income over Expenditure 542,898 210,146
Total Assets 1,391,701 850,531
Accumulated Fund 845,066 634,920
By order of the Board
Dated June 20, 2017
……………………………………….
DIRECTOR
……………………………………….
DIRECTOR

2016 Annual Report National Insurance Commission
88
FIRE MAINTENANCE FUNDIndependent Auditor’s Report to the Honourable Minister of Finance
OpinionWe have audited the financial statements of NIC – Fire Maintenance Fund which comprise the statement of financial position as at 31 December, 2016 Income and Expenditure Accounts and cash flow statement for the year then ended, and notes to the financial statements, including a summary of significant accounting policies and other explanatory notes as set out on pages 8 to 10.
In our opinion, the accompanying financial statements give a true and fair view of the financial position of the Fund as at 31 December, 2016 and of its financial performance and its cash flows for the year then ended in accordance with Ghana National Accounting Standards and in the manner required by the Insurance Act 2006 (Act 724).
Basis for Opinion We conducted our audit in accordance with International Standards on Auditing (ISAs). Our responsibilities under those standards are further described in the Auditor’s Responsibilities for the Audit of the Financial Statements section of our report. We are independent of the Fund in accordance with the International Ethics Standards Board for Accountants’ Code of Ethics for Professional Accountants (IESBA Code), and we have fulfilled our other ethical responsibilities in accordance with the IESBA Code. We believe that the audit evidence we have obtained is sufficient and appropriate to provide a basis for our opinion.
Responsibilities of the Board of Directors for the Financial StatementsThe Board of Directors are responsible for the preparation of the financial statements in accordance with Ghana National Accounting Standards and in the manner required by the Insurance Act 2006 (Act 724) and for such internal control as the Board of Directors determines is necessary to enable the preparation of financial statements that are free from material misstatement, whether due to fraud or error.
In preparing the financial statements, the Board of Directors are responsible for assessing the Fund’s ability to continue as a going concern, disclosing, as applicable, matters related to going concern and using the going concern basis of accounting unless the Board of Directors either intends to liquidate the Fund or to cease operations, or has no realistic alternative but to do so. The Board of Directors are responsible for overseeing the Fund’s financial reporting process.
Auditor’s responsibilityOur objectives are to obtain reasonable assurance about whether the financial statements as a whole are free from material misstatement, whether due to fraud or error, and to issue an auditor’s report that includes our opinion. Reasonable assurance is a high level of assurance, but is not a guarantee that an audit conducted in accordance with ISAs will always detect a material misstatement when it exists. Misstatements can arise from fraud or error and are considered material if individually or in the aggregate, they could reasonably be expected to influence the economic decision of users taken on the basis of these financial statements.
As part of an audit in accordance with ISAs, we exercise professional judgement and maintain professional skepticism throughout the audit. We also;
■ Identify and assess the risks of material misstatement of the financial statements, whether due to fraud or error, design and perform audit procedures responsive to those risks, and obtain audit evidence that is sufficient and appropriate to provide a basis for our opinion.
■ The risk of not detecting a material misstatement resulting from fraud is higher than for one resulting from error, as fraud may involve collusion, forgery, intentional omissions, misrepresentations, or the override of internal control.
■ Evaluate the appropriateness of policies used and the reasonableness of accounting estimates and related disclosures made by the Board of Directors.

2016 Annual Report National Insurance Commission
2016 Annual Report National Insurance Commission
89
■ Conclude on the appropriateness of the Board of Director’s use of the going concern basis of accounting and, based on the audit evidence obtained, whether a material uncertainty exists related to events or conditions that may cast significant doubt on the Fund’s ability to continue as a going concern. If we conclude that a material uncertainty exists, we are required to draw attention in our auditor’s report to the related disclosures in the financial statements or, if such disclosures are inadequate, to modify our opinion. Our conclusions are based on the audit evidence obtained up to the date of our auditor’s report. However, future events or conditions may cause the Fund to cease to continue as a going concern.
■ Evaluate the overall presentation, structure and content of the financial statements, including the disclosures, and whether the financial statements represent the underlying transactions and events in a manner that achieves fair presentation.
We communicate with the Board of Directors regarding, among other matters, the planned scope and timing of the audit and significant audit findings, including any significant deficiencies in internal control that we identify during our audit.
The engagement Partner on the audit resulting in this independent auditor’s report is Emmanuel Offei – ICAG/P/1102.
For: Boateng, Offei & Co. – [ICAG/F/2017/108]Chartered AccountantsCorrespondent firm; Grant Thornton International 9 Bissau Avenue, East LegonAccra-Ghana
June 20, 2017

2016 Annual Report National Insurance Commission
90
NATIONAL INSURANCE COMMISSIONFIRE MAINTENANCE FUND
INCOME AND EXPENDITURE ACCOUNTS FOR THE YEAR ENDED 31ST DECEMBER, 2016
Notes 2016 2015
(GHS) (GHS)
INCOME 2 716,387 608,444
EXPENDITURE 3 (173,489) (398,298)
Excess of Income over Expenditure 542,898 210,146
ACCUMULATED FUND
Balance as at 1st January 845,066 634,920
Excess of Income over Expenditure for year 542,898 210,146
Balance as at 31st December 1,387,964 845,066
The accompanying notes form an integral part of these Financial Statements.

2016 Annual Report National Insurance Commission
2016 Annual Report National Insurance Commission
91
NATIONAL INSURANCE COMMISSIONFIRE MAINTENANCE FUND
STATEMENT OF FINANCIAL POSITION AS AT 31ST DECEMBER, 2016
Notes 2016 2015
(GHS) (GHS)
Current Assets
Accounts Receivable 4 158,673 123,045
Short Term Investments 5 649,363 500,000
Bank and Cash Balances 6 583,665 227,486
1,391,701 850,531
Accumulated Fund
Accumulated fund 1,387,964 845,066
Current Liabilities
Accounts Payable 7 3,737 5,465
Total Liabilities & Accumulated Fund 1,391,701 850,531
The Financial Statements on page 90 to 95 were approved by the Board of Directors of the NIC on June 20, 2017 and were signed on its behalf by:
……………………………………….
DIRECTOR
……………………………………….
DIRECTOR
The accompanying notes form an integral part of these Financial Statements.

2016 Annual Report National Insurance Commission
92
NATIONAL INSURANCE COMMISSIONFIRE MAINTENANCE FUND
STATEMENT OF CASHFLOWS FOR THE YEAR ENDED 31ST DECEMBER, 2016
Notes 2016 2015
(GHS) (GHS)
Operating Activities
Cash Generated from Operations 8 337,997 (12,636)
Net Cash Generated from Operating Activities 337,997 (12,636)
Cash flow from Investing Activities
Purchase of Investment (149,363) (68,833)
Investment Income Received 167,545 137,330
Net Cash Inflow from Investing Activities 18,182 68,497
Net increase/(decrease) in Cash and Cash Equivalents 356,179 55,861
Movement in Cash and Cash Equivalents
Cash and Cash Equivalents at the beginning of the Year 227,486 171,625
Increase in Cash and Cash Equivalents 7 356,179 55,861
Cash and Cash Equivalents at end of the Year 583,665 227,486
The accompanying notes form an integral part of these Financial Statements.
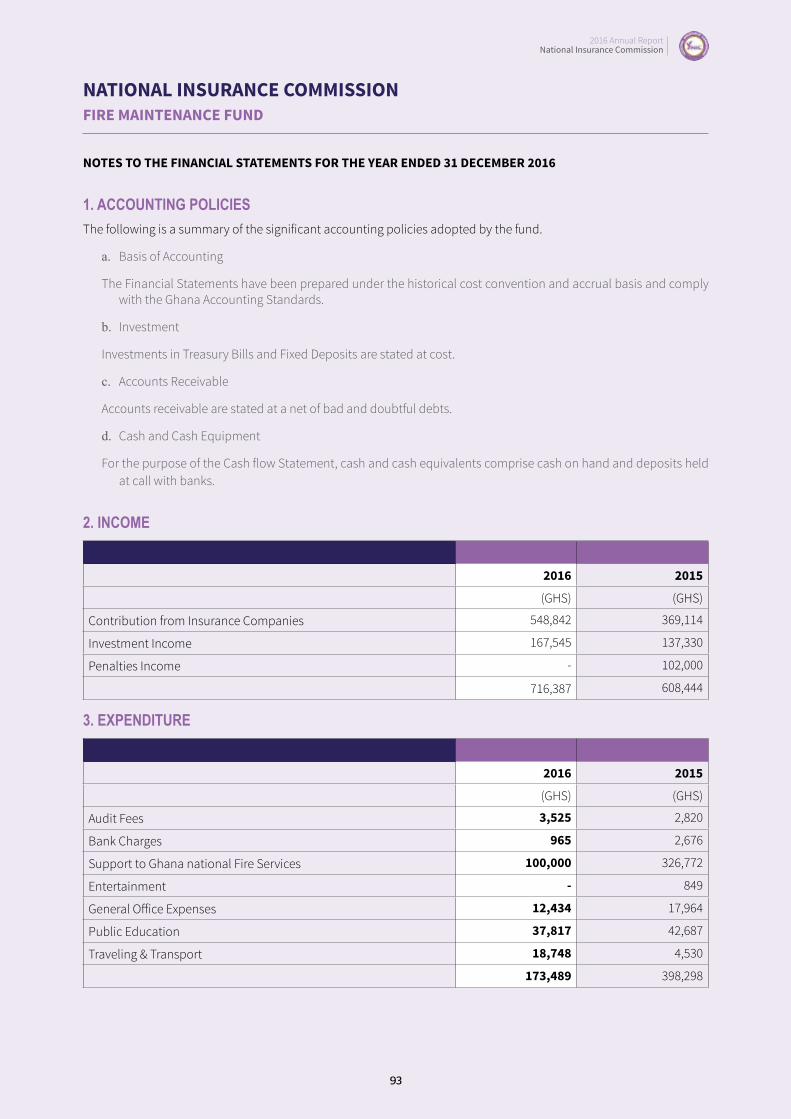
2016 Annual Report National Insurance Commission
2016 Annual Report National Insurance Commission
93
NATIONAL INSURANCE COMMISSIONFIRE MAINTENANCE FUND
NOTES TO THE FINANCIAL STATEMENTS FOR THE YEAR ENDED 31 DECEMBER 2016
1. ACCOUNTING POLICIESThe following is a summary of the significant accounting policies adopted by the fund.
a. Basis of Accounting
The Financial Statements have been prepared under the historical cost convention and accrual basis and comply with the Ghana Accounting Standards.
b. Investment
Investments in Treasury Bills and Fixed Deposits are stated at cost.
c. Accounts Receivable
Accounts receivable are stated at a net of bad and doubtful debts.
d. Cash and Cash Equipment
For the purpose of the Cash flow Statement, cash and cash equivalents comprise cash on hand and deposits held at call with banks.
2. INCOME
2016 2015
(GHS) (GHS)
Contribution from Insurance Companies 548,842 369,114
Investment Income 167,545 137,330
Penalties Income - 102,000
716,387 608,444
3. EXPENDITURE
2016 2015
(GHS) (GHS)
Audit Fees 3,525 2,820
Bank Charges 965 2,676
Support to Ghana national Fire Services 100,000 326,772
Entertainment - 849
General Office Expenses 12,434 17,964
Public Education 37,817 42,687
Traveling & Transport 18,748 4,530
173,489 398,298

2016 Annual Report National Insurance Commission
94
4. ACCOUNTS RECEIVABLE
2016 2015
(GHS) (GHS)
Penalties Receivable 25,000 25,000
Accrued Investment Income 75,717 57,534
Other Receivables (120) 2,340
National Insurance Commission 58,076 38,171
158,673 123,045
5. SHORT TERM INVESTMENT
2016 2015
(GHS) (GHS)
Fixed Deposit 649,363 500,000
Balance as at 1st January 500,000 431,167
Additions 149,363 68,833
Balance as at 31st December 649,363 500,000
Net Investments 149,363 68,833
6. CASH & CASH EQUIVALENT
2016 2015
(GHS) (GHS)
Bank and Cash 583,665 227,486
7. ACCOUNTS PAYABLE
2016 2015
(GHS) (GHS)
Audit Fees 3,525 2,820
Accrued Expenses - 1,400
WHT Payables 211 1,244
National Insurance Commission
3,736 5,464

2016 Annual Report National Insurance Commission
2016 Annual Report National Insurance Commission
95
8. RECONCILIATION OF EXCESS OF INCOME OVER EXPENDITURE TO CASH FLOW FROM OPERATING ACTIVITIES
2016 2015
(GHS) (GHS)
Excess of Income over Expenditure 542,898 210,146
Investment Income (167,545) (137,330)
(Increase)/Decrease in Accounts Receivable (35,629) (84,092)
Increase/(Decrease) in Creditors (1,728) (1,360)
Cash Generated from / (used in) Operating Activities 337,997 (12,636)
9. CONTINGENT LIABILITIES
There were no contingent liabilities at 31st December, 2016 (2015: Nil)

2016 Annual Report National Insurance Commission
96
LIST OF REGISTERED NON-LIFE INSURANCE COMPANIES
No. Company Contact Details Location
1 Activa International Insurance Company (Ghana) Limited
PMB KIA 85 Airport, Accra
Tel: 686352/672145/685118
Fax:685176
e-mail: [email protected]
3rd Floor, Heritage Tower, 6th Avenue, West Ridge.
2 Allianz Insurance Company Ghana Limited
PMB CT 353 Cantonments, Accra
Tel: 764893-4/764891
Fax : 765140
e-mail : [email protected]
www.allianz-ghana.com
18, North Airport, adjacent Villagio Apartments, West Airport Residential Area
3 Best Assurance Company Limited
P. O. Box CT 11022 Cantonments-Accra
Tel : +233(0)302541745
Info : bestpointinsurance.com
www.bestpointinsurance.co
Opp. American House, East Legon
4 Saham Insurance Limited
P. O. Box 1292, Accra
Tel: 774771, 760639, 768351
Fax: 760568
e-mail: [email protected]
www.groupecolina.com
Near Ghana Commercial Bank. La Beach Road, Osu
#18 Dr. lsert Road, Ridge-Accra
5 Donewell Insurance Company Limited
P. O. Box GP 2136, Accra
Tel: 763065, 763118, 763171, 7011560-1, 772778
Fax: 763147
e-mail: [email protected]
F 33/1, Carl Quist Street, Kuku Hill, Osu RE
6
Enterprise Insurance Company Limited
P. O. Box GP 50, Accra
Tel: 666856-8/666847-9
Fax: 666186/670306/677677
e-mail: [email protected]
www.enterprisegroup.com.gh
Enterprise House, No. 11 High Street
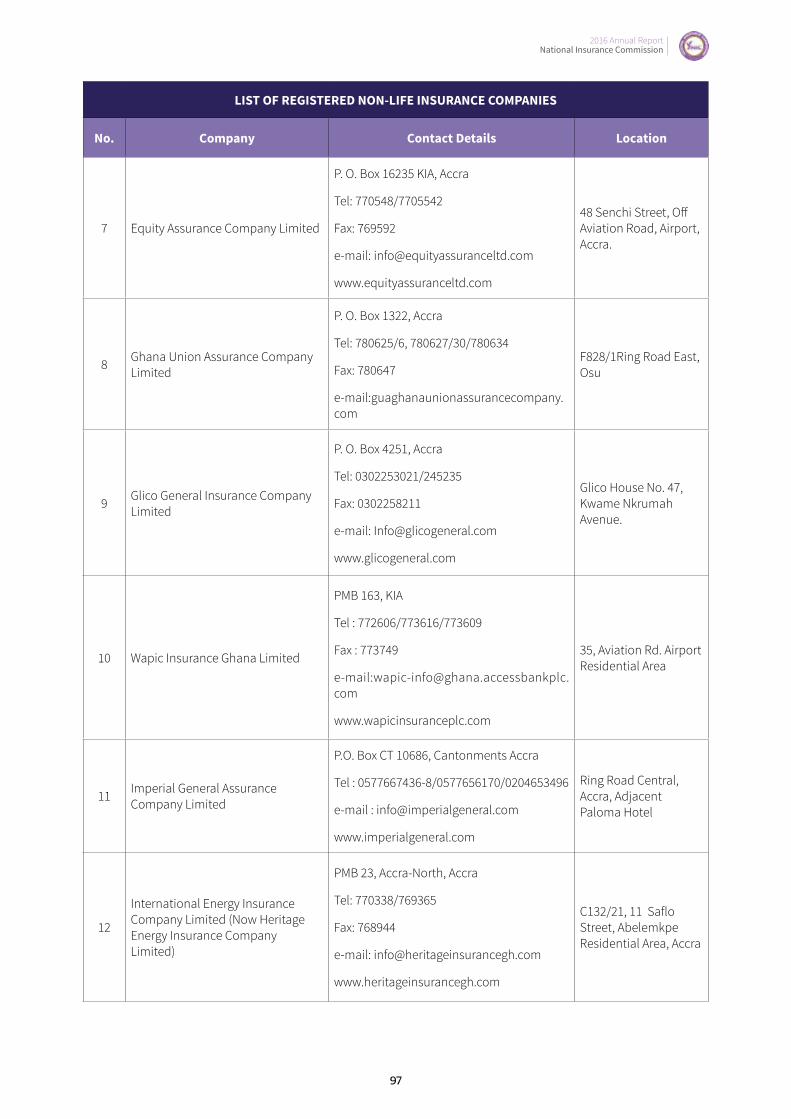
2016 Annual Report National Insurance Commission
2016 Annual Report National Insurance Commission
97
LIST OF REGISTERED NON-LIFE INSURANCE COMPANIES
No. Company Contact Details Location
7 Equity Assurance Company Limited
P. O. Box 16235 KIA, Accra
Tel: 770548/7705542
Fax: 769592
e-mail: [email protected]
www.equityassuranceltd.com
48 Senchi Street, Off Aviation Road, Airport, Accra.
8 Ghana Union Assurance Company Limited
P. O. Box 1322, Accra
Tel: 780625/6, 780627/30/780634
Fax: 780647
e-mail:guaghanaunionassurancecompany.com
F828/1Ring Road East, Osu
9 Glico General Insurance Company Limited
P. O. Box 4251, Accra
Tel: 0302253021/245235
Fax: 0302258211
e-mail: [email protected]
www.glicogeneral.com
Glico House No. 47, Kwame Nkrumah Avenue.
10 Wapic Insurance Ghana Limited
PMB 163, KIA
Tel : 772606/773616/773609
Fax : 773749
e-mail:[email protected]
www.wapicinsuranceplc.com
35, Aviation Rd. Airport Residential Area
11 Imperial General Assurance Company Limited
P.O. Box CT 10686, Cantonments Accra
Tel : 0577667436-8/0577656170/0204653496
e-mail : [email protected]
www.imperialgeneral.com
Ring Road Central, Accra, Adjacent Paloma Hotel
12
International Energy Insurance Company Limited (Now Heritage Energy Insurance Company Limited)
PMB 23, Accra-North, Accra
Tel: 770338/769365
Fax: 768944
e-mail: [email protected]
www.heritageinsurancegh.com
C132/21, 11 Saflo Street, Abelemkpe Residential Area, Accra
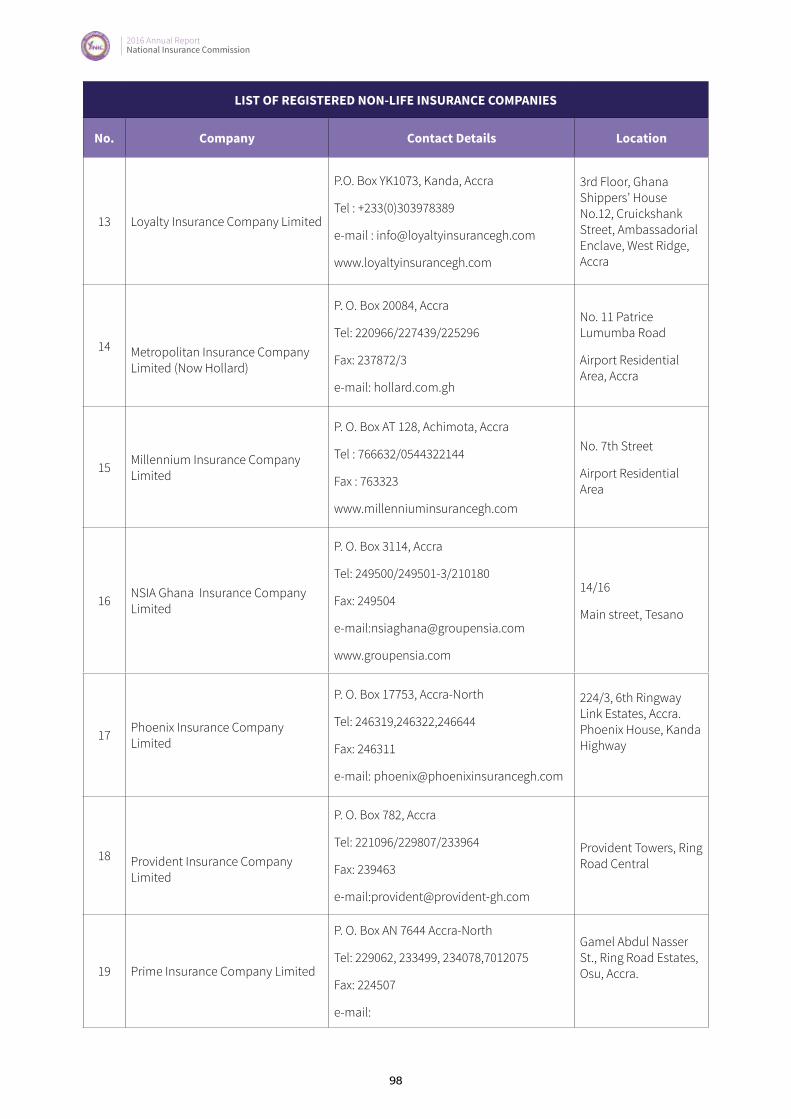
2016 Annual Report National Insurance Commission
98
LIST OF REGISTERED NON-LIFE INSURANCE COMPANIES
No. Company Contact Details Location
13 Loyalty Insurance Company Limited
P.O. Box YK1073, Kanda, Accra
Tel : +233(0)303978389
e-mail : [email protected]
www.loyaltyinsurancegh.com
3rd Floor, Ghana Shippers’ House No.12, Cruickshank Street, Ambassadorial Enclave, West Ridge, Accra
14 Metropolitan Insurance Company Limited (Now Hollard)
P. O. Box 20084, Accra
Tel: 220966/227439/225296
Fax: 237872/3
e-mail: hollard.com.gh
No. 11 Patrice Lumumba Road
Airport Residential Area, Accra
15 Millennium Insurance Company Limited
P. O. Box AT 128, Achimota, Accra
Tel : 766632/0544322144
Fax : 763323
www.millenniuminsurancegh.com
No. 7th Street
Airport Residential Area
16 NSIA Ghana Insurance Company Limited
P. O. Box 3114, Accra
Tel: 249500/249501-3/210180
Fax: 249504
e-mail:[email protected]
www.groupensia.com
14/16
Main street, Tesano
17 Phoenix Insurance Company Limited
P. O. Box 17753, Accra-North
Tel: 246319,246322,246644
Fax: 246311
e-mail: [email protected]
224/3, 6th Ringway Link Estates, Accra. Phoenix House, Kanda Highway
18 Provident Insurance Company Limited
P. O. Box 782, Accra
Tel: 221096/229807/233964
Fax: 239463
e-mail:[email protected]
Provident Towers, Ring Road Central
19 Prime Insurance Company Limited
P. O. Box AN 7644 Accra-North
Tel: 229062, 233499, 234078,7012075
Fax: 224507
e-mail:
Gamel Abdul Nasser St., Ring Road Estates, Osu, Accra.
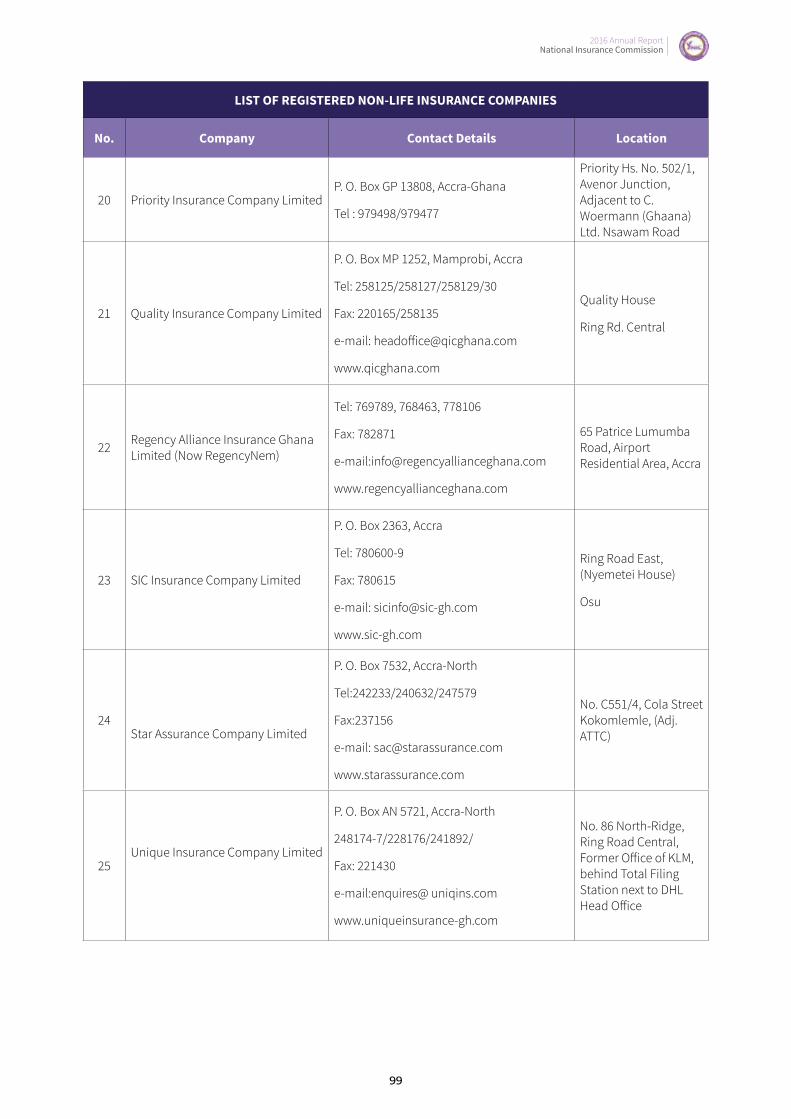
2016 Annual Report National Insurance Commission
2016 Annual Report National Insurance Commission
99
LIST OF REGISTERED NON-LIFE INSURANCE COMPANIES
No. Company Contact Details Location
20 Priority Insurance Company LimitedP. O. Box GP 13808, Accra-Ghana
Tel : 979498/979477
Priority Hs. No. 502/1, Avenor Junction, Adjacent to C. Woermann (Ghaana) Ltd. Nsawam Road
21 Quality Insurance Company Limited
P. O. Box MP 1252, Mamprobi, Accra
Tel: 258125/258127/258129/30
Fax: 220165/258135
e-mail: [email protected]
www.qicghana.com
Quality House
Ring Rd. Central
22 Regency Alliance Insurance Ghana Limited (Now RegencyNem)
Tel: 769789, 768463, 778106
Fax: 782871
e-mail:[email protected]
www.regencyallianceghana.com
65 Patrice Lumumba Road, Airport Residential Area, Accra
23 SIC Insurance Company Limited
P. O. Box 2363, Accra
Tel: 780600-9
Fax: 780615
e-mail: [email protected]
www.sic-gh.com
Ring Road East, (Nyemetei House)
Osu
24Star Assurance Company Limited
P. O. Box 7532, Accra-North
Tel:242233/240632/247579
Fax:237156
e-mail: [email protected]
www.starassurance.com
No. C551/4, Cola Street Kokomlemle, (Adj. ATTC)
25Unique Insurance Company Limited
P. O. Box AN 5721, Accra-North
248174-7/228176/241892/
Fax: 221430
e-mail:enquires@ uniqins.com
www.uniqueinsurance-gh.com
No. 86 North-Ridge, Ring Road Central, Former Office of KLM, behind Total Filing Station next to DHL Head Office

2016 Annual Report National Insurance Commission
100
LIST OF REGISTERED NON-LIFE INSURANCE COMPANIES
No. Company Contact Details Location
26 Vanguard Assurance Company Limited
P. O. Box 1868, Accra
Tel: 666485-7/782921-2
Fax: 668610
e-mail: [email protected]
www.vanguardassurance.com
Independence Avenue near CAL Bank
LIST OF REGISTERED LIFE INSURANCE COMPANIES
No. Company Contact Details Location
1 African Life Assurance Company Limited
P. O. Box 16192, KIA
Accra
Tel : +233(0)302769666/769615/769581
e-mail :[email protected]
www.africanlifeghana.com
9 Cantonments Crescent, Cantonments, Accra
2 A-Plus Life Assurance Company Limited
P.O. Box AD 655, Adabraka-Accra
Tel : 0501450800
C618/3 Samosa Machel Road Asylum Down
9/1&9/2 Saxel Avenue Tesano, Accra
3 Capital Express Assurance (Gh) Limited (Now Avance Life)
P. O. Box 5080, Accra
Tel: 240409, 0289546118/0289546151
Fax: 247942
e-mail: [email protected]
www.capitalexpressassurance.com
House No. 865A/3, Tackie Tawiah Ave., Kanda Highway, North Ridge
4 Donewell Life Insurance Company Limited
P. O. Box GP 3958, Accra
Tel: 763321, 763266, 772778
Fax: 763266
e-mail: donewelllife.com.gh
www.donewelllife.com.gh
F333/1, Karl Quist Street, Kuku Hill, Osu-Re
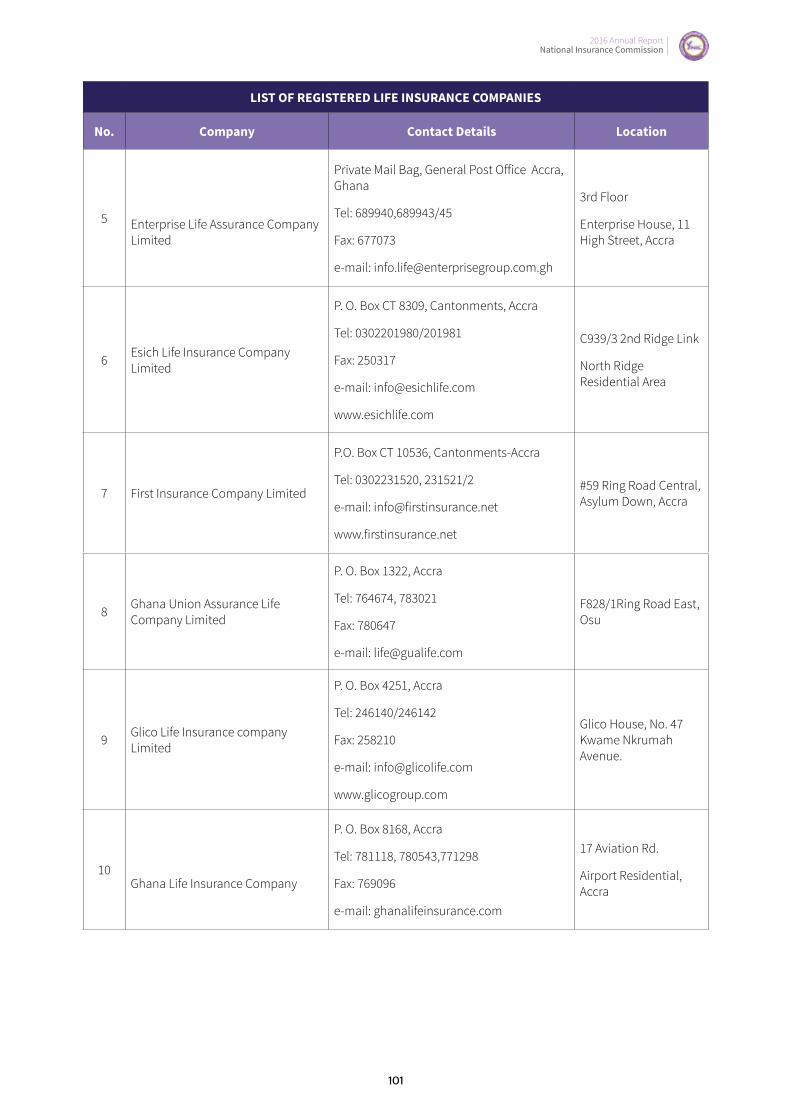
2016 Annual Report National Insurance Commission
2016 Annual Report National Insurance Commission
101
LIST OF REGISTERED LIFE INSURANCE COMPANIES
No. Company Contact Details Location
5 Enterprise Life Assurance Company Limited
Private Mail Bag, General Post Office Accra, Ghana
Tel: 689940,689943/45
Fax: 677073
e-mail: [email protected]
3rd Floor
Enterprise House, 11 High Street, Accra
6 Esich Life Insurance Company Limited
P. O. Box CT 8309, Cantonments, Accra
Tel: 0302201980/201981
Fax: 250317
e-mail: [email protected]
www.esichlife.com
C939/3 2nd Ridge Link
North Ridge Residential Area
7 First Insurance Company Limited
P.O. Box CT 10536, Cantonments-Accra
Tel: 0302231520, 231521/2
e-mail: [email protected]
www.firstinsurance.net
#59 Ring Road Central, Asylum Down, Accra
8 Ghana Union Assurance Life Company Limited
P. O. Box 1322, Accra
Tel: 764674, 783021
Fax: 780647
e-mail: [email protected]
F828/1Ring Road East, Osu
9 Glico Life Insurance company Limited
P. O. Box 4251, Accra
Tel: 246140/246142
Fax: 258210
e-mail: [email protected]
www.glicogroup.com
Glico House, No. 47 Kwame Nkrumah Avenue.
10Ghana Life Insurance Company
P. O. Box 8168, Accra
Tel: 781118, 780543,771298
Fax: 769096
e-mail: ghanalifeinsurance.com
17 Aviation Rd.
Airport Residential, Accra

2016 Annual Report National Insurance Commission
102
LIST OF REGISTERED LIFE INSURANCE COMPANIES
No. Company Contact Details Location
11 GN Life Assurance Company Limited
P.O. Box AN5879, Accra-North
Tel : 0302221885
Fax : 0302256344
e-mail :[email protected]
www.gnlifeassurance.com
No.62 Kinshaha Avenue, East Legon
12 MetLife Insurance Ghana Limited
P. O. Box CT 456, Cantonments, Accra
Tel: 633933
Fax: 685466, 685440
e-mail: [email protected]
www.metropolitan.com.gh
1st & 2nd Floors, Omanye Aba Building, 28th February Road, Osu, Accra.
13 Millennium Life Insurance Company Limited
P.O. Box KA18210, Airport, Accra
Tel: 0302766633
Fax: 0302763323
e-mail: millenniuminsurance.com
No.4, Dr. Paul Acquah street
Airport Residential Area
14 Old Mutual Life Assurance Company Limited
P.O. Box 782, Accra
Tel: 252132/233938/230646
e-mail: [email protected]
www.oldmutual.com.gh
Provident Towers, Ring Road Central
15 Phoenix Life Insurance Company Limited
P. O. Box 17753, Accra-North
Tel: 911023
Fax: 222008
e-mail: [email protected]
CDH Building, Opposite NIC, Independence Avenue, Accra
16 Provident Life Assurance Company Limited
P. O. Box 782, Accra
Tel: 252132/233938
e-mail: [email protected]
Provident Towers, Ring Road Central
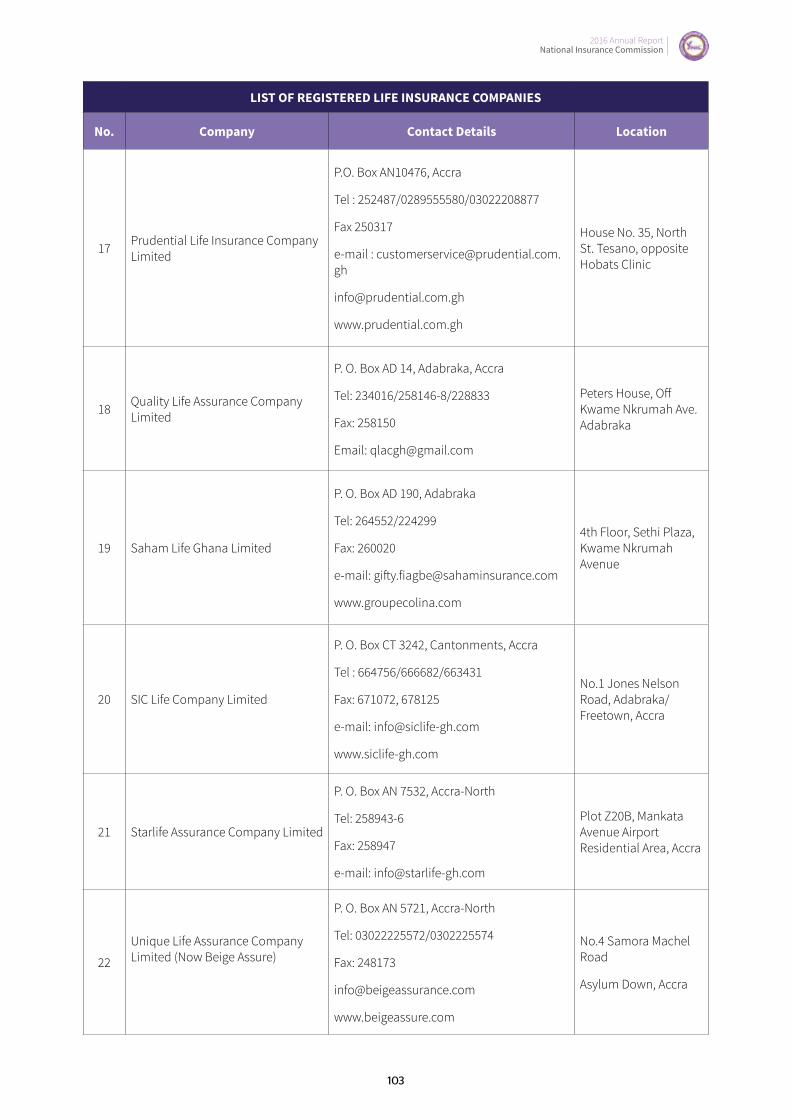
2016 Annual Report National Insurance Commission
2016 Annual Report National Insurance Commission
103
LIST OF REGISTERED LIFE INSURANCE COMPANIES
No. Company Contact Details Location
17 Prudential Life Insurance Company Limited
P.O. Box AN10476, Accra
Tel : 252487/0289555580/03022208877
Fax 250317
e-mail : [email protected]
www.prudential.com.gh
House No. 35, North St. Tesano, opposite Hobats Clinic
18 Quality Life Assurance Company Limited
P. O. Box AD 14, Adabraka, Accra
Tel: 234016/258146-8/228833
Fax: 258150
Email: [email protected]
Peters House, Off Kwame Nkrumah Ave. Adabraka
19 Saham Life Ghana Limited
P. O. Box AD 190, Adabraka
Tel: 264552/224299
Fax: 260020
e-mail: [email protected]
www.groupecolina.com
4th Floor, Sethi Plaza, Kwame Nkrumah Avenue
20 SIC Life Company Limited
P. O. Box CT 3242, Cantonments, Accra
Tel : 664756/666682/663431
Fax: 671072, 678125
e-mail: [email protected]
www.siclife-gh.com
No.1 Jones Nelson Road, Adabraka/Freetown, Accra
21 Starlife Assurance Company Limited
P. O. Box AN 7532, Accra-North
Tel: 258943-6
Fax: 258947
e-mail: [email protected]
Plot Z20B, Mankata Avenue Airport Residential Area, Accra
22
Unique Life Assurance Company Limited (Now Beige Assure)
P. O. Box AN 5721, Accra-North
Tel: 03022225572/0302225574
Fax: 248173
www.beigeassure.com
No.4 Samora Machel Road
Asylum Down, Accra
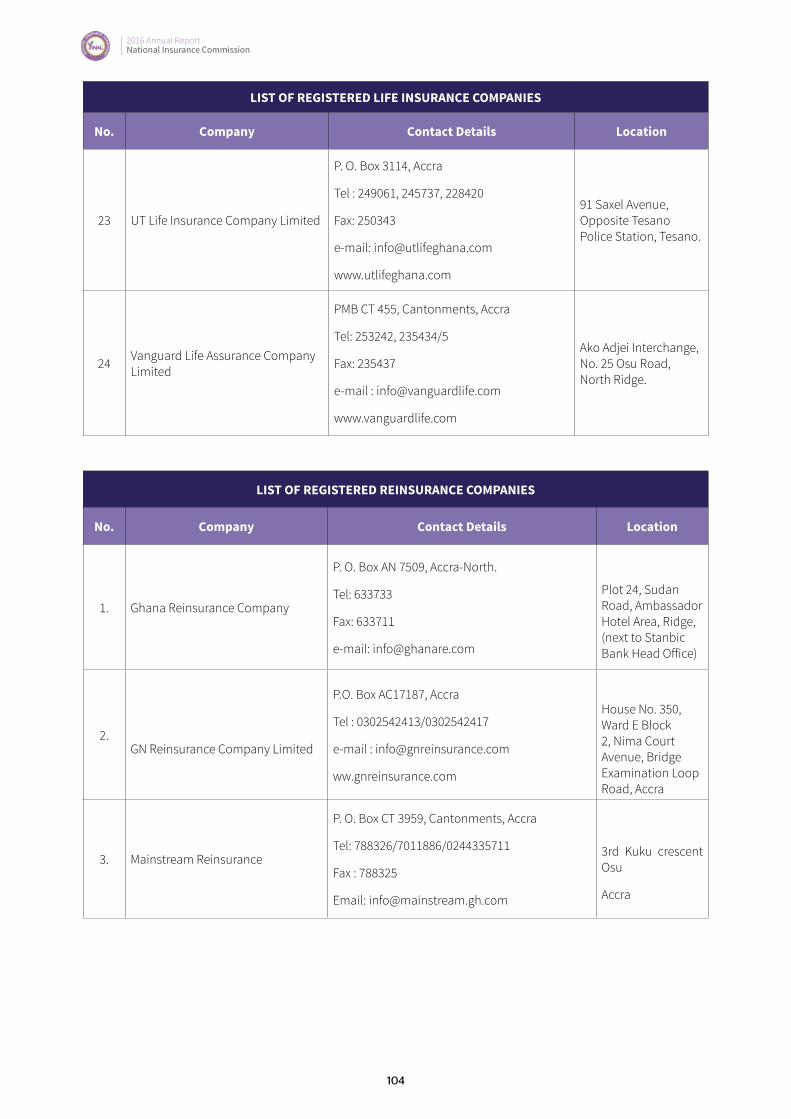
2016 Annual Report National Insurance Commission
104
LIST OF REGISTERED LIFE INSURANCE COMPANIES
No. Company Contact Details Location
23 UT Life Insurance Company Limited
P. O. Box 3114, Accra
Tel : 249061, 245737, 228420
Fax: 250343
e-mail: [email protected]
www.utlifeghana.com
91 Saxel Avenue, Opposite Tesano Police Station, Tesano.
24 Vanguard Life Assurance Company Limited
PMB CT 455, Cantonments, Accra
Tel: 253242, 235434/5
Fax: 235437
e-mail : [email protected]
www.vanguardlife.com
Ako Adjei Interchange, No. 25 Osu Road, North Ridge.
LIST OF REGISTERED REINSURANCE COMPANIES
No. Company Contact Details Location
1. Ghana Reinsurance Company
P. O. Box AN 7509, Accra-North.
Tel: 633733
Fax: 633711
e-mail: [email protected]
Plot 24, Sudan Road, Ambassador Hotel Area, Ridge, (next to Stanbic Bank Head Office)
2.GN Reinsurance Company Limited
P.O. Box AC17187, Accra
Tel : 0302542413/0302542417
e-mail : [email protected]
ww.gnreinsurance.com
House No. 350, Ward E Block 2, Nima Court Avenue, Bridge Examination Loop Road, Accra
3. Mainstream Reinsurance
P. O. Box CT 3959, Cantonments, Accra
Tel: 788326/7011886/0244335711
Fax : 788325
Email: [email protected]
3rd Kuku crescent Osu
Accra

2016 Annual Report National Insurance Commission
2016 Annual Report National Insurance Commission
105
LIST OF REGISTERED REINSURANCE COMPANIES (CONTACT OFFICE)
No. Company Contact Details Location
1. Munich Mauritius Re (Liaison Office/Contact Office
P. O. Box GP 19389, Accra, Ghana
Tel: (0302) 507010
Fax: (0302) 507011
e-mail: [email protected]
www.munichre.com
5th Floor, Gulf House
East Legon
2.WAICA Re Corporation Plc. (Liaison/Contact Office)
P.O. Box AN 5042, Accra-North
Tel : 0302631164, 0244734534
e-mail : [email protected]
Suite No. 10, The Emporium Ambassador Hotel, 2nd Floor
LIST OF REGISTERED INSURANCE BROKING COMPANIES
No. Company Contact Details Location
1 AG Associates Limited
P. O. Box SK 26 Sakumono, Comm. 13
Tel: 0244731209
e-mail: [email protected]
Agbogba, Accra
2 Akoto Risk Management Limited
P. O. Box 953, Accra
Tel: 237573, 225330, 227813, 228905
Fax:246543
e-mail: [email protected]
90 Kwame Nkrumah Avenue
3. All Risks Consultancy Limited
P. O. AN Box 11585, Accra
Tel: 2025544
Fax: 789912
e-mail: [email protected]
www.alriskconsultancy.com
2nd Floor, Caledonian Kojo Thompson Road, Accra
4. AllStar Insurance BrokersP.O. Box CT 6104, Cantonments-Accra
Tel: 0302243690, 0244362432
Marbel Plaza, Behind Hotel President, Asylum Down, Accra
5. Allied Insurance Brokers Limited
P. O. Box RT 649, Accra Newtown, Accra
Tel: 233459, 027 2090137
e-mail: [email protected]
15 Hill Street, New Town, Accra

2016 Annual Report National Insurance Commission
106
LIST OF REGISTERED INSURANCE BROKING COMPANIES
No. Company Contact Details Location
6. Alpha Insurance Brokers Limited
P. O. Box CT 6046, Cantonments, Accra
Tel: 661572, 681156
Fax: 661572
e-mail: [email protected]
Annex ‘B’, Room 109, First Floor, Republic House, Accra
7. Anchor Premier Brokers Limited
P.O. Box 05853, Osu, Accra
Tel : 0243029337/0244356397/0244326326
e-mail : [email protected]
Ghana Procurement Agency Building
Kokommlemle Main Road
8. Arrow Class Insurance Brokers Company Limited
P.O. Box Box KN 4769, Accra
Tel : 433735/2330-3932005, 2330-3932006
e-mail : [email protected]
www.arrowclassinsurance.com
2nd floor of L’aine Office, Kojo Thompson Road Complex, Adabraka-Accra
9. ARB Insurance Brokers Limited
P.O. Box CT 138 Cantonments-Accra
Tel : 0244822342
Fax : 0302-308598
e-mail : [email protected]/[email protected]
B235/25, 13 Akorlu Close Darkuman
10. Apex Insurance Brokers Limited
P. O. Box KN 3068, Kaneshie-Accra
Tel: 020 8226823/0277610368
Fax: 660650
e-mail:
House No. 58, Owusu Kofi Street, Darkuman, Accra.
11.Ark Insurance Brokers Company
P. O. Box 1609, Mamprobi-Accra
Tel./Fax: 662657
e-mail:
PZ Building, 15 Kwame Nkrumah Avenue, Behind Regency Alliance Insurance and Association Int. Sch. 65 Patrice Lumumba Rd, Airport Residential Area
12. Ascoma Ghana Management Limited
P. O. Box 206, Tradefair Centre, Accra
Tel : 0243690363
Fax : 304977
e-mail: [email protected]
www.ascoma.com
33 Labone Crescent, North Labone
13. Asterix Brokers Limited
P. O. Box AD 50, Adabraka-Accra
Tel : 028 9523683/544060
e-mail: [email protected]
No. 117, Lagos Avenue, East Legon
Opposite Zenith Bank

2016 Annual Report National Insurance Commission
2016 Annual Report National Insurance Commission
107
LIST OF REGISTERED INSURANCE BROKING COMPANIES
No. Company Contact Details Location
14. Baobab Brokers Limited
P. O. Box CT 525 Cantonments, Accra
Tel: 291977/0509-387602
e-mail: [email protected]
www.baobabbrokers.com
4th Floor, Total House, 25 Liberia Road, Accra
15. Boaitey & Associates Insurance Brokers Limited
P.O. Box Tl 469, Taifa, Accra
Tel : 020-2018138/0302416853/0265155560
Darfuor House #47, Aflyee West Achimota, Nsawam Road
16. Byllwych Insurance Brokers Limited
P.O. Box AD 200, Adabraka-Accra
Tel : 0200114114/0269366666
e-mail : [email protected]
1st Floor Ike Quartey House, B795/2 Oblogo Road, Kaneshie Zongo-Junction Accra
17. Cardinal Brokers Limited
P. O. Box 2225 Mamprobi, Accra
Tel: 316851, 313230
Fax:
e-mail: [email protected]
House No. 49, Nii Mampong Okai Street, Dansoman
18 Ceris International Limited
P. O. Box CT 3547 Cantonments-Accra
Tel: 680925, 671330, 0244319862, 0208404264, 673778
Fax: 680926
e-mail:
Hse. No. 657/4 2nd Floor (opposite City Paints) Kojo Thompson Road, Accra
19. Claim Limited
P. O. Box CT. 1731, Cantonments,
Tel: 778829
Fax:760830
e-mail: [email protected]
Trade Fair Centre (Pavilion ‘V’) La, Accra
20. Corporate Trust Insurance Brokers Limited
P. O. Box AC 663
Accra
Tel : 234260, 263447
Fax : 234321, 263214
e-mail : [email protected]
Martco House, Kojo Thompson Road, Adabraka
21. Crown Insurance Brokers
P. O. Box 15282 Accra-North
Tel: 237568-9
Fax: 235739
e-mail: [email protected]
House No. C418/2 Watson Avenue, Adabraka
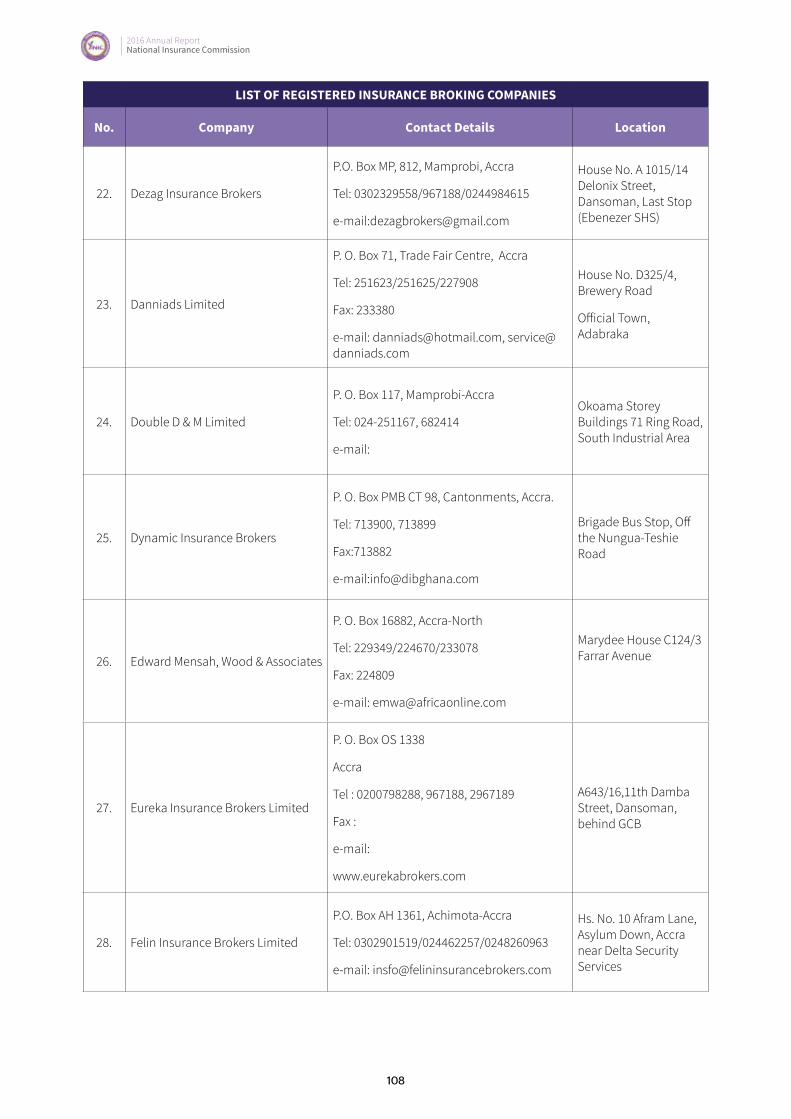
2016 Annual Report National Insurance Commission
108
LIST OF REGISTERED INSURANCE BROKING COMPANIES
No. Company Contact Details Location
22. Dezag Insurance Brokers
P.O. Box MP, 812, Mamprobi, Accra
Tel: 0302329558/967188/0244984615
e-mail:[email protected]
House No. A 1015/14 Delonix Street, Dansoman, Last Stop (Ebenezer SHS)
23. Danniads Limited
P. O. Box 71, Trade Fair Centre, Accra
Tel: 251623/251625/227908
Fax: 233380
e-mail: [email protected], [email protected]
House No. D325/4, Brewery Road
Official Town, Adabraka
24. Double D & M Limited
P. O. Box 117, Mamprobi-Accra
Tel: 024-251167, 682414
e-mail:
Okoama Storey Buildings 71 Ring Road, South Industrial Area
25. Dynamic Insurance Brokers
P. O. Box PMB CT 98, Cantonments, Accra.
Tel: 713900, 713899
Fax:713882
e-mail:[email protected]
Brigade Bus Stop, Off the Nungua-Teshie Road
26. Edward Mensah, Wood & Associates
P. O. Box 16882, Accra-North
Tel: 229349/224670/233078
Fax: 224809
e-mail: [email protected]
Marydee House C124/3 Farrar Avenue
27. Eureka Insurance Brokers Limited
P. O. Box OS 1338
Accra
Tel : 0200798288, 967188, 2967189
Fax :
e-mail:
www.eurekabrokers.com
A643/16,11th Damba Street, Dansoman, behind GCB
28. Felin Insurance Brokers Limited
P.O. Box AH 1361, Achimota-Accra
Tel: 0302901519/024462257/0248260963
e-mail: [email protected]
Hs. No. 10 Afram Lane, Asylum Down, Accra near Delta Security Services
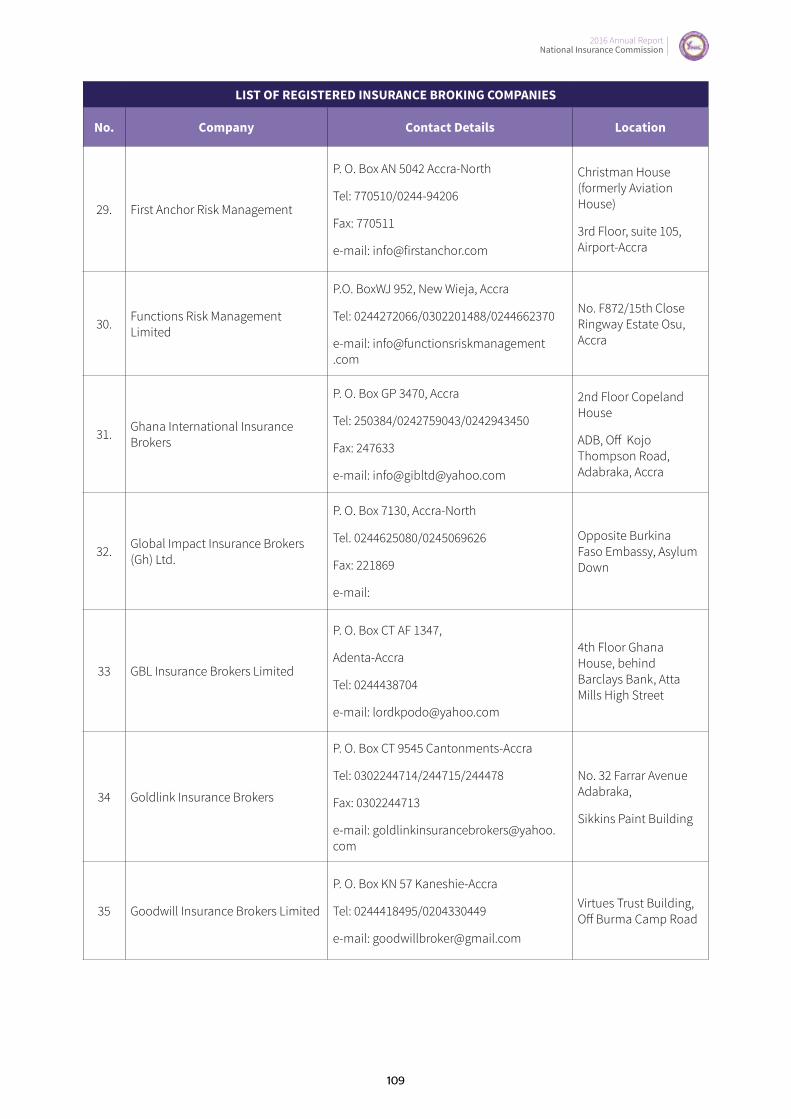
2016 Annual Report National Insurance Commission
2016 Annual Report National Insurance Commission
109
LIST OF REGISTERED INSURANCE BROKING COMPANIES
No. Company Contact Details Location
29. First Anchor Risk Management
P. O. Box AN 5042 Accra-North
Tel: 770510/0244-94206
Fax: 770511
e-mail: [email protected]
Christman House (formerly Aviation House)
3rd Floor, suite 105, Airport-Accra
30. Functions Risk Management Limited
P.O. BoxWJ 952, New Wieja, Accra
Tel: 0244272066/0302201488/0244662370
e-mail: info@functionsriskmanagement .com
No. F872/15th Close Ringway Estate Osu, Accra
31. Ghana International Insurance Brokers
P. O. Box GP 3470, Accra
Tel: 250384/0242759043/0242943450
Fax: 247633
e-mail: info@[email protected]
2nd Floor Copeland House
ADB, Off Kojo Thompson Road, Adabraka, Accra
32. Global Impact Insurance Brokers (Gh) Ltd.
P. O. Box 7130, Accra-North
Tel. 0244625080/0245069626
Fax: 221869
e-mail:
Opposite Burkina Faso Embassy, Asylum Down
33 GBL Insurance Brokers Limited
P. O. Box CT AF 1347,
Adenta-Accra
Tel: 0244438704
e-mail: [email protected]
4th Floor Ghana House, behind Barclays Bank, Atta Mills High Street
34 Goldlink Insurance Brokers
P. O. Box CT 9545 Cantonments-Accra
Tel: 0302244714/244715/244478
Fax: 0302244713
e-mail: [email protected]
No. 32 Farrar Avenue Adabraka,
Sikkins Paint Building
35 Goodwill Insurance Brokers Limited
P. O. Box KN 57 Kaneshie-Accra
Tel: 0244418495/0204330449
e-mail: [email protected]
Virtues Trust Building, Off Burma Camp Road
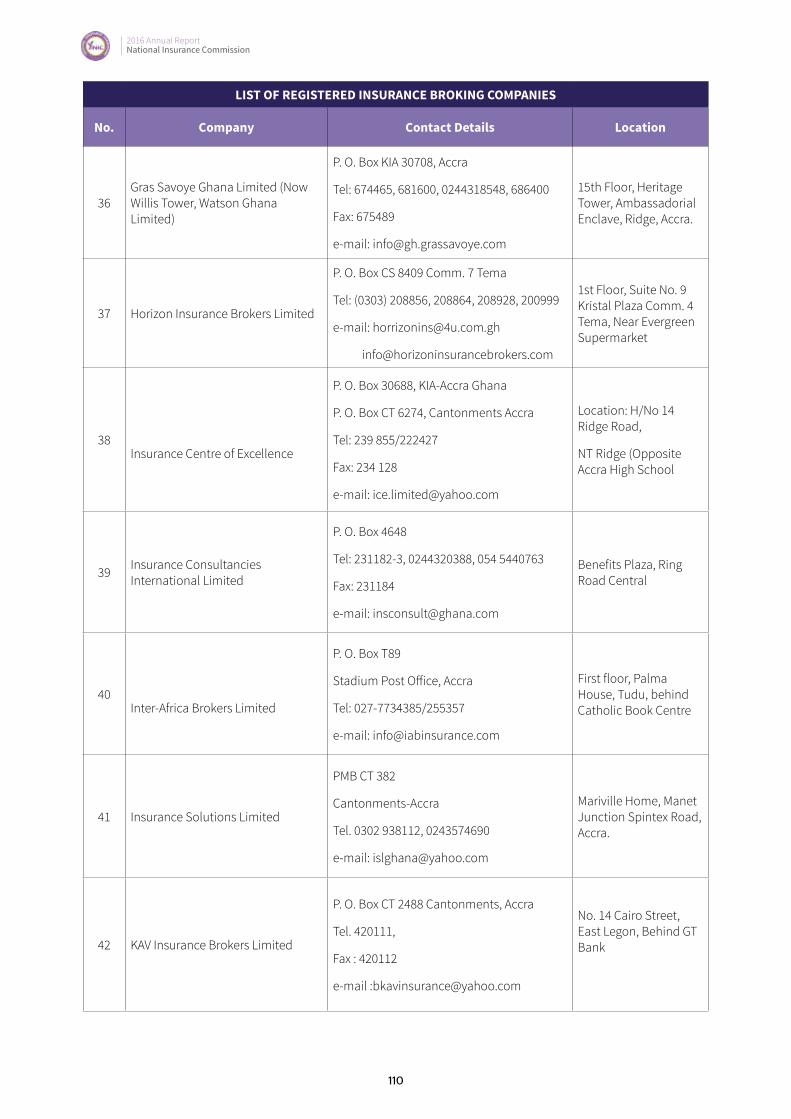
2016 Annual Report National Insurance Commission
110
LIST OF REGISTERED INSURANCE BROKING COMPANIES
No. Company Contact Details Location
36Gras Savoye Ghana Limited (Now Willis Tower, Watson Ghana Limited)
P. O. Box KIA 30708, Accra
Tel: 674465, 681600, 0244318548, 686400
Fax: 675489
e-mail: [email protected]
15th Floor, Heritage Tower, Ambassadorial Enclave, Ridge, Accra.
37 Horizon Insurance Brokers Limited
P. O. Box CS 8409 Comm. 7 Tema
Tel: (0303) 208856, 208864, 208928, 200999
e-mail: [email protected]
1st Floor, Suite No. 9 Kristal Plaza Comm. 4 Tema, Near Evergreen Supermarket
38Insurance Centre of Excellence
P. O. Box 30688, KIA-Accra Ghana
P. O. Box CT 6274, Cantonments Accra
Tel: 239 855/222427
Fax: 234 128
e-mail: [email protected]
Location: H/No 14 Ridge Road,
NT Ridge (Opposite Accra High School
39 Insurance Consultancies International Limited
P. O. Box 4648
Tel: 231182-3, 0244320388, 054 5440763
Fax: 231184
e-mail: [email protected]
Benefits Plaza, Ring Road Central
40Inter-Africa Brokers Limited
P. O. Box T89
Stadium Post Office, Accra
Tel: 027-7734385/255357
e-mail: [email protected]
First floor, Palma House, Tudu, behind Catholic Book Centre
41 Insurance Solutions Limited
PMB CT 382
Cantonments-Accra
Tel. 0302 938112, 0243574690
e-mail: [email protected]
Mariville Home, Manet Junction Spintex Road, Accra.
42 KAV Insurance Brokers Limited
P. O. Box CT 2488 Cantonments, Accra
Tel. 420111,
Fax : 420112
e-mail :[email protected]
No. 14 Cairo Street, East Legon, Behind GT Bank

2016 Annual Report National Insurance Commission
2016 Annual Report National Insurance Commission
111
LIST OF REGISTERED INSURANCE BROKING COMPANIES
No. Company Contact Details Location
43 KEK Insurance Brokers Limited
P. O. Box 6681, Accra-North
Tel: 764023, 764573, 764390, 770614
Fax: 764138, 764210
e-mail:[email protected]
Broking House No.40/41, Senchi St., Aviation Road, Airport Residential Area, Accra
44 Khols & Hols Insurance Brokers & Management Consultants
P. O. Box
Tel: 0266812600/0266335735
e-mail: [email protected]
www.kholsinsurancebrokers.com
Nana Swiss House Plot No. 14 Community 16 Lashibi, Tema
45 Liberty Insurance Brokers Co. Limited
P. O. Box CT 8092, Accra
Tel : 020 8184215
Fax :
e-mail : [email protected]
4th Floor of Dufie Towers, 1st Junction, Teshie-Nungua Estate
46 Lordship Insurance Brokers
P. O. Box 1144 Achimota Market
Tel: 781435/781774
Fax: 770432
e-mail: [email protected]
www.lorshipin.com
F&D Court, H/N C140 Motorway Extension, Abelemkpe
47 M&G Insurance Brokers Limited
P. O. Box GP2913, Accra
Tel: 254647
Fax: 254649
e-mail: [email protected]
5th Floor, Sethi Plaza
123 Kwame Nkrumah Avenue, Adabraka
48 Maxpal Intermediaries
P. O. Box SD 79, Stadium Post Office Accra
Tel: 232795/241216
Fax: 232795
e-mail: [email protected]
B219/10 B10 street, Awudome
Kaneshie

2016 Annual Report National Insurance Commission
112
LIST OF REGISTERED INSURANCE BROKING COMPANIES
No. Company Contact Details Location
49 Metrix Brokerage Limited
P. O. Box CT 3865 Cantonments
Tel: 0303932305/932308
e-mail: [email protected]
www.metrixbrokerage.com
Behind the Trade Fair at the back of Goil Filling Station
50 MIDAS Insurance Brokers Limited
P. O. Box AN 10554 Accra-North
Tel: 255168
Fax: 258667
e-mail: [email protected]
Plot No. A10, Awudome Roundabout, Kaneshie
51 Multinational Insurance Brokers
P. O. Box KA 30223 Airport, Accra
Tel: 0289013928
e-mail: [email protected]
No. 13 Star Avenue, Kokomlemle
52 NDL Insurance Consult
P. O. Box GP 1388 Accra, Ghana
Tel: 0202019973/0302967330
Fax: 0302760404
e-mail: [email protected]
F618/2 Anu Mensa Street, Near VRA Clinic, Osu
53 Novelty Insurance Brokers LimitedP. O. Box AF 1383 Adenta
Tel: 268002
Superior Oil Office Complex Ampomah Junction
54 Oak Insurance BrokersP. O. Box KN, 5111 Kaneshie, Accra
Tel: 0302230060
House No. 6, Obutu Road
Accra New Town
55 Premier Brokers & Consultants
P. O. Box DS 1632 Dansoman, Accra.
Tel: 915111, 918011, 028 9540270
Fax: 224804
e-mail:[email protected]
Marble House, South Industrial Area, Accra
56 Progressive Insurance Brokers Limited
P. O. Box GP 14438 Accra Central
Tel: 237058, 020-2018102
Anum Yemoh Place, East Legon, Accra

2016 Annual Report National Insurance Commission
2016 Annual Report National Insurance Commission
113
LIST OF REGISTERED INSURANCE BROKING COMPANIES
No. Company Contact Details Location
57 Prudent Insurance Brokers Limited
P. O. Box AN 8118 Accra-North
Tel: 020-8157160,0244-767037, 0244-883991, 240818
Fax: 240882
e-mail: [email protected]
Hse. No. 520/4, Jones Nelson Street, Adabraka, Accra
58 Riscovery Limited
P. O. Box GP 13596
Accra
Tel : 0244269936
Fax : 0268089949
e-mail : [email protected]
309/17 Abavana Junction, Kotobabi
59 Risk Management and Advisory Services
P. O. AN 12331
Accra- North
Tel. 816390, 816389, 024415834, 0208128369
e-mail :[email protected]
No. 120B Spintex Rd, Industrial Area
60 Safeguard Insurance Brokers Limited
P. O. Box CT 1345 Cantonments, Accra
Tel: 0302784829/784513/0206850886
e-mail: [email protected]
6 Osu Duku Street, Osu, Accra
61 Safety Insurance Brokers Ltd.
P. O. Box OS 2912 Osu, Accra
Tel. 761944, 786603, 024376965
Fax: 786602
e-mail: [email protected]
2nd Floor, Blue Chip Building
62 Shield Insurance Brokers Limited
P. O. Box GP 13197, Accra.
Tel: 0243761632, 0544356888, 953055, 519651
Fax: -
e-mail: [email protected]
Kangaroo House, Adjacent Fly over, Manet Court

2016 Annual Report National Insurance Commission
114
LIST OF REGISTERED INSURANCE BROKING COMPANIES
No. Company Contact Details Location
63 Saviour Insurance Brokers & Consultants
P. O. Box 468, Accra
Tel: 224559 /0277426580
e-mail:
Kanda, East Ayawaso, Accra
64 Trans-National Brokers Limited
P. O. Box 17841, Accra
Tel/Fax: 024 4272060, 0209420518
Fax : 235603, 949803
e-mail: [email protected]
C154/19 Tesano Business Centre Opposite Santana Market, Tesano
65 Trinity Insurance Brokers Ltd.
P. O. Box GP 1800
Accra
Tel. 764117, 764018
Fax : 764130
e-mail : [email protected]
Cantonments Rd. Opposite St Thomas School, Osu.
66 Tri-Star Insurance Services Limited
P. O. Box 12566, Accra-North
Tel: (233-21)244861, 256183, 220302
Fax: 220319
e-mail: [email protected]
No. 14, Naa Ata Street, Tesano, Accra
67 Universal Insurance Consultants Ltd.
P. O. Box CT 117, Cantonments, Accra.
Tel: 222076/229362
Fax: 233944
e-mail:[email protected]
1st Floor, Standard Chartered Bank Building
Adabraka
68 UGroup Insurance Brokers
P. O. Box AN 16664
Accra-North
Tel : 02082453
e-mail :
www.ugroup.com
House No. C352, Dome, Accra.
69 Visal Insurance Brokers Limited
P. O. Box CT 4219
Tel : 0244644155
e-mail : [email protected]
Plot No. 46, 48 Boundry Road, Near UBA Bank, America House, East Legon
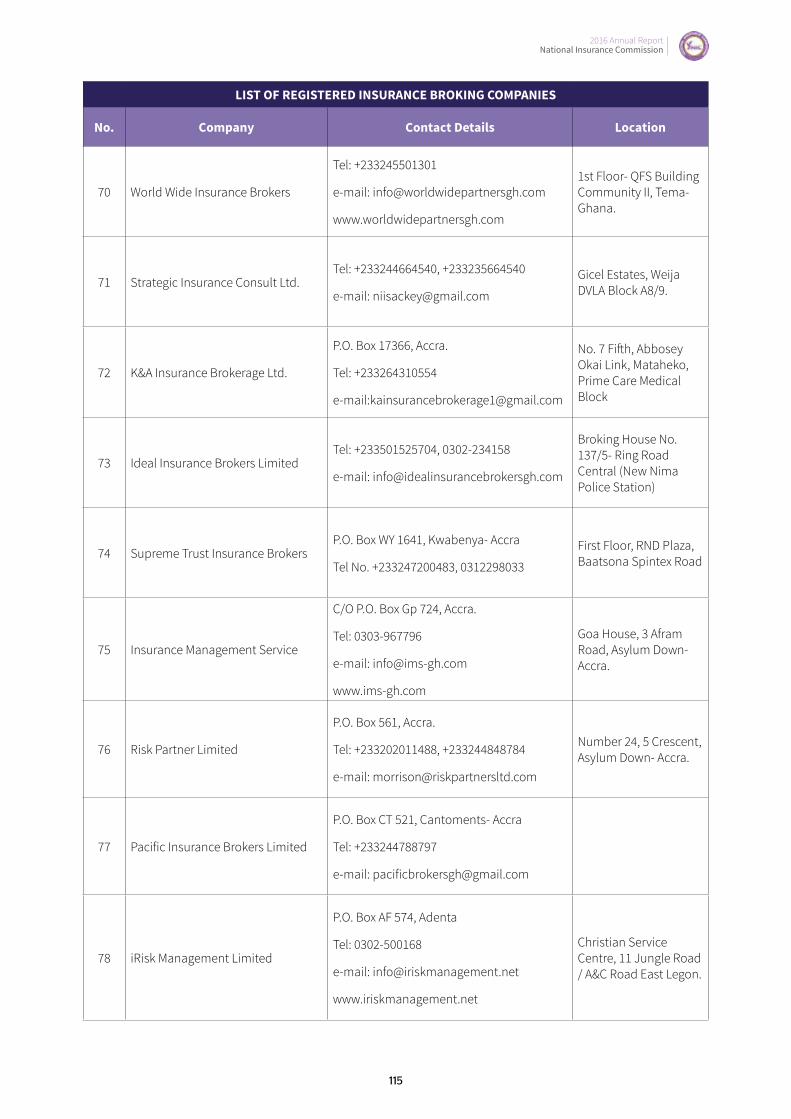
2016 Annual Report National Insurance Commission
2016 Annual Report National Insurance Commission
115
LIST OF REGISTERED INSURANCE BROKING COMPANIES
No. Company Contact Details Location
70 World Wide Insurance Brokers
Tel: +233245501301
e-mail: [email protected]
www.worldwidepartnersgh.com
1st Floor- QFS Building Community II, Tema- Ghana.
71 Strategic Insurance Consult Ltd.Tel: +233244664540, +233235664540
e-mail: [email protected]
Gicel Estates, Weija DVLA Block A8/9.
72 K&A Insurance Brokerage Ltd.
P.O. Box 17366, Accra.
Tel: +233264310554
e-mail:[email protected]
No. 7 Fifth, Abbosey Okai Link, Mataheko, Prime Care Medical Block
73 Ideal Insurance Brokers LimitedTel: +233501525704, 0302-234158
e-mail: [email protected]
Broking House No. 137/5- Ring Road Central (New Nima Police Station)
74 Supreme Trust Insurance BrokersP.O. Box WY 1641, Kwabenya- Accra
Tel No. +233247200483, 0312298033
First Floor, RND Plaza, Baatsona Spintex Road
75 Insurance Management Service
C/O P.O. Box Gp 724, Accra.
Tel: 0303-967796
e-mail: [email protected]
www.ims-gh.com
Goa House, 3 Afram Road, Asylum Down- Accra.
76 Risk Partner Limited
P.O. Box 561, Accra.
Tel: +233202011488, +233244848784
e-mail: [email protected]
Number 24, 5 Crescent, Asylum Down- Accra.
77 Pacific Insurance Brokers Limited
P.O. Box CT 521, Cantoments- Accra
Tel: +233244788797
e-mail: [email protected]
78 iRisk Management Limited
P.O. Box AF 574, Adenta
Tel: 0302-500168
e-mail: [email protected]
www.iriskmanagement.net
Christian Service Centre, 11 Jungle Road / A&C Road East Legon.
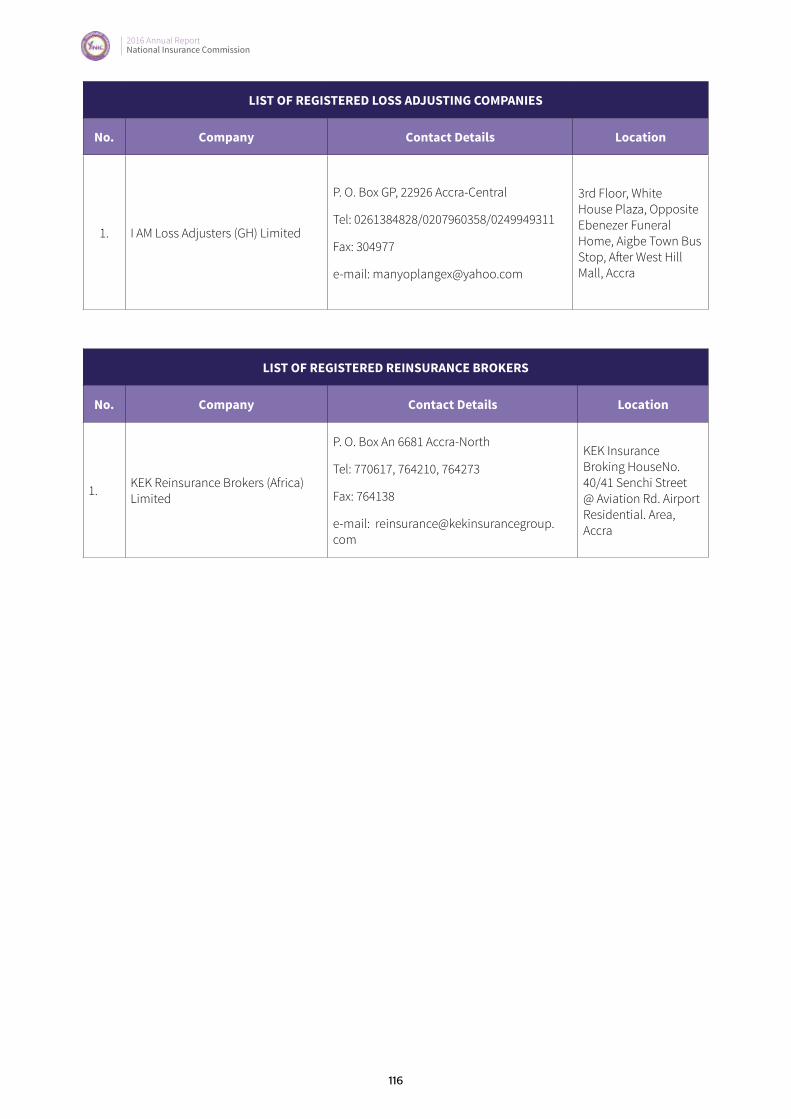
2016 Annual Report National Insurance Commission
116
LIST OF REGISTERED LOSS ADJUSTING COMPANIES
No. Company Contact Details Location
1. I AM Loss Adjusters (GH) Limited
P. O. Box GP, 22926 Accra-Central
Tel: 0261384828/0207960358/0249949311
Fax: 304977
e-mail: [email protected]
3rd Floor, White House Plaza, Opposite Ebenezer Funeral Home, Aigbe Town Bus Stop, After West Hill Mall, Accra
LIST OF REGISTERED REINSURANCE BROKERS
No. Company Contact Details Location
1. KEK Reinsurance Brokers (Africa) Limited
P. O. Box An 6681 Accra-North
Tel: 770617, 764210, 764273
Fax: 764138
e-mail: [email protected]
KEK Insurance Broking HouseNo. 40/41 Senchi Street @ Aviation Rd. Airport Residential. Area, Accra

2016 Annual Report National Insurance Commission
2016 Annual Report National Insurance Commission
117
Notes

NIC | THE INSURANCE SUPERVISOR 27
Insure them against fire, burglary and natural disasters.
NATIONAL INSURANCE COMMISSIONFor More Information, Contact Any Licensed Insurance Company, Broker Or Agent.
INSURANCE AND ITS BENEFITS
Insurance brings the smiles back and helps you stand on your feet again when disaster strikes.
Do you know that the house and properties you
have acquired through much effort and over a
period of time could be lost within a minute?
Insure them against fire, burglary and natural disaster.


desi
gn &
prin
t: Bu
ck P
ress
Ltd
| +2
33-3
02 4
0806
1