15 stats every marketing leader needs to know
TRANSCRIPT
Needs to Know to Grow thei r Business
15 Stats
EVERY MARKETING LEADER
Presented by
We compiled 15 of the biggest takeaways from our 2017 Demand
Benchmarks Report.
U s e t h e m t o s e e h o w y o u r b u s i n e s s m e a s u r e s u p .
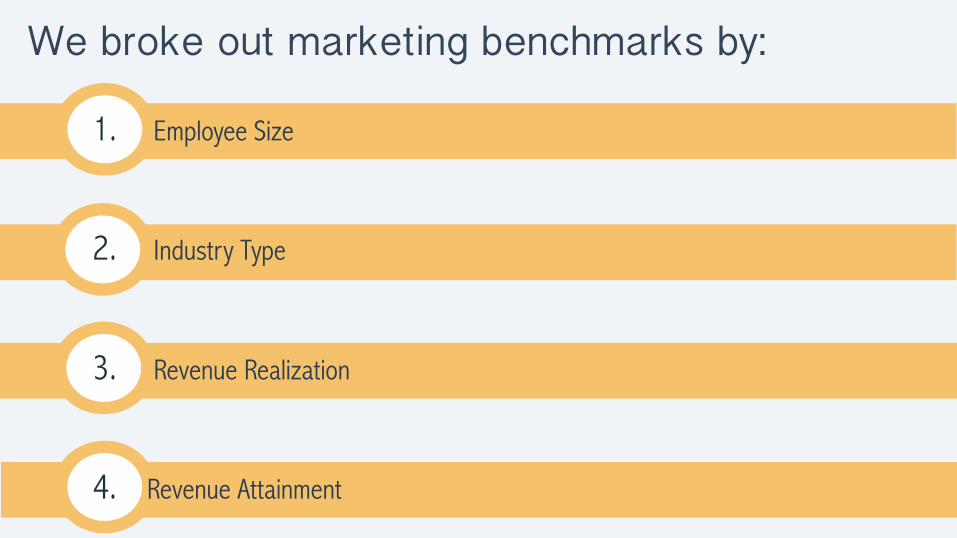
We broke out marketing benchmarks by:
1. Employee Size
2. Industry Type
3. Revenue Realization
4. Revenue Attainment
{ }1 Stats by Employee Size

Not always.
Is bigger better?
Stat #1
68% of businesses from 2 to 50 employees report that they’re exceeding revenue goals.“ “
68% of businesses from 2 to 50 employees report that they’re exceeding revenue goals.“ “
Stat #1
Growth for larger companies however…seems to plateau.

You might be thinking, “What are the smaller
guys doing?”
You might be thinking,
Some are using lower-cost, inbound marketing tactics.
“What are the smaller guys doing?”
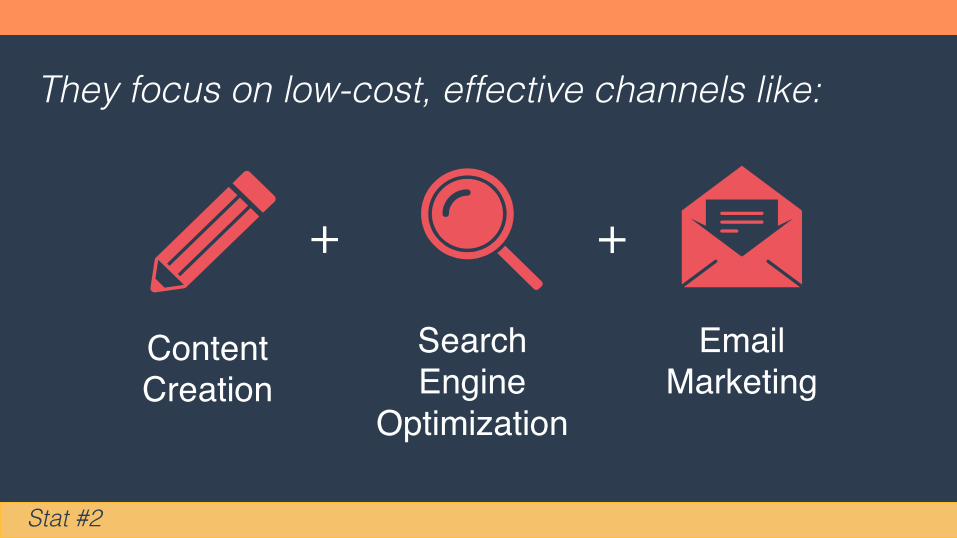
They focus on low-cost, effective channels like:
Content Creation
Search Engine
Optimization
Email Marketing
Stat #2
Organizations of 200+ employees, on the other hand, are slowest to adapt to
content marketing.
Stat #3
Instead, they rely on expensive, outbound methods like paid ads & branding.
This may be one of the reasons they spend 2xas much per lead as companies 200 and under.
$$$$$$$$$$$$$$$$
Stat #4
INBOUND HELPS.In short,
Considering a wider range of marketing tactics can be a
cost-effective route to growth.

Quality.
Where do large companies also
fall short?
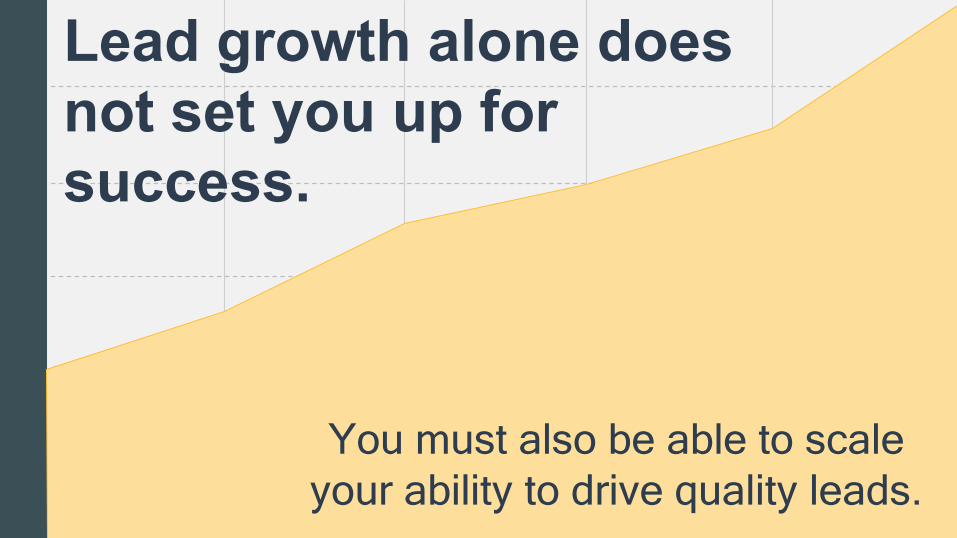
You must also be able to scale your ability to drive quality leads.
Lead growth alone does not set you up for success.
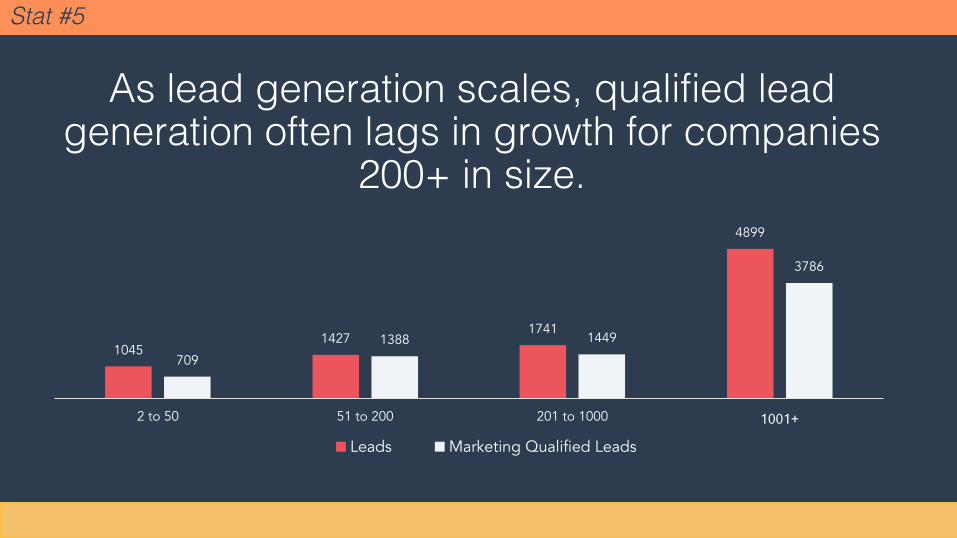
Stat #5
10451427
1741
4899
709
1388 1449
3786
2 to 50 51 to 200 201 to 1000 1001+
Leads Marketing Qualified Leads
As lead generation scales, qualified lead generation often lags in growth for companies
200+ in size.
CAN SCALE YOUR ABILITY TO PUSH LEADS DOWN THE FUNNEL AND QUALIFY DEMAND.
Marketing automation and personalized content

Want to see the full report?Download the Full 2017 Demand
Generation Benchmark Report
Presented by
Want to keep reading on?Go for it
{ }2 Stats by Industry Type

You bet.
Does marketing performance vary
by industry?

If it’s one thing we know for sure –email isn’t dead yet.
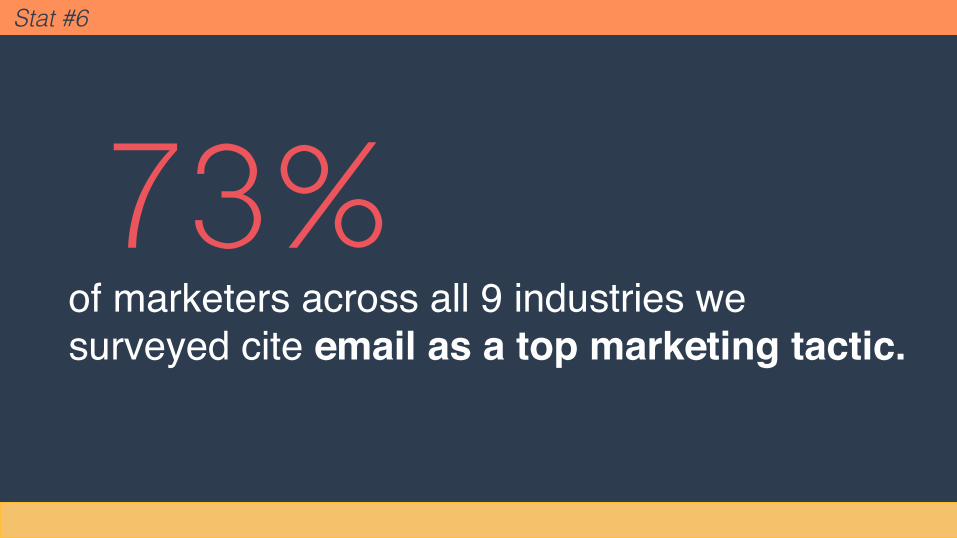
Stat #6
73%of marketers across all 9 industries we surveyed cite email as a top marketing tactic.
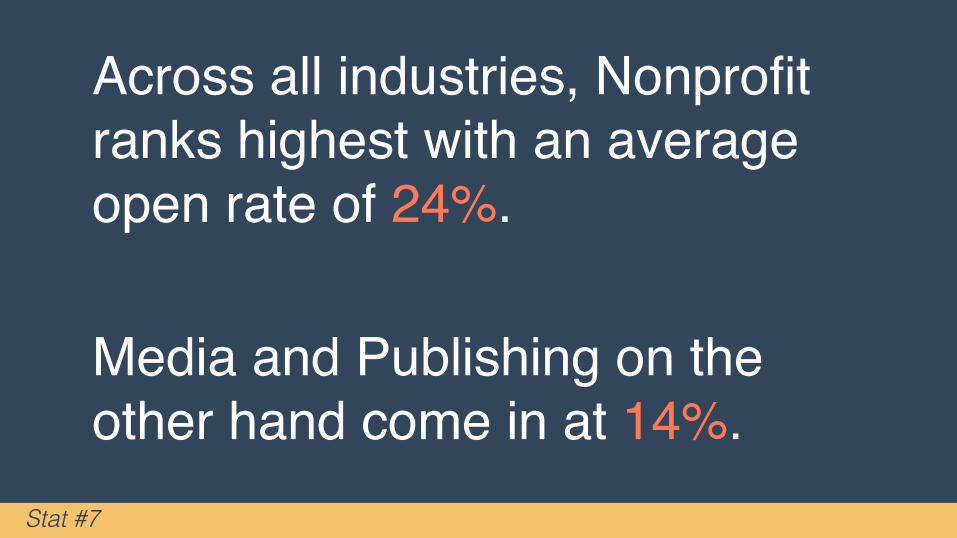
Across all industries, Nonprofit ranks highest with an average open rate of 24%.
Media and Publishing on the other hand come in at 14%.
Stat #7
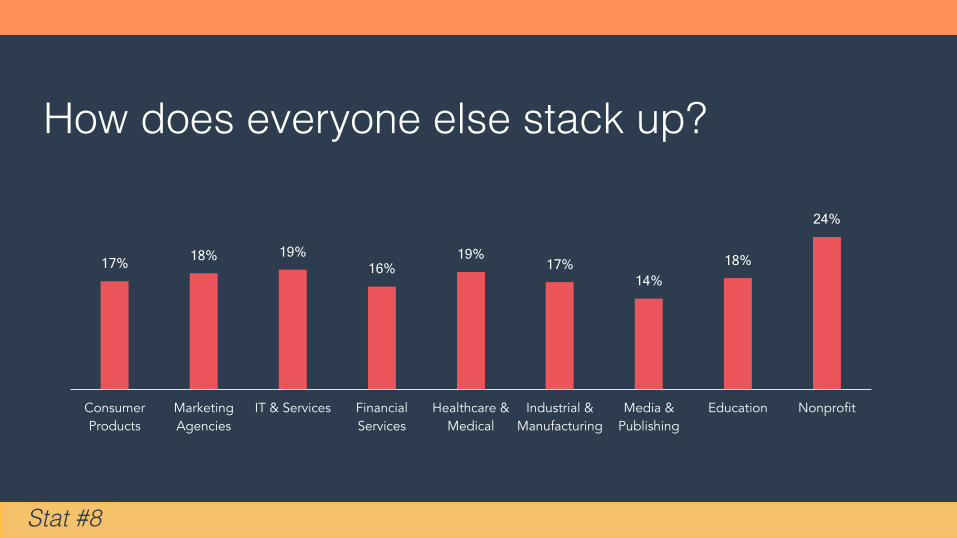
How does everyone else stack up?
Stat #8
17% 18% 19% 16%
19% 17%
14% 18%
24%
Consumer Products
Marketing Agencies
IT & Services Financial Services
Healthcare & Medical
Industrial & Manufacturing
Media & Publishing
Education Nonprofit
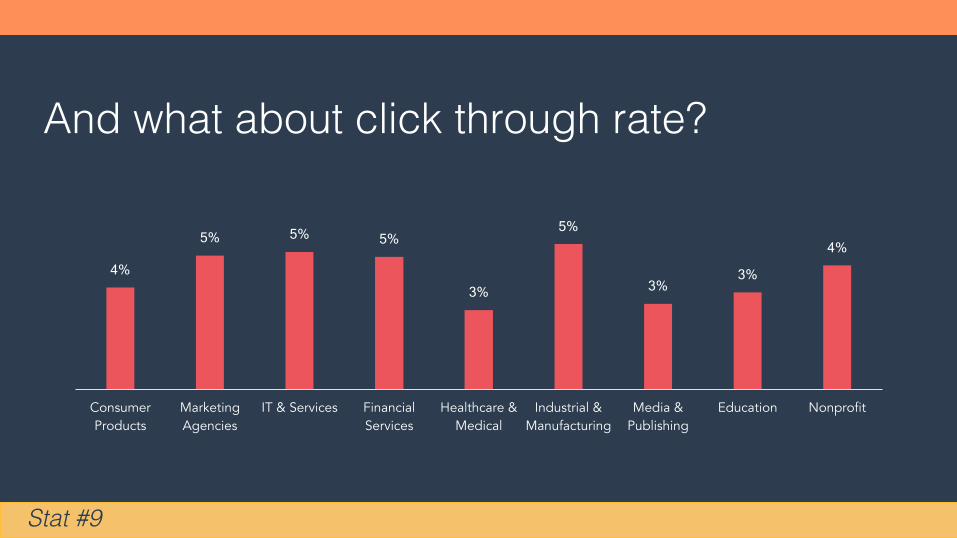
And what about click through rate?
Stat #9
4%
5% 5% 5%
3%
5%
3% 3%
4%
Consumer Products
Marketing Agencies
IT & Services Financial Services
Healthcare & Medical
Industrial & Manufacturing
Media & Publishing
Education Nonprofit

Looking to improve your email or click-through rate?
Use Personalized & Relevant Contentto make sure you’re providing a
unique experience to each reader.
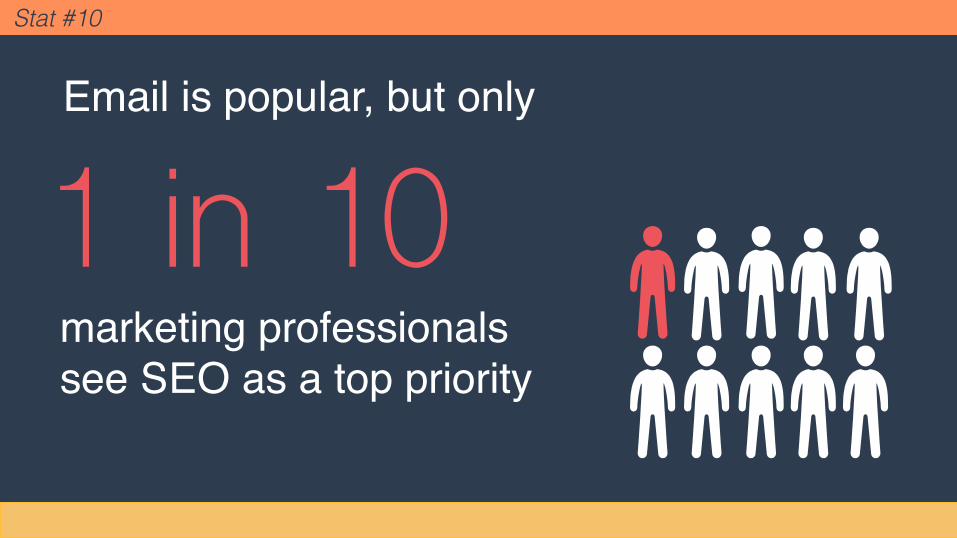
Email is popular, but only
1 in 10marketing professionals see SEO as a top priority
Stat #10
THE FIRST STEP TO GENERATING DEMAND IS GENERATING TRAFFIC
If it’s lead growth companies want…
And a strong SEO strategy is one of the most effective tactics to growing your web presence.

How do qualified leads
stack up by industry?
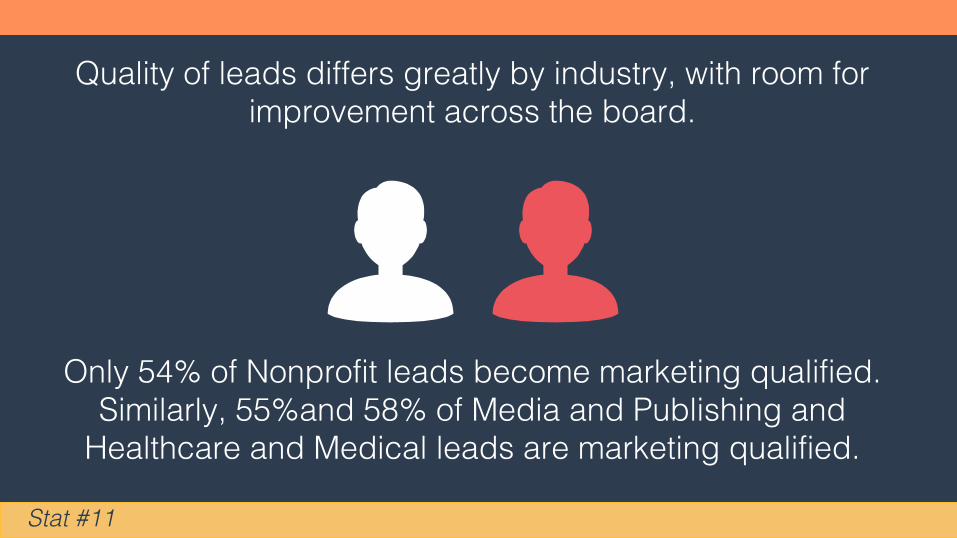
Quality of leads differs greatly by industry, with room for improvement across the board.
Stat #11
Only 54% of Nonprofit leads become marketing qualified. Similarly, 55%and 58% of Media and Publishing and
Healthcare and Medical leads are marketing qualified.

MARKETING AUTOMATIONLeverage
To nurture your leads and drive them through their buyers’ journey.
{ }3 Stats by Revenue Realization

No matter the size or maturity of your business,There’s room to
grow.
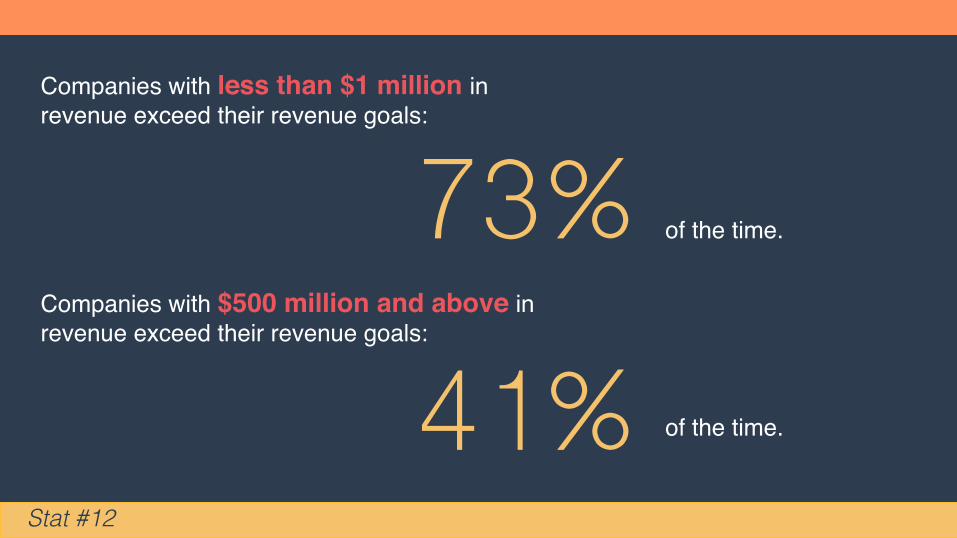
Companies with less than $1 million in revenue exceed their revenue goals:
73% of the time.
Companies with $500 million and above in revenue exceed their revenue goals:
41% of the time.
Stat #12
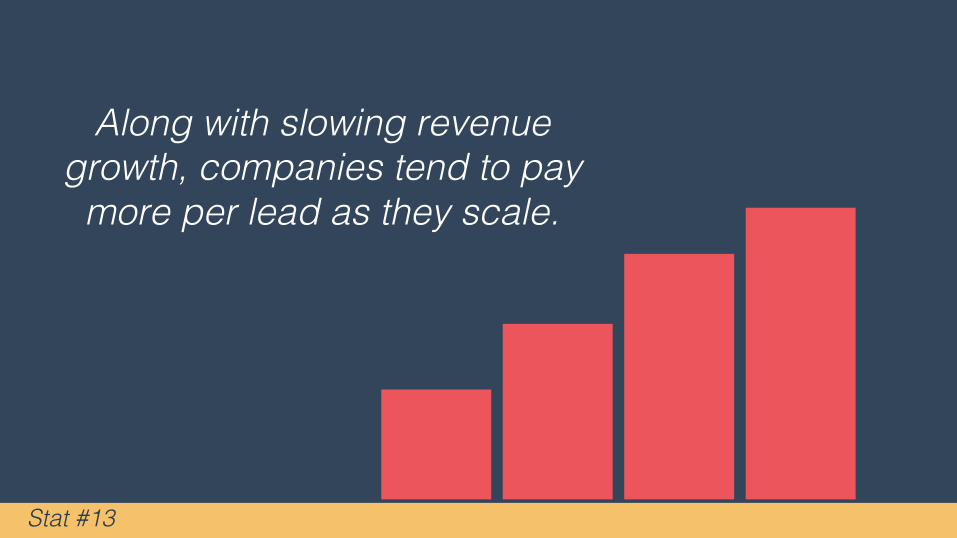
Along with slowing revenue growth, companies tend to pay
more per lead as they scale.
Stat #13
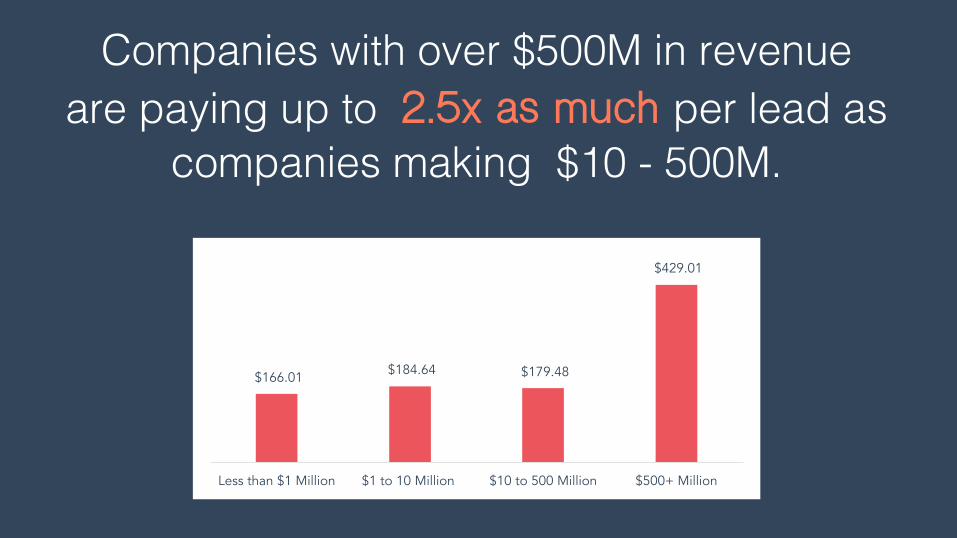
Companies with over $500M in revenue are paying up to 2.5x as much per lead as
companies making $10 - 500M.
$166.01 $184.64 $179.48
$429.01
Less than $1 Million $1 to 10 Million $10 to 500 Million $500+ Million
{ }4 Stats by Revenue Attainment
What are the companies doing that are exceeding their revenue goals?
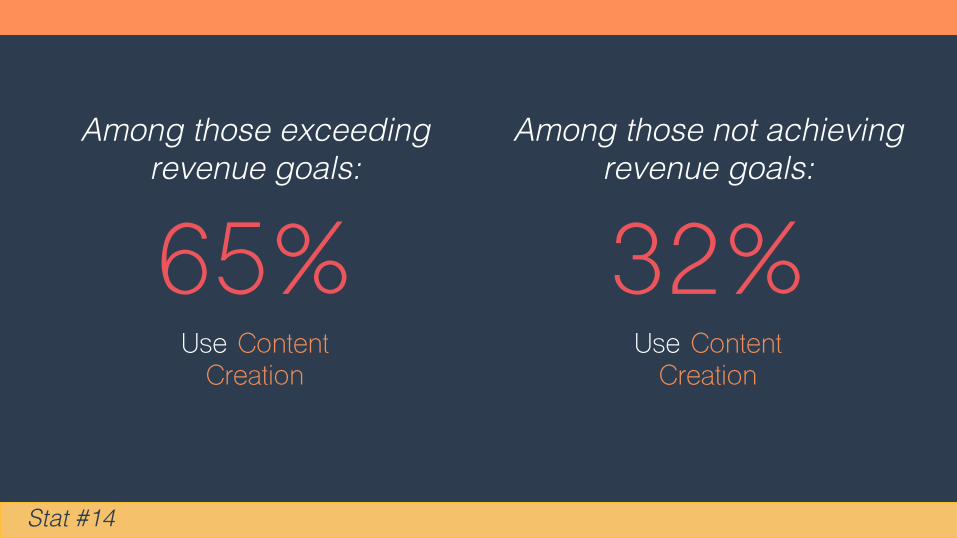
65%
Stat #14
Use Content Creation
Among those exceeding revenue goals:
32%Use Content
Creation
Among those not achieving revenue goals:
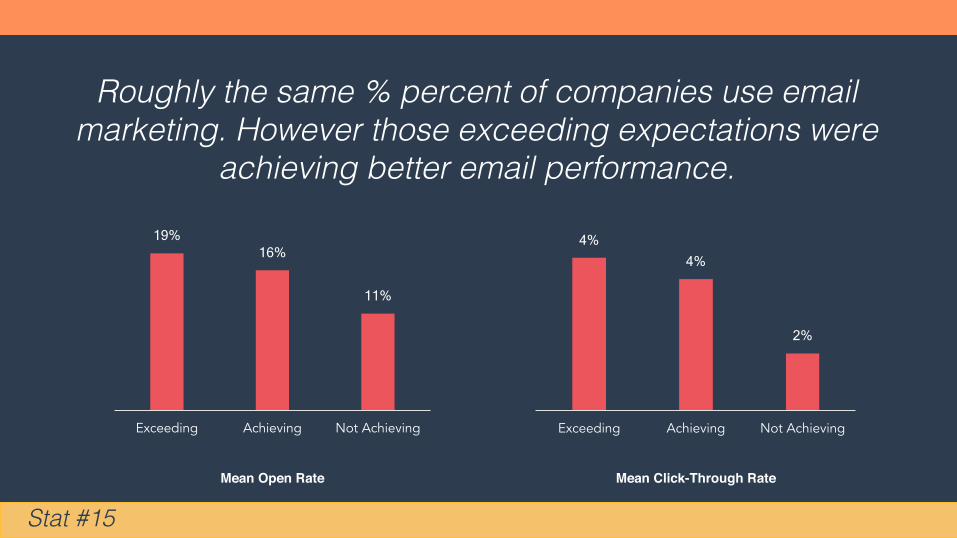
Stat #15
Roughly the same % percent of companies use email marketing. However those exceeding expectations were
achieving better email performance.
19% 16%
11%
Exceeding Achieving Not Achieving
4% 4%
2%
Exceeding Achieving Not Achieving
Mean Open Rate Mean Click-Through Rate

SENDING EMAIL ISN’T GOING TO HELP YOUR BUSINESS GROW
But sending GREAT email just might.

Want to learn more?Download the Full 2017 Demand
Generation Benchmark Report
Presented by
For 50+ charts and graphs with marketing industry benchmarks broken down by company size, industry, and revenue.