1.5 hour powerpoint presentation civilization vs. the oil agegaiapc.ca/pj/howepowerpointbw5.pdfa...
TRANSCRIPT

A M O S T C R I T I C A L S U B J E C T
Civilization vs. the Oil Age
Excerpts from the new book
The End of Fossil Energy and Per Capita Oil (FIFTH EDITION)
This book is available directly from the author: John Howe by email at: [email protected]. And at our website www.solarcarandtractor.com
1.5 Hour PowerPoint Presentation
1

Oil is a Most Important Natural Resource and Absolutely Fundamental to Industrialized Civilization
Oil is finite and non-renewable.
Oil provides the basic energy source for:
• food for seven billion people. • most of the energy for modern transportation. • support of other energy sources. • raw materials for plastics and lubricants.
2

World Per Capita Oil Use
Barrels per person per year 0 5 10 15 20 25
U.S. Gasoline Only*
U.S.
All Western Europe
Russia
World Average
China
Oil
Gasoline
* In the U.S. we consume more gasoline (mostly for transportation) than other countries consume in total combined oil.
3

World Annual Oil Use
0 5 10 15 20 25 30 35
U.S. (gasoline only)
China
Western Europe
U.S.**
World*
Oil Gasoline
Billion barrels
* The world uses one billion barrels of oil every 11 days. ** In the U.S. we use approximately ¼ of the world total oil consumption.
4

0
5
10
15
20
25
30
35
1900 1950 2000 2050 2100 2150
The World Oil Age B
illio
n ba
rrel
s pe
r ye
ar
In the span of two lifetimes we will have consumed almost all of the oil reserves in the world.
I N T W O 8 0 Y E A R L I F E T I M E S
Oil industry forecasts
Peak extraction rate
Typical finite resource decline rate (Hubbert’s bell shaped curve)
1.2 trillion barrels already used in 80 years
1.2 trillion barrels remaining 80 years
2015
5

The U.S. Oil Age
0
1
2
3
4
5
6
7
8
1900 1950 2000 2050 2100 2150
Bill
ion
barr
els
per
year
U.S. consumption rate grew while our extraction rates (including fracking and nonconventional) remained relatively the same.
I N T W O 8 0 Y E A R L I F E T I M E S
“Fracking” and other expensive non-conventional sources
2015
Consumption
Extraction
6

World Population Growth
0 10 20 30 40 50 60 70 80
1900 1950 2000 2050 2100 2150
The present world population growth rate is 1.8 children per female. Even if we reduce the growth rate to 1 child per female we still have a food gap between the
global availabity of oil and the number of people who need it to survive.
Bill
ions
of p
eopl
e
I N T W O 8 0 Y E A R L I F E T I M E S
0 child per female
1 child per female
2 child per female
food gap
Bill
ions
of b
arre
ls o
f oil
per
year
35
25
15
5 2015
oil extraction rate
7
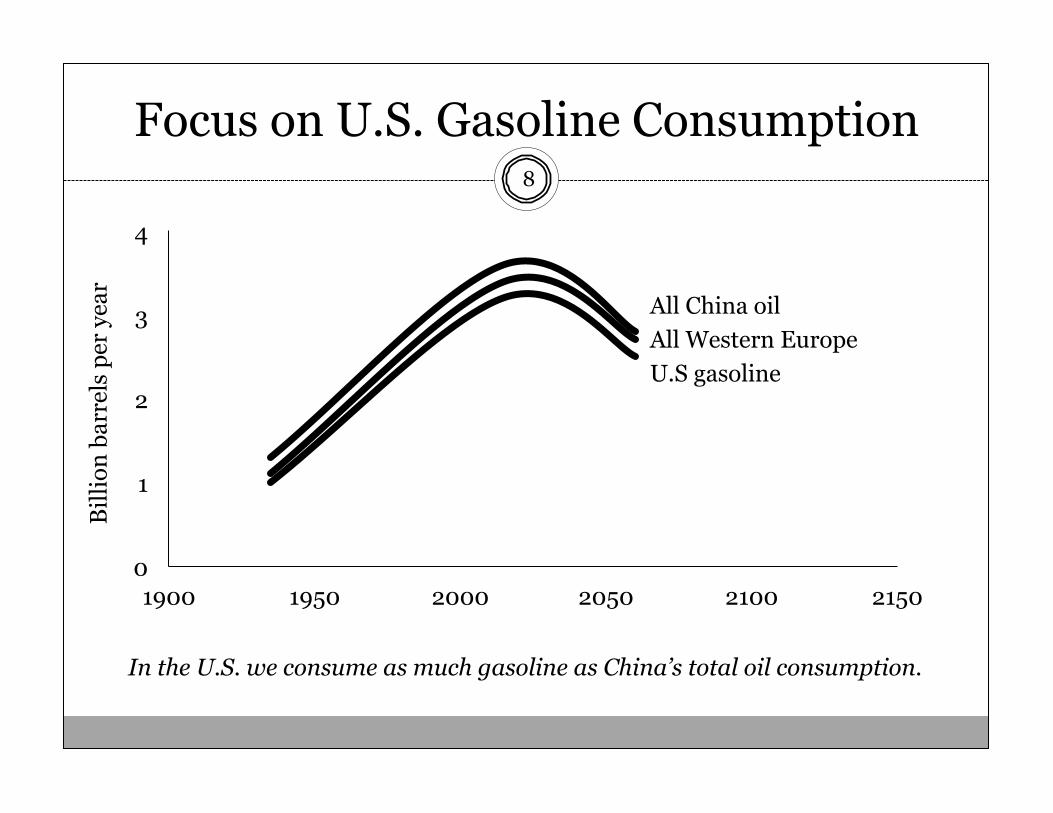
Focus on U.S. Gasoline Consumption
0
1
2
3
4
1900 1950 2000 2050 2100 2150
Bill
ion
barr
els
per
year
In the U.S. we consume as much gasoline as China’s total oil consumption.
U.S gasoline All Western Europe All China oil
8

Time Remaining in the Oil Age
0 5 10 15 20 25 30 35 40
U.S. Oil Age
U.S. Oil Age
Total World Oil Age
7 years left at the present consumption rate
Years
(½ from U.S. and ½ from rest of world, as now)
(All from U.S.)
49 billion barrels left in U.S. (optimistic) Divided by 7 billion barrels per year Equals 7 years
9

Percent of All World Energy
0 5 10 15 20 25 30 35
Wind and solar
Biofuel
Hydro
Nuclear
Natural gas*
Coal*
Oil*
* Oil, coal, and natural gas are finite and contribute to elevated levels of greenhouse gas.
Percent (%)
Depend on oil and non-renewable metals
Cannot be increased
Finite energy sources
Renewable energy sources
10

U.S. Liquid Fuel Consumption
0 1 2 3 4 5 6 7 8
Everything else**
Jet fuel
Distillate*
Gasoline
Total
* Diesel and heating oil. ** Including support of other energy sources.
Billion barrels per year
11

The Case for 50% Gasoline Rationing
0 1 2 3 4
All Russia oil
All Japan oil
All China oil
50% reduction in use
All gasoline use
Compared to:
Billion barrels per year
12

Other Positives for Gasoline Rationing
• Consumption of 400 million gallons per day. 50% reduction to 200 million gallons per day.
• 200 million gallons per day x $3 per gallon = $600 million per day or $0.22 trillion per year back into economy.
• Gasoline rationing would encourage mass transportation, electric cars, and bicycles.
• Gasoline rationing would lower the cost of oil for other needs.
• Gasoline rationing electronic swipe cards could be saved or sold.
13

Gasoline Rationing vs. all CO2 Sources
World total: 36 billion metric tons per year 1/3 from China: 10.5 billion tons
1/7 from U.S.: 5.3 billion tons U.S. coal: 1.7 billion tons
U.S. natural gas: 1.4 billion tons U.S. liquid fuels: 2.2 billion tons
(including U.S. gasoline 1.1 billion tons)
50% gas rationing reduction = 0.5 billion metric tons per year
= 5% of all China’s or 10% of all U.S. CO2 emissions
14

Other Directly Related Issues
Chapter 3 • A call for personal involvement • Educate yourself, see Bibliography, websites • Join mass movements • Get into gardening • Have a stand-alone solar survival system Chapter 5 • A solar electric future, potential and limitations:
cars, tractors, airplanes?? 18 wheelers?? • Battery storage, weight, recycling?? • Cost and hazards of lithium
The following chapters refer to the book The End of Fossil Energy and Per Capita Oil
15

Chapter 6 • Population and immigration demographics Chapter 8 • Food availability on world, national, local, and personal scales Chapter 9 • Localization, transition, resilience movements Chapter 10 • The end of economic growth Chapter 11 • The desparate need for decisive leadership • Autocracy vs. democracy? (Plato’s “philosopher king”)
Other Directly Related Issues (continued) 16

Conclusions
• Our civilization is at the tipping point. • Seriously question the future of a child born today. • Climate change is a longer-term and much less
serious problem. • Please help network these thoughts.
John Howe www.solarcarandtractor.com You tube.com/Howe Triple Crisis
17