15-1 copyright © 2008 thomson south-western, a part of the thomson corporation. thomson, the star...
TRANSCRIPT
15-1COPYRIGHT © 2008 Thomson South-Western, a part of The Thomson Corporation. Thomson, the Star logo, and South-Western are trademarks used herein under license.
15-2
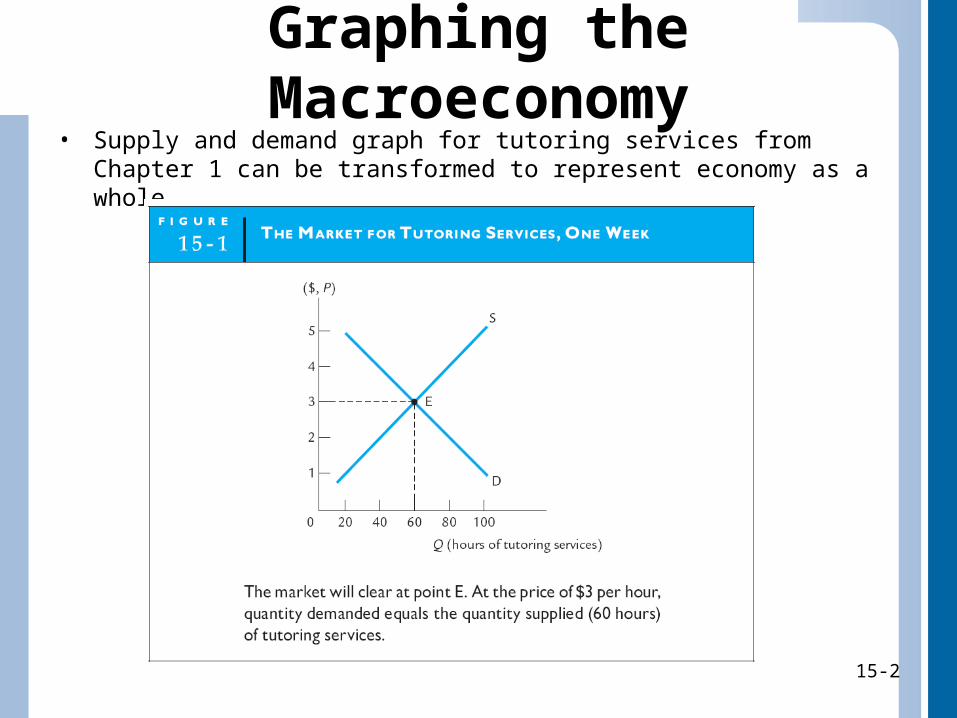
Graphing the Macroeconomy• Supply and demand graph for tutoring services from Chapter 1 can be
transformed to represent economy as a whole
15-2
15-3
Graphing the Macroeconomy (cont.)
15-3
15-4
Graphing the Macroeconomy (cont.)
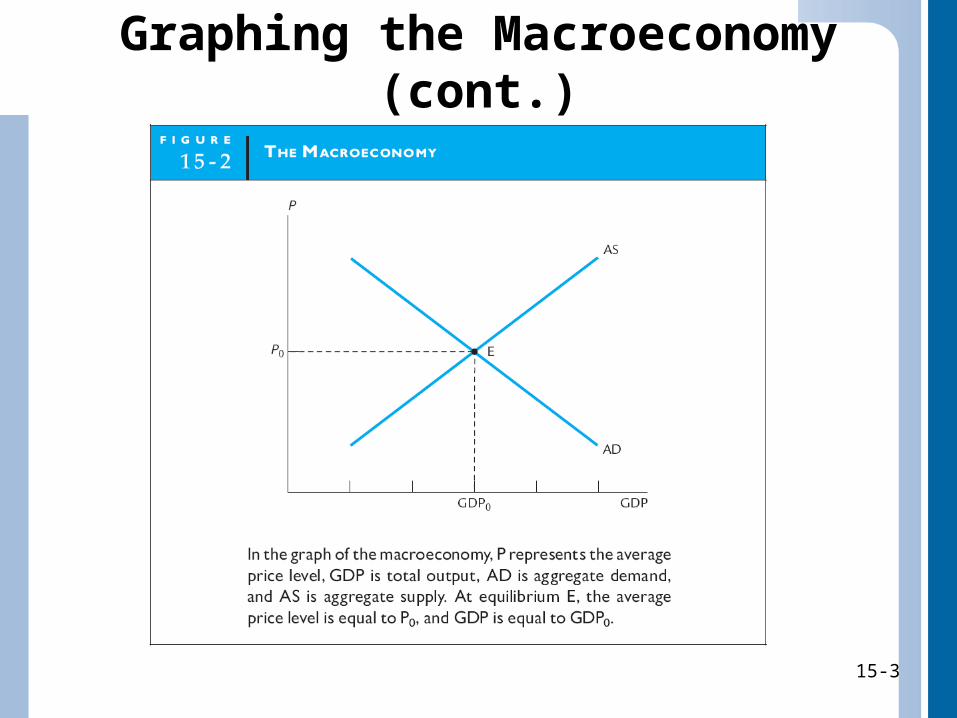
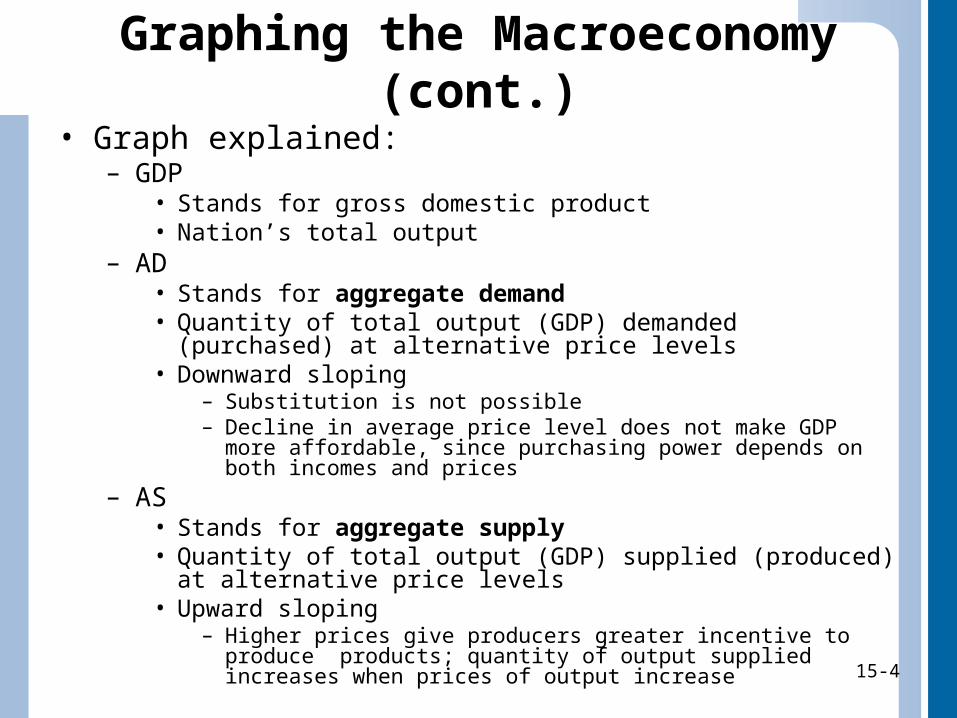
• Graph explained:– GDP
• Stands for gross domestic product• Nation’s total output
– AD• Stands for aggregate demand• Quantity of total output (GDP) demanded (purchased) at alternative
price levels• Downward sloping
– Substitution is not possible– Decline in average price level does not make GDP more affordable,
since purchasing power depends on both incomes and prices– AS
• Stands for aggregate supply• Quantity of total output (GDP) supplied (produced) at alternative
price levels• Upward sloping
– Higher prices give producers greater incentive to produce products; quantity of output supplied increases when prices of output increase
15-4
15-5
Gross Domestic Product• Market value of all final goods and services produced in
economy in given time period, usually one year– Final goods and services include all products as well as services
that are purchased as final products• Example: Purchasing bag of flour at supermarket to bake a cake
and then eat it vs. bakery buying bag of flour to bake a cake and then sell it
– All goods comprising GDP must be produced during particular year
• Example: If you sell your 10-year home this year, value of home does not constitute part of this year’s GDP; but if you employ current services of realtor, value of realtor’s services are included in this year’s GDP
– Necessary to define gross domestic product in value terms, specifically dollars in United States
• Must first attach value to physical quantities of output produced; then can add them up to tabulate total domestic product
– Use market prices to value physical quantities of output» Market price includes retail price of product plus any sales and
excise taxes paid by consumer15-5
15-6
Gross National Product• Market value of all final goods and services
produced by economy over particular time period– Word “by” in definition distinguishes gross national
product (GNP) from gross domestic product (GDP)• Example of GDP: If Mexican citizen comes up to United
States during summer to pick tomatoes, value of these tomatoes would be included in U.S. GDP
– Tomatoes are produced within physical boundaries of U.S.
• Example of GNP: If U.S. citizen makes earrings in Mexico, value of earrings is counted as part of U.S. GNP
– Doesn’t matter where earrings are produced, as long U.S. citizen produces them
15-6
15-7
Real vs. Nominal GDP• Real GDP
– GDP calculated at constant prices (prices that exist in a base year)
• Example: If 1982 is base year, real GDP in 1990 calculated by valuing 1990 production of a product at prices that existed in 1982
– 1990 Real GDP = 1982 prices × 1990 production– Number to use when comparing information over different time
periods– Adjusted for inflation
• Nominal GDP– GDP calculated at current prices (actual prices of a particular
year)• Example: 1990 nominal GDP includes production of product valued
at prices that exist in the year 1990– 1990 Nominal GDP = 1990 prices × 1990 production
– Number to consider when trying to make sense of information for one year only
– Not adjusted for inflation15-7
15-8
Flaws of GDP• Gross domestic product is typically used as
indicator of economic activity, as well as measure of standards of living– When GDP is high, assumption is that economy is
doing well and that standards of living are high
– When GDP is growing over time, assumption is that economic activity and standards of living are increasing
• Some flaws in these assumptions– The following make GDP an imperfect measure of economic
activity and standards of living:» Nonmarket activities» Underground economy» Distribution and composition of national output
15-8
15-9
Nonmarket Activities• Exclusion of nonmarketed goods and services serves to
understate full value of productive activity in economy
• Exclusion of nonmarketed goods and services also distorts comparisons– During 1950s, most women stayed home as full-time
homemakers, but in 1990s, many women had entered formal labor market, paying out money for services that they had previously provided themselves
• Comparisons of countries’ GDPs distorted as well– In many Third World countries, many families grow own food,
build own homes, and gather own water and fuel; GDP statistics are very low in part because many of these nonmarketed activities go unreported
15-9
15-10
Underground Activities• Underground economy involves economic
activity that is never reported to government, either because activity is illegal or participants wish to evade taxes– Such underground activity causes GDP to understate
actual economic activity
• Similarly, any time person engages in under-the-table exchange, usually to avoid payment of personal income taxes, activity is not recorded and therefore doesn’t enter GDP statistics
15-10
15-11
Composition and Distribution• Composition of GDP
– Goods and services of which GDP consists• Example: If small country primarily produces armaments and
other military hardware, its people may not be achieving same quality of life as those of another country that has similar level of GDP but primarily produces health care, educational services, and other goods and services directly meeting needs of people
• Distribution of income– How national income is distributed within economy
• Makes a great deal of difference whether nation’s income flows primarily to small, select, elite group of people or is distributed more equally within country
15-11
15-12
Aggregate Demand
• Will increase whenever any of following sectors increase purchases:– Consumers– Businesses– Government– Foreign purchasers
15-12
15-13
Consumers
• Individual consumers purchase U.S. durable and nondurable goods and services– Durable goods
• Products with life of longer than one year
– Nondurable goods• Products with life of less than one year
• Consumer purchases represent largest component of aggregate demand
15-13
15-14
Consumers (cont.)• Consumers will increase purchases of goods
and services as result of variety of factors:– When consumer incomes rise, consumer purchases
go up– When consumer expectations of future improve,
consumer purchases go up– Government policies to reduce personal income taxes
will serve to increase consumer incomes because what is left after paying taxes will be higher
– Government policies that increase government income transfers will increase consumer incomes
– When interest rates fall, cost of borrowing money declines; consumers more willing to purchase expensive items that they must buy with borrowed money
15-14
15-15
Businesses• Private business firms in economy also purchase U.S.
GDP– Examples: Computers, office buildings, etc.
• Businesses “purchase” changes in inventories (unsold goods and materials)– Business normally holds variety of inventories
• Increases or decreases in inventories included in aggregate demand as business purchases
• Business purchases are relatively small component of aggregate demand, but tend to fluctuate a lot
• Business purchases influenced by variety of factors:– If economy is improving and businesses expect sales to boom,
may begin purchasing more inventory now to meet future consumer demand
– Decline in interest rates means that new inventory is cheaper and easier for businesses to buy
15-15
15-16
Government• Government purchases goods, services, and
structures• Only government purchases of U.S. GDP are
represented along aggregate demand curve• Income transfers not included in category of
government purchases of goods and services– Cash transfers from government for which no good or
service is provided in return• Examples: Social Security benefits, unemployment
compensation, etc.
• Any increase in government purchases will increase aggregate demand
15-16
15-17
Foreign Purchasers
• Foreigners purchase some of our production, ranging from around 8 to 12 percent of U.S. GDP in recent years– Include individual people, businesses, and
governments of other countries• Refer to their purchases as U.S. exports
– Anything that causes our exports to increase will result in increase in aggregate demand
15-17
15-18
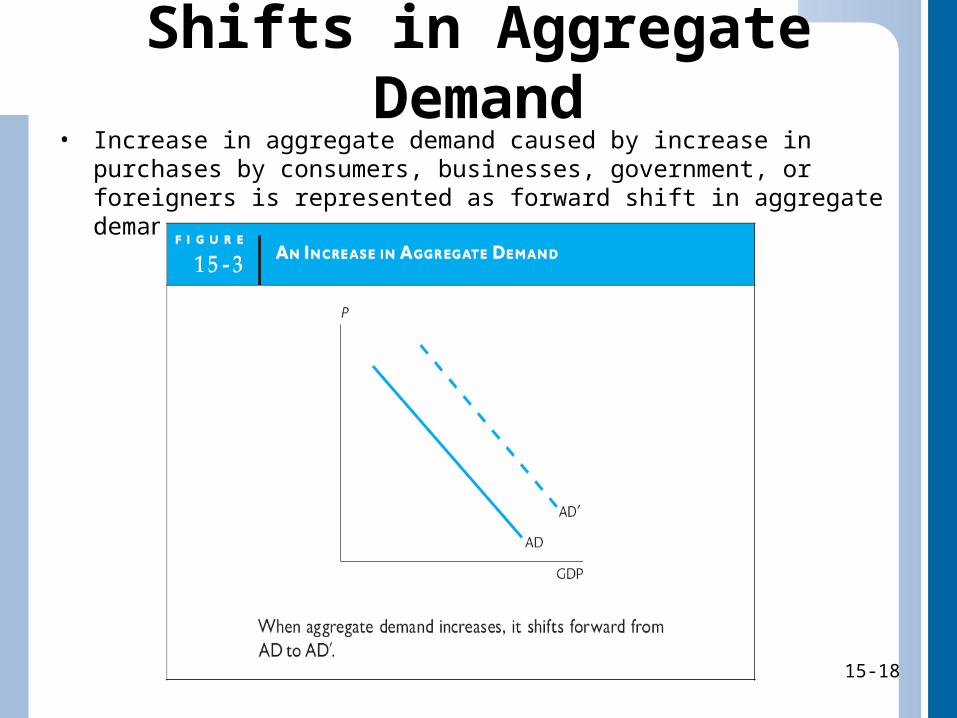
Shifts in Aggregate Demand• Increase in aggregate demand caused by increase in purchases by
consumers, businesses, government, or foreigners is represented as forward shift in aggregate demand
15-18
15-19
Shifts in Aggregate Supply
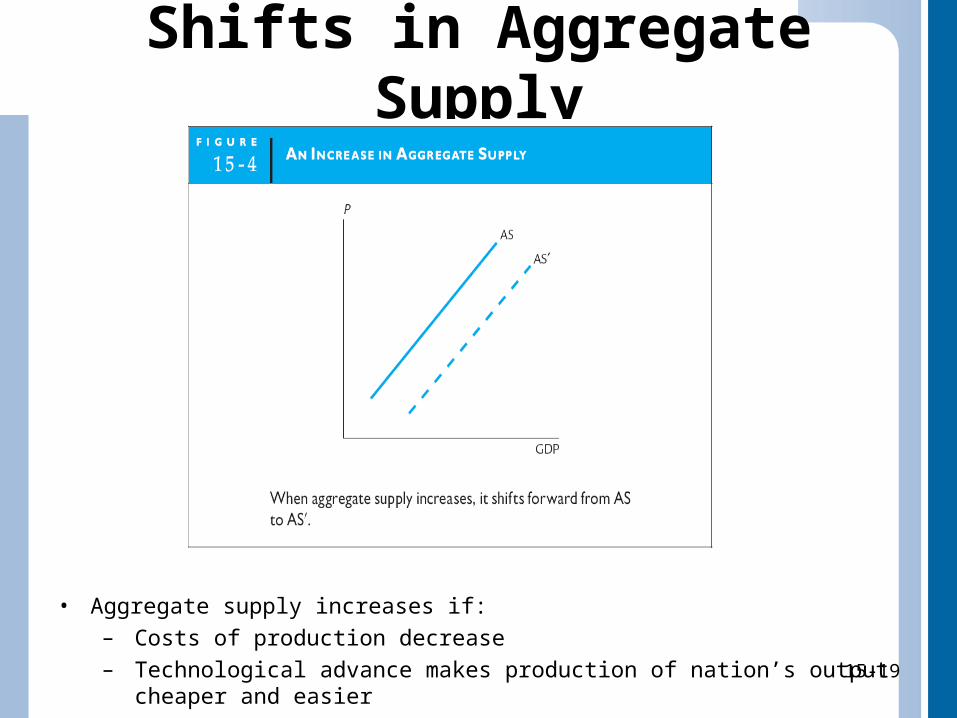
• Aggregate supply increases if:
– Costs of production decrease
– Technological advance makes production of nation’s output cheaper and easier
15-19
15-20
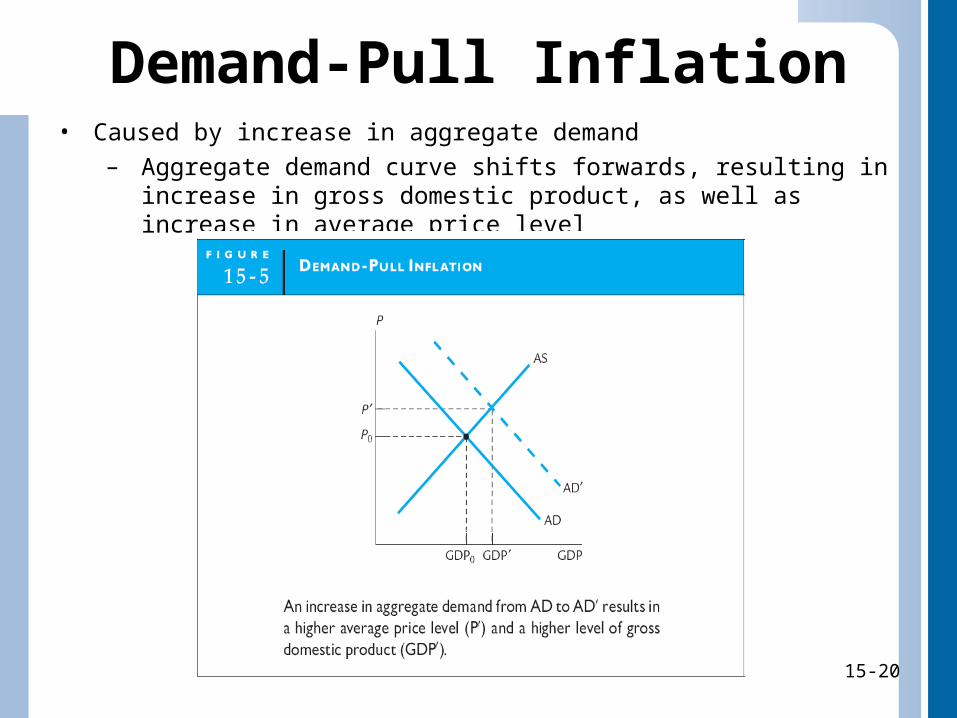
Demand-Pull Inflation• Caused by increase in aggregate demand
– Aggregate demand curve shifts forwards, resulting in increase in gross domestic product, as well as increase in average price level
15-20
15-21
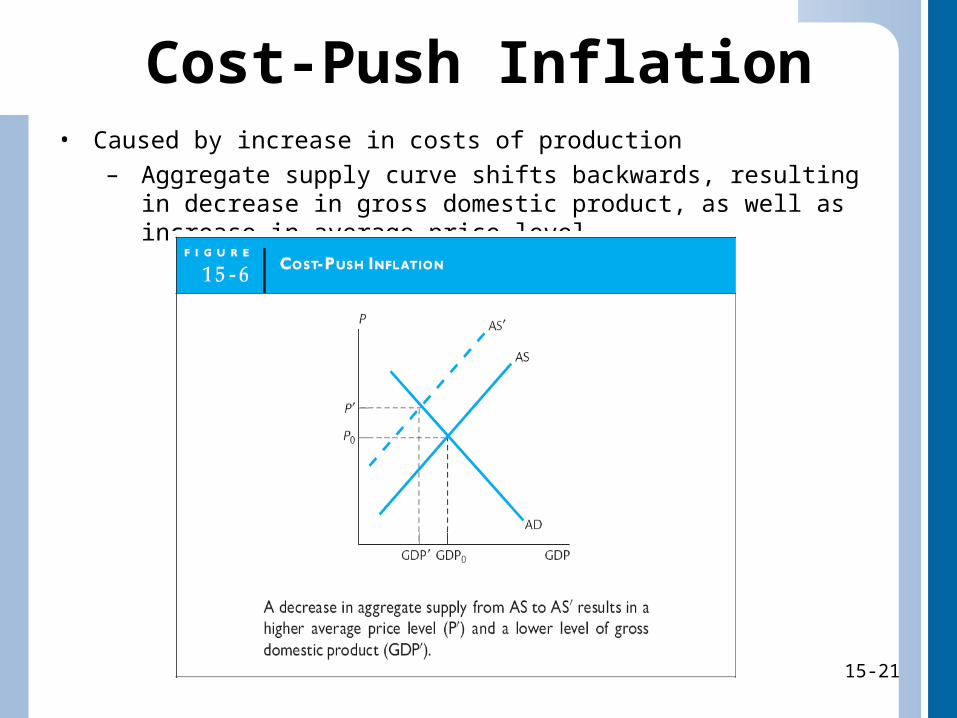
Cost-Push Inflation• Caused by increase in costs of production
– Aggregate supply curve shifts backwards, resulting in decrease in gross domestic product, as well as increase in average price level
15-21
15-22
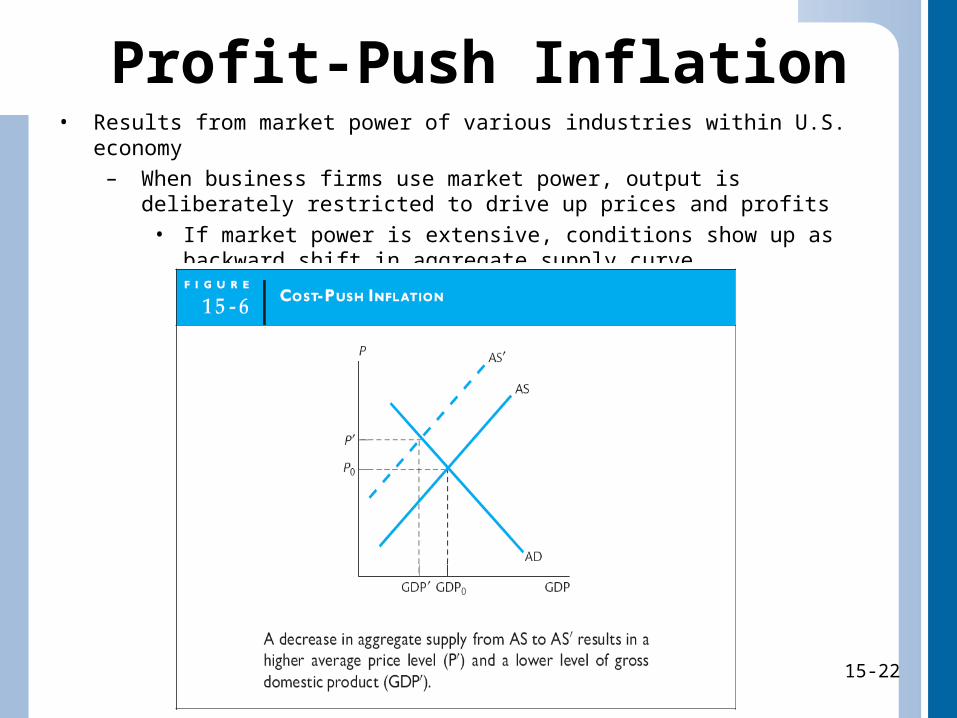
Profit-Push Inflation• Results from market power of various industries within U.S. economy
– When business firms use market power, output is deliberately restricted to drive up prices and profits
• If market power is extensive, conditions show up as backward shift in aggregate supply curve
15-22
15-23
Fiscal Policy
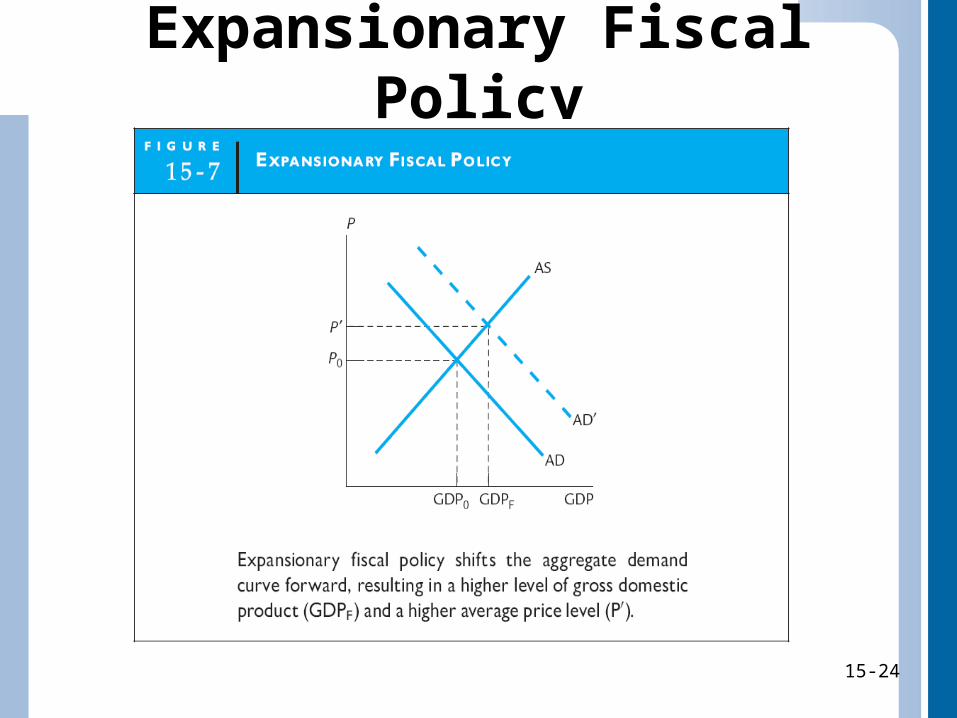
• Use of government spending and tax policy to shift aggregate demand curve
• Can be either expansionary or contractionary– Expansionary fiscal policy
• Increases aggregate demand, thereby expanding GDP
– Contractionary fiscal policy• Decreases aggregate demand, thereby
contracting GDP
15-23
15-24
Expansionary Fiscal Policy
15-24
15-25
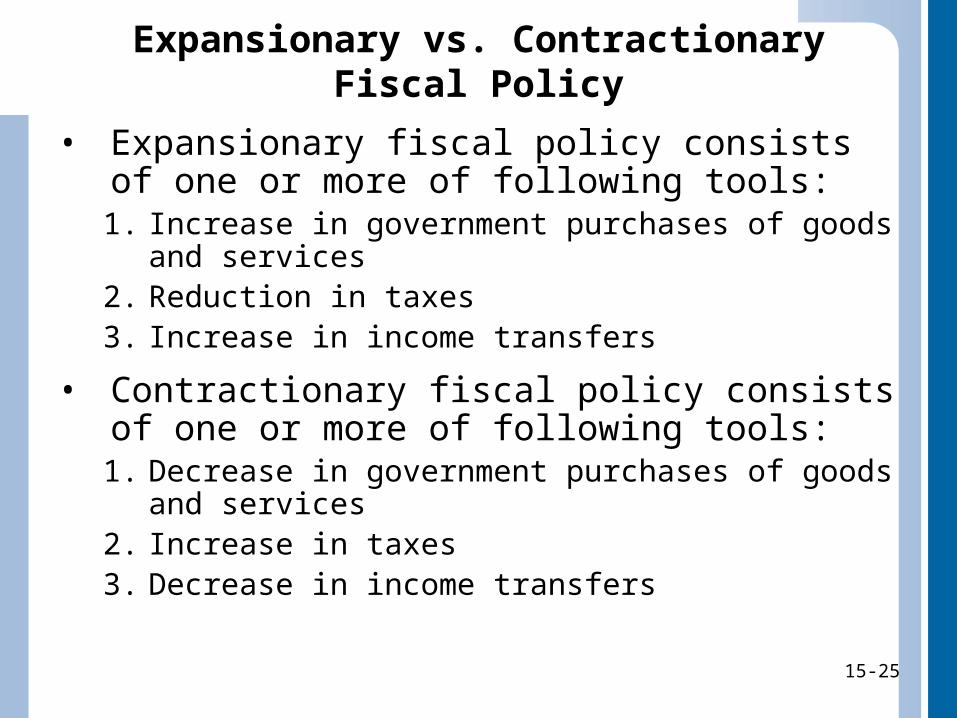
Expansionary vs. Contractionary Fiscal Policy
• Expansionary fiscal policy consists of one or more of following tools:1. Increase in government purchases of goods and
services2. Reduction in taxes3. Increase in income transfers
• Contractionary fiscal policy consists of one or more of following tools:1. Decrease in government purchases of goods and
services2. Increase in taxes3. Decrease in income transfers
15-25

15-26
Monetary Policy• Changes made in nation’s money supply to shift
aggregate demand curve• Whereas fiscal policy is under control of
government, monetary policy is under control of Federal Reserve– Federal Reserve controls nation’s money supply
• Changes in nation’s money supply will affect interest rate– Increase in supply of money will cause reduction in interest rate
» Reflects expansionary monetary policy– Decrease in nation’s money supply will cause increase in
interest rate» Reflects contractionary monetary policy
• Monetary policy affects economy through effects on interest rates
– Rise in interest rate will cause reduction in business purchases, as well as decrease in consumer purchases
15-26
15-27
Monetary Policy (cont.)
• Is an aggregate demand-side policy– Designed to influence aggregate demand
• Federal Reserve may choose either expansionary or contractionary monetary policy, depending on state of economy
15-27
15-28
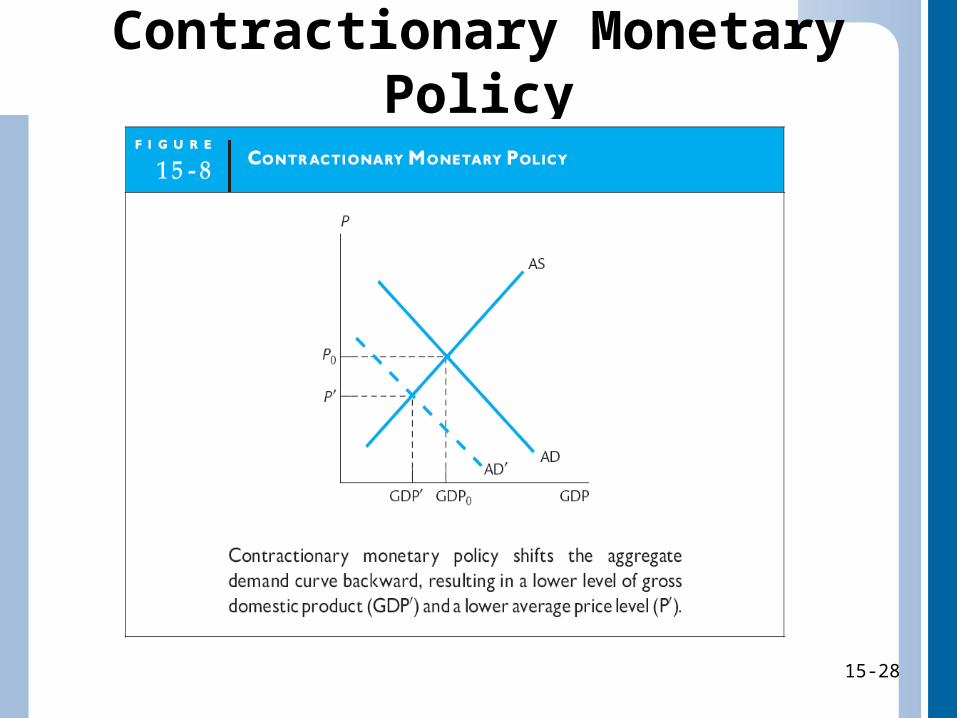
Contractionary Monetary Policy
15-28
15-29
Shortcomings of Fiscal and Monetary Policy
• Operates on aggregate demand side of economy:
– Increase in aggregate demand, as in case of expansionary fiscal policy, results in increase in GDP and employment, but at cost of creating inflation
– Decrease in aggregate demand, as in case of contractionary monetary policy, reduces problem of inflation, but at cost of creating recession and unemployment
15-29
15-30
Supply-Side Policy
• Use of various tools to improve incentives for workers and businesses to produce more, thereby increasing aggregate supply and GDP– Cuts in personal income tax rates– Cuts in government transfer programs– Cuts in government regulations
15-30
15-31
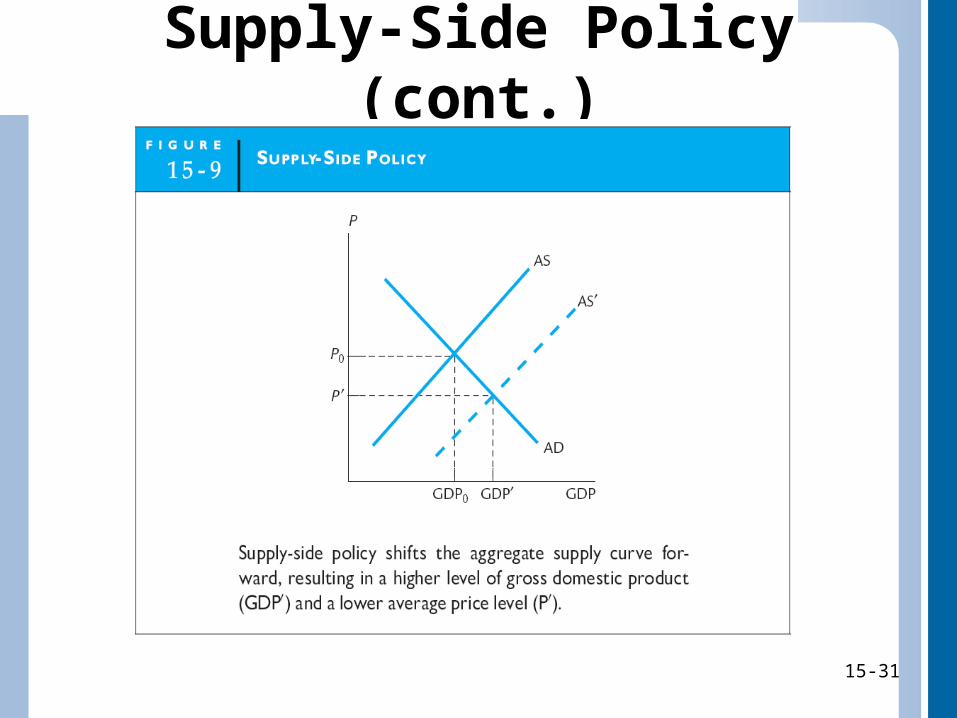
Supply-Side Policy (cont.)
15-31
15-32
Cuts in Personal Income Tax Rates
• From supply-side perspective, tax cut must take form of reduction in tax rates, because it is assumed that tax rates influence decisions about work effort– Reduction in tax rates considered tantamount to
increase in hourly wages; assumed that people will respond to incentive of higher after-tax wages by increasing work effort• If nation’s workers respond as desired, increased work effort
will result in expanded production, which will increase supply side of economy
– Aggregate supply will shift forward, resulting in expanded GDP and decreased price level
15-32
15-33
Cuts in Income Transfers
• In terms of supply-side policy, reducing transfers forces people to seek employment– With more people working, production
expands and aggregate supply increases
15-33
15-34
Deregulation
• Reduction of government regulations– By reducing certain regulations, it is argued
that businesses will expand production, thereby increasing aggregate supply side of economy
15-34
15-35
Effects of Supply-Side Policy• Labor economists believe that overall impact of changes
in after-tax wages is close to zero– Most people are unable to alter number of hours they work, so
increased incentives for work effort will not change number of hours worked
– Others may decide to cut work hours because tax-rate cuts allow them to maintain desired level of income while working fewer hours
• Many have argued that cuts in government transfers do not result in expanded work effort– Transfer programs in early 1980s were meant for women with
small children and others unable to work– Many participants in current welfare system will not be able to
work unless needs for child care, transportation, job training, and education are met
– Given possibility of recession at any time, jobs may simply be unavailable
15-35
15-36
The Objective of Supply-Side Policy
• Conservative objective of reducing government role in economy is at root of supply-side policies
– Supply-siders would reduce:• Government domestic spending and involvement
in social programs• Taxes to increase spending ability of private sector• Government regulatory control over business
15-36
15-37
The Economic Left and the Economic Right
• THE ECONOMIC RIGHT (Conservative)– Would prefer to see fiscal
policy that reduces taxes and places more purchasing power in private sector of economy
– Often supportive of high levels of defense-related spending
– Would prefer use of monetary policy
– Favor use of supply-side policy
• THE ECONOMIC LEFT (Liberal)– Favor fiscal policy that
increases government purchases and transfers, especially if government purchases are for domestic programs
15-37
15-38
Appendix: The Slope of the Aggregate Demand Curve
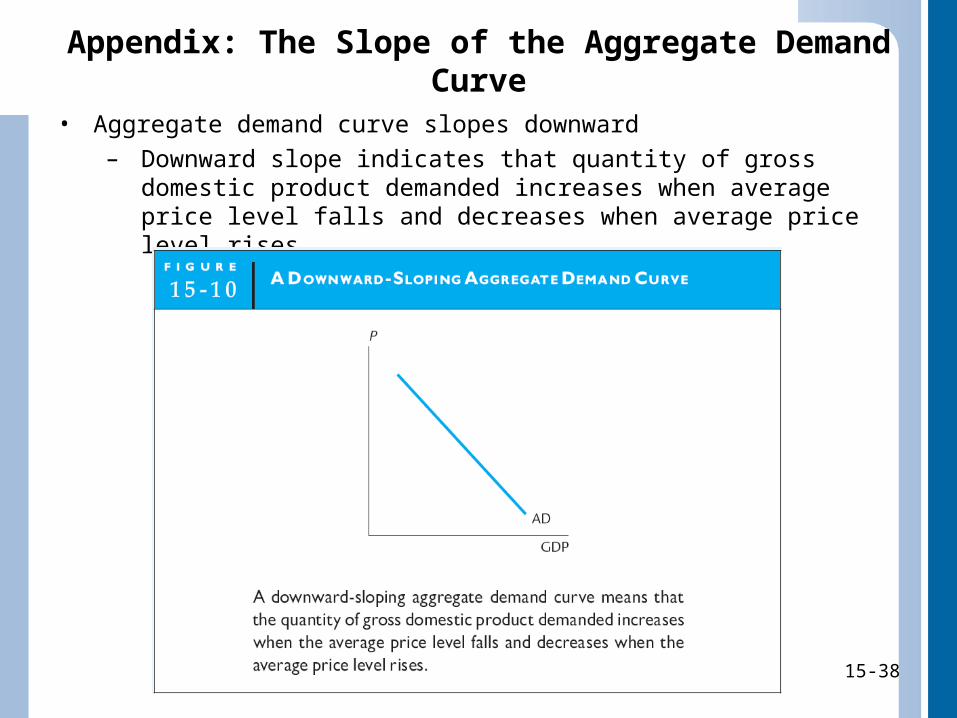
• Aggregate demand curve slopes downward
– Downward slope indicates that quantity of gross domestic product demanded increases when average price level falls and decreases when average price level rises
15-38
15-39
Appendix: The Slope of theAggregate Demand Curve (cont.)
• Relationship between quantity of GDP demanded and average price level is negative for three reasons:1. If average price level in U.S. rises relative to price
levels in other countries, then American consumers will tend to buy more foreign goods and fewer American goods
2. Fixed amount of money (i.e., money in a savings account) loses purchasing power when prices of purchased items increase
3. When interest rates rise, people and businesses reduce purchases of big-ticket items (i.e., cars, homes, factories)
15-39
15-40
Appendix: The Slope of theAggregate Demand Curve (cont.)
• Keep in mind difference between factors that cause movement along aggregate demand curve and factors that cause shift in aggregate demand curve– Because average price level is on vertical axis of
graph of aggregate demand, any change in average price level that causes changes in quantity of GDP demanded is reflected as movement along demand curve
– On the other hand, changes not precipitated by change in average price level—such as changes in population size, consumer incomes, or government fiscal or monetary policy—will cause shift in entire aggregate demand curve
15-40
15-41
Appendix: The Slope of the Aggregate Supply Curve
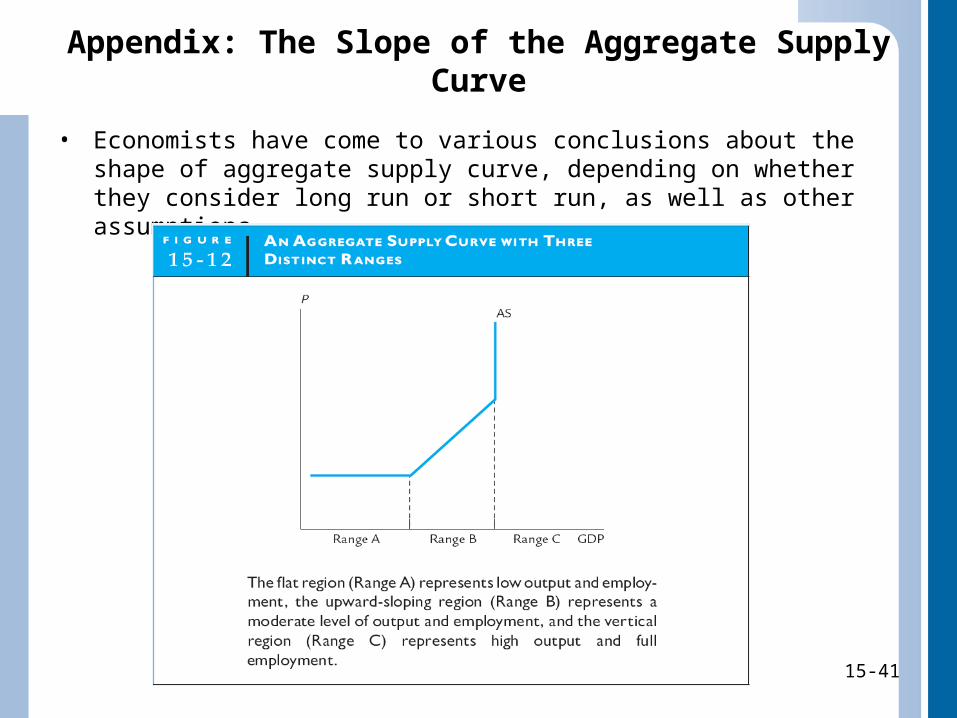
• Economists have come to various conclusions about the shape of aggregate supply curve, depending on whether they consider long run or short run, as well as other assumptions
15-41
15-42
Appendix: The Slope of theAggregate Supply Curve (cont.)
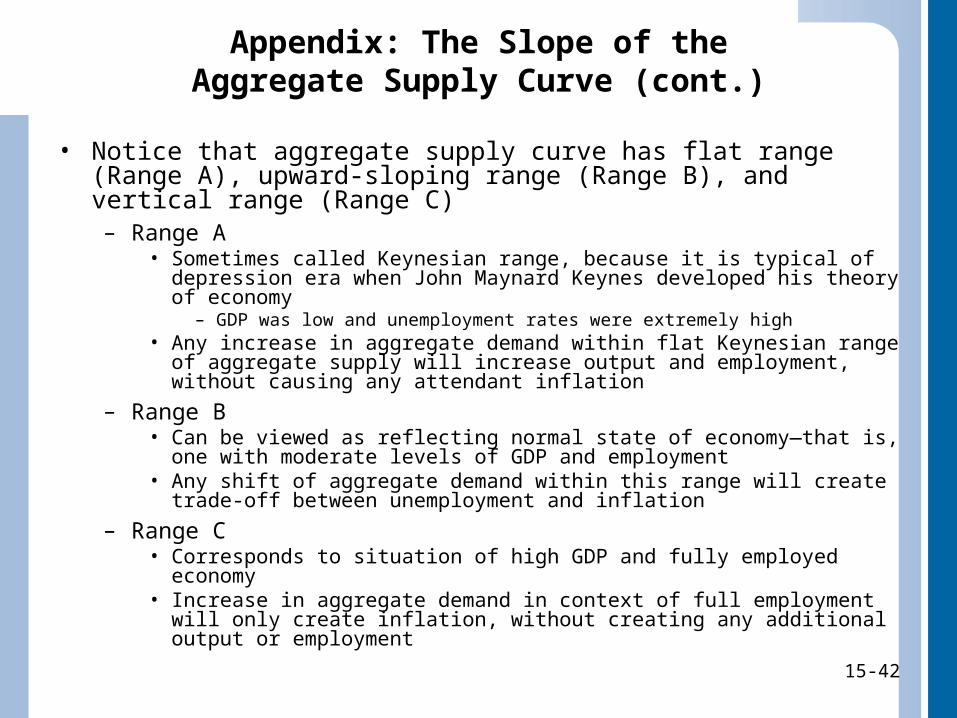
• Notice that aggregate supply curve has flat range (Range A), upward-sloping range (Range B), and vertical range (Range C)– Range A
• Sometimes called Keynesian range, because it is typical of depression era when John Maynard Keynes developed his theory of economy
– GDP was low and unemployment rates were extremely high• Any increase in aggregate demand within flat Keynesian range of aggregate
supply will increase output and employment, without causing any attendant inflation
– Range B• Can be viewed as reflecting normal state of economy—that is, one with
moderate levels of GDP and employment• Any shift of aggregate demand within this range will create trade-off between
unemployment and inflation
– Range C• Corresponds to situation of high GDP and fully employed economy• Increase in aggregate demand in context of full employment will only create
inflation, without creating any additional output or employment
15-42
15-43
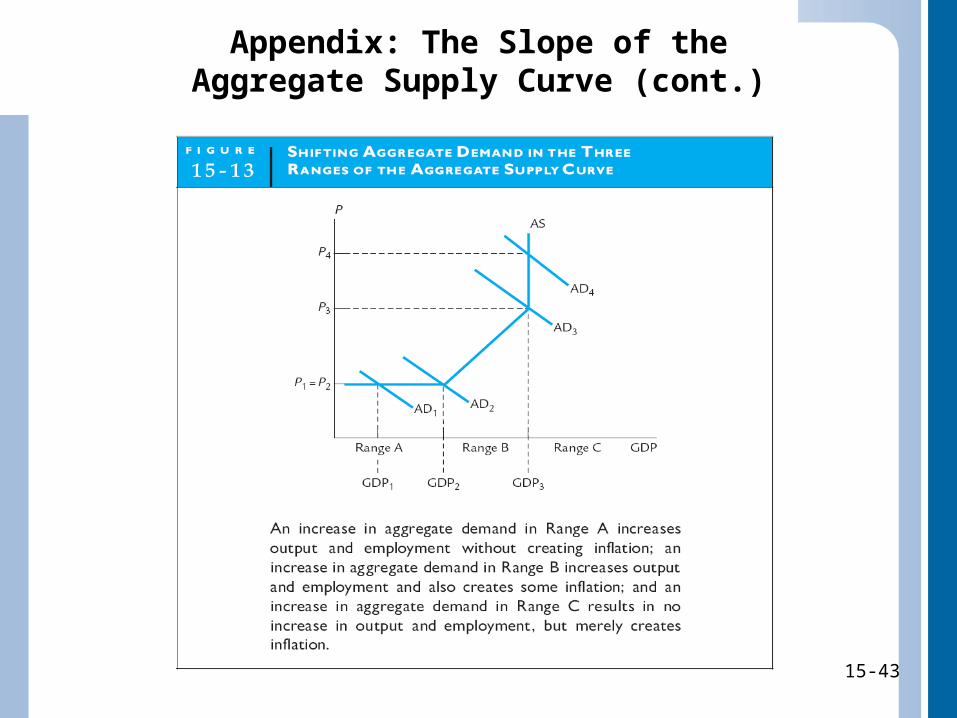
Appendix: The Slope of theAggregate Supply Curve (cont.)
15-43