14-d - medina, kolesnik - streamlining operations through ...€¦ · streamlining operations...
TRANSCRIPT
3/12/2015
2015 NHIA Annual Conference & Exposition 1
Streamlining Operations Through the Use of Technology
Alexis Kolesnik RN MSN, Care Team LeaderJefferson Home Infusion
Rowell Medina PharmD, Clinical Infusion PharmacistJohns Hopkins Home Care Group
Disclosures
The speakers declare no conflicts of interest or financial interest in any service or product mentioned in this program.
Clinical trials and off‐label/investigational uses will not be discussed during this presentation.
23/12/15
Definitions• Process Improvement: a method to introduce
process change to improve quality of a product or service, to better match customer and consumer needs
• Waste: anything other than the minimum amount of equipment, materials, parts, space and time which are absolutely essential to ass value to the product
• Resource: a place or thing that provides something useful
33/12/15
3/12/2015
2015 NHIA Annual Conference & Exposition 2
Identify the Problem
Brainstorming Session– How are things done now: “As-Is”
– What process needs improvement?
– What are the requirements for the “to be”?
– Stakeholders
– Where is the waste?
– How are resources utilized?
WHAT METHOD WORKS FOR YOUR ORGANIZATION?
43/12/15
Performance ImprovementMethods
• PDCA (Plan Do Check Act)
• Needs Assessment
• Lean & Six Sigma
53/12/15
FOCUS-PDCA
Useful tool to guide and direct simple and complex process problem solving activities
Ask yourself……
What should this process look like if it were perfect??
63/12/15
3/12/2015
2015 NHIA Annual Conference & Exposition 3
FOCUS- PDCA Stages• Find a process to improve
• Organize a team that knows the process
• Clarify current knowledge of the process
• Understand cause of process variation
• Select the process to improve
• Plan the improvement
• Do data collection, analysis and improvement
• Change data for process improvement and customer outcome
• Act to hold, gain and continue improvement
73/12/15
Needs Assessment• Process for examining and framing people related
problems and performance improvement (PI) opportunities
• Initiated in response to a problem, opportunity or an ongoing learning or PI effort
• Compare current to desired condition• Focus:
– On a single individual– Job function– Entire organization– People related problem or PI
83/12/15
Lean
• Most frequently used quality improvement approach
• Lean thinking was developed by the Toyota Motor Company
• Operations within an organization are categorized into 3 types using Value Stream mapping– Non Value added (NVA)
– Necessary but Non-Value added (NNVA)
– Value added (VA)
93/12/15
3/12/2015
2015 NHIA Annual Conference & Exposition 4
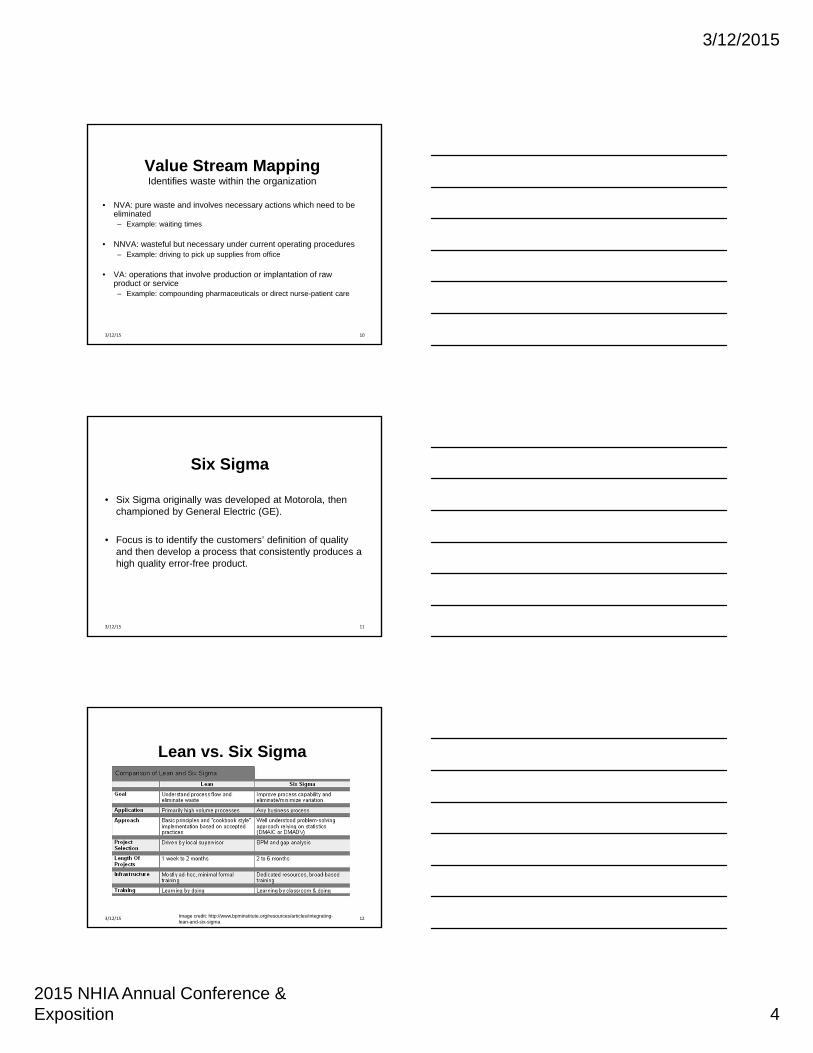
Value Stream MappingIdentifies waste within the organization
• NVA: pure waste and involves necessary actions which need to be eliminated– Example: waiting times
• NNVA: wasteful but necessary under current operating procedures– Example: driving to pick up supplies from office
• VA: operations that involve production or implantation of raw product or service– Example: compounding pharmaceuticals or direct nurse-patient care
103/12/15
Six Sigma
• Six Sigma originally was developed at Motorola, then championed by General Electric (GE).
• Focus is to identify the customers’ definition of quality and then develop a process that consistently produces a high quality error-free product.
113/12/15
Lean vs. Six Sigma
Image credit: http://www.bpminstitute.org/resources/articles/integrating-lean-and-six-sigma
123/12/15
3/12/2015
2015 NHIA Annual Conference & Exposition 5
Two separate entities, yet combined for a single approach:
Lean Sigma
• Focus on measuring and eliminating errors (Six Sigma) and ensuring an efficient work flow and value added (Lean)
• Measuring and maintaining process performance while recognizing the importance of maintaining a culture that supports rapid continuous improvement
133/12/15
Visual Tools
• Value Stream Map
• Swim Lane Process Map
• Fishbone Diagram
• Spaghetti Diagram
• Descriptive Statistics
– Box plots, histograms, charts, etc
– Continuous data vs. categorical data
143/12/15
Potential Solutions
• Multidisciplinary team
• Key process improvements
• Detailed and thorough
• Problem or root cause
• Timeline
• Communication
Dutton, Emma K. "Root Cause Analysis: Why Blaming the Individual Misses the Point." Web.Garrett, Rhonda. "Is Your Company Solving the Right Problems?" IndustryWeek. N.p., 1 July 2014. Web. 15 Nov. 2014.
153/12/15
3/12/2015
2015 NHIA Annual Conference & Exposition 6
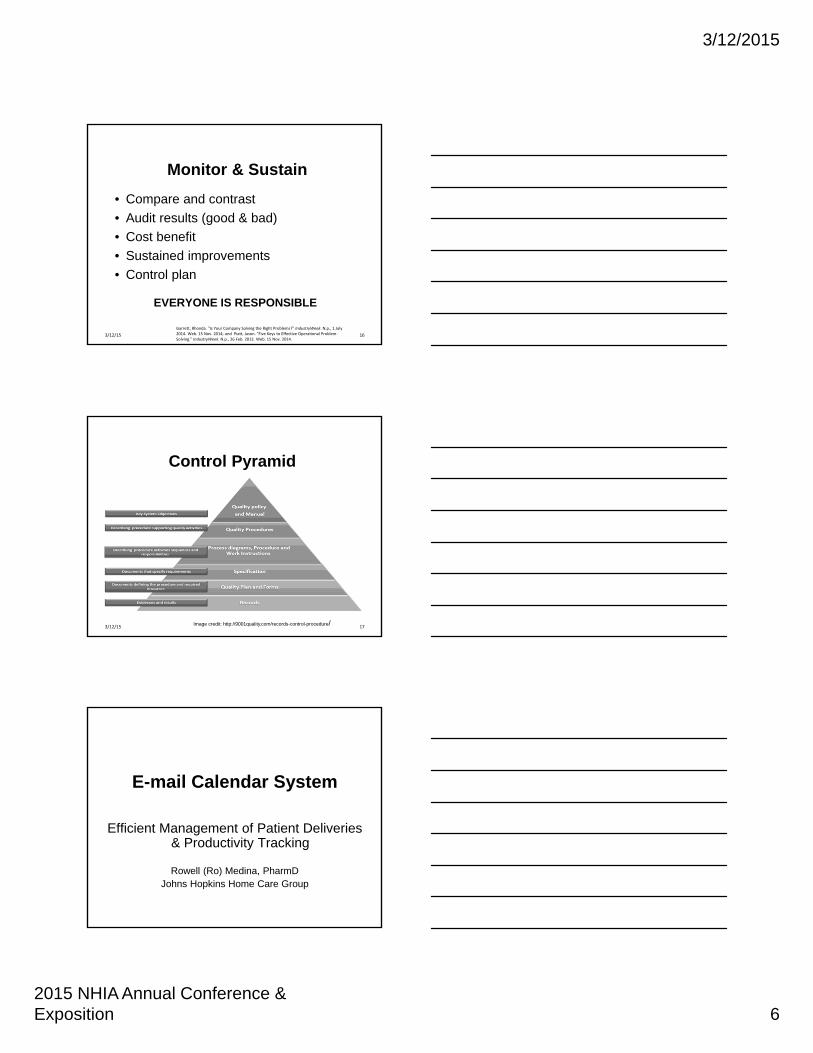
Monitor & Sustain
• Compare and contrast
• Audit results (good & bad)
• Cost benefit
• Sustained improvements
• Control plan
EVERYONE IS RESPONSIBLE
Garrett, Rhonda. "Is Your Company Solving the Right Problems?" IndustryWeek. N.p., 1 July 2014. Web. 15 Nov. 2014; and Piatt, Jason. "Five Keys to Effective Operational Problem‐Solving." IndustryWeek. N.p., 26 Feb. 2013. Web. 15 Nov. 2014.
163/12/15
Control Pyramid
Image credit: http://9001quality.com/records-control-procedure/173/12/15
E-mail Calendar System
Efficient Management of Patient Deliveries & Productivity Tracking
Rowell (Ro) Medina, PharmDJohns Hopkins Home Care Group
3/12/2015
2015 NHIA Annual Conference & Exposition 7
Background
• Four teams– Disease state (3 adult teams)
– Age (1 pediatric team)
• Consists of– Pharmacist: clinical management
– Clinical Technician: supply & delivery management
• Electronic charting
193/12/15
Previous State
• “Paper and pencil” scheduling
• Two calendars per team (RPh & CSR)
• Morning & afternoon rounds
• Unable to view workload or track progress
• Difficult to forward patients causing higher risks for missing deliveries
203/12/15
Brainstorm
• Microsoft Outlook Calendar– Current E-mail system
– Secured & HIPAA compliant
– “LIVE”
• Separate calendar per team
• Use of appointments (30 minute blocks)– Notes
– Color coding
213/12/15
3/12/2015
2015 NHIA Annual Conference & Exposition 8
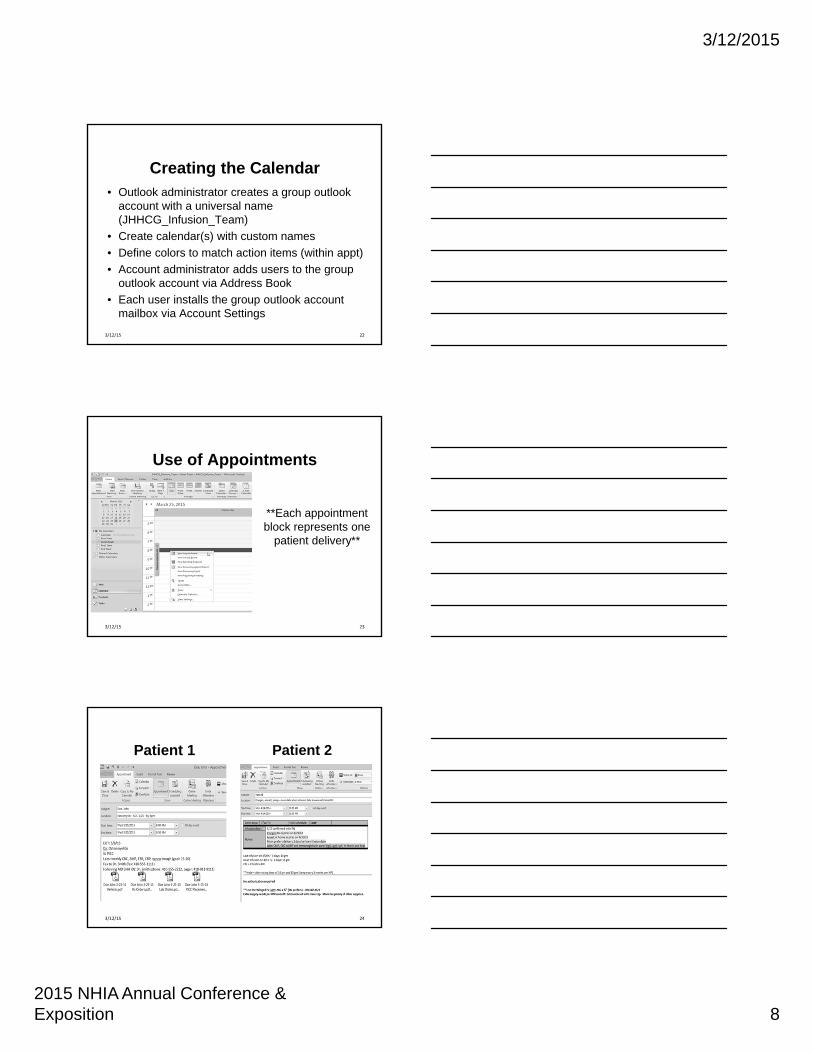
Creating the Calendar• Outlook administrator creates a group outlook
account with a universal name (JHHCG_Infusion_Team)
• Create calendar(s) with custom names
• Define colors to match action items (within appt)
• Account administrator adds users to the group outlook account via Address Book
• Each user installs the group outlook account mailbox via Account Settings
223/12/15
Use of Appointments
**Each appointment block represents one
patient delivery**
233/12/15
Patient 1
24
Patient 2
3/12/15
3/12/2015
2015 NHIA Annual Conference & Exposition 9
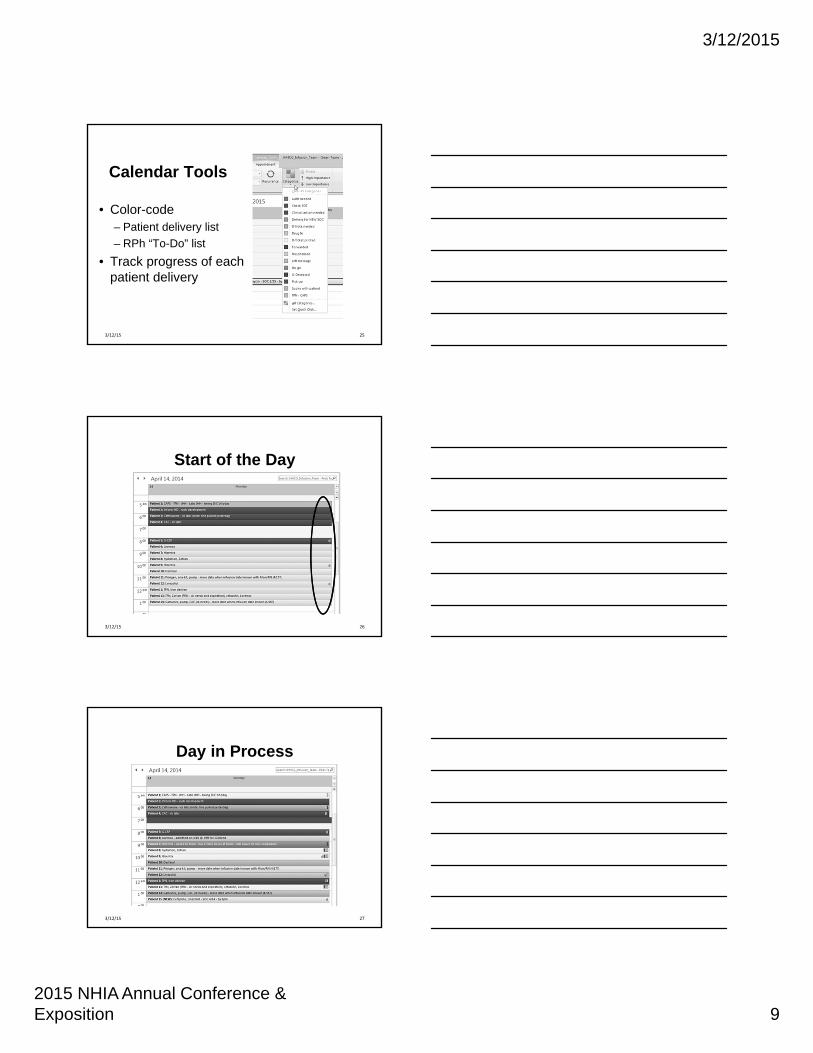
Calendar Tools
• Color-code– Patient delivery list
– RPh “To-Do” list
• Track progress of each patient delivery
253/12/15
Start of the Day
263/12/15
Day in Process
273/12/15
3/12/2015
2015 NHIA Annual Conference & Exposition 10
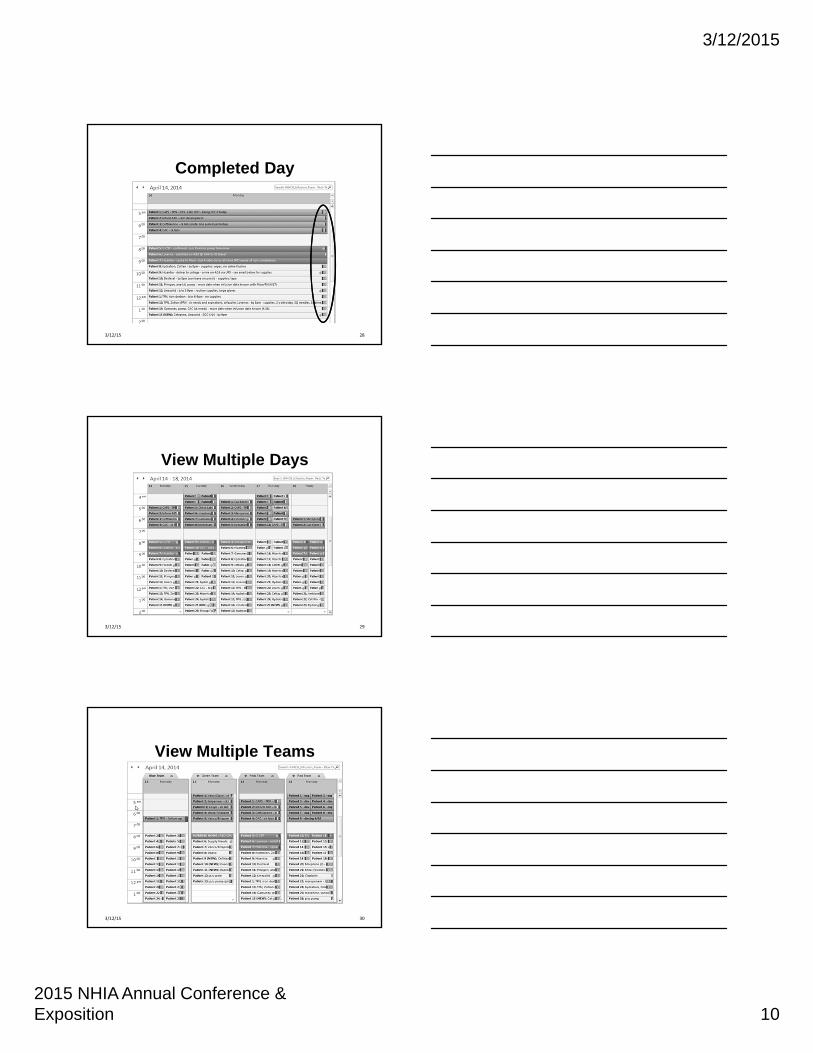
Completed Day
283/12/15
View Multiple Days
293/12/15
View Multiple Teams
303/12/15
3/12/2015
2015 NHIA Annual Conference & Exposition 11
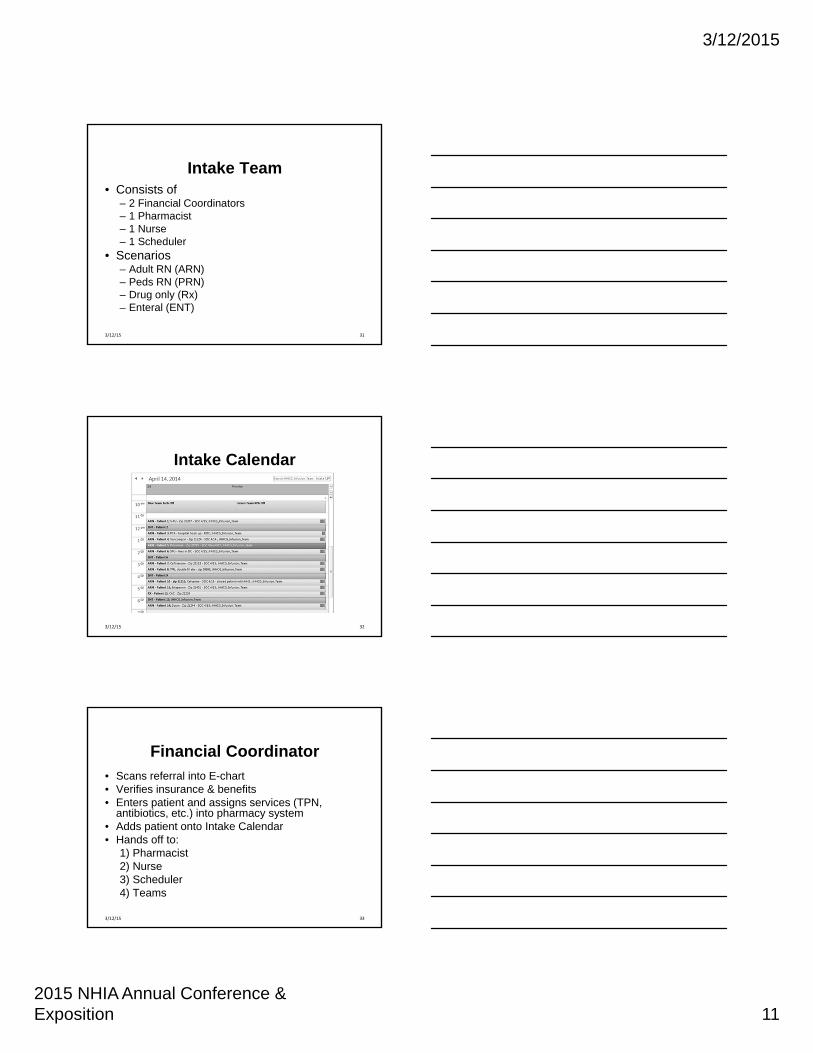
Intake Team• Consists of
– 2 Financial Coordinators– 1 Pharmacist– 1 Nurse– 1 Scheduler
• Scenarios– Adult RN (ARN)– Peds RN (PRN)– Drug only (Rx)– Enteral (ENT)
313/12/15
Intake Calendar
323/12/15
Financial Coordinator
• Scans referral into E-chart• Verifies insurance & benefits• Enters patient and assigns services (TPN,
antibiotics, etc.) into pharmacy system• Adds patient onto Intake Calendar• Hands off to:
1) Pharmacist2) Nurse3) Scheduler4) Teams
333/12/15
3/12/2015
2015 NHIA Annual Conference & Exposition 12
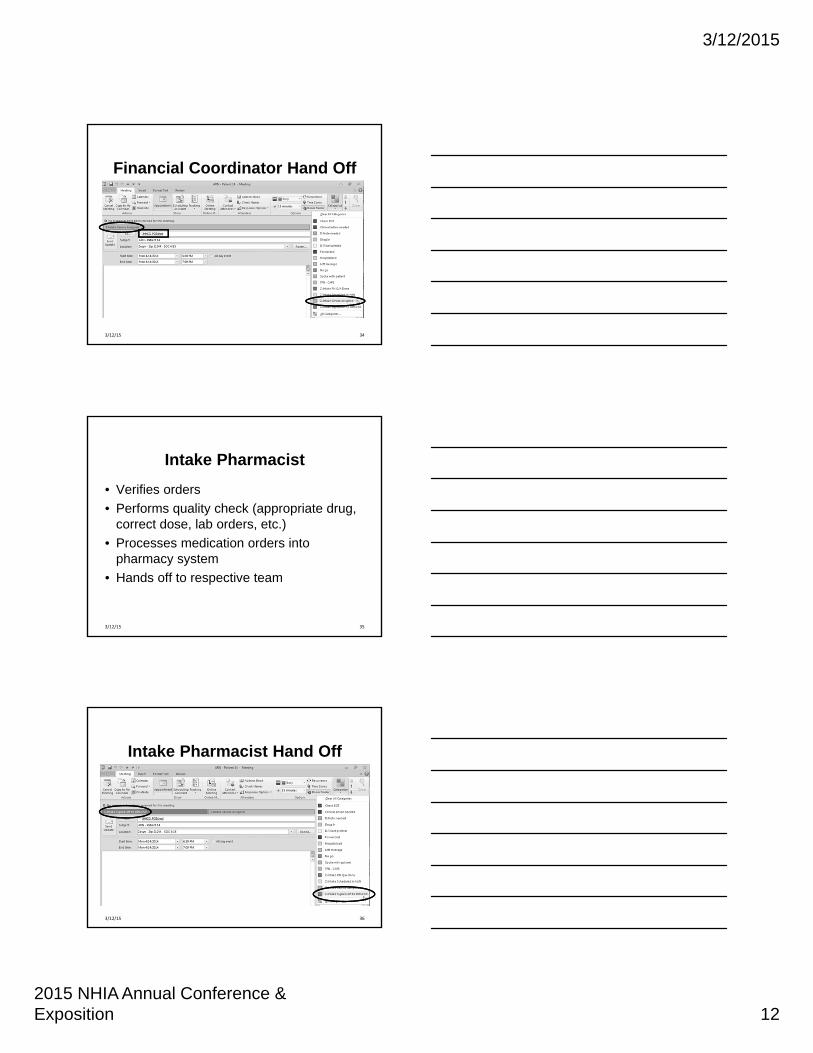
Financial Coordinator Hand Off
343/12/15
Intake Pharmacist
• Verifies orders
• Performs quality check (appropriate drug, correct dose, lab orders, etc.)
• Processes medication orders into pharmacy system
• Hands off to respective team
353/12/15
Intake Pharmacist Hand Off
363/12/15
3/12/2015
2015 NHIA Annual Conference & Exposition 13
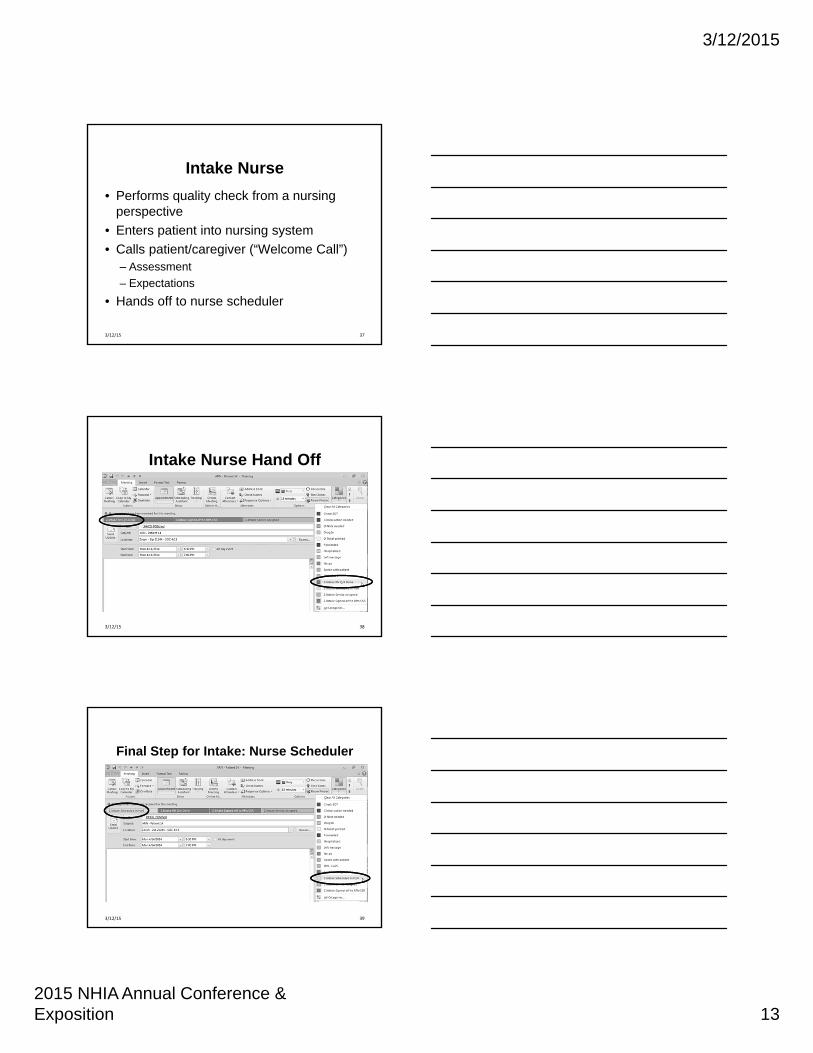
Intake Nurse
• Performs quality check from a nursing perspective
• Enters patient into nursing system
• Calls patient/caregiver (“Welcome Call”)– Assessment
– Expectations
• Hands off to nurse scheduler
373/12/15
Intake Nurse Hand Off
383/12/15
Final Step for Intake: Nurse Scheduler
393/12/15
3/12/2015
2015 NHIA Annual Conference & Exposition 14
Benefits• Real‐time• Used throughout JH Health System• User friendly• Efficient communication
– Smooth hand offs– Signals to work– Eliminated morning or afternoon rounds
• Track progress and productivity• Emergency preparedness plan
– Ability to work from home
403/12/15
Limitations
• No warning when deleting patients or calendars (retrievable)
• Correctly forwarding of patients (copy & paste entire appointment with notes)
• Changes and updates cannot be made simultaneously by more than one person
• Administrator is needed to manage calendar(s) and allow users
413/12/15
Interface for Pharmacy & Delivery Routing Systems
Synchronizing Drug Preparation & Delivery Management
Rowell (Ro) Medina, PharmD
Johns Hopkins Home Care Group
3/12/2015
2015 NHIA Annual Conference & Exposition 15
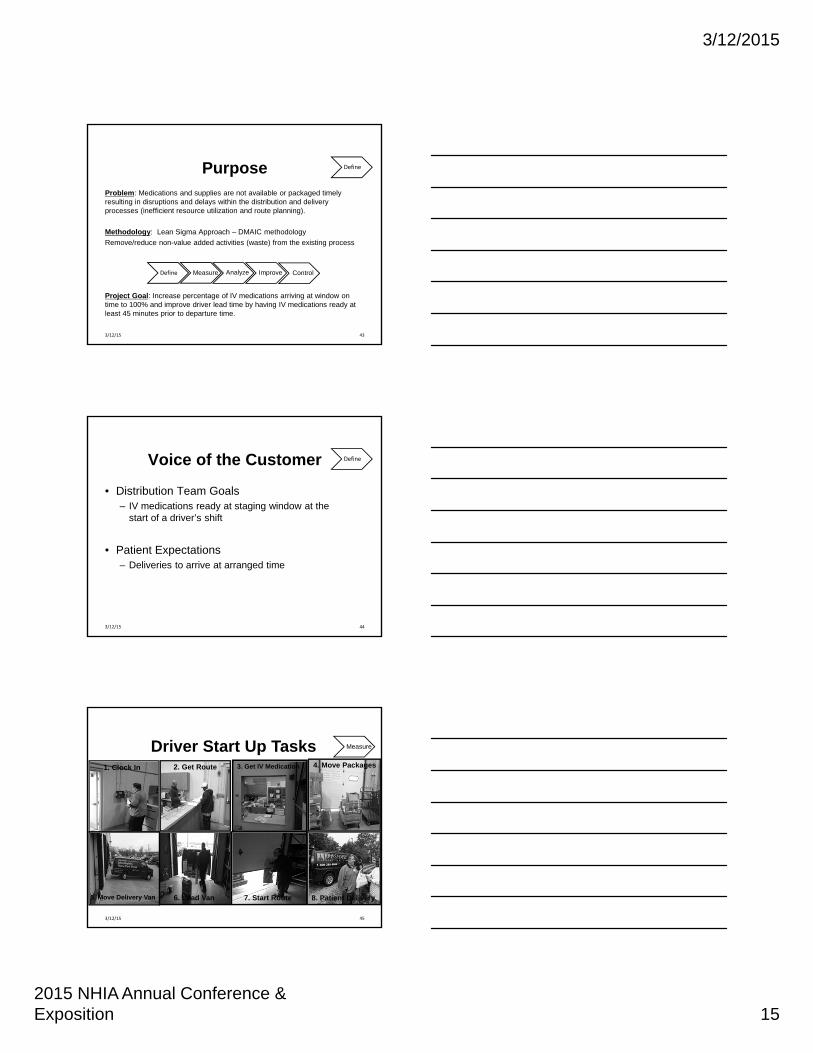
PurposeProblem: Medications and supplies are not available or packaged timely resulting in disruptions and delays within the distribution and delivery processes (inefficient resource utilization and route planning).
Methodology: Lean Sigma Approach – DMAIC methodology
Remove/reduce non-value added activities (waste) from the existing process
Project Goal: Increase percentage of IV medications arriving at window on time to 100% and improve driver lead time by having IV medications ready at least 45 minutes prior to departure time.
43
Define
Define Measure Analyze Improve Control
3/12/15
Voice of the Customer
• Distribution Team Goals– IV medications ready at staging window at the
start of a driver’s shift
• Patient Expectations– Deliveries to arrive at arranged time
44
Define
3/12/15
1. Clock In 2. Get Route 4. Move Packages
5. Move Delivery Van 6. Load Van 7. Start Route
Driver Start Up Tasks3. Get IV Medication
8. Patient Delivery
Measure
453/12/15
3/12/2015
2015 NHIA Annual Conference & Exposition 16
463/12/15
CAPS
Vendors
Vendors
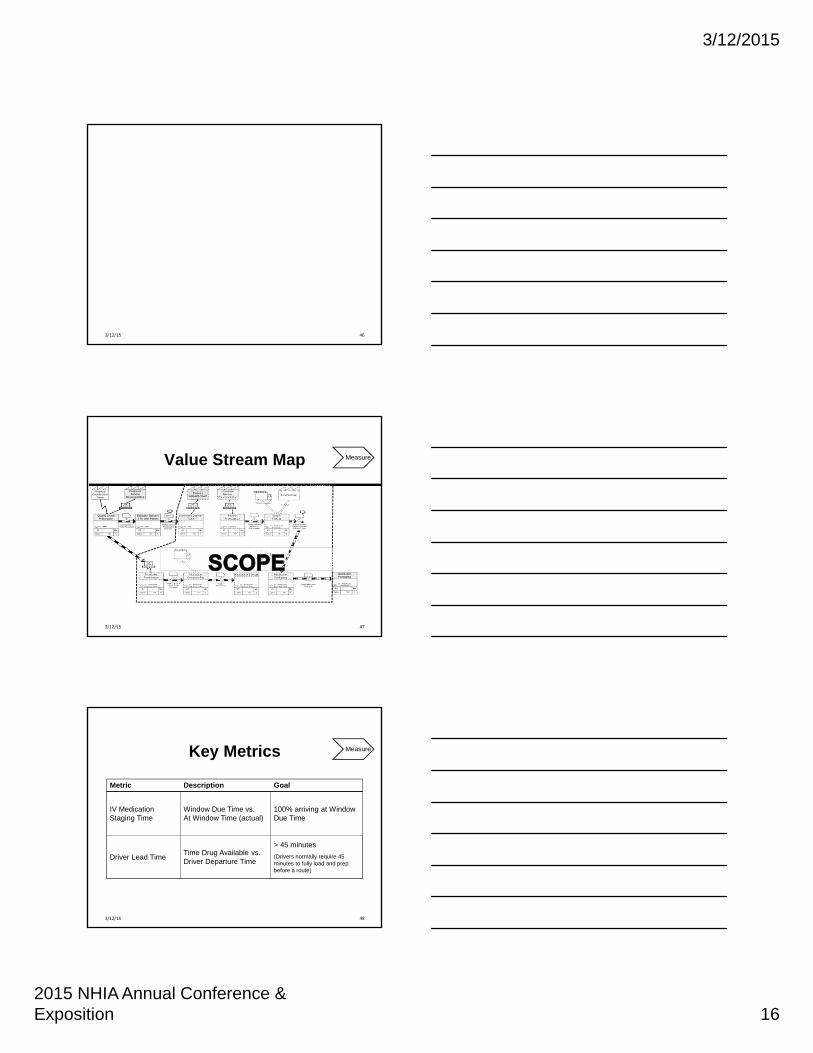
Value Stream Map Measure
473/12/15
Key Metrics
48
Measure
Metric Description Goal
IV Medication Staging Time
Window Due Time vs. At Window Time (actual)
100% arriving at Window Due Time
Driver Lead TimeTime Drug Available vs.Driver Departure Time
> 45 minutes
(Drivers normally require 45 minutes to fully load and prep before a route)
3/12/15

3/12/2015
2015 NHIA Annual Conference & Exposition 17
What We Learned?
• Causes of medication staging delay
• Major Factor: Communication
49
Analyze
3/12/15
Communication
• No time on delivery ticket
• No time on compounding sheet
• Lack of prioritization
• “First in, first out” mentality
• Held deliveries
• Delivery by times
• Driver departure times
50
Analyze
3/12/15
5S Quick Hit:Medication Staging
51
BEFORE AFTER
Improve
3/12/15
3/12/2015
2015 NHIA Annual Conference & Exposition 18
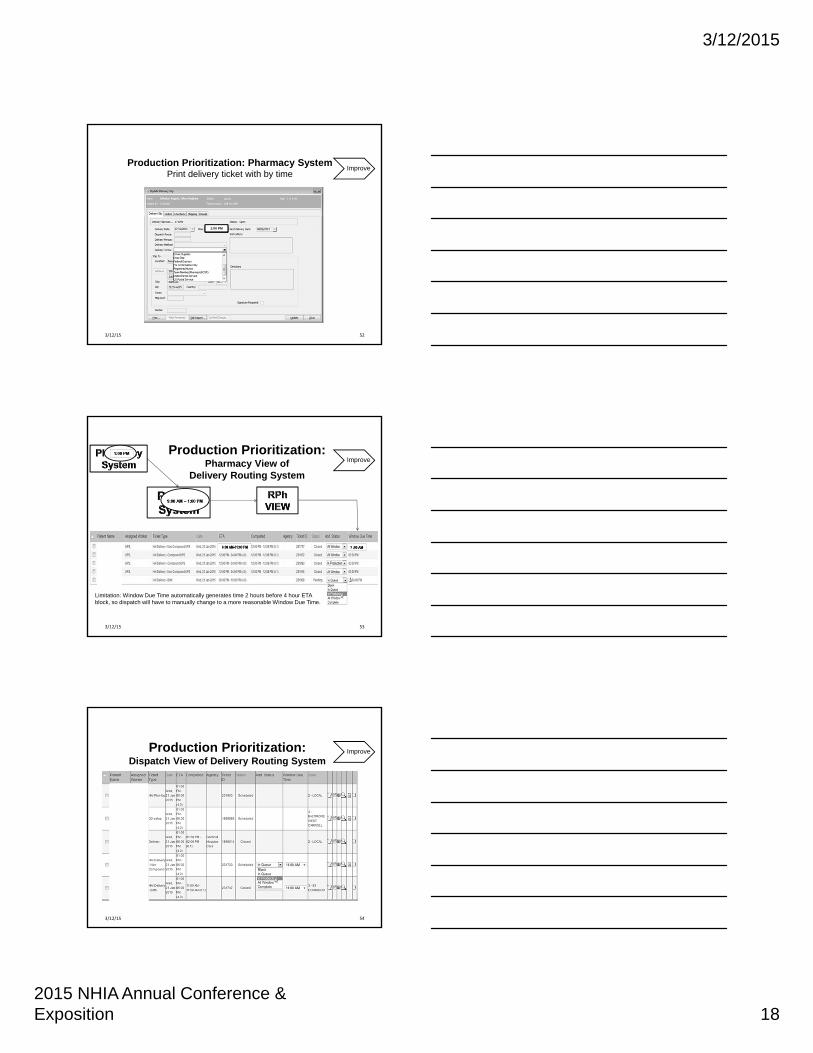
11: 1:01:00 1:00 P1:00 PM
Production Prioritization: Pharmacy System Print delivery ticket with by time
Improve
523/12/15
Limitation: Window Due Time automatically generates time 2 hours before 4 hour ETA block, so dispatch will have to manually change to a more reasonable Window Due Time.
Production Prioritization:Pharmacy View of
Delivery Routing System
Improve
533/12/15
Production Prioritization:Dispatch View of Delivery Routing System
Improve
543/12/15
3/12/2015
2015 NHIA Annual Conference & Exposition 19
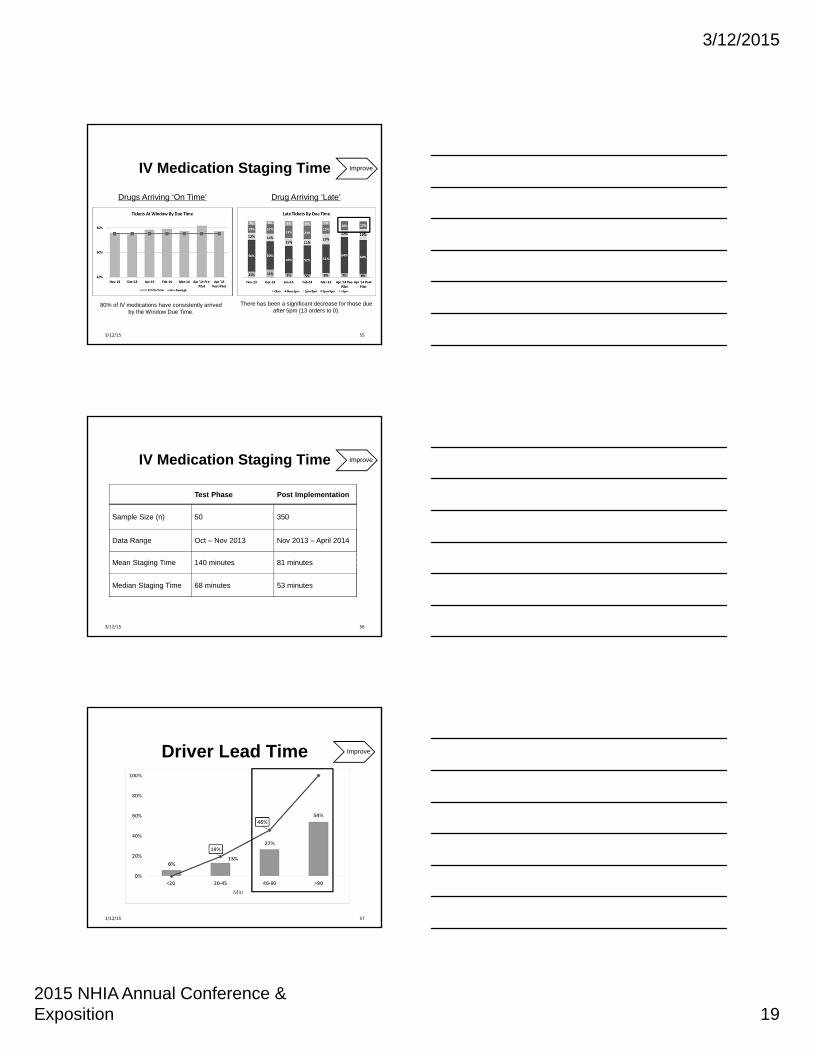
IV Medication Staging Time
55
80% of IV medications have consistently arrived by the Window Due Time.
There has been a significant decrease for those due after 5pm (13 orders to 0).
Drugs Arriving ‘On Time’ Drug Arriving ‘Late’
Improve
3/12/15
Test Phase Post Implementation
Sample Size (n) 50 350
Data Range Oct – Nov 2013 Nov 2013 – April 2014
Mean Staging Time 140 minutes 81 minutes
Median Staging Time 68 minutes 53 minutes
56
IV Medication Staging Time Improve
3/12/15
Driver Lead Time
57
Improve
3/12/15
3/12/2015
2015 NHIA Annual Conference & Exposition 20
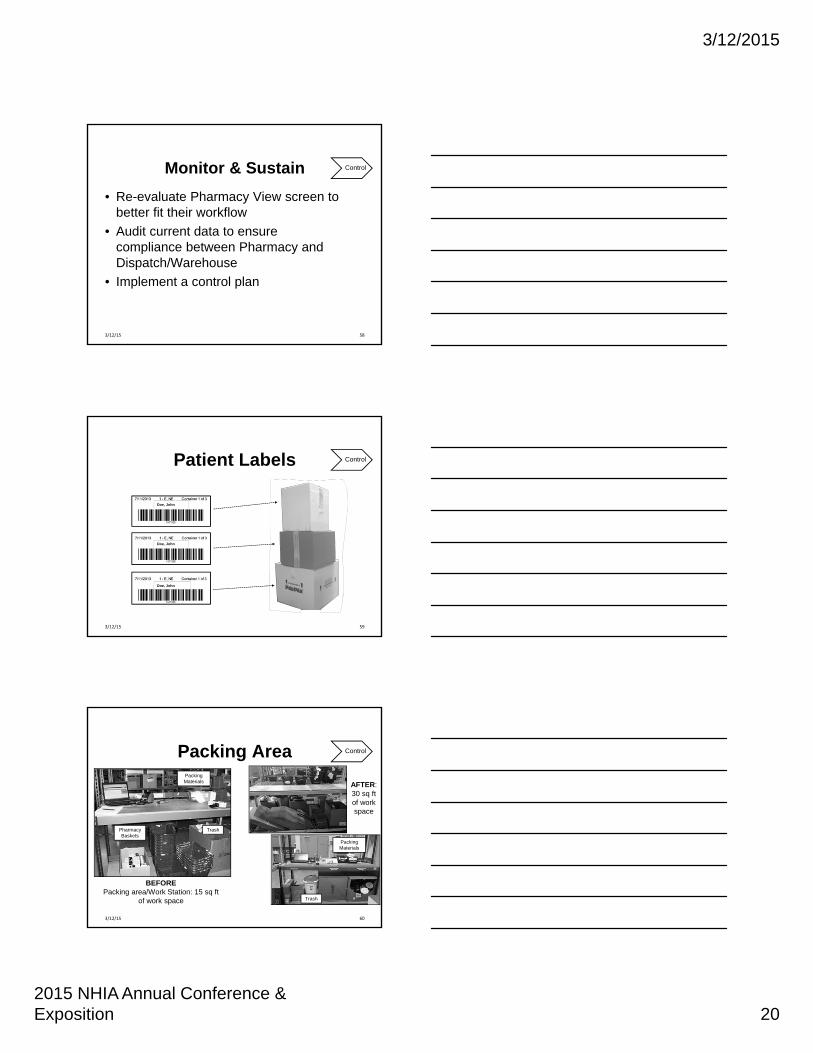
Monitor & Sustain
• Re-evaluate Pharmacy View screen to better fit their workflow
• Audit current data to ensure compliance between Pharmacy and Dispatch/Warehouse
• Implement a control plan
58
Control
3/12/15
Doe, John
Doe, John
Doe, John
ControlPatient Labels
593/12/15
Packing Area
60
Control
Pharmacy Baskets
Trash
Packing Materials
BEFOREPacking area/Work Station: 15 sq ft
of work space Trash
Packing Materials
AFTER:30 sq ft of work space
3/12/15
3/12/2015
2015 NHIA Annual Conference & Exposition 21
61
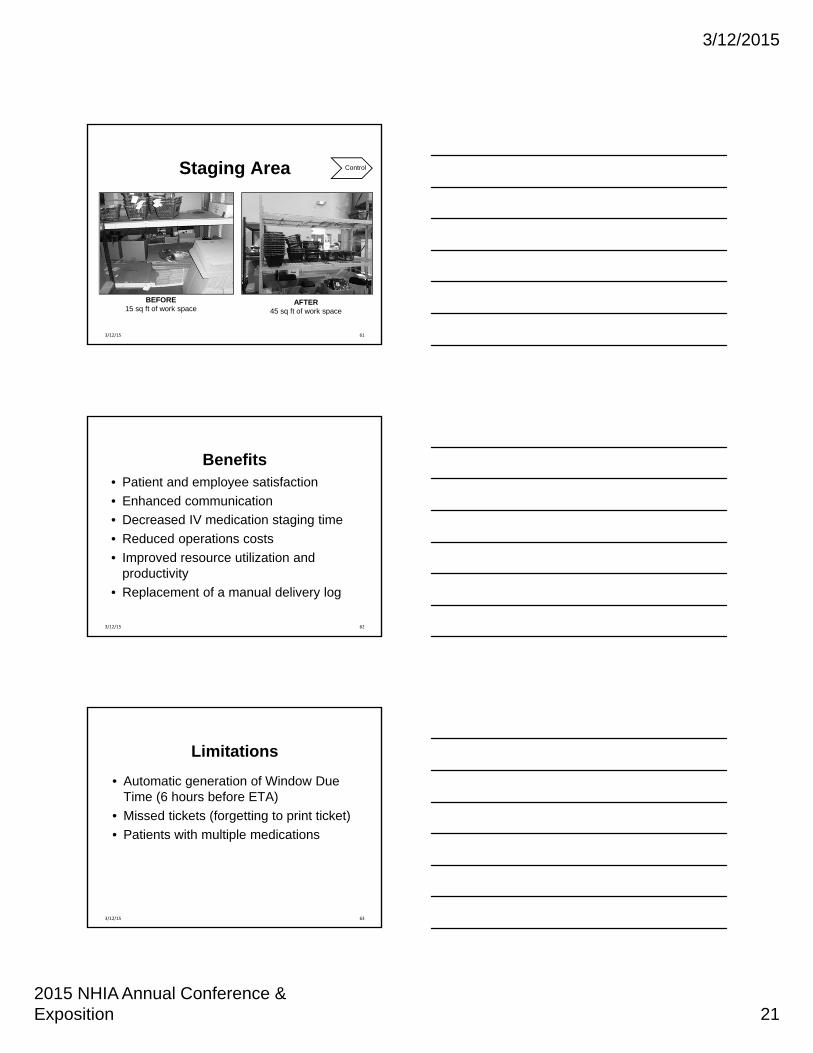
Staging Area Control
BEFORE15 sq ft of work space
AFTER45 sq ft of work space
3/12/15
Benefits• Patient and employee satisfaction
• Enhanced communication
• Decreased IV medication staging time
• Reduced operations costs
• Improved resource utilization and productivity
• Replacement of a manual delivery log
623/12/15
Limitations
• Automatic generation of Window Due Time (6 hours before ETA)
• Missed tickets (forgetting to print ticket)
• Patients with multiple medications
633/12/15
3/12/2015
2015 NHIA Annual Conference & Exposition 22
Electronic Route Optimization
Efficient Patient & Nursing Scheduling
Alexis M. Kolesnik RN MSN
Jefferson Home Infusion
Change Management
• Organizational change can be represented as three states of change
– Current State
– Transition state
– Future state
653/12/15
Effective Change ManagementRequires involvement and action by
many within the department
• Coordinators
• Mobile Registered Nurses
• Intake personal
• Document trackers
• Administration
663/12/15
3/12/2015
2015 NHIA Annual Conference & Exposition 23
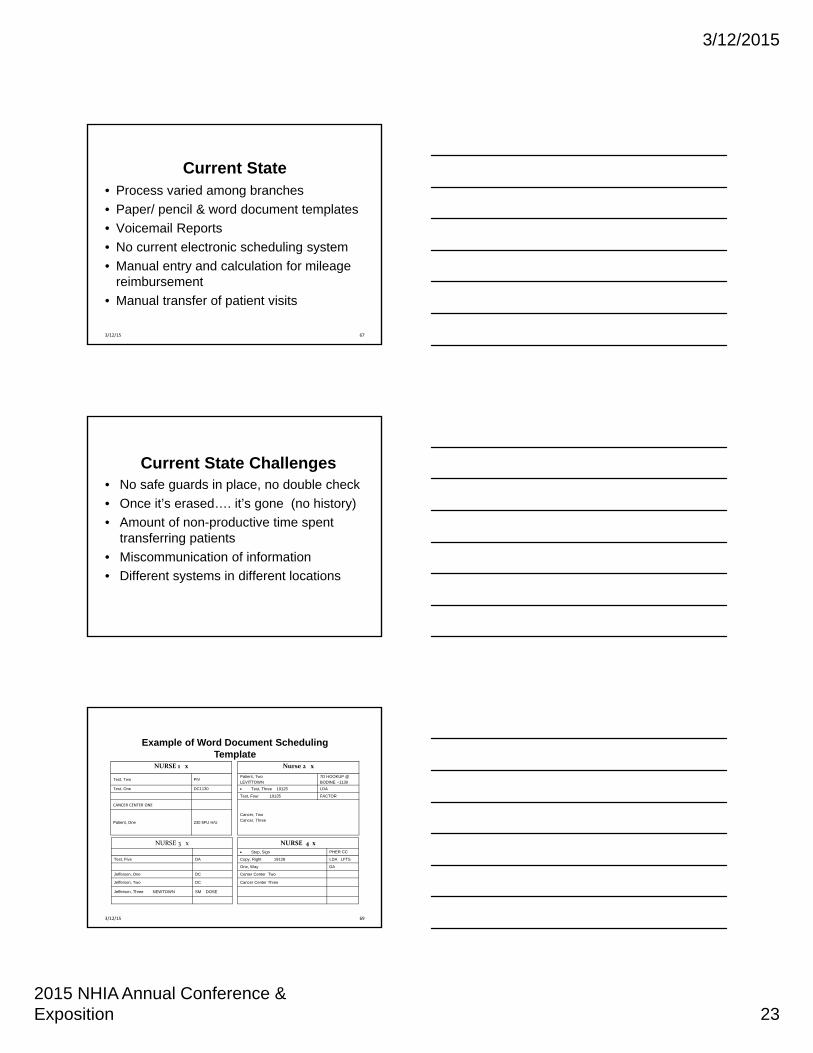
Current State• Process varied among branches
• Paper/ pencil & word document templates
• Voicemail Reports
• No current electronic scheduling system
• Manual entry and calculation for mileage reimbursement
• Manual transfer of patient visits
673/12/15
Current State Challenges • No safe guards in place, no double check
• Once it’s erased…. it’s gone (no history)
• Amount of non-productive time spent transferring patients
• Miscommunication of information
• Different systems in different locations
69
NURSE 3 x NURSE 4 x
Stop, Sign PHER CC
Test, Five DA Copy, Right 19128 LDA LFTS
One, Way DA
Jefferson, One DC Center Center Two
Jefferson, Two DC Cancer Center Three
Jefferson, Three NEWTOWN SM DOSE
NURSE 1 x Nurse 2 x
Test, Two PIVPatient, Two LEVITTOWN
7D HOOKUP @ BODINE ~1130
Test, One DC1130 Test, Three 19125 LDA
Test, Four 19135 FACTOR
CANCER CENTER ONE
Cancer, TwoCancer, ThreePatient, One 230 5FU H/U
Example of Word Document Scheduling Template
3/12/15
3/12/2015
2015 NHIA Annual Conference & Exposition 24
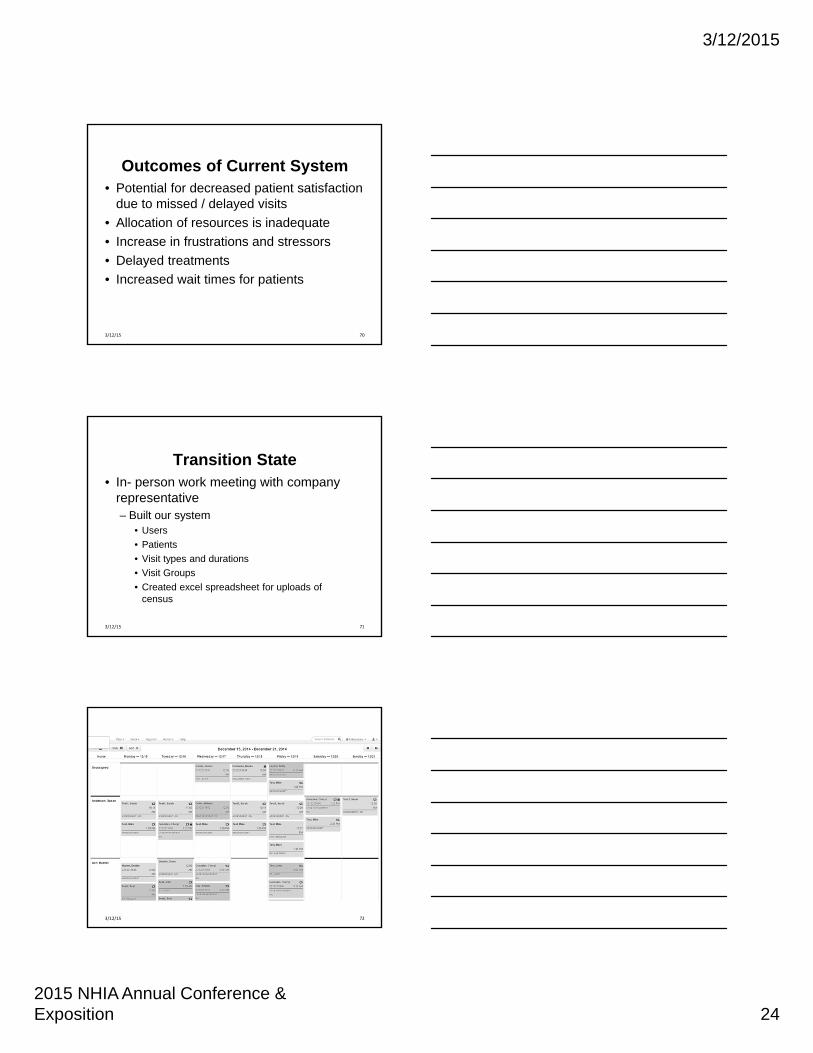
Outcomes of Current System• Potential for decreased patient satisfaction
due to missed / delayed visits
• Allocation of resources is inadequate
• Increase in frustrations and stressors
• Delayed treatments
• Increased wait times for patients
703/12/15
Transition State• In- person work meeting with company
representative– Built our system
• Users
• Patients
• Visit types and durations
• Visit Groups
• Created excel spreadsheet for uploads of census
713/12/15
723/12/15

3/12/2015
2015 NHIA Annual Conference & Exposition 25
Education• Outpatient Coordinators
– Changes in work rules and process
– Scheduling patients
– Remove discrepancies between offices
This step took several sessions and reinforcement was needed throughout the pilot
733/12/15
Reinforcement in certain areas was necessary to avoid future errors
• Plotting the visits
• Manipulating them on the schedule
• Sequence in which visits were plotted or deleted
• No reoccurring visits entered, leaving patients off schedule
“It does not matter how slowly you go as long as you do not stop.”
‐Confucius
743/12/15
Pilot Group• Five clinicians
– Different working styles
– Various levels of computer knowledge
– Different geographical areas
– Comfort levels varied
– Different levels of understanding of what this program is intended to do
753/12/15
3/12/2015
2015 NHIA Annual Conference & Exposition 26
Concerns and Issues@ follow- up sessions
• Missing patient demographic information
• Visit type incorrect
• Additional information vital to the visit not apparent (NO NOTE)
• Assignments changed after deadline with no notice
763/12/15
Positive Feedback
• Assignment is easily accessible
• Changes are immediate through out the day
• Travel reimbursement procedure fast and efficient
• Ability to look at future visit dates
• Use the system for daily patient logs
• Ability to see six week work schedule
773/12/15
Implementation
• Small groups for training
• Reinforced having an open mind
• Leave negativity at the door
• Follow up meetings for issues or concerns
• Open door policy
“Progress is impossible without change, and those who can not change their minds cannot change anything” -- George Bernard Shaw
783/12/15
3/12/2015
2015 NHIA Annual Conference & Exposition 27
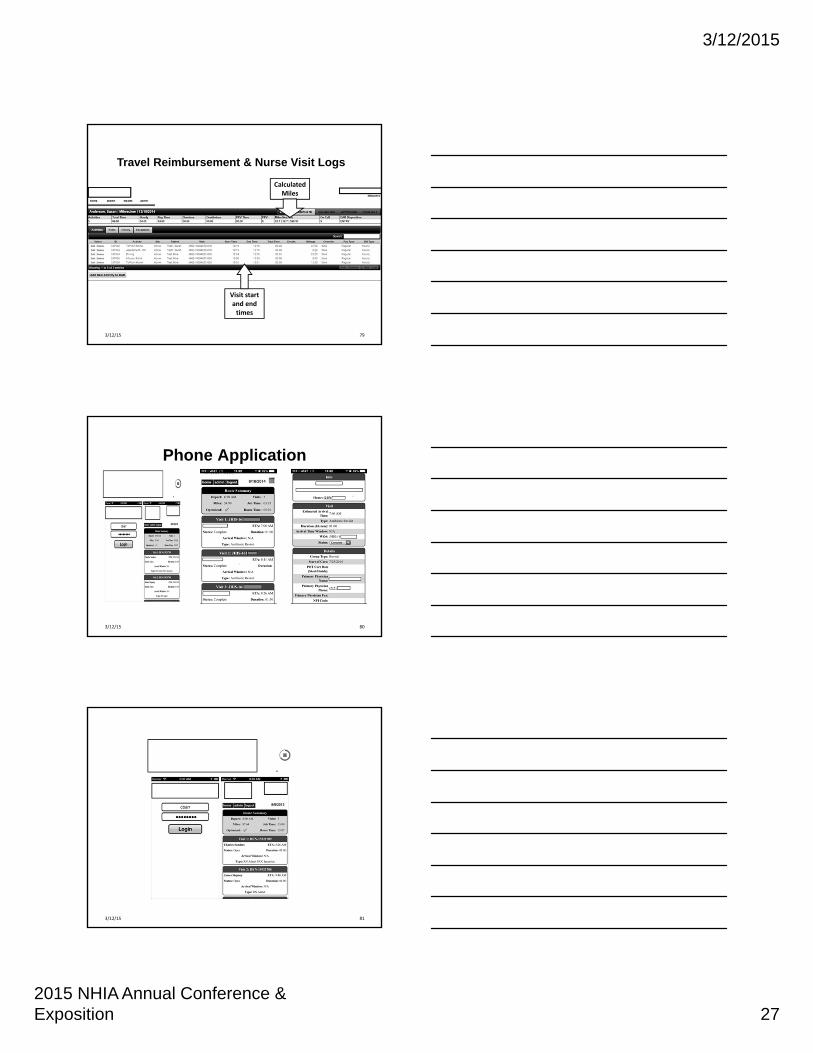
79
Calculated Miles
Visit start and end times
Travel Reimbursement & Nurse Visit Logs
3/12/15
Phone Application
803/12/15
813/12/15
3/12/2015
2015 NHIA Annual Conference & Exposition 28
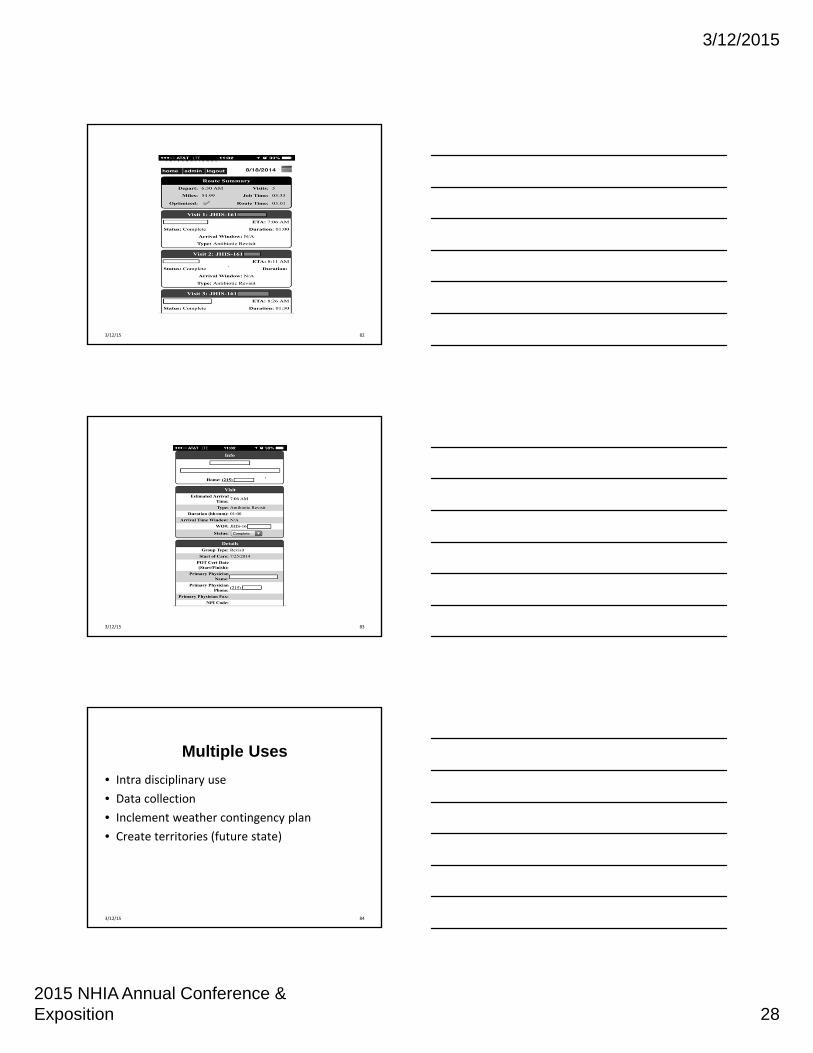
823/12/15
833/12/15
Multiple Uses
• Intra disciplinary use
• Data collection
• Inclement weather contingency plan
• Create territories (future state)
843/12/15
3/12/2015
2015 NHIA Annual Conference & Exposition 29
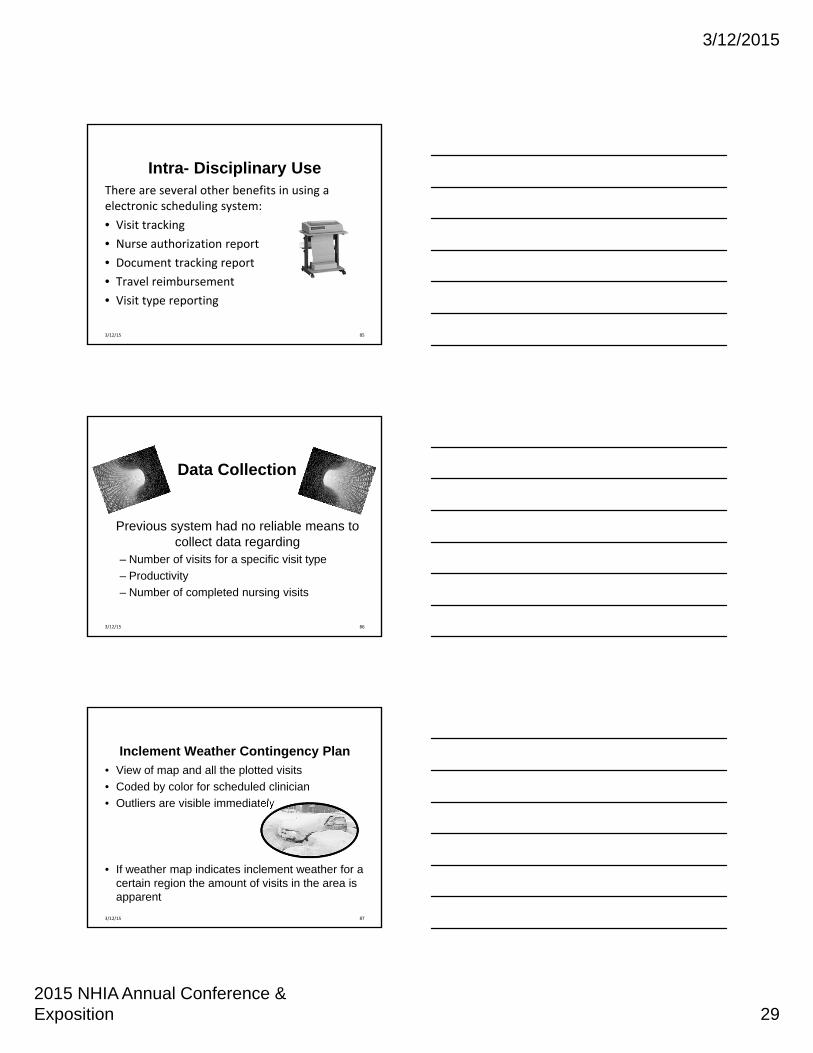
Intra- Disciplinary UseThere are several other benefits in using a electronic scheduling system:
• Visit tracking
• Nurse authorization report
• Document tracking report
• Travel reimbursement
• Visit type reporting
853/12/15
Data Collection
Previous system had no reliable means to collect data regarding
– Number of visits for a specific visit type
– Productivity
– Number of completed nursing visits
863/12/15
Inclement Weather Contingency Plan
• View of map and all the plotted visits
• Coded by color for scheduled clinician
• Outliers are visible immediately
• If weather map indicates inclement weather for a certain region the amount of visits in the area is apparent
873/12/15
3/12/2015
2015 NHIA Annual Conference & Exposition 30
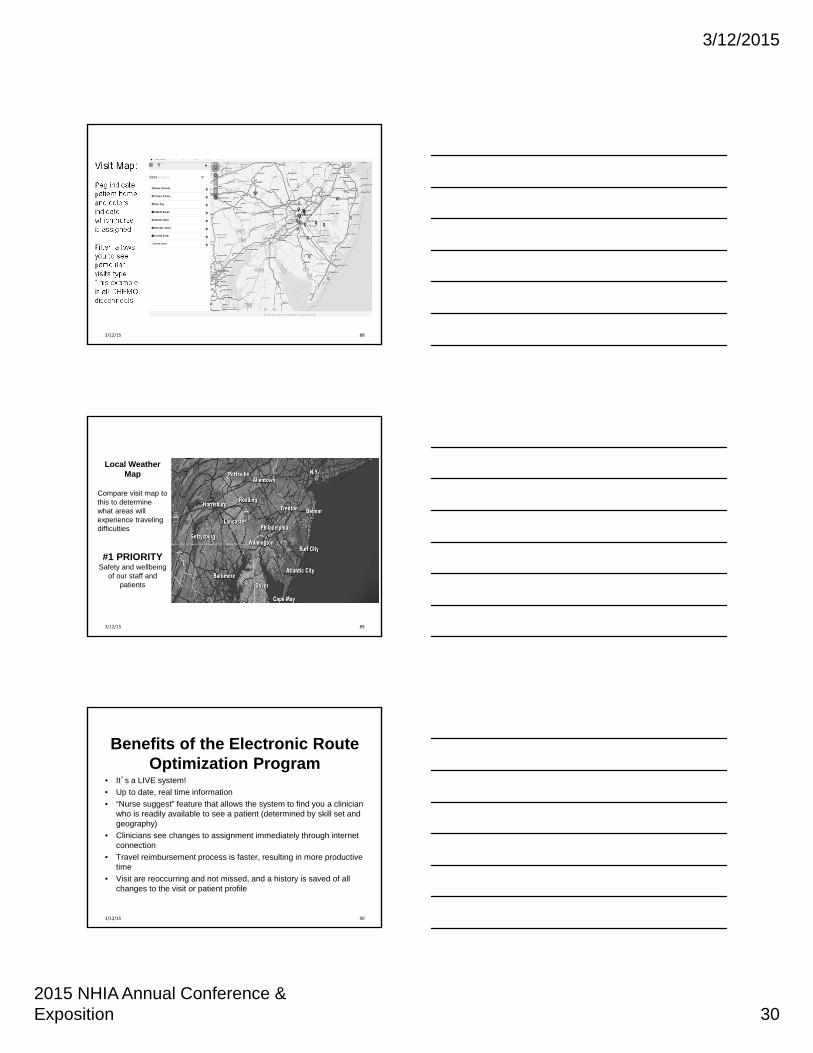
Visit Map:
Peg indicate patient home and colors indicate which nurse is assigned
Filter: allows you to see particular visits type. This example is all CHEMO disconnects
883/12/15
89
Local Weather Map
Compare visit map to this to determine what areas will experience traveling difficulties
#1 PRIORITYSafety and wellbeing
of our staff and patients
3/12/15
Benefits of the Electronic Route Optimization Program
• It’s a LIVE system!
• Up to date, real time information
• “Nurse suggest” feature that allows the system to find you a clinician who is readily available to see a patient (determined by skill set and geography)
• Clinicians see changes to assignment immediately through internet connection
• Travel reimbursement process is faster, resulting in more productive time
• Visit are reoccurring and not missed, and a history is saved of all changes to the visit or patient profile
903/12/15
3/12/2015
2015 NHIA Annual Conference & Exposition 31
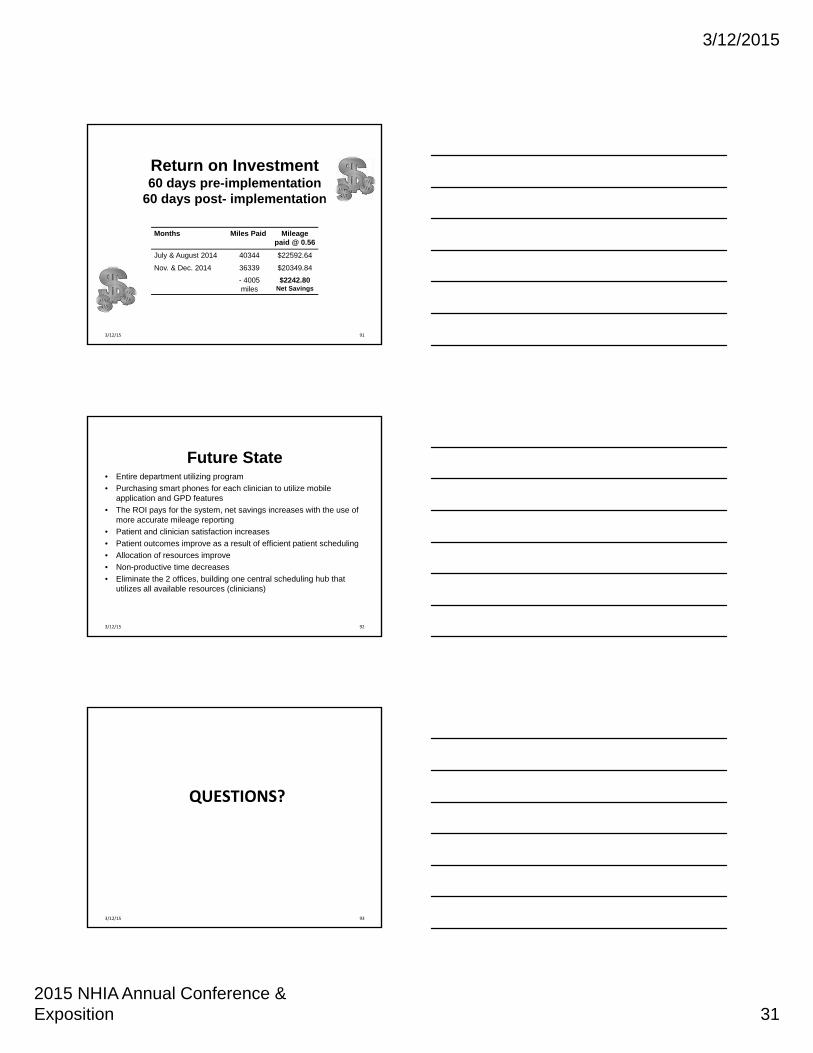
Return on Investment60 days pre-implementation
60 days post- implementation
Months Miles Paid Mileage paid @ 0.56
July & August 2014 40344 $22592.64
Nov. & Dec. 2014 36339 $20349.84
- 4005 miles
$2242.80Net Savings
913/12/15
Future State• Entire department utilizing program
• Purchasing smart phones for each clinician to utilize mobile application and GPD features
• The ROI pays for the system, net savings increases with the use of more accurate mileage reporting
• Patient and clinician satisfaction increases
• Patient outcomes improve as a result of efficient patient scheduling
• Allocation of resources improve
• Non-productive time decreases
• Eliminate the 2 offices, building one central scheduling hub that utilizes all available resources (clinicians)
923/12/15
QUESTIONS?
933/12/15