12 public hospitals - productivity commission...12.4 report on government services 2017 figure 12.2...
TRANSCRIPT

PUBLIC HOSPITALS 12.1
12 Public hospitals
CONTENTS
12.1 Profile of public hospitals 12.1
12.2 Framework of performance indicators for public hospitals 12.5
12.3 Key performance indicator results for public hospitals 12.7
12.4 Definitions of key terms 12.33
12.5 References 12.36
Attachment tables
Attachment tables are identified in references throughout this chapter by a ‘12A’ prefix (for
example, table 12A.1) and are available from the website at www.pc.gov.au/rogs/2017.
This chapter reports on the performance of State and Territory public hospitals, focusing
on acute care services. Commencing with this edition of the Report, the performance of
maternity services in public hospitals are no longer reported.
All abbreviations used in this Report are available in a complete list in volume A:
Approach to performance reporting.
12.1 Profile of public hospitals
Public hospitals provide a range of services, including:
acute care services to admitted patients
subacute and non-acute services to admitted patients (for example, rehabilitation,
palliative care and long stay maintenance care)
emergency, outpatient and other services to non-admitted patients
mental health services, including services provided to admitted patients by designated
psychiatric/psychogeriatric units
public health services

12.2 REPORT ON GOVERNMENT SERVICES 2017
teaching and research activities.
This chapter focuses on services (acute, subacute and non-acute) provided to admitted
patients and services provided to non-admitted patients in public hospitals. These services
comprise the bulk of public hospital activity.
In some instances, data for stand-alone psychiatric hospitals are included in this chapter.
The performance of psychiatric hospitals and psychiatric units of public hospitals is
examined more closely in the ‘Mental health management’ chapter of this Report
(chapter 13).
Funding
Total recurrent expenditure on public hospitals (excluding depreciation) was $55.0 billion
in 2014-15 (table 12A.1), with 90.8 per cent funded by the Australian, State and Territory
governments and 9.2 per cent funded by non-government sources (including depreciation)
(AIHW 2016b).
Government real recurrent expenditure on public hospitals per person has increased from
$1850.9 per person in 2010-11 to $2321.1 in 2014-15 (table 12A.2).
Size and scope of sector
Hospitals
In 2014-15, Australia had 698 public hospitals (table 12A.3). Although 68.9 per cent of
hospitals had 50 or fewer beds (figure 12.1), these smaller hospitals represented only
14.3 per cent of total available beds (table 12A.3).

PUBLIC HOSPITALS 12.3
Figure 12.1 Public hospitals, by size, 2014-15a, b
a See table 12A.3 for detailed footnotes and caveats. b The ACT did not have hospitals with more than 10
to 50 beds or more than 50 to 100 beds. The NT did not have hospitals with 10 or fewer beds.
Source: AIHW (2016), Hospital resources 2014-15: Australian hospital statistics, Health services series no.
71. Cat. no. HSE 176; table 12A.3.
Hospital beds
There were 60 340 available beds for admitted patients in public hospitals in 2014-15,
equivalent to 2.6 beds per 1000 people (table 12A.3 and table 12A.4). The concept of an
available bed is becoming less important in the overall context of hospital activity,
particularly given the increasing significance of same day hospitalisations and hospital-in-
the-home care (AIHW 2011). Nationally, more beds were available per 1000 people in
remote areas (table 12A.4).
Admitted patient care
There were approximately 6.0 million separations from public (non-psychiatric) hospitals
in 2014-15, of which just over half were same day patients (table 12A.5). Nationally, this
translates into 239.8 separations per 1000 people (figure 12.2). Acute separations
accounted for the majority of separations from public hospitals (table 12A.10).
0
20
40
60
80
100
NSW Vic Qld WA SA Tas ACT NT Aust
Pe
r ce
nt
10 or fewer beds more than 10 to 50 beds
more than 50 to 100 beds more than 100 beds

12.4 REPORT ON GOVERNMENT SERVICES 2017
Figure 12.2 Separation rates in public (non-psychiatric) hospitalsa
a See table 12A.6 for detailed footnotes and caveats.
Source: AIHW (various years), Australian Hospital Statistics, Health Services Series, Cat. nos HSE 117,
134 and 145; AIHW (various years), Admitted patient care: Australian hospital statistics, Health services
series Cat. no. HSE 156 and 172; table 12A.6.
Variations in admission rates can reflect different practices in classifying patients as either
admitted same day patients or non-admitted outpatients. The extent of differences in
classification practices can be inferred from the variation in the proportion of same day
separations across jurisdictions for certain conditions or treatments. This is particularly true
of medical separations. Significant variation across jurisdictions in the proportion of same
day medical separations was evident in 2014-15 (table 12A.7).
In 2014-15, on an age standardised basis, public hospital separations (including same day
separations) for Aboriginal and Torres Strait Islander Australians were markedly higher
than the corresponding rate for all Australians (table 12A.8).
Non-admitted patient services
Non-admitted patient services include outpatient services, which may be provided on an
individual or group basis, and emergency department services. A total of 33.8 million
individual service events were provided to outpatients in public hospitals in 2014-15 and
around one million group service events (table 12A.11). Differing admission practices
across states and territories lead to variation among jurisdictions in the services reported
(AIHW 2016c). There were 7.4 million presentations to emergency departments in
2014-15 (table 12A.12).
0
100
200
300
400
500
600
700
NSW Vic Qld WA SA Tas ACT NT Aust
Se
para
tio
ns/'000 p
eo
ple
2010-11 to 2013-14 2014-15

PUBLIC HOSPITALS 12.5
Staff
In 2014-15, nurses comprised the single largest group of full time equivalent (FTE) staff
employed in public hospitals (figure 12.3). Comparing data on FTE staff across
jurisdictions should be undertaken with care, as these data are affected by jurisdictional
differences in the recording and classification of staff.
Figure 12.3 Average FTE staff per 1000 people, public hospital services, 2014-15a
a See table 12A.9 for detailed footnotes and caveats.
Source: AIHW (2016), Hospital resources 2014-15: Australian hospital statistics. Health services series no.
71. Cat. no. HSE 176; ABS (unpublished), Australian Demographic Statistics, December Quarter 2014,
Cat. no. 3101.0; tables 12A.9 and 2A.2.
12.2 Framework of performance indicators for public
hospitals
Performance is reported against objectives that are common to public hospitals in all
jurisdictions (box 12.1).
0
2
4
6
8
NSW Vic Qld WA SA Tas ACT NT Aust
Sta
ff/'0000
pe
op
le
Salaried medical officers Nurses
Diagnostic and allied health Administrative and clerical
Other staff

12.6 REPORT ON GOVERNMENT SERVICES 2017
Box 12.1 Objectives for public hospitals
Public hospitals aim to alleviate or manage illness and the effects of injury and rehabilitate
where necessary by providing universal access to acute, non and sub-acute care along with
emergency, outpatient and community care that is:
timely, affordable and accessible
appropriate and responsive to the needs of individuals and communities
high quality and safe
well co-ordinated to ensure continuity of care where more than one service type, and/or
ongoing service provision is required
sustainable in terms of workforce, infrastructure, innovation and capacity to respond to
emerging needs.
Governments aim for public hospital services to meet these objectives in an equitable and
efficient manner.
The performance indicator framework provides information on equity, efficiency and
effectiveness, and distinguishes the outputs and outcomes of public hospital services
(figure 12.4).
The performance indicator framework shows which data are complete and comparable in
the 2017 Report. For data that are not considered directly comparable, text includes
relevant caveats and supporting commentary. Chapter 1 discusses data comparability, data
completeness and information on data quality from a Report-wide perspective. In addition
to section 12.1, the Report’s Statistical context chapter (chapter 2) contains data that may
assist in interpreting the performance indicators presented in this chapter.
Improvements to performance reporting for public hospitals are ongoing and will include
identifying indicators to fill gaps in reporting against key objectives, improving the
comparability and completeness of data and reviewing proxy indicators to see if more
direct measures can be developed.

PUBLIC HOSPITALS 12.7
Figure 12.4 Public hospitals performance indicator framework
12.3 Key performance indicator results for public
hospitals
Different delivery contexts, locations and types of client can affect the equity, effectiveness
and efficiency of health services.

12.8 REPORT ON GOVERNMENT SERVICES 2017
Outputs
Outputs are the services delivered (while outcomes are the impact of these services on the
status of an individual or group) (see chapter 1). Output information is also critical for
equitable, efficient and effective management of government services.
Equity
Access — Equity of access by special needs groups
‘Equity of access by special needs groups’ is an indicator of governments’ objective to
provide hospital services in an equitable manner (box 12.2).
Box 12.2 Equity of access by special needs groups
‘Equity of access by special needs groups’ measures the performance of agencies providing
services for identified special needs groups including: Aboriginal and Torres Strait Islander
Australians; people living in communities outside the capital cities (that is, people living in other
metropolitan areas, or rural and remote communities); and people from culturally and
linguistically diverse backgrounds.
Equity of access by special needs groups has been identified as a key area for development in
future Reports. Data for the emergency department waiting times and waiting times for admitted
patient services indicators are reported by Indigenous status, remoteness and socioeconomic
status.
Effectiveness
Access — Emergency department waiting times
‘Emergency department waiting times’ is an indicator of governments’ objective to
provide timely and accessible services (box 12.3).

PUBLIC HOSPITALS 12.9
Box 12.3 Emergency department waiting times
‘Emergency department waiting times’ is defined by the following two measures:
Emergency department waiting times by triage category, defined as the proportion of
patients seen within the benchmarks set by the Australasian Triage Scale. The Australasian
Triage Scale is a scale for rating clinical urgency, designed for use in hospital-based
emergency services in Australia and New Zealand. The benchmarks, set according to triage
category, are as follows:
– triage category 1: need for resuscitation — patients seen immediately
– triage category 2: emergency — patients seen within 10 minutes
– triage category 3: urgent — patients seen within 30 minutes
– triage category 4: semi-urgent — patients seen within 60 minutes
– triage category 5: non-urgent — patients seen within 120 minutes.
Length of stay for emergency department care, proportion of patients staying for four hours
or less, is defined as the percentage of presentations to public hospital emergency
departments where the time from presentation to admission, transfer or discharge is less
than or equal to four hours. It is a measure of the duration of the emergency department
service rather than a waiting time for emergency department care.
High or increasing proportions for both measures is desirable.
Data reported for both measures are:
comparable (subject to caveats) within jurisdictions over time but are not comparable across
jurisdictions
incomplete for the current reporting period. All required 2015-16 data were not available for
the ACT.
Emergency department waiting times by triage category
Nationally, in 2015-16 (excluding the ACT), all patients in triage category 1 were seen
within the clinically appropriate timeframe. For all triage categories combined, around
three-quarters of patients were seen within triage category timeframes (table 12.1). The
comparability of emergency department waiting times data across jurisdictions can be
influenced by differences in data coverage and clinical practices — in particular, the
allocation of cases to urgency categories. The proportion of patients in each triage category
who were subsequently admitted can indicate the comparability of triage categorisations
across jurisdictions and thus the comparability of the waiting times data (table 12A.13).
Emergency department waiting times by hospital peer group, Indigenous status,
remoteness and socioeconomic status for public hospitals are reported in the attachment
(tables 12A.14–17).

12.10 REPORT ON GOVERNMENT SERVICES 2017
Table 12.1 Proportion of emergency department patients seen within
triage category timeframes, public hospitals, 2015-16a
Triage category NSW Vic Qld WA SA Tas ACTb NT Austb
1 — Resuscitation 100 100 100 100 100 100 na 100 100
2 — Emergency 82 78 74 77 70 80 na 63 77
3 — Urgent 76 71 61 53 56 59 na 53 67
4 — Semi-urgent 80 72 74 67 70 64 na 60 74
5 — Non-urgent 94 89 94 93 92 87 na 89 93
Total 81 74 70 65 66 66 na 61 74
a See box 12.3 and table 12A.13 for detailed definitions, footnotes and caveats. b Data for the ACT were
not available at the time of data supply. Australian totals exclude the ACT. na Not available.
Source: AIHW (2016), Emergency department care 2015-16: Australian hospital statistics. Health services
series no. 72. Cat. no. HSE 182; table 12A.13.
Proportion of patients staying for four hours or less
The proportion of patients staying for four hours or less in an emergency department has
increased from 64.3 per cent in 2011-12 to 73.2 per cent in 2015-16 (figure 12.5).
Figure 12.5 Length of stay for emergency department care, proportion of
patients staying for four hours or lessa, b
a See box 12.3 and table 12A.18 for detailed definitions, footnotes and caveats. b Data for the ACT for
2015-16 were not available at the time of data supply. The Australian total for 2015-16 excludes the ACT.
Source: AIHW (various years), Emergency department care: Australian hospital statistics. Health services
series no. 45, 52, 58, 65 and 72 Cat. no. HSE 126, 142, 153, 168 and 182; table 12A.18.
0
20
40
60
80
100
NSW Vic Qld WA SA Tas ACT NT Aust
Pe
r ce
nt
2011-12 to 2014-15 2015-16

PUBLIC HOSPITALS 12.11
Waiting times for admitted patient services
‘Waiting times for admitted patient services’ is an indicator of governments’ objective to
provide timely and accessible services (box 12.4).
Box 12.4 Waiting times for admitted patient services
‘Waiting times for admitted patient services’ is defined by the following three measures:
Overall elective surgery waiting times
Elective surgery waiting times by clinical urgency category
Presentations to emergency departments with a length of stay of 4 hours or less ending in
admission
Data reported for these three measures are:
comparable (subject to caveats) within jurisdictions over time but are not comparable across
jurisdictions
incomplete for the current reporting period. All required 2015-16 data were not available for
the ACT.
Overall elective surgery waiting times
‘Overall elective surgery waiting times’ are calculated by comparing the date patients are added
to a waiting list with the date they were admitted. Days on which the patient was not ready for
care are excluded. ‘Overall waiting times’ are presented as the number of days within which 50
per cent of patients are admitted and the number of days within which 90 per cent of patients
are admitted. Patients on waiting lists who were not subsequently admitted to hospital are
excluded.
For overall elective surgery waiting times, a low or decreasing number of days waited are
desirable.
Elective surgery waiting times by clinical urgency category
‘Elective surgery waiting times by clinical urgency category’ reports the proportion of patients
who were admitted from waiting lists after an extended wait. In general, at the time of being
placed on the public hospital waiting list, a clinical assessment is made of the urgency with
which the patient requires elective surgery. The clinical urgency categories are:
Category 1 — procedures that are clinically indicated within 30 days
Category 2 — procedures that are clinically indicated within 90 days
Category 3 — procedures that are clinically indicated within 365 days.
The term ‘extended wait’ is used for patients in the categories 1, 2 and 3 waiting longer than
specified times (30 days, 90 days and 365 days respectively).
(continued next page)

12.12 REPORT ON GOVERNMENT SERVICES 2017
Box 12.4 (continued)
For elective surgery waiting times by clinical urgency category, a low or decreasing proportion
of patients who have experienced extended waits at admission is desirable. However, variation
in the way patients are classified to urgency categories should be considered. Rather than
comparing jurisdictions, the results for individual jurisdictions should be viewed in the context of
the proportions of patients assigned to each of the three urgency categories.
Presentations to emergency departments with a length of stay of 4 hours or less
ending in admission
‘Presentations to emergency departments with a length of stay of 4 hours or less ending in
admission’ is defined as the percentage of presentations to public hospital emergency
departments where the time from presentation to admission to hospital is less than or equal to
four hours.
A high or increasing proportion of presentations to emergency departments with a length of stay
of 4 hours or less ending in admission is desirable.
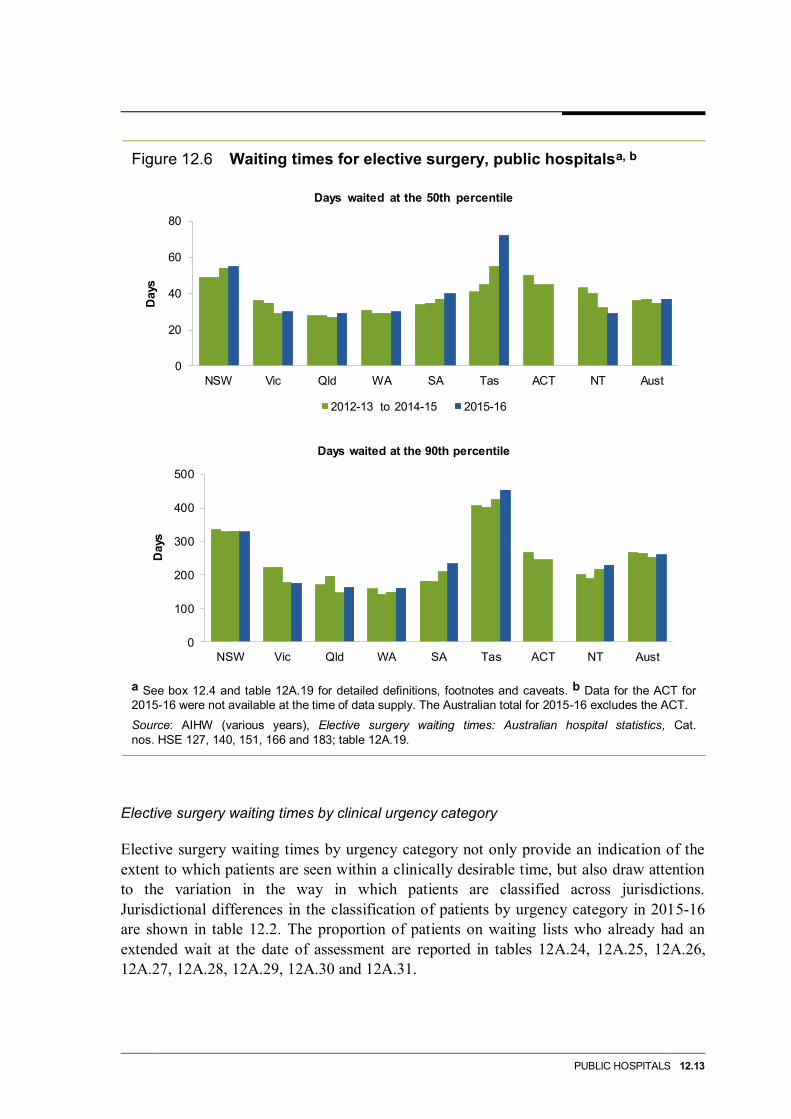
Overall elective surgery waiting times
Nationally in 2015-16 (excluding the ACT), 50 per cent of patients were admitted within
37 days and 90 per cent of patients were admitted within 260 days (figure 12.6 and
table 12A.19). Attachment 12A includes data on elective surgery waiting times by hospital
peer group and indicator procedure. It also includes waiting times by Indigenous status,
remoteness and socioeconomic status (tables 12A.19–22).
Comparisons across jurisdictions should be made with caution, due to differences in
clinical practices and classification of patients across Australia. The measures are also
affected by variations across jurisdictions in the method used to calculate waiting times for
patients who transferred from a waiting list managed by one hospital to a waiting list
managed by another hospital, with the time waited on the first list included in the waiting
time reported in NSW, WA, SA and the NT. This approach can have the effect of
increasing the apparent waiting times for admissions in these jurisdictions compared with
other jurisdictions (AIHW 2016a).
PUBLIC HOSPITALS 12.13
Figure 12.6 Waiting times for elective surgery, public hospitalsa, b
a See box 12.4 and table 12A.19 for detailed definitions, footnotes and caveats. b Data for the ACT for
2015-16 were not available at the time of data supply. The Australian total for 2015-16 excludes the ACT.
Source: AIHW (various years), Elective surgery waiting times: Australian hospital statistics, Cat.
nos. HSE 127, 140, 151, 166 and 183; table 12A.19.
Elective surgery waiting times by clinical urgency category
Elective surgery waiting times by urgency category not only provide an indication of the
extent to which patients are seen within a clinically desirable time, but also draw attention
to the variation in the way in which patients are classified across jurisdictions.
Jurisdictional differences in the classification of patients by urgency category in 2015-16
are shown in table 12.2. The proportion of patients on waiting lists who already had an
extended wait at the date of assessment are reported in tables 12A.24, 12A.25, 12A.26,
12A.27, 12A.28, 12A.29, 12A.30 and 12A.31.
0
20
40
60
80
NSW Vic Qld WA SA Tas ACT NT Aust
Days
Days waited at the 50th percentile
2012-13 to 2014-15 2015-16
0
100
200
300
400
500
NSW Vic Qld WA SA Tas ACT NT Aust
Days
Days waited at the 90th percentile

12.14 REPORT ON GOVERNMENT SERVICES 2017
Table 12.2 Elective surgery waiting times by clinical urgency category,
2015-16 (per cent)a
Patients on waiting lists Patients admitted from waiting lists
Patients admitted from waiting lists with extended waits
New South Wales
Category 1 2.4 22.4 0.2
Category 2 15.4 33.3 2.9
Category 3 82.2 44.3 4.4
Total 100.0 100.0 2.9
Victoria
Category 1 4.7 29.8 –
Category 2 47.7 46.3 22.9
Category 3 47.6 23.9 6.3
Total 100.0 100.0 12.1
Queensland
Category 1 5.9 36.2 2.4
Category 2 27.4 40.0 5.3
Category 3 66.7 23.8 1.6
Total 100.0 100.0 3.4
Western Australia
Category 1 5.9 24.6 8.2
Category 2 24.9 34.7 10.7
Category 3 69.2 40.7 1.9
Total 100.0 100.0 6.5
South Australia
Category 1 4.3 25.6 10.0
Category 2 21.8 36.6 11.6
Category 3 73.8 37.8 4.7
Total 99.9 100.0 8.6
Tasmania
Category 1 6.6 31.9 22.9
Category 2 37.5 41.7 56.6
Category 3 55.9 26.4 37.1
Total 100.0 100.0 40.7
(continued next page)

PUBLIC HOSPITALS 12.15
Table 12.2 (continued)
Patients on waiting lists
Patients admitted from waiting lists
Patients admitted from waiting lists with extended waits
Australian Capital Territoryb
Category 1 na na na
Category 2 na na na
Category 3 na na na
Total na na na
Northern Territory
Category 1 4.9 37.5 6.8
Category 2 32.9 44.0 33.1
Category 3 62.2 18.5 19.6
Total 100.0 100.0 20.8
a See box 12.4 and tables 12A.23, 12A.24, 12A.25, 12A.26, 12A.27, 12A.28, 12A.29, 12A.30 and 12A.31
for detailed definitions, footnotes and caveats. b Data for the ACT were not available at the time of data
supply. na Not available. – Nil or rounded to zero.
Source: AIHW (unpublished) National Elective Surgery Waiting Times Data Collection; tables 12A.23,
12A.24, 12A.25, 12A.26, 12A.27, 12A.28, 12A.29, 12A.30 and 12A.31.
Emergency department presentations with stay of 4 hours or less ending in admission
Nationally in 2015-16 (excluding the ACT), almost half of those who presented to an
emergency department and were admitted, waited 4 hours or less to be admitted to a public
hospital (table 12.3).
Table 12.3 Proportion of emergency department presentations with a length of stay 4 hours or less ending in admission, 2015-16a
Triage category NSW Vic Qld WA SA Tas ACTb NT Austb
1 — Resuscitation 52 57 59 66 59 58 na 46 57
2 — Emergency 45 53 56 58 45 34 na 28 50
3 — Urgent 41 51 55 48 40 24 na 25 47
4 — Semi-urgent 46 55 58 50 47 28 na 28 50
5 — Non-urgent 66 65 65 60 67 48 na 36 64
Total 44 53 56 51 44 28 na 27 49
a See box 12.4 and table 12A.32 for detailed definitions, footnotes and caveats. b Data for the ACT were
not available at the time of data supply and have not been included in the Australian totals. na Not
available.
Source: AIHW (2016), Emergency department care 2015-16: Australian hospital statistics. Health services
series no. 72. Cat. no. HSE 182; table 12A.32.

12.16 REPORT ON GOVERNMENT SERVICES 2017
Quality — Safety — hospital accreditation
‘Accreditation’ is an indicator of governments’ objective to provide public hospital
services that are high quality and safe (box 12.5).
Box 12.5 Accreditation
‘Accreditation’ is defined by the proportion of hospitals accredited to the National Safety and
Quality Health Service standards. The standards are:
Governance for safety and quality in health service organisations
Partnering with consumers
Preventing and controlling healthcare associated infections
Medication safety
Patient identification and procedure matching
Clinical handover
Blood and blood products
Preventing and managing pressure injuries
Recognising and responding to clinical deterioration in acute health care
Preventing falls and harm from falls.
A high or increasing rate of accreditation is desirable. However, it is not possible to draw
conclusions about the quality of care in those hospitals that are not accredited to all standards.
Data reported for this indicator are:
comparable (subject to caveats) across jurisdictions but not over time. Data for 2013-14 and
2014-15 are not comparable with prior years.
complete (subject to caveats) for the current reporting period. All required 2015 data are
available for all jurisdictions.
The proportion of accredited public hospitals is reported in figure 12.7.
Accreditation is provided by a number of bodies, including the Australian Healthcare
Standards’ Evaluation and Quality Improvement Program, Business Excellence Australia,
and the Quality Improvement Council. Hospitals can also be certified as compliant with the
International Organization for Standardization’s (ISO) 9000 quality family.

PUBLIC HOSPITALS 12.17
Figure 12.7 Proportion of public hospitals accredited to the National
Safety and Quality Health Service Standards, 30 June 2015a
a See box 12.5 and table 12A.33 for detailed definitions, footnotes and caveats.
Source: AIHW (2016), Hospital resources 2014-15: Australian hospital statistics. Health services series
no. 71. Cat. no. HSE 176; SA government (unpublished); table 12A.33.
Australian Health Ministers have mandated accreditation in all public and private hospitals
and day procedure services in Australia from 1 January 2013. From this date health
services are to be assessed to the National Safety and Quality Health Service (NSQHS)
Standards by accrediting agencies approved by the Australian Commission for Safety and
Quality in Health Care. By end 2016 it is anticipated all Australian hospitals will have been
accredited to all 10 NSQHS standards.
Quality — Safety — adverse events in public hospitals
‘Adverse events in public hospitals’ is an indicator of governments’ objective to provide
public hospital services that are high quality and safe (box 12.6). Sentinel events, which
are a subset of adverse events that result in death or very serious harm to the patient, are
reported as a separate output indicator.
0
20
40
60
80
100
NSW Vic Qld WA SA Tas ACT NT Aust
Pe
r ce
nt

12.18 REPORT ON GOVERNMENT SERVICES 2017
Box 12.6 Adverse events in public hospitals
‘Adverse events in public hospitals’ is defined by the following three measures:
selected healthcare-associated infections
adverse events treated in hospitals
falls resulting in patient harm in hospitals.
Selected healthcare-associated infections
‘Selected healthcare-associated infections’ is the number of Staphylococcus aureus (including
Methicillin-resistant Staphylococcus aureus [MRSA]) bacteraemia (SAB) patient episodes
associated with public hospitals (admitted and non-admitted patients), expressed as a rate per
10 000 patient days for public hospitals.
A patient episode of SAB is defined as a positive blood culture for SAB. Only the first isolate per
patient is counted, unless at least 14 days has passed without a positive blood culture, after
which an additional episode is recorded.
SAB is considered to be healthcare-associated if the first positive blood culture is collected
more than 48 hours after hospital admission or less than 48 hours after discharge, or if the first
positive blood culture is collected 48 hours or less after admission and one or more of the
following key clinical criteria was met for the patient episode of SAB:
SAB is a complication of the presence of an indwelling medical device
SAB occurs within 30 days of a surgical procedure where SAB is related to the surgical site
an invasive instrumentation or incision related to the SAB was performed within 48 hours
SAB is associated with neutropenia contributed to by cytotoxic therapy. Neutropenia is
defined as at least two separate calendar days with values of absolute neutrophil count
(ANC) <500 cell/mm3 (0.5 × 10
9/L) on or within a seven-day time period which includes the
date the positive blood specimen was collected (Day 1), the three calendar days before and
the three calendar days after.
Cases where a known previous positive test has been obtained within the last 14 days are
excluded. Patient days for unqualified newborns, hospital boarders and posthumous organ
procurement are excluded.
A low or decreasing rate of selected healthcare-associated infections is desirable.
Data reported for this measure are:
comparable (subject to caveats) within jurisdictions over time but are not comparable across
jurisdictions
complete (subject to caveats) for the current reporting period. All required 2015-16 data are
available for all jurisdictions.
(continued next page)

PUBLIC HOSPITALS 12.19
Box 12.6 (continued)
Adverse events treated in hospitals
‘Adverse events treated in hospitals’ are incidents in which harm resulted to a person during
hospitalisation and are measured by separations that had an adverse event (including
infections, falls resulting in injuries and problems with medication and medical devices) that
occurred during hospitalisation. Hospital separations data include information on diagnoses and
place of occurrence that can indicate that an adverse event was treated and/or occurred during
the hospitalisation, but some adverse events are not identifiable using these codes.
Low or decreasing adverse events treated in hospitals is desirable.
Data reported for this measure are:
comparable (subject to caveats) across jurisdictions and over time
complete (subject to caveats) for the current reporting period. All required 2014-15 data are
available for all jurisdictions.
Falls resulting in patient harm in hospitals
‘Falls resulting in patient harm in hospitals’ is defined as the number of separations with an
external cause code for fall and a place of occurrence of health service area, expressed as a
rate per 1000 hospital separations. It is not possible to determine if the place of occurrence was
a public hospital, only that it was a health service area.
A low or decreasing rate of falls resulting in patient harm in hospitals is desirable.
Data reported for this measure are:
comparable (subject to caveats) across jurisdictions and over time
complete (subject to caveats) for the current reporting period. All required 2014-15 data are
available for all jurisdictions.
Selected healthcare-associated infections
Selected healthcare-associated infections per 10 000 patient days is reported in figure 12.8.

12.20 REPORT ON GOVERNMENT SERVICES 2017
Figure 12.8 Selected healthcare-associated infections, public hospitalsa
a See box 12.6 and table 12A.34 for detailed definitions, footnotes and caveats.
Source: AIHW 2016 Staphylococcus aureus bacteraemia in Australian public hospitals 2015-16 Australian
hospital statistics. Health services series; table 12A.34.
Adverse events treated in hospitals
In 2014-15, 6.7 per cent of separations in public hospitals had an adverse event reported
during hospitalisation (table 12.4). A separation may be recorded against more than one
category, as some adverse events are reported as diagnoses and others as external causes or
places of occurrence (of the injury or poisoning) — results by category are in table 12A.35.
Table 12.4 Separations with an adverse event per 100 separations, public hospitals, 2014-15a
NSW Vic Qld WA SA Tas ACT NT Aust
Total 6.8 6.6 6.4 7.1 7.5 8.0 7.3 3.5 6.7
a See box 12.6 and table 12A.35 for detailed definitions, footnotes and caveats.
Source: AIHW (unpublished), National Hospital Morbidity Database; table 12A.35.
0.0
0.2
0.4
0.6
0.8
1.0
1.2
1.4
NSW Vic Qld WA SA Tas ACT NT Aust
Infe
cti
on
s/1
0
000 p
ati
en
t d
ays
2011-12 to 2014-15 2015-16

PUBLIC HOSPITALS 12.21
Falls resulting in patient harm in hospitals
Falls resulting in patient harm per 1000 hospital separations, where the place of occurrence
was a health service area, varied across states and territories in 2014-15 (figure 12.9). Data
are reported by Indigenous status and remoteness in table 12A.36.
Figure 12.9 Separations for falls resulting in patient harm in public
hospitals, 2014-15a
a See box 12.6 and table 12A.36 for detailed definitions, footnotes and caveats.
Source: AIHW (2016), Admitted patient care 2014-15: Australian hospital statistics. Health services series
no. 68. Cat. no. HSE 172; table 12A.36.
Quality — Safety — Sentinel events
‘Sentinel events’ is an indicator of governments’ objective to deliver public hospital
services that are high quality and safe (box 12.7). Sentinel events are a subset of adverse
events that result in death or very serious harm to the patient. Adverse events are reported
as a separate output indicator.
0.0
1.0
2.0
3.0
4.0
5.0
6.0
7.0
8.0
NSW Vic Qld WA SA Tas ACT NT Aust
falls/'000
se
para
tio
ns

12.22 REPORT ON GOVERNMENT SERVICES 2017
Box 12.7 Sentinel events
‘Sentinel events’ is defined as the number of reported adverse events that occur because of
hospital system and process deficiencies, and which result in the death of, or serious harm to, a
patient. Sentinel events occur relatively infrequently and are independent of a patient’s
condition.
Australian health ministers have agreed on a national core set of sentinel events for which all
public hospitals are required to provide data. The eight agreed core sentinel events are:
1. Procedures involving the wrong patient or body part resulting in death or major permanent
loss of function.
2. Suicide of a patient in an inpatient unit.
3. Retained instruments or other material after surgery requiring re-operation or further surgical
procedure.
4. Intravascular gas embolism resulting in death or neurological damage.
5. Haemolytic blood transfusion reaction resulting from ABO (blood group) incompatibility.
6. Medication error leading to the death of a patient reasonably believed to be due to incorrect
administration of drugs.
7. Maternal death associated with pregnancy, birth or the puerperium.
8. Infant discharged to the wrong family.
A low or decreasing number of sentinel events is desirable.
Over time, an increase in the number of sentinel events reported might reflect improvements in
incident reporting mechanisms and organisational cultural change, rather than an increase in
the frequency of such events. However, trends need to be monitored to establish whether this is
the underlying reason.
Data reported for this indicator are:
comparable (subject to caveats) within jurisdictions over time but are not comparable across
jurisdictions
complete (subject to caveats) for the current reporting period. All required 2014-15 data are
available for all jurisdictions.
Sentinel event programs have been implemented by all State and Territory governments.
The purpose of these programs is to facilitate a safe environment for patients by reducing
the frequency of these events. The programs are not punitive, and are designed to facilitate
self-reporting of errors so that the underlying causes of the events can be examined, and
action taken to reduce the risk of these events re-occurring.
Numbers of sentinel events for 2014-15 are reported below. As larger states and territories
will tend to have more sentinel events than smaller jurisdictions, the numbers of
separations are also presented to provide context.
PUBLIC HOSPITALS 12.23
In 2014-15:
In NSW public hospitals there was a total of 50 sentinel events (table 12A.37)
compared to around 1.8 million separations (table 12A.5).
In Victorian public hospitals there was a total of 19 sentinel events (table 12A.38)
compared to around 1.6 million separations (table 12A.5).
In Queensland public hospitals there was a total of 10 sentinel events (table 12A.39)
compared to around 1.2 million separations (table 12A.5).
In WA public hospitals there was a total of 5 sentinel events (table 12A.40) compared
to around 601 000 separations (table 12A.5).
In SA public hospitals there was a total of 9 sentinel events (table 12A.41) compared to
around 422 000 separations (table 12A.5).
In Tasmanian public hospitals there were no reported sentinel events (table 12A.42)
compared to around 120 000 separations (table 12A.5).
In ACT public hospitals there were 4 reported sentinel events (table 12A.43). There
were around 101 000 separations (table 12A.5).
In NT public hospitals there was a total of 2 sentinel events (table 12A.44) compared to
around 132 000 separations (table 12A.5).
Data for 2010-11 to 2014-15 are reported in tables 12A.37–44, along with disaggregation
by the type of sentinel event. Australian totals are reported in table 12A.45.
Quality — Responsiveness — Patient satisfaction
‘Patient satisfaction’ provides a proxy measure of governments’ objective to deliver
services that are high quality and responsive to individual patient needs (box 12.8).

12.24 REPORT ON GOVERNMENT SERVICES 2017
Box 12.8 Patient satisfaction
‘Patient satisfaction’ is defined by the following six measures for the purposes of this report:
Proportion of people who went to an emergency department in the last 12 months reporting
that the emergency department doctors, specialists or nurses ‘always’ or ‘often’:
– listened carefully to them
– showed respect to them
– spent enough time with them
Proportion of people who were admitted to hospital in the last 12 months reporting that the
hospital doctors, specialists or nurses ‘always’ or ‘often’:
– listened carefully to them
– showed respect to them
– spent enough time with them.
A high or increasing proportion of patients who were satisfied is desirable, as it suggests the
hospital care was of high quality and better met the expectations and needs of patients.
Data reported for this indicator are:
comparable (subject to caveats) across jurisdictions and over time.
complete (subject to caveats) for the current reporting period. All required 2015-16 data are
available for all jurisdictions.
The Patient Experience Survey does not include people living in discrete Indigenous
communities and very remote areas, which affects the comparability of the NT results.
Patient satisfaction surveys are different from other sources of hospital quality data,
because they provide information on hospital quality from the patient’s perspective.
Surveys can be useful for obtaining information on patient views of both clinical and non-
clinical hospital care (such as whether patients feel they were treated with respect and
provided with appropriate information regarding their treatment).
In 2015-16, nationally for all measures, the satisfaction rate was above 80 per cent, with
satisfaction generally higher for nurses compared to doctors/specialists (table 12.5). To
assist interpretation of these results, associated relative standard errors and confidence
intervals are reported in attachment tables 12A.46–49.

PUBLIC HOSPITALS 12.25
Table 12.5 Patient satisfaction, hospitals, 2015-16a, b
NSW Vic Qld WA SA Tas ACT NT Aust
Emergency department patients
Proportion of people who went to an emergency department in the last 12 months reporting the emergency department doctors, specialists or nurses always or often listened carefully to them
Doctors or specialists 86.2 86.7 87.5 90.0 84.5 84.4 81.5 90.9 87.0
Nurses 87.8 91.2 91.9 91.2 87.3 91.8 #88.4 88.9 90.3
Proportion of people who went to an emergency department in the last 12 months reporting the emergency department doctors, specialists or nurses always or often showed respect to them
Doctors or specialists 88.6 88.6 88.9 88.7 86.4 85.7 81.8 92.0 88.3
Nurses 89.5 92.2 93.6 91.4 87.1 91.8 #86.8 88.9 91.5
Proportion of people who went to an emergency department in the last 12 months reporting the emergency department doctors, specialists or nurses always or often spent enough time with them
Doctors or specialists 81.6 83.9 86.2 86.7 80.6 83.7 74.8 90.3 83.6
Nurses 84.5 87.4 90.2 90.4 82.6 89.2 #79.0 89.1 87.1
Admitted hospital patients
Proportion of people who were admitted to hospital in the last 12 months reporting the hospital doctors, specialists or nurses always or often listened carefully to them
Doctors or specialists 92.3 93.0 92.8 93.2 90.1 89.9 #85.1 #91.9 92.2
Nurses 90.7 92.1 93.5 94.3 88.7 90.7 85.5 88.9 92.0
Proportion of people who were admitted to hospital in the last 12 months reporting the hospital doctors, specialists or nurses always or often showed respect to them
Doctors or specialists 91.3 92.9 93.2 94.1 92.3 90.6 87.5 93.9 92.5
Nurses 90.3 94.2 93.6 94.3 90.9 93.3 86.7 88.8 92.6
Proportion of people who were admitted to hospital in the last 12 months reporting the hospital doctors, specialists or nurses always or often spent enough time with them
Doctors or specialists 88.3 90.0 90.8 89.3 86.7 84.6 81.0 #87.5 88.9
Nurses 89.7 90.3 92.2 91.0 86.8 89.6 85.7 89.4 90.2
a See box 12.8 and tables 12A.46–49 for detailed definitions, footnotes and caveats. b # indicates the
proportion should be used with caution as it has a margin of error greater than 10 percentage points.
Source: ABS (unpublished) Patient Experience Survey 2015-16; tables 12A.46–49.
Quality — Continuity — Continuity of care
‘Continuity of care’ is an indicator of governments’ objective to provide public hospital
services that are of high quality and well coordinated to ensure continuity of care
(box 12.9).

12.26 REPORT ON GOVERNMENT SERVICES 2017
Box 12.9 Continuity of care
‘Continuity of care’ measures the provision of uninterrupted, timely, coordinated healthcare,
interventions and actions across programs, practitioners and organisations.
Continuity of care has been identified as a key area for development in future Reports.
Quality — Continuity — Selected unplanned hospital readmission rates
‘Selected unplanned hospital readmission rates’ is an indicator of governments’ objective
to provide public hospital services that are of high quality and well coordinated to ensure
continuity of care (box 12.10).
Box 12.10 Selected unplanned hospital readmission rates
‘Selected unplanned hospital readmission rates’ is defined as the rate at which patients
unexpectedly return to the same hospital within 28 days for further treatment where the original
admission involved one of a selected set of procedures, and the readmission is identified as a
post-operative complication. It is expressed as a rate per 1000 separations in which one of the
selected surgical procedures was performed. The indicator is an underestimate of all possible
unplanned/unexpected readmissions.
The selected surgical procedures are knee replacement, hip replacement, tonsillectomy and
adenoidectomy, hysterectomy, prostatectomy, cataract surgery and appendectomy. Unplanned
readmissions are those having a principal diagnosis of a post-operative adverse event for which
a specified ICD-10-AM diagnosis code has been assigned.
Low or decreasing rates of unplanned readmissions are desirable. Conversely, high or
increasing rates suggest the quality of care provided by hospitals, or post-discharge care or
planning, should be examined, because there may be scope for improvement.
Data reported for this indicator are:
comparable (subject to caveats) within jurisdictions over time but are not comparable across
jurisdictions
complete (subject to caveats) for the current reporting period. All required 2014-15 data are
available for all jurisdictions.
Selected unplanned hospital readmission rates in public hospitals are reported in table 12.6.

PUBLIC HOSPITALS 12.27
Table 12.6 Selected unplanned hospital readmission rates per 1000
separations, by selected surgical procedure, 2014-15a
NSW Vic Qld WA SA Tas ACT NT Total
Knee replacement 19.4 19.4 36.3 28.1 18.6 18.3 7.0 np 22.7
Hip replacement 16.9 16.1 23.5 16.7 7.1 21.6 8.5 np 17.1
Tonsillectomy and
Adenoidectomy 31.7 26.0 49.5 41.3 53.9 34.9 31.3 105.0 35.7
Hysterectomy 28.6 28.4 40.9 38.6 25.5 27.5 78.3 np 31.6
Prostatectomy 23.0 23.4 33.0 12.6 13.0 – np np 24.3
Cataract surgery 2.5 2.9 5.1 3.1 2.5 4.1 0.9 10.1 3.1
Appendicectomy 20.5 19.8 23.9 35.1 26.7 36.5 14.3 37.7 22.0
a See box 12.10 and table 12A.50 for detailed definitions, footnotes and caveats. np Not published. – Nil
or rounded to zero.
Source: AIHW (unpublished) National Hospital Morbidity Database; WA Health (unpublished);
table 12A.50.
Patients might be re-admitted unexpectedly if the initial care or treatment was ineffective
or unsatisfactory, if post-discharge planning was inadequate, or for reasons outside the
control of the hospital (for example poor post-discharge care). Selected unplanned hospital
readmission rates are reported by hospital peer group, Indigenous status, remoteness and
socioeconomic status in table 12A.51.
Efficiency
Sustainability — Workforce sustainability
‘Workforce sustainability’ is an indicator of governments’ objective to provide sustainable
public hospital services (box 12.11).

12.28 REPORT ON GOVERNMENT SERVICES 2017
Box 12.11 Workforce sustainability
‘Workforce sustainability’ reports age profiles for nurse (including midwives) and medical
practitioner workforces. It shows the proportions of registered nurses and medical practitioners
in ten year age brackets, by jurisdiction and by region.
High or increasing proportions of the workforce that are new entrants and/or low or decreasing
proportions of the workforce that are close to retirement is desirable.
All nurses (including midwives) and medical practitioners in the workforce are included in these
measures, as crude indicators of the potential respective workforces for public hospitals.
These measures are not a substitute for a full workforce analysis that allows for migration,
trends in full-time work and expected demand increases. They can, however, indicate that
further attention should be given to workforce sustainability for public hospitals.
Data reported for this indicator are:
comparable (subject to caveats) across jurisdictions and over time
complete (subject to caveats) for the current reporting period. All required 2015 data are
available for all jurisdictions.
Nationally in 2015, 17.4 per cent of the medical practitioner workforce and 11.6 per cent of
the nursing workforce were aged 60 years and over (figures 12.10 and 12.11), reflecting a
gradual increase from 2007 for nurses (table 12A.52) and 2009 for medical practitioners
(table 12A.54). Data disaggregated by remoteness area are available in tables 12A.53
(nursing) and 12A.55 (medical practitioner).
Figure 12.10 Nursing workforce, by age group, 2015a
a See box 12.11 and table 12A.53 for detailed definitions, footnotes and caveats.
Source: AIHW (unpublished) National Health Workforce Data Set; table 12A.53.
0
20
40
60
80
100
NSW Vic Qld WA SA Tas ACT NT Aust
Pe
r c
en
t
<30 30–39 40–49 50–59 60+

PUBLIC HOSPITALS 12.29
Figure 12.11 Medical practitioner workforce, by age group, 2015a
a See box 12.11 and table 12A.55 for detailed definitions, footnotes and caveats.
Source: AIHW (unpublished) National Health Workforce Data Set; table 12A.55.
Efficiency — Cost per admitted patient separation
‘Cost per admitted patient separation’ is an indicator of governments’ objective to deliver
services in an efficient manner (box 12.12).
Box 12.12 Cost per admitted patient separation
‘Cost per admitted patient separation’ is defined by the following two measures:
Recurrent cost per weighted separation
Capital cost per weighted separation.
A low or decreasing recurrent cost per weighted separation or capital cost per weighted
separation can reflect more efficient service delivery in public hospitals. However, this indicator
needs to be viewed in the context of the set of performance indicators as a whole, as
decreasing cost could also be associated with decreasing quality and effectiveness.
Recurrent cost per weighted separation
‘Recurrent cost per weighted separation’ is the average cost of providing care for an admitted
patient (overnight stay or same day) adjusted for casemix. Casemix adjustment takes account
of variation in the relative complexity of the patient’s clinical condition and of the hospital
services provided, but not other influences on length of stay.
(continued next page)
0
20
40
60
80
100
NSW Vic Qld WA SA Tas ACT NT Aust
Pe
r ce
nt
<30 30–39 40–49 50–59 60+

12.30 REPORT ON GOVERNMENT SERVICES 2017
Box 12.12 (continued)
Data reported for this measure are:
comparable (subject to caveats) across jurisdictions but not over time. Data prior to 2013-14
are not comparable with data after this time
complete (subject to caveats) for the current reporting period. All required 2014-15 data are
available for all jurisdictions.
Capital cost per weighted separation
‘Capital cost per separation’ is calculated as capital, labour and material costs divided by the
number of weighted separations.
Capital costs include depreciation and the user cost of capital for buildings and equipment. This
measure allows the full cost of hospital services to be considered. Depreciation is defined as
the cost of consuming an asset’s services. It is measured by the reduction in value of an asset
over the financial year. The user cost of capital is the opportunity cost of the capital invested in
an asset, and is equivalent to the return foregone from not using the funds to deliver other
services or to retire debt. Interest payments represent a user cost of capital, so are deducted
from capital costs to avoid double counting.
Data reported for this measure are:
comparable (subject to caveats) within jurisdictions over time but are not comparable across
jurisdictions. Data prior to 2013-14 are not comparable with data after this time
complete (subject to caveats) for the current reporting period. All required 2014-15 data are
available for all jurisdictions.
Recurrent cost per weighted separation
Nationally in 2014-15, the recurrent cost per weighted separation was $5025
(figure 12.12). Comparable data are available for 2013-14 but have not been adjusted for
inflation (table 12A.56).

PUBLIC HOSPITALS 12.31
Figure 12.12 Recurrent cost per weighted separation, 2014-15a
a See box 12.12 and table 12A.56 for detailed definitions, footnotes and caveats.
Source: IHPA (unpublished) National Hospital Cost Data Collection; table 12A.56.
Average cost per admitted acute emergency department presentation for 2014-15 are
reported in table 12A.58.
The ‘Relative stay index’ can provide useful context for interpreting the cost per separation
indicator as the length of stay per separation can influence cost. The relative stay index is
defined as the actual number of acute care patient days divided by the expected number of
acute care patient days, adjusted for casemix. The relative stay index for Australia for all
hospitals (public and private) is one. A relative stay index greater than one indicates that
average length of patient stay is higher than expected given the jurisdiction’s casemix
distribution. A relative stay index of less than one indicates that the number of bed days
used was less than expected. The relative stay index for public hospitals is reported in
table 12A.59.
Capital cost per weighted separation
Costs associated with non-current physical assets (such as depreciation and the user cost of
capital) are potentially important components of the total costs of many services delivered
by government agencies. Capital costs are reported in table 12A.57. This is an interim
indicator reported until ‘Total cost per casemix adjusted separation’ data again become
available.
The Steering Committee’s approach is to report the full costs of a service where they are
available. Where the full costs of a service cannot be accurately measured, the Steering
0
1 000
2 000
3 000
4 000
5 000
6 000
7 000
8 000
NSW Vic Qld WA SA Tas ACT NT Aust
$/s
ep
ara
tio
n

12.32 REPORT ON GOVERNMENT SERVICES 2017
Committee seeks to report estimated costs that are comparable. Where differences in
comparability remain, the differences are documented. The Steering Committee has
identified financial reporting issues that have affected the accuracy and comparability of
unit costs for acute care services. These include the treatment of payroll tax,
superannuation, depreciation and the user cost of capital associated with buildings and
equipment. A number of issues remain to improve further the quality of these estimates.
Recurrent cost per non-admitted patient
‘Recurrent cost per non-admitted patient’ is an indicator of governments’ objective to
deliver services in an efficient manner (box 12.13).
Box 12.13 Recurrent cost per non-admitted patient
‘Recurrent cost per non-admitted patient’ is defined by the following two measures:
Average cost per non-admitted acute emergency department presentation
Average cost per non-admitted service event.
A low or decreasing recurrent cost per non-admitted patient can reflect more efficient service
delivery in public hospitals. However, this indicator should be viewed in the context of the set of
performance indicators as a whole, as decreasing cost could also be associated with
decreasing quality and effectiveness. This indicator does not adjust for the complexity of
service.
Data reported for this indicator are:
comparable (subject to caveats) across jurisdictions but not over time. Data for 2014-15 are
not comparable with previous years
complete (subject to caveats) for the current reporting period. All required 2014-15 data are
available for all jurisdictions.
Nationally in 2014-15, the average cost per non-admitted emergency department
presentation was $449 (table 12A.60). Nationally, non-admitted service events had an
average cost of $272 in 2014-15 (table 12A.61). These data are reported for the first time
this year and are not comparable with data reported for this indicator in previous editions.
Outcomes
Outcomes are the impact of services on the status of an individual or group (see chapter 1).
Mortality in hospitals
‘Mortality in hospitals’ is an indicator of governments’ objective to manage illness and the
effects of injury in a safe manner (box 12.14).

PUBLIC HOSPITALS 12.33
Box 12.14 Mortality in hospitals
‘Mortality in hospitals’ is defined by the following three measures:
Hospital standardised mortality ratio
Death in low-mortality diagnostic related groups
In-hospital mortality rates.
Mortality in hospitals has been identified as a key area for development in future Reports.
12.4 Definitions of key terms
Accreditation Professional recognition awarded to hospitals and other healthcare facilities that meet defined industry standards. Public hospitals can seek accreditation through the ACHS Evaluation and Quality Improvement Program, the Australian Quality Council (now known as Business Excellence Australia), the Quality Improvement Council, the International Organisation for Standardization 9000 Quality Management System or other equivalent programs.
Acute care Clinical services provided to admitted or non-admitted patients, including managing labour, curing illness or treating injury, performing surgery, relieving symptoms and/or reducing the severity of illness or injury, and performing diagnostic and therapeutic procedures. Most episodes involve a relatively short hospital stay.
Admitted patient A patient who has undergone a formal admission process in a public hospital to begin an episode of care. Admitted patients can receive acute, subacute or non-acute care services.
Allied health (non-admitted)
Occasions of service to non-admitted patients at units/clinics providing treatment/counselling to patients. These include units providing physiotherapy, speech therapy, family planning, dietary advice, optometry and occupational therapy.
AR-DRG Australian Refined Diagnosis Related Group - a patient classification system that hospitals use to match their patient services (hospital procedures and diagnoses) with their resource needs. AR-DRG version 6.0x is based on the ICD-10-AM classification.
Casemix adjusted Adjustment of data on cases treated to account for the number and type of cases. Cases are sorted by AR-DRG into categories of patients with similar clinical conditions and requiring similar hospital services. Casemix adjustment is an important step to achieving comparable measures of efficiency across hospitals and jurisdictions.
Casemix adjusted separations
The number of separations adjusted to account for differences across hospitals in the complexity of episodes of care.
Community health services
Health services for individuals and groups delivered in a community setting, rather than via hospitals or private facilities.
Comparability Data are considered comparable if (subject to caveats) they can be used to inform an assessment of comparative performance. Typically, data are considered comparable when they are collected in the same way and in accordance with the same definitions. For comparable indicators or measures, significant differences in reported results allow an assessment of differences in performance, rather than being the result of anomalies in the data.
Completeness Data are considered complete if all required data are available for all jurisdictions that provide the service.

12.34 REPORT ON GOVERNMENT SERVICES 2017
Cost of capital The return foregone on the next best investment, estimated at a rate of 8 per cent of the depreciated replacement value of buildings, equipment and land. Also called the ‘opportunity cost’ of capital.
Elective surgery waiting times
Elective surgery waiting times are calculated by comparing the date on which patients are added to a waiting list with the date on which they are admitted for the awaited procedure. Days on which the patient was not ready for care are excluded.
Emergency department waiting time to commencement of clinical care
The time elapsed for each patient from presentation to the emergency department (that is, the time at which the patient is clerically registered or triaged, whichever occurs earlier) to the commencement of service by a treating medical officer or nurse.
Emergency department waiting times to admission
The time elapsed for each patient from presentation to the emergency department to admission to hospital.
ICD-10-AM The Australian modification of the International Standard Classification of Diseases and Related Health Conditions. This is the current classification of diagnoses in Australia.
Hospital boarder A person who is receiving food and/or accommodation but for whom the hospital does not accept responsibility for treatment and/or care.
Length of stay The period from admission to separation less any days spent away from the hospital (leave days).
Medicare Australian Government funding of private medical and optometrical services (under the Medicare Benefits Schedule). Sometimes defined to include other forms of Australian Government funding such as subsidisation of selected pharmaceuticals (under the Pharmaceutical Benefits Scheme) and public hospital funding (under the Australian Health Care Agreements), which provides public hospital services free of charge to public patients.
Mortality rate The number of deaths per 100 000 people.
Newborn qualification status
A newborn qualification status is assigned to each patient day within a newborn episode of care.
A newborn patient day is qualified if the infant meets at least one of the following criteria:
is the second or subsequent live born infant of a multiple birth, whose mother is currently an admitted patient,
is admitted to an intensive care facility in a hospital, being a facility approved by the Commonwealth Minister for the purpose of the provision of special care,
is admitted to, or remains in hospital without its mother.
A newborn patient day is unqualified if the infant does not meet any of the above criteria.
The day on which a change in qualification status occurs is counted as a day of the new qualification status.
If there is more than one qualification status in a single day, the day is counted as a day of the final qualification status for that day.
Nursing workforce Registered and enrolled nurses who are employed in nursing, on extended leave or looking for work in nursing.
Medical practitioner workforce
Registered medical practitioners who are employed as medical practitioners, on extended leave or looking for work as a medical practitioner.
Non-acute care Includes maintenance care and newborn care (where the newborn does not require acute care).
Non-admitted occasions of service
Occasion of examination, consultation, treatment or other service provided to a non-admitted patient in a functional unit of a health service establishment. Services can include emergency department visits, outpatient services (such as pathology, radiology and imaging, and allied health services, including

PUBLIC HOSPITALS 12.35
speech therapy and family planning) and other services to non-admitted patients. Hospital non-admitted occasions of service are not yet recorded consistently across states and territories, and relative differences in the complexity of services provided are not yet documented.
Non-admitted patient A patient who has not undergone a formal admission process, but who may receive care through an emergency department, outpatient or other non-admitted service.
Public hospital A hospital that provides free treatment and accommodation to eligible admitted persons who elect to be treated as public patients. It also provides free services to eligible non-admitted patients and can provide (and charge for) treatment and accommodation services to private patients. Charges to non-admitted patients and admitted patients on discharge can be levied in accordance with the Australian Health Care Agreements (for example, aids and appliances).
Real expenditure Actual expenditure adjusted for changes in prices.
Relative stay index The actual number of patient days for acute care separations in selected AR–DRGs divided by the expected number of patient days adjusted for casemix. Includes acute care separations only. Excludes: patients who died or were transferred within 2 days of admission, or separations with length of stay greater than 120 days, AR-DRGs which are for ‘rehabilitation’, AR-DRGs which are predominantly same day (such as R63Z chemotherapy and L61Z admit for renal dialysis), AR-DRGs which have a length of stay component in the definition, and error AR-DRGs.
Same day patients A patient whose admission date is the same as the separation date.
Sentinel events Adverse events that cause serious harm to patients and that have the potential to undermine public confidence in the healthcare system.
Separation A total hospital stay (from admission to discharge, transfer or death) or a portion of a hospital stay beginning or ending in a change in the type of care for an admitted patient (for example, from acute to rehabilitation). Includes admitted patients who receive same day procedures (for example, renal dialysis).
Subacute care Specialised multidisciplinary care in which the primary need for care is optimisation of the patient’s functioning and quality of life. A person’s functioning may relate to their whole body or a body part, the whole person, or the whole person in a social context, and to impairment of a body function or structure, activity limitation and/or participation restriction.
Subacute care comprises the defined care types of rehabilitation, palliative care, geriatric evaluation and management and psychogeriatric care.
Triage category The urgency of the patient’s need for medical and nursing care:
category 1 — resuscitation (immediate within seconds)
category 2 — emergency (within 10 minutes)
category 3 — urgent (within 30 minutes)
category 4 — semi-urgent (within 60 minutes)
category 5 — non-urgent (within 120 minutes).
Urgency category for elective surgery
Category 1 patients — admission within 30 days is desirable for a condition that has the potential to deteriorate quickly to the point that it can become an emergency.
Category 2 patients — admission within 90 days is desirable for a condition that is causing some pain, dysfunction or disability, but that is not likely to deteriorate quickly or become an emergency.
Category 3 patients — admission at some time in the future is acceptable for a condition causing minimal or no pain, dysfunction or disability, that is unlikely to deteriorate quickly and that does not have the potential to become an emergency.

12.36 REPORT ON GOVERNMENT SERVICES 2017
12.5 References
AIHW (Australian Institute of Health and Welfare) 2001, 2006, 2009, 2010, 2011, 2012,
2013, 2014 Australian Hospital Statistics, Cat. nos. HSE 11, 14, 41, 71, 84, 107, 117,
134 and 145 AIHW, Canberra.
—— 2016a, Elective surgery waiting times 2015–16: Australian hospital statistics, Health
services series no. 73. Cat. no. HSE 183 AIHW, Canberra.
—— 2016b, Health expenditure Australia 2014–15, Health and Welfare Expenditure
Series No. 57, Cat. no. HWE 67 Canberra, AIHW.
—— 2016c, Non-admitted patient care 2014–15: Australian hospital statistics, Health
services series no. 69. Cat. no. HSE 174 AIHW, Canberra.
—— 2016d, Hospital resources 2014–15: Australian hospital statistics, Health services
series no. 71. Cat. no. HSE 176 AIHW, Canberra.
Eshani, J., Jackson, T., Duckett, J., 2006, ‘The incidence and cost of adverse events in
Victorian hospitals 2003-04’, The Medical Journal of Australia, Vol 184, No. 11,
pp. 551–555.
NCCH (National Centre for Classification in Health) 2008, The International Statistical
Classification of Diseases and Related Health Problems, 10th Revision, Australian
Modification, 6th edition (ICD-10-AM), Sydney.
Van Den Bos, J., Rustagi, K., Gray, T., Halford, M,. Ziemkiewicz,. E. and Shreve, J., 2011,
The $17.1 Billion Problem: The Annual Cost Of Measurable Medical Errors, Health
Affairs, 30, no. 4: 596-603.

12A
This file is available in Adobe PDF format on the Review web page (www.pc.gov.au/rogs/2017).
Public hospitals — attachment
Definitions for the indicators and descriptors in this attachment are in section 12.4 of the chapter.
Unsourced information was obtained from the Australian, State and Territory governments.
Data in this Report are examined by the Health Working Group, but have not been formally audited
by the Secretariat.
Data reported in the attachment tables are the most accurate available at the time of data collection.
Historical data may have been updated since the last edition of RoGS.
REPORT ON
GOVERNMENT
SERVICES 2017
PUBLIC
HOSPITALS

CONTENTS
Attachment contents
Table 12A.1 Recurrent expenditure on public hospital services (including psychiatric hospitals),
(2014-15 dollars, million)
Table 12A.2 Recurrent expenditure per person, public hospital services (including psychiatric) (2014-
15 dollars)
Table 12A.3 Public hospitals (including psychiatric hospitals) by hospital size
Table 12A.4 Available beds per 1000 people, by region, public hospitals (including psychiatric)
(number)
Table 12A.5 Summary of separations, public hospitals
Table 12A.6 Separations, public (non-psychiatric) hospitals
Table 12A.7 Acute same-day and overnight separations by broad category of service, public
hospitals
Table 12A.8 Separations per 1000 people, by Indigenous status of patient (number)
Table 12A.9 Average full time equivalent (FTE) staff per 1000 persons, public hospital services
(including psychiatric hospitals)
Table 12A.10 Separations, by type of episode of care, public hospitals (including psychiatric), 2014-15
Table 12A.11 Individual and group service events, by Tier 2 clinic classes, states and territories, 2014-
15
Table 12A.12 Emergency department presentations, public hospital emergency departments, states
and territories, 2014-15
Table 12A.13 Emergency department waiting times, by triage category, public hospitals
Table 12A.14 Patients treated within national benchmarks for emergency department waiting time, by
hospital peer group, by State and Territory
Table 12A.15 Patients treated within national benchmarks for emergency department waiting time, by
Indigenous status, by State and Territory
Table 12A.16 Patients treated within national benchmarks for emergency department waiting time, by
remoteness, by State and Territory
Table 12A.17 Patients treated within national benchmarks for emergency department waiting time, by
State and Territory, by SEIFA IRSD quintiles
Table 12A.18 Length of stay for emergency department care, proportion of patients staying for four
hours or less
Table 12A.19 Waiting times for elective surgery in public hospitals, by State and Territory, by
procedure and hospital peer group (days)
Table 12A.20 Waiting times for elective surgery in public hospitals, by Indigenous status and
procedure, by State and Territory (days)
Table 12A.21 Waiting times for elective surgery in public hospitals, by State and Territory, by
remoteness area (days)
Table 12A.22 Waiting times for elective surgery in public hospitals, by State and Territory, by SEIFA
IRSD quintiles (days)
Table 12A.23 Classification of elective surgery patients, by clinical urgency category (per cent)
Table 12A.24 NSW elective surgery waiting times by clinical urgency category, public hospitals (per
cent)
Table 12A.25 Victorian elective surgery waiting times by clinical urgency category, public hospitals
(per cent)
Table 12A.26 Queensland elective surgery waiting times, by clinical urgency category, public hospitals
(per cent)
Table 12A.27 WA elective surgery waiting times, by clinical urgency category, public hospitals (per
cent)
Table 12A.28 SA elective surgery waiting times, by clinical urgency category, public hospitals
Table 12A.29 Tasmanian elective surgery waiting times, by clinical urgency category, public hospitals
Table 12A.30 ACT elective surgery waiting times, by clinical urgency category, public hospitals
Table 12A.31 NT elective surgery waiting times, by clinical urgency category, public hospitals
REPORT ON
GOVERNMENT
SERVICES 2017
PUBLIC
HOSPITALS
PAGE 1 of CONTENTS

CONTENTS
Attachment contents
Table 12A.32 Proportion of presentations to emergency departments with a length of stay of 4 hours
or less ending in admission, public hospitals
Table 12A.33 Public hospital accreditation, 30 June 2015
Table 12A.34 Episodes of Staphylococcus aureus (including MRSA) bacteraemia (SAB) in acute care
hospitals, by MRSA and MSSA
Table 12A.35 Separations with an adverse event, public hospitals
Table 12A.36 Separations for falls resulting in patient harm in hospitals, per 1000 separations, 2014-
15
Table 12A.37 NSW selected sentinel events (number)
Table 12A.38 Victoria selected sentinel events (number)
Table 12A.39 Queensland selected sentinel events (number)
Table 12A.40 WA selected sentinel events (number)
Table 12A.41 SA selected sentinel events (number)
Table 12A.42 Tasmania selected sentinel events (number)
Table 12A.43 ACT selected sentinel events (number)
Table 12A.44 NT selected sentinel events (number)
Table 12A.45 Australia selected sentinel events (number)
Table 12A.46 Proportion of persons who went to an emergency department in the last 12 months
reporting the ED doctors or specialists always or often: listened carefully, showed
respect, and spent enough time with them, by State and Territory, by remoteness, 2015-
16
Table 12A.47 Proportion of persons who went to an emergency department in the last 12 months
reporting the ED nurses always or often: listened carefully, showed respect, and spent
enough time with them, by remoteness, by State and Territory, 2015-16
Table 12A.48 Proportion of persons who were admitted to hospital in the last 12 months reporting the
hospital doctors or specialists always or often: listened carefully, showed respect, and
spent enough time with them, by remoteness, by State and Territory, 2015-16
Table 12A.49 Proportion of persons who were admitted to hospital in the last 12 months reporting the
hospital nurses always or often: listened carefully, showed respect, and spent enough
time with them, by State and Territory, by remoteness, 2015-16
Table 12A.50 Selected unplanned hospital readmissions rates
Table 12A.51 Unplanned hospital readmission rates, by Indigenous status, hospital peer group,
remoteness and SEIFA IRSD quintiles, 2014-15
Table 12A.52 Nursing workforce (includes midwives), by age group and remoteness area
Table 12A.53 Nursing workforce (includes midwives), by age group, 2015
Table 12A.54 Medical practitioner workforce, by age group and remoteness area
Table 12A.55 Medical practitioner workforce, by age group, 2015
Table 12A.56 Average cost per admitted acute weighted separation, excluding depreciation,
Table 12A.57 Indicative estimates of capital costs per weighted separation, 2014-15
Table 12A.58 Average cost per admitted acute emergency department presentation, 2014-15
Table 12A.59 Relative stay index, indirectly standardised, patients in public hospitals, by medical,
surgical and other type of diagnosis related group 2014-15
Table 12A.60 Average cost per non-admitted acute emergency department presentation, 2014-15
Table 12A.61 Average cost per non-admitted presentation, 2014-15
REPORT ON
GOVERNMENT
SERVICES 2017
PUBLIC
HOSPITALS
PAGE 2 of CONTENTS

TABLE 12A.1
Table 12A.1
NSW (d) Vic Qld (e) WA (f) SA (g) Tas (h) ACT NT (i) Aust
2005-06
Salary and wages 6 840 5 018 3 073 1 822 1 465 409 329 279 19 235
Non-salary 4 243 3 023 1 872 1 010 944 305 218 146 11 761
Total 11 083 8 042 4 945 2 832 2 409 714 547 426 30 996
2006-07
Salary and wages 6 942 5 247 3 509 2 049 1 526 432 335 294 20 335
Non-salary 4 375 3 076 1 991 1 154 932 318 240 156 12 242
Total 11 317 8 322 5 501 3 203 2 458 751 575 450 32 577
2007-08
Salary and wages 7 008 5 585 3 996 2 264 1 658 419 375 303 21 609
Non-salary 4 654 3 234 2 201 1 234 1 145 336 254 163 13 221
Total 11 662 8 819 6 198 3 498 2 803 755 629 466 34 829
2008-09
Salary and wages 7 297 5 850 4 360 2 491 1 759 475 414 337 22 982
Non-salary 4 616 3 383 2 355 1 311 1 120 333 270 180 13 568
Total 11 912 9 233 6 715 3 802 2 879 809 684 517 36 549
2009-10
Salary and wages 7 175 6 077 4 749 2 519 1 831 572 422 363 23 707
Non-salary 4 785 3 496 2 507 1 439 1 133 352 287 167 14 165
Total 11 959 9 573 7 256 3 958 2 964 924 709 529 37 872
2010-11
Salary and wages 7 511 6 507 5 369 2 719 1 922 604 459 390 25 482
Non-salary 5 313 3 731 2 691 1 629 1 335 372 314 181 15 567
Total 12 824 10 238 8 060 4 348 3 257 976 773 572 41 048
2011-12
Recurrent expenditure on public hospital services (including psychiatric hospitals), (2014-15 dollars, million)
(a), (b), (c)
REPORT ON
GOVERNMENT
SERVICES 2017
PUBLIC
HOSPITALS
PAGE 1 of TABLE 12A.1

TABLE 12A.1
Table 12A.1
NSW (d) Vic Qld (e) WA (f) SA (g) Tas (h) ACT NT (i) Aust
Recurrent expenditure on public hospital services (including psychiatric hospitals), (2014-15 dollars, million)
(a), (b), (c)
Salary and wages 8 160 6 778 5 556 3 006 2 084 616 619 425 27 244
Non-salary 5 822 3 782 2 793 1 740 1 415 376 392 190 16 510
Total 13 982 10 560 8 349 4 746 3 499 992 1 011 615 43 753
2012-13
Salary and wages 8 204 6 777 5 181 3 218 1 989 616 681 441 27 107
Non-salary 5 958 3 847 2 878 1 824 1 373 392 359 199 16 831
Total 14 162 10 624 8 059 5 042 3 362 1 007 1 040 640 43 937
2013-14
Salary and wages 8 434 6 921 5 655 3 306 2 146 637 688 443 28 230
Non-salary 5 959 3 996 3 091 1 808 1 455 388 361 192 17 251
Total 14 393 10 917 8 746 5 115 3 601 1 025 1 049 635 45 481
2014-15
Salary and wages 10 882 7 849 5 674 4 368 2 109 775 660 489 32 804
Non-salary 7 461 5 761 3 193 3 957 1 594 457 429 307 23 159
Total 18 343 12 682 8 866 8 325 3 702 1 232 1 089 796 55 036
(a)
(b)
(c)
(d)
(e)
(f) In WA, expenditure on public patients at Joondalup and Peel Health Campuses is included from 2006-07 figures but not in those for previous years.
NSW hospital expenditure recorded against special purposes and trust funds is excluded.
Expenditure data exclude depreciation.
Recurrent expenditure on the purchase of public hospitals services at the State, or area health service-level, from privately owned and/or operated hospitals is
excluded.
Queensland pathology services were purchased from a statewide pathology service rather than being provided by hospital employees.
For 2014–15, recurrent expenditure reported to the AIHW by most jurisdictions (excludes Queensland) included expenditure on public hospital services by
public hospitals, local hospital networks and by state/territory health authorities. The recurrent expenditure data for 2014–15 are not comparable with
recurrent expenditure reported in previous years, which did not include expenditure by local hospital networks and by state/territory health authorities.
REPORT ON
GOVERNMENT
SERVICES 2017
PUBLIC
HOSPITALS
PAGE 2 of TABLE 12A.1

TABLE 12A.1
Table 12A.1
NSW (d) Vic Qld (e) WA (f) SA (g) Tas (h) ACT NT (i) Aust
Recurrent expenditure on public hospital services (including psychiatric hospitals), (2014-15 dollars, million)
(a), (b), (c)
(g)
(h)
(i)
Source : AIHW (various years), Australian hospital statistics , Health Services Series; AIHW (various years), Hospital resources: Australian hospital statistics ,
Health services series; AIHW (2016), Health expenditure Australia 2014–15 , Health and Welfare Expenditure Series No. 57, Cat. no. HWE 67.
For 2005-06 data for one hospital are not included.
Interest payments for the NT were not reported.
In SA in 2011-12 there were significant once-off revaluations of other employee related expenses. This reflects as an artificial reduction in expenditure,
including for salaries and wages expenditure components, for 2012-13 results.
REPORT ON
GOVERNMENT
SERVICES 2017
PUBLIC
HOSPITALS
PAGE 3 of TABLE 12A.1

TABLE 12A.2
Table 12A.2
NSW Vic Qld (e) WA (f) SA (g) Tas (h) ACT (i) NT Aust
2005-06 1 648.5 1 601.0 1 247.4 1 387.9 1 557.8 1 462.2 1 636.6 2 055.9 1 525.0
2006-07 1 666.5 1 630.6 1 356.1 1 536.5 1 573.1 1 526.3 1 701.0 2 134.5 1 578.4
2007-08 1 678.9 1 695.9 1 489.9 1 634.1 1 776.2 1 523.1 1 828.0 2 145.9 1 651.9
2008-09 1 699.9 1 737.7 1 570.4 1 715.6 1 801.3 1 611.2 1 948.1 2 316.9 1 701.1
2009-10 1 682.7 1 766.6 1 661.5 1 745.8 1 830.8 1 825.3 1 979.9 2 322.0 1 731.6
2010-11 1 785.1 1 862.9 1 816.5 1 873.2 1 992.8 1 914.2 2 117.6 2 485.0 1 850.9
2011-12 1 919.2 1 891.4 1 847.5 1 982.9 2 121.5 1 937.4 2 724.1 2 638.9 1 940.8
2012-13 1 918.2 1 870.1 1 748.6 2 032.3 2 021.6 1 967.6 2 751.1 2 678.1 1 914.8
2013-14 1 921.2 1 887.1 1 866.9 2 016.1 2 146.2 1 994.6 2 738.6 2 613.9 1 950.6
2014-15 2 409.8 2 137.4 1 867.0 3 228.5 2 187.3 2 392.5 2 806.3 3 274.5 2 321.1
(a)
(b)
(c)
(d)
(e)
(f)
(g)
(h)
(i)
Source :
Recurrent expenditure per person, public hospital services
(including psychiatric) (2014-15 dollars) (a), (b), (c), (d)
In WA, recurrent expenditure per person from 2006-07 includes expenditure on public patients at
Joondalup and Peel Health Campuses. Expenditure for these patients is not included in previous years.
Expenditure data exclude depreciation and interest payments.
Recurrent expenditure on the purchase of public hospitals services at the State, or area health service-
level, from privately owned and/or operated hospitals is not included.
AIHW (various years), Australian hospital statistics , Health Services Series; AIHW (various
years), Hospital resources: Australian hospital statistics, Health services series; AIHW (2016),
Health expenditure Australia 2014–15, Health and Welfare Expenditure Series No. 57, Cat. no.
HWE 67.
The expenditure numbers for the ACT include substantial expenditures for NSW residents, and so the
ACT expenditure is overstated.
Queensland pathology services were purchased from a statewide pathology service rather than being
provided by hospital employees.
In Tasmania, for 2005-06, data for one hospital are not included.
In SA in 2011-12 there were significant once-off revaluations of other employee related expenses. This
reflects as an artificial reduction in expenditure, including for salaries and wages expenditure
components, for 2012-13 results.
Expenditure data are deflated using the hospital/nursing home care price index from the AIHW
publication Health Expenditure Australia.
For 2014–15, recurrent expenditure reported to the AIHW by most jurisdictions (excludes Queensland)
included expenditure on public hospital services by public hospitals, local hospital networks and by
state/territory health authorities. The recurrent expenditure data for 2014–15 are not comparable with
recurrent expenditure reported in previous years, which did not include expenditure by local hospital
networks and by state/territory health authorities.
REPORT ON
GOVERNMENT
SERVICES 2017
PUBLIC
HOSPITALS
PAGE 1 of TABLE 12A.2

TABLE 12A.3
Table 12A.3
NSW Vic (e,f) Qld WA SA (g) Tas ACT NT Aust
2010-11
No. of hospitals
10 or fewer beds 29 38 74 43 11 14 1 – 212
more than 10 to 50 beds 118 53 62 31 54 5 – 2 322
more than 50 to 100 beds 30 20 10 3 6 1 – 1 73
more than 100 to 200 beds 22 20 9 10 3 1 – 1 65
more than 200 to 500 beds 18 16 10 5 4 1 1 1 56
more than 500 beds 9 4 5 2 2 1 1 – 24
Total 226 151 170 94 80 23 3 5 752
Proportion of total hospitals (%)
10 or fewer beds 12.8 25.2 43.5 45.7 13.8 60.9 33.3 0.0 28.2
more than 10 to 50 beds 52.2 35.1 36.5 33.0 67.5 21.7 0.0 40.0 42.8
more than 50 to 100 beds 13.3 13.2 5.9 3.2 7.5 4.3 0.0 20.0 9.7
more than 100 beds 21.7 26.5 14.1 18.1 11.3 13.0 66.7 40.0 19.3
Total 100.0 100.0 100.0 100.0 100.0 100.0 100.0 100.0 100.0
No. of available beds
10 or fewer beds 122 221 224 239 51 76 10 – 930
more than 10 to 50 beds 3 026 1 270 1 394 761 1 328 81 – 52 7 862
more than 50 to 100 beds 2 146 1 463 697 226 452 87 – 60 5 263
more than 100 to 200 beds 3 278 2 942 1 505 1 496 519 116 – 183 9 936
more than 200 to 500 beds 5 473 5 098 3 111 1 469 1 262 333 223 367 17 303
more than 500 beds 5 887 2 480 4 186 1 302 1 428 503 693 – 16 478
Total 19 931 13 474 11 117 5 492 5 040 1 196 926 662 57 772
Proportion of total beds (%)
10 or fewer beds 0.6 1.6 2.0 4.4 1.0 6.4 1.1 0.0 1.6
more than 10 to 50 beds 15.2 9.4 12.5 13.9 26.3 6.8 0.0 7.9 13.6
more than 50 to 100 beds 10.8 10.9 6.3 4.1 9.0 7.3 0.0 9.1 9.1
more than 100 beds 73.4 78.1 79.2 77.7 63.7 79.6 98.9 83.1 75.7
Total 100.0 100.0 100.0 100.0 100.0 100.0 100.0 100.0 100.0
2011-12
No. of hospitals
10 or fewer beds 32 38 74 44 12 14 1 – 217
more than 10 to 50 beds 116 52 62 32 51 5 – 2 318
more than 50 to 100 beds 27 20 10 3 8 1 – 1 71
more than 100 to 200 beds 22 21 8 10 3 1 – 1 65
more than 200 to 500 beds 19 16 10 5 4 1 1 1 57
more than 500 beds 9 4 6 2 2 1 1 – 25
Total 225 151 170 96 80 23 3 5 753
Proportion of total hospitals (%)
10 or fewer beds 14.2 25.2 43.5 45.8 15.0 60.9 33.3 0.0 28.8
Public hospitals (including psychiatric hospitals) by hospital size
(a), (b), (c), (d)
REPORT ON
GOVERNMENT
SERVICES 2017
PUBLIC
HOSPITALS
PAGE 1 of TABLE 12A.3

TABLE 12A.3
Table 12A.3
NSW Vic (e,f) Qld WA SA (g) Tas ACT NT Aust
Public hospitals (including psychiatric hospitals) by hospital size
(a), (b), (c), (d)
more than 10 to 50 beds 51.6 34.4 36.5 33.3 63.8 21.7 0.0 40.0 42.2
more than 50 to 100 beds 12.0 13.2 5.9 3.1 10.0 4.3 0.0 20.0 9.4
more than 100 beds 22.2 27.2 14.1 17.7 11.3 13.0 66.7 40.0 19.5
Total 100.0 100.0 100.0 100.0 100.0 100.0 100.0 100.0 100.0
No. of available beds
10 or fewer beds 125 206 223 243 89 76 10 – 958
more than 10 to 50 beds 2 970 1 212 1 415 785 1 279 81 – 54 7 776
more than 50 to 100 beds 1 915 1 431 720 227 639 89 – 60 5 130
more than 100 to 200 beds 3 198 2 947 1 300 1 579 482 115 – 195 9 709
more than 200 to 500 beds 5 868 5 159 2 853 1 521 1 280 324 225 387 17 584
more than 500 beds 5 996 2 540 4 734 1 321 1 464 503 704 – 17 261
Total 20 073 13 495 11 245 5 677 5 232 1 188 939 696 58 420
Proportion of total beds (%)
10 or fewer beds 0.6 1.5 2.0 4.3 1.7 6.4 1.1 0.0 1.6
more than 10 to 50 beds 14.8 9.0 12.6 13.8 24.4 6.8 0.0 7.8 13.3
more than 50 to 100 beds 9.5 10.6 6.4 4.0 12.2 7.5 0.0 8.6 8.8
more than 100 beds 75.0 78.9 79.0 77.9 61.7 79.3 98.9 83.6 76.3
Total 100.0 100.0 100.0 100.0 100.0 100.0 100.0 100.0 100.0
2012-13
No. of hospitals
10 or fewer beds 31 39 76 42 22 14 1 – 225
more than 10 to 50 beds 119 50 61 28 41 5 – 2 306
more than 50 to 100 beds 26 23 8 3 8 1 – 1 70
more than 100 to 200 beds 21 18 8 10 3 1 – 1 62
more than 200 to 500 beds 19 15 12 5 4 2 1 1 59
more than 500 beds 9 5 5 2 2 – 1 – 24
Total 225 150 170 90 80 23 3 5 746
Proportion of total hospitals (%)
10 or fewer beds 13.8 26.0 44.7 46.7 27.5 60.9 33.3 0.0 30.2
more than 10 to 50 beds 52.9 33.3 35.9 31.1 51.3 21.7 0.0 40.0 41.0
more than 50 to 100 beds 11.6 15.3 4.7 3.3 10.0 4.3 0.0 20.0 9.4
more than 100 beds 21.8 25.3 14.7 18.9 11.3 13.0 66.7 40.0 19.4
Total 100.0 100.0 100.0 100.0 100.0 100.0 100.0 100.0 100.0
No. of available beds
10 or fewer beds 103 226 244 233 137 76 10 – 1 029
more than 10 to 50 beds 3 045 1 199 1 448 723 1 018 82 – 54 7 569
more than 50 to 100 beds 1 944 1 699 621 226 580 89 – 60 5 218
more than 100 to 200 beds 3 123 2 589 1 294 1 547 444 115 – 183 9 295
more than 200 to 500 beds 5 964 4 663 3 880 1 590 1 280 826 235 367 18 804
more than 500 beds 6 003 3 073 3 786 1 330 1 464 – 741 – 16 396
REPORT ON
GOVERNMENT
SERVICES 2017
PUBLIC
HOSPITALS
PAGE 2 of TABLE 12A.3

TABLE 12A.3
Table 12A.3
NSW Vic (e,f) Qld WA SA (g) Tas ACT NT Aust
Public hospitals (including psychiatric hospitals) by hospital size
(a), (b), (c), (d)
Total 20 181 13 449 11 273 5 648 4 922 1 188 986 664 58 311
Proportion of total beds (%)
10 or fewer beds 0.5 1.7 2.2 4.1 2.8 6.4 1.0 0.0 1.8
more than 10 to 50 beds 15.1 8.9 12.8 12.8 20.7 6.9 0.0 8.1 13.0
more than 50 to 100 beds 9.6 12.6 5.5 4.0 11.8 7.5 0.0 9.0 8.9
more than 100 beds 74.8 76.8 79.5 79.1 64.8 79.2 99.0 82.8 76.3
Total 100.0 100.0 100.0 100.0 100.0 100.0 100.0 100.0 100.0
2013-14
No. of hospitals
10 or fewer beds 33 39 76 44 22 14 1 – 229
more than 10 to 50 beds 118 52 60 28 41 5 – 2 306
more than 50 to 100 beds 23 22 8 3 8 1 – 1 66
more than 100 to 200 beds 23 18 8 9 3 1 – 1 63
more than 200 to 500 beds 19 15 11 5 4 2 1 1 58
more than 500 beds 9 5 6 2 2 – 1 – 25
Total 225 151 169 91 80 23 3 5 747
Proportion of total hospitals (%)
10 or fewer beds 14.7 25.8 45.0 48.4 27.5 60.9 33.3 – 30.7
more than 10 to 50 beds 52.4 34.4 35.5 30.8 51.3 21.7 – 40.0 41.0
more than 50 to 100 beds 10.2 14.6 4.7 3.3 10.0 4.3 – 20.0 8.8
more than 100 beds 22.7 25.2 14.8 17.6 11.3 13.0 66.7 40.0 19.5
Total 100.0 100.0 100.0 100.0 100.0 100.0 100.0 100.0 100.0
No. of available beds
10 or fewer beds 112 234 238 219 135 80 10 – 1 029
more than 10 to 50 beds 3 053 1 225 1 413 689 1 014 85 – 54 7 533
more than 50 to 100 beds 1 657 1 675 609 222 564 81 – 60 4 867
more than 100 to 200 beds 3 366 2 588 1 319 1 386 417 117 – 183 9 377
more than 200 to 500 beds 5 987 4 799 3 411 1 646 1 259 824 258 367 18 551
more than 500 beds 6 068 3 062 4 518 1 314 1 487 – 762 – 17 211
Total 20 242 13 583 11 508 5 477 4 876 1 187 1 030 664 58 567
Proportion of total beds (%)
10 or fewer beds 0.6 1.7 2.1 4.0 2.8 6.7 1.0 0.0 1.8
more than 10 to 50 beds 15.1 9.0 12.3 12.6 20.8 7.2 0.0 8.1 12.9
more than 50 to 100 beds 8.2 12.3 5.3 4.1 11.6 6.8 0.0 9.0 8.3
more than 100 beds 76.2 76.9 80.4 79.4 64.9 79.3 99.0 82.8 77.1
Total 100.0 100.0 100.0 100.0 100.0 100.0 100.0 100.0 100.0
2014-15
No. of hospitals
10 or fewer beds 22 39 29 45 19 13 1 – 168
more than 10 to 50 beds 128 51 60 26 41 5 – 2 313
REPORT ON
GOVERNMENT
SERVICES 2017
PUBLIC
HOSPITALS
PAGE 3 of TABLE 12A.3

TABLE 12A.3
Table 12A.3
NSW Vic (e,f) Qld WA SA (g) Tas ACT NT Aust
Public hospitals (including psychiatric hospitals) by hospital size
(a), (b), (c), (d)
more than 50 to 100 beds 24 21 9 4 8 – – 1 67
more than 100 to 200 beds 24 19 6 8 3 3 – 1 64
more than 200 to 500 beds 18 17 12 7 4 2 1 1 62
more than 500 beds 9 4 6 2 2 – 1 – 24
Total 225 151 122 92 77 23 3 5 698
Proportion of total hospitals (%)
10 or fewer beds 9.8 25.8 23.8 48.9 24.7 56.5 33.3 – 24.1
more than 10 to 50 beds 56.9 33.8 49.2 28.3 53.2 21.7 – 40.0 44.8
more than 50 to 100 beds 10.7 13.9 7.4 4.3 10.4 0.0 – 20.0 9.6
more than 100 beds 22.7 26.5 19.7 18.5 11.7 21.7 66.7 40.0 21.5
Total 100.0 100.0 100.0 100.0 100.0 100.0 100.0 100.0 100.0
No. of available beds
10 or fewer beds 68 237 207 217 123 70 10 .. 931
more than 10 to 50 beds 3 355 1 138 1 375 677 985 85 .. 54 7 669
more than 50 to 100 beds 1 725 1 579 667 268 587 .. .. 60 4 886
more than 100 to 200 beds 3 674 2 685 956 1 211 422 337 .. 183 9 468
more than 200 to 500 beds 5 945 5 685 3 904 2 095 1 314 807 265 367 20 382
more than 500 beds 6 252 2 584 4 662 1 221 1 492 .. 793 .. 17 003
Total 21 018 13 908 11 771 5 689 4 923 1 299 1 068 664 60 340
Proportion of total beds (%)
10 or fewer beds 0.3 1.7 1.8 3.8 2.5 5.4 0.9 .. 1.5
more than 10 to 50 beds 16.0 8.2 11.7 11.9 20.0 6.5 .. 8.1 12.7
more than 50 to 100 beds 8.2 11.4 5.7 4.7 11.9 .. .. 9.0 8.1
more than 100 beds 75.5 78.8 80.9 79.6 65.6 88.1 99.1 82.8 77.6
Total 100.0 100.0 100.0 100.0 100.0 100.0 100.0 100.0 100.0
(a)
(b)
(c)
(d)
(e)
(f)
(g)
The number of hospitals reported can be affected by administrative and/or reporting arrangements and
is not necessarily a measure of the number of physical hospital buildings or campuses.
The count of hospitals in Victoria is a count of the campuses that report data separately to the National
Hospital Morbidity Database.
The comparability of bed numbers can be affected by the casemix of hospitals including the extent to
which hospitals provide same day admitted services and other specialised services.
Size is based on the average number of available beds.
A change in definition of average available beds may affect comparison over time.
In 2012-13 a large number of SA state-funded aged care beds in country hospitals converted into
Commonwealth multi-purpose service places. This has resulted in an apparent decrease in the
numbers of available beds between 2011-12 and 2012-13. This has also resulted in hospitals shifting
categories, there are more hospitals with 10 or fewer beds in 2012-13.
For Victoria for 2009-10 to 2011-12, the numbers of available beds have been adjusted to correct
reporting anomalies and to include Secure Extended Care Unit beds. These beds meet the definition of
an available bed but were incorrectly excluded from the submissions of some health services to the
NPHED. Comparisons of bed numbers published in previous years are not valid for Victoria.
REPORT ON
GOVERNMENT
SERVICES 2017
PUBLIC
HOSPITALS
PAGE 4 of TABLE 12A.3
TABLE 12A.3
Table 12A.3
NSW Vic (e,f) Qld WA SA (g) Tas ACT NT Aust
Public hospitals (including psychiatric hospitals) by hospital size
(a), (b), (c), (d)
Source : AIHW (various years), Australian hospital statistics , Health Services Series; AIHW (various
years), Hospital resources: Australian hospital statistics, Health services series.
.. Not applicable. – Nil or rounded to zero.
REPORT ON
GOVERNMENT
SERVICES 2017
PUBLIC
HOSPITALS
PAGE 5 of TABLE 12A.3

TABLE 12A.4
Table 12A.4
NSW Vic Qld WA (e) SA (f) Tas ACT NT Aust
2005-06
Metropolitan 2.7 2.4 2.4 2.4 2.8 .. 2.2 .. 2.5
Rural 3.3 2.6 2.5 2.4 3.6 2.7 – 2.7 2.8
Remote 6.5 2.4 5.7 3.9 7.6 2.5 .. 2.9 4.9
Total 2.9 2.4 2.5 2.5 3.2 2.7 2.2 2.8 2.7
2006-07
Major cities 2.7 2.3 2.1 2.5 2.7 .. 2.4 .. 2.5
Regional 3.4 2.7 2.9 2.9 3.6 2.8 – 2.8 3.0
Remote 7.5 2.1 5.6 3.8 7.8 3.0 .. 2.9 4.9
Total 2.9 2.4 2.5 2.7 3.1 2.8 2.3 2.8 2.7
2007-08
Major cities 2.7 2.4 2.3 2.6 2.8 .. 2.6 .. 2.5
Regional 3.4 2.7 2.9 2.5 3.7 2.6 – 2.9 3.0
Remote 7.7 2.9 4.9 3.2 7.7 3.0 .. 2.9 4.5
Total 2.9 2.5 2.6 2.6 3.2 2.6 2.5 2.9 2.7
2008-09
Major cities 2.6 2.3 2.2 2.5 2.7 .. 2.5 .. 2.5
Regional 3.3 2.7 2.8 2.3 3.4 2.6 .. 2.8 2.9
Remote 6.9 3.0 4.9 2.9 7.3 2.1 .. 2.8 4.3
Total 2.8 2.4 2.5 2.5 3.0 2.6 2.5 2.8 2.6
2009-10
Major cities 2.6 2.3 2.3 2.4 2.7 .. 2.6 .. 2.5
Regional 3.1 2.7 2.6 2.2 3.3 2.7 .. 3.1 2.8
Remote 5.7 3.0 4.4 2.9 7.0 2.1 .. 3.0 4.0
Total 2.7 2.4 2.5 2.4 3.0 2.7 2.6 3.1 2.6
2010-11
Metropolitan 2.6 2.3 2.3 2.4 2.8 .. 2.6 .. 2.5
Rural 3.1 2.7 2.6 2.2 3.3 2.4 .. 2.9 2.8
Remote 5.6 3.0 4.2 2.8 6.7 2.1 .. 2.9 3.9
Total 2.8 2.4 2.5 2.4 3.1 2.4 2.6 2.9 2.6
2011-12
Major cities 2.7 2.3 2.3 2.5 2.9 .. 2.6 .. 2.5
Regional 3.1 2.7 2.8 2.2 3.6 2.3 .. 3.0 2.8
Remote 5.3 2.5 4.1 2.6 6.6 2.2 .. 3.1 3.7
Total 2.8 2.4 2.5 2.4 3.2 2.3 2.6 3.0 2.6
2012-13
Major cities 2.6 2.3 2.4 2.3 2.8 .. 2.6 .. 2.5
Regional 3.1 2.7 2.5 2.3 3.2 2.3 – 2.8 2.7
Remote 5.3 2.2 4.0 2.5 4.7 2.0 .. 2.9 3.4
Total 2.8 2.4 2.5 2.3 3.0 2.3 2.6 2.8 2.6
Available beds per 1000 people, by region, public hospitals
(including psychiatric) (number) (a), (b), (c), (d)
REPORT ON
GOVERNMENT
SERVICES 2017
PUBLIC
HOSPITALS
PAGE 1 of TABLE 12A.4

TABLE 12A.4
Table 12A.4
NSW Vic Qld WA (e) SA (f) Tas ACT NT Aust
Available beds per 1000 people, by region, public hospitals
(including psychiatric) (number) (a), (b), (c), (d)
2013-14
Major cities 2.6 2.3 2.4 2.2 2.7 .. 2.7 .. 2.4
Regional 3.0 2.7 2.5 2.2 3.2 2.3 – 2.7 2.7
Remote 5.1 1.7 3.8 2.2 4.7 2.1 .. 2.8 3.2
Total 2.7 2.4 2.5 2.2 2.9 2.3 2.7 2.8 2.5
2014-15
Major cities 2.6 2.3 2.4 2.2 2.8 .. 2.8 .. 2.5
Regional 3.2 2.7 2.5 2.2 3.1 2.5 .. 2.6 2.8
Remote 6.4 2.4 3.6 2.5 4.4 2.1 .. 2.8 3.3
Total 2.8 2.4 2.5 2.2 2.9 2.5 2.8 2.7 2.6
(a)
(b)
(c)
(d)
(e)
(f)
Source : AIHW (various years), Australian hospital statistics , Health Services Series; AIHW (various
years), Hospital resources: Australian hospital statistics , Health services series.
In WA, beds available for public patients at Joondalup and Peel Health Campuses are included from
2006-07 figures but not in those for previous years.
In 2012-13 a large number of SA state-funded aged care beds in country hospitals converted into
Commonwealth multi-purpose service places. This has resulted in an apparent decrease in the
numbers of available beds between 2011-12 and 2012-13.
Analysis by remoteness area is of less relevance to geographically smaller jurisdictions and those
jurisdictions with small populations residing in remote areas (such as Victoria).
Available beds includes both average available beds for overnight and same day accommodation.
Average available overnight beds is the number of beds available to provide overnight accommodation
for patients (other than neonatal cots (nonspecial-care) and beds occupied by hospital-in-the-home
patients), averaged over the counting period. Average available same day beds is the number of beds,
chairs or trolleys available to provide accommodation for same-day patients, averaged over the
counting period.
The comparability of bed numbers can be affected by the casemix of hospitals including the extent to
which hospitals provide same day admitted services and other specialised services.
.. Not applicable. – Nil or rounded to zero.
Population calculated based on a crude rate. Data need to be viewed in the context of the age and sex
structure and morbidity and mortality of the population in each jurisdiction. The age and sex structure of
the population in each jurisdiction is provided in the 'Statistical appendix' and mortality rates in the
'Health sector summary'.
REPORT ON
GOVERNMENT
SERVICES 2017
PUBLIC
HOSPITALS
PAGE 2 of TABLE 12A.4

TABLE 12A.5
Table 12A.5
Unit NSW Vic (b) Qld WA SA Tas ACT (c) NT Aust
2010-11
Separations
Public hospitals no. 1 582 804 1 496 041 964 349 548 272 390 154 99 333 93 745 104 434 5 279 132
Public acute hospitals no. 1 576 866 1 495 555 964 025 546 785 388 483 99 118 93 745 104 434 5 269 011
Public psychiatric hospitals no. 5 938 486 324 1 487 1 671 215 .. .. 10 121
Overnight separations
Public hospitals no. 875 005 645 995 472 812 255 849 212 421 49 703 43 849 38 350 2 593 984
Public acute hospitals no. 869 273 645 515 472 492 254 433 211 101 49 496 43 849 38 350 2 584 509
Public psychiatric hospitals no. 5 732 480 320 1 416 1 320 207 .. .. 9 475
Same day separations
Public hospitals no. 707 799 850 046 491 537 292 423 177 733 49 630 49 896 66 084 2 685 148
Public acute hospitals no. 707 593 850 040 491 533 292 352 177 382 49 622 49 896 66 084 2 684 502
Public psychiatric hospitals no. 206 6 4 71 351 8 .. .. 646
Same day separations (per cent of total)
Public hospitals % 44.7 56.8 51.0 53.3 45.6 50.0 53.2 63.3 50.9
Public acute hospitals % 44.9 56.8 51.0 53.5 45.7 50.1 53.2 63.3 50.9
Public psychiatric hospitals % 3.5 1.2 1.2 4.8 21.0 3.7 .. .. 6.4
Separations per 1000 population (d)
Public hospitals no. 205.7 255.7 209.4 235.2 217.2 181.4 272.3 504.5 225.9
Public acute hospitals no. 204.8 255.6 209.3 234.6 216.2 180.9 272.3 504.5 225.5
Public psychiatric hospitals no. 0.8 0.1 0.1 0.6 1.0 0.5 0.0 0.0 0.5
2011-12
Separations
Public hospitals no. 1 660 602 1 543 773 1 001 215 588 143 407 315 99 632 97 455 113 357 5 511 492
Public acute hospitals no. 1 655 276 1 543 310 1 000 832 586 745 405 462 99 276 97 455 113 357 5 501 713
Public psychiatric hospitals no. 5 326 463 383 1 398 1 853 356 .. .. 9 779
Summary of separations, public hospitals (a)
REPORT ON
GOVERNMENT
SERVICES 2017
PUBLIC
HOSPITALS
PAGE 1 of TABLE 12A.5

TABLE 12A.5
Table 12A.5
Unit NSW Vic (b) Qld WA SA Tas ACT (c) NT Aust
Summary of separations, public hospitals (a)
Overnight separations
Public hospitals no. 924 308 660 844 496 615 270 866 218 944 49 120 45 138 38 864 2 704 699
Public acute hospitals no. 919 191 660 387 496 235 269 498 217 482 48 772 45 138 38 864 2 695 567
Public psychiatric hospitals no. 5 117 457 380 1 368 1 462 348 – – 9 132
Same day separations
Public hospitals no. 736 294 882 929 504 600 317 277 188 371 50 512 52 317 74 493 2 806 793
Public acute hospitals no. 736 085 882 923 504 597 317 247 187 980 50 504 52 317 74 493 2 806 146
Public psychiatric hospitals no. 209 6 3 30 391 8 .. .. 647
Same day separations (per cent of total)
Public hospitals % 44.3 57.2 50.4 53.9 46.2 50.7 53.7 65.7 50.9
Public acute hospitals % 44.5 57.2 50.4 54.1 46.4 50.9 53.7 65.7 51.0
Public psychiatric hospitals % 3.9 1.3 0.8 2.1 21.1 2.2 .. .. 6.6
Separations per 1000 population (d)
Public hospitals no. 216.1 264.9 220.3 248.8 227.6 179.9 278.8 544.7 236.4
Public acute hospitals no. 215.3 264.8 220.2 248.2 226.5 179.2 278.8 544.7 236.0
Public psychiatric hospitals no. 0.8 0.1 0.1 0.6 1.1 0.7 0.0 0.0 0.4
2012-13
Separations
Public hospitals no. 1 716 789 1 429 453 1 044 011 606 809 413 756 106 358 94 712 118 307 5 530 195
Public acute hospitals no. 1 711 419 1 429 009 1 043 492 605 499 412 239 105 263 94 712 118 307 5 519 940
Public psychiatric hospitals no. 5 370 444 519 1 310 1 517 1 095 .. .. 10 255
Overnight separations
Public hospitals no. 947 449 641 888 520 905 279 791 222 508 50 532 44 624 38 818 2 746 515
Public acute hospitals no. 942 265 641 446 520 432 278 502 221 256 49 453 44 624 38 818 2 736 796
Public psychiatric hospitals no. 5 184 442 473 1 289 1 252 1 079 .. .. 9 719
Same day separations
REPORT ON
GOVERNMENT
SERVICES 2017
PUBLIC
HOSPITALS
PAGE 2 of TABLE 12A.5

TABLE 12A.5
Table 12A.5
Unit NSW Vic (b) Qld WA SA Tas ACT (c) NT Aust
Summary of separations, public hospitals (a)
Public hospitals no. 769 340 787 565 523 106 327 018 191 248 55 826 50 088 79 489 2 783 680
Public acute hospitals no. 769 154 787 563 523 060 326 997 190 983 55 810 50 088 79 489 2 783 144
Public psychiatric hospitals no. 186 2 46 21 265 16 .. .. 536
Same day separations (per cent of total)
Public hospitals % 44.8 55.1 50.1 53.9 46.2 52.5 52.9 67.2 50.3
Public acute hospitals % 44.9 55.1 50.1 54.0 46.3 53.0 52.9 67.2 50.4
Public psychiatric hospitals % 3.5 0.5 8.9 1.6 17.5 1.5 .. .. 5.2
Separations per 1000 population (d)
Public hospitals no. 219.6 239.5 224.3 247.9 228.0 189.5 263.7 561.6 232.1
Public acute hospitals no. 218.9 239.5 224.2 247.3 227.1 187.4 263.7 561.6 231.6
Public psychiatric hospitals no. 0.8 0.1 0.1 0.5 0.9 2.1 .. .. 0.5
2013-14
Separations
Public hospitals no. 1 771 521 1 509 766 1 087 073 595 884 415 778 114 033 96 968 123 847 5 714 870
Public acute hospitals no. 1 766 334 1 509 348 1 086 658 594 793 414 535 112 997 96 968 123 847 5 705 480
Public psychiatric hospitals no. 5 187 418 415 1 091 1 243 1 036 .. .. 9 390
Overnight separations
Public hospitals no. 966 448 641 912 534 791 278 209 220 485 53 974 44 812 40 154 2 780 785
Public acute hospitals no. 961 398 641 497 534 403 277 130 219 550 52 953 44 812 40 154 2 771 897
Public psychiatric hospitals no. 5 050 415 388 1 079 935 1 021 .. .. 8 888
Same day separations
Public hospitals no. 805 073 867 854 552 282 317 675 195 293 60 059 52 156 83 693 2 934 085
Public acute hospitals no. 804 936 867 851 552 255 317 663 194 985 60 044 52 156 83 693 2 933 583
Public psychiatric hospitals no. 137 3 27 12 308 15 .. .. 502
Same day separations (per cent of total)
Public hospitals % 45.4 57.5 50.8 53.3 47.0 52.7 53.8 67.6 51.3
REPORT ON
GOVERNMENT
SERVICES 2017
PUBLIC
HOSPITALS
PAGE 3 of TABLE 12A.5

TABLE 12A.5
Table 12A.5
Unit NSW Vic (b) Qld WA SA Tas ACT (c) NT Aust
Summary of separations, public hospitals (a)
Public acute hospitals % 45.6 57.5 50.8 53.4 47.0 53.1 53.8 67.6 51.4
Public psychiatric hospitals % 2.6 0.7 6.5 1.1 24.8 1.4 .. .. 5.3
Separations per 1000 population (d)
Public hospitals no. 221.9 247.4 228.1 234.7 225.8 201.9 262.0 571.1 234.4
Public acute hospitals no. 221.2 247.4 228.0 234.2 225.0 200.0 262.0 571.1 234.0
Public psychiatric hospitals no. 0.7 0.1 0.1 0.4 0.8 2.0 .. .. 0.4
2014-15
Separations
Public hospitals no. 1 813 998 1 587 951 1 202 798 600 723 422 295 119 506 100 784 132 283 5 980 338
Public acute hospitals no. 1 808 679 1 587 510 1 202 496 599 474 420 870 118 419 100 784 132 283 5 970 515
Public psychiatric hospitals no. 5 319 441 302 1 249 1 425 1 087 .. .. 9 823
Overnight separations
Public hospitals no. 983 352 672 286 558 410 276 646 222 732 55 946 47 316 41 243 2 857 931
Public acute hospitals no. 978 234 671 847 558 108 275 409 221 688 54 875 47 316 41 243 2 848 720
Public psychiatric hospitals no. 5 118 439 302 1 237 1 044 1 071 .. .. 9 211
Same day separations
Public hospitals no. 830 646 915 665 644 388 324 077 199 563 63 560 53 468 91 040 3 122 407
Public acute hospitals no. 830 445 915 663 644 388 324 065 199 182 63 544 53 468 91 040 3 121 795
Public psychiatric hospitals no. 201 2 – 12 381 16 .. .. 612
Same day separations (per cent of total)
Public hospitals % 45.8 57.7 53.6 53.9 47.3 53.2 53.1 68.8 52.2
Public acute hospitals % 45.9 57.7 53.6 54.1 47.3 53.7 53.1 68.8 52.3
Public psychiatric hospitals % 3.8 0.5 0.0 1.0 26.7 1.5 .. .. 6.2
Separations per 1000 population (d)
Public hospitals no. 222.6 254.9 246.7 231.0 225.6 208.3 267.2 598.0 240.2
Public acute hospitals no. 221.9 254.8 246.6 230.5 224.8 206.1 267.2 598.0 239.8
REPORT ON
GOVERNMENT
SERVICES 2017
PUBLIC
HOSPITALS
PAGE 4 of TABLE 12A.5

TABLE 12A.5
Table 12A.5
Unit NSW Vic (b) Qld WA SA Tas ACT (c) NT Aust
Summary of separations, public hospitals (a)
Public psychiatric hospitals no. 0.7 0.1 0.1 0.5 0.9 2.1 .. .. 0.4
(a)
(b)
(c)
(d)
Source: AIHW (various years), Australian Hospital Statistics , Health Services Series; AIHW (various years), Admitted patient care: Australian hospital statistics,
Health services series.
Separations for which the care type was reported as newborn with no qualified days, and records for hospital boarders and posthumous organ procurement
have been excluded.
.. Not applicable. – Nil or rounded to zero.
Figures are directly age-standardised to the June 2001 Australian population.
Data on state of hospitalisation should be interpreted with caution because of cross-border flows of patients. This is particularly the case for the ACT. In
2009–10, about 18 per cent of separations for ACT hospitals were for patients who resided in NSW.
There was a change in Victorian admission policy from 1 July 2012 that has impacted the separation time series.
REPORT ON
GOVERNMENT
SERVICES 2017
PUBLIC
HOSPITALS
PAGE 5 of TABLE 12A.5

TABLE 12A.6
Table 12A.6
Unit NSW Vic (b) Qld WA (c) SA (d) Tas ACT NT (e) Aust
Total separations (no.)
2005-06 '000 1 409 1 272 750 393 376 94 72 83 4 451
2006-07 '000 1 451 1 314 784 449 389 97 76 86 4 646
2007-08 '000 1 457 1 351 832 457 366 96 81 90 4 729
2008-09 '000 1 500 1 379 883 466 372 94 90 95 4 880
2009-10 '000 1 537 1 424 923 504 381 101 88 100 5 058
2010-11 '000 1 577 1 496 964 547 388 99 94 104 5 269
2011-12 '000 1 655 1 543 1 001 587 405 99 97 113 5 502
2012-13 '000 1 711 1 429 1 043 605 412 105 95 118 5 520
2013-14 '000 1 766 1 509 1 087 595 415 113 97 124 5 705
2014-15 '000 1 809 1 588 1 202 599 421 118 101 132 5 971
Overnight separations (no.)
2005-06 '000 792 561 383 194 192 48 33 34 2 237
2006-07 '000 814 577 398 213 197 48 35 34 2 315
2007-08 '000 819 584 424 221 203 45 37 34 2 368
2008-09 '000 838 590 440 226 205 45 41 36 2 420
2009-10 '000 847 615 453 235 208 50 41 37 2 485
2010-11 '000 869 646 472 254 211 49 44 38 2 585
2011-12 '000 919 660 496 269 217 49 45 39 2 696
2012-13 '000 942 641 520 279 221 49 45 39 2 737
2013-14 '000 961 641 534 277 220 53 45 40 2 772
2014-15 '000 978 672 558 275 222 55 47 41 2 849
Same day separations (no.)
2005-06 '000 617 711 367 200 184 46 39 50 2 214
2006-07 '000 637 737 386 236 192 49 41 52 2 331
2007-08 '000 638 767 408 235 163 51 44 56 2 362
2008-09 '000 662 790 443 240 168 50 49 60 2 460
2009-10 '000 690 809 469 270 173 51 48 63 2 573
2010-11 '000 708 850 492 292 177 50 50 66 2 685
2011-12 '000 736 883 505 317 188 51 52 74 2 806
2012-13 '000 769 788 523 327 191 56 50 79 2 783
2013-14 '000 805 868 552 318 195 60 52 84 2 934
2014-15 '000 830 916 644 324 199 64 53 91 3 122
Same day separations as a percentage of total separations (%)
2005-06 % 43.8 55.9 48.9 50.8 48.9 49.0 54.7 59.6 49.7
2006-07 % 43.9 56.1 49.2 52.6 49.4 50.5 54.4 60.6 50.2
2007-08 % 43.8 56.8 49.0 51.5 44.6 52.8 54.0 62.0 49.9
2008-09 % 44.1 57.2 50.2 51.5 45.0 52.6 54.2 62.7 50.4
2009-10 % 44.9 56.8 50.9 53.4 45.4 50.7 53.9 63.2 50.9
2010-11 % 44.9 56.8 51.0 53.5 45.7 50.1 53.2 63.3 50.9
2011-12 % 44.5 57.2 50.4 54.1 46.4 50.9 53.7 65.7 51.0
Separations, public (non-psychiatric) hospitals (a)
REPORT ON
GOVERNMENT
SERVICES 2017
PUBLIC
HOSPITALS
PAGE 1 of TABLE 12A.6

TABLE 12A.6
Table 12A.6
Unit NSW Vic (b) Qld WA (c) SA (d) Tas ACT NT (e) Aust
Separations, public (non-psychiatric) hospitals (a)
2012-13 % 44.9 55.1 50.1 54.0 46.3 53.0 52.9 67.2 50.4
2013-14 % 45.6 57.5 50.8 53.4 47.0 53.1 53.8 67.6 51.4
2014-15 % 45.9 57.7 53.6 54.1 47.3 53.7 53.1 68.8 52.3
Total separations (rate per 1000) (f)
2005-06 no. 199.8 243.7 187.9 195.7 228.4 185.8 238.4 483.0 212.8
2006-07 no. 204.4 246.6 190.1 217.7 231.5 187.5 244.8 480.1 218.0
2007-08 no. 201.4 247.7 195.6 214.3 215.1 182.7 256.1 486.4 216.9
2008-09 no. 203.4 247.2 202.0 212.0 215.1 177.7 275.4 487.9 218.8
2009-10 no. 203.4 248.7 204.7 222.1 216.2 186.7 263.6 486.8 220.9
2010-11 no. 204.8 255.6 209.3 234.6 216.2 180.9 272.3 504.5 225.5
2011-12 no. 215.3 264.8 220.2 248.2 226.5 179.2 278.8 544.7 236.0
2012-13 no. 218.9 239.5 224.2 247.3 227.1 187.4 263.7 561.6 231.6
2013-14 no. 221.2 247.4 228.0 234.2 225.0 200.0 262.0 571.1 234.0
2014-15 no. 221.9 254.8 246.6 230.5 224.8 206.1 267.2 598.0 239.8
(a)
(b)
(c)
(d)
(e)
(f)
Source :
Rates per 1000 people are directly age standardised to the Australian population at June 2001.
AIHW (various years), Australian Hospital Statistics , Health Services Series; AIHW (various
years), Admitted patient care: Australian hospital statistics , Health services series.
Excludes separations for which the care type was reported as ‘newborn with no qualified days’ and
records for hospital boarders and posthumous organ procurement.
In WA, separations for public patients at Joondalup and Peel Health Campuses are included from 2006-
07 figures but not in those for previous years.
In SA as of 1 July 2007, all sameday chemotherapy and scopes patients were treated on an outpatient
basis. This resulted in a drop in sameday inpatient activity from 2007-08 onwards. In addition to this
flexible bronchoscopy patients were treated as outpatients from 1 July 2009.
There was a change in Victorian admission policy from 1 July 2012 that has impacted the separation
time series.
Aboriginal and Torres Strait Islander people make up a high proportion of the population in the NT which
contributes to the high level of separations in the NT. Aboriginal and Torres Strait Islander people are
more likely than other Australians to experience poor health.
REPORT ON
GOVERNMENT
SERVICES 2017
PUBLIC
HOSPITALS
PAGE 2 of TABLE 12A.6

TABLE 12A.7
Table 12A.7
NSW Vic (b) Qld WA SA Tas ACT NT Aust
2011-12
Same-day separations
Childbirth 2 921 1 104 2 070 673 564 124 369 209 8 034
Specialist mental health 8 351 930 4 856 491 1 180 5 101 53 15 967
Emergency
Surgical 8 436 6 486 2 494 2 372 1 298 522 656 139 22 403
Medical 133 043 182 590 124 801 63 325 34 079 3 559 9 847 9 210 560 454
Other 1 873 762 734 588 231 119 133 17 4 457
Non-emergency
Surgical 102 433 108 908 55 086 38 606 36 677 8 120 4 674 4 004 358 508
Medical 409 794 492 295 282 218 170 483 105 379 30 260 32 984 58 879 1 582 292
Other 69 443 89 854 32 341 40 739 8 963 7 803 3 553 1 982 254 678
Total same-day separations 736 294 882 929 504 600 317 277 188 371 50 512 52 317 74 493 2 806 793
Overnight separations
Childbirth 69 968 53 259 41 364 20 943 14 581 3 731 4 040 2 983 210 869
Specialist mental health 32 074 20 562 18 626 10 059 7 640 2 169 1 343 857 93 330
Emergency
Surgical 76 568 56 058 40 147 26 938 18 950 5 381 5 944 4 491 234 477
Medical 469 321 308 907 247 201 139 147 112 626 22 154 19 924 22 416 1 341 696
Other 20 473 12 655 8 398 5 781 4 954 1 245 1 108 893 55 507
Non-emergency
Surgical 102 891 92 821 63 338 33 019 29 735 6 460 5 822 2 645 336 731
Medical 146 616 110 235 71 888 33 398 28 225 7 568 6 762 4 270 408 962
Other 6 397 6 347 5 653 1 581 2 233 412 195 309 23 127
Total overnight separations 924 308 660 844 496 615 270 866 218 944 49 120 45 138 38 864 2 704 699
Acute same-day and overnight separations by broad category of service, public hospitals (a)
REPORT ON
GOVERNMENT
SERVICES 2017
PUBLIC
HOSPITALS
PAGE 1 of TABLE 12A.7

TABLE 12A.7
Table 12A.7
NSW Vic (b) Qld WA SA Tas ACT NT Aust
Acute same-day and overnight separations by broad category of service, public hospitals (a)
Total seperations
Childbirth 72 889 54 363 43 434 21 616 15 145 3 855 4 409 3 192 218 903
Specialist mental health 40 425 21 492 23 482 10 550 8 820 2 174 1 444 910 109 297
Emergency
Surgical 85 004 62 544 42 641 29 310 20 248 5 903 6 600 4 630 256 880
Medical 602 364 491 497 372 002 202 472 146 705 25 713 29 771 31 626 1 902 150
Other 22 346 13 417 9 132 6 369 5 185 1 364 1 241 910 59 964
Non-emergency
Surgical 205 324 201 729 118 424 71 625 66 412 14 580 10 496 6 649 695 239
Medical 556 410 602 530 354 106 203 881 133 604 37 828 39 746 63 149 1 991 254
Other 75 840 96 201 37 994 42 320 11 196 8 215 3 748 2 291 277 805
Total 1 660 602 1 543 773 1 001 215 588 143 407 315 99 632 97 455 113 357 5 511 492
Same day separations (% of total separations)
Childbirth 4.0 2.0 4.8 3.1 3.7 3.2 8.4 6.5 3.7
Specialist mental health 20.7 4.3 20.7 4.7 13.4 0.2 7.0 5.8 14.6
Emergency
Surgical 9.9 10.4 5.8 8.1 6.4 8.8 9.9 3.0 8.7
Medical 22.1 37.1 33.5 31.3 23.2 13.8 33.1 29.1 29.5
Other 8.4 5.7 8.0 9.2 4.5 8.7 10.7 1.9 7.4
Non-emergency
Surgical 49.9 54.0 46.5 53.9 55.2 55.7 44.5 60.2 51.6
Medical 73.6 81.7 79.7 83.6 78.9 80.0 83.0 93.2 79.5
Other 91.6 93.4 85.1 96.3 80.1 95.0 94.8 86.5 91.7
REPORT ON
GOVERNMENT
SERVICES 2017
PUBLIC
HOSPITALS
PAGE 2 of TABLE 12A.7

TABLE 12A.7
Table 12A.7
NSW Vic (b) Qld WA SA Tas ACT NT Aust
Acute same-day and overnight separations by broad category of service, public hospitals (a)
2012-13
Same-day separations
Childbirth 2 986 1 263 2 402 742 619 193 459 172 8 836
Specialist mental health 7 982 1 782 4 382 453 936 8 115 54 15 712
Emergency
Surgical 8 614 5 183 2 747 2 244 1 469 621 733 130 21 741
Medical 144 356 82 596 160 619 63 585 37 051 4 479 9 617 9 915 512 218
Other 2 257 677 946 684 242 137 106 10 5 059
Non-emergency
Surgical 104 578 108 729 55 371 40 481 36 417 7 958 4 929 4 345 362 808
Medical 428 746 497 409 268 829 176 215 105 138 35 621 30 183 62 570 1 604 711
Other 69 821 89 926 27 810 42 614 9 376 6 809 3 946 2 293 252 595
Total same-day separations 769 340 787 565 523 106 327 018 191 248 55 826 50 088 79 489 2 783 680
Overnight separations
Childbirth 70 511 54 836 41 693 22 043 14 883 3 650 4 340 3 022 214 978
Specialist mental health 33 461 21 596 19 923 10 878 6 835 2 913 1 438 949 97 993
Emergency
Surgical 77 439 56 624 42 864 27 707 19 213 5 200 5 789 4 303 239 139
Medical 481 991 286 679 265 820 142 674 115 703 23 095 19 479 22 127 1 357 568
Other 21 019 13 040 9 698 6 097 4 949 1 370 1 163 1 036 58 372
Non-emergency
Surgical 104 352 92 269 61 634 33 778 28 808 6 351 5 675 2 825 335 692
Medical 151 938 110 432 74 368 35 034 30 032 7 562 6 530 4 261 420 157
Other 6 738 6 412 4 905 1 580 2 085 391 210 295 22 616
Total overnight separations 947 449 641 888 520 905 279 791 222 508 50 532 44 624 38 818 2 746 515
REPORT ON
GOVERNMENT
SERVICES 2017
PUBLIC
HOSPITALS
PAGE 3 of TABLE 12A.7

TABLE 12A.7
Table 12A.7
NSW Vic (b) Qld WA SA Tas ACT NT Aust
Acute same-day and overnight separations by broad category of service, public hospitals (a)
Total seperations
Childbirth 73 497 56 099 44 095 22 785 15 502 3 843 4 799 3 194 223 814
Specialist mental health 41 443 23 378 24 305 11 331 7 771 2 921 1 553 1 003 113 705
Emergency
Surgical 86 053 61 807 45 611 29 951 20 682 5 821 6 522 4 433 260 880
Medical 626 347 369 275 426 439 206 259 152 754 27 574 29 096 32 042 1 869 786
Other 23 276 13 717 10 644 6 781 5 191 1 507 1 269 1 046 63 431
Non-emergency
Surgical 208 930 200 998 117 005 74 259 65 225 14 309 10 604 7 170 698 500
Medical 580 684 607 841 343 197 211 249 135 170 43 183 36 713 66 831 2 024 868
Other 76 559 96 338 32 715 44 194 11 461 7 200 4 156 2 588 275 211
Total 1 716 789 1 429 453 1 044 011 606 809 413 756 106 358 94 712 118 307 5 530 195
Same day separations (% of total separations)
Childbirth 4.1 2.3 5.4 3.3 4.0 5.0 9.6 5.4 3.9
Specialist mental health 19.3 7.6 18.0 4.0 12.0 0.3 7.4 5.4 13.8
Emergency
Surgical 10.0 8.4 6.0 7.5 7.1 10.7 11.2 2.9 8.3
Medical 23.0 22.4 37.7 30.8 24.3 16.2 33.1 30.9 27.4
Other 9.7 4.9 8.9 10.1 4.7 9.1 8.4 1.0 8.0
Non-emergency
Surgical 50.1 54.1 47.3 54.5 55.8 55.6 46.5 60.6 51.9
Medical 73.8 81.8 78.3 83.4 77.8 82.5 82.2 93.6 79.3
Other 91.2 93.3 85.0 96.4 81.8 94.6 94.9 88.6 91.8
REPORT ON
GOVERNMENT
SERVICES 2017
PUBLIC
HOSPITALS
PAGE 4 of TABLE 12A.7

TABLE 12A.7
Table 12A.7
NSW Vic (b) Qld WA SA Tas ACT NT Aust
Acute same-day and overnight separations by broad category of service, public hospitals (a)
2013-14
Same-day separations
Childbirth 3 063 1 400 2 472 808 659 251 468 198 9 319
Specialist mental health 7 078 2 004 4 276 475 1 141 15 67 – 15 056
Emergency
Surgical 8 205 6 006 2 938 2 422 1 474 615 461 140 22 261
Medical 154 709 131 069 185 802 46 487 37 585 7 290 10 537 10 203 583 682
Other 1 976 1 065 1 095 1 304 251 206 135 17 6 049
Non-emergency
Surgical 102 360 115 851 55 212 40 966 35 708 7 801 5 390 4 190 367 478
Medical 433 861 507 036 256 477 179 151 98 970 36 456 29 753 66 276 1 607 980
Other 80 095 103 153 30 981 45 814 13 030 7 377 4 729 2 619 287 798
Total same-day separations 791 347 867 584 539 253 317 427 188 818 60 011 51 540 83 643 2 899 623
Overnight separations
Childbirth 69 938 55 536 41 778 22 472 14 858 3 821 4 528 3 033 215 964
Specialist mental health 32 583 21 899 18 717 10 373 6 439 2 182 1 299 991 94 483
Emergency
Surgical 79 281 57 118 44 060 28 114 19 026 5 629 5 425 4 703 243 356
Medical 487 939 273 532 277 702 139 979 113 623 25 163 20 708 22 969 1 361 615
Other 22 173 14 009 11 052 6 414 4 854 1 538 1 222 1 046 62 308
Non-emergency
Surgical 105 287 97 576 63 814 35 054 28 091 6 342 6 085 2 629 344 878
Medical 106 054 73 799 42 771 19 920 21 977 6 111 2 915 3 604 277 151
Other 7 100 7 003 4 853 1 792 2 120 491 207 312 23 878
Total overnight separations 910 355 600 472 504 747 264 118 210 988 51 277 42 389 39 287 2 623 633
REPORT ON
GOVERNMENT
SERVICES 2017
PUBLIC
HOSPITALS
PAGE 5 of TABLE 12A.7

TABLE 12A.7
Table 12A.7
NSW Vic (b) Qld WA SA Tas ACT NT Aust
Acute same-day and overnight separations by broad category of service, public hospitals (a)
Total seperations
Childbirth 73 001 56 936 44 250 23 280 15 517 4 072 4 996 3 231 225 283
Specialist mental health 39 661 23 903 22 993 10 848 7 580 2 197 1 366 991 109 539
Emergency
Surgical 87 486 63 124 46 998 30 536 20 500 6 244 5 886 4 843 265 617
Medical 642 648 404 601 463 504 186 466 151 208 32 453 31 245 33 172 1 945 297
Other 24 149 15 074 12 147 7 718 5 105 1 744 1 357 1 063 68 357
Non-emergency
Surgical 207 647 213 427 119 026 76 020 63 799 14 143 11 475 6 819 712 356
Medical 539 915 580 835 299 248 199 071 120 947 42 567 32 668 69 880 1 885 131
Other 87 195 110 156 35 834 47 606 15 150 7 868 4 936 2 931 311 676
Total 1 701 702 1 468 056 1 044 000 581 545 399 806 111 288 93 929 122 930 5 523 256
Same day separations (% of total separations)
Childbirth 4.2 2.5 5.6 3.5 4.2 6.2 9.4 6.1 4.1
Specialist mental health 17.8 8.4 18.6 4.4 15.1 0.7 4.9 0.0 13.7
Emergency
Surgical 9.4 9.5 6.3 7.9 7.2 9.8 7.8 2.9 8.4
Medical 24.1 32.4 40.1 24.9 24.9 22.5 33.7 30.8 30.0
Other 8.2 7.1 9.0 16.9 4.9 11.8 9.9 1.6 8.8
Non-emergency
Surgical 49.3 54.3 46.4 53.9 56.0 55.2 47.0 61.4 51.6
Medical 80.4 87.3 85.7 90.0 81.8 85.6 91.1 94.8 85.3
Other 91.9 93.6 86.5 96.2 86.0 93.8 95.8 89.4 92.3
REPORT ON
GOVERNMENT
SERVICES 2017
PUBLIC
HOSPITALS
PAGE 6 of TABLE 12A.7

TABLE 12A.7
Table 12A.7
NSW Vic (b) Qld WA SA Tas ACT NT Aust
Acute same-day and overnight separations by broad category of service, public hospitals (a)
2014-15
Same-day separations
Childbirth 3 120 1 368 2 395 873 778 276 427 155 9 392
Specialist mental health 6 161 1 418 5 688 613 1 310 15 60 – 15 265
Emergency
Surgical 8 295 6 602 2 981 2 447 1 648 593 459 136 23 161
Medical 164 205 160 632 206 307 46 108 42 028 8 139 10 647 11 960 650 026
Other 1 733 1 470 1 306 1 164 234 274 130 24 6 335
Non-emergency
Surgical 105 422 116 787 59 911 40 733 36 153 7 952 5 604 4 117 376 679
Medical 443 353 518 981 308 524 188 154 98 030 37 984 30 449 71 832 1 697 307
Other 83 821 108 149 44 066 43 829 12 042 8 274 4 998 2 730 307 909
Total same-day separations 816 110 915 407 631 178 323 921 192 223 63 507 52 774 90 954 3 086 074
Overnight separations
Childbirth 69 803 56 251 42 214 22 710 14 672 4 071 4 754 3 116 217 591
Specialist mental health 34 225 23 202 19 276 11 593 7 899 2 270 1 236 957 100 658
Emergency
Surgical 80 787 60 198 45 233 27 917 19 479 5 884 5 490 4 651 249 639
Medical 496 582 292 925 293 116 141 005 115 148 26 399 21 802 24 186 1 411 163
Other 23 188 14 414 11 884 6 533 4 818 1 554 1 315 1 045 64 751
Non-emergency
Surgical 107 118 99 159 66 347 32 605 27 240 6 683 6 068 2 663 347 883
Medical 107 560 75 576 43 762 19 387 21 783 5 521 3 477 3 465 280 531
Other 7 641 7 294 5 206 1 696 1 960 425 230 297 24 749
Total overnight separations 926 904 629 019 527 038 263 446 212 999 52 807 44 372 40 380 2 696 965
REPORT ON
GOVERNMENT
SERVICES 2017
PUBLIC
HOSPITALS
PAGE 7 of TABLE 12A.7

TABLE 12A.7
Table 12A.7
NSW Vic (b) Qld WA SA Tas ACT NT Aust
Acute same-day and overnight separations by broad category of service, public hospitals (a)
Total seperations
Childbirth 72 923 57 619 44 609 23 583 15 450 4 347 5 181 3 271 226 983
Specialist mental health 40 386 24 620 24 964 12 206 9 209 2 285 1 296 957 115 923
Emergency
Surgical 89 082 66 800 48 214 30 364 21 127 6 477 5 949 4 787 272 800
Medical 660 787 453 557 499 423 187 113 157 176 34 538 32 449 36 146 2 061 189
Other 24 921 15 884 13 190 7 697 5 052 1 828 1 445 1 069 71 086
Non-emergency
Surgical 212 540 215 946 126 258 73 338 63 393 14 635 11 672 6 780 724 562
Medical 550 913 594 557 352 286 207 541 119 813 43 505 33 926 75 297 1 977 838
Other 91 462 115 443 49 272 45 525 14 002 8 699 5 228 3 027 332 658
Total 1 813 998 1 587 951 1 202 798 600 723 422 295 119 506 100 784 132 283 5 980 338
Same day separations (% of total separations)
Childbirth 4.3 2.4 5.4 3.7 5.0 6.3 8.2 4.7 4.1
Specialist mental health 15.3 5.8 22.8 5.0 14.2 0.7 4.6 0.0 13.2
Emergency
Surgical 9.3 9.9 6.2 8.1 7.8 9.2 7.7 2.8 8.5
Medical 24.8 35.4 41.3 24.6 26.7 23.6 32.8 33.1 31.5
Other 7.0 9.3 9.9 15.1 4.6 15.0 9.0 2.2 8.9
Non-emergency
Surgical 49.6 54.1 47.5 55.5 57.0 54.3 48.0 60.7 52.0
Medical 80.5 87.3 87.6 90.7 81.8 87.3 89.8 95.4 85.8
Other 91.6 93.7 89.4 96.3 86.0 95.1 95.6 90.2 92.6
REPORT ON
GOVERNMENT
SERVICES 2017
PUBLIC
HOSPITALS
PAGE 8 of TABLE 12A.7

TABLE 12A.7
Table 12A.7
NSW Vic (b) Qld WA SA Tas ACT NT Aust
Acute same-day and overnight separations by broad category of service, public hospitals (a)
(a)
(b)
Source : AIHW (various years), Australian Hospital Statistics , Health Services Series; AIHW (various years), Admitted patient care: Australian hospital statistics ,
Health services series.
There was a change in Victorian admission policy from 1 July 2012 that has impacted the separation time series.
Separations for which the care type was reported as Acute or Newborn (with at least one qualified day) and separations for which care type was not reported.
– Nil or rounded to zero.
REPORT ON
GOVERNMENT
SERVICES 2017
PUBLIC
HOSPITALS
PAGE 9 of TABLE 12A.7

TABLE 12A.8
Table 12A.8
NSW Vic Qld WA (d) SA Tas (e) ACT (e) NT (e) Total (f)
2005-06
Public hospitals
495.6 np 745.4 845.2 875.0 np np 1 548.0 792.1
All people 203.2 243.4 186.2 196.4 228.4 np np 479.1 213.6
Private Hospitals
np np np np np np np np np
All people 108.6 136.4 175.2 157.2 129.2 np np np np
2006-07
Public hospitals
528.0 624.3 756.7 876.5 929.3 np np 1 584.8 787.5
All people 206.0 246.7 190.2 218.4 232.6 np np 480.1 218.8
Private Hospitals
np np np np np np np np np
All people 112.9 141.3 177.9 138.4 132.5 np np np 141.4
2007-08
Public hospitals
550.5 629.8 785.7 869.4 908.9 np np 1 670.7 807.7
All people 202.8 247.8 195.7 215.1 216.4 np np 486.4 217.6
Private Hospitals
15.0 53.7 82.0 315.3 91.3 np np np 95.1
All people 117.6 145.5 181.5 150.9 138.3 np np np 147.0
2008-09
Public hospitals
511.5 535.8 732.5 817.3 950.5 np np 1 656.0 763.3
All people 205.6 249.5 204.4 215.8 217.7 np np 495.5 221.3
Private Hospitals
17.3 44.1 64.6 373.1 67.4 np np np 81.7
All people 122.9 145.3 186.6 165.3 143.4 np np np 145.6
2009-10
Aboriginal and Torres
Strait Islander people
Aboriginal and Torres
Strait Islander people
Aboriginal and Torres
Strait Islander people
Aboriginal and Torres
Strait Islander people
Separations per 1000 people, by Indigenous status of patient
(number) (a), (b), (c)
Aboriginal and Torres
Strait Islander people
Aboriginal and Torres
Strait Islander people
Aboriginal and Torres
Strait Islander people
Aboriginal and Torres
Strait Islander people
REPORT ON
GOVERNMENT
SERVICES 2017
PUBLIC
HOSPITALS
PAGE 1 of TABLE 12A.8

TABLE 12A.8
Table 12A.8
NSW Vic Qld WA (d) SA Tas (e) ACT (e) NT (e) Total (f)
Separations per 1000 people, by Indigenous status of patient
(number) (a), (b), (c)
Public hospitals
522.5 558.1 752.8 901.8 1 005.2 np np 1 663.8 813.4
All people 207.1 251.4 206.7 225.4 219.9 np np 500.2 224.3
Private Hospitals
15.4 62.5 47.4 411.8 52.0 np np np 84.0
All people 127.7 155.4 188.0 168.8 149.0 np np np 152.6
2010-11
Public hospitals
540.7 636.4 765.2 986.6 1 059.5 np np 1 704.3 848.0
All people 207.3 258.0 211.5 238.3 218.2 np np 510.6 227.9
Private Hospitals
18.5 135.5 40.5 453.0 37.7 np np np 93.3
All people 131.3 149.6 186.5 180.4 152.8 np np np 152.4
2011-12
Public hospitals
589.6 715.3 794.9 1 074.5 1 129.1 223.5 652.5 1 778.7 877.4
All people 216.1 264.9 220.3 248.8 227.6 179.9 278.8 544.7 236.4
Private Hospitals
24.6 91.9 43.7 488.0 33.2 np np np 95.5
All people 137.7 155.9 195.2 183.1 155.5 np np np 158.2
2012-13
Public hospitals
650.2 701.3 874.8 1 095.8 1 193.5 244.5 626.6 1 906.4 938.6
All people 223.2 244.7 229.7 256.7 231.1 191.0 271.9 579.7 237.0
Private Hospitals
29.6 79.0 45.1 523.1 42.9 np np np 103.1
All people 139.2 160.0 202.5 189.6 159.2 np np np 162.3
2013-14
Aboriginal and Torres
Strait Islander people
Aboriginal and Torres
Strait Islander people
Aboriginal and Torres
Strait Islander people
Aboriginal and Torres
Strait Islander people
Aboriginal and Torres
Strait Islander people
Aboriginal and Torres
Strait Islander people
Aboriginal and Torres
Strait Islander people
Aboriginal and Torres
Strait Islander people
REPORT ON
GOVERNMENT
SERVICES 2017
PUBLIC
HOSPITALS
PAGE 2 of TABLE 12A.8

TABLE 12A.8
Table 12A.8
NSW Vic Qld WA (d) SA Tas (e) ACT (e) NT (e) Total (f)
Separations per 1000 people, by Indigenous status of patient
(number) (a), (b), (c)
Public hospitals
527.0 597.9 751.0 1 032.8 885.7 191.7 483.9 1 863.4 800.6
All people 221.9 247.4 228.1 234.7 225.8 201.9 262.0 571.1 234.4
Private Hospitals
25.5 55.0 44.2 520.9 41.3 np np np 95.6
All people 135.9 158.7 202.4 186.0 159.7 np np np 160.7
2014-15
Public hospitals
554.0 647.8 777.6 1 096.9 871.4 238.2 489.3 1 981.2 842.1
All people 222.6 254.9 246.7 231.0 225.6 208.3 267.2 598.0 240.2
Private Hospitals
32.0 48.7 56.1 547.6 46.7 np np np 105.3
All people 143.0 160.2 207.4 183.9 159.7 np np np 164.4
(a)
(b)
(c)
(d)
(e)
(f)
Source :
Directly age standardised to the Australian population at 30 June 2001.
Identification of Aboriginal and Torres Strait Islander patients has varied among jurisdictions and over
time. From 2011-12 Indigenous data are of acceptable quality for all states and territories in public
hospitals. From 2006-07 data for NSW, Victoria, Queensland, SA, WA and the NT (public only) were of
acceptable quality. For 2005-06 NSW, Queensland, SA, WA and the NT (public only) were of
acceptable quality. Prior to this Queensland, SA, WA and the NT (public only) were of acceptable
quality. Data should be interpreted with caution as there are jurisdictional differences in data quality and
changes in hospitalisation rates for Indigenous people over time may include a component due to
improved identification.
AIHW (unpublished), National Hospital Morbidity Database.
np Not published.
In WA, separations for public patients at Joondalup and Peel Health Campuses are included from 2006-
07 public hospitals figures but not in those for previous years.
The totals include data only for the states and teritories that had acceptable data quality. Caution should
be used in the interpretation of these data because of jurisdictional differences in data quality.
Private hospital data are supressed for confidentiality reasons.
Excludes separations with a care type of Newborn without qualified days, and records for Hospital
boarders and Posthumous organ procurement.
Aboriginal and Torres
Strait Islander people
Aboriginal and Torres
Strait Islander people
Aboriginal and Torres
Strait Islander people
Aboriginal and Torres
Strait Islander people
REPORT ON
GOVERNMENT
SERVICES 2017
PUBLIC
HOSPITALS
PAGE 3 of TABLE 12A.8

TABLE 12A.9
Table 12A.9
NSW (d) Vic (e) Qld (f) WA (g) SA Tas (h) ACT (i) NT Aust
2005-06
Salaried medical officers 1.2 1.1 1.0 1.0 1.3 1.0 1.2 1.5 1.1
Nurses 5.3 5.0 4.0 4.3 5.7 4.7 5.0 5.7 4.9
Registered nurses na na 3.4 4.0 4.4 4.2 4.3 5.0 na
Other nurses na na 0.6 0.3 1.2 0.5 0.8 0.7 na
Other personal care staff na na 0.2 na na 0.2 0.5 0.1 na
Diagnostic and allied health 1.6 2.4 0.9 1.2 1.4 0.9 1.3 1.4 1.6
Administrative and clerical 1.8 1.9 1.2 1.6 1.9 1.3 1.8 2.0 1.7
Domestic and other staff 1.7 1.4 1.6 1.9 1.5 2.1 0.5 2.6 1.6
Total staff 11.5 11.8 8.9 10.1 11.7 10.2 10.4 13.2 10.9
2006-07
Salaried medical officers 1.1 1.2 1.2 1.2 1.4 1.1 1.3 1.6 1.2
Nurses 5.4 5.2 4.3 4.6 5.6 4.6 5.2 5.7 5.0
Registered nurses na na 3.7 4.4 4.4 4.1 4.3 5.1 na
Other nurses na na 0.6 0.2 1.2 0.5 0.9 0.7 na
Other personal care staff na na 0.2 0.0 0.5 0.2 0.5 0.1 na
Diagnostic and allied health 1.7 2.4 1.1 1.3 1.2 0.9 1.3 1.4 1.7
Administrative and clerical 1.8 2.0 1.4 1.9 2.0 1.5 1.7 2.1 1.8
Domestic and other staff 1.7 1.3 1.8 2.0 1.3 2.0 0.5 2.6 1.6
Total staff 11.7 12.0 10.0 11.0 12.0 10.2 10.5 13.5 11.4
2007-08
Salaried medical officers 1.2 1.3 1.4 1.2 1.4 1.0 1.5 1.6 1.3
Nurses 5.3 5.2 4.6 4.5 5.8 4.5 5.7 5.6 5.1
Registered nurses na na 4.0 4.3 4.6 4.0 4.7 5.0 na
Other nurses na na 0.6 0.2 1.2 0.5 1.0 0.6 na
Other personal care staff na na 0.2 na 0.5 na 0.5 0.1 na
Diagnostic and allied health 1.8 2.4 1.2 1.4 1.3 1.1 1.4 1.5 1.7
Administrative and clerical 1.6 2.1 1.5 1.9 1.9 1.3 1.8 2.0 1.8
Domestic and other staff 1.4 1.3 1.8 2.0 1.2 2.0 0.5 2.6 1.5
Total staff 11.4 12.2 10.6 11.0 12.1 9.9 11.4 13.3 11.4
2008-09
Salaried medical officers 1.2 1.4 1.4 1.3 1.5 1.5 1.8 1.7 1.4
Nurses 5.4 5.4 4.6 4.7 6.1 4.9 5.8 6.1 5.2
Registered nurses na na na na na na na na na
Other nurses na na na na na na na na na
Other personal care staff na na 0.2 na 0.5 na 0.5 0.1 na
Diagnostic and allied health 1.7 2.4 1.1 1.4 1.2 1.0 1.5 1.5 1.7
Administrative and clerical 1.6 2.1 1.5 1.9 1.9 1.6 2.0 2.0 1.8
Domestic and other staff 1.3 1.2 1.7 1.9 1.2 2.2 0.5 2.6 1.4
Total staff 11.1 12.5 10.5 11.2 12.3 11.2 12.2 14.0 11.5
Average full time equivalent (FTE) staff per 1000 persons, public
hospital services (including psychiatric hospitals) (a), (b), (c)
REPORT ON
GOVERNMENT
SERVICES 2017
PUBLIC
HOSPITALS
PAGE 1 of TABLE 12A.9

TABLE 12A.9
Table 12A.9
NSW (d) Vic (e) Qld (f) WA (g) SA Tas (h) ACT (i) NT Aust
Average full time equivalent (FTE) staff per 1000 persons, public
hospital services (including psychiatric hospitals) (a), (b), (c)
2009-10
Salaried medical officers 1.3 1.4 1.4 1.4 1.6 1.8 1.7 1.7 1.4
Nurses 5.2 5.5 4.6 4.7 6.3 5.3 5.8 6.7 5.2
Registered nurses na na na na na na na na na
Other nurses na na na na na na na na na
Other personal care staff na na 0.2 na 0.5 na 0.5 0.0 0.1
Diagnostic and allied health 1.6 2.5 1.1 1.2 1.2 1.0 1.5 1.6 1.6
Administrative and clerical 1.6 2.1 1.5 1.9 1.8 2.0 2.0 2.1 1.7
Domestic and other staff 1.3 1.3 1.7 1.8 1.1 2.1 0.5 2.7 1.4
Total staff 10.9 12.7 10.5 11.0 12.6 12.3 12.0 14.9 11.5
2010-11
Salaried medical officers 1.3 1.5 1.6 1.4 1.6 1.9 1.8 1.9 1.5
Nurses 5.2 5.7 5.1 4.8 6.4 5.5 5.9 6.7 5.4
Registered nurses na na na na na na na na na
Other nurses na na na na na na na na na
Other personal care staff na na 0.3 na 0.6 na 0.6 0.0 0.1
Diagnostic and allied health 1.5 2.6 1.2 1.2 1.2 1.1 1.6 1.6 1.7
Administrative and clerical 1.6 2.1 1.7 2.0 2.1 2.1 2.1 2.0 1.9
Domestic and other staff 1.1 1.3 1.8 1.9 1.1 2.1 0.5 2.7 1.4
Total staff 10.8 13.2 11.6 11.2 12.9 12.7 12.4 15.0 11.9
2011-12
Salaried medical officers 1.4 1.5 1.7 1.5 1.7 1.7 1.8 2.0 1.5
Nurses 5.4 5.7 5.1 4.9 6.5 5.3 6.7 6.9 5.5
Registered nurses na na na na na na na na na
Other nurses na na na na na na na na na
Other personal care staff na na 0.3 na 0.5 na 0.6 0.0 0.1
Diagnostic and allied health 1.4 2.6 1.2 1.3 1.1 1.1 2.5 1.7 1.7
Administrative and clerical 1.6 2.2 1.7 2.0 2.0 2.2 2.6 2.1 1.9
Domestic and other staff 1.1 1.3 1.8 1.8 1.0 2.1 0.0 2.8 1.4
Total staff 11.0 13.3 11.9 11.5 12.7 12.4 14.2 15.6 12.0
2012-13
Salaried medical officers 1.4 1.5 1.6 1.5 1.7 1.5 2.1 2.1 1.5
Nurses 5.6 5.6 4.7 5.0 6.5 5.1 7.2 7.1 5.4
Registered nurses na na na na na na na na na
Other nurses na na na na na na na na na
Other personal care staff na – 0.2 – 0.5 na 0.8 0.0 0.1
Diagnostic and allied health 1.6 2.5 1.1 1.3 1.1 1.2 2.8 1.7 1.7
Administrative and clerical 1.7 2.1 1.5 2.1 2.0 2.2 2.1 2.1 1.9
Domestic and other staff 1.1 1.3 1.7 1.9 0.9 2.1 0.2 2.7 1.4
Total staff 11.5 13.0 10.8 11.8 12.8 12.1 15.1 15.7 12.0
REPORT ON
GOVERNMENT
SERVICES 2017
PUBLIC
HOSPITALS
PAGE 2 of TABLE 12A.9

TABLE 12A.9
Table 12A.9
NSW (d) Vic (e) Qld (f) WA (g) SA Tas (h) ACT (i) NT Aust
Average full time equivalent (FTE) staff per 1000 persons, public
hospital services (including psychiatric hospitals) (a), (b), (c)
2013-14
Salaried medical officers 1.5 1.5 1.7 1.5 1.8 1.6 2.3 2.1 1.6
Nurses 5.7 5.7 5.0 5.0 6.6 5.5 7.5 7.0 5.6
Registered nurses na na na na na na na na na
Other nurses na na na na na na na na na
Other personal care staff na na na na na na na na na
Diagnostic and allied health 1.7 2.6 1.3 1.5 1.1 1.3 3.0 1.7 1.8
Administrative and clerical 1.8 2.2 1.6 1.7 2.0 2.3 3.0 2.0 1.9
Domestic and other staff 1.2 1.3 1.9 1.8 1.5 2.2 1.5 2.8 1.5
Total staff 11.9 13.2 11.5 11.5 13.0 12.9 17.3 15.6 12.3
2014-15
Salaried medical officers 1.6 1.7 1.7 2.4 1.8 1.8 2.2 2.3 1.8
Nurses 6.1 6.2 5.1 5.7 6.4 6.4 7.6 7.6 5.9
Registered nurses na 5.3 4.5 5.7 5.2 5.8 7.0 7.1 3.5
Other nurses na 0.9 0.6 – 1.2 0.7 0.7 0.4 0.4
Diagnostic and allied health 2.2 2.4 1.2 1.8 1.2 1.7 2.6 1.9 2.0
Administrative and clerical 3.3 2.3 1.6 3.0 1.5 2.9 3.8 2.1 2.6
1.8 1.6 1.7 2.0 1.5 2.7 1.2 2.4 1.7
Total staff 15.1 14.2 11.3 15.0 12.5 15.5 17.4 16.3 14.0
(a)
(b)
(c)
(d)
(e)
(f)
(g)
(h)
Where average FTE staff numbers are not available for a financial year, staff numbers on the last day
of the financial year are used (for example, 30 June 2009, for 2008-09). Staff contracted to provide
products (rather than labour) are not included.
For Victoria, FTEs may be slightly understated. 'Other personal care staff' are included in 'domestic and
other staff'.
Many WA hospitals were unable to provide a split between nurse categories and these have been
reported as registered nurses.
In Tasmania in 2006-07 data for two small hospitals are not included. Tasmanian 'other personal care'
staff are included in 'domestic and other staff'.
Staff per 1000 people are calculated from ABS population data at 31 December 2013 (table 2A.2).
Population data used to derive rates are revised to the final 2011 Census rebased estimates and
projections. Population data for All Australians for all years are estimates. See chapter 2 (table 2A.2)
for details.
Queensland pathology services staff employed by the state pathology service are not included.
For NSW, 'other personal care staff' are included in 'diagnostic and allied health' and 'domestic and
other staff'.
Other personal care staff,
domestic and other
For 2014–15, average full-time equivalent staff reported to the AIHW by most jurisdictions (excludes
Queensland) included staff employed in providing public hospital services by public hospitals, local
hospital networks and by state/territory health authorities. The staffing data for 2014–15 are not
comparable with staffing data reported in previous years, which did not include staff employed by local
hospital networks and by state/territory health authorities.
REPORT ON
GOVERNMENT
SERVICES 2017
PUBLIC
HOSPITALS
PAGE 3 of TABLE 12A.9

TABLE 12A.9
Table 12A.9
NSW (d) Vic (e) Qld (f) WA (g) SA Tas (h) ACT (i) NT Aust
Average full time equivalent (FTE) staff per 1000 persons, public
hospital services (including psychiatric hospitals) (a), (b), (c)
(i)
Source : AIHW (various years), Australian hospital statistics, Health Services Series; AIHW (various
years), Hospital resources: Australian hospital statistics , Health services series.
na Not available.
Caution should be used in comparing data for the ACT with other jurisdictions as the ACT workforce
serves many residents of southern NSW in addition to ACT residents, while only ACT residents are
captured in the denominator.
REPORT ON
GOVERNMENT
SERVICES 2017
PUBLIC
HOSPITALS
PAGE 4 of TABLE 12A.9

TABLE 12A.10
Table 12A.10
Unit NSW Vic (b) Qld WA SA Tas ACT NT Aust
2010-11
Number of separations
Acute care no. 1 510 980 1 446 301 919 598 529 774 371 880 96 124 86 828 102 340 5 063 825
Rehabilitation care no. 30 832 14 776 19 385 9 496 7 664 1 114 2 718 441 86 426
Palliative care no. 10 919 6 659 6 599 1 234 1 678 217 629 320 28 255
Geriatric evaluation
and management no. 5 624 15 293 2 172 804 1 701 141 707 42 26 484
Psychogeriatric care no. 808 – 596 730 288 1 21 1 2 445
Maintenance care no. 7 919 621 5 863 1 384 2 803 437 1 570 292 20 889
Newborn total no. 77 737 56 535 45 530 23 273 15 693 4 548 4 557 3 545 231 418
Newborn — unqualified
days only no. 62 019 44 278 35 563 18 423 11 553 3 267 3 286 2 623 181 012
Other admitted care no. – – 169 – – 14 1 76 260
Not reported no. 4 134 – – – 4 – – 142
Total (c) no. 1 644 823 1 540 319 999 912 566 695 401 707 102 600 97 031 107 057 5 460 144
Total (d) no. 1 582 804 1 496 041 964 349 548 272 390 154 99 333 93 745 104 434 5 279 132
Proportion of total separations
Acute care % 95.5 96.7 95.4 96.6 95.3 96.8 92.6 98.0 95.9
Rehabilitation care % 1.9 1.0 2.0 1.7 2.0 1.1 2.9 0.4 1.6
Palliative care % 0.7 0.4 0.7 0.2 0.4 0.2 0.7 0.3 0.5
Geriatric evaluation
and management % 0.4 1.0 0.2 0.1 0.4 0.1 0.8 – 0.5
Psychogeriatric care % 0.1 – 0.1 0.1 0.1 – – – –
Maintenance care % 0.5 – 0.6 0.3 0.7 0.4 1.7 0.3 0.4
% 1.0 0.8 1.0 0.9 1.1 1.3 1.4 0.9 1.0
Separations, by type of episode of care, public hospitals (including psychiatric), 2014-15 (a)
Newborn excluding
unqualified days
REPORT ON
GOVERNMENT
SERVICES 2017
PUBLIC
HOSPITALS
PAGE 1 of TABLE 12A.10

TABLE 12A.10
Table 12A.10
Unit NSW Vic (b) Qld WA SA Tas ACT NT Aust
Separations, by type of episode of care, public hospitals (including psychiatric), 2014-15 (a)
Other admitted care % – – – – – – – 0.1 –
Not reported % – – – – – – – – –
Total (d) % 100.0 100.0 100.0 100.0 100.0 100.0 100.0 100.0 100.0
2011-12
Number of separations
Acute care no. 1 564 100 1 490 776 947 980 566 072 387 421 95 999 91 177 111 520 5 255 045
Rehabilitation care no. 31 964 14 954 24 068 11 511 9 205 910 2 603 347 95 562
Palliative care no. 12 371 7 191 7 333 1 456 1 492 476 648 293 31 260
Geriatric evaluation
and management no. 5 907 16 963 3 712 1 554 1 597 324 374 20 30 451
Psychogeriatric care no. 827 – 472 732 255 54 42 – 2 382
Maintenance care no. 8 671 553 6 859 1 411 3 037 384 1 210 146 22 271
Newborn total no. 78 731 58 981 46 498 24 112 16 258 4 132 4 862 3 704 237 278
Newborn — unqualified
days only no. 42 116 45 672 35 804 18 705 11 950 2 670 3 483 2 806 163 206
Other admitted care no. 135 – 97 – – 13 22 133 400
Not reported no. 12 27 – – – 10 – – 49
Total (c) no. 1 702 718 1 589 445 1 037 019 606 848 419 265 102 302 100 938 116 163 5 674 698
Total (d) no. 1 660 602 1 543 773 1 001 215 588 143 407 315 99 632 97 455 113 357 5 511 492
Proportion of total separations
Acute care % 94.2 96.6 94.7 96.2 95.1 96.4 93.6 98.4 95.3
Rehabilitation care % 1.9 1.0 2.4 2.0 2.3 0.9 2.7 0.3 1.7
Palliative care % 0.7 0.5 0.7 0.2 0.4 0.5 0.7 0.3 0.6
Geriatric evaluation
and management % 0.4 1.1 0.4 0.3 0.4 0.3 0.4 – 0.6
Psychogeriatric care % – – – 0.1 0.1 0.1 – – –
REPORT ON
GOVERNMENT
SERVICES 2017
PUBLIC
HOSPITALS
PAGE 2 of TABLE 12A.10

TABLE 12A.10
Table 12A.10
Unit NSW Vic (b) Qld WA SA Tas ACT NT Aust
Separations, by type of episode of care, public hospitals (including psychiatric), 2014-15 (a)
Maintenance care % 0.5 – 0.7 0.2 0.7 0.4 1.2 0.1 0.4
% 2.2 0.9 1.1 0.9 1.1 1.5 1.4 0.8 1.3
Other admitted care % – – – – – – – 0.1 –
Not reported % – – – – – – – – –
Total (d) % 100.0 100.0 100.0 100.0 100.0 100.0 100.0 100.0 100.0
2012-13
Number of separations
Acute care no. 1 614 570 1 375 204 984 757 583 629 393 762 102 023 88 879 116 574 5 259 398
Rehabilitation care no. 35 533 15 264 27 012 11 564 10 069 911 2 608 259 103 220
Palliative care no. 13 129 7 342 8 404 1 518 1 411 553 600 315 33 272
Geriatric evaluation
and management no. 6 497 17 920 4 606 1 964 1 479 266 456 96 33 284
Psychogeriatric care no. 809 – 472 792 268 114 28 2 2 485
Maintenance care no. 9 590 470 7 494 1 412 2 290 866 777 163 23 062
Newborn total no. 78 805 60 763 47 382 25 544 16 726 4 045 5 166 3 665 242 096
Newborn — unqualified
days only no. 42 145 47 510 36 118 19 614 12 249 2 467 3 807 2 832 166 742
Other admitted care no. 1 – 2 – – 6 5 65 79
Not reported no. – – – – – 41 – – 41
Total (c) no. 1 758 934 1 476 963 1 080 129 626 423 426 005 108 825 98 519 121 139 5 696 937
Total (d) no. 1 716 789 1 429 453 1 044 011 606 809 413 756 106 358 94 712 118 307 5 530 195
Proportion of total separations
Acute care % 94.0 96.2 94.3 96.2 95.2 95.9 93.8 98.5 95.1
Rehabilitation care % 2.1 1.1 2.6 1.9 2.4 0.9 2.8 0.2 1.9
Palliative care % 0.8 0.5 0.8 0.3 0.3 0.5 0.6 0.3 0.6
Newborn excluding
unqualified days
REPORT ON
GOVERNMENT
SERVICES 2017
PUBLIC
HOSPITALS
PAGE 3 of TABLE 12A.10

TABLE 12A.10
Table 12A.10
Unit NSW Vic (b) Qld WA SA Tas ACT NT Aust
Separations, by type of episode of care, public hospitals (including psychiatric), 2014-15 (a)
Geriatric evaluation
and management % 0.4 1.3 0.4 0.3 0.4 0.3 0.5 0.1 0.6
Psychogeriatric care % – – – 0.1 0.1 0.1 – – –
Maintenance care % 0.6 – 0.7 0.2 0.6 0.8 0.8 0.1 0.4
% 2.1 0.9 1.1 1.0 1.1 1.5 1.4 0.7 1.4
Other admitted care % – – – – – – – 0.1 –
Not reported % – – – – – – – – –
Total (d) % 100.0 100.0 100.0 100.0 100.0 100.0 100.0 100.0 100.0
2013-14
Number of separations
Acute care no. 1 664 642 1 454 287 1 032 739 575 631 395 472 109 829 92 628 122 016 5 447 244
Rehabilitation care no. 39 096 15 627 24 168 7 136 10 264 895 1 657 248 99 091
Palliative care no. 12 235 7 353 8 051 1 604 1 896 569 550 327 32 585
Geriatric evaluation
and management no. 7 344 18 286 3 825 3 000 1 337 245 168 116 34 321
Psychogeriatric care no. 893 – 486 881 3 132 21 – 2 416
Maintenance care no. 10 251 444 6 543 1 718 2 472 895 643 157 23 123
Newborn total no. 79 099 62 041 47 923 25 859 16 808 4 326 5 352 3 773 245 181
Newborn — unqualified
days only no. 42 041 48 272 36 662 19 945 12 474 2 875 4 051 2 908 169 228
Other admitted care no. na na na na na na na na na
Not reported no. na na na na na na na na na
Total (c) no. 1 813 562 1 558 038 1 123 735 615 829 428 252 116 908 101 019 126 755 5 884 098
Total (d) no. 1 771 521 1 509 766 1 087 073 595 884 415 778 114 033 96 968 123 847 5 714 870
Proportion of total separations
Newborn excluding
unqualified days
REPORT ON
GOVERNMENT
SERVICES 2017
PUBLIC
HOSPITALS
PAGE 4 of TABLE 12A.10

TABLE 12A.10
Table 12A.10
Unit NSW Vic (b) Qld WA SA Tas ACT NT Aust
Separations, by type of episode of care, public hospitals (including psychiatric), 2014-15 (a)
Acute care % 94.0 96.3 95.0 96.6 95.1 96.3 95.5 98.5 95.3
Rehabilitation care % 2.2 1.0 2.2 1.2 2.5 0.8 1.7 0.2 1.7
Palliative care % 0.7 0.5 0.7 0.3 0.5 0.5 0.6 0.3 0.6
Geriatric evaluation
and management % 0.4 1.2 0.4 0.5 0.3 0.2 0.2 0.1 0.6
Psychogeriatric care % 0.1 – – 0.1 – 0.1 – – –
Maintenance care % 0.6 – 0.6 0.3 0.6 0.8 0.7 0.1 0.4
% 2.1 0.9 1.0 1.0 1.0 1.3 1.3 0.7 1.3
Other admitted care % na na na na na na na na na
Not reported % na na na na na na na na na
Total (d) % 100.0 100.0 100.0 100.0 100.0 100.0 100.0 99.9 100.0
2014-15
Number of separations
Acute care no. 1 705 432 1 530 126 1 147 041 581 455 400 864 115 269 95 516 130 236 5 705 939
Rehabilitation care no. 38 950 17 855 25 052 6 381 11 245 1 061 1 955 316 102 815
Palliative care no. 13 429 7 387 8 379 1 792 1 989 669 639 310 34 594
Geriatric evaluation
and management no. 6 136 17 495 4 075 2 675 1 481 270 227 87 32 446
Psychogeriatric care no. 803 – 318 597 20 142 10 5 1 895
Maintenance care no. 11 666 788 6 757 1 911 2 338 1 047 807 158 25 472
Newborn total no. 79 225 62 956 48 437 26 215 16 755 4 649 5 626 3 992 247 855
Newborn — unqualified
days only no. 41 649 48 656 37 262 20 303 12 397 3 605 3 996 2 894 170 762
Other admitted care no. na na na na na na na na na
Not reported no. na na na na na na na na na
Newborn excluding
unqualified days
REPORT ON
GOVERNMENT
SERVICES 2017
PUBLIC
HOSPITALS
PAGE 5 of TABLE 12A.10

TABLE 12A.10
Table 12A.10
Unit NSW Vic (b) Qld WA SA Tas ACT NT Aust
Separations, by type of episode of care, public hospitals (including psychiatric), 2014-15 (a)
Total (c), (e) no. 1 855 647 1 636 607 1 240 060 621 026 434 692 123 111 104 780 135 177 6 151 100
Total (d), (e) no. 1 813 998 1 587 951 1 202 798 600 723 422 295 119 506 100 784 132 283 5 980 338
Proportion of total separations
Acute care % 94.0 96.4 95.4 96.8 94.9 96.5 94.8 98.5 95.4
Rehabilitation care % 2.1 1.1 2.1 1.1 2.7 0.9 1.9 0.2 1.7
Palliative care % 0.7 0.5 0.7 0.3 0.5 0.6 0.6 0.2 0.6
Geriatric evaluation
and management % 0.3 1.1 0.3 0.4 0.4 0.2 0.2 0.1 0.5
Psychogeriatric care % – – – 0.1 – 0.1 – – –
Maintenance care % 0.6 – 0.6 0.3 0.6 0.9 0.8 0.1 0.4
% 2.1 0.9 0.9 1.0 1.0 0.9 1.6 0.8 1.3
Other admitted care % na na na na na na na na na
Not reported % na na na na na na na na na
Total (d), (e) % 100.0 100.0 100.0 100.0 100.0 100.0 100.0 100.0 100.0
(a)
(b) There was a change in Victorian admission policy from 1 July 2012 that has impacted the separation time series.
(c)
(d)
(e)
Source : AIHW (various years), Australian Hospital Statistics , Health Services Series; AIHW (various years), Admitted patient care: Australian hospital statistics ,
Health services series.
Total separations exclude 'newborn unqualified days only', which are not normally included as admitted patient care.
– Nil or rounded to zero. na Not available.
Excludes records for hospital boarders or posthumous organ procurement.
Total separations include 'newborn unqualified days only', which are not normally included as admitted patient care.
Newborn excluding
unqualified days
Includes separations for which the care type was Other admitted or was not reported.
REPORT ON
GOVERNMENT
SERVICES 2017
PUBLIC
HOSPITALS
PAGE 6 of TABLE 12A.10

TABLE 12A.11
Table 12A.11
Unit NSW Vic (a) Qld WA SA Tas ACT NT (a), (b) Aust
Individual service events
Procedural clinics no. 2 000 491 1 066 804 784 419 215 423 318 537 51 198 28 100 28 668 4 493 640
Medical consultation clinics no. 4 275 965 2 304 971 1 389 455 906 415 935 419 212 202 221 279 151 265 10 396 971
Stand-alone diagnostic clinics no. 3 258 743 na 67 701 25 985 249 148 5 235 23 497 na 3 630 309
Allied health and/or clinical nurse specialist clinicsno. 8 041 891 2 368 659 1 892 169 1 196 169 640 039 212 273 678 413 99 562 15 129 175
Clinic type not reported no. 162 560 – – – – – – – 162 560
Total no. 17 739 650 5 740 434 4 133 744 2 343 992 2 143 143 480 908 951 289 279 495 33 812 655
Group service events
Procedural clinics no. 462 – 2 234 – 23 – – na 2 719
Medical consultation clinics no. 50 027 5 479 5 593 1 746 3 915 685 663 na 68 108
Stand-alone diagnostic clinics no. 202 n.a. – – 29 – – na 231
Allied health and/or clinical nurse specialist clinicsno. 599 156 165 881 132 347 35 677 41 446 5 543 27 306 na 1 007 356
Clinic type not reported no. 14 266 – – – – – – na 14 266
Total no. 664 113 171 360 140 174 37 423 45 413 6 228 27 969 na 1 092 680
Total service events
Procedural clinics no. 2 000 953 1 066 804 786 653 215 423 318 560 51 198 28 100 28 668 4 496 359
Medical consultation clinics no. 4 325 992 2 310 450 1 395 048 908 161 939 334 212 887 221 942 151 265 10 465 079
Stand-alone diagnostic clinics no. 3 258 945 na 67 701 25 985 249 177 5 235 23 497 na 3 630 540
Allied health and/or clinical nurse specialist clinicsno. 8 641 047 2 534 540 2 024 516 1 231 846 681 485 217 816 705 719 99 562 16 136 531
Clinic type not reported no. 176 826 – – – – – – – 176 826
Total no. 18 403 763 5 911 794 4 273 918 2 381 415 2 188 556 487 136 979 258 279 495 34 905 335
(a) Victoria and the NT did not report service events that occurred in Stand-alone diagnostic clinics, although they were provided.
(b)
Individual and group service events, by Tier 2 clinic classes, states and territories, 2014-15
The NT did not report group service events, although they were provided.
REPORT ON
GOVERNMENT
SERVICES 2017
PUBLIC
HOSPITALS
PAGE 1 of TABLE 12A.11

TABLE 12A.11
Table 12A.11
Unit NSW Vic (a) Qld WA SA Tas ACT NT (a), (b) Aust
Individual and group service events, by Tier 2 clinic classes, states and territories, 2014-15
na Not available. – Nil or rounded to zero.
Source : AIHW (2016), Non-admitted patient care 2014–15: Australian hospital statistics, Health services series no. 69. Cat. no. HSE 174.
REPORT ON
GOVERNMENT
SERVICES 2017
PUBLIC
HOSPITALS
PAGE 2 of TABLE 12A.11

TABLE 12A.12
Table 12A.12
Unit NSW Vic Qld WA SA Tas ACT NT Aust
no. 807 007 514 270 447 261 267 406 195 621 56 390 73 622 64 481 2 426 058
Public acute group A hospitals (b) no. 845 818 649 782 624 916 244 439 146 738 67 892 56 339 44 446 2 680 370
Public acute group B hospitals (c) no. 451 689 321 209 306 706 210 016 83 666 25 794 .. .. 1 399 080
Public acute group C hospitals (d) no. 360 826 84 885 – 81 960 43 343 – .. 33 317 604 331
Other hospitals no. 216 126 40 477 – – – – .. .. 256 603
Total no. 2 681 466 1 610 623 1 378 883 803 821 469 368 150 076 129 961 142 244 7 366 442
(a)
(b)
(c)
(d)
.. Not applicable. – Nil or rounded to zero.
Source :
Emergency department presentations, public hospital emergency departments, states and territories, 2014-15
AIHW (2016), Emergency department care 2014–15: Australian hospital statistics, Health services series no. 65. Cat. no. HSE 168. Canberra: AIHW.
Principal referral and women's and
children's hospitals (a)
Principal referral hospitals are public acute hospitals that provide a very broad range of services, have a range of highly specialised service units, and have very
large patient volumes. The term ‘referral’ recognises that these hospitals have specialist facilities not typically found in smaller hospitals.
Public acute group A hospitals are public acute hospitals that provide a wide range of services typically including a 24-hour emergency department, intensive care
unit, coronary care unit and oncology unit, but do not provide the breadth of services provided by Principal referral hospitals.
Public acute group B hospitals are those public acute hospitals that do not have the service profile of the Principal referral hospitals and Group A hospitals, but do
have a 24-hour emergency department; they typically provide elective surgery and have specialised service units such as obstetric, paediatric and psychiatric units.
Public acute group C hospitals include those public acute hospitals that provide a more limited range of services than Principal referral hospitals or Public acute
group A and B hospitals, but do have an obstetric unit, provide surgical services and/or some form of emergency facility (emergency department, or accident and
emergency service).
REPORT ON
GOVERNMENT
SERVICES 2017
PUBLIC
HOSPITALS
PAGE 1 of TABLE 12A.12

TABLE 12A.13
Table 12A.13
Unit NSW Vic Qld WA (b) SA (c) Tas ACT NT Aust
2006-07
Proportion of patients seen on time (d) (e)
1 – Resuscitation % 100 100 98 98 99 96 100 100 99
2 – Emergency % 87 82 67 71 72 72 77 56 78
3 – Urgent % 71 73 57 59 56 62 47 54 65
4 – Semi-urgent % 74 67 60 61 63 61 49 48 66
5 – Non-urgent % 89 88 87 87 87 87 81 87 88
Total % 76 74 61 64 63 64 54 55 70
Estimated proportion of presentations ending in admission (e) (f)
1 – Resuscitation % 81 92 71 67 71 82 73 70 79
2 – Emergency % 64 74 56 46 58 57 58 64 62
3 – Urgent % 43 53 31 33 40 38 42 43 42
4 – Semi-urgent % 18 22 10 11 13 13 14 14 16
5 – Non-urgent % 5 5 3 4 6 3 4 7 5
Total % 28 33 22 21 32 25 25 25 27
Proportion of presentations (e)
1 – Resuscitation % 1 1 1 1 1 1 1 1 1
2 – Emergency % 8 8 9 10 12 8 7 6 8
3 – Urgent % 32 29 37 29 36 34 33 29 32
4 – Semi-urgent % 45 48 46 51 47 50 48 52 47
5 – Non-urgent % 15 15 8 9 4 7 11 12 12
Total % 100 100 100 100 100 100 100 100 100
Data coverage
% 81 89 64 72 69 96 100 100 78
no. 71 38 21 16 8 3 2 5 164
2007-08
Proportion of patients seen on time (d) (e)
1 – Resuscitation % 100 100 98 99 100 99 100 100 100
2 – Emergency % 81 79 69 69 72 74 81 59 76
3 – Urgent % 69 71 56 56 54 54 52 47 63
4 – Semi-urgent % 75 65 61 59 60 58 51 47 66
5 – Non-urgent % 90 86 87 86 80 86 78 86 87
Total % 76 71 63 61 61 60 58 52 69
Estimated proportion of presentations ending in admission (e) (f)
1 – Resuscitation % 80 92 71 65 73 84 73 67 78
2 – Emergency % 61 75 55 45 60 58 60 64 61
Emergency department waiting times, by triage category, public
hospitals (a)
Estimated proportion of
presentations with
episode-level data (g)
Hospitals reporting
emergency department
episode-level data
REPORT ON
GOVERNMENT
SERVICES 2017
PUBLIC
HOSPITALS
PAGE 1 of TABLE 12A.13

TABLE 12A.13
Table 12A.13
Unit NSW Vic Qld WA (b) SA (c) Tas ACT NT Aust
Emergency department waiting times, by triage category, public
hospitals (a)
3 – Urgent % 40 53 32 33 42 38 42 42 41
4 – Semi-urgent % 16 21 10 11 14 13 13 13 16
5 – Non-urgent % 5 4 3 4 6 5 3 5 4
Total % 26 33 22 20 29 25 25 24 27
Proportion of presentations (e)
1 – Resuscitation % 1 1 1 1 1 1 1 1 1
2 – Emergency % 8 8 9 10 11 8 8 6 9
3 – Urgent % 31 30 37 29 35 35 32 30 32
4 – Semi-urgent % 45 47 44 52 46 50 45 53 46
5 – Non-urgent % 15 14 9 8 6 7 14 10 12
Total % 100 100 100 100 100 100 100 100 100
Data coverage
% 81 89 64 72 67 88 100 100 78
no. 71 38 22 16 8 3 2 5 165
2008-09
Proportion of patients seen on time (d) (e)
1 – Resuscitation % 100 100 99 99 100 99 100 100 100
2 – Emergency % 80 82 72 69 75 76 86 62 77
3 – Urgent % 68 74 59 53 59 54 53 48 64
4 – Semi-urgent % 73 68 65 62 62 61 53 49 67
5 – Non-urgent % 90 86 88 89 83 87 78 89 88
Total % 75 73 66 62 64 62 60 54 70
Estimated proportion of presentations ending in admission (e) (f)
1 – Resuscitation % 81 92 69 67 78 82 77 72 79
2 – Emergency % 62 74 53 48 58 58 63 61 61
3 – Urgent % 41 52 30 34 42 38 44 43 40
4 – Semi-urgent % 17 21 10 12 15 13 15 14 16
5 – Non-urgent % 5 4 3 4 5 5 3 4 5
Total % 26 33 22 22 30 25 27 25 27
Proportion of presentations (e)
1 – Resuscitation % 1 1 1 1 1 1 1 1 1
2 – Emergency % 8 9 10 11 12 7 9 7 9
3 – Urgent % 31 30 39 30 35 34 31 30 32
4 – Semi-urgent % 44 47 43 51 44 50 44 53 46
5 – Non-urgent % 16 13 8 8 8 8 15 10 12
Total % 100 100 100 100 100 100 100 100 100
Estimated proportion of
presentations with
episode-level data (g)
Hospitals reporting
emergency department
episode-level data
REPORT ON
GOVERNMENT
SERVICES 2017
PUBLIC
HOSPITALS
PAGE 2 of TABLE 12A.13

TABLE 12A.13
Table 12A.13
Unit NSW Vic Qld WA (b) SA (c) Tas ACT NT Aust
Emergency department waiting times, by triage category, public
hospitals (a)
Data coverage
% 83 88 72 72 67 89 100 100 80
no. 85 38 26 16 8 4 2 5 184
2009-10
Proportion of patients seen on time (d) (e)
1 – Resuscitation % 100 100 99 99 100 99 100 100 100
2 – Emergency % 82 80 77 71 78 71 83 63 78
3 – Urgent % 70 71 60 55 63 52 57 49 65
4 – Semi-urgent % 73 67 66 64 63 63 56 51 68
5 – Non-urgent % 89 85 89 92 85 88 77 91 88
Total % 75 72 66 64 67 63 62 56 70
Estimated proportion of presentations ending in admission (e) (f)
1 – Resuscitation % 81 90 69 68 78 79 72 72 78
2 – Emergency % 62 73 54 49 59 54 55 61 61
3 – Urgent % 41 51 32 35 41 32 38 44 40
4 – Semi-urgent % 17 21 10 11 16 10 13 14 16
5 – Non-urgent % 5 4 3 4 7 4 3 6 5
Total % 27 33 23 23 30 21 24 26 27
Proportion of presentations (e)
1 – Resuscitation % 1 1 1 1 1 1 0 1 1
2 – Emergency % 8 9 10 11 12 8 9 7 9
3 – Urgent % 30 31 40 31 36 35 31 28 33
4 – Semi-urgent % 45 47 42 50 44 46 46 53 45
5 – Non-urgent % 16 13 7 7 7 11 13 10 12
Total % 100 100 100 100 100 100 100 100 100
Data coverage
% 83 90 72 73 67 89 100 100 81
no. 84 39 26 16 8 4 2 5 184
2010-11
Proportion of patients seen on time (d) (e)
1 – Resuscitation % 100 100 100 99 100 100 100 100 100
2 – Emergency % 83 81 78 71 78 72 78 65 79
Estimated proportion of
presentations with
episode-level data (g)
Hospitals reporting
emergency department
episode-level data
Estimated proportion of
presentations with
episode-level data (g)
Hospitals reporting
emergency department
episode-level data
REPORT ON
GOVERNMENT
SERVICES 2017
PUBLIC
HOSPITALS
PAGE 3 of TABLE 12A.13

TABLE 12A.13
Table 12A.13
Unit NSW Vic Qld WA (b) SA (c) Tas ACT NT Aust
Emergency department waiting times, by triage category, public
hospitals (a)
3 – Urgent % 71 70 60 50 66 55 48 53 65
4 – Semi-urgent % 73 65 67 65 70 63 48 54 68
5 – Non-urgent % 88 86 90 92 88 83 75 90 88
Total % 76 71 67 63 71 62 55 58 70
Estimated proportion of presentations ending in admission (e) (f)
1 – Resuscitation % 81 87 67 72 76 77 75 76 77
2 – Emergency % 62 69 52 54 58 53 54 62 60
3 – Urgent % 41 49 32 38 40 32 37 46 40
4 – Semi-urgent % 18 21 10 13 16 11 14 15 16
5 – Non-urgent % 6 5 3 4 8 4 4 5 5
Total % 27 33 24 26 30 21 24 26 28
Proportion of presentations (e)
1 – Resuscitation % 1 1 1 1 1 0 0 1 1
2 – Emergency % 9 9 11 11 13 7 10 6 10
3 – Urgent % 30 32 41 32 37 35 31 26 33
4 – Semi-urgent % 45 47 41 49 42 48 46 56 45
5 – Non-urgent % 15 11 6 7 7 9 13 10 11
Total % 100 100 100 100 100 100 100 100 100
Data coverage
% 83 90 72 74 68 93 100 100 81
no. 86 39 26 16 8 4 2 5 186
2011-12
Proportion of patients seen on time (d) (e)
1 – Resuscitation % 100 100 100 99 100 100 100 100 100
2 – Emergency % 82 83 82 76 79 77 76 64 80
3 – Urgent % 71 72 63 52 70 64 50 49 66
4 – Semi-urgent % 74 67 69 67 77 71 47 49 70
5 – Non-urgent % 89 87 90 94 92 88 81 89 89
Total % 76 72 69 65 76 71 55 54 72
Estimated proportion of presentations ending in admission (e) (f)
1 – Resuscitation % 88 93 69 69 78 83 77 71 80
2 – Emergency % 64 75 50 53 59 51 56 58 61
3 – Urgent % 42 54 30 36 40 33 38 44 41
4 – Semi-urgent % 18 23 9 13 15 11 15 16 17
5 – Non-urgent % 6 6 3 4 6 4 3 5 5
Total % 29 36 23 25 29 21 26 26 29
Proportion of presentations (e)
Estimated proportion of
presentations with
episode-level data (g)
Hospitals reporting
emergency department
episode-level data
REPORT ON
GOVERNMENT
SERVICES 2017
PUBLIC
HOSPITALS
PAGE 4 of TABLE 12A.13

TABLE 12A.13
Table 12A.13
Unit NSW Vic Qld WA (b) SA (c) Tas ACT NT Aust
Emergency department waiting times, by triage category, public
hospitals (a)
1 – Resuscitation % 1 0 1 1 1 1 0 1 1
2 – Emergency % 9 9 11 11 12 8 11 7 10
3 – Urgent % 32 33 42 32 36 34 33 29 34
4 – Semi-urgent % 44 48 40 48 43 48 44 54 45
5 – Non-urgent % 14 10 6 7 7 10 11 9 10
Total % 100 100 100 100 100 100 100 100 100
Data coverage
% 88 91 72 78 80 92 100 100 84
no. 95 40 26 17 14 4 2 5 203
2012-13
Proportion of patients seen on time (d) (e)
1 – Resuscitation % 100 100 100 100 100 100 100 100 100
2 – Emergency % 83 84 84 81 75 83 74 66 82
3 – Urgent % 73 72 68 52 66 65 43 52 68
4 – Semi-urgent % 77 68 74 67 78 70 46 52 72
5 – Non-urgent % 92 87 92 93 92 90 79 89 91
Total % 78 73 74 66 75 71 51 57 73
Estimated proportion of presentations ending in admission (e) (f)
1 – Resuscitation % 80 74 72 69 79 80 81 72 76
2 – Emergency % 63 58 52 50 59 52 56 57 58
3 – Urgent % 42 41 32 35 41 33 36 44 38
4 – Semi-urgent % 18 17 10 13 15 11 16 16 15
5 – Non-urgent % 6 4 3 4 6 4 4 5 5
Total % 29 28 25 24 30 21 26 26 27
Proportion of presentations (e)
1 – Resuscitation % 1 0 1 1 1 1 0 1 1
2 – Emergency % 11 10 12 12 13 8 11 9 11
3 – Urgent % 32 34 42 33 36 35 34 28 35
4 – Semi-urgent % 44 47 40 47 42 48 45 53 44
5 – Non-urgent % 12 9 5 7 7 9 10 9 9
Total % 100 100 100 100 100 100 100 100 100
Data coverage
% 88 92 74 78 83 92 100 100 85
Estimated proportion of
presentations with
episode-level data (g)
Hospitals reporting
emergency department
episode-level data
Estimated proportion of
presentations with
episode-level data (g)
REPORT ON
GOVERNMENT
SERVICES 2017
PUBLIC
HOSPITALS
PAGE 5 of TABLE 12A.13

TABLE 12A.13
Table 12A.13
Unit NSW Vic Qld WA (b) SA (c) Tas ACT NT Aust
Emergency department waiting times, by triage category, public
hospitals (a)
no. 95 40 27 17 14 4 2 5 204
2013-14
Proportion of patients seen on time (d) (e)
1 – Resuscitation % 100 100 100 100 100 100 100 100 100
2 – Emergency % 83 84 80 86 74 85 83 61 82
3 – Urgent % 76 73 67 58 65 66 50 51 70
4 – Semi-urgent % 80 71 75 71 77 71 57 53 75
5 – Non-urgent % 94 88 92 94 92 90 86 89 92
Total % 81 75 73 70 73 72 61 57 75
Estimated proportion of presentations ending in admission (e) (f)
1 – Resuscitation % 79 74 78 68 80 77 80 74 77
2 – Emergency % 62 60 60 50 59 58 58 56 59
3 – Urgent % 41 43 39 35 40 37 39 43 40
4 – Semi-urgent % 16 19 13 12 15 13 17 16 16
5 – Non-urgent % 5 5 4 3 6 4 5 5 5
Total % 28 30 30 24 30 25 27 27 29
Proportion of presentations (e)
1 – Resuscitation % 1 0 1 1 1 1 0 1 1
2 – Emergency % 11 10 12 12 13 8 10 10 11
3 – Urgent % 32 35 42 34 37 35 34 29 35
4 – Semi-urgent % 44 45 40 46 42 47 42 51 44
5 – Non-urgent % 13 9 5 7 7 9 13 9 9
Total % 100 100 100 100 100 100 100 100 100
Data coverage
% 99 92 74 78 83 92 100 100 88
no. 180 40 27 17 14 4 2 5 289
2014-15
Proportion of patients seen on time (d) (e)
1 – Resuscitation % 100 100 99 100 100 100 100 100 100
2 – Emergency % 82 80 77 83 69 83 78 62 79
3 – Urgent % 76 73 64 57 57 64 48 54 68
4 – Semi-urgent % 81 73 74 69 69 67 53 59 74
5 – Non-urgent % 95 89 93 93 89 89 86 88 92
Total % 81 75 71 68 66 70 59 60 74
Estimated proportion of
presentations with
episode-level data (g)
Hospitals reporting
emergency department
episode-level data
Hospitals reporting
emergency department
episode-level data
REPORT ON
GOVERNMENT
SERVICES 2017
PUBLIC
HOSPITALS
PAGE 6 of TABLE 12A.13

TABLE 12A.13
Table 12A.13
Unit NSW Vic Qld WA (b) SA (c) Tas ACT NT Aust
Emergency department waiting times, by triage category, public
hospitals (a)
Estimated proportion of presentations ending in admission (e) (f)
1 – Resuscitation % 79 74 79 68 81 80 81 84 77
2 – Emergency % 61 61 62 53 60 58 60 60 60
3 – Urgent % 41 45 41 37 41 38 40 45 42
4 – Semi-urgent % 16 21 14 14 16 14 17 18 17
5 – Non-urgent % 5 6 4 4 7 5 4 6 5
Total % 29 33 32 26 31 25 27 30 30
Proportion of presentations (e)
1 – Resuscitation % 1 1 1 1 1 1 0 1 1
2 – Emergency % 12 10 13 12 14 8 9 12 12
3 – Urgent % 32 36 43 34 37 35 34 29 36
4 – Semi-urgent % 43 45 38 46 41 47 42 50 43
5 – Non-urgent % 12 9 5 7 7 10 15 9 9
Total % 100 100 100 100 100 100 100 100 100
Data coverage
% na na na na na na na na na
no. na na na na na na na na na
2015-16
Proportion of patients seen on time (d) (e)
1 – Resuscitation % 100 100 100 100 100 100 na 100 100
2 – Emergency % 82 78 74 77 70 80 na 63 77
3 – Urgent % 76 71 61 53 56 59 na 53 67
4 – Semi-urgent % 80 72 74 67 70 64 na 60 74
5 – Non-urgent % 94 89 94 93 92 87 na 89 93
Total % 81 74 70 65 66 66 na 61 74
Estimated proportion of presentations ending in admission (e) (f)
1 – Resuscitation % 70 74 79 69 83 81 na 87 75
2 – Emergency % 53 63 63 53 61 58 na 64 58
3 – Urgent % 36 47 42 37 41 38 na 48 40
4 – Semi-urgent % 14 22 15 14 17 15 na 19 16
5 – Non-urgent % 4 6 5 4 8 5 na 9 5
Total % 25 34 34 27 33 27 na 34 30
Proportion of presentations (e)
1 – Resuscitation % 1 1 1 1 1 1 na 1 1
2 – Emergency % 12 11 14 13 14 9 na 13 12
3 – Urgent % 33 36 44 35 39 35 na 31 37
Estimated proportion of
presentations with
episode-level data (g)
Hospitals reporting
emergency department
episode-level data
REPORT ON
GOVERNMENT
SERVICES 2017
PUBLIC
HOSPITALS
PAGE 7 of TABLE 12A.13

TABLE 12A.13
Table 12A.13
Unit NSW Vic Qld WA (b) SA (c) Tas ACT NT Aust
Emergency department waiting times, by triage category, public
hospitals (a)
4 – Semi-urgent % 43 44 36 45 39 45 na 47 42
5 – Non-urgent % 11 9 4 7 6 9 na 9 8
Total % 100 100 100 100 100 100 na 100 100
Data coverage
% na na na na na na na na na
no. na na na na na na na na na
(a)
(b)
(c)
(d)
(e)
(f)
(g)
Source :
The proportion of occasions of service for which the emergency department departure status was
reported as 'admitted to this hospital'.
The proportion of occasions of service for which the waiting time to service delivery was within the time
specified in the definition of the triage category. For the triage category Resuscitation, an occasion of
service was classified as 'seen on time' if the waiting time to service was reported as less than or equal
to 2 minutes.
Values are derived from all hospitals that reported to the non-admitted patient emergency department
care database.
Estimated proportion of
presentations with
episode-level data (g)
Hospitals reporting
emergency department
episode-level data
For more information on data quality, including collection methodologies and data limitations, see
METeOR on the AIHW website.
For 2014-15, waiting times information could not be calculated for one Public acute group B hospital in
SA, that reported about 40 000 emergency department presentations.
For 2014-15, waiting times information could not be calculated for 8 months of data (about 27 000
emergency department presentations) for a Public acute group B hospital in WA. For 2015–16, waiting
times information could not be calculated for about 43 000 emergency department presentations for a
Public acute group B hospital in WA.
Data coverage is estimated as the number of occasions of service with waiting times data divided by the
number of emergency department occasions of service. This can underestimate coverage because
some occasions of service are for other than emergency presentations. For some jurisdictions, the
number of emergency department occasions of service reported to the Non-admitted Patient Emergency
Department Care Database exceeded the number of accident and emergency occasions of service
reported to the National Public Hospital Establishments Database. For these jurisdictions the coverage
has been estimated as 100 per cent.
AIHW (various years), Australian hospital statistics, Health Services Series; AIHW (various
years), Emergency department care: Australian hospital statistics . Health services series.
na Not available.
REPORT ON
GOVERNMENT
SERVICES 2017
PUBLIC
HOSPITALS
PAGE 8 of TABLE 12A.13

TABLE 12A.14
Table 12A.14
NSW Vic Qld WA (d) SA (e) Tas ACT (f) NT AustAust (total
number)
2013-14
Principal referral and Women's and children's hospitals
Triage category 1 100 100 100 100 100 100 99 100 100 24 045
Triage category 2 81 84 79 83 69 87 80 55 79 298 351
Triage category 3 73 72 67 62 63 56 42 30 68 844 244
Triage category 4 77 69 76 71 80 64 49 35 72 891 924
Triage category 5 93 88 95 95 93 87 81 66 91 139 951
Total (g) 77 74 74 71 72 67 54 38 73 2 198 515
Total number (g), (h) 730 215 476 059 413 291 216 475 186 207 51 019 66 282 59 084 2 198 632
Public acute group A hospitals
Triage category 1 100 100 100 100 100 100 100 100 100 16 397
Triage category 2 86 85 81 87 77 85 89 72 84 315 055
Triage category 3 77 73 69 42 57 71 60 67 69 952 477
Triage category 4 80 73 75 60 61 73 67 63 73 1 035 951
Triage category 5 93 90 91 90 86 93 91 91 91 175 970
Total (g) 81 76 74 59 64 74 69 67 74 2 495 850
Total number (g), (h) 764 324 606 438 584 642 245 773 138 354 63 510 52 854 40 045 2 495 940
Public acute group B hospitals
Triage category 1 100 100 100 99 100 np – – 100 4 085
Triage category 2 85 84 80 86 89 79 – – 83 116 333
Triage category 3 77 72 62 70 86 75 – – 71 409 001
Patients treated within national benchmarks for emergency department waiting time, by hospital peer
group, by State and Territory (a), (b), (c)
REPORT ON
GOVERNMENT
SERVICES 2017
PUBLIC
HOSPITALS
PAGE 1 of TABLE 12A.14

TABLE 12A.14
Table 12A.14
NSW Vic Qld WA (d) SA (e) Tas ACT (f) NT AustAust (total
number)
Patients treated within national benchmarks for emergency department waiting time, by hospital peer
group, by State and Territory (a), (b), (c)
Triage category 4 80 70 71 81 88 79 – – 76 569 559
Triage category 5 94 89 91 96 99 95 – – 93 116 561
Total (g) 81 73 70 79 89 79 – – 77 1 215 539
Total number (g), (h) 398 076 271 845 288 611 191 213 40 792 25 054 – – 1 215 591
Other hospitals
Triage category 1 100 100 – 100 100 – – np 100 1 683
Triage category 2 80 88 – 94 98 – – 74 83 44 714
Triage category 3 81 83 – 89 94 – – 76 83 174 035
Triage category 4 85 72 – 84 96 – – 74 83 336 691
Triage category 5 96 85 – 95 99 – – 94 94 141 021
Total (g) 86 78 – 88 96 – – 79 85 698 144
Total number (g), (h) 449 435 119 247 – 59 030 40 501 – – 30 356 698 569
All hospitals
Triage category 1 100 100 100 100 100 100 100 100 100 46 210
Triage category 2 83 84 80 86 74 85 83 61 82 774 453
Triage category 3 76 73 67 58 65 66 50 51 70 2 379 757
Triage category 4 80 71 75 71 77 71 57 53 75 2 834 125
Triage category 5 94 88 92 94 92 90 86 89 92 573 503
Total (g) 81 75 73 70 73 72 61 57 75 6 608 048
Total number (g), (h) 2 342 050 1 473 589 1 286 544 712 491 405 854 139 583 119 136 129 485 6 608 732
REPORT ON
GOVERNMENT
SERVICES 2017
PUBLIC
HOSPITALS
PAGE 2 of TABLE 12A.14

TABLE 12A.14
Table 12A.14
NSW Vic Qld WA (d) SA (e) Tas ACT (f) NT AustAust (total
number)
Patients treated within national benchmarks for emergency department waiting time, by hospital peer
group, by State and Territory (a), (b), (c)
2014-15
Principal referral and Women's and children's hospitals
Triage category 1 100 100 99 100 100 100 100 100 100 25 294
Triage category 2 77 78 75 81 66 84 77 56 75 321 562
Triage category 3 70 73 66 59 54 51 39 37 65 891 688
Triage category 4 76 72 77 68 65 58 43 50 71 922 657
Triage category 5 92 89 95 94 90 86 80 79 90 146 965
Total (g) 75 74 73 68 62 62 51 49 71 2 308 166
Total number (g), (h) 755 637 489 503 432 418 259 596 189 097 53 274 69 512 59 162 2 308 199
Public acute group A hospitals
Triage category 1 100 100 99 100 100 100 100 100 100 17 170
Triage category 2 84 80 79 85 69 84 81 74 81 333 726
Triage category 3 76 72 65 41 49 72 59 67 67 990 809
Triage category 4 81 74 73 59 54 72 66 57 73 1 038 293
Triage category 5 94 92 91 88 80 91 92 88 92 175 283
Total (g) 81 75 71 57 57 74 69 64 73 2 555 281
Total number (g), (h) 796 207 630 293 600 708 233 405 137 424 63 535 53 478 40 316 2 555 366
Public acute group B hospitals
Triage category 1 100 100 98 99 100 np – – 99 4 240
Triage category 2 85 81 77 85 83 78 – – 82 124 084
Triage category 3 77 71 59 67 86 69 – – 69 416 261
REPORT ON
GOVERNMENT
SERVICES 2017
PUBLIC
HOSPITALS
PAGE 3 of TABLE 12A.14

TABLE 12A.14
Table 12A.14
NSW Vic Qld WA (d) SA (e) Tas ACT (f) NT AustAust (total
number)
Patients treated within national benchmarks for emergency department waiting time, by hospital peer
group, by State and Territory (a), (b), (c)
Triage category 4 81 70 73 76 88 72 – – 76 552 823
Triage category 5 94 88 93 94 98 95 – – 93 105 682
Total (g) 82 73 69 75 89 73 – – 76 1 203 090
Total number (g), (h) 405 088 276 158 286 674 171 628 39 543 24 079 – – 1 203 170
Other hospitals
Triage category 1 100 100 – 99 100 – – np 100 1 849
Triage category 2 87 89 – 80 97 – – 67 86 50 157
Triage category 3 85 84 – 87 93 – – 74 85 187 897
Triage category 4 87 76 – 86 95 – – 76 85 350 792
Triage category 5 97 87 – 96 98 – – 92 95 134 997
Total (g) 88 81 – 87 95 – – 78 87 725 692
Total number (g), (h) 457 739 119 086 – 78 055 42 580 – – 28 703 726 163
All hospitals
Triage category 1 100 100 99 100 100 100 100 100 100 48 553
Triage category 2 82 80 77 83 69 83 78 62 79 829 529
Triage category 3 76 73 64 57 57 64 48 54 68 2 486 655
Triage category 4 81 73 74 69 69 67 53 59 74 2 864 565
Triage category 5 95 89 93 93 89 89 86 88 92 562 927
Total (g) 81 75 71 68 66 70 59 60 74 6 792 229
Total number (g), (h) 2 414 671 1 515 040 1 319 800 742 684 408 644 140 888 122 990 128 181 6 792 898
REPORT ON
GOVERNMENT
SERVICES 2017
PUBLIC
HOSPITALS
PAGE 4 of TABLE 12A.14

TABLE 12A.14
Table 12A.14
NSW Vic Qld WA (d) SA (e) Tas ACT (f) NT AustAust (total
number)
Patients treated within national benchmarks for emergency department waiting time, by hospital peer
group, by State and Territory (a), (b), (c)
2015-16
Principal referral and Women's and children's hospitals
Triage category 1 100 100 100 100 100 100 na 100 100 27 577
Triage category 2 76 76 72 77 67 77 na 57 74 340 278
Triage category 3 71 70 61 52 54 42 na 36 64 928 518
Triage category 4 75 70 77 65 66 52 na 52 71 923 017
Triage category 5 91 88 96 93 92 84 na 81 90 146 898
Total (g) 75 72 71 65 63 55 na 49 70 2 366 288
Total number (g), (h) 777 635 507 210 453 141 310 551 197 567 56 220 na 63 995 2 366 319
Public acute group A hospitals
Triage category 1 100 100 100 100 100 100 na 100 100 18 096
Triage category 2 84 79 75 75 73 82 na 78 79 360 045
Triage category 3 76 72 62 39 51 71 na 67 66 1 040 378
Triage category 4 80 75 72 58 59 70 na 59 73 1 017 742
Triage category 5 94 92 92 89 86 91 na 89 92 164 896
Total (g) 81 76 69 54 61 73 na 66 73 2 601 157
Total number (g), (h) 827 303 660 158 630 032 236 591 141 750 63 983 na 41 384 2 601 201
Public acute group B hospitals
Triage category 1 100 100 99 100 100 n.p na – 100 4 606
Triage category 2 84 77 76 80 69 80 na – 79 135 393
Triage category 3 77 68 60 67 58 68 na – 68 434 150
REPORT ON
GOVERNMENT
SERVICES 2017
PUBLIC
HOSPITALS
PAGE 5 of TABLE 12A.14

TABLE 12A.14
Table 12A.14
NSW Vic Qld WA (d) SA (e) Tas ACT (f) NT AustAust (total
number)
Patients treated within national benchmarks for emergency department waiting time, by hospital peer
group, by State and Territory (a), (b), (c)
Triage category 4 81 68 73 74 75 73 na – 75 561 213
Triage category 5 94 87 94 92 97 94 na – 93 97 448
Total (g) 82 71 69 74 70 73 na – 74 1 232 810
Total number (g), (h) 414 332 293 232 294 880 129 334 76 759 24 316 na – 1 232 853
Other hospitals
Triage category 1 100 100 – 100 100 – na 100 100 2 025
Triage category 2 87 89 – 81 96 – na 65 86 53 020
Triage category 3 85 85 – 86 94 – na 74 85 196 834
Triage category 4 88 78 – 85 94 – na 77 86 358 499
Triage category 5 97 90 – 97 98 – na 92 95 130 604
Total (g) 89 83 – 87 95 – na 78 87 740 982
Total number (g), (h) 467 932 121 920 – 78 843 43 052 – na 29 748 741 495
All hospitals
Triage category 1 100 100 100 100 100 100 na 100 100 52 304
Triage category 2 82 78 74 77 70 80 na 63 77 888 736
Triage category 3 76 71 61 53 56 59 na 53 67 2 599 880
Triage category 4 80 72 74 67 70 64 na 60 74 2 860 471
Triage category 5 94 89 94 93 92 87 na 89 93 539 846
Total (g) 81 74 70 65 66 66 na 61 74 6 941 237
Total number (g), (h) 2 487 202 1 582 520 1 378 053 755 319 459 128 144 519 na 135 127 6 941 868
REPORT ON
GOVERNMENT
SERVICES 2017
PUBLIC
HOSPITALS
PAGE 6 of TABLE 12A.14

TABLE 12A.14
Table 12A.14
NSW Vic Qld WA (d) SA (e) Tas ACT (f) NT AustAust (total
number)
Patients treated within national benchmarks for emergency department waiting time, by hospital peer
group, by State and Territory (a), (b), (c)
(a)
(b)
(c)
(d)
(e)
(f)
(g)
(h)
Source :
na Not available. – Nil or rounded to zero. np Not published.
AIHW (unpublished) National Non-admitted Patient Emergency Department Care Database.
The totals exclude records for which the waiting time to service could not be calculated, and records for which the episode end status was either 'Did not
wait to be attended by a health care professional' or 'Dead on arrival, not treated in emergency department'.
The totals include records for which the triage category was not assigned or not reported.
For 2014-15, waiting times information could not be calculated for 8 months of data (about 27 000 emergency department presentations) for a Public
acute group B hospital in WA. For 2015–16, waiting times information could not be calculated for about 43 000 emergency department presentations for a
Public acute group B hospital in WA.
For 2014-15, waiting times information could not be calculated for one Public acute group B hospital in SA, that reported about 40 000 emergency
department presentations.
For more information on data quality, including collection methodologies and data limitations, see METeOR on the AIHW website.
Data for the ACT were not available at the time of data supply and have not been included in the totals for 2015-16.
The proportion of presentations for which the waiting time to commencement of clinical care was within the time specified in the definition of the triage
category. Records were excluded from the calculation of waiting time statistics if the triage category was unknown, if the patient did not wait or was dead
on arrival, or if the waiting time could not be calculated due to missing or invalid time fields.
It should be noted that the data presented here are not necessarily representative of the hospitals not included in the NNAPEDCD.
REPORT ON
GOVERNMENT
SERVICES 2017
PUBLIC
HOSPITALS
PAGE 7 of TABLE 12A.14

TABLE 12A.15
Table 12A.15
NSW Vic Qld WA (e) SA (f) Tas ACT (g) NT AustAust (total
number)
2013-14
All hospitals
Aboriginal and Torres Strait Islander Australians
Triage category 1 % 100 100 100 100 100 np np 100 100 2 572
Triage category 2 % 83 85 83 86 76 85 81 64 80 35 268
Triage category 3 % 76 74 72 71 70 62 48 58 71 119 095
Triage category 4 % 80 72 75 79 82 72 52 58 74 157 452
Triage category 5 % 94 89 92 96 94 90 82 88 93 34 463
Total (h) % 81 76 76 79 79 71 57 61 76 348 850
Total number (h), (i) no. 114 632 22 585 77 236 53 284 17 072 6 329 3 205 54 533 348 876
Other Australians
Triage category 1 % 100 100 100 100 100 100 100 100 100 43 638
Triage category 2 % 83 84 80 86 74 85 83 59 82 739 185
Triage category 3 % 76 73 67 57 65 66 50 45 70 2260 662
Triage category 4 % 80 71 75 70 77 71 57 50 75 2676 673
Triage category 5 % 94 88 93 94 92 90 86 89 92 539 040
Total (h) % 81 75 73 70 73 72 61 53 75 6 259 198
Total number (h), (i) no. 2 227 418 1 451 004 1 209 308 659 207 388 782 133 254 115 931 74 952 6 259 856
2014-15
All hospitals
Aboriginal and Torres Strait Islander Australians
Patients treated within national benchmarks for emergency department waiting time, by Indigenous
status, by State and Territory (a), (b), (c), (d)
REPORT ON
GOVERNMENT
SERVICES 2017
PUBLIC
HOSPITALS
PAGE 1 of TABLE 12A.15

TABLE 12A.15
Table 12A.15
NSW Vic Qld WA (e) SA (f) Tas ACT (g) NT AustAust (total
number)
Patients treated within national benchmarks for emergency department waiting time, by Indigenous
status, by State and Territory (a), (b), (c), (d)
Triage category 1 % 100 100 100 99 100 np np 100 100 2 672
Triage category 2 % 82 79 80 87 68 85 79 63 78 40 239
Triage category 3 % 75 72 68 73 63 62 48 60 70 128 936
Triage category 4 % 81 73 75 79 76 68 49 60 75 167 052
Triage category 5 % 94 90 92 95 93 90 83 85 92 36 424
Total (h) % 81 74 74 79 73 70 56 62 75 375 323
Total number (h), (i) no. 127 391 24 367 81 895 57 947 17 922 6 522 3 489 55 834 375 367
Other Australians
Triage category 1 % 100 100 99 100 100 100 100 100 100 45 881
Triage category 2 % 82 80 77 83 69 83 78 61 79 789 290
Triage category 3 % 76 73 64 56 57 64 48 49 68 2 357 719
Triage category 4 % 81 73 74 68 69 67 53 58 74 2 697 513
Triage category 5 % 95 89 93 93 89 89 86 90 92 526 503
Total (h) % 81 75 71 68 66 70 59 58 74 6 416 906
Total number (h), (i) no. 2 287 280 1 490 673 1 237 905 684 737 390 722 134 366 119 501 72 347 6 417 531
2015-16
All hospitals
Aboriginal and Torres Strait Islander Australians
Triage category 1 % 100 100 100 100 100 np na 100 100 3 098
Triage category 2 % 82 77 77 80 71 78 na 65 77 47 221
Triage category 3 % 75 68 67 68 61 60 na 59 68 146 166
REPORT ON
GOVERNMENT
SERVICES 2017
PUBLIC
HOSPITALS
PAGE 2 of TABLE 12A.15

TABLE 12A.15
Table 12A.15
NSW Vic Qld WA (e) SA (f) Tas ACT (g) NT AustAust (total
number)
Patients treated within national benchmarks for emergency department waiting time, by Indigenous
status, by State and Territory (a), (b), (c), (d)
Triage category 4 % 81 71 76 76 77 64 na 61 75 179 350
Triage category 5 % 94 91 94 95 93 89 na 87 93 40 203
Total (h) % 81 73 73 76 73 66 na 63 75 416 038
Total number (h), (i) no. 148 324 27 206 92 026 61 563 20 585 7 071 na 59 319 416 094
Other Australians
Triage category 1 % 100 100 100 100 100 100 na 100 100 49 206
Triage category 2 % 82 78 74 77 70 80 na 62 78 841 515
Triage category 3 % 76 71 61 51 56 59 na 49 67 2453 714
Triage category 4 % 80 73 74 66 70 64 na 59 74 2681 121
Triage category 5 % 94 89 94 93 92 87 na 90 92 499 643
Total (h) % 81 74 69 64 66 66 na 59 74 6 525 199
Total number (h), (i) no. 2 338 878 1 555 314 1 286 027 693 756 438 543 137 448 na 75 808 6 525 774
(a)
(b)
(c)
(d)
The quality of the identification of Aboriginal and Torres Strait Islander patients in National Non-admitted Patient Emergency Department Care Database
has not been assessed. Identification of Aboriginal and Torres Strait Islander patients is not considered to be complete, and completeness may vary
among the states and territories.
The proportion of presentations for which the waiting time to commencement of clinical care was within the time specified in the definition of the triage
category. Records were excluded from the calculation of waiting time statistics if the triage category was unknown, if the patient did not wait or was
dead on arrival, or if the waiting time could not be calculated due to missing or invalid time fields.
It should be noted that the data presented here are not necessarily representative of the hospitals not included in the NNAPEDCD.
For more information on data quality, including collection methodologies and data limitations, see METeOR on the AIHW website.
REPORT ON
GOVERNMENT
SERVICES 2017
PUBLIC
HOSPITALS
PAGE 3 of TABLE 12A.15

TABLE 12A.15
Table 12A.15
NSW Vic Qld WA (e) SA (f) Tas ACT (g) NT AustAust (total
number)
Patients treated within national benchmarks for emergency department waiting time, by Indigenous
status, by State and Territory (a), (b), (c), (d)
(e)
(f)
(g)
(h)
(i)
Source : AIHW (unpublished) National Non-admitted Patient Emergency Department Care Database.
Data for the ACT were not available at the time of data supply and have not been included in the totals for 2015-16.
na Not available. np Not published.
The totals exclude records for which the waiting time to service could not be calculated, and records for which the episode end status was either 'Did
not wait to be attended by a health care professional' or 'Dead on arrival, not treated in emergency department'.
The totals include records for which the triage category was not assigned or not reported.
For 2014-15, waiting times information could not be calculated for 8 months of data (about 27 000 emergency department presentations) for a Public
acute group B hospital in WA. For 2015–16, waiting times information could not be calculated for about 43 000 emergency department presentations for
a Public acute group B hospital in WA.
For 2014-15, waiting times information could not be calculated for one Public acute group B hospital in SA, that reported about 40 000 emergency
department presentations.
REPORT ON
GOVERNMENT
SERVICES 2017
PUBLIC
HOSPITALS
PAGE 4 of TABLE 12A.15

TABLE 12A.16
Table 12A.16
NSW Vic Qld WA (f) SA (g) Tas ACT (h) NT AustAust (total
number)
2013-14
All hospitals
Major cities
Triage category 1 % 100 100 100 100 100 np 99 np 100 30 848
Triage category 2 % 83 85 77 85 72 86 83 61 82 534 475
Triage category 3 % 75 73 62 52 61 65 50 49 67 1 573 492
Triage category 4 % 79 71 72 67 73 72 57 52 73 1 735 729
Triage category 5 % 94 87 93 93 89 92 86 91 91 305 912
Total (i) % 79 75 70 66 70 74 61 57 74 4 180 456
Total number (i), (j) no. 1 461 571 1 018 644 768 835 504 131 310 762 2 346 110 524 3 876 4 180 689
Inner regional
Triage category 1 % 100 100 100 100 100 100 np np 100 8 144
Triage category 2 % 85 84 84 91 74 85 85 66 85 144 752
Triage category 3 % 78 72 76 68 65 61 51 45 74 487 243
Triage category 4 % 81 71 77 77 82 67 59 54 76 647 381
Triage category 5 % 94 90 93 94 94 89 89 89 92 141 780
Total (i) % 82 75 78 77 75 69 63 57 78 1 429 300
Total number (i), (j) no. 580 724 357 851 316 409 56 551 22 292 87 465 6 459 1 860 1 429 611
Outer regional
Triage category 1 % 100 100 100 99 100 100 np 100 100 4 563
Triage category 2 % 81 86 85 84 87 84 82 54 80 68 036
Patients treated within national benchmarks for emergency department waiting time, by remoteness, by
State and Territory (a), (b), (c), (d), (e)
REPORT ON
GOVERNMENT
SERVICES 2017
PUBLIC
HOSPITALS
PAGE 1 of TABLE 12A.16

TABLE 12A.16
Table 12A.16
NSW Vic Qld WA (f) SA (g) Tas ACT (h) NT AustAust (total
number)
Patients treated within national benchmarks for emergency department waiting time, by remoteness, by
State and Territory (a), (b), (c), (d), (e)
Triage category 3 % 79 79 75 76 85 74 53 32 74 223 594
Triage category 4 % 84 77 79 84 90 78 57 37 78 297 955
Triage category 5 % 95 93 94 96 98 93 82 73 94 74 659
Total (i) % 84 80 79 83 89 78 62 40 79 668 807
Total number (i), (j) no. 212 232 85 131 145 924 73 923 54 554 47 794 1 509 47 827 668 894
Remote
Triage category 1 % np np 99 100 np np – 100 100 653
Triage category 2 % 86 87 90 92 79 87 np 69 82 9 240
Triage category 3 % 82 77 82 84 87 76 np 65 77 36 381
Triage category 4 % 86 76 76 83 94 78 np 63 77 63 832
Triage category 5 % 97 88 90 95 99 np np 90 94 16 564
Total (i) % 86 79 80 87 92 79 np 66 80 126 670
Total number (i), (j) no. 7 312 1 520 20 158 50 578 8 315 1 285 45 37 459 126 672
Very remote
Triage category 1 % np np 100 np np np – 100 100 433
Triage category 2 % 84 np 91 85 66 np – 69 77 5 627
Triage category 3 % 79 np 82 77 69 66 np 64 72 20 293
Triage category 4 % 80 79 76 83 87 np np 65 71 30 735
Triage category 5 % 93 np 89 96 98 np np 92 92 8 594
Total (i) % 82 82 81 83 80 75 np 69 75 65 682
Total number (i), (j) no. 1 591 260 15 714 9 884 1 125 233 11 36 865 65 683
REPORT ON
GOVERNMENT
SERVICES 2017
PUBLIC
HOSPITALS
PAGE 2 of TABLE 12A.16

TABLE 12A.16
Table 12A.16
NSW Vic Qld WA (f) SA (g) Tas ACT (h) NT AustAust (total
number)
Patients treated within national benchmarks for emergency department waiting time, by remoteness, by
State and Territory (a), (b), (c), (d), (e)
2014-15
All hospitals
Major cities
Triage category 1 % 100 100 99 100 100 np 100 np 100 32 419
Triage category 2 % 80 79 74 82 67 87 78 62 78 572 742
Triage category 3 % 74 72 59 51 53 64 48 50 65 1 643 728
Triage category 4 % 79 72 72 64 62 68 53 57 72 1 752 110
Triage category 5 % 94 88 93 92 85 88 86 88 91 300 250
Total (i) % 79 75 67 64 61 72 59 59 72 4 301 394
Total number (i), (j) no. 1 506 584 1 054 879 796 547 515 539 308 504 2 288 113 665 3 388 4 301 394
Inner regional
Triage category 1 % 100 100 99 100 100 100 np np 100 8 624
Triage category 2 % 85 81 84 84 70 82 80 56 83 153 748
Triage category 3 % 78 71 74 67 58 58 49 49 73 510 389
Triage category 4 % 81 73 76 77 74 62 54 59 76 658 468
Triage category 5 % 94 92 94 95 90 87 89 92 93 139 787
Total (i) % 83 75 77 76 68 66 60 60 78 1 471 238
Total number (i), (j) no. 598 045 362 117 317 391 73 989 22 790 88 423 6 764 1 719 1 471 238
Outer regional
Triage category 1 % 100 100 100 99 100 100 np 100 100 4 740
REPORT ON
GOVERNMENT
SERVICES 2017
PUBLIC
HOSPITALS
PAGE 3 of TABLE 12A.16

TABLE 12A.16
Table 12A.16
NSW Vic Qld WA (f) SA (g) Tas ACT (h) NT AustAust (total
number)
Patients treated within national benchmarks for emergency department waiting time, by remoteness, by
State and Territory (a), (b), (c), (d), (e)
Triage category 2 % 86 87 82 84 83 84 84 56 81 72 180
Triage category 3 % 81 79 71 76 84 73 50 38 74 235 949
Triage category 4 % 85 77 77 81 89 75 56 51 79 304 075
Triage category 5 % 96 92 92 95 97 92 90 82 95 74 389
Total (i) % 86 80 76 80 88 76 63 50 80 691 406
Total number (i), (j) no. 219 785 85 117 152 175 73 738 64 089 48 155 1 549 46 798 691 406
Remote
Triage category 1 % np np 100 99 np np – 100 100 710
Triage category 2 % 88 90 91 91 80 81 np 71 83 10 870
Triage category 3 % 82 81 82 85 84 75 np 65 78 36 724
Triage category 4 % 89 78 79 84 93 77 np 62 78 63 888
Triage category 5 % 97 93 92 95 99 np np 92 95 16 698
Total (i) % 88 82 82 87 91 78 np 66 80 128 915
Total number (i), (j) no. 11 207 1 414 18 377 50 667 9 031 1 300 52 36 867 128 915
Very remote
Triage category 1 % np – 100 np np – – 100 100 486
Triage category 2 % 84 np 90 88 64 np – 66 75 6 733
Triage category 3 % 82 np 81 80 66 70 np 64 71 20 966
Triage category 4 % 85 67 79 84 82 71 np 65 72 31 220
Triage category 5 % 96 np 92 96 97 np np 88 91 7 683
Total (i) % 86 75 82 85 77 73 np 68 74 67 088
REPORT ON
GOVERNMENT
SERVICES 2017
PUBLIC
HOSPITALS
PAGE 4 of TABLE 12A.16

TABLE 12A.16
Table 12A.16
NSW Vic Qld WA (f) SA (g) Tas ACT (h) NT AustAust (total
number)
Patients treated within national benchmarks for emergency department waiting time, by remoteness, by
State and Territory (a), (b), (c), (d), (e)
Total number (i), (j) no. 2 076 243 14 935 10 205 1 348 274 17 37 990 67 088
2015-16
All hospitals
Major cities
Triage category 1 % 100 100 100 100 100 n.p na np 100 35 079
Triage category 2 % 80 78 70 76 69 87 na 65 76 608 522
Triage category 3 % 75 72 56 46 52 57 na 50 65 1 712 424
Triage category 4 % 79 73 72 62 64 65 na 60 73 1 747 310
Triage category 5 % 94 88 93 92 90 87 na 92 91 282 671
Total (i) % 79 74 65 60 62 68 na 61 71 4 386 119
Total number (i), (j) no. 1 553 533 1 105 242 842 787 524 838 353 668 2 437 na 3 614 4 386 119
Inner regional
Triage category 1 % 100 100 100 100 100 100 na np 100 9 211
Triage category 2 % 85 78 82 81 70 78 na 67 82 169 547
Triage category 3 % 77 68 71 63 57 54 na 54 71 539 094
Triage category 4 % 81 71 76 75 73 60 na 59 76 651 686
Triage category 5 % 94 92 94 95 93 86 na 92 93 139 649
Total (i) % 82 73 76 73 67 63 na 62 76 1 509 392
Total number (i), (j) no. 620 479 374 180 321 227 76 266 25 803 89 585 na 1 852 1 509 392
Outer regional
REPORT ON
GOVERNMENT
SERVICES 2017
PUBLIC
HOSPITALS
PAGE 5 of TABLE 12A.16

TABLE 12A.16
Table 12A.16
NSW Vic Qld WA (f) SA (g) Tas ACT (h) NT AustAust (total
number)
Patients treated within national benchmarks for emergency department waiting time, by remoteness, by
State and Territory (a), (b), (c), (d), (e)
Triage category 1 % 100 100 100 99 100 99 na 100 100 4 986
Triage category 2 % 86 86 80 77 82 81 na 58 80 78 144
Triage category 3 % 81 78 72 70 84 68 na 37 73 249 052
Triage category 4 % 86 77 78 76 89 71 na 53 79 314 978
Triage category 5 % 95 93 95 92 97 90 na 85 94 73 442
Total (i) % 86 80 76 75 88 72 na 50 79 720 696
Total number (i), (j) no. 237 570 88 612 156 566 73 594 65 400 49 168 na 49 786 720 696
Remote
Triage category 1 % np np 100 99 100 np na 100 100 763
Triage category 2 % 90 84 91 88 80 79 na 72 83 12 243
Triage category 3 % 83 74 83 84 84 66 na 65 77 39 687
Triage category 4 % 90 76 84 83 93 71 na 63 79 66 754
Triage category 5 % 96 88 98 97 97 n.p na 89 96 18 452
Total (i) % 89 78 86 86 91 72 na 67 81 137 919
Total number (i), (j) no. 18 602 1 552 19 467 49 984 8 889 1 272 na 38 153 137 919
Very remote
Triage category 1 % np np 100 np np np na 100 100 577
Triage category 2 % 86 np 90 85 70 np na 66 74 7 771
Triage category 3 % 81 np 83 79 66 np na 63 71 23 392
Triage category 4 % 92 74 84 82 82 np na 66 75 33 046
Triage category 5 % 97 np 96 96 95 np na 90 93 9 346
REPORT ON
GOVERNMENT
SERVICES 2017
PUBLIC
HOSPITALS
PAGE 6 of TABLE 12A.16

TABLE 12A.16
Table 12A.16
NSW Vic Qld WA (f) SA (g) Tas ACT (h) NT AustAust (total
number)
Patients treated within national benchmarks for emergency department waiting time, by remoteness, by
State and Territory (a), (b), (c), (d), (e)
Total (i) % 90 77 86 83 77 68 na 68 76 74 152
Total number (i), (j) no. 5 408 215 15 891 10 625 1 461 225 na 40 327 74 152
(a)
(b)
(c)
(d)
(e)
(f)
(g)
(h)
(i)
(j)
Source: AIHW (unpublished) National Non-admitted Patient Emergency Department Care Database.
Data for the ACT were not available at the time of data supply and have not been included in the totals for 20015-16.
Area of usual residence was not reported or not mappable to SEIFA categories for approximately 2 per cent of records.
Remoteness areas are based on the usual residential address of the patient. Not all remoteness areas are represented in each State or Territory. The
remoteness area 'Major city' does not exist within Tasmania or the NT, 'Inner regional' does not exist within the NT, 'Outer regional' does not exist in the ACT,
'Remote' does not exist in the ACT and 'Very remote' does not exist in Victoria or the ACT. However, data are reported for the state/territory where the hospital
was located. This means, for example, that although there is no ‘major city’ classification in Tasmania, Tasmanian hospitals may treat some patients whose
usual residence is a major city in another jurisdiction.
na Not available. – Nil or rounded to zero. np Not published.
The proportion of presentations for which the waiting time to commencement of clinical care was within the time specified in the definition of the triage category.
Records were excluded from the calculation of waiting time statistics if the triage category was unknown, if the patient did not wait or was dead on arrival, or if
the waiting time could not be calculated due to missing or invalid time fields.
It should be noted that the data presented here are not necessarily representative of the hospitals not included in the NNAPEDCD.
The totals exclude records for which the waiting time to service could not be calculated, and records for which the episode end status was either 'Did not wait to
be attended by a health care professional' or 'Dead on arrival, not treated in emergency department'.
The totals include records for which the triage category was not assigned or not reported.
For 2014-15, waiting times information could not be calculated for 8 months of data (about 27 000 emergency department presentations) for a Public acute
group B hospital in WA. For 2015–16, waiting times information could not be calculated for about 43 000 emergency department presentations for a Public
acute group B hospital in WA.
For 2014-15, waiting times information could not be calculated for one Public acute group B hospital in SA, that reported about 40 000 emergency department
presentations.
For more information on data quality, including collection methodologies and data limitations, see METeOR on the AIHW website.
REPORT ON
GOVERNMENT
SERVICES 2017
PUBLIC
HOSPITALS
PAGE 7 of TABLE 12A.16

TABLE 12A.17
Table 12A.17
unit NSW Vic Qld WA (f) SA (g) Tas ACT (h) NT AustAust (total
number)
2013-14
All hospitals
Quintile 1
Triage category 1 % 100 100 100 99 100 100 np 100 100 11 586
Triage category 2 % 84 83 80 88 76 84 84 65 82 192 241
Triage category 3 % 76 72 69 63 65 68 53 60 71 606 253
Triage category 4 % 79 70 74 73 77 73 59 61 75 721 325
Triage category 5 % 94 86 91 93 92 90 86 90 92 146 668
Total (i) % 80 74 74 73 74 74 64 64 76 1 678 073
Total number (i), (j) no. 660 024 291 625 377 623 90 799 131 478 75 094 2 088 49 522 1 678 253
Quintile 2
Triage category 1 % 100 100 100 100 100 np np 100 100 10 179
Triage category 2 % 83 85 79 86 74 86 86 57 82 166 757
Triage category 3 % 77 76 65 64 65 67 56 44 71 517 293
Triage category 4 % 80 72 74 75 76 72 59 44 76 632 608
Triage category 5 % 94 90 92 95 92 90 88 84 93 137 878
Total (i) % 81 77 72 74 73 73 65 48 77 1 464 715
Total number (i), (j) no. 584 273 346 473 234 496 140 911 118 099 21 268 3 887 15 556 1 464 963
Quintile 3
Triage category 1 % 100 100 100 99 100 100 np 100 100 8 553
Triage category 2 % 83 85 80 85 72 85 84 64 82 150 272
Patients treated within national benchmarks for emergency department waiting time, by State and Territory,
by SEIFA IRSD quintiles (a), (b), (c), (d), (e)
REPORT ON
GOVERNMENT
SERVICES 2017
PUBLIC
HOSPITALS
PAGE 1 of TABLE 12A.17

TABLE 12A.17
Table 12A.17
unit NSW Vic Qld WA (f) SA (g) Tas ACT (h) NT AustAust (total
number)
Patients treated within national benchmarks for emergency department waiting time, by State and Territory,
by SEIFA IRSD quintiles (a), (b), (c), (d), (e)
Triage category 3 % 74 73 65 58 63 64 49 59 68 458 528
Triage category 4 % 78 70 74 71 76 69 55 58 73 539 761
Triage category 5 % 93 88 93 94 91 91 83 90 92 97 536
Total (i) % 79 74 72 70 72 70 60 61 74 1 254 650
Total number (i), (j) no. 386 417 314 342 272 443 172 661 48 788 23 913 7 857 28 327 1 254 748
Quintile 4
Triage category 1 % 100 100 100 99 100 100 99 100 100 7 817
Triage category 2 % 84 85 79 85 73 86 82 56 82 136 195
Triage category 3 % 77 72 66 55 63 59 50 32 68 421 001
Triage category 4 % 80 71 75 69 78 66 55 38 73 476 506
Triage category 5 % 94 88 93 94 92 88 85 74 91 84 188
Total (i) % 81 75 72 68 72 68 60 41 74 1 125 707
Total number (i), (j) no. 276 665 331 034 241 634 130 213 72 653 16 680 37 017 19 859 1 125 755
Quintile 5
Triage category 1 % 100 100 100 100 100 np 100 100 100 6 499
Triage category 2 % 84 84 83 85 71 87 83 58 83 116 548
Triage category 3 % 77 75 71 54 63 56 50 41 69 337 524
Triage category 4 % 81 73 79 68 79 71 57 51 75 404 845
Triage category 5 % 94 88 95 94 93 93 86 93 92 81 050
Total (i) % 81 76 77 67 73 71 61 54 75 946 466
Total number (i), (j) no. 355 895 179 846 140 635 160 325 25 968 2 147 67 093 14 617 946 526
REPORT ON
GOVERNMENT
SERVICES 2017
PUBLIC
HOSPITALS
PAGE 2 of TABLE 12A.17

TABLE 12A.17
Table 12A.17
unit NSW Vic Qld WA (f) SA (g) Tas ACT (h) NT AustAust (total
number)
Patients treated within national benchmarks for emergency department waiting time, by State and Territory,
by SEIFA IRSD quintiles (a), (b), (c), (d), (e)
2014-15
All hospitals
Quintile 1
Triage category 1 % 100 100 99 100 100 100 np 100 100 12 023
Triage category 2 % 81 78 77 87 73 83 83 65 79 204 794
Triage category 3 % 76 70 66 64 61 66 50 62 70 625 277
Triage category 4 % 80 70 73 72 73 69 54 64 75 716 717
Triage category 5 % 94 87 91 93 90 89 86 88 92 144 683
Total (i) % 80 72 71 73 71 71 61 66 75 1 703 494
Total number (i), (j) no. 684 887 297 347 372 557 84 035 137 254 74 877 2 141 50 560 1 703 658
Quintile 2
Triage category 1 % 100 100 99 100 100 np np 100 100 10 659
Triage category 2 % 83 81 77 83 68 84 81 59 80 179 628
Triage category 3 % 76 74 63 63 56 66 53 48 69 543 253
Triage category 4 % 81 73 75 72 66 69 57 53 76 645 586
Triage category 5 % 95 91 92 94 89 89 90 84 93 135 748
Total (i) % 81 76 71 72 64 71 63 54 76 1 514 874
Total number (i), (j) no. 601 277 352 396 245 565 155 462 119 488 21 968 3 977 14 907 1 515 040
Quintile 3
Triage category 1 % 100 100 99 100 100 100 np 100 100 8 921
Triage category 2 % 81 81 77 83 68 82 78 67 79 160 291
Triage category 3 % 73 73 62 56 57 61 46 60 67 481 052
REPORT ON
GOVERNMENT
SERVICES 2017
PUBLIC
HOSPITALS
PAGE 3 of TABLE 12A.17
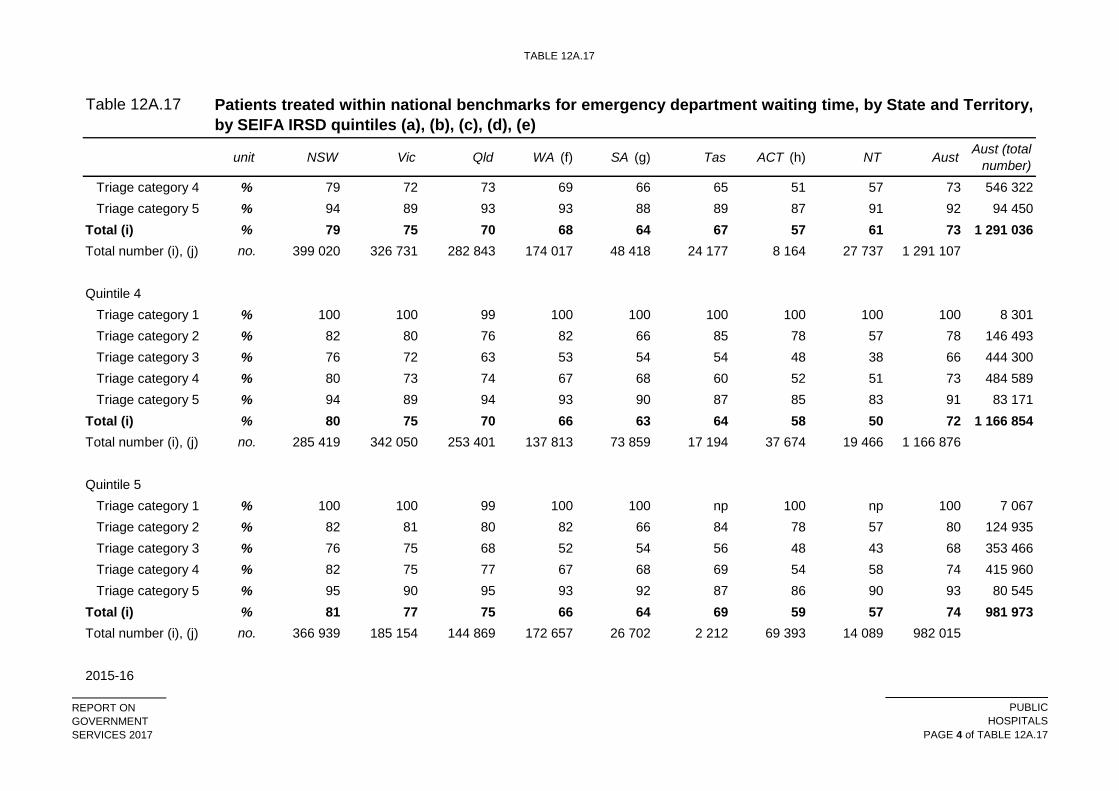
TABLE 12A.17
Table 12A.17
unit NSW Vic Qld WA (f) SA (g) Tas ACT (h) NT AustAust (total
number)
Patients treated within national benchmarks for emergency department waiting time, by State and Territory,
by SEIFA IRSD quintiles (a), (b), (c), (d), (e)
Triage category 4 % 79 72 73 69 66 65 51 57 73 546 322
Triage category 5 % 94 89 93 93 88 89 87 91 92 94 450
Total (i) % 79 75 70 68 64 67 57 61 73 1 291 036
Total number (i), (j) no. 399 020 326 731 282 843 174 017 48 418 24 177 8 164 27 737 1 291 107
Quintile 4
Triage category 1 % 100 100 99 100 100 100 100 100 100 8 301
Triage category 2 % 82 80 76 82 66 85 78 57 78 146 493
Triage category 3 % 76 72 63 53 54 54 48 38 66 444 300
Triage category 4 % 80 73 74 67 68 60 52 51 73 484 589
Triage category 5 % 94 89 94 93 90 87 85 83 91 83 171
Total (i) % 80 75 70 66 63 64 58 50 72 1 166 854
Total number (i), (j) no. 285 419 342 050 253 401 137 813 73 859 17 194 37 674 19 466 1 166 876
Quintile 5
Triage category 1 % 100 100 99 100 100 np 100 np 100 7 067
Triage category 2 % 82 81 80 82 66 84 78 57 80 124 935
Triage category 3 % 76 75 68 52 54 56 48 43 68 353 466
Triage category 4 % 82 75 77 67 68 69 54 58 74 415 960
Triage category 5 % 95 90 95 93 92 87 86 90 93 80 545
Total (i) % 81 77 75 66 64 69 59 57 74 981 973
Total number (i), (j) no. 366 939 185 154 144 869 172 657 26 702 2 212 69 393 14 089 982 015
2015-16
REPORT ON
GOVERNMENT
SERVICES 2017
PUBLIC
HOSPITALS
PAGE 4 of TABLE 12A.17

TABLE 12A.17
Table 12A.17
unit NSW Vic Qld WA (f) SA (g) Tas ACT (h) NT AustAust (total
number)
Patients treated within national benchmarks for emergency department waiting time, by State and Territory,
by SEIFA IRSD quintiles (a), (b), (c), (d), (e)
All hospitals
Quintile 1
Triage category 1 % 100 100 100 100 100 100 na 100 100 13 173
Triage category 2 % 82 78 74 81 72 80 na 64 78 225 626
Triage category 3 % 76 69 63 59 60 62 na 60 68 667 738
Triage category 4 % 81 71 74 70 73 65 na 65 75 725 204
Triage category 5 % 94 87 93 92 92 88 na 88 92 143 706
Total (i) % 81 72 70 69 70 68 na 66 74 1 775 619
Total number (i), (j) no. 723 872 313 057 376 227 79 952 152 588 76 158 na 53 765 1 775 619
Quintile 2
Triage category 1 % 100 100 100 100 100 100 na 100 100 11 538
Triage category 2 % 82 80 74 76 71 79 na 63 78 190 999
Triage category 3 % 76 73 59 59 55 59 na 48 68 569 116
Triage category 4 % 81 73 73 69 68 65 na 56 75 647 391
Triage category 5 % 94 91 93 93 91 87 na 87 93 135 643
Total (i) % 81 75 68 68 65 66 na 56 75 1 554 849
Total number (i), (j) no. 631 611 360 795 233 250 158 434 133 134 22 277 na 15 348 1 554 849
Quintile 3
Triage category 1 % 100 100 100 100 100 99 na 100 100 9 811
Triage category 2 % 81 79 74 76 69 81 na 71 77 173 710
Triage category 3 % 73 72 61 51 54 62 na 60 66 512 350
Triage category 4 % 79 73 73 67 66 65 na 59 73 558 388
REPORT ON
GOVERNMENT
SERVICES 2017
PUBLIC
HOSPITALS
PAGE 5 of TABLE 12A.17

TABLE 12A.17
Table 12A.17
unit NSW Vic Qld WA (f) SA (g) Tas ACT (h) NT AustAust (total
number)
Patients treated within national benchmarks for emergency department waiting time, by State and Territory,
by SEIFA IRSD quintiles (a), (b), (c), (d), (e)
Triage category 5 % 93 89 93 94 93 89 na 91 92 94 717
Total (i) % 79 74 69 65 63 67 na 63 72 1 349 039
Total number (i), (j) no. 411 738 343 646 306 223 173 908 60 624 24 248 na 28 652 1 349 039
Quintile 4
Triage category 1 % 100 100 100 100 100 100 na 100 100 8 772
Triage category 2 % 82 77 73 77 69 78 na 59 76 154 753
Triage category 3 % 76 71 61 49 54 46 na 38 65 458 989
Triage category 4 % 80 73 75 65 69 56 na 54 73 480 063
Triage category 5 % 94 89 94 92 93 85 na 87 92 77 764
Total (i) % 80 74 69 63 64 59 na 51 72 1 180 358
Total number (i), (j) no. 293 325 346 043 280 928 142 724 79 884 17 617 na 19 837 1 180 358
Quintile 5
Triage category 1 % 100 100 100 100 100 n.p na np 100 7 320
Triage category 2 % 81 77 78 77 67 81 na 58 78 131 043
Triage category 3 % 77 72 64 49 54 47 na 44 67 355 217
Triage category 4 % 81 74 77 66 68 59 na 60 75 402 446
Triage category 5 % 95 90 95 94 93 85 na 91 93 71 690
Total (i) % 81 75 73 63 64 61 na 57 74 967 754
Total number (i), (j) no. 374 848 206 204 159 155 180 124 28 911 2 383 na 16 129 967 754
(a) The proportion of presentations for which the waiting time to commencement of clinical care was within the time specified in the definition of the triage
category. Records were excluded from the calculation of waiting time statistics if the triage category was unknown, if the patient did not wait or was dead on
arrival, or if the waiting time could not be calculated due to missing or invalid time fields.
REPORT ON
GOVERNMENT
SERVICES 2017
PUBLIC
HOSPITALS
PAGE 6 of TABLE 12A.17

TABLE 12A.17
Table 12A.17
unit NSW Vic Qld WA (f) SA (g) Tas ACT (h) NT AustAust (total
number)
Patients treated within national benchmarks for emergency department waiting time, by State and Territory,
by SEIFA IRSD quintiles (a), (b), (c), (d), (e)
(b)
(c)
(d)
(e)
(f)
(g)
(h)
(i)
(j)
Source : AIHW (unpublished) National Non-admitted Patient Emergency Department Care Database.
It should be noted that the data presented here are not necessarily representative of the hospitals not included in the NNAPEDCD.
na Not available. np Not published.
SEIFA quintiles are based on the SEIFA IRSD, with quintile 1 being the most disadvantaged and quintile 5 being the least disadvantaged. The SEIFA quintiles
represent approximately 20 per cent of the national population, but do not necessarily represent 20 per cent of the population in each state or territory.
Disaggregation by SEIFA is based on the patient's usual residence, not the location of the hospital.
Area of usual residence was not reported or not mappable to SEIFA categories for approximately 2 per cent of records.
The totals exclude records for which the waiting time to service could not be calculated, and records for which the episode end status was either 'Did not wait
to be attended by a health care professional' or 'Dead on arrival, not treated in emergency department'.
The totals include records for which the triage category was not assigned or not reported.
For 2014-15, waiting times information could not be calculated for 8 months of data (about 27 000 emergency department presentations) for a Public acute
group B hospital in WA. For 2015–16, waiting times information could not be calculated for about 43 000 emergency department presentations for a Public
acute group B hospital in WA.
For 2014-15, waiting times information could not be calculated for one Public acute group B hospital in SA, that reported about 40 000 emergency department
presentations.
For more information on data quality, including collection methodologies and data limitations, see METeOR on the AIHW website.
Data for the ACT were not available at the time of data supply and have not been included in the totals for 2015-16.
REPORT ON
GOVERNMENT
SERVICES 2017
PUBLIC
HOSPITALS
PAGE 7 of TABLE 12A.17

TABLE 12A.18
Table 12A.18
Unit NSW Vic Qld WA SA Tas ACT (c) NT Aust
2011-12
no. 1 331 758 975 275 789 155 577 182 275 963 94 076 68 357 94 403 4 206 169
no. 2 231 891 1 509 052 1 238 522 725 840 427 011 141 700 118 396 144 842 6 537 254
% 59.7 64.6 63.7 79.5 64.6 66.4 57.7 65.2 64.3
2012-13
no. 1 447 210 1 002 616 921 527 581 873 300 787 98 992 68 172 92 578 4 513 755
no. 2 275 808 1 528 608 1 284 158 754 119 455 220 147 064 118 931 145 532 6 709 440
% 63.6 65.6 71.8 77.2 66.1 67.3 57.3 63.6 67.3
2013-14
no. 1 946 951 1 084 460 1 031 765 590 031 298 650 100 372 77 844 89 438 5 219 511
no. 2 634 923 1 572 787 1 351 573 742 615 463 171 148 278 125 888 145 176 7 184 411
% 73.9 69.0 76.3 79.5 64.5 67.7 61.8 61.6 72.7
Length of stay for emergency department care, proportion of patients staying for four hours or less
(a), (b)
Number of ED
presentations where ED
Stay is less than or equal
to four hours
Total number of ED
presentations
ED Stay length is
within four hours
Number of ED
presentations where ED
Stay is less than or equal
to four hours
Total number of ED
presentations
ED Stay length is
within four hours
Number of ED
presentations where ED
Stay is less than or equal
to four hours
Total number of ED
presentations
ED Stay length is
within four hours
REPORT ON
GOVERNMENT
SERVICES 2017
PUBLIC
HOSPITALS
PAGE 1 of TABLE 12A.18

TABLE 12A.18
Table 12A.18
Unit NSW Vic Qld WA SA Tas ACT (c) NT Aust
Length of stay for emergency department care, proportion of patients staying for four hours or less
(a), (b)
no. 2 005 126 1 126 336 1 057 255 632 713 299 542 99 899 81 989 88 315 5 391 175
no. 2 675 845 1 610 614 1 378 883 803 821 469 368 150 076 129 961 142 244 7 360 812
% 74.9 69.9 76.7 78.7 63.8 66.6 63.1 62.1 73.2
no. 2 039 955 1 195 831 1 082 725 630 193 318 104 101 754 na 94 356 5 462 918
no. 2 726 943 1 679 874 1 439 140 829 431 481 889 153 541 na 148 459 7 459 277
% 74.8 71.2 75.2 76.0 66.0 66.3 na 63.6 73.2
(a)
(b)
(c)
Source :
For more information on data quality, including collection methodologies and data limitations, see METeOR on the AIHW website.
AIHW (various years), Emergency department care: Australian hospital statistics, Health services series.
2015-16
Number of ED
presentations where ED
Stay is less than or equal
to four hours
Total number of ED
presentations
ED Stay length is
within four hours
na Not available.
Data for the ACT were not available at the time of data supply and have not been included in the totals for 2015-16.
Invalid records are excluded from the numerator and denominator. Invalid records are records for which: the length of stay is less than zero (0), the
presentation date or time is missing or the physical departure date or time is missing.
2014-15
Number of ED
presentations where ED
Stay is less than or equal
to four hours
Total number of ED
presentations
ED Stay length is
within four hours
REPORT ON
GOVERNMENT
SERVICES 2017
PUBLIC
HOSPITALS
PAGE 2 of TABLE 12A.18

TABLE 12A.19
Table 12A.19
NSW Vic Qld WA SA Tas ACT (d) NT Aust (d)
2012-13
Principal referral and Women's and children's hospitals
50th percentile
Cataract extraction 88 88 42 153 68 159 np 154 76
Cholecystectomy 43 61 34 47 48 164 62 71 48
Coronary artery bypass graft 28 19 4 13 16 31 np – 16
Cystoscopy 21 22 28 50 39 51 29 42 26
Haemorrhoidectomy 61 104 np np np np np 119 85
Hysterectomy 35 50 34 33 51 44 np np 39
Inguinal herniorrhaphy 44 51 48 52 41 129 62 np 50
Myringoplasty 290 np 84 np np np np np 167
Myringotomy 57 91 44 53 56 np np np 54
Prostatectomy 49 25 46 48 40 np np np 42
Septoplasty 307 165 38 np 182 np np np 224
Tonsillectomy 295 136 42 77 71 173 141 127 87
Total hip replacement 177 120 85 100 88 np np np 119
Total knee replacement 319 163 147 114 137 np np np 221
Varicose veins stripping & ligation 91 224 35 52 np np 127 np 85
Total (e) 28 36 25 33 34 43 29 40 30
90th percentile
Cataract extraction 304 220 309 340 309 343 np 230 295
Cholecystectomy 170 243 143 216 90 452 207 292 203
Coronary artery bypass graft 85 84 68 41 56 93 np – 76
Cystoscopy 100 113 168 339 101 179 149 138 133
Waiting times for elective surgery in public hospitals, by State and Territory, by procedure and hospital
peer group (days) (a), (b), (c)
REPORT ON
GOVERNMENT
SERVICES 2017
PUBLIC
HOSPITALS
PAGE 1 of TABLE 12A.19

TABLE 12A.19
Table 12A.19
NSW Vic Qld WA SA Tas ACT (d) NT Aust (d)
Waiting times for elective surgery in public hospitals, by State and Territory, by procedure and hospital
peer group (days) (a), (b), (c)
Haemorrhoidectomy 345 344 np np np np np 278 356
Hysterectomy 310 191 154 127 155 134 np np 191
Inguinal herniorrhaphy 336 248 162 184 208 637 204 np 288
Myringoplasty 399 np 355 np np np np np 410
Myringotomy 241 212 98 96 92 np np np 126
Prostatectomy 131 188 189 164 105 np np np 147
Septoplasty 378 532 440 np 352 np np np 424
Tonsillectomy 369 442 141 226 332 483 372 375 363
Total hip replacement 363 300 362 235 215 np np np 362
Total knee replacement 374 352 475 293 285 np np np 395
Varicose veins stripping & ligation 356 357 136 166 np np 545 np 336
Total (e) 285 221 161 181 175 358 220 196 219
Public acute group A hospitals
50th percentile
Cataract extraction 305 65 37 38 115 728 157 174 159
Cholecystectomy 69 66 54 20 41 55 67 np 57
Coronary artery bypass graft – – – np – – – – np
Cystoscopy 28 21 23 22 45 27 40 np 25
Haemorrhoidectomy 80 99 74 27 np 68 np np 69
Hysterectomy 76 58 65 54 65 86 np np 68
Inguinal herniorrhaphy 87 78 66 26 37 114 np np 72
Myringoplasty 305 np 85 np np np np np 104
Myringotomy 85 33 33 30 34 np np np 36
Prostatectomy 56 26 32 48 66 np np np 40
REPORT ON
GOVERNMENT
SERVICES 2017
PUBLIC
HOSPITALS
PAGE 2 of TABLE 12A.19

TABLE 12A.19
Table 12A.19
NSW Vic Qld WA SA Tas ACT (d) NT Aust (d)
Waiting times for elective surgery in public hospitals, by State and Territory, by procedure and hospital
peer group (days) (a), (b), (c)
Septoplasty 346 220 103 np 111 np np np 242
Tonsillectomy 269 97 77 90 68 68 np np 106
Total hip replacement 224 122 91 90 111 297 np np 128
Total knee replacement 323 162 169 92 153 441 138 np 225
Varicose veins stripping & ligation 76 203 99 np 115 np np np 113
Total (e) 67 34 29 30 42 42 85 43 42
90th percentile
Cataract extraction 361 199 250 148 370 867 305 395 359
Cholecystectomy 320 194 155 84 126 407 238 np 213
Coronary artery bypass graft – – – np – – – – np
Cystoscopy 111 90 88 117 109 265 188 np 106
Haemorrhoidectomy 311 343 227 119 np 716 np np 308
Hysterectomy 335 232 165 150 192 283 np np 245
Inguinal herniorrhaphy 347 247 212 103 145 692 np np 320
Myringoplasty 364 np 290 np np np np np 356
Myringotomy 329 183 119 97 93 np np np 160
Prostatectomy 272 156 173 156 119 np np np 169
Septoplasty 379 806 365 np 323 np np np 400
Tonsillectomy 367 342 288 265 229 161 np np 362
Total hip replacement 364 329 355 276 323 621 np np 361
Total knee replacement 372 376 468 315 349 762 355 np 379
Varicose veins stripping & ligation 359 498 357 np 361 np np np 370
Total (e) 351 241 194 156 207 493 283 204 311
Public acute group B hospitals
REPORT ON
GOVERNMENT
SERVICES 2017
PUBLIC
HOSPITALS
PAGE 3 of TABLE 12A.19

TABLE 12A.19
Table 12A.19
NSW Vic Qld WA SA Tas ACT (d) NT Aust (d)
Waiting times for elective surgery in public hospitals, by State and Territory, by procedure and hospital
peer group (days) (a), (b), (c)
50th percentile
Cataract extraction 221 37 84 55 71 293 – – 125
Cholecystectomy 52 49 61 30 15 np – – 48
Coronary artery bypass graft – – – – – – – – –
Cystoscopy 29 22 np 10 13 23 – – 20
Haemorrhoidectomy 66 62 59 37 np np – – 55
Hysterectomy 76 78 77 26 26 np – – 56
Inguinal herniorrhaphy 71 60 80 35 19 np – – 60
Myringoplasty np np np np np np – – 151
Myringotomy np 78 np 64 np – – – 70
Prostatectomy 59 26 – 18 np – – – 26
Septoplasty 329 127 np 140 np np – – 197
Tonsillectomy 203 120 np 116 96 np – – 124
Total hip replacement 252 83 92 114 np – – – 154
Total knee replacement 280 122 113 154 126 – – – 238
Varicose veins stripping & ligation 161 84 np np np np – – 92
Total (e) 76 42 41 28 25 29 – – 46
90th percentile
Cataract extraction 347 69 170 284 201 427 – – 337
Cholecystectomy 182 151 109 122 57 np – – 141
Coronary artery bypass graft – – – – – – – – –
Cystoscopy 104 91 np 64 54 107 – – 85
Haemorrhoidectomy 258 195 142 118 np np – – 183
Hysterectomy 328 194 329 77 67 np – – 245
REPORT ON
GOVERNMENT
SERVICES 2017
PUBLIC
HOSPITALS
PAGE 4 of TABLE 12A.19

TABLE 12A.19
Table 12A.19
NSW Vic Qld WA SA Tas ACT (d) NT Aust (d)
Waiting times for elective surgery in public hospitals, by State and Territory, by procedure and hospital
peer group (days) (a), (b), (c)
Inguinal herniorrhaphy 315 168 175 122 76 np – – 232
Myringoplasty np np np np np np – – 357
Myringotomy np 152 np 161 np – – – 160
Prostatectomy 322 155 – 83 np – – – 160
Septoplasty 375 386 np 390 np np – – 376
Tonsillectomy 352 350 np 354 295 np – – 349
Total hip replacement 356 407 153 301 np – – – 351
Total knee replacement 356 453 203 329 265 – – – 355
Varicose veins stripping & ligation 343 303 np np np np – – 326
Total (e) 333 178 144 154 152 356 – – 272
Other hospitals
50th percentile
Cataract extraction 269 44 – 32 74 – – np 61
Cholecystectomy 48 90 np 35 17 – – np 39
Coronary artery bypass graft – – – – – – – – –
Cystoscopy 23 21 np 23 12 – – np 20
Haemorrhoidectomy 38 85 np 41 3 – – np 37
Hysterectomy 54 np np 34 28 – – – 37
Inguinal herniorrhaphy 65 83 np 36 21 – – np 47
Myringoplasty np 111 – 104 np – – np 113
Myringotomy np 19 – 41 np – – np 28
Prostatectomy np 97 – np 13 – – – 51
Septoplasty 295 46 – 81 np – – – 84
Tonsillectomy 210 29 – 70 61 – – np 61
REPORT ON
GOVERNMENT
SERVICES 2017
PUBLIC
HOSPITALS
PAGE 5 of TABLE 12A.19

TABLE 12A.19
Table 12A.19
NSW Vic Qld WA SA Tas ACT (d) NT Aust (d)
Waiting times for elective surgery in public hospitals, by State and Territory, by procedure and hospital
peer group (days) (a), (b), (c)
Total hip replacement 40 np – 85 177 – – – 79
Total knee replacement 47 np – 101 195 – – – 90
Varicose veins stripping & ligation 93 np np np np – – np 82
Total (e) 55 36 24 32 26 13 – 62 36
90th percentile
Cataract extraction 350 265 – 147 279 – – np 314
Cholecystectomy 94 230 np 85 63 – – np 112
Coronary artery bypass graft – – – – – – – – –
Cystoscopy 82 106 np 127 57 – – np 96
Haemorrhoidectomy 274 249 np 99 34 – – np 148
Hysterectomy 178 np np 105 87 – – – 118
Inguinal herniorrhaphy 303 254 np 99 82 – – np 205
Myringoplasty np 349 – 278 np – – np 323
Myringotomy np 82 – 182 np – – np 128
Prostatectomy np 192 – np 93 – – – 188
Septoplasty 349 251 – 278 np – – – 329
Tonsillectomy 331 112 – 202 174 – – np 265
Total hip replacement 225 np – 243 353 – – – 284
Total knee replacement 165 np – 288 349 – – – 301
Varicose veins stripping & ligation 247 np np np np – – np 257
Total (e) 315 237 72 141 195 13 – 231 242
All hospitals (f)
50th percentile
Cataract extraction 238 51 45 44 82 277 157 156 89
REPORT ON
GOVERNMENT
SERVICES 2017
PUBLIC
HOSPITALS
PAGE 6 of TABLE 12A.19

TABLE 12A.19
Table 12A.19
NSW Vic Qld WA SA Tas ACT (d) NT Aust (d)
Waiting times for elective surgery in public hospitals, by State and Territory, by procedure and hospital
peer group (days) (a), (b), (c)
Cholecystectomy 56 61 48 29 31 71 64 58 50
Coronary artery bypass graft 28 19 4 13 16 31 np – 16
Cystoscopy 25 22 25 22 31 34 35 50 24
Haemorrhoidectomy 65 81 63 37 20 70 np 75 60
Hysterectomy 60 60 55 35 43 70 55 np 53
Inguinal herniorrhaphy 71 69 65 34 29 104 81 53 59
Myringoplasty 304 131 84 87 np np np 140 123
Myringotomy 68 50 38 50 42 72 59 73 49
Prostatectomy 54 28 37 30 36 np 63 np 39
Septoplasty 327 124 78 125 99 272 np np 193
Tonsillectomy 260 101 56 88 69 96 142 75 97
Total hip replacement 197 117 89 92 108 371 121 np 123
Total knee replacement 297 161 156 105 154 610 154 np 206
Varicose veins stripping & ligation 97 140 56 70 88 39 146 98 95
Total (e) 49 36 28 31 34 41 50 43 36
90th percentile
Cataract extraction 355 249 266 206 301 753 305 307 339
Cholecystectomy 234 189 143 112 90 392 217 170 182
Coronary artery bypass graft 85 84 68 45 56 93 np – 76
Cystoscopy 103 98 103 137 97 179 171 161 109
Haemorrhoidectomy 306 289 226 121 90 750 np 244 266
Hysterectomy 316 213 172 120 134 237 189 np 218
Inguinal herniorrhaphy 336 222 184 120 116 633 232 133 281
Myringoplasty 383 375 327 278 np np np 355 364
REPORT ON
GOVERNMENT
SERVICES 2017
PUBLIC
HOSPITALS
PAGE 7 of TABLE 12A.19

TABLE 12A.19
Table 12A.19
NSW Vic Qld WA SA Tas ACT (d) NT Aust (d)
Waiting times for elective surgery in public hospitals, by State and Territory, by procedure and hospital
peer group (days) (a), (b), (c)
Myringotomy 328 170 102 133 97 260 201 175 141
Prostatectomy 198 178 176 147 106 np 139 np 167
Septoplasty 377 540 376 390 331 584 np np 386
Tonsillectomy 366 353 216 259 279 447 374 363 359
Total hip replacement 361 322 351 272 319 809 347 np 358
Total knee replacement 367 380 459 313 343 961 440 np 373
Varicose veins stripping & ligation 353 375 318 342 338 np 506 np 353
Total (e) 335 223 171 159 183 405 266 202 266
2013-14
Principal referral and Women's and children's hospitals
50th percentile
Cataract extraction 77 65 51 106 85 91 np 105 70
Cholecystectomy 51 49 34 36 43 94 66 52 47
Coronary artery bypass graft 26 21 7 14 19 17 np – 18
Cystoscopy 26 22 27 36 36 33 27 40 26
Haemorrhoidectomy 61 115 75 np np np np 89 82
Hysterectomy 28 44 32 28 48 24 np np 34
Inguinal herniorrhaphy 45 49 44 41 44 84 56 np 47
Myringoplasty 305 np 90 np np np np np 174
Myringotomy 63 115 36 49 44 np np np 53
Prostatectomy 61 26 50 33 57 np np np 48
Septoplasty 315 192 56 np np np np np 262
Tonsillectomy 254 179 42 72 73 135 324 np 92
REPORT ON
GOVERNMENT
SERVICES 2017
PUBLIC
HOSPITALS
PAGE 8 of TABLE 12A.19

TABLE 12A.19
Table 12A.19
NSW Vic Qld WA SA Tas ACT (d) NT Aust (d)
Waiting times for elective surgery in public hospitals, by State and Territory, by procedure and hospital
peer group (days) (a), (b), (c)
Total hip replacement 159 136 76 77 60 np np np 102
Total knee replacement 297 194 127 89 94 763 np np 209
Varicose veins stripping & ligation 88 125 51 np np np 69 np 85
Total (e) 29 36 26 28 35 43 30 33 30
90th percentile
Cataract extraction 250 169 336 315 329 146 np 203 292
Cholecystectomy 180 176 122 117 84 316 220 168 158
Coronary artery bypass graft 79 91 93 63 81 74 np – 83
Cystoscopy 100 112 161 242 113 116 98 184 122
Haemorrhoidectomy 315 377 355 np np np np 187 340
Hysterectomy 187 189 163 118 130 136 np np 167
Inguinal herniorrhaphy 310 215 167 126 134 296 200 np 251
Myringoplasty 455 np 340 np np np np np 439
Myringotomy 305 235 100 93 87 np np np 175
Prostatectomy 160 157 193 127 103 np np np 156
Septoplasty 365 588 364 np np np np np 399
Tonsillectomy 363 512 312 276 332 311 407 np 361
Total hip replacement 362 319 423 175 162 np np np 365
Total knee replacement 365 403 482 284 241 953 np np 403
Varicose veins stripping & ligation 358 410 196 np np np 431 np 345
Total (e) 271 231 201 153 147 304 196 171 222
Public acute group A hospitals
50th percentile
Cataract extraction 291 48 29 65 84 608 125 127 152
REPORT ON
GOVERNMENT
SERVICES 2017
PUBLIC
HOSPITALS
PAGE 9 of TABLE 12A.19

TABLE 12A.19
Table 12A.19
NSW Vic Qld WA SA Tas ACT (d) NT Aust (d)
Waiting times for elective surgery in public hospitals, by State and Territory, by procedure and hospital
peer group (days) (a), (b), (c)
Cholecystectomy 61 47 49 18 45 69 64 np 50
Coronary artery bypass graft – – – np – – – – np
Cystoscopy 29 21 22 20 48 28 31 np 25
Haemorrhoidectomy 71 67 57 25 np np np np 62
Hysterectomy 80 56 69 41 61 113 np np 69
Inguinal herniorrhaphy 85 64 71 21 49 125 np np 66
Myringoplasty 329 96 89 np np np np np 104
Myringotomy 87 39 63 72 np np np np 56
Prostatectomy 61 29 30 41 51 np np np 44
Septoplasty 339 170 127 np 229 np np np 255
Tonsillectomy 240 83 83 170 69 np np np 110
Total hip replacement 244 112 82 75 108 275 92 np 120
Total knee replacement 316 163 184 85 165 372 126 np 217
Varicose veins stripping & ligation 110 211 86 71 75 np np np 122
Total (e) 65 33 30 30 45 56 66 39 43
90th percentile
Cataract extraction 360 145 264 155 330 810 303 252 356
Cholecystectomy 306 143 128 78 88 394 156 np 156
Coronary artery bypass graft – – – np – – – – np
Cystoscopy 120 91 88 89 107 234 157 np 105
Haemorrhoidectomy 287 279 217 113 np np np np 244
Hysterectomy 297 257 163 112 253 246 np np 248
Inguinal herniorrhaphy 349 196 181 84 104 564 np np 300
Myringoplasty 372 361 363 np np np np np 368
REPORT ON
GOVERNMENT
SERVICES 2017
PUBLIC
HOSPITALS
PAGE 10 of TABLE 12A.19

TABLE 12A.19
Table 12A.19
NSW Vic Qld WA SA Tas ACT (d) NT Aust (d)
Waiting times for elective surgery in public hospitals, by State and Territory, by procedure and hospital
peer group (days) (a), (b), (c)
Myringotomy 338 153 235 228 np np np np 230
Prostatectomy 135 210 140 89 130 np np np 149
Septoplasty 365 675 405 np 337 np np np 393
Tonsillectomy 360 305 330 308 290 np np np 351
Total hip replacement 361 320 364 248 327 497 344 np 357
Total knee replacement 364 385 436 287 318 733 346 np 376
Varicose veins stripping & ligation 362 561 436 340 215 np np np 374
Total (e) 346 227 212 150 211 549 271 169 301
Public acute group B hospitals
50th percentile
Cataract extraction 211 np 92 34 68 64 – – 103
Cholecystectomy 53 42 36 28 20 np – – 42
Coronary artery bypass graft – – – – – – – – –
Cystoscopy 29 22 np 7 21 36 – – 19
Haemorrhoidectomy 63 59 36 41 np np – – 56
Hysterectomy 81 86 68 36 24 np – – 61
Inguinal herniorrhaphy 69 48 58 38 20 np – – 55
Myringoplasty np np np np np np – – 154
Myringotomy np 90 np 63 np – – – 79
Prostatectomy 64 42 – 15 np – – – 28
Septoplasty 328 139 np 144 np np – – 196
Tonsillectomy 211 132 np 124 77 np – – 133
Total hip replacement 232 88 73 70 np – – – 133
Total knee replacement 278 195 104 84 168 – – – 230
REPORT ON
GOVERNMENT
SERVICES 2017
PUBLIC
HOSPITALS
PAGE 11 of TABLE 12A.19

TABLE 12A.19
Table 12A.19
NSW Vic Qld WA SA Tas ACT (d) NT Aust (d)
Waiting times for elective surgery in public hospitals, by State and Territory, by procedure and hospital
peer group (days) (a), (b), (c)
Varicose veins stripping & ligation 179 76 np np np np – – 95
Total (e) 71 41 36 25 26 35 – – 43
90th percentile
Cataract extraction 351 np 210 224 232 400 – – 348
Cholecystectomy 195 117 97 107 65 np – – 127
Coronary artery bypass graft – – – – – – – – –
Cystoscopy 98 69 np 50 68 177 – – 74
Haemorrhoidectomy 154 195 133 192 np np – – 161
Hysterectomy 339 280 209 99 72 np – – 239
Inguinal herniorrhaphy 314 147 116 133 82 np – – 206
Myringoplasty np np np np np np – – 357
Myringotomy np 228 np 165 np – – – 206
Prostatectomy 324 223 – 70 np – – – 194
Septoplasty 364 361 np 413 np np – – 364
Tonsillectomy 349 351 np 336 287 np – – 348
Total hip replacement 344 354 181 266 np – – – 336
Total knee replacement 351 401 267 332 314 – – – 349
Varicose veins stripping & ligation 323 339 np np np np – – 326
Total (e) 330 199 146 126 160 356 – – 274
Other hospitals
50th percentile
Cataract extraction 266 37 – 37 78 – – 175 56
Cholecystectomy 48 54 np 38 18 – – np 40
Coronary artery bypass graft – – – – – – – – –
REPORT ON
GOVERNMENT
SERVICES 2017
PUBLIC
HOSPITALS
PAGE 12 of TABLE 12A.19

TABLE 12A.19
Table 12A.19
NSW Vic Qld WA SA Tas ACT (d) NT Aust (d)
Waiting times for elective surgery in public hospitals, by State and Territory, by procedure and hospital
peer group (days) (a), (b), (c)
Cystoscopy 23 15 np 19 12 – – np 16
Haemorrhoidectomy 41 85 np 48 3 – – np 44
Hysterectomy 56 np np 29 36 – – – 39
Inguinal herniorrhaphy 60 69 np 43 20 – – np 47
Myringoplasty np 128 – 81 np – – 130 111
Myringotomy np 23 – 26 30 – – np 26
Prostatectomy np 60 – np 13 – – – 36
Septoplasty 315 39 – 101 92 – – – 111
Tonsillectomy 196 34 – 74 56 – – np 63
Total hip replacement 40 np – 54 191 – – – 60
Total knee replacement 47 190 – 77 195 – – – 78
Varicose veins stripping & ligation 125 np np np np – – np 94
Total (e) 61 33 21 34 26 – – 89 37
90th percentile
Cataract extraction 350 250 – 163 308 – – 429 314
Cholecystectomy 139 160 np 85 69 – – np 111
Coronary artery bypass graft – – – – – – – – –
Cystoscopy 83 95 np 81 52 – – np 82
Haemorrhoidectomy 271 207 np 94 44 – – np 147
Hysterectomy 194 np np 92 110 – – – 125
Inguinal herniorrhaphy 261 335 np 95 105 – – np 187
Myringoplasty np 449 – 210 np – – 331 369
Myringotomy np 130 – 167 98 – – np 140
Prostatectomy np 172 – np 48 – – – 161
REPORT ON
GOVERNMENT
SERVICES 2017
PUBLIC
HOSPITALS
PAGE 13 of TABLE 12A.19

TABLE 12A.19
Table 12A.19
NSW Vic Qld WA SA Tas ACT (d) NT Aust (d)
Waiting times for elective surgery in public hospitals, by State and Territory, by procedure and hospital
peer group (days) (a), (b), (c)
Septoplasty 356 362 – 290 332 – – – 348
Tonsillectomy 329 187 – 246 178 – – np 297
Total hip replacement 137 np – 139 337 – – – 261
Total knee replacement 139 493 – 181 344 – – – 312
Varicose veins stripping & ligation 262 np np np np – – np 239
Total (e) 323 215 80 135 201 – – 310 245
All hospitals (f)
50th percentile
Cataract extraction 231 41 49 43 78 166 125 116 82
Cholecystectomy 55 46 43 28 35 71 65 50 47
Coronary artery bypass graft 26 21 7 20 19 17 np – 18
Cystoscopy 27 21 24 19 31 31 29 47 23
Haemorrhoidectomy 65 70 52 40 21 np np 70 59
Hysterectomy 56 62 58 33 47 70 63 np 52
Inguinal herniorrhaphy 69 56 58 35 33 84 59 41 56
Myringoplasty 316 141 89 81 np np np 154 131
Myringotomy 71 62 47 55 35 72 78 61 55
Prostatectomy 61 33 41 26 41 np np np 43
Septoplasty 325 136 100 139 138 np np np 220
Tonsillectomy 236 104 63 99 70 114 309 67 102
Total hip replacement 192 116 78 68 105 371 95 np 109
Total knee replacement 289 171 154 83 160 546 138 np 198
Varicose veins stripping & ligation 122 125 65 79 60 75 75 68 97
Total (e) 49 35 28 29 35 45 45 40 37
REPORT ON
GOVERNMENT
SERVICES 2017
PUBLIC
HOSPITALS
PAGE 14 of TABLE 12A.19

TABLE 12A.19
Table 12A.19
NSW Vic Qld WA SA Tas ACT (d) NT Aust (d)
Waiting times for elective surgery in public hospitals, by State and Territory, by procedure and hospital
peer group (days) (a), (b), (c)
90th percentile
Cataract extraction 352 213 312 191 309 715 303 295 335
Cholecystectomy 221 146 122 90 83 335 195 188 147
Coronary artery bypass graft 79 91 93 60 81 74 np – 83
Cystoscopy 106 90 103 103 99 141 131 184 102
Haemorrhoidectomy 224 265 246 116 88 np np 171 226
Hysterectomy 269 251 166 103 144 230 206 np 211
Inguinal herniorrhaphy 335 194 166 105 104 452 205 138 249
Myringoplasty 403 435 353 238 np np np 440 385
Myringotomy 324 197 198 169 88 215 200 195 192
Prostatectomy 165 192 148 91 97 np np np 157
Septoplasty 365 449 385 354 336 np np np 379
Tonsillectomy 360 355 321 291 279 321 410 274 354
Total hip replacement 357 323 370 202 313 761 382 np 355
Total knee replacement 362 393 434 276 321 881 458 np 365
Varicose veins stripping & ligation 353 409 340 295 182 np 306 np 353
Total (e) 329 222 197 142 180 401 246 188 265
2014-15
Principal referral and Women's and children's hospitals
50th percentile
Cataract extraction 120 58 67 68 104 202 np 127 83
Cholecystectomy 52 35 30 39 41 54 81 59 42
Coronary artery bypass graft 27 18 8 11 14 12 np – 14
REPORT ON
GOVERNMENT
SERVICES 2017
PUBLIC
HOSPITALS
PAGE 15 of TABLE 12A.19

TABLE 12A.19
Table 12A.19
NSW Vic Qld WA SA Tas ACT (d) NT Aust (d)
Waiting times for elective surgery in public hospitals, by State and Territory, by procedure and hospital
peer group (days) (a), (b), (c)
Cystoscopy 27 20 24 27 40 37 26 34 24
Haemorrhoidectomy 82 63 56 np np np np 34 65
Hysterectomy 29 35 42 34 42 40 np np 36
Inguinal herniorrhaphy 53 37 40 31 48 56 70 np 45
Myringoplasty 280 np 87 np np np np np 188
Myringotomy 73 58 67 55 60 98 np np 64
Prostatectomy 56 31 40 36 86 np np np 44
Septoplasty 306 267 70 np np np np np 266
Tonsillectomy 254 146 86 70 76 204 298 171 135
Total hip replacement 173 99 55 96 92 208 139 np 98
Total knee replacement 288 126 99 118 135 325 253 np 167
Varicose veins stripping & ligation 112 106 34 np np np np np 90
Total (e) 33 31 24 26 38 52 31 30 29
90th percentile
Cataract extraction 230 126 275 207 332 360 np 239 254
Cholecystectomy 209 130 88 132 94 364 342 217 154
Coronary artery bypass graft 93 83 38 53 60 60 np – 73
Cystoscopy 97 82 77 123 165 144 140 179 98
Haemorrhoidectomy 302 185 275 np np np np 273 274
Hysterectomy 210 192 175 104 125 293 np np 179
Inguinal herniorrhaphy 302 178 184 125 192 404 263 np 251
Myringoplasty 362 np 347 np np np np np 402
Myringotomy 315 176 291 133 93 313 np np 222
Prostatectomy 152 89 85 165 209 np np np 125
REPORT ON
GOVERNMENT
SERVICES 2017
PUBLIC
HOSPITALS
PAGE 16 of TABLE 12A.19

TABLE 12A.19
Table 12A.19
NSW Vic Qld WA SA Tas ACT (d) NT Aust (d)
Waiting times for elective surgery in public hospitals, by State and Territory, by procedure and hospital
peer group (days) (a), (b), (c)
Septoplasty 359 456 347 np np np np np 401
Tonsillectomy 357 346 362 329 339 313 584 593 358
Total hip replacement 356 238 259 277 236 588 512 np 334
Total knee replacement 361 354 329 317 276 776 599 np 360
Varicose veins stripping & ligation 309 414 253 np np np np np 322
Total (e) 260 188 161 135 189 357 279 226 208
Public acute group A hospitals
50th percentile
Cataract extraction 295 13 33 72 109 551 107 143 119
Cholecystectomy 59 37 41 24 47 64 52 np 46
Coronary artery bypass graft – – – np – – – – np
Cystoscopy 33 19 21 21 41 27 31 np 23
Haemorrhoidectomy 65 58 54 45 np np np np 56
Hysterectomy 84 55 69 48 77 125 np np 70
Inguinal herniorrhaphy 79 46 50 29 51 140 np np 57
Myringoplasty 337 88 77 np np np – np 110
Myringotomy 90 45 42 84 np np np np 51
Prostatectomy 61 28 29 36 47 np np np 39
Septoplasty 339 150 91 np 224 np np np 230
Tonsillectomy 293 78 69 157 148 253 np np 117
Total hip replacement 254 108 52 90 126 324 np np 111
Total knee replacement 313 148 88 106 236 440 195 np 206
Varicose veins stripping & ligation 126 132 np 57 117 np np np 112
Total (e) 69 27 28 35 48 63 56 29 39
REPORT ON
GOVERNMENT
SERVICES 2017
PUBLIC
HOSPITALS
PAGE 17 of TABLE 12A.19

TABLE 12A.19
Table 12A.19
NSW Vic Qld WA SA Tas ACT (d) NT Aust (d)
Waiting times for elective surgery in public hospitals, by State and Territory, by procedure and hospital
peer group (days) (a), (b), (c)
90th percentile
Cataract extraction 357 75 169 185 218 645 252 315 351
Cholecystectomy 286 124 86 93 133 392 140 np 134
Coronary artery bypass graft – – – np – – – – np
Cystoscopy 161 76 76 106 113 490 87 np 100
Haemorrhoidectomy 230 228 129 111 np np np np 191
Hysterectomy 323 267 189 100 324 436 np np 267
Inguinal herniorrhaphy 349 156 98 111 141 619 np np 274
Myringoplasty 378 344 285 np np np – np 359
Myringotomy 348 125 159 244 np np np np 217
Prostatectomy 156 95 88 87 119 np np np 119
Septoplasty 365 488 290 np 358 np np np 381
Tonsillectomy 363 221 261 337 416 441 np np 355
Total hip replacement 362 287 300 189 335 553 np np 350
Total knee replacement 365 340 348 257 358 775 450 np 362
Varicose veins stripping & ligation 362 637 np 271 308 np np np 381
Total (e) 348 180 132 164 239 538 219 145 290
Public acute group B hospitals
50th percentile
Cataract extraction 259 27 83 34 113 97 – – 147
Cholecystectomy 59 34 38 30 19 np – – 42
Coronary artery bypass graft – – – – – – – – –
Cystoscopy 31 20 np 8 21 30 – – 19
Haemorrhoidectomy 66 56 47 37 np np – – 55
REPORT ON
GOVERNMENT
SERVICES 2017
PUBLIC
HOSPITALS
PAGE 18 of TABLE 12A.19

TABLE 12A.19
Table 12A.19
NSW Vic Qld WA SA Tas ACT (d) NT Aust (d)
Waiting times for elective surgery in public hospitals, by State and Territory, by procedure and hospital
peer group (days) (a), (b), (c)
Hysterectomy 70 64 68 36 30 np – – 55
Inguinal herniorrhaphy 77 39 44 33 22 np – – 52
Myringoplasty np np np np np – – – 106
Myringotomy np 57 np 74 np – – – 64
Prostatectomy 56 26 – 16 np – – – 27
Septoplasty 323 126 np 205 np – – – 236
Tonsillectomy 231 147 np 159 np np – – 155
Total hip replacement 248 142 83 76 83 – – – 169
Total knee replacement 284 259 126 82 166 – – – 236
Varicose veins stripping & ligation 238 107 np np np np – – 132
Total (e) 77 32 34 27 28 43 – – 43
90th percentile
Cataract extraction 353 69 306 309 273 427 – – 350
Cholecystectomy 223 89 85 106 59 np – – 134
Coronary artery bypass graft – – – – – – – – –
Cystoscopy 99 77 np 64 82 97 – – 78
Haemorrhoidectomy 250 160 87 127 np np – – 169
Hysterectomy 320 174 178 85 67 np – – 181
Inguinal herniorrhaphy 321 103 106 110 61 np – – 216
Myringoplasty np np np np np – – – 338
Myringotomy np 174 np 185 np – – – 173
Prostatectomy 280 87 – 83 np – – – 135
Septoplasty 356 349 np 373 np – – – 359
Tonsillectomy 349 328 np 353 np np – – 343
REPORT ON
GOVERNMENT
SERVICES 2017
PUBLIC
HOSPITALS
PAGE 19 of TABLE 12A.19

TABLE 12A.19
Table 12A.19
NSW Vic Qld WA SA Tas ACT (d) NT Aust (d)
Waiting times for elective surgery in public hospitals, by State and Territory, by procedure and hospital
peer group (days) (a), (b), (c)
Total hip replacement 350 372 225 341 329 – – – 346
Total knee replacement 352 462 266 330 332 – – – 352
Varicose veins stripping & ligation 346 618 np np np np – – 357
Total (e) 334 175 156 127 195 348 – – 287
Other hospitals
50th percentile
Cataract extraction 223 34 – 37 70 – – 166 53
Cholecystectomy 40 np 41 44 23 – – np 37
Coronary artery bypass graft – – – – – – – – –
Cystoscopy 24 50 – 17 14 – – np 19
Haemorrhoidectomy 41 57 np 56 np – – np 46
Hysterectomy 56 np np 46 35 – – – 44
Inguinal herniorrhaphy 56 np np 46 23 – – np 42
Myringoplasty np 131 – 129 np – – np 137
Myringotomy np 24 – 47 np – – np 28
Prostatectomy np 56 – np np – – – 36
Septoplasty 294 41 – 123 110 – – – 79
Tonsillectomy 166 30 – 121 37 – – np 55
Total hip replacement 58 – – 76 167 – – – 76
Total knee replacement 56 – – 102 243 – – – 83
Varicose veins stripping & ligation 137 np np np np – – np 88
Total (e) 59 29 23 37 27 – – 112 37
90th percentile
Cataract extraction 349 133 – 191 307 – – 418 300
REPORT ON
GOVERNMENT
SERVICES 2017
PUBLIC
HOSPITALS
PAGE 20 of TABLE 12A.19

TABLE 12A.19
Table 12A.19
NSW Vic Qld WA SA Tas ACT (d) NT Aust (d)
Waiting times for elective surgery in public hospitals, by State and Territory, by procedure and hospital
peer group (days) (a), (b), (c)
Cholecystectomy 146 np 84 85 59 – – np 98
Coronary artery bypass graft – – – – – – – – –
Cystoscopy 84 173 – 95 46 – – np 84
Haemorrhoidectomy 317 113 np 213 np – – np 161
Hysterectomy 190 np np 166 101 – – – 133
Inguinal herniorrhaphy 314 np np 100 74 – – np 174
Myringoplasty np 499 – 265 np – – np 432
Myringotomy np 64 – 161 np – – np 118
Prostatectomy np 91 – np np – – – 107
Septoplasty 355 96 – 291 314 – – – 336
Tonsillectomy 317 74 – 296 185 – – np 271
Total hip replacement 182 – – 197 325 – – – 265
Total knee replacement 185 – – 200 342 – – – 308
Varicose veins stripping & ligation 258 np np np np – – np 279
Total (e) 318 139 90 164 212 – – 384 228
All hospitals (f)
50th percentile
Cataract extraction 221 35 57 41 99 273 107 143 83
Cholecystectomy 56 36 38 32 35 59 70 50 43
Coronary artery bypass graft 27 18 8 11 14 12 np – 14
Cystoscopy 29 20 22 19 27 32 29 42 22
Haemorrhoidectomy 67 58 50 48 30 np np 32 56
Hysterectomy 60 51 62 38 46 86 73 np 55
Inguinal herniorrhaphy 70 42 47 35 32 106 73 54 51
REPORT ON
GOVERNMENT
SERVICES 2017
PUBLIC
HOSPITALS
PAGE 21 of TABLE 12A.19

TABLE 12A.19
Table 12A.19
NSW Vic Qld WA SA Tas ACT (d) NT Aust (d)
Waiting times for elective surgery in public hospitals, by State and Territory, by procedure and hospital
peer group (days) (a), (b), (c)
Myringoplasty 309 121 79 85 np np np 243 137
Myringotomy 78 47 51 65 56 135 73 113 56
Prostatectomy 59 29 34 28 42 np np np 40
Septoplasty 322 131 84 183 170 np np np 214
Tonsillectomy 260 106 73 118 76 219 251 80 124
Total hip replacement 206 105 57 84 117 274 128 np 109
Total knee replacement 290 147 92 102 212 374 232 np 191
Varicose veins stripping & ligation 142 112 40 73 77 np 119 np 105
Total (e) 54 29 27 29 37 55 45 32 35
90th percentile
Cataract extraction 351 126 265 202 299 589 252 281 331
Cholecystectomy 229 118 86 97 92 359 264 204 137
Coronary artery bypass graft 93 83 38 56 60 60 np – 73
Cystoscopy 119 78 77 98 104 184 101 180 93
Haemorrhoidectomy 269 184 147 129 240 np np 267 208
Hysterectomy 288 225 182 104 145 316 175 np 217
Inguinal herniorrhaphy 334 149 107 110 111 481 240 149 242
Myringoplasty 364 432 321 279 np np np 792 383
Myringotomy 331 145 195 173 96 313 246 394 190
Prostatectomy 180 90 87 113 149 np np np 121
Septoplasty 363 422 331 357 358 np np np 370
Tonsillectomy 359 293 332 338 343 373 592 506 353
Total hip replacement 356 287 277 251 323 564 450 np 344
Total knee replacement 361 356 340 271 347 775 526 np 359
REPORT ON
GOVERNMENT
SERVICES 2017
PUBLIC
HOSPITALS
PAGE 22 of TABLE 12A.19

TABLE 12A.19
Table 12A.19
NSW Vic Qld WA SA Tas ACT (d) NT Aust (d)
Waiting times for elective surgery in public hospitals, by State and Territory, by procedure and hospital
peer group (days) (a), (b), (c)
Varicose veins stripping & ligation 347 546 196 304 295 np 305 np 357
Total (e) 330 177 147 148 210 424 245 217 253
2015-16
Principal referral and Women's and children's hospitals
50th percentile
Cataract extraction 140 69 63 75 174 137 na 180 89
Cholecystectomy 49 26 38 29 45 103 na 55 39
Coronary artery bypass graft 27 19 7 7 13 32 na – 13
Cystoscopy 33 19 26 34 41 28 na 31 26
Haemorrhoidectomy 73 71 70 np np np na 30 68
Hysterectomy 37 36 29 30 29 80 na np 34
Inguinal herniorrhaphy 47 33 52 24 56 167 na np 44
Myringoplasty 317 np 104 np np np na np 203
Myringotomy 76 39 64 64 67 102 na 149 64
Prostatectomy 60 29 38 40 76 np na np 43
Septoplasty 302 190 169 np 245 np na np 252
Tonsillectomy 266 70 120 86 89 142 na 83 108
Total hip replacement 188 95 60 108 85 126 na np 96
Total knee replacement 307 122 85 142 163 163 na np 162
Varicose veins stripping & ligation 102 153 45 np 83 np na np 96
Total (e) 35 32 28 28 40 71 na 27 32
90th percentile
Cataract extraction 261 158 334 148 316 248 na 331 299
REPORT ON
GOVERNMENT
SERVICES 2017
PUBLIC
HOSPITALS
PAGE 23 of TABLE 12A.19

TABLE 12A.19
Table 12A.19
NSW Vic Qld WA SA Tas ACT (d) NT Aust (d)
Waiting times for elective surgery in public hospitals, by State and Territory, by procedure and hospital
peer group (days) (a), (b), (c)
Cholecystectomy 207 91 88 112 88 538 na 186 133
Coronary artery bypass graft 89 80 48 26 39 105 na – 70
Cystoscopy 111 82 81 162 115 221 na 239 105
Haemorrhoidectomy 365 198 313 np np np na 325 315
Hysterectomy 252 243 121 111 110 488 na np 193
Inguinal herniorrhaphy 327 117 186 110 113 596 na np 258
Myringoplasty 379 np 350 np np np na np 393
Myringotomy 257 113 253 158 114 252 na 331 204
Prostatectomy 170 113 87 146 140 np na np 125
Septoplasty 365 386 354 np 366 np na np 376
Tonsillectomy 363 215 336 346 381 300 na 377 352
Total hip replacement 362 241 220 348 273 276 na np 343
Total knee replacement 365 357 304 409 318 357 na np 363
Varicose veins stripping & ligation 346 361 338 np 365 np na np 353
Total (e) 283 172 161 150 212 399 na 244 215
Public acute group A hospitals
50th percentile
Cataract extraction 279 25 67 36 135 453 na 114 131
Cholecystectomy 61 35 45 25 54 74 na np 45
Coronary artery bypass graft – np – – – – na – np
Cystoscopy 28 19 24 21 42 37 na np 23
Haemorrhoidectomy 70 51 57 33 np np na np 55
Hysterectomy 77 52 66 40 86 145 na np 67
Inguinal herniorrhaphy 83 47 56 31 55 93 na np 57
REPORT ON
GOVERNMENT
SERVICES 2017
PUBLIC
HOSPITALS
PAGE 24 of TABLE 12A.19

TABLE 12A.19
Table 12A.19
NSW Vic Qld WA SA Tas ACT (d) NT Aust (d)
Waiting times for elective surgery in public hospitals, by State and Territory, by procedure and hospital
peer group (days) (a), (b), (c)
Myringoplasty 338 106 111 np np np na np 174
Myringotomy 66 63 40 124 np np na np 49
Prostatectomy 62 28 34 35 51 np na – 40
Septoplasty 333 155 96 np 341 np na np 226
Tonsillectomy 274 108 63 167 174 257 na np 142
Total hip replacement 252 127 66 71 160 263 na np 123
Total knee replacement 313 154 89 82 266 427 na np 197
Varicose veins stripping & ligation 117 125 92 36 150 np na np 113
Total (e) 67 27 31 34 55 76 na 26 40
90th percentile
Cataract extraction 357 128 293 155 335 621 na 209 354
Cholecystectomy 281 117 108 64 103 287 na np 149
Coronary artery bypass graft – np – – – – na – np
Cystoscopy 128 77 77 141 111 342 na np 94
Haemorrhoidectomy 317 180 215 90 np np na np 207
Hysterectomy 319 213 196 106 362 365 na np 259
Inguinal herniorrhaphy 346 154 166 83 203 384 na np 259
Myringoplasty 383 363 320 np np np na np 362
Myringotomy 347 169 218 322 np np na np 251
Prostatectomy 259 106 87 97 159 np na – 126
Septoplasty 365 548 317 np 412 np na np 379
Tonsillectomy 361 308 280 348 399 629 na np 356
Total hip replacement 358 337 294 176 372 489 na np 352
Total knee replacement 365 377 333 269 389 672 na np 364
REPORT ON
GOVERNMENT
SERVICES 2017
PUBLIC
HOSPITALS
PAGE 25 of TABLE 12A.19

TABLE 12A.19
Table 12A.19
NSW Vic Qld WA SA Tas ACT (d) NT Aust (d)
Waiting times for elective surgery in public hospitals, by State and Territory, by procedure and hospital
peer group (days) (a), (b), (c)
Varicose veins stripping & ligation 352 378 335 219 348 np na np 352
Total (e) 344 190 169 168 306 530 na 146 292
Public acute group B hospitals
50th percentile
Cataract extraction 279 23 83 32 117 328 na – 195
Cholecystectomy 57 26 50 30 21 np na – 41
Coronary artery bypass graft – – – – – – na – –
Cystoscopy 34 20 35 9 25 41 na – 20
Haemorrhoidectomy 57 43 70 26 np np na – 47
Hysterectomy 77 62 71 41 30 np na – 58
Inguinal herniorrhaphy 75 35 64 36 20 np na – 55
Myringoplasty np np np np np np na – 107
Myringotomy np 75 np 60 np – na – 62
Prostatectomy 69 35 – 23 np – na – 37
Septoplasty 318 146 np 170 np – na – 226
Tonsillectomy 195 123 np 112 np np na – 128
Total hip replacement 234 204 62 69 np – na – 159
Total knee replacement 276 266 90 96 164 – na – 224
Varicose veins stripping & ligation 184 38 np np np np na – 79
Total (e) 78 29 38 26 27 63 na – 44
90th percentile
Cataract extraction 344 86 347 195 294 417 na – 343
Cholecystectomy 209 84 141 99 64 np na – 136
Coronary artery bypass graft – – – – – – na – –
REPORT ON
GOVERNMENT
SERVICES 2017
PUBLIC
HOSPITALS
PAGE 26 of TABLE 12A.19

TABLE 12A.19
Table 12A.19
NSW Vic Qld WA SA Tas ACT (d) NT Aust (d)
Waiting times for elective surgery in public hospitals, by State and Territory, by procedure and hospital
peer group (days) (a), (b), (c)
Cystoscopy 111 74 79 80 81 174 na – 82
Haemorrhoidectomy 217 148 308 119 np np na – 159
Hysterectomy 329 160 189 108 77 np na – 192
Inguinal herniorrhaphy 304 104 182 106 62 np na – 208
Myringoplasty np np np np np np na – 349
Myringotomy np 153 np 109 np – na – 141
Prostatectomy 309 89 – 114 np – na – 121
Septoplasty 358 310 np 359 np – na – 355
Tonsillectomy 335 315 np 341 np np na – 331
Total hip replacement 350 444 216 244 np – na – 348
Total knee replacement 347 449 236 364 288 – na – 349
Varicose veins stripping & ligation 349 249 np np np np na – 340
Total (e) 331 154 169 132 194 379 na – 289
Other hospitals
50th percentile
Cataract extraction 234 57 57 36 70 – na np 69
Cholecystectomy 39 84 34 41 19 – na np 40
Coronary artery bypass graft – – – – – – na – –
Cystoscopy 27 np np 28 13 – na np 23
Haemorrhoidectomy 44 76 np 55 np – na np 48
Hysterectomy 53 np 51 60 34 – na – 48
Inguinal herniorrhaphy 55 75 32 50 21 – na np 44
Myringoplasty np 211 – 127 np – na np 146
Myringotomy np 28 np 35 np – na np 31
REPORT ON
GOVERNMENT
SERVICES 2017
PUBLIC
HOSPITALS
PAGE 27 of TABLE 12A.19

TABLE 12A.19
Table 12A.19
NSW Vic Qld WA SA Tas ACT (d) NT Aust (d)
Waiting times for elective surgery in public hospitals, by State and Territory, by procedure and hospital
peer group (days) (a), (b), (c)
Prostatectomy np 76 np np 13 – na – 43
Septoplasty 267 37 np 125 119 – na np 59
Tonsillectomy 160 39 np 118 68 – na np 68
Total hip replacement 48 – – 77 190 – na – 69
Total knee replacement 62 – np 110 236 – na – 89
Varicose veins stripping & ligation 163 np np np np – na np 106
Total (e) 58 43 27 40 27 – na 92 42
90th percentile
Cataract extraction 351 154 153 203 285 – na np 298
Cholecystectomy 134 112 97 114 55 – na np 112
Coronary artery bypass graft – – – – – – na – –
Cystoscopy 97 np np 98 54 – na np 88
Haemorrhoidectomy 216 268 np 223 np – na np 217
Hysterectomy 247 np 115 129 85 – na – 127
Inguinal herniorrhaphy 268 172 113 168 92 – na np 174
Myringoplasty np 635 – 294 np – na np 549
Myringotomy np 90 np 198 np – na np 126
Prostatectomy np 132 np np 54 – na – 129
Septoplasty 465 87 np 314 334 – na np 316
Tonsillectomy 314 90 np 316 291 – na np 286
Total hip replacement 197 – – 268 349 – na – 308
Total knee replacement 232 – np 286 353 – na – 328
Varicose veins stripping & ligation 311 np np np np – na np 288
Total (e) 313 159 105 193 215 – na 422 233
REPORT ON
GOVERNMENT
SERVICES 2017
PUBLIC
HOSPITALS
PAGE 28 of TABLE 12A.19

TABLE 12A.19
Table 12A.19
NSW Vic Qld WA SA Tas ACT (d) NT Aust (d)
Waiting times for elective surgery in public hospitals, by State and Territory, by procedure and hospital
peer group (days) (a), (b), (c)
All hospitals
50th percentile
Cataract extraction 240 56 64 37 119 301 na 158 93
Cholecystectomy 56 31 43 29 39 83 na 43 42
Coronary artery bypass graft 27 19 7 7 13 32 na – 13
Cystoscopy 30 20 24 24 29 32 na 38 23
Haemorrhoidectomy 63 55 59 37 31 np na 37 54
Hysterectomy 62 48 54 36 45 110 na np 52
Inguinal herniorrhaphy 69 40 55 35 34 110 na 55 52
Myringoplasty 317 154 109 90 np np na 202 173
Myringotomy 69 52 50 63 57 105 na 117 57
Prostatectomy 62 32 35 33 41 np na np 42
Septoplasty 317 123 97 173 273 383 na np 209
Tonsillectomy 253 87 80 111 87 180 na 58 120
Total hip replacement 212 115 63 78 144 178 na np 114
Total knee replacement 290 148 88 94 222 299 na np 188
Varicose veins stripping & ligation 135 121 58 61 80 np na np 104
Total (e) 55 30 29 30 40 72 na 29 37
90th percentile
Cataract extraction 349 153 330 184 310 562 na 342 334
Cholecystectomy 232 103 100 87 90 414 na 170 139
Coronary artery bypass graft 89 80 48 26 39 105 na – 70
Cystoscopy 116 79 78 124 100 260 na 232 95
Haemorrhoidectomy 310 175 226 152 91 np na 317 225
REPORT ON
GOVERNMENT
SERVICES 2017
PUBLIC
HOSPITALS
PAGE 29 of TABLE 12A.19

TABLE 12A.19
Table 12A.19
NSW Vic Qld WA SA Tas ACT (d) NT Aust (d)
Waiting times for elective surgery in public hospitals, by State and Territory, by procedure and hospital
peer group (days) (a), (b), (c)
Hysterectomy 296 210 164 111 187 399 na np 216
Inguinal herniorrhaphy 327 132 163 105 111 477 na 255 233
Myringoplasty 378 505 346 317 np np na 865 382
Myringotomy 312 142 226 202 117 257 na 343 196
Prostatectomy 201 110 87 115 139 np na np 125
Septoplasty 364 366 332 344 387 700 na np 365
Tonsillectomy 361 280 310 342 368 447 na 279 350
Total hip replacement 356 328 270 246 355 459 na np 348
Total knee replacement 362 383 324 333 365 659 na np 361
Varicose veins stripping & ligation 347 358 336 249 363 np na np 348
Total (e) 328 174 163 161 233 452 na 229 260
(a)
(b)
(c)
(d)
(e)
(f)
Source:
Other hospitals data includes hospitals categorised as peer groups not observed in individual peer group breakdowns (that is, not Principal referral and
Women's and children's hospitals, Public acute group A or Public acute group B hospitals).
AIHW National Elective Surgery Waiting Times Data Collection.
For more information on data quality, including collection methodologies and data limitations, see METeOR on the AIHW website.
The data presented for this indicator are sourced from the National Elective Surgery Waiting Times Data Collection.
Data are suppressed where there are fewer than 100 elective surgery admissions in the category.
Total includes all removals for elective surgery procedures, including but not limited to the procedures listed above.
Data for the ACT were not available at the time of data supply and have not been included in the calculation of Australian waiting times for 2015-16.
np Not published. – Nil or rounded to zero. na Not available.
REPORT ON
GOVERNMENT
SERVICES 2017
PUBLIC
HOSPITALS
PAGE 30 of TABLE 12A.19
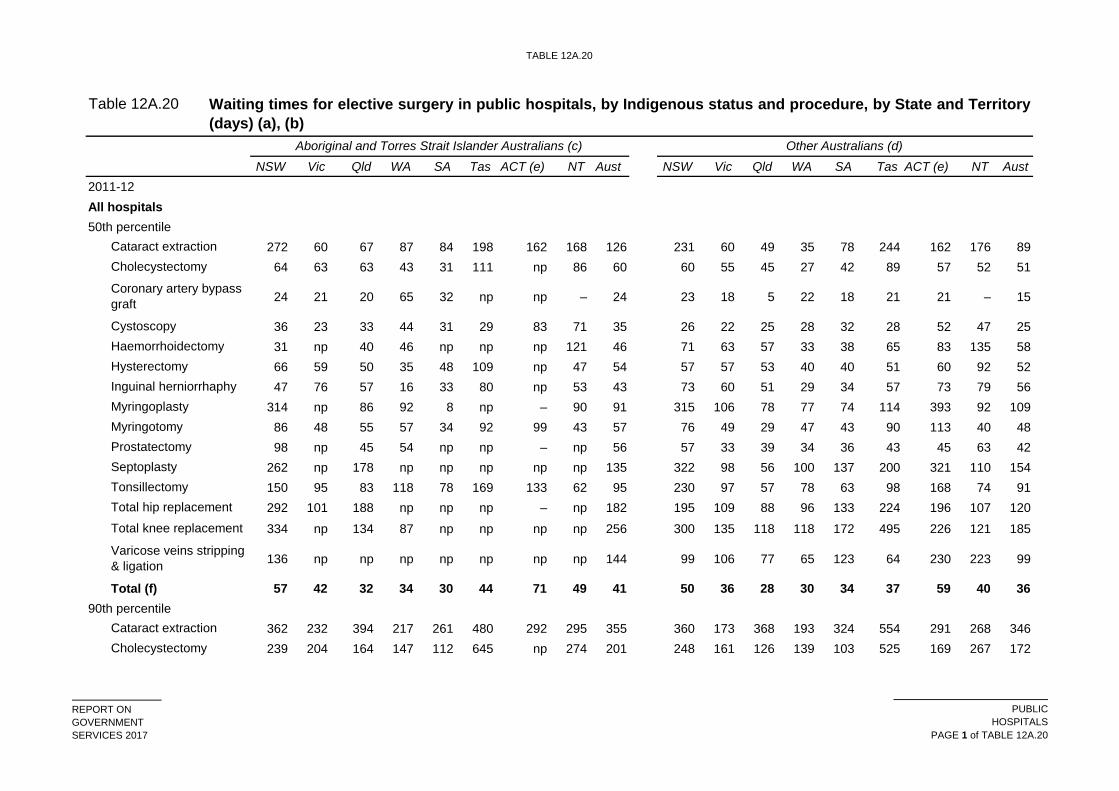
TABLE 12A.20
Table 12A.20
NSW Vic Qld WA SA Tas ACT (e) NT Aust NSW Vic Qld WA SA Tas ACT (e) NT Aust
2011-12
All hospitals
50th percentile
272 60 67 87 84 198 162 168 126 231 60 49 35 78 244 162 176 89
64 63 63 43 31 111 np 86 60 60 55 45 27 42 89 57 52 51
24 21 20 65 32 np np – 24 23 18 5 22 18 21 21 – 15
36 23 33 44 31 29 83 71 35 26 22 25 28 32 28 52 47 25
31 np 40 46 np np np 121 46 71 63 57 33 38 65 83 135 58
66 59 50 35 48 109 np 47 54 57 57 53 40 40 51 60 92 52
47 76 57 16 33 80 np 53 43 73 60 51 29 34 57 73 79 56
314 np 86 92 8 np – 90 91 315 106 78 77 74 114 393 92 109
86 48 55 57 34 92 99 43 57 76 49 29 47 43 90 113 40 48
98 np 45 54 np np – np 56 57 33 39 34 36 43 45 63 42
262 np 178 np np np np np 135 322 98 56 100 137 200 321 110 154
150 95 83 118 78 169 133 62 95 230 97 57 78 63 98 168 74 91
292 101 188 np np np – np 182 195 109 88 96 133 224 196 107 120
334 np 134 87 np np np np 256 300 135 118 118 172 495 226 121 185
136 np np np np np np np 144 99 106 77 65 123 64 230 223 99
Total (f) 57 42 32 34 30 44 71 49 41 50 36 28 30 34 37 59 40 36
90th percentile
362 232 394 217 261 480 292 295 355 360 173 368 193 324 554 291 268 346
239 204 164 147 112 645 np 274 201 248 161 126 139 103 525 169 267 172
Aboriginal and Torres Strait Islander Australians (c) Other Australians (d)
Waiting times for elective surgery in public hospitals, by Indigenous status and procedure, by State and Territory
(days) (a), (b)
Cataract extraction
Cholecystectomy
Coronary artery bypass
graft
Haemorrhoidectomy
Total knee replacement
Varicose veins stripping
& ligation
Hysterectomy
Inguinal herniorrhaphy
Myringoplasty
Cholecystectomy
Septoplasty
Tonsillectomy
Total hip replacement
Cystoscopy
Myringotomy
Prostatectomy
Cataract extraction
REPORT ON
GOVERNMENT
SERVICES 2017
PUBLIC
HOSPITALS
PAGE 1 of TABLE 12A.20

TABLE 12A.20
Table 12A.20
NSW Vic Qld WA SA Tas ACT (e) NT Aust NSW Vic Qld WA SA Tas ACT (e) NT Aust
Aboriginal and Torres Strait Islander Australians (c) Other Australians (d)
Waiting times for elective surgery in public hospitals, by Indigenous status and procedure, by State and Territory
(days) (a), (b)
86 36 75 181 131 np np – 104 85 84 55 61 78 73 71 – 75
101 120 97 188 83 134 138 194 131 102 100 96 158 93 135 224 157 107
Haemorrhoidectomy 174 np 127 112 np np np 234 195 304 262 163 182 122 797 314 227 246
283 184 138 93 98 217 np 145 175 306 171 167 123 176 198 229 162 205
325 448 208 148 359 331 np 156 265 338 173 147 151 141 524 198 330 270
376 np 323 263 296 np – 400 349 376 352 286 238 302 565 529 381 365
331 112 137 172 163 180 280 131 161 322 141 102 113 98 197 270 105 135
191 np 169 77 np np – np 169 183 185 139 139 88 106 188 129 160
365 np 326 np np np np np 360 372 367 296 358 316 601 543 413 369
363 328 290 336 327 373 267 280 354 370 327 223 238 254 331 330 320 355
372 281 289 np np np – np 378 364 300 301 266 335 660 441 239 356
378 np 328 328 np np np np 377 370 352 361 342 362 868 488 477 370
352 np np np np np np np 358 342 384 349 379 363 667 627 562 361
Total (f) 339 232 177 169 162 352 286 248 260 336 186 150 157 194 348 285 219 247
2012-13
All hospitals
50th percentile
Cataract extraction 269 np 80 76 np np np 174 140 238 52 43 44 81 277 157 150 88
Cholecystectomy 55 np 39 np np np np np 48 56 60 46 29 30 70 66 56 50
np np np np np np – – 15 28 19 8 13 15 43 np – 16
Cystoscopy 34 np 27 30 np np np np 30 25 21 24 22 30 34 34 48 23
Coronary artery bypass
graft
Varicose veins stripping
& ligation
Septoplasty
Cystoscopy
Hysterectomy
Prostatectomy
Total hip replacement
Tonsillectomy
Inguinal herniorrhaphy
Coronary artery bypass
graft
Myringoplasty
Myringotomy
Total knee replacement
REPORT ON
GOVERNMENT
SERVICES 2017
PUBLIC
HOSPITALS
PAGE 2 of TABLE 12A.20

TABLE 12A.20
Table 12A.20
NSW Vic Qld WA SA Tas ACT (e) NT Aust NSW Vic Qld WA SA Tas ACT (e) NT Aust
Aboriginal and Torres Strait Islander Australians (c) Other Australians (d)
Waiting times for elective surgery in public hospitals, by Indigenous status and procedure, by State and Territory
(days) (a), (b)
Haemorrhoidectomy np np np np np np np np np 68 79 56 35 19 68 np 86 59
Hysterectomy np np 57 np np np np np 59 59 59 55 35 43 69 55 np 53
Inguinal herniorrhaphy 49 np np np np np np np 41 72 71 65 34 29 104 85 54 61
Myringoplasty np np np 97 np np – 150 121 311 132 82 83 np np np np 124
Myringotomy np np 53 39 np np np np 54 68 50 35 54 41 71 64 np 49
Prostatectomy np np np np np np – np np 54 28 36 31 36 np 65 np 39
Septoplasty np np np np np np np np 238 328 129 75 124 99 269 np np 196
Tonsillectomy 237 np 79 np np np np np 105 259 105 51 89 68 98 176 74 98
Total hip replacement np np np np np np – np 158 196 105 78 92 108 380 136 np 115
Total knee replacement np np np np np np np np 297 296 141 152 105 153 616 177 np 195
np np np np np – np np np 97 145 56 70 87 np 157 np 97
Total (f) 56 44 28 34 28 47 39 52 40 49 36 27 30 34 41 51 35 36
90th percentile
Cataract extraction 360 np 334 214 np np np 399 357 356 248 217 208 301 755 305 239 339
Cholecystectomy 303 np 167 np np np np np 197 234 188 139 112 90 399 217 190 181
np np np np np np – – 88 85 85 68 44 54 127 np – 76
Cystoscopy 111 np 108 99 np np np np 127 103 96 100 137 97 185 168 146 107
Haemorrhoidectomy np np np np np np np np np 310 284 211 121 90 750 np 222 257
Hysterectomy np np 168 np np np np np 240 315 213 172 120 130 237 189 np 217
Inguinal herniorrhaphy 284 np np np np np np np 225 338 232 181 120 119 636 235 145 286
Myringoplasty np np np 279 np np – 400 348 383 375 330 279 np np np np 367
Myringotomy np np 106 165 np np np np 177 337 170 102 128 95 251 254 np 139
Prostatectomy np np np np np np – np np 211 179 170 146 107 np 139 np 167
Septoplasty np np np np np np np np 399 378 571 377 390 330 584 np np 390
Varicose veins stripping
& ligation
Coronary artery bypass
graft
REPORT ON
GOVERNMENT
SERVICES 2017
PUBLIC
HOSPITALS
PAGE 3 of TABLE 12A.20

TABLE 12A.20
Table 12A.20
NSW Vic Qld WA SA Tas ACT (e) NT Aust NSW Vic Qld WA SA Tas ACT (e) NT Aust
Aboriginal and Torres Strait Islander Australians (c) Other Australians (d)
Waiting times for elective surgery in public hospitals, by Indigenous status and procedure, by State and Territory
(days) (a), (b)
Tonsillectomy 362 np 246 np np np np np 358 366 355 212 261 271 455 377 371 359
Total hip replacement np np np np np np – np 372 362 308 346 271 317 831 373 np 357
Total knee replacement np np np np np np np np 406 368 365 462 312 343 964 445 np 373
np np np np np – np np np 353 403 308 342 339 np 545 np 356
Total (f) 342 247 173 174 167 328 217 259 277 335 223 162 158 182 409 278 174 264
2013-14
All hospitals
50th percentile
Cataract extraction 242 np 70 55 np np np 133 112 231 41 48 42 78 170 125 110 81
Cholecystectomy 56 np 42 np np np np np 46 55 46 43 27 35 71 65 np 47
np np np np np np np – 17 26 21 6 20 21 17 np – 18
Cystoscopy 32 np 24 32 np np np np 29 27 21 24 18 31 31 29 49 23
Haemorrhoidectomy np np np np np np – np np 64 69 52 40 21 np np 61 59
Hysterectomy np np 64 np np np np np 57 55 62 57 33 47 69 65 np 52
Inguinal herniorrhaphy 58 np np np np np np np 45 69 56 58 35 33 84 59 42 56
Myringoplasty np np np 74 np np – 156 119 320 141 87 83 np np np np 134
Myringotomy np np 70 41 np np np np 59 71 63 42 57 35 72 76 np 54
Prostatectomy np np np np np np – np 64 61 33 41 26 41 np np np 43
Septoplasty np np np np np np np np np 325 136 98 135 138 np np np 218
Tonsillectomy 205 98 84 np np np np np 108 240 104 60 100 70 115 275 69 102
Total hip replacement np np np np np np np np 129 192 117 78 68 104 371 96 np 109
Total knee replacement np np np np np np np np 243 289 171 154 83 160 535 138 np 197
Varicose veins stripping
& ligation
Coronary artery bypass
graft
REPORT ON
GOVERNMENT
SERVICES 2017
PUBLIC
HOSPITALS
PAGE 4 of TABLE 12A.20

TABLE 12A.20
Table 12A.20
NSW Vic Qld WA SA Tas ACT (e) NT Aust NSW Vic Qld WA SA Tas ACT (e) NT Aust
Aboriginal and Torres Strait Islander Australians (c) Other Australians (d)
Waiting times for elective surgery in public hospitals, by Indigenous status and procedure, by State and Territory
(days) (a), (b)
np np np np np – np np np 121 125 65 79 61 np 75 np 97
Total (f) 54 39 32 31 30 54 55 54 42 49 35 28 29 35 45 45 34 36
90th percentile
Cataract extraction 359 np 335 183 np np np 378 349 352 213 311 192 310 716 302 231 335
Cholecystectomy 154 np 141 np np np np np 146 223 146 121 90 84 342 195 np 147
np np np np np np np – 77 79 91 93 63 81 74 np – 83
Cystoscopy 133 np 106 117 np np np np 140 106 90 102 102 99 140 126 188 101
Haemorrhoidectomy np np np np np np – np np 224 265 246 116 88 np np 160 224
Hysterectomy np np 168 np np np np np 197 268 251 166 104 145 224 205 np 212
Inguinal herniorrhaphy 339 np np np np np np np 281 335 194 166 105 104 446 205 134 249
Myringoplasty np np np 221 np np – 440 392 422 434 345 255 np np np np 383
Myringotomy np np 274 154 np np np np 232 325 196 171 180 87 182 200 np 187
Prostatectomy np np np np np np – np 151 165 192 147 91 98 np np np 157
Septoplasty np np np np np np np np np 365 449 384 360 336 np np np 379
Tonsillectomy 358 335 339 np np np np np 353 360 355 317 293 278 321 405 334 354
Total hip replacement np np np np np np np np 377 357 325 368 202 313 761 400 np 355
Total knee replacement np np np np np np np np 390 362 393 433 277 321 879 458 np 365
np np np np np – np np np 353 409 332 295 182 np 306 np 353
Total (f) 336 224 245 156 146 354 273 250 279 329 222 195 141 181 406 246 163 264
2014-15
All hospitals
50th percentile
Varicose veins stripping
& ligation
Coronary artery bypass
graft
Varicose veins stripping
& ligation
REPORT ON
GOVERNMENT
SERVICES 2017
PUBLIC
HOSPITALS
PAGE 5 of TABLE 12A.20

TABLE 12A.20
Table 12A.20
NSW Vic Qld WA SA Tas ACT (e) NT Aust NSW Vic Qld WA SA Tas ACT (e) NT Aust
Aboriginal and Torres Strait Islander Australians (c) Other Australians (d)
Waiting times for elective surgery in public hospitals, by Indigenous status and procedure, by State and Territory
(days) (a), (b)
Cataract extraction 245 np 82 78 np np np 160 142 221 35 56 41 100 273 107 127 83
Cholecystectomy 54 np 40 43 np np np np 46 56 36 38 30 34 59 70 39 43
np np np np np np np - 11 28 18 8 11 14 13 np - 14
Cystoscopy 29 18 23 18 np np np 54 26 29 20 22 19 27 34 29 39 22
Haemorrhoidectomy np np np np np np - np 68 67 58 50 48 30 np np 30 56
Hysterectomy np np 70 np np np np np 69 60 51 62 38 45 84 73 np 54
Inguinal herniorrhaphy 63 np np np np np np np 48 70 42 47 35 32 109 73 51 51
Myringoplasty np np np 68 np np np 245 149 307 121 81 107 np np np np 134
Myringotomy np np 51 62 np np np np 62 78 47 51 66 56 141 np np 55
Prostatectomy np np np np - np np - np 58 29 35 28 42 np np np 40
Septoplasty np np np np np np np np np 323 132 84 183 170 np np np 215
Tonsillectomy 201 102 78 np np np np np 111 265 106 73 120 77 219 266 70 124
Total hip replacement np np np np np np np np 151 206 105 57 84 117 275 128 np 109
Total knee replacement 314 np np np np np np np 263 289 147 92 102 214 373 233 np 190
np np np np np np np np np 142 112 40 73 77 np 117 np 105
Total (f) 61 36 30 35 33 60 44 49 42 53 29 27 29 37 55 45 29 35
90th percentile
Cataract extraction 355 np 303 233 np np np 358 345 351 126 264 200 299 588 252 238 331
Cholecystectomy 246 np 86 98 np np np np 166 229 118 87 97 92 358 264 140 136
np np np np np np np - 61 94 83 37 56 60 60 np - 74
Cystoscopy 153 65 76 115 np np np 200 132 117 78 77 98 104 185 101 177 92
Haemorrhoidectomy np np np np np np - np 282 271 183 148 127 240 np np 266 207
Varicose veins stripping
& ligation
Coronary artery bypass
graft
Coronary artery bypass
graft
REPORT ON
GOVERNMENT
SERVICES 2017
PUBLIC
HOSPITALS
PAGE 6 of TABLE 12A.20
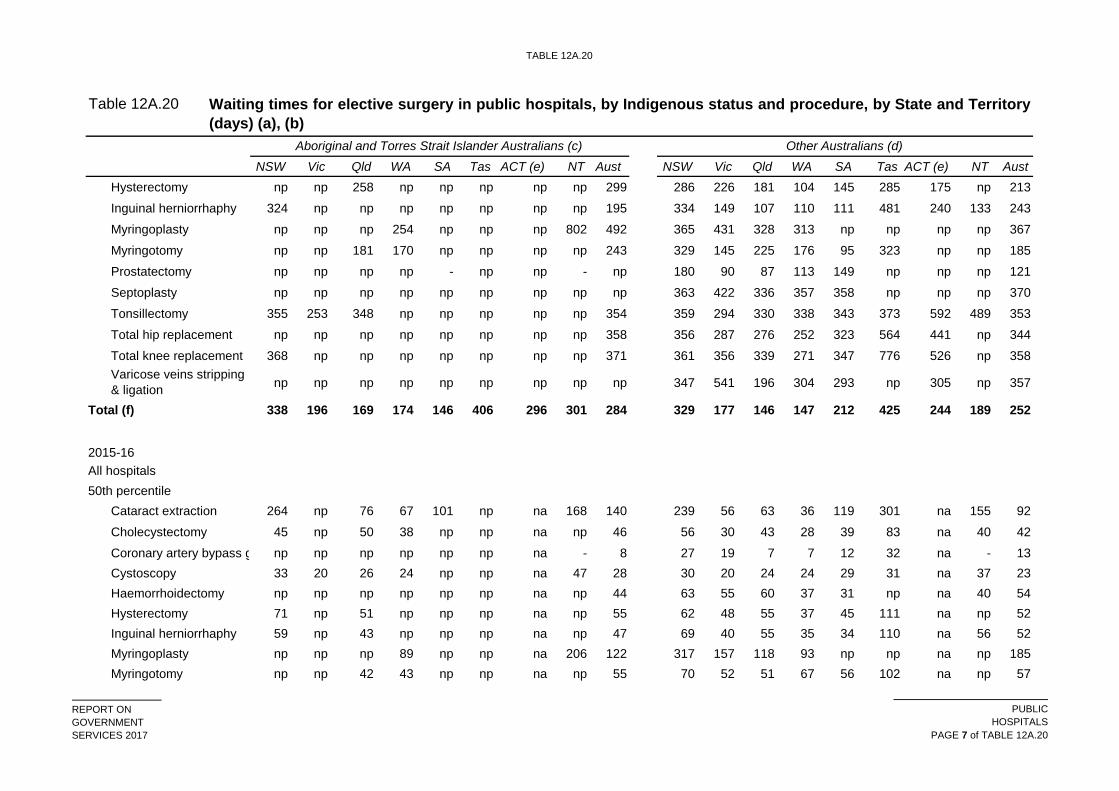
TABLE 12A.20
Table 12A.20
NSW Vic Qld WA SA Tas ACT (e) NT Aust NSW Vic Qld WA SA Tas ACT (e) NT Aust
Aboriginal and Torres Strait Islander Australians (c) Other Australians (d)
Waiting times for elective surgery in public hospitals, by Indigenous status and procedure, by State and Territory
(days) (a), (b)
Hysterectomy np np 258 np np np np np 299 286 226 181 104 145 285 175 np 213
Inguinal herniorrhaphy 324 np np np np np np np 195 334 149 107 110 111 481 240 133 243
Myringoplasty np np np 254 np np np 802 492 365 431 328 313 np np np np 367
Myringotomy np np 181 170 np np np np 243 329 145 225 176 95 323 np np 185
Prostatectomy np np np np - np np - np 180 90 87 113 149 np np np 121
Septoplasty np np np np np np np np np 363 422 336 357 358 np np np 370
Tonsillectomy 355 253 348 np np np np np 354 359 294 330 338 343 373 592 489 353
Total hip replacement np np np np np np np np 358 356 287 276 252 323 564 441 np 344
Total knee replacement 368 np np np np np np np 371 361 356 339 271 347 776 526 np 358
np np np np np np np np np 347 541 196 304 293 np 305 np 357
Total (f) 338 196 169 174 146 406 296 301 284 329 177 146 147 212 425 244 189 252
2015-16
All hospitals
50th percentile
Cataract extraction 264 np 76 67 101 np na 168 140 239 56 63 36 119 301 na 155 92
Cholecystectomy 45 np 50 38 np np na np 46 56 30 43 28 39 83 na 40 42
Coronary artery bypass graft np np np np np np na - 8 27 19 7 7 12 32 na - 13
Cystoscopy 33 20 26 24 np np na 47 28 30 20 24 24 29 31 na 37 23
Haemorrhoidectomy np np np np np np na np 44 63 55 60 37 31 np na 40 54
Hysterectomy 71 np 51 np np np na np 55 62 48 55 37 45 111 na np 52
Inguinal herniorrhaphy 59 np 43 np np np na np 47 69 40 55 35 34 110 na 56 52
Myringoplasty np np np 89 np np na 206 122 317 157 118 93 np np na np 185
Myringotomy np np 42 43 np np na np 55 70 52 51 67 56 102 na np 57
Varicose veins stripping
& ligation
REPORT ON
GOVERNMENT
SERVICES 2017
PUBLIC
HOSPITALS
PAGE 7 of TABLE 12A.20

TABLE 12A.20
Table 12A.20
NSW Vic Qld WA SA Tas ACT (e) NT Aust NSW Vic Qld WA SA Tas ACT (e) NT Aust
Aboriginal and Torres Strait Islander Australians (c) Other Australians (d)
Waiting times for elective surgery in public hospitals, by Indigenous status and procedure, by State and Territory
(days) (a), (b)
Prostatectomy np np np np np np na np np 62 32 35 33 42 np na np 42
Septoplasty np np np np np np na np 283 317 123 96 173 273 395 na np 207
Tonsillectomy 253 94 86 141 np np na np 140 254 87 79 109 88 183 na 47 119
Total hip replacement np np np np np np na np 133 211 115 63 78 145 178 na np 113
Total knee replacement 307 np np np np np na np 259 290 148 88 94 221 299 na np 186
Varicose veins stripping & ligationnp np np np np np na - np 135 120 57 60 80 np na np 104
Total (d) 61 36 34 33 33 79 na 46 43 55 30 29 30 40 71 na 26 37
90th percentile
Cataract extraction 355 np 336 230 307 np na 430 350 349 153 329 181 310 564 na 285 333
Cholecystectomy 174 np 113 106 np np na np 157 232 102 100 86 90 414 na 133 138
Coronary artery bypass graft np np np np np np na - 40 92 79 50 26 39 105 na - 71
Cystoscopy 113 84 81 101 np np na 232 139 116 79 78 124 100 258 na 232 95
Haemorrhoidectomy np np np np np np na np 307 312 175 226 152 91 np na 315 222
Hysterectomy 324 np 151 np np np na np 251 295 208 167 111 188 404 na np 216
Inguinal herniorrhaphy 309 np 178 np np np na np 249 327 132 162 105 111 489 na 263 233
Myringoplasty np np np 267 np np na 865 458 379 509 347 342 np np na np 376
Myringotomy np np 174 146 np np na np 236 316 143 233 225 119 257 na np 191
Prostatectomy np np np np np np na np np 202 110 87 115 139 np na np 125
Septoplasty np np np np np np na np 365 364 366 332 344 387 713 na np 365
Tonsillectomy 359 247 322 347 np np na np 352 361 281 309 342 366 461 na 280 350
Total hip replacement np np np np np np na np 346 356 329 267 244 356 465 na np 348
Total knee replacement 359 np np np np np na np 363 362 383 324 333 365 659 na np 361
Varicose veins stripping & ligationnp np np np np np na - np 347 358 338 250 363 np na np 348
Total (f) 340 195 198 179 195 409 na 310 294 328 174 162 160 234 455 na 198 259
REPORT ON
GOVERNMENT
SERVICES 2017
PUBLIC
HOSPITALS
PAGE 8 of TABLE 12A.20

TABLE 12A.20
Table 12A.20
NSW Vic Qld WA SA Tas ACT (e) NT Aust NSW Vic Qld WA SA Tas ACT (e) NT Aust
Aboriginal and Torres Strait Islander Australians (c) Other Australians (d)
Waiting times for elective surgery in public hospitals, by Indigenous status and procedure, by State and Territory
(days) (a), (b)
(a)
(b)
(c)
(d)
(e)
(f)
Source :
The quality of the data reported for Indigenous status in the National Elective Surgery Waiting Times Data Collection (NESWTDC) has not been formally assessed;
therefore, caution should be exercised when interpreting these data.
Data are suppressed where there are fewer than 100 elective surgery admissions in the category.
AIHW (unpublished) linked National Hospital Morbidity Database; AIHW (unpublished) National Elective Surgery Waiting Times Data Collection.
na Not available. np Not published. – Nil or rounded to zero.
Other Australians includes records for which the Indigenous status was Not reported.
Total includes all removals for elective surgery procedures, including but not limited to the procedures listed above.
Data for the ACT were not available at the time of data supply and have not been included in the calculation of Aust waiting times for 2015-16.
For more information on data quality, including collection methodologies and data limitations, see METeOR on the AIHW website.
REPORT ON
GOVERNMENT
SERVICES 2017
PUBLIC
HOSPITALS
PAGE 9 of TABLE 12A.20

TABLE 12A.21
Table 12A.21
NSW Vic Qld WA SA Tas ACT NT Aust
All hospitals
2010-11
50th percentile
Major cities 42 37 28 31 41 48 77 4 36
Inner regional 56 32 29 27 33 35 63 np 38
Outer regional 61 28 34 29 29 38 np 29 39
Remote 43 36 28 32 28 38 np 33 32
Very remote 27 32 35 27 26 55 np 50 35
90th percentile
Major cities 316 176 140 162 221 222 367 50 229
Inner regional 345 177 157 138 162 353 370 np 289
Outer regional 349 189 166 165 156 342 np 236 303
Remote 338 195 157 182 150 350 np 173 223
Very remote 233 182 185 156 151 425 np 278 221
2011-12
50th percentile
Major cities 46 37 28 30 38 np 59 8 36
Inner regional 58 35 28 28 32 37 66 np 38
Outer regional 65 29 32 31 30 39 46 40 36
Remote 38 35 27 29 26 31 np 39 29
Very remote 46 30 28 33 21 48 – 56 35
90th percentile
Major cities 322 188 147 161 210 np 283 320 232
Inner regional 349 182 143 152 215 384 291 np 287
Outer regional 350 179 182 160 147 304 290 236 267
Remote 341 216 166 137 119 269 np 174 166
Very remote 315 207 161 165 127 296 – 247 186
2012-13
50th percentile
Major cities 45 36 27 31 38 np 51 np 36
Inner regional 57 36 28 30 31 42 43 np 40
Outer regional 62 29 32 31 27 40 np 39 37
Remote 52 28 28 30 21 36 np 40 30
Very remote 62 np 28 30 16 np np 56 35
90th percentile
Major cities 326 224 161 160 194 np 269 np 248
Waiting times for elective surgery in public hospitals, by State
and Territory, by remoteness area (days) (a), (b), (c), (d)
REPORT ON
GOVERNMENT
SERVICES 2017
PUBLIC
HOSPITALS
PAGE 1 of TABLE 12A.21

TABLE 12A.21
Table 12A.21
NSW Vic Qld WA SA Tas ACT NT Aust
Waiting times for elective surgery in public hospitals, by State
and Territory, by remoteness area (days) (a), (b), (c), (d)
Inner regional 343 223 175 156 214 413 231 np 305
Outer regional 345 218 218 166 165 403 np 185 293
Remote 344 181 194 132 106 383 np 180 171
Very remote 341 np 214 173 119 np np 272 222
2013-14
50th percentile
Major cities 46 36 28 28 41 np 48 np 36
Inner regional 57 35 28 28 33 45 42 np 40
Outer regional 62 28 29 34 27 45 33 33 37
Remote 54 29 28 30 21 43 np 36 30
Very remote 72 np 30 35 19 np – 61 41
90th percentile
Major cities 322 226 190 142 182 np 249 np 249
Inner regional 336 209 166 120 208 401 238 np 294
Outer regional 340 212 265 182 167 406 220 168 295
Remote 350 258 221 133 118 297 np 176 178
Very remote 367 np 320 143 126 np – 261 229
2014-15
50th percentile
Major cities 49 29 27 28 43 np 42 np 35
Inner regional 62 31 29 28 34 56 31 np 40
Outer regional 66 28 28 35 28 54 30 30 38
Remote 58 35 29 32 24 52 np 35 31
Very remote 61 np 27 35 25 np np 56 36
90th percentile
Major cities 321 180 154 148 222 np 210 np 234
Inner regional 342 179 144 121 214 428 203 np 295
Outer regional 343 211 194 175 199 422 167 211 294
Remote 348 104 168 156 112 364 np 183 183
Very remote 336 np 227 160 130 np np 315 233
(a) The data presented for this indicator are sourced from linked records in the National Hospital Morbidity
Database and National Elective Surgery Waiting Times Data Collection. The linked records represent
about 97 per cent of all records in the National Elective Surgery Waiting Times Data Collection for 2010-
11 and 2011-12 and about 96 per cent of all records for 2012-13, 2013-14 and 2014-15. For the NT, a
higher number of records were identified in the National Hospital Morbidity Database than were reported
to the National Elective Surgery Waiting Times Data Collection.
REPORT ON
GOVERNMENT
SERVICES 2017
PUBLIC
HOSPITALS
PAGE 2 of TABLE 12A.21

TABLE 12A.21
Table 12A.21
NSW Vic Qld WA SA Tas ACT NT Aust
Waiting times for elective surgery in public hospitals, by State
and Territory, by remoteness area (days) (a), (b), (c), (d)
(b)
(c)
(d)
Source : AIHW (unpublished) linked National Hospital Morbidity Database and National Elective Surgery
Waiting Times Data Collection.
Disaggregation by remoteness area is by the patient's usual residence, not the location of hospital. Data
are reported by jurisdiction of hospitalisation, regardless of the jurisdiction of usual residence. Hence,
the data represent the waiting times for patients living in each remoteness area (regardless of their
jurisdiction of residence) in the reporting jurisdiction.
np Not published. – Nil or rounded to zero.
Data are suppressed where there are fewer than 100 elective surgery admissions in the category.
For more information on data quality, including collection methodologies and data limitations, see
METeOR on the AIHW website.
REPORT ON
GOVERNMENT
SERVICES 2017
PUBLIC
HOSPITALS
PAGE 3 of TABLE 12A.21

TABLE 12A.22
Table 12A.22
NSW Vic Qld WA SA Tas ACT NT Aust
All hospitals
2010-11
50th percentile
Quintile 1 52 41 30 29 40 37 61 42 41
Quintile 2 56 35 28 30 40 37 75 39 41
Quintile 3 42 38 29 29 37 34 72 29 35
Quintile 4 43 35 29 31 35 32 78 30 35
Quintile 5 28 30 25 29 35 np 73 34 30
90th percentile
Quintile 1 338 196 159 170 225 353 370 278 286
Quintile 2 343 180 153 163 211 336 379 237 297
Quintile 3 322 176 146 147 207 352 388 150 209
Quintile 4 319 175 145 168 173 323 367 235 214
Quintile 5 207 150 129 164 183 np 364 223 184
2011-12
50th percentile
Quintile 1 56 41 28 34 32 39 64.5 50 40
Quintile 2 59 37 28 29 36 35 52 45 41
Quintile 3 43 38 29 30 31 38 64 38 34
Quintile 4 45 34 28 30 34 36 65 36 34
Quintile 5 32 32 25 30 35 np 57 40 31
90th percentile
Quintile 1 343 200 154 178 192 322 283 254 285
Quintile 2 346 195 158 150 207 304 298 223 290
Quintile 3 321 185 151 155 176 430 305 186 210
Quintile 4 318 183 145 159 182 462 289 225 204
Quintile 5 215 156 142 161 170 np 277 229 184
2012-13
50th percentile
Quintile 1 56 40 29 29 34 41 37 50 41
Quintile 2 55 37 29 33 33 42 48 40 39
Quintile 3 47 36 28 30 33 40 52 40 35
Quintile 4 45 35 28 31 35 35 52 41 35
Quintile 5 35 29 24 29 32 38 49 37 31
90th percentile
Quintile 1 342 245 188 160 196 409 220 258 301
Quintile 2 340 224 186 167 176 387 261 175 282
Waiting times for elective surgery in public hospitals, by
State and Territory, by SEIFA IRSD quintiles (days) (a), (b),
(c), (d)
REPORT ON
GOVERNMENT
SERVICES 2017
PUBLIC
HOSPITALS
PAGE 1 of TABLE 12A.22

TABLE 12A.22
Table 12A.22
NSW Vic Qld WA SA Tas ACT NT Aust
Waiting times for elective surgery in public hospitals, by
State and Territory, by SEIFA IRSD quintiles (days) (a), (b),
(c), (d)
Quintile 3 335 221 154 155 176 451 289 177 246
Quintile 4 320 217 163 162 179 326 273 189 230
Quintile 5 273 203 154 152 167 305 256 170 210
2013-14
50th percentile
Quintile 1 56 39 29 29 35 47 38 54 42
Quintile 2 55 36 28 32 36 47 42 35 39
Quintile 3 48 36 28 29 34 42 47 34 35
Quintile 4 44 34 28 28 38 40 49 35 35
Quintile 5 36 29 25 28 33 38 44 31 31
90th percentile
Quintile 1 334 235 222 136 189 401 265 252 296
Quintile 2 335 222 207 148 185 430 238 167 280
Quintile 3 330 228 175 138 168 448 247 146 249
Quintile 4 317 216 182 149 169 292 255 173 229
Quintile 5 270 194 185 140 145 263 240 162 206
2014-15
50th percentile
Quintile 1 62 33 28 29 37 56 28 49 41
Quintile 2 58 32 29 33 37 58 34 34 39
Quintile 3 51 29 28 28 36 50 40 32 34
Quintile 4 48 28 28 28 41 49 43 29 33
Quintile 5 37 27 24 28 36.5 46 41 34 30
90th percentile
Quintile 1 336 189 168 148 212 428 171 291 290
Quintile 2 339 187 176 159 217 407 182 225 279
Quintile 3 329 184 149 146 203 486 213 167 236
Quintile 4 319 174 149 145 211 333 206 211 213
Quintile 5 274 156 113 142 174.5 271 212 210 194
(a) The data presented for this indicator are sourced from linked records in the National Hospital
Morbidity Database and National Elective Surgery Waiting Times Data Collection. The linked records
represent about 97 per cent of all records in the National Elective Surgery Waiting Times Data
Collection for 2010-11 and 2011-12 and about 96 per cent of all records for 2012-13, 2013-14 and
2014-15. For the NT, a higher number of records were identified in the National Hospital Morbidity
Database than were reported to the National Elective Surgery Waiting Times Data Collection.
REPORT ON
GOVERNMENT
SERVICES 2017
PUBLIC
HOSPITALS
PAGE 2 of TABLE 12A.22

TABLE 12A.22
Table 12A.22
NSW Vic Qld WA SA Tas ACT NT Aust
Waiting times for elective surgery in public hospitals, by
State and Territory, by SEIFA IRSD quintiles (days) (a), (b),
(c), (d)
(b)
(c)
(d)
Source: AIHW (unpublished) linked National Hospital Morbidity Database and National Elective
Surgery Waiting Times Data Collection.
Socio-Economic Indexes for Areas (SEIFA) quintiles are based on the ABS Index of Relative
Socio-Economic Disadvantage (IRSD), with quintile 1 being the most disadvantaged and quintile 5
being the least disadvantaged. Each SEIFA quintile represents approximately 20 per cent of the
national population, but does not necessarily represent 20 per cent of the population in each state or
territory. Disaggregation by SEIFA is by the patient's usual residence, not the location of the hospital.
Data are reported by jurisdiction of hospitalisation, regardless of the jurisdiction of usual residence.
Hence, the data represent the waiting times for patients in each SEIFA quintile (regardless of their
jurisdiction of residence) in the reporting jurisdiction.
Data are suppressed where there are fewer than 100 elective surgery admissions in the category.
np Not published.
For more information on data quality, including collection methodologies and data limitations, see
METeOR on the AIHW website.
REPORT ON
GOVERNMENT
SERVICES 2017
PUBLIC
HOSPITALS
PAGE 3 of TABLE 12A.22

TABLE 12A.23
Table 12A.23
NSW Vic Qld WA SA Tas ACT (b) NT
2006-07
Patients on waiting lists
Category 1 4.1 2.5 8.5 7.9 7.9 6.6 2.7 10.1
Category 2 28.3 43.9 39.3 34.7 24.6 49.6 50.2 41.6
Category 3 67.7 53.6 52.3 57.4 67.5 43.8 47.1 48.3
Total 100.0 100.0 100.1 100.0 100.0 100.0 100.0 100.0
Patients admitted from waiting lists
Category 1 33.2 24.5 38.1 33.0 33.8 42.2 29.7 47.7
Category 2 33.0 47.8 43.8 29.2 27.7 37.5 47.5 35.1
Category 3 33.8 27.7 18.1 37.8 38.5 20.3 22.8 17.2
Total 100.0 100.0 100.0 100.0 100.0 100.0 100.0 100.0
2007-08
Patients on waiting lists
Category 1 3.7 2.8 9.2 6.2 8.6 6.9 3.1 9.4
Category 2 22.1 47.4 42.1 34.2 23.8 48.4 53.7 43.2
Category 3 74.2 49.8 48.7 59.6 67.5 44.7 43.2 47.4
Total 100.0 100.0 100.0 100.0 100.0 100.0 100.0 100.0
Patients admitted from waiting lists
Category 1 30.1 26.1 38.6 31.8 35.8 44.5 28.7 42.7
Category 2 35.0 46.4 43.5 33.7 29.9 35.8 49.7 39.9
Category 3 34.9 27.5 17.9 34.5 34.3 19.7 21.6 17.4
Total 100.0 100.0 100.0 100.0 100.0 100.0 100.0 100.0
2008-09
Patients on waiting lists
Category 1 3.4 3.3 8.6 8.5 5.1 7.5 2.3 12.6
Category 2 17.7 47.3 46.1 35.5 23.3 54.5 54.0 47.2
Category 3 78.9 49.4 45.3 56.0 71.6 38.0 43.7 40.2
Total 100.0 100.0 100.0 100.0 100.0 100.0 100.0 100.0
Patients admitted from waiting lists
Category 1 28.3 27.6 39.6 30.6 33.2 36.6 28.3 45.6
Category 2 32.4 46.3 44.0 34.0 31.6 35.9 50.1 36.6
Category 3 39.3 26.1 16.4 35.4 35.1 27.5 21.6 17.8
Total 100.0 100.0 100.0 100.0 100.0 100.0 100.0 100.0
2009-10
Patients on waiting lists
Category 1 3.0 4.0 9.2 6.1 5.1 9.5 2.8 9.4
Category 2 16.6 46.3 53.7 34.2 23.4 53.7 53.6 38.2
Category 3 80.4 49.7 37.1 59.6 71.5 36.8 43.6 52.4
Total 100.0 100.0 100.0 100.0 100.0 100.0 100.0 100.0
Patients admitted from waiting lists
Classification of elective surgery patients, by clinical urgency
category (per cent) (a)
REPORT ON
GOVERNMENT
SERVICES 2017
PUBLIC
HOSPITALS
PAGE 1 of TABLE 12A.23

TABLE 12A.23
Table 12A.23
NSW Vic Qld WA SA Tas ACT (b) NT
Classification of elective surgery patients, by clinical urgency
category (per cent) (a)
Category 1 27.7 26.6 39.0 28.4 31.8 39.3 29.8 42.4
Category 2 31.6 48.1 44.3 35.7 34.5 40.9 49.7 39.4
Category 3 40.7 25.3 16.7 35.9 33.6 19.8 20.4 18.2
Total 100.0 100.0 100.0 100.0 100.0 100.0 99.9 100.0
2010-11
Patients on waiting lists
Category 1 3.1 4.0 10.1 6.4 6.4 9.8 4.1 7.7
Category 2 16.8 45.8 48.0 30.6 25.0 54.9 54.9 38.7
Category 3 80.2 50.2 41.9 62.9 68.6 35.3 41.0 53.6
Total 100.0 100.0 100.0 100.0 100.0 100.0 100.0 100.0
Patients admitted from waiting lists
Category 1 26.9 28.2 39.0 26.1 33.6 40.8 29.1 42.3
Category 2 32.3 47.6 45.6 35.3 34.2 42.5 48.6 38.3
Category 3 40.8 24.2 15.4 38.6 32.2 16.7 22.3 19.4
Total 100.0 100.0 100.0 100.0 100.0 100.0 100.0 100.0
2011-12
Patients on waiting lists
Category 1 2.8 3.5 8.9 5.5 5.0 6.2 3.5 4.7
Category 2 16.4 46.6 47.1 31.0 23.0 52.5 47.2 42.9
Category 3 80.8 49.9 44.0 63.5 72.0 41.3 49.3 52.4
Total 100.0 100.0 100.0 100.0 100.0 100.0 100.0 100.0
Patients admitted from waiting lists
Category 1 25.5 30.3 40.0 23.4 27.1 39.0 30.2 38.8
Category 2 33.2 46.9 44.6 34.8 33.3 44.0 48.6 41.4
Category 3 41.3 22.8 15.4 41.8 39.6 17.0 21.2 19.8
Total 100.0 100.0 100.0 100.0 100.0 100.0 100.0 100.0
2012-13
Patients on waiting lists 0.0 0.0 0.0 0.0 0.0 0.0 0.0 0.0
Category 1 2.6 3.6 5.5 4.4 5.1 6.0 4.2 4.8
Category 2 16.7 48.8 41.0 28.8 24.0 52.6 39.3 35.8
Category 3 80.7 47.6 53.5 66.7 70.9 41.4 56.5 59.4
Total 100.0 100.0 100.0 99.9 100.0 100.0 100.0 100.0
Patients admitted from waiting lists
Category 1 24.2 31.1 40.5 25.1 26.4 39.5 31.6 29.1
Category 2 32.4 46.5 43.7 35.0 35.7 40.6 44.8 49.3
Category 3 43.3 22.4 15.8 39.9 37.9 19.9 23.6 21.7
Total 99.9 100.0 100.0 100.0 100.0 100.0 100.0 100.1
REPORT ON
GOVERNMENT
SERVICES 2017
PUBLIC
HOSPITALS
PAGE 2 of TABLE 12A.23

TABLE 12A.23
Table 12A.23
NSW Vic Qld WA SA Tas ACT (b) NT
Classification of elective surgery patients, by clinical urgency
category (per cent) (a)
2013-14
Patients on waiting lists
Category 1 2.5 4.1 7.6 5.1 4.2 5.7 4.4 5.3
Category 2 16.0 50.1 34.9 27.7 22.4 50.9 35.9 41.0
Category 3 81.5 45.8 57.5 67.1 73.4 43.4 59.7 53.7
Total 100.0 100.0 100.0 99.9 100.0 100.0 100.0 100.0
Patients admitted from waiting lists
Category 1 23.5 28.9 39.0 24.9 25.5 38.2 29.3 29.8
Category 2 33.2 47.7 41.8 37.1 36.0 42.0 44.5 48.5
Category 3 43.3 23.3 19.1 38.0 38.5 19.8 26.3 21.7
Total 100.0 99.9 99.9 100.0 100.0 100.0 100.0 100.0
2014-15
Patients on waiting lists
Category 1 2.5 4.4 2.7 5.4 3.7 5.5 4.0 4.3
Category 2 15.9 49.6 29.0 28.5 22.5 49.0 35.4 39.7
Category 3 81.6 46.0 68.2 66.0 73.7 45.5 60.6 56.1
Total 100.0 100.0 99.9 99.9 99.9 100.0 100.0 100.1
Patients admitted from waiting lists
Category 1 22.6 30.3 39.7 25.5 25.9 37.4 32.5 37.0
Category 2 33.0 46.9 41.9 34.7 35.4 42.1 41.8 44.6
Category 3 44.3 22.8 18.4 39.8 38.7 20.5 25.7 18.5
Total 99.9 100.0 100.0 100.0 100.0 100.0 100.0 100.1
2015-16
Patients on waiting lists
Category 1 2.4 4.7 5.9 5.9 4.3 6.6 na 4.9
Category 2 15.4 47.7 27.4 24.9 21.8 37.5 na 32.9
Category 3 82.2 47.6 66.7 69.2 73.8 55.9 na 62.2
Total 100.0 100.0 100.0 100.0 99.9 100.0 na 100.0
Patients admitted from waiting lists
Category 1 22.4 29.8 36.2 24.6 25.6 31.9 na 37.5
Category 2 33.3 46.3 40.0 34.7 36.6 41.7 na 44.0
Category 3 44.3 23.9 23.8 40.7 37.8 26.4 na 18.5
Total 100.0 100.0 100.0 100.0 100.0 100.0 na 100.0
(a)
(b)
Source :
Data for 2010-11 and prior years are were sourced from state and territory governments. Data for
2011-12 and after were sourced from the AIHW. Some differences in data may occur between these
periods due to the different data sources.
State and Territory governments (unpublished); AIHW (unpublished) National Elective Surgery
Waiting Times Data Collection.
Data for the ACT were not available at the time of data supply and have not been included in the
totals for 2015-16.
na Not available.
REPORT ON
GOVERNMENT
SERVICES 2017
PUBLIC
HOSPITALS
PAGE 3 of TABLE 12A.23

TABLE 12A.24
Table 12A.24
2006-07 2007-08 2008-09 2009-10 2010-11 2011-12 2012-13 2013-14 2014-15 2015-16
Per cent of patients on waiting lists with extended waits (d)
Category 1 (over 30 days) 5.1 1.5 3.3 0.1 0.3 1.2 0.1 0.3 0.4 –
Category 2 (over 90 days) 28.9 16.2 7.4 1.2 0.4 0.9 1.7 1.5 2.0 0.2
Category 3 (over 12 months) 0.2 0.1 1.3 2.0 0.2 0.3 0.9 0.6 1.0 0.2
All patients 8.5 3.7 2.5 1.8 0.2 0.4 1.0 0.7 1.1 0.2
Per cent of patients admitted from waiting lists with extended waits
Category 1 (over 30 days) 12.9 7.9 7.2 7.9 7.4 6.3 2.6 0.3 0.2 0.2
Category 2 (over 90 days) 25.5 24.3 14.5 15.9 10.3 9.8 6.1 3.1 2.5 2.9
Category 3 (over 12 months) 4.4 4.6 6.4 12.1 8.8 8.4 6.5 4.1 3.5 4.4
All patients 14.2 12.5 9.2 12.1 8.9 8.3 5.4 2.9 2.4 2.9
Waiting time data coverage
Per cent of elective surgery separations 100.0 100.0 100.0 100.0 100.0 100.0 100.0 100.0 100.0 100.0
(a)
(b)
(c)
(d)
Source :
NSW elective surgery waiting times by clinical urgency category, public hospitals (per cent) (a), (b), (c)
Data show patients on the waiting list at 30 June.
NSW Government (unpublished); AIHW (unpublished) National Elective Surgery Waiting Times Data Collection.
Waiting times are counted as the time waited in the most recent urgency category plus any time waited in more urgent categories, for example time in
category 2, plus time spent previously in category 1.
Before 2015–16, there was no specified or agreed desirable wait for category 3 patients, so the term ‘extended wait’ was used for category 3 patients
waiting longer than 12 months for elective surgery, as well as for category 1 and 2 patients waiting longer than the agreed desirable waits of 30 and 90 days
respectively. From 2015–16, the desirable wait for category 3 patients is defined as within 365 days.
Data for 2010-11 and prior years are were sourced from the NSW Government. Data for 2011-12 and after were sourced from the AIHW. Some differences
in data may occur between these periods due to the different data sources.
– Nil or rounded to zero.
REPORT ON
GOVERNMENT
SERVICES 2017
PUBLIC
HOSPITALS
PAGE 1 of TABLE 12A.24

TABLE 12A.25
Table 12A.25
2006-07 2007-08 2008-09 2009-10 2010-11 2011-12 2012-13 2013-14 2014-15 2015-16
Per cent of patients on waiting lists with extended waits (d)
Category 1 (over 30 days) – – – – – – – – – –
Category 2 (over 90 days) 34.0 35.1 32.9 29.9 28.0 34.0 37.5 34.7 32.3 28.2
Category 3 (over 12 months) 10.5 9.3 9.3 6.8 6.8 9.4 17.0 14.0 7.8 7.3
All patients 20.5 21.3 20.3 17.4 16.3 20.6 26.4 23.8 19.6 16.9
Per cent of patients admitted from waiting lists with extended waits
Category 1 (over 30 days) – – – – – – – – – –
Category 2 (over 90 days) 25.3 29.9 27.0 27.0 25.4 27.7 34.3 31.4 24.2 22.9
Category 3 (over 12 months) 8.5 9.7 7.9 8.0 7.4 8.5 11.0 9.9 7.4 6.3
All patients 14.5 16.5 14.6 15.1 13.9 14.9 18.4 17.3 13.0 12.1
Waiting time data coverage
Per cent of elective surgery separations 77.9 78.1 79.2 79.6 78.0 78.9 79.0 79.6 79.5 80.7
(a)
(b)
(c)
(d)
Source :
Victorian elective surgery waiting times by clinical urgency category, public hospitals (per cent) (a), (b), (c)
Data show patients on the waiting list at 30 June.
– Nil or rounded to zero.
Victorian Government (unpublished); AIHW (unpublished) National Elective Surgery Waiting Times Data Collection.
Waiting times are counted as the time waited in the most recent urgency category plus any time waited in more urgent categories, for example time in category
2, plus time spent previously in category 1.
Before 2015–16, there was no specified or agreed desirable wait for category 3 patients, so the term ‘extended wait’ was used for category 3 patients waiting
longer than 12 months for elective surgery, as well as for category 1 and 2 patients waiting longer than the agreed desirable waits of 30 and 90 days
respectively. From 2015–16, the desirable wait for category 3 patients is defined as within 365 days.
Data for 2010-11 and prior years are were sourced from the Victorian Government. Data for 2011-12 and after were sourced from the AIHW. Some differences
in data may occur between these periods due to the different data sources.
REPORT ON
GOVERNMENT
SERVICES 2017
PUBLIC
HOSPITALS
PAGE 1 of TABLE 12A.25

TABLE 12A.26
Table 12A.26
2006-07 2007-08 2008-09 2009-10 2010-11 2011-12 2012-13 2013-14 2014-15 2015-16
Per cent of patients on waiting lists with extended waits (e)
Category 1 (over 30 days) 6.4 8.0 6.4 8.4 10.4 7.8 7.2 1.1 0.5 0.2
Category 2 (over 90 days) 20.5 21.4 22.1 28.2 21.1 26.6 33.5 7.8 1.4 1.0
Category 3 (over 12 months) 32.5 24.4 15.5 1.1 3.4 8.0 9.9 0.9 0.1 0.2
All patients 25.6 21.6 17.8 16.3 12.6 16.8 19.4 3.3 0.5 0.5
Per cent of patients admitted from waiting lists with extended waits
Category 1 (over 30 days) 13.2 14.7 13.0 12.8 13.5 12.3 8.3 5.0 2.2 2.4
Category 2 (over 90 days) 17.7 16.9 18.4 21.3 24.9 22.5 23.1 19.5 6.1 5.3
Category 3 (over 12 months) 11.7 11.2 8.7 11.3 6.2 10.2 12.1 11.4 2.6 1.6
All patients 14.9 15.0 14.7 16.3 17.6 16.5 15.4 12.3 3.9 3.4
Waiting time data coverage
Per cent of elective surgery separations 95.0 98.0 98.0 98.0 98.0 89.3 97.9 98.2 91.0 97.9
(a)
(b)
(c)
(d)
(e)
Source :
Queensland elective surgery waiting times, by clinical urgency category, public hospitals (per cent) (a), (b),
(c), (d)
Queensland Government (unpublished); AIHW (unpublished) National Elective Surgery Waiting Times Data Collection.
Waiting times are counted as the time waited in the most recent urgency category plus any time waited in more urgent categories, for example time in
category 2, plus time spent previously in category 1.
Data show patients on the waiting list at 30 June.
Before 2015–16, there was no specified or agreed desirable wait for category 3 patients, so the term ‘extended wait’ was used for category 3 patients
waiting longer than 12 months for elective surgery, as well as for category 1 and 2 patients waiting longer than the agreed desirable waits of 30 and 90 days
respectively. From 2015–16, the desirable wait for category 3 patients is defined as within 365 days.
Data for 2010-11 and prior years are were sourced from the Queensland Government. Data for 2011-12 and after were sourced from the AIHW. Some
differences in data may occur between these periods due to the different data sources.
For 2014-15, Queensland was not able to provide data for 2 hospitals (that reported about 7000 admissions from elective surgery waiting lists in 2013–14)
and 5 months of data for a third hospital (that reported about 3700 admissions in 2013–14).
REPORT ON
GOVERNMENT
SERVICES 2017
PUBLIC
HOSPITALS
PAGE 1 of TABLE 12A.26

TABLE 12A.27
Table 12A.27
2006-07 2007-08 2008-09 2009-10 2010-11 2011-12 2012-13 2013-14 2014-15 2015-16
Per cent of patients on waiting lists with extended waits (d)
Category 1 (over 30 days) 26.2 13.9 21.1 11.7 16.4 14.5 3.8 1.8 6.7 17.3
Category 2 (over 90 days) 46.2 40.1 30.1 28.8 25.2 23.8 9.1 7.7 17.6 15.5
Category 3 (over 12 months) 6.5 4.1 3.1 2.6 3.5 4.1 1.6 0.8 2.5 1.9
All patients 21.9 17.0 14.2 12.1 11.0 10.8 3.9 2.8 7.0 6.2
Per cent of patients admitted from waiting lists with extended waits
Category 1 (over 30 days) 28.8 12.3 14.1 14.5 12.7 15.4 8.2 2.2 4.0 8.2
Category 2 (over 90 days) 44.0 30.2 24.7 24.1 19.3 17.4 15.0 8.2 10.7 10.7
Category 3 (over 12 months) 24.3 5.4 4.5 3.1 3.2 3.5 3.3 1.7 1.7 1.9
All patients 31.6 16.0 14.3 13.8 11.3 11.1 8.6 4.2 5.4 6.5
Waiting time data coverage
Per cent of elective surgery separations 67.0 79.0 78.0 79.0 92.0 100.0 100.0 100.0 100.0 98.6
(a)
(b)
(c)
(d)
Source : WA Government (unpublished); AIHW (unpublished) National Elective Surgery Waiting Times Data Collection.
WA elective surgery waiting times, by clinical urgency category, public hospitals (per cent) (a), (b), (c)
Before 2015–16, there was no specified or agreed desirable wait for category 3 patients, so the term ‘extended wait’ was used for category 3 patients waiting
longer than 12 months for elective surgery, as well as for category 1 and 2 patients waiting longer than the agreed desirable waits of 30 and 90 days
respectively. From 2015–16, the desirable wait for category 3 patients is defined as within 365 days.
Waiting times are counted as the time waited in the most recent urgency category plus any time waited in more urgent categories, for example time in category
2, plus time spent previously in category 1.
Data show patients on the waiting list at 30 June.
Data for 2010-11 and prior years are were sourced from the WA Government. Data for 2011-12 and after were sourced from the AIHW. Some differences in
data may occur between these periods due to the different data sources.
REPORT ON
GOVERNMENT
SERVICES 2017
PUBLIC
HOSPITALS
PAGE 1 of TABLE 12A.27

TABLE 12A.28
Table 12A.28
2006-07 2007-08 2008-09 2009-10 2010-11 2011-12 2012-13 2013-14 2014-15 2015-16
Per cent of patients on waiting lists with extended waits (c)
Category 1 (over 30 days) 21.6 26.0 0.8 2.5 0.1 – – – – –
Category 2 (over 90 days) 16.8 11.2 1.1 1.1 0.1 – – 0.2 – –
Category 3 (over 12 months) 11.3 6.5 0.1 0.1 – – – 0.0 – –
All patients 13.5 9.3 0.3 0.5 – – – 0.1 – –
Per cent of patients admitted from waiting lists with extended waits
Category 1 (over 30 days) 22.5 21.5 17.4 11.2 13.2 9.9 7.8 6.7 8.0 10.0
Category 2 (over 90 days) 22.1 27.1 15.6 10.9 12.7 16.8 7.7 7.7 10.4 11.6
Category 3 (over 12 months) 9.5 11.4 7.2 3.1 6.1 3.9 2.6 2.1 2.7 4.7
All patients 17.4 19.2 13.2 8.4 10.7 7.8 5.8 5.3 6.8 8.6
Waiting time data coverage
Per cent of elective surgery separations 61.6 67.7 70.6 70.7 70.7 96.7 96.8 96.4 96.5 96.4
(a)
(b)
(c)
– Nil or rounded to zero.
Source : SA Government (unpublished); AIHW (unpublished) National Elective Surgery Waiting Times Data Collection.
SA elective surgery waiting times, by clinical urgency category, public hospitals (a), (b)
Data show patients on the waiting list at 30 June.
Before 2015–16, there was no specified or agreed desirable wait for category 3 patients, so the term ‘extended wait’ was used for category 3 patients waiting
longer than 12 months for elective surgery, as well as for category 1 and 2 patients waiting longer than the agreed desirable waits of 30 and 90 days
respectively. From 2015–16, the desirable wait for category 3 patients is defined as within 365 days.
Data for 2010-11 and prior years are were sourced from the SA Government. Data for 2011-12 and after were sourced from the AIHW. Some differences in
data may occur between these periods due to the different data sources. Country hospitals were also included for the first time in 2011-12.
REPORT ON
GOVERNMENT
SERVICES 2017
PUBLIC
HOSPITALS
PAGE 1 of TABLE 12A.28

TABLE 12A.29
Table 12A.29
2006-07 2007-08 2008-09 2009-10 2010-11 2011-12 2012-13 2013-14 2014-15 2015-16
Per cent of patients on waiting lists with extended waits (d)
Category 1 (over 30 days) 39.7 46.4 48.0 55.3 55.6 39.0 32.4 33.5 26.5 16.1
Category 2 (over 90 days) 64.8 68.5 68.6 66.7 66.7 70.0 66.9 61.6 62.2 40.9
Category 3 (over 12 months) 32.0 40.3 27.2 22.7 25.6 34.0 30.5 22.6 24.4 9.4
All patients 48.8 54.4 51.3 49.4 51.1 53.0 49.7 43.1 43.0 21.7
Per cent of patients admitted from waiting lists with extended waits
Category 1 (over 30 days) 25.0 23.4 27.1 23.3 28.0 24.0 26.1 24.8 27.2 22.9
Category 2 (over 90 days) 46.1 51.2 48.2 45.3 39.0 40.0 42.5 50.3 57.2 56.6
Category 3 (over 12 months) 22.6 28.8 28.5 19.8 28.0 28.0 27.0 24.7 32.9 37.1
All patients 32.4 34.4 35.1 31.6 33.0 32.0 33.0 35.5 41.0 40.7
Waiting time data coverage
Per cent of elective surgery separations 100.0 100.0 100.0 100.0 100.0 100.0 100.0 100.0 100.0 100.0
(a)
(b)
(c)
(d)
Source :
Tasmanian elective surgery waiting times, by clinical urgency category, public hospitals (a), (b), (c)
Before 2015–16, there was no specified or agreed desirable wait for category 3 patients, so the term ‘extended wait’ was used for category 3 patients waiting
longer than 12 months for elective surgery, as well as for category 1 and 2 patients waiting longer than the agreed desirable waits of 30 and 90 days
respectively. From 2015–16, the desirable wait for category 3 patients is defined as within 365 days.
Waiting times are counted as time waited in the most recent urgency category plus any time waited in more urgent categories, for example time in category 2,
plus time spent previously in category 1.
Data show patients on the waiting list at 30 June.
Tasmanian Government (unpublished); AIHW (unpublished) National Elective Surgery Waiting Times Data Collection.
Data for 2010-11 and prior years are were sourced from the Tasmanian Government. Data for 2011-12 and after were sourced from the AIHW. Some
differences in data may occur between these periods due to the different data sources.
REPORT ON
GOVERNMENT
SERVICES 2017
PUBLIC
HOSPITALS
PAGE 1 of TABLE 12A.29

TABLE 12A.30
Table 12A.30
2006-07 2007-08 2008-09 2009-10 2010-11 2011-12 2012-13 2013-14 2014-15 2015-16
Per cent of patients on waiting lists with extended waits (e)
Category 1 (over 30 days) 6.8 6.6 0.8 6.6 1.1 – 1.2 0.5 16.2 na
Category 2 (over 90 days) 54.0 54.5 51.2 58.3 50.1 41.1 34.0 29.9 44.8 na
Category 3 (over 12 months) 24.3 20.9 15.4 20.2 14.6 5.7 8.0 11.0 18.2 na
All patients 38.7 38.5 34.4 40.2 33.5 22.2 17.9 17.3 27.5 na
Per cent of patients admitted from waiting lists with extended waits
Category 1 (over 30 days) 7.2 4.1 5.9 6.4 9.8 2.5 1.6 1.5 4.6 na
Category 2 (over 90 days) 49.1 53.4 54.9 56.3 55.1 49.3 39.6 26.2 31.1 na
Category 3 (over 12 months) 30.4 29.0 24.8 22.0 23.6 14.7 9.7 12.8 16.7 na
All patients 32.4 34.0 34.5 34.4 34.9 27.9 20.5 15.4 18.8 na
Waiting time data coverage
Per cent of elective surgery separations 100.0 100.0 100.0 100.0 100.0 100.0 100.0 100.0 100.0 na
(a)
(b)
(c)
(d)
(e)
na Not available. – Nil or rounded to zero.
Source : ACT Government (unpublished); AIHW (unpublished) National Elective Surgery Waiting Times Data Collection.
Waiting times are counted as time waited in the most recent urgency category plus any time waited in more urgent categories, for example time in category 2,
plus time spent previously in category 1.
Before 2015–16, there was no specified or agreed desirable wait for category 3 patients, so the term ‘extended wait’ was used for category 3 patients waiting
longer than 12 months for elective surgery, as well as for category 1 and 2 patients waiting longer than the agreed desirable waits of 30 and 90 days
respectively. From 2015–16, the desirable wait for category 3 patients is defined as within 365 days.
ACT elective surgery waiting times, by clinical urgency category, public hospitals (a), (b), (c), (d)
Data show patients on the waiting list at 30 June.
Data for 2010-11 and prior years are were sourced from the ACT Government. Data for 2011-12 and after were sourced from the AIHW. Some differences in
data may occur between these periods due to the different data sources.
Data for the ACT for 2015-16 were not available at the time of data supply.
REPORT ON
GOVERNMENT
SERVICES 2017
PUBLIC
HOSPITALS
PAGE 1 of TABLE 12A.30

TABLE 12A.31
Table 12A.31
2006-07 2007-08 2008-09 2009-10 2010-11 2011-12 2012-13 2013-14 2014-15 2015-16
Per cent of patients on waiting lists with extended waits (d)
Category 1 (over 30 days) 53.7 57.0 49.7 37.2 23.7 15.6 15.7 14.8 13.4 14.2
Category 2 (over 90 days) 51.7 52.4 50.0 42.9 38.4 30.4 19.2 35.7 39.9 28.3
Category 3 (over 12 months) 39.3 35.8 24.2 15.0 16.7 6.1 13.3 20.0 23.4 24.8
All patients 45.9 44.9 39.1 27.7 25.6 17.0 15.5 26.2 29.5 25.4
Per cent of patients admitted from waiting lists with extended waits
Category 1 (over 30 days) 19.2 19.6 24.3 23.5 18.6 16.1 9.5 9.8 12.4 6.8
Category 2 (over 90 days) 43.0 37.9 41.6 47.8 41.2 32.8 27.5 24.7 32.8 33.1
Category 3 (over 12 months) 39.9 29.1 19.7 19.1 17.9 16.3 13.2 12.5 18.2 19.6
All patients 31.1 28.6 29.8 32.2 27.1 23.0 19.2 17.6 22.5 20.8
Waiting time data coverage
Per cent of elective surgery separations 100.0 100.0 100.0 100.0 100.0 100.0 100.0 100.0 100.0 100.0
(a)
(b)
(c)
(d)
Source :
NT elective surgery waiting times, by clinical urgency category, public hospitals (a), (b), (c)
Data show patients on the waiting list at 30 June.
NT Government (unpublished); AIHW (unpublished) National Elective Surgery Waiting Times Data Collection.
Waiting times are counted as time waited in the most recent urgency category plus any time waited in more urgent categories, for example time in
category 2, plus time spent previously in category 1.
Before 2015–16, there was no specified or agreed desirable wait for category 3 patients, so the term ‘extended wait’ was used for category 3 patients
waiting longer than 12 months for elective surgery, as well as for category 1 and 2 patients waiting longer than the agreed desirable waits of 30 and 90
days respectively. From 2015–16, the desirable wait for category 3 patients is defined as within 365 days.
Data for 2010-11 and prior years are were sourced from the NT Government. Data for 2011-12 and after were sourced from the AIHW. Some
differences in data may occur between these periods due to the different data sources.
REPORT ON
GOVERNMENT
SERVICES 2017
PUBLIC
HOSPITALS
PAGE 1 of TABLE 12A.31

TABLE 12A.32
Table 12A.32
NSW Vic Qld WA SA Tas ACT (c) NT Aust
2012-13
Principal referral and specialist women’s and children’s hospitals (f)
Resuscitation 43 57 54 59 53 56 62 49 51
Emergency 28 44 37 49 35 31 40 20 36
Urgent 23 36 36 42 29 18 24 19 31
Semi-urgent 27 35 43 44 32 19 28 16 33
Non-urgent 46 50 60 52 51 36 40 33 49
Total (d) 26 38 38 45 32 22 29 19 33
Large hospitals
Resuscitation 44 44 54 54 39 69 .. .. 48
Emergency 36 40 55 56 52 37 .. .. 45
Urgent 29 31 51 42 44 34 .. .. 37
Semi-urgent 31 33 57 41 44 42 .. .. 36
Non-urgent 64 58 66 53 61 77 .. .. 62
Total (d) 32 34 53 46 46 38 .. .. 39
All hospitals (e)
Resuscitation 44 56 54 59 55 56 62 48 52
Emergency 32 44 40 52 41 32 40 23 39
Urgent 27 36 39 43 38 22 24 23 34
Semi-urgent 30 36 45 45 43 24 28 24 35
Non-urgent 53 53 62 55 61 47 40 50 54
Total (d) 30 38 41 46 41 25 29 24 36
2013-14
Principal referral and women’s and children’s hospitals (f)
Resuscitation 52 61 62 72 52 55 66 49 58
Emergency 42 49 53 65 38 33 47 17 47
Urgent 38 49 51 62 33 24 29 11 44
Semi-urgent 44 50 58 63 38 27 32 11 47
Non-urgent 61 60 65 64 61 37 39 10 59
Total (d) 42 50 53 63 37 28 34 14 46
Public acute group A hospitals
Resuscitation 48 53 56 55 50 64 53 40 52
Emergency 39 46 51 47 25 29 39 21 43
Urgent 33 39 51 34 21 22 30 21 38
Semi-urgent 35 41 57 36 24 26 37 19 40
Non-urgent 58 60 70 48 33 64 61 44 58
Total (d) 36 41 53 39 23 25 34 21 40
All hospitals (e)
Proportion of presentations to emergency departments with a length of stay of 4
hours or less ending in admission, public hospitals (a), (b)
REPORT ON
GOVERNMENT
SERVICES 2017
PUBLIC
HOSPITALS
PAGE 1 of TABLE 12A.32

TABLE 12A.32
Table 12A.32
NSW Vic Qld WA SA Tas ACT (c) NT Aust
Proportion of presentations to emergency departments with a length of stay of 4
hours or less ending in admission, public hospitals (a), (b)
Resuscitation 51 57 59 66 54 58 63 46 56
Emergency 43 49 53 58 37 33 45 21 47
Urgent 40 44 51 51 35 25 29 21 43
Semi-urgent 44 45 57 52 42 28 33 22 46
Non-urgent 65 60 68 60 59 44 45 50 62
Total (d) 42 46 53 53 38 28 34 22 45
2014-15
Principal referral and women’s and children’s hospitals (f)
Resuscitation 51 61 64 72 55 54 59 48 58
Emergency 38 49 51 66 41 36 46 23 45
Urgent 35 52 53 62 34 27 28 18 44
Semi-urgent 42 55 60 62 39 29 32 19 48
Non-urgent 56 66 62 67 63 35 36 16 58
Total (d) 38 53 54 63 38 30 34 20 46
Public acute group A hospitals
Resuscitation 49 51 53 62 47 65 50 42 51
Emergency 43 46 54 50 22 28 46 18 45
Urgent 38 40 56 36 17 22 37 17 41
Semi-urgent 40 43 60 39 20 24 40 16 43
Non-urgent 61 64 68 57 27 62 53 21 59
Total (d) 40 43 56 41 20 25 40 17 43
All hospitals (e)
Resuscitation 51 56 59 68 54 58 57 46 56
Emergency 43 49 56 60 37 35 46 24 48
Urgent 40 48 56 52 34 26 31 21 45
Semi-urgent 45 51 60 53 40 28 35 22 48
Non-urgent 65 64 66 63 58 45 42 29 63
Total (d) 43 49 57 55 37 29 36 23 47
2015-16
Principal referral and women’s and children’s hospitals (f)
Resuscitation 51 61 65 69 58 58 na 52 59
Emergency 39 50 57 61 44 38 na 28 47
Urgent 34 53 56 53 38 26 na 25 45
Semi-urgent 41 57 57 55 43 29 na 30 49
Non-urgent 56 64 61 58 69 39 na 39 59
Total (d) 38 54 57 56 42 30 na 28 47
Public acute group A hospitals
REPORT ON
GOVERNMENT
SERVICES 2017
PUBLIC
HOSPITALS
PAGE 2 of TABLE 12A.32

TABLE 12A.32
Table 12A.32
NSW Vic Qld WA SA Tas ACT (c) NT Aust
Proportion of presentations to emergency departments with a length of stay of 4
hours or less ending in admission, public hospitals (a), (b)
Resuscitation 50 52 50 56 57 61 na 37 52
Emergency 45 51 53 50 39 25 na 22 48
Urgent 39 45 54 34 28 18 na 18 43
Semi-urgent 43 50 58 37 29 22 na 17 46
Non-urgent 64 67 66 45 44 57 na 24 61
Total (d) 42 48 54 39 32 22 na 19 45
All hospitals (e)
Resuscitation 52 57 59 66 59 58 na 46 57
Emergency 45 53 56 58 45 34 na 28 50
Urgent 41 51 55 48 40 24 na 25 47
Semi-urgent 46 55 58 50 47 28 na 28 50
Non-urgent 66 65 65 60 67 48 na 36 64
Total (d) 44 53 56 51 44 28 na 27 49
(a)
(b)
(c)
(d)
(e)
(f)
Source: AIHW (various years), Emergency department care: Australian hospital statistics, Health
services series.
Includes presentations for all Types of visit.
Length of stay is calculated as the length of time between presentation to the emergency department
and physical departure.
The total includes presentations for which the triage category was not reported.
Data for 2012-13 includes Principal referral and specialist women’s and children’s hospitals, Large
hospitals and hospitals in other peer groups that reported to the National Non-Admitted Patient
Emergency Department Care Database. Data for 2013-14 includes Principal referral and Women’s
and children’s hospitals, Public acute group A hospitals, Public acute group B hospitals and hospitals
in other peer groups that reported to the National Non-Admitted Patient Emergency Department Care
Database.
Principal referral and Women’s and Children’s hospitals do not describe the same set of hospitals
under the different peer group classifications. As there are two different peer group classifications
used, this constitutes a break in series between 2012-13 and 2013-14.
Data for the ACT were not available at the time of data supply and have not been included in the totals
for 2015-16.
na Not available. .. Not applicable.
REPORT ON
GOVERNMENT
SERVICES 2017
PUBLIC
HOSPITALS
PAGE 3 of TABLE 12A.32

TABLE 12A.33
Table 12A.33
Unit NSW Vic Qld WA SA (a) Tas ACT NT Aust
Number of hospitals(a) no. 225 151 122 92 77 23 3 5 698
Accredited against NSQHSS standards 1 to 3(b) no. 58 48 22 70 36 5 – – 239
Accredited against NSQHSS standards 1 to 10(b) no. 163 89 94 16 33 9 3 5 412
Public hospitals—total NSQHSS accredited no. 221 137 116 86 69 14 3 5 651
Not assessed as at 30 June 2015(b) no. 4 14 6 6 8 9 – – 47
Proportion assessed at 30 June 2015(b) % 98 91 95 94 90 61 100 100 93
(a)
(b)
– Nil or rounded to zero.
Source:
Public hospital accreditation, 30 June 2015
Information sourced from the NPHED. The number of public hospitals accredited to the NSQHSS was based on unpublished data supplied by the
ACSQHC, the AIHW limited the data to only those public hospitals that were also reported to the NPHED
Information sourced from the Australian Commission on Safety and Quality in Health Care (ACSQHC) National Safety and Quality Health Service (NSQHS)
Standards (unpublished data).
AIHW (2016), Hospital resources 2014–15: Australian hospital statistics, Health services series no. 71. Cat. no. HSE 176; SA government
(unpublished).
REPORT ON
GOVERNMENT
SERVICES 2017
PUBLIC
HOSPITALS
PAGE 1 of TABLE 12A.33

TABLE 12A.34
Table 12A.34
unit NSW (c) Vic Qld (d) WA (e) SA Tas ACT NT Aust (f)
2010-11
Infection rates
rate per 10 000
patient days 0.4 0.3 0.3 0.1 0.2 0.2 0.2 0.6 0.3
rate per 10 000
patient days 0.9 0.7 0.9 0.7 0.7 1.0 1.1 0.9 0.8
rate per 10 000
patient days 1.3 0.9 1.1 0.9 0.9 1.2 1.3 1.5 1.1
no. 233 118 72 21 31 6 7 16 504
no. 536 322 209 112 91 37 34 27 1 368
Total no. 769 440 281 133 122 43 41 43 1 872
Coverage (h) % 98 99 77 95 81 100 98 100 93
2011-12
Infection rates
rate per 10 000
patient days0.3 0.2 0.2 0.1 0.3 0.1 0.2 0.5 0.2
rate per 10 000
patient days0.8 0.8 0.7 0.5 0.6 0.6 1 0.8 0.7
Total (g)rate per 10 000
patient days1.1 1.0 0.8 0.6 0.9 0.8 1.1 1.3 1.0
Number of infections
no. 201 82 51 22 40 5 6 15 422
no. 473 379 220 75 86 22 31 24 1 310
Methicillin resistant
Staphylococcus aureus
Methicillin sensitive
Staphylococcus aureus
Methicillin resistant
Staphylococcus aureus
Methicillin sensitive
Staphylococcus aureus
Methicillin resistant
Staphylococcus aureus
Methicillin sensitive
Staphylococcus aureus
Episodes of Staphylococcus aureus (including MRSA) bacteraemia (SAB) in acute care hospitals, by
MRSA and MSSA (a), (b)
Methicillin resistant
Staphylococcus aureus
Methicillin sensitive
Staphylococcus aureus
Total (g)
Number of infections
REPORT ON
GOVERNMENT
SERVICES 2017
PUBLIC
HOSPITALS
PAGE 1 of TABLE 12A.34

TABLE 12A.34
Table 12A.34
unit NSW (c) Vic Qld (d) WA (e) SA Tas ACT NT Aust (f)
Episodes of Staphylococcus aureus (including MRSA) bacteraemia (SAB) in acute care hospitals, by
MRSA and MSSA (a), (b)
Total no. 674 461 271 97 126 27 37 39 1 732
Coverage (h) % 97 99 98 96 80 100 98 100 96
2012-13
Infection rates
rate per 10 000
patient days 0.3 0.2 0.2 0.1 0.2 0.1 0.1 0.2 0.2
rate per 10 000
patient days 0.7 0.7 0.8 0.6 0.6 0.8 1.1 0.5 0.7
Total (g)rate per 10 000
patient days 1.0 0.9 1.0 0.8 0.8 0.9 1.2 0.7 0.9
Number of infections
no. 206 81 47 22 23 2 3 7 391
no. 447 345 260 105 90 29 36 15 1 327
Total no. 653 426 307 127 113 31 39 22 1 718
Coverage (h) % 100 99 95 96 92 100 100 100 98
2013-14
Infection rates
rate per 10 000
patient days0.3 0.2 0.1 0.1 0.2 0.1 0.2 0.4 0.2
rate per 10 000
patient days0.7 0.7 0.8 0.8 0.4 0.8 0.7 0.7 0.7
Total (g)rate per 10 000
patient days0.9 0.9 0.9 0.9 0.6 0.9 0.9 1.1 0.9
Number of infections
Methicillin resistant
Staphylococcus aureus
Methicillin resistant
Staphylococcus aureus
Methicillin sensitive
Staphylococcus aureus
Methicillin resistant
Staphylococcus aureus
Methicillin sensitive
Staphylococcus aureus
Methicillin sensitive
Staphylococcus aureus
REPORT ON
GOVERNMENT
SERVICES 2017
PUBLIC
HOSPITALS
PAGE 2 of TABLE 12A.34

TABLE 12A.34
Table 12A.34
unit NSW (c) Vic Qld (d) WA (e) SA Tas ACT NT Aust (f)
Episodes of Staphylococcus aureus (including MRSA) bacteraemia (SAB) in acute care hospitals, by
MRSA and MSSA (a), (b)
no. 180 95 46 23 24 3 6 11 388
no. 409 307 258 125 57 32 23 22 1 233
Total no. 589 402 304 148 81 35 29 33 1 621
Coverage (h) % 97 99 99 96 95 100 100 100 98
2014-15
Infection rates
rate per 10 000
patient days 0.3 0.1 0.1 0.1 0.1 0.1 0.2 0.3 0.2
rate per 10 000
patient days 0.6 0.6 0.7 0.7 0.6 0.7 0.7 0.4 0.6
Total (g)rate per 10 000
patient days 0.8 0.8 0.8 0.8 0.8 0.8 0.9 0.7 0.8
Number of infections
no.171 69 35 16 21 3 7 9 331
no. 367 295 240 104 91 27 23 13 1 160
Total no. 538 364 275 120 112 30 30 22 1 491
Coverage (h) % 98 99 100 96 93 100 100 100 98
2015-16 (i)
Infection rates
rate per 10 000
patient days 0.2 0.1 0.1 0.2 0.1 0.2 0.1 0.2 0.1rate per 10 000
patient days 0.6 0.6 0.6 0.7 0.6 0.7 0.7 0.4 0.6
Methicillin resistant
Staphylococcus aureus
Methicillin sensitive
Staphylococcus aureus
Methicillin resistant
Staphylococcus aureus
Methicillin resistant
Staphylococcus aureus
Methicillin sensitive
Staphylococcus aureus
Methicillin sensitive
Staphylococcus aureus
Methicillin resistant
Staphylococcus aureus
Methicillin sensitive
Staphylococcus aureus
REPORT ON
GOVERNMENT
SERVICES 2017
PUBLIC
HOSPITALS
PAGE 3 of TABLE 12A.34

TABLE 12A.34
Table 12A.34
unit NSW (c) Vic Qld (d) WA (e) SA Tas ACT NT Aust (f)
Episodes of Staphylococcus aureus (including MRSA) bacteraemia (SAB) in acute care hospitals, by
MRSA and MSSA (a), (b)
Total (g)
rate per 10 000
patient days 0.7 0.7 0.7 0.9 0.7 0.9 0.8 0.6 0.7
Number of infections
no. 131 52 35 30 16 6 4 6 280
no. 367 296 245 102 83 29 25 13 1160
Total no. 498 348 280 132 99 35 29 19 1440
Coverage (h) % 99 99 100 95 95 100 100 100 98
(a)
(b) For more information on data quality, including collection methodologies and data limitations, see METeOR on the AIHW website.
(c)
(d)
(e)
(f)
(g)
(h)
(i)
Source :
Australian totals include NSW.
WA reported one case where both MRSA and MSSA were identified. This case is reported in the MRSA counts above for WA, and in the total.
For 2010-11, Qld data only include patients 14 years of age and over.
NSW does not provide patient day data, but rather occupied bed day data for calculation of the denominator. There may be some difference between patient day
and occupied bed day data.
AIHW unpublished.
The definition of a SAB episode was updated for 2015-16 data reporting. The change is not considered to have resulted in counts of SAB cases for 2015-16 that
are not comparable with counts for previous years.
The SAB patient episodes were associated with both admitted patient care and with non-admitted patient care (including emergency departments and outpatient
clinics). The comparability of the SAB rates among jurisdictions and over time is limited because of coverage differences and because the count of patient days
reflects the amount of admitted patient activity, but does not necessarily reflect the amount of non-admitted patient activity.
Total may not equal sum of components due to rounding.
Coverage is the number of patient days for hospitals included in the SAB surveillance arrangements as a proportion of total patient days for all public hospitals.
Coverage estimates may be preliminary.
Methicillin resistant
Staphylococcus aureus
Methicillin sensitive
Staphylococcus aureus
REPORT ON
GOVERNMENT
SERVICES 2017
PUBLIC
HOSPITALS
PAGE 4 of TABLE 12A.34

TABLE 12A.35
Table 12A.35
Unit NSW Vic Qld WA SA Tas ACT NT Aust
2010-11
Number of events
External cause of injury and poisoning
no.na na na na na na na na na
Misadventures to patients during surgical and medical care no. na na na na na na na na na
Procedures causing abnormal reactions/complications no. na na na na na na na na na
Other external causes of adverse events no. na na na na na na na na na
Place of occurrence of injury and poisoning
Place of occurrence: Health service area no. na na na na na na na na na
Diagnoses
Selected post-procedural disorders no. na na na na na na na na na
Haemorrhage and haematoma complicating a procedure no. na na na na na na na na na
Infection following a procedure no. na na na na na na na na na
Complications of internal prosthetic devices no. na na na na na na na na na
no.na na na na na na na na na
Total (any of the above) (e) no. na na na na na na na na na
Events per 100 separations (f)
External cause of injury and poisoning
Rate 2.3 2.1 1.9 2.2 2.4 2.2 1.8 np 2.1
Misadventures to patients during surgical and medical care Rate 0.2 0.3 0.3 0.3 0.3 0.3 0.3 np 0.3
Procedures causing abnormal reactions/complications Rate 3.1 3.1 3.2 3.2 3.6 4.1 3.5 np 3.2
Other external causes of adverse events Rate 0.1 0.1 0.1 0.1 0.2 0.1 0.2 np 0.1
Place of occurrence of injury and poisoning
Separations with an adverse event, public hospitals (a), (b), (c), (d)
Adverse effects of drugs, medicaments and biological
substances
Other diagnoses of complications of medical and surgical
care
Adverse effects of drugs, medicaments and biological
substances
REPORT ON
GOVERNMENT
SERVICES 2017
PUBLIC
HOSPITALS
PAGE 1 of TABLE 12A.35

TABLE 12A.35
Table 12A.35
Unit NSW Vic Qld WA SA Tas ACT NT Aust
Separations with an adverse event, public hospitals (a), (b), (c), (d)
Place of occurrence: Health service area Rate 5.9 5.7 5.5 5.8 6.3 7.0 5.8 np 5.7
Diagnoses
Selected post-procedural disorders Rate 0.9 0.6 0.7 0.9 1.1 1.1 1.1 np 0.8
Haemorrhage and haematoma complicating a procedure Rate 0.4 0.5 0.4 0.5 0.4 0.5 0.5 np 0.5
Infection following a procedure Rate 0.5 0.4 0.4 0.4 0.4 0.5 0.5 np 0.4
Complications of internal prosthetic devices Rate 1.2 1.2 1.3 1.2 1.2 1.2 1.3 np 1.2
Rate 0.7 1.0 0.8 0.8 0.8 0.9 0.8 np 0.8
Total (any of the above) (e) Rate 6.1 5.8 5.7 6.0 6.6 7.1 6.0 np 5.9
2011-12
Number of events
External cause of injury and poisoning
no. 39 674 32 632 21 282 13 369 10 061 2 393 2 159 973 122 543
Misadventures to patients during surgical and medical care no. 3 864 5 188 3 257 1 482 1 012 422 285 159 15 669
Procedures causing abnormal reactions/complications no. 52 902 51 360 32 805 18 641 14 405 4 444 3 458 2 257 180 272
Other external causes of adverse events no. 2 093 2 633 1 261 412 953 128 194 90 7 764
Place of occurrence of injury and poisoning
Place of occurrence: Health service area no. 101 761 91 565 59 278 34 598 26 368 7 544 5 968 3 444 330 526
Diagnoses
Selected post-procedural disorders no. 15 433 10 457 7 673 4 719 4 435 1 233 1 073 401 45 424
Haemorrhage and haematoma complicating a procedure no. 7 731 8 025 4 419 2 746 1 797 487 502 326 26 033
Infection following a procedure no. 8 185 5 709 4 514 2 369 1 578 488 351 437 23 631
Complications of internal prosthetic devices no. 19 505 20 253 12 774 6 571 4 825 1 237 1 410 893 67 468
Other diagnoses of complications of medical and surgical
care
Adverse effects of drugs, medicaments and biological
substances
REPORT ON
GOVERNMENT
SERVICES 2017
PUBLIC
HOSPITALS
PAGE 2 of TABLE 12A.35
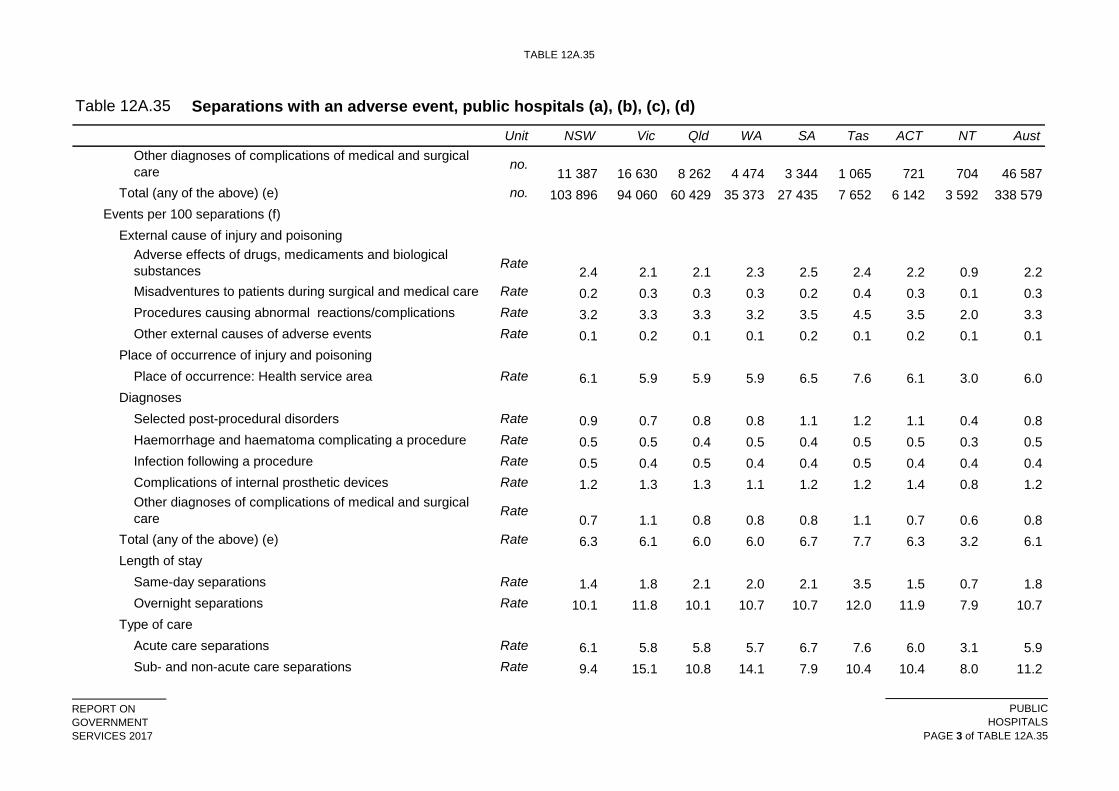
TABLE 12A.35
Table 12A.35
Unit NSW Vic Qld WA SA Tas ACT NT Aust
Separations with an adverse event, public hospitals (a), (b), (c), (d)
no. 11 387 16 630 8 262 4 474 3 344 1 065 721 704 46 587
Total (any of the above) (e) no. 103 896 94 060 60 429 35 373 27 435 7 652 6 142 3 592 338 579
Events per 100 separations (f)
External cause of injury and poisoning
Rate 2.4 2.1 2.1 2.3 2.5 2.4 2.2 0.9 2.2
Misadventures to patients during surgical and medical care Rate 0.2 0.3 0.3 0.3 0.2 0.4 0.3 0.1 0.3
Procedures causing abnormal reactions/complications Rate 3.2 3.3 3.3 3.2 3.5 4.5 3.5 2.0 3.3
Other external causes of adverse events Rate 0.1 0.2 0.1 0.1 0.2 0.1 0.2 0.1 0.1
Place of occurrence of injury and poisoning
Place of occurrence: Health service area Rate 6.1 5.9 5.9 5.9 6.5 7.6 6.1 3.0 6.0
Diagnoses
Selected post-procedural disorders Rate 0.9 0.7 0.8 0.8 1.1 1.2 1.1 0.4 0.8
Haemorrhage and haematoma complicating a procedure Rate 0.5 0.5 0.4 0.5 0.4 0.5 0.5 0.3 0.5
Infection following a procedure Rate 0.5 0.4 0.5 0.4 0.4 0.5 0.4 0.4 0.4
Complications of internal prosthetic devices Rate 1.2 1.3 1.3 1.1 1.2 1.2 1.4 0.8 1.2
Rate 0.7 1.1 0.8 0.8 0.8 1.1 0.7 0.6 0.8
Total (any of the above) (e) Rate 6.3 6.1 6.0 6.0 6.7 7.7 6.3 3.2 6.1
Length of stay
Same-day separations Rate 1.4 1.8 2.1 2.0 2.1 3.5 1.5 0.7 1.8
Overnight separations Rate 10.1 11.8 10.1 10.7 10.7 12.0 11.9 7.9 10.7
Type of care
Acute care separations Rate 6.1 5.8 5.8 5.7 6.7 7.6 6.0 3.1 5.9
Sub- and non-acute care separations Rate 9.4 15.1 10.8 14.1 7.9 10.4 10.4 8.0 11.2
Other diagnoses of complications of medical and surgical
care
Other diagnoses of complications of medical and surgical
care
Adverse effects of drugs, medicaments and biological
substances
REPORT ON
GOVERNMENT
SERVICES 2017
PUBLIC
HOSPITALS
PAGE 3 of TABLE 12A.35

TABLE 12A.35
Table 12A.35
Unit NSW Vic Qld WA SA Tas ACT NT Aust
Separations with an adverse event, public hospitals (a), (b), (c), (d)
Urgency of admission
Emergency admission Rate 9.1 8.9 7.9 9.0 9.8 11.5 10.1 6.9 8.9
Non-emergency admission Rate 4.0 4.4 4.6 3.9 4.3 5.6 3.7 1.3 4.2
All separations Rate 6.3 6.1 6.0 6.0 6.7 7.7 6.3 3.2 6.1
2012-13
Number of events
External cause of injury and poisoning
no. 43 155 32 327 24 649 15 113 11 410 2 918 2 377 1 091 133 040
Misadventures to patients during surgical and medical care no. 4 186 5 173 3 138 1 674 1 225 426 321 134 16 277
Procedures causing abnormal reactions/complications no. 53 495 54 704 34 699 19 853 14 959 5 091 4 109 2 625 189 535
Other external causes of adverse events no. 2 422 3 091 1 469 466 1 326 190 220 124 9 308
Place of occurrence of injury and poisoning
Place of occurrence: Health service area no. 106 563 94 097 64 065 37 828 28 319 8 630 6 836 3 921 350 259
Diagnoses
Selected post-procedural disorders no. 14 707 10 007 8 125 4 795 4 645 1 417 1 202 503 45 401
Haemorrhage and haematoma complicating a procedure no. 7 820 7 639 4 668 2 927 1 773 572 535 315 26 249
Infection following a procedure no. 8 079 5 068 4 499 2 443 1 511 520 410 464 22 994
Complications of internal prosthetic devices no. 20 443 22 995 13 966 7 208 5 103 1 465 1 713 1 072 73 965
no. 11 916 18 627 9 036 5 072 3 700 1 172 950 704 51 177
Total (any of the above) (e) no. 108 860 96 776 65 637 38 642 29 689 8 752 6 996 4 038 359 390
Events per 100 separations (f)
External cause of injury and poisoning
Adverse effects of drugs, medicaments and biological
substances
Other diagnoses of complications of medical and surgical
care
REPORT ON
GOVERNMENT
SERVICES 2017
PUBLIC
HOSPITALS
PAGE 4 of TABLE 12A.35

TABLE 12A.35
Table 12A.35
Unit NSW Vic Qld WA SA Tas ACT NT Aust
Separations with an adverse event, public hospitals (a), (b), (c), (d)
Rate 2.5 2.3 2.4 2.5 2.8 2.7 2.5 0.9 2.4
Misadventures to patients during surgical and medical care Rate 0.2 0.4 0.3 0.3 0.3 0.4 0.3 0.1 0.3
Procedures causing abnormal reactions/complications Rate 3.1 3.8 3.3 3.3 3.6 4.8 4.3 2.2 3.4
Other external causes of adverse events Rate 0.1 0.2 0.1 0.1 0.3 0.2 0.2 0.1 0.2
Place of occurrence of injury and poisoning
Place of occurrence: Health service area Rate 6.2 6.6 6.1 6.2 6.8 8.1 7.2 3.3 6.3
Diagnoses
Selected post-procedural disorders Rate 0.9 0.7 0.8 0.8 1.1 1.3 1.3 0.4 0.8
Haemorrhage and haematoma complicating a procedure Rate 0.5 0.5 0.4 0.5 0.4 0.5 0.6 0.3 0.5
Infection following a procedure Rate 0.5 0.4 0.4 0.4 0.4 0.5 0.4 0.4 0.4
Complications of internal prosthetic devices Rate 1.2 1.6 1.3 1.2 1.2 1.4 1.8 0.9 1.3
Rate 0.7 1.3 0.9 0.8 0.9 1.1 1.0 0.6 0.9
Total (any of the above) (e) Rate 6.3 6.8 6.3 6.4 7.2 8.2 7.4 3.4 6.5
2013-14
Number of events
External cause of injury and poisoning
no. 46 855 33 751 26 073 15 787 11 553 3 300 2 529 1 386 141 234
Misadventures to patients during surgical and medical care no. 4 549 5 603 3 558 1 988 1 276 436 265 156 17 831
Procedures causing abnormal reactions/complications no. 54 043 60 951 36 612 21 724 15 267 5 403 3 892 2 927 200 819
Other external causes of adverse events no. 2 779 3 705 1 630 631 1 591 224 329 166 11 055
Place of occurrence of injury and poisoning
Place of occurrence: Health service area no. 111 634 101 609 67 317 40 749 29 008 9 468 6 850 4 496 371 131
Adverse effects of drugs, medicaments and biological
substances
Adverse effects of drugs, medicaments and biological
substances
Other diagnoses of complications of medical and surgical
care
REPORT ON
GOVERNMENT
SERVICES 2017
PUBLIC
HOSPITALS
PAGE 5 of TABLE 12A.35

TABLE 12A.35
Table 12A.35
Unit NSW Vic Qld WA SA Tas ACT NT Aust
Separations with an adverse event, public hospitals (a), (b), (c), (d)
Diagnoses
Selected post-procedural disorders no. 13 488 10 754 8 404 5 098 4 478 1 499 990 536 45 247
Haemorrhage and haematoma complicating a procedure no. 7 986 7 974 4 778 3 292 1 909 638 519 317 27 413
Infection following a procedure no. 7 994 5 147 4 968 2 431 1 512 593 403 409 23 457
Complications of internal prosthetic devices no. 21 077 26 162 14 652 7 921 5 290 1 645 1 669 1 364 79 780
no. 12 674 20 854 9 837 5 659 3 882 1 330 949 810 55 995
Total (any of the above) (e) no. 114 176 105 014 69 127 41 602 30 515 9 624 7 064 4 627 381 749
Events per 100 separations (f)
External cause of injury and poisoning
Rate 2.6 2.2 2.4 2.6 2.8 2.9 2.6 1.1 2.5
Misadventures to patients during surgical and medical care Rate 0.3 0.4 0.3 0.3 0.3 0.4 0.3 0.1 0.3
Procedures causing abnormal reactions/complications Rate 3.1 4.0 3.4 3.6 3.7 4.7 4.0 2.4 3.5
Other external causes of adverse events Rate 0.2 0.2 0.1 0.1 0.4 0.2 0.3 0.1 0.2
Place of occurrence of injury and poisoning
Place of occurrence: Health service area Rate 6.3 6.7 6.2 6.8 7.0 8.3 7.1 3.6 6.5
Diagnoses
Selected post-procedural disorders Rate 0.8 0.7 0.8 0.9 1.1 1.3 1.0 0.4 0.8
Haemorrhage and haematoma complicating a procedure Rate 0.5 0.5 0.4 0.6 0.5 0.6 0.5 0.3 0.5
Infection following a procedure Rate 0.5 0.3 0.5 0.4 0.4 0.5 0.4 0.3 0.4
Complications of internal prosthetic devices Rate 1.2 1.7 1.3 1.3 1.3 1.4 1.7 1.1 1.4
Rate 0.7 1.4 0.9 0.9 0.9 1.2 1.0 0.7 1.0
Total (any of the above) (e) Rate 6.4 7.0 6.4 7.0 7.3 8.4 7.3 3.7 6.7
Other diagnoses of complications of medical and surgical
care
Adverse effects of drugs, medicaments and biological
substances
Other diagnoses of complications of medical and surgical
care
REPORT ON
GOVERNMENT
SERVICES 2017
PUBLIC
HOSPITALS
PAGE 6 of TABLE 12A.35

TABLE 12A.35
Table 12A.35
Unit NSW Vic Qld WA SA Tas ACT NT Aust
Separations with an adverse event, public hospitals (a), (b), (c), (d)
2014-15
Number of events
External cause of injury and poisoning
no. 50 866 34 889 28 998 16 200 11 981 3 425 2 645 1 593 150 597
Misadventures to patients during surgical and medical care no. 5 381 6 145 3 823 2 100 1 296 461 298 170 19 674
Procedures causing abnormal reactions/complications no. 58 776 57 188 39 944 21 775 15 227 5 230 3 977 2 788 204 905
Other external causes of adverse events no. 3 508 4 117 2 057 885 2 047 249 326 159 13 348
Place of occurrence of injury and poisoning
Place of occurrence: Health service area no. 120 455 99 824 74 335 41 620 29 465 9 428 7 112 4 549 386 788
Diagnoses
Selected post-procedural disorders no. 15 051 12 116 8 987 5 452 4 305 1 358 974 558 48 801
Haemorrhage and haematoma complicating a procedure no. 8 577 7 970 5 343 3 337 1 881 561 492 328 28 489
Infection following a procedure no. 8 298 5 060 5 438 2 474 1 563 615 393 403 24 244
Complications of internal prosthetic devices no. 22 431 22 845 15 603 7 733 5 427 1 731 1 744 1 274 78 788
no. 15 074 19 106 10 938 5 994 3 964 1 297 1 004 679 58 056
Total (any of the above) (e) no. 123 619 104 020 76 551 42 619 31 526 9 616 7 396 4 688 400 035
Events per 100 separations (f)
External cause of injury and poisoning
Rate 2.8 2.2 2.4 2.7 2.8 2.9 2.6 1.2 2.5
Misadventures to patients during surgical and medical care Rate 0.3 0.4 0.3 0.3 0.3 0.4 0.3 0.1 0.3
Procedures causing abnormal reactions/complications Rate 3.2 3.6 3.3 3.6 3.6 4.4 3.9 2.1 3.4
Other external causes of adverse events Rate 0.2 0.3 0.2 0.1 0.5 0.2 0.3 0.1 0.2
Place of occurrence of injury and poisoning
Adverse effects of drugs, medicaments and biological
substances
Other diagnoses of complications of medical and surgical
care
Adverse effects of drugs, medicaments and biological
substances
REPORT ON
GOVERNMENT
SERVICES 2017
PUBLIC
HOSPITALS
PAGE 7 of TABLE 12A.35

TABLE 12A.35
Table 12A.35
Unit NSW Vic Qld WA SA Tas ACT NT Aust
Separations with an adverse event, public hospitals (a), (b), (c), (d)
Place of occurrence: Health service area Rate 6.6 6.3 6.2 6.9 7.0 7.9 7.1 3.4 6.5
Diagnoses
Selected post-procedural disorders Rate 0.8 0.8 0.7 0.9 1.0 1.1 1.0 0.4 0.8
Haemorrhage and haematoma complicating a procedure Rate 0.5 0.5 0.4 0.6 0.4 0.5 0.5 0.2 0.5
Infection following a procedure Rate 0.5 0.3 0.5 0.4 0.4 0.5 0.4 0.3 0.4
Complications of internal prosthetic devices Rate 1.2 1.4 1.3 1.3 1.3 1.4 1.7 1.0 1.3
Rate 0.8 1.2 0.9 1.0 0.9 1.1 1.0 0.5 1.0
Total (any of the above) (e) Rate 6.8 6.6 6.4 7.1 7.5 8.0 7.3 3.5 6.7
(a)
(b)
(c)
(d)
(e)
(f)
na Not available. np Not published.
These data can be interpreted as representing selected adverse events in health care that have resulted in, or have affected, hospital admissions, rather than all
adverse events that occurred in hospitals. Some of the adverse events included in these tables may represent events that occurred before admission.
Some adverse events are not identifiable using the codes for an adverse event or a place of occurrence of hospital. Some other diagnosis codes may suggest
that an adverse event has occurred when it has not.
Public hospitals include public acute and public psychiatric hospitals.
Source: AIHW (unpublished) National Hospital Morbidity Database.
Separations that included ICD-10-AM diagnosis and/or external cause codes that indicated an adverse event was treated and/or occurred during the
hospitalisation.
Categories do not sum to the totals because multiple diagnoses and external causes can be recorded for each separation and external cause codes and
diagnosis codes can be used together to describe an adverse event.
Age standardised rate.
Other diagnoses of complications of medical and surgical
care
REPORT ON
GOVERNMENT
SERVICES 2017
PUBLIC
HOSPITALS
PAGE 8 of TABLE 12A.35

TABLE 12A.36
Table 12A.36
NSW Vic Qld WA SA Tas ACT NT
Rate No.
Hospital sector
Public 5.6 3.6 3.7 5.0 5.0 6.9 4.5 1.8 4.5 26 921
Private (c) 1.5 1.5 1.8 1.5 1.1 np np np 1.6 6 575
Indigenous status
Aboriginal and Torres Strait Islander Australians 2.0 1.4 1.6 1.2 1.5 5.0 2.9 1.2 1.5 683
Other Australians (d) 4.0 2.8 2.9 3.7 3.4 4.4 4.5 2.8 3.4 32 813
Remoteness area of residence (e)
Major cities 4.2 2.6 2.9 3.6 3.4 6.5 4.7 5.0 3.4 23 431
Inner regional 3.4 3.4 2.8 3.1 2.8 4.5 3.3 1.4 3.3 6 403
Outer regional 3.2 3.4 2.7 3.9 3.6 4.2 2.4 2.3 3.2 2 978
Remote and Very remote 2.6 3.5 1.8 1.9 3.4 3.5 .. 1.4 1.9 540
Socioeconomic status of area of residence (f)
1—Lowest 4.1 2.8 3.2 3.8 4.1 5.0 3.8 1.2 3.5 7 778
2 3.9 3.2 3.3 4.0 3.5 4.5 4.1 3.2 3.6 7 370
3 4.2 2.8 2.9 3.3 2.9 3.8 3.4 2.3 3.3 6 606
4 4.3 2.6 2.3 3.3 3.0 3.7 4.7 1.9 3.1 5 859
5—Highest 3.6 2.5 2.3 3.2 2.1 1.8 4.6 2.5 3.0 5 736
Total (g) 4.0 2.8 2.9 3.5 3.3 np np np 3.3 33 496
(a)
(b)
Falls resulting in patient harm occurring in hospitals could be underestimated as the place of occurrence was not reported (or unspecified) for about a quarter
of separations with an external cause of injury of falls.
Separations for falls resulting in patient harm in hospitals, per 1000 separations, 2014-15 (a), (b)
Aust
Falls could also be overestimated, as it is not currently possible to identify falls specifically occurring in hospitals. Currently, the data identify falls occurring in
any health service setting, including day surgery centres or hospices. However, to minimise the inclusion of falls that occurred before admission, separations
with an injury or poisoning principal diagnosis are excluded.
REPORT ON
GOVERNMENT
SERVICES 2017
PUBLIC
HOSPITALS
PAGE 1 of TABLE 12A.36

TABLE 12A.36
Table 12A.36
NSW Vic Qld WA SA Tas ACT NT
Separations for falls resulting in patient harm in hospitals, per 1000 separations, 2014-15 (a), (b)
Aust
(c)
(d)
(e)
(f)
(g)
np Not published. .. Not applicable.
Source: AIHW (2016), Admitted patient care 2014–15: Australian hospital statistics, Health services series no. 68. Cat. no. HSE 172.
The total includes separations for which the place of usual residence was not reported.
Other Australians includes separations for non‑Indigenous people and those for whom Indigenous status was not stated.
Cells have been suppressed to protect confidentiality where the presentation could identify a patient or a service provider or where rates are likely to be highly
volatile, for example, where the denominator is very small. Rates were suppressed where the numerator was less than 5. Data for private hospitals in
Tasmania, ACT and the NT were suppressed.
Disaggregation by remoteness area of usual residence, not remoteness of hospital. However, state/territory data are reported by jurisdiction of the hospital,
regardless of the jurisdiction of usual residence.
Disaggregation by socioeconomic group is based on the usual residence of the patient, not the location of the hospital.
REPORT ON
GOVERNMENT
SERVICES 2017
PUBLIC
HOSPITALS
PAGE 2 of TABLE 12A.36

TABLE 12A.37
Table 12A.37
2010-11 2011-12 2012-13 2013-14 2014-15
1 1 – – –
12 20 15 18 15
10 14 13 18 20
1 – 2 2 3
– 1 1 – –
2 1 2 12 3
6 8 5 3 9
– – – – –
32 45 38 53 50
(a)
(b)
Source : NSW government (unpublished).
Procedures involving the wrong patient or body part resulting in death or major
permanent loss of function.
Suicide of a patient in an inpatient unit.
Retained instruments or other material after surgery requiring re-operation or further
surgical procedure.
Total
– Nil or rounded to zero.
Sentinel events definitions can vary across jurisdictions.
Data are sourced from the NSW Maternal and Perinatal Mortality Review Committee. Data for all prior years included in the table have been updated to
reflect the modified definition, and are not comparable to results published in the 2014 Report and prior versions.
NSW selected sentinel events (number) (a)
Intravascular gas embolism resulting in death or neurological damage.
Infant discharged to the wrong family.
Haemolytic blood transfusion reaction resulting from ABO (blood group) incompatibility.
Medication error leading to the death of a patient reasonably believed to be due to
incorrect administration of drugs.
Maternal death associated with pregnancy, birth or the puerperium. (b)
REPORT ON
GOVERNMENT
SERVICES 2017
PUBLIC
HOSPITALS
PAGE 1 of TABLE 12A.37

TABLE 12A.38
Table 12A.38
2010-11 2011-12 2012-13 2013-14 2014-15
1 1 – – –
9 8 9 7 4
5 7 6 6 6
1 – – 1 –
1 – – – –
2 4 1 3 7
2 – 1 3 2
– – – – –
21 20 17 20 19
(a)
(b)
Source :
Victoria has supplied data using the sentinel event definition applicable to the data collection period. Most other jurisdictions have retrospectively applied
the amended definition.
Victorian government (unpublished).
– Nil or rounded to zero.
Victoria selected sentinel events (number) (a)
Sentinel events definitions can vary across jurisdictions.
Total
Procedures involving the wrong patient or body part resulting in death or major
permanent loss of function.
Suicide of a patient in an inpatient unit.
Retained instruments or other material after surgery requiring re-operation or further
surgical procedure.
Intravascular gas embolism resulting in death or neurological damage.
Infant discharged to the wrong family.
Haemolytic blood transfusion reaction resulting from ABO (blood group) incompatibility.
Medication error leading to the death of a patient reasonably believed to be due to
incorrect administration of drugs.
Maternal death or serious morbidity associated with labour or delivery (b).
REPORT ON
GOVERNMENT
SERVICES 2017
PUBLIC
HOSPITALS
PAGE 1 of TABLE 12A.38

TABLE 12A.39
Table 12A.39
2010-11 2011-12 2012-13 2013-14 2014-15
– 1 – 2 1
1 1 2 6 4
5 5 4 – 1
– – – – 1
– – – – 1
4 – – 3 –
– 1 1 1 2
– – – – –
10 8 7 12 10
(a)
Source : Queensland government (unpublished).
Sentinel events definitions can vary across jurisdictions.
– Nil or rounded to zero.
Procedures involving the wrong patient or body part resulting in death or major
permanent loss of function.
Suicide of a patient in an inpatient unit.
Retained instruments or other material after surgery requiring re-operation or
further surgical procedure.
Queensland selected sentinel events (number) (a)
Total
Intravascular gas embolism resulting in death or neurological damage.
Infant discharged to the wrong family.
Haemolytic blood transfusion reaction resulting from ABO (blood group)
incompatibility.
Medication error leading to the death of a patient reasonably believed to be due
to incorrect administration of drugs.
Maternal death associated with pregnancy, birth or the puerperium.
REPORT ON
GOVERNMENT
SERVICES 2017
PUBLIC
HOSPITALS
PAGE 1 of TABLE 12A.39

TABLE 12A.40
Table 12A.40
2010-11 2011-12 2012-13 2013-14 2014-15
1 1 1 2 –
5 5 7 2 2
1 3 3 1 1
– – – – –
– – – – –
2 – 3 1 2
3 2 1 1 –
– – – 2 –
12 11 15 9 5
(a)
(b)
– Nil or rounded to zero.
Source : WA government (unpublished).
WA selected sentinel events (number) (a)
Total
Intravascular gas embolism resulting in death or neurological damage.
Infant discharged to the wrong family.
Haemolytic blood transfusion reaction resulting from ABO (blood group)
incompatibility.
Medication error leading to the death of a patient reasonably believed to be due to
incorrect administration of drugs.
Maternal death or serious morbidity associated with labour or delivery (b).
WA has supplied data using the sentinel event definition applicable to the data collection period. Most other jurisdictions have retrospectively applied the
amended definition.
Sentinel events definitions can vary across jurisdictions.
Procedures involving the wrong patient or body part resulting in death or major
permanent loss of function.
Suicide of a patient in an inpatient unit.
Retained instruments or other material after surgery requiring re-operation or further
surgical procedure.
REPORT ON
GOVERNMENT
SERVICES 2017
PUBLIC
HOSPITALS
PAGE 1 of TABLE 12A.40

TABLE 12A.41
Table 12A.41
2010-11 2011-12 2012-13 2013-14 2014-15
– – – – –
2 1 1 3 2
3 5 5 1 5
– – – 1 –
– – 1 – –
1 1 – 1 2
– 2 2 – –
– – – – –
6 9 9 6 9
(a)
Source : SA government (unpublished).
– Nil or rounded to zero.
SA selected sentinel events (number) (a)
Sentinel events definitions can vary across jurisdictions.
Total
Procedures involving the wrong patient or body part resulting in death or major
permanent loss of function.
Suicide of a patient in an inpatient unit.
Retained instruments or other material after surgery requiring re-operation or further
surgical procedure.
Intravascular gas embolism resulting in death or neurological damage.
Infant discharged to the wrong family.
Haemolytic blood transfusion reaction resulting from ABO (blood group)
incompatibility.
Medication error leading to the death of a patient reasonably believed to be due to
incorrect administration of drugs.
Maternal death associated with pregnancy, birth or the puerperium.
REPORT ON
GOVERNMENT
SERVICES 2017
PUBLIC
HOSPITALS
PAGE 1 of TABLE 12A.41

TABLE 12A.42
Table 12A.42
2010-11 2011-12 2012-13 2013-14 2014-15
– – – – –
– – – – –
– 1 – – –
– – – 1 –
– – – – –
– – – – –
– – – – –
– – – – –
– 1 – – –
(a)
Source : Tasmanian government (unpublished).
Sentinel events definitions can vary across jurisdictions.
– Nil or rounded to zero.
Procedures involving the wrong patient or body part resulting in death or major
permanent loss of function.
Suicide of a patient in an inpatient unit.
Retained instruments or other material after surgery requiring re-operation or further
surgical procedure.
Tasmania selected sentinel events (number) (a)
Total
Intravascular gas embolism resulting in death or neurological damage.
Infant discharged to the wrong family.
Haemolytic blood transfusion reaction resulting from ABO (blood group) incompatibility.
Medication error leading to the death of a patient reasonably believed to be due to
incorrect administration of drugs.
Maternal death associated with pregnancy, birth or the puerperium.
REPORT ON
GOVERNMENT
SERVICES 2017
PUBLIC
HOSPITALS
PAGE 1 of TABLE 12A.42

TABLE 12A.43
Table 12A.43
2010-11 2011-12 2012-13 2013-14 2014-15
np np np np np
np np np np 3
np np np np np
np np np np np
np np np np np
np np np np np
np np np np np
np np np np np
2 3 3 – 4
(a)
Source :
Haemolytic blood transfusion reaction resulting from ABO (blood group) incompatibility.
Medication error leading to the death of a patient reasonably believed to be due to
incorrect administration of drugs.
Maternal death associated with pregnancy, birth or the puerperium.
ACT selected sentinel events (number) (a)
ACT government (unpublished).
np Not published. – Nil or rounded to zero.
Sentinel events definitions can vary across jurisdictions.
Total
Procedures involving the wrong patient or body part resulting in death or major
permanent loss of function.
Suicide of a patient in an inpatient unit.
Retained instruments or other material after surgery requiring re-operation or further
surgical procedure.
Intravascular gas embolism resulting in death or neurological damage.
Infant discharged to the wrong family.
REPORT ON
GOVERNMENT
SERVICES 2017
PUBLIC
HOSPITALS
PAGE 1 of TABLE 12A.43

TABLE 12A.44
Table 12A.44
2010-11 2011-12 2012-13 2013-14 2014-15
– – – – –
– – 1 1 –
2 – – 1 –
– – – – 1
– – – – –
– – – – –
– – – – 1
– – – – –
2 – 1 2 2
(a)
(b)
Source : NT government (unpublished).
Sentinel events definitions can vary across jurisdictions.
– Nil or rounded to zero.
Procedures involving the wrong patient or body part resulting in death or major
permanent loss of function.
Suicide of a patient in an inpatient unit.
Retained instruments or other material after surgery requiring re-operation or further
surgical procedure.
The NT has supplied data using the sentinel event definition applicable to the data collection period. Most other jurisdictions have retrospectively applied
the amended definition.
NT selected sentinel events (number) (a)
Total
Intravascular gas embolism resulting in death or neurological damage.
Infant discharged to the wrong family.
Haemolytic blood transfusion reaction resulting from ABO (blood group) incompatibility.
Medication error leading to the death of a patient reasonably believed to be due to
incorrect administration of drugs.
Maternal death or serious morbidity associated with labour or delivery (b).
REPORT ON
GOVERNMENT
SERVICES 2017
PUBLIC
HOSPITALS
PAGE 1 of TABLE 12A.44

TABLE 12A.45
Table 12A.45
2010-11 2011-12 2012-13 2013-14 2014-15
3 4 1 4 1
29 35 35 37 30
26 35 31 27 33
2 – 2 5 5
1 1 2 – 1
11 6 6 20 14
11 13 10 8 14
– – – 2 –
85 97 90 102 99
(a)
(b)
Source : State and Territory governments (unpublished).
– Nil or rounded to zero.
Australia selected sentinel events (number) (a)
Sentinel events definitions can vary across jurisdictions.
Infant discharged to the wrong family.
Haemolytic blood transfusion reaction resulting from ABO (blood group) incompatibility.
Medication error leading to the death of a patient reasonably believed to be due to
incorrect administration of drugs.
Maternal death associated with pregnancy, birth or the puerperium.
Total (b)
Procedures involving the wrong patient or body part resulting in death or major
permanent loss of function.
Suicide of a patient in an inpatient unit.
Retained instruments or other material after surgery requiring re-operation or further
surgical procedure.
The total includes sentinel events for the ACT which are not reported in the 8 sub categories of sentinel events due to confidentiality issues.
Intravascular gas embolism resulting in death or neurological damage.
REPORT ON
GOVERNMENT
SERVICES 2017
PUBLIC
HOSPITALS
PAGE 1 of TABLE 12A.45

TABLE 12A.46
Table 12A.46
unit NSW Vic (b) Qld WA SA Tas (b) ACT (b),(h) NT (b) Aust
Major cities % 84.5 87.0 87.8 90.1 83.8 .. 81.5 .. 86.8
Other (c) % 88.1 86.6 89.5 91.3 85.5 84.4 - 90.9 87.6
Total (d) % 86.2 86.7 87.5 90.0 84.5 84.4 81.5 90.9 87.0
Major cities % 0.5 3.0 2.1 2.1 1.5 .. 5.4 .. 0.9
Other (c) % 2.9 2.6 3.5 3.7 4.3 1.7 - 3.5 1.3
Total (d) % 1.6 1.8 2.0 1.6 1.7 1.7 5.4 3.5 0.8
Major cities ± 0.9 5.1 3.6 3.6 2.4 .. 8.7 .. 1.6
Other (c) ± 5.1 4.5 6.1 6.7 7.1 2.7 - 6.3 2.2
Total (d) ± 2.7 3.0 3.4 2.8 2.8 2.7 8.7 6.3 1.3
Major cities % 87.1 89.9 88.5 87.4 87.3 .. 81.8 .. 88.3
Other (c) % 89.6 87.2 90.1 91.3 87.8 85.7 - 92.0 88.9
Total (d) % 88.6 88.6 88.9 88.7 86.4 85.7 81.8 92.0 88.3
Major cities % 1.5 2.6 1.3 3.0 2.1 .. 4.6 .. 1.1
Other (c) % 2.5 1.3 3.2 3.7 3.4 1.8 - 3.0 1.4
Proportion of persons who went to an emergency department in the last 12 months reporting the ED
doctors or specialists always or often: listened carefully, showed respect, and spent enough time with
them, by State and Territory, by remoteness, 2015-16 (a), (b), (e), (f), (g)
Proportion of persons who went to an emergency department in the last 12 months reporting the ED doctors or specialists always or often listened carefully to
themproportion
Proportion of persons who went to an emergency department in the last 12 months reporting the ED doctors or specialists always or often showed respect to
them
relative standard error
95 per cent confidence interval
proportion
relative standard error
REPORT ON
GOVERNMENT
SERVICES 2017
PUBLIC
HOSPITALS
PAGE 1 of TABLE 12A.46

TABLE 12A.46
Table 12A.46
unit NSW Vic (b) Qld WA SA Tas (b) ACT (b),(h) NT (b) Aust
Proportion of persons who went to an emergency department in the last 12 months reporting the ED
doctors or specialists always or often: listened carefully, showed respect, and spent enough time with
them, by State and Territory, by remoteness, 2015-16 (a), (b), (e), (f), (g)
Total (d) % 2.0 1.7 1.7 1.9 0.7 1.8 4.6 3.0 0.9
Major cities ± 2.6 4.6 2.3 5.1 3.7 .. 7.4 .. 1.9
Other (c) ± 4.5 2.3 5.6 6.7 5.8 3.1 - 5.5 2.5
Total (d) ± 3.4 2.9 3.0 3.4 1.2 3.1 7.4 5.5 1.6
Major cities % 80.9 83.3 84.6 86.4 80.8 .. 74.8 .. 83.1
Other (c) % 82.8 83.9 89.6 85.0 82.8 83.7 - 90.3 84.9
Total(d) % 81.6 83.9 86.2 86.7 80.6 83.7 74.8 90.3 83.6
Major cities % 1.3 3.3 2.1 3.2 1.9 .. 6.7 .. 1.6
Other (c) % 3.4 3.0 3.5 5.8 3.5 2.6 - 3.5 1.4
Total(d) % 1.6 1.8 2.2 3.4 2.4 2.6 6.7 3.5 1.3
Major cities ± 2.1 5.4 3.6 5.4 3.0 .. 9.9 .. 2.6
Other (c) ± 5.5 4.9 6.2 9.7 5.6 4.2 - 6.2 2.3
Total(d) ± 2.5 3.0 3.7 5.7 3.8 4.2 9.9 6.2 2.0
(a)
(b)
Proportion of persons who went to an emergency department in the last 12 months reporting the ED doctors or specialists always or often spent enough time
with them
Persons 15 years and over who went to an emergency department for their own health in the last 12 months, excluding interviews by proxy. Excludes those
who responded don't know.
95 per cent confidence interval
relative standard error
proportion
95 per cent confidence interval
There are no very remote areas in Victoria; no major cities in Tasmania; no outer regional, remote or very remote areas in the ACT; and no inner regional or
major cities in the NT.
REPORT ON
GOVERNMENT
SERVICES 2017
PUBLIC
HOSPITALS
PAGE 2 of TABLE 12A.46

TABLE 12A.46
Table 12A.46
unit NSW Vic (b) Qld WA SA Tas (b) ACT (b),(h) NT (b) Aust
Proportion of persons who went to an emergency department in the last 12 months reporting the ED
doctors or specialists always or often: listened carefully, showed respect, and spent enough time with
them, by State and Territory, by remoteness, 2015-16 (a), (b), (e), (f), (g)
(c)
(d)
(e)
(f)
(g)
(h)
.. Not applicable. – Nil or rounded to zero.
Source :
Data for the NT should be interpreted with caution as the Patient Experience Survey excluded discrete Aboriginal and Torres Strait Islander communities,
which comprise around 25 per cent of the estimated resident population of the NT living in private dwellings.
ABS (unpublished) Patient Experience Survey 2015-16
For more information on data quality, including collection methodologies and data limitations, see the Patient Experience Survey (cat. no. 4839.0) on the ABS
website.
Crude rates.
Cells in this table have been randomly adjusted to avoid the release of confidential data. Discrepancies may occur between sums of the component items
and totals.
Includes inner and outer regional, remote and very remote areas.
Excludes didn't see any doctors or specialists.
REPORT ON
GOVERNMENT
SERVICES 2017
PUBLIC
HOSPITALS
PAGE 3 of TABLE 12A.46

TABLE 12A.47
Table 12A.47
unit NSW Vic (b) Qld WA SA Tas (b) ACT (b),(h) NT (b) Aust
Major cities % 87.2 93.0 93.8 88.3 87.9 .. #88.4 .. 90.2
Other (c) % 89.1 87.8 91.9 98.4 86.6 91.8 - 88.9 90.1
Total (d) % 87.8 91.2 91.9 91.2 87.3 91.8 #88.4 88.9 90.3
Major cities % 2.8 1.8 1.3 3.3 1.6 .. 6.1 .. 1.4
Other (c) % 1.5 2.1 1.4 2.2 4.1 1.8 - 2.8 1.1
Total (d) % 1.8 1.7 1.4 2.4 1.5 1.8 6.1 2.8 0.9
Major cities ± 4.8 3.2 2.4 5.7 2.8 .. 10.5 .. 2.5
Other (c) ± 2.6 3.6 2.6 4.3 7.0 3.3 - 4.8 1.9
Total (d) ± 3.2 3.1 2.6 4.3 2.6 3.3 10.5 4.8 1.6
Major cities % 90.1 94.2 94.4 88.3 87.8 .. #86.8 .. 91.3
Other (c) % 90.1 88.7 94.5 98.4 84.4 91.8 - 88.9 91.4
Total (d) % 89.5 92.2 93.6 91.4 87.1 91.8 #86.8 88.9 91.5
Major cities % 2.0 1.9 1.2 3.3 1.2 .. 6.2 .. 1.4
Other (c) % 2.3 2.2 1.0 2.2 1.6 1.8 - 2.3 0.8
Total (d) % 1.4 1.9 1.3 2.1 1.2 1.8 6.2 2.3 1.0
Proportion of persons who went to an emergency department in the last 12 months reporting the ED
nurses always or often: listened carefully, showed respect, and spent enough time with them, by
remoteness, by State and Territory, 2015-16 (a), (b), (e), (f), (g)
Proportion of persons who went to an emergency department in the last 12 months reporting the ED nurses always or often listened carefully to them
Proportion of persons who went to an emergency department in the last 12 months reporting the ED nurses always or often showed respect to them
proportion
relative standard error
95 per cent confidence interval
proportion
relative standard error
REPORT ON
GOVERNMENT
SERVICES 2017
PUBLIC
HOSPITALS
PAGE 1 of TABLE 12A.47

TABLE 12A.47
Table 12A.47
unit NSW Vic (b) Qld WA SA Tas (b) ACT (b),(h) NT (b) Aust
Proportion of persons who went to an emergency department in the last 12 months reporting the ED
nurses always or often: listened carefully, showed respect, and spent enough time with them, by
remoteness, by State and Territory, 2015-16 (a), (b), (e), (f), (g)
Major cities ± 3.5 3.5 2.2 5.6 2.1 .. 10.6 .. 2.5
Other (c) ± 4.0 3.8 1.9 4.3 2.6 3.2 - 4.1 1.5
Total (d) ± 2.4 3.4 2.4 3.8 2.1 3.2 10.6 4.1 1.8
Major cities % 83.0 89.7 87.9 86.5 82.3 .. #79.0 .. 86.1
Other (c) % 85.5 85.1 92.5 97.2 81.1 89.2 - 89.1 88.7
Total (d) % 84.5 87.4 90.2 90.4 82.6 89.2 #79.0 89.1 87.1
Major cities % 2.7 2.5 1.9 3.0 1.9 .. 7.1 .. 1.7
Other (c) % 2.0 3.4 1.5 0.9 4.4 1.2 - 2.9 1.0
Total (d) % 2.0 2.6 1.0 2.1 2.3 1.2 7.1 2.9 1.3
Major cities ± 4.3 4.4 3.3 5.1 3.1 .. 10.9 .. 2.8
Other (c) ± 3.4 5.6 2.7 1.8 7.1 2.0 - 5.1 1.8
Total (d) ± 3.3 4.5 1.7 3.7 3.7 2.0 10.9 5.1 2.1
(a)
(b)
(c) Includes inner and outer regional, remote and very remote areas.
proportion
95 per cent confidence interval
Persons 15 years and over who went to an emergency department for their own health in the last 12 months, excluding interviews by proxy. Excludes those
who responded don't know.
There are no very remote areas in Victoria; no major cities in Tasmania; no outer regional, remote or very remote areas in the ACT; and no inner regional or
major cities in the NT.
relative standard error
Proportion of persons who went to an emergency department in the last 12 months reporting the ED nurses always or often spent enough time with them
95 per cent confidence interval
REPORT ON
GOVERNMENT
SERVICES 2017
PUBLIC
HOSPITALS
PAGE 2 of TABLE 12A.47

TABLE 12A.47
Table 12A.47
unit NSW Vic (b) Qld WA SA Tas (b) ACT (b),(h) NT (b) Aust
Proportion of persons who went to an emergency department in the last 12 months reporting the ED
nurses always or often: listened carefully, showed respect, and spent enough time with them, by
remoteness, by State and Territory, 2015-16 (a), (b), (e), (f), (g)
(d)
(e)
(f)
(g)
(h)
Source :
For more information on data quality, including collection methodologies and data limitations, see the Patient Experience Survey (cat. no. 4839.0) on the ABS
website.
Crude rates.
Data for the NT should be interpreted with caution as the Patient Experience Survey excluded discrete Aboriginal and Torres Strait Islander communities,
which comprise around 25 per cent of the estimated resident population of the NT living in private dwellings.
.. Not applicable. – Nil or rounded to zero.
ABS (unpublished) Patient Experience Survey 2015-16
Cells in this table have been randomly adjusted to avoid the release of confidential data. Discrepancies may occur between sums of the component items
and totals.
# Proportion has a margin of error >10 percentage points which should be considered when using this information
Excludes didn't see any nurses.
REPORT ON
GOVERNMENT
SERVICES 2017
PUBLIC
HOSPITALS
PAGE 3 of TABLE 12A.47

TABLE 12A.48
Table 12A.48
unit NSW Vic (b) Qld WA SA Tas (b) ACT (b),(h) NT (b) Aust
Major cities % 91.3 94.2 92.3 93.3 89.8 .. #85.1 .. 92.8
Other (c) % 89.8 89.8 91.6 97.5 85.7 89.9 - #91.9 90.2
Total(d) % 92.3 93.0 92.8 93.2 90.1 89.9 #85.1 #91.9 92.2
Major cities % 2.8 1.5 2.1 2.2 2.8 .. 6.1 .. 0.8
Other (c) % 1.7 0.5 1.9 3.2 1.7 1.9 - 6.0 0.6
Total(d) % 1.7 0.5 1.9 2.2 2.3 1.9 6.1 6.0 0.5
Major cities ± 5.0 2.8 3.8 4.0 4.9 .. 10.1 .. 1.4
Other (c) ± 3.0 0.8 3.5 6.1 2.9 3.4 - 10.8 1.1
Total(d) ± 3.0 0.9 3.4 4.0 4.0 3.4 10.1 10.8 0.9
Major cities % 90.7 94.0 93.6 93.4 90.2 .. 87.5 .. 92.7
Other (c) % 92.2 92.7 91.4 #90.3 89.7 90.6 - 93.9 91.6
Total(d) % 91.3 92.9 93.2 94.1 92.3 90.6 87.5 93.9 92.5
Major cities % 2.7 1.1 1.9 2.3 0.8 .. 4.1 .. 0.8
Other (c) % 2.9 0.9 2.5 7.2 4.2 1.0 - 5.4 1.8
Proportion of persons who were admitted to hospital in the last 12 months reporting the hospital
doctors or specialists always or often: listened carefully, showed respect, and spent enough time with
them, by remoteness, by State and Territory, 2015-16 (a), (b), (e), (f), (g)
Proportion of persons who were admitted to hospital in the last 12 months reporting the hospital doctors or specialists always or often listened carefully to them
Proportion of persons who were admitted to hospital in the last 12 months reporting the hospital doctors or specialists always or often showed respect to them
proportion
relative standard error
95 per cent confidence interval
proportion
relative standard error
REPORT ON
GOVERNMENT
SERVICES 2017
PUBLIC
HOSPITALS
PAGE 1 of TABLE 12A.48

TABLE 12A.48
Table 12A.48
unit NSW Vic (b) Qld WA SA Tas (b) ACT (b),(h) NT (b) Aust
Proportion of persons who were admitted to hospital in the last 12 months reporting the hospital
doctors or specialists always or often: listened carefully, showed respect, and spent enough time with
them, by remoteness, by State and Territory, 2015-16 (a), (b), (e), (f), (g)
Total(d) % 2.1 0.6 2.0 2.3 0.6 1.0 4.1 5.4 0.7
Major cities ± 4.7 2.0 3.5 4.2 1.4 .. 7.1 .. 1.5
Other (c) ± 5.2 1.6 4.5 12.8 7.4 1.8 - 9.9 3.1
Total(d) ± 3.8 1.2 3.7 4.3 1.1 1.8 7.1 9.9 1.2
Major cities % 88.2 91.8 90.5 88.3 86.2 .. 81.0 .. 89.4
Other (c) % 88.7 88.7 91.8 92.5 85.8 84.6 - #87.5 87.9
Total(d) % 88.3 90.0 90.8 89.3 86.7 84.6 81.0 #87.5 88.9
Major cities % 2.0 1.0 2.6 3.1 1.0 .. 5.8 .. 0.9
Other (c) % 3.4 3.8 2.2 1.8 4.4 3.7 - 7.2 1.7
Total(d) % 1.8 1.2 2.4 2.8 1.0 3.7 5.8 7.2 0.3
Major cities ± 3.5 1.8 4.6 5.5 1.7 .. 9.2 .. 1.5
Other (c) ± 6.0 6.6 3.9 3.3 7.4 6.1 - 12.4 3.0
Total(d) ± 3.2 2.2 4.2 4.8 1.7 6.1 9.2 12.4 0.6
(a)
(b)
Persons 15 years and over who were admitted to hospital for their own health in the last 12 months, excluding interviews by proxy. Excludes those who
responded don't know.
There are no very remote areas in Victoria; no major cities in Tasmania; no outer regional, remote or very remote areas in the ACT; and no inner regional or
major cities in the NT.
relative standard error
proportion
95 per cent confidence interval
Proportion of persons who were admitted to hospital in the last 12 months reporting the hospital doctors or specialists always or often spent enough time with
them
95 per cent confidence interval
REPORT ON
GOVERNMENT
SERVICES 2017
PUBLIC
HOSPITALS
PAGE 2 of TABLE 12A.48

TABLE 12A.48
Table 12A.48
unit NSW Vic (b) Qld WA SA Tas (b) ACT (b),(h) NT (b) Aust
Proportion of persons who were admitted to hospital in the last 12 months reporting the hospital
doctors or specialists always or often: listened carefully, showed respect, and spent enough time with
them, by remoteness, by State and Territory, 2015-16 (a), (b), (e), (f), (g)
(c)
(d)
(e)
(f)
(g)
(h)
Source : ABS (unpublished) Patient Experience Survey 2015-16
For more information on data quality, including collection methodologies and data limitations, see the Patient Experience Survey (cat. no. 4839.0) on the ABS
website.
Cells in this table have been randomly adjusted to avoid the release of confidential data. Discrepancies may occur between sums of the component items
and totals.
Excludes didn't see any doctors or specialists.
Crude rates.
Includes inner and outer regional, remote and very remote areas.
# Proportion has a margin of error >10 percentage points which should be considered when using this information
.. Not applicable. – Nil or rounded to zero.
Data for the NT should be interpreted with caution as the Patient Experience Survey excluded discrete Aboriginal and Torres Strait Islander communities,
which comprise around 25 per cent of the estimated resident population of the NT living in private dwellings.
REPORT ON
GOVERNMENT
SERVICES 2017
PUBLIC
HOSPITALS
PAGE 3 of TABLE 12A.48

TABLE 12A.49
Table 12A.49
unit NSW Vic (b) Qld WA SA Tas (b) ACT (b),(h) NT (b) Aust
Proportion of persons who were admitted to hospital in the last 12 months reporting the hospital nurses always or often listened carefully to them
Major cities % 90.9 91.9 93.0 92.8 87.6 .. 85.5 .. 91.7
Other (c) % 90.5 94.5 94.9 96.6 89.1 90.7 – 88.9 92.3
Total (d) % 90.7 92.1 93.5 94.3 88.7 90.7 85.5 88.9 92.0
Major cities % 1.6 2.5 2.2 2.2 2.5 .. 2.9 .. 1.1
Other (c) % 1.9 0.8 1.7 3.6 2.7 0.3 – 4.5 1.3
Total (d) % 0.7 1.2 1.2 2.0 1.7 0.3 2.9 4.5 0.6
Major cities ± 2.8 4.5 3.9 4.0 4.3 .. 4.9 .. 2.0
Other (c) ± 3.4 1.6 3.1 6.8 4.7 0.5 – 7.9 2.4
Total (d) ± 1.3 2.1 2.3 3.8 3.0 0.5 4.9 7.9 1.2
Proportion of persons who were admitted to hospital in the last 12 months reporting the hospital nurses always or often showed respect to them
Major cities % 90.9 92.7 94.0 92.5 91.6 .. 86.7 .. 92.4
Other (c) % 91.4 96.6 94.1 97.7 89.4 93.3 - 88.8 92.9
Total (d) % 90.3 94.2 93.6 94.3 90.9 93.3 86.7 88.8 92.6
Major cities % 0.7 2.3 1.6 2.2 2.0 .. 3.1 .. 1.1
Other (c) % 2.0 1.3 2.2 1.7 3.9 0.5 - 5.1 0.9
Total (d) % 0.6 1.0 1.1 1.7 1.6 0.5 3.1 5.1 0.6
Proportion of persons who were admitted to hospital in the last 12 months reporting the hospital
nurses always or often: listened carefully, showed respect, and spent enough time with them, by
State and Territory, by remoteness, 2015-16 (a), (b), (e), (f), (g)
proportion
relative standard error
95 per cent confidence interval
relative standard error
proportion
95 per cent confidence interval
REPORT ON
GOVERNMENT
SERVICES 2017
PUBLIC
HOSPITALS
PAGE 1 of TABLE 12A.49

TABLE 12A.49
Table 12A.49
unit NSW Vic (b) Qld WA SA Tas (b) ACT (b),(h) NT (b) Aust
Proportion of persons who were admitted to hospital in the last 12 months reporting the hospital
nurses always or often: listened carefully, showed respect, and spent enough time with them, by
State and Territory, by remoteness, 2015-16 (a), (b), (e), (f), (g)
Major cities ± 1.3 4.1 2.9 4.0 3.7 .. 5.2 .. 1.9
Other (c) ± 3.5 2.4 3.9 3.3 6.8 0.9 - 8.9 1.6
Total (d) ± 1.0 1.9 2.0 3.1 2.8 0.9 5.2 8.9 1.1
Major cities % 89.3 89.8 91.5 90.3 88.5 .. 85.7 .. 89.8
Other (c) % 90.9 92.2 94.7 93.5 81.1 89.6 - 89.4 90.4
Total (d) % 89.7 90.3 92.2 91.0 86.8 89.6 85.7 89.4 90.2
Major cities % 1.6 1.8 2.1 2.8 2.1 .. 4.3 .. 0.6
Other (c) % 3.2 2.8 2.2 2.5 4.1 2.1 - 5.1 1.0
Total (d) % 1.5 1.2 1.5 2.1 1.9 2.1 4.3 5.1 0.3
Major cities ± 2.9 3.2 3.8 4.9 3.7 .. 7.2 .. 1.1
Other (c) ± 5.8 5.1 4.1 4.6 6.6 3.8 - 8.9 1.8
Total (d) ± 2.6 2.1 2.6 3.8 3.3 3.8 7.2 8.9 0.6
(a)
(b)
(c)
(d)
Proportion of persons who were admitted to hospital in the last 12 months reporting the hospital nurses always or often spent enough time with them
Persons 15 years and over who were admitted to hospital for their own health in the last 12 months, excluding interviews by proxy. Excludes those who
responded don't know.
Includes inner and outer regional, remote and very remote areas.
There are no very remote areas in Victoria; no major cities in Tasmania; no outer regional, remote or very remote areas in the ACT; and no inner regional
or major cities in the NT.
Excludes didn't see any nurses.
proportion
relative standard error
95 per cent confidence interval
REPORT ON
GOVERNMENT
SERVICES 2017
PUBLIC
HOSPITALS
PAGE 2 of TABLE 12A.49

TABLE 12A.49
Table 12A.49
unit NSW Vic (b) Qld WA SA Tas (b) ACT (b),(h) NT (b) Aust
Proportion of persons who were admitted to hospital in the last 12 months reporting the hospital
nurses always or often: listened carefully, showed respect, and spent enough time with them, by
State and Territory, by remoteness, 2015-16 (a), (b), (e), (f), (g)
(e)
(f)
(g)
(h)
Source : ABS (unpublished) Patient Experience Survey 2015-16
.. Not applicable. – Nil or rounded to zero.
Crude rates.
Data for the NT should be interpreted with caution as the Patient Experience Survey excluded discrete Aboriginal and Torres Strait Islander communities,
which comprise around 25 per cent of the estimated resident population of the NT living in private dwellings.
For more information on data quality, including collection methodologies and data limitations, see the Patient Experience Survey (cat. no. 4839.0) on the
ABS website.
Cells in this table have been randomly adjusted to avoid the release of confidential data. Discrepancies may occur between sums of the component items
and totals.
REPORT ON
GOVERNMENT
SERVICES 2017
PUBLIC
HOSPITALS
PAGE 3 of TABLE 12A.49

TABLE 12A.50
Table 12A.50
NSW Vic Qld WA SA Tas ACT NT Aust (g) Aust (g)
no.
2010-11
Surgical procedure prior to separation
Knee replacement 21.7 22.0 37.5 31.1 19.6 31.7 np np 24.4 242
Hip replacement 16.5 20.8 14.2 14.7 10.3 np np np 16.5 119
Tonsillectomy and Adenoidectomy 22.9 23.9 31.0 34.4 31.3 37.6 19.3 np 26.3 516
Hysterectomy 29.1 28.9 34.7 33.5 28.1 40.1 np np 30.5 284
Prostatectomy 27.2 20.9 25.8 38.0 21.9 np np np 25.1 174
Cataract surgery 3.2 3.9 4.0 4.3 4.0 – – np 3.5 166
Appendicectomy 24.8 25.6 19.6 30.8 22.8 19.9 37.7 40.2 24.2 548
2011-12
Surgical procedure prior to separation
Knee replacement 18.5 19.1 26.9 17.4 17.7 np np np 20.0 204
Hip replacement 17.7 17.4 14.2 22.5 23.7 np np np 17.7 129
Tonsillectomy and Adenoidectomy 24.8 23.7 32.6 33.3 33.7 60.6 18.3 np 27.8 557
Hysterectomy 27.9 32.4 33.2 31.5 28.1 28.1 np np 30.9 281
Prostatectomy 22.7 26.4 36.3 50.3 25.9 np np np 27.2 181
Cataract surgery 2.8 3.2 4.0 2.6 3.3 7.2 – np 3.2 156
Appendicectomy 23.5 24.5 20.4 31.3 36.0 29.8 26.3 49.6 24.7 623
2012-13
Surgical procedure prior to separation
Knee replacement 21.6 15.1 35.1 22.3 18.6 37.0 – np 22.4 227
Hip replacement 18.0 16.1 16.1 15.9 19.3 29.6 12.9 np 17.5 130
Tonsillectomy and Adenoidectomy 30.3 29.1 35.7 42.4 37.5 51.9 44.7 83.0 33.1 673
Hysterectomy 31.6 25.9 31.8 43.6 28.7 52.0 23.1 np 30.6 277
Selected unplanned hospital readmissions rates (a), (b), (c), (d), (e), (f)
rate per 1000 separations
REPORT ON
GOVERNMENT
SERVICES 2017
PUBLIC
HOSPITALS
PAGE 1 of TABLE 12A.50

TABLE 12A.50
Table 12A.50
NSW Vic Qld WA SA Tas ACT NT Aust (g) Aust (g)
no.
Selected unplanned hospital readmissions rates (a), (b), (c), (d), (e), (f)
rate per 1000 separations
Prostatectomy 27.3 26.5 40.7 33.9 28.9 57.8 np np 31.1 198
Cataract surgery 3.4 3.0 4.6 2.6 2.9 4.4 0.9 6.0 3.4 167
Appendicectomy 22.4 22.8 22.0 29.0 27.0 26.5 20.4 43.5 23.1 584
2013-14
Surgical procedure prior to separation
Knee replacement 21.4 21.2 31.3 34.4 18.5 33.8 30.6 np 23.7 264
Hip replacement 18.1 16.3 19.3 24.8 20.9 14.9 18.4 – 17.8 145
Tonsillectomy and Adenoidectomy 28.5 30.1 43.4 45.4 35.7 35.3 27.3 58.5 33.0 683
Hysterectomy 28.6 26.0 34.8 37.3 30.9 8.4 64.1 np 29.8 281
Prostatectomy 25.8 19.8 30.4 29.6 29.3 30.5 np np 25.5 165
Cataract surgery 2.7 3.7 4.3 2.1 1.7 2.1 – 9.3 3.1 162
Appendicectomy 18.3 20.3 19.7 32.9 25.7 19.1 30.2 34.9 20.3 538
2014-15
Surgical procedure prior to separation
Knee replacement 19.4 19.4 36.3 28.1 18.6 18.3 7.0 np 22.7 265
Hip replacement 16.9 16.1 23.5 16.7 7.1 21.6 8.5 np 17.1 151
Tonsillectomy and Adenoidectomy 31.7 26.0 49.5 41.3 53.9 34.9 31.3 105.0 35.7 752
Hysterectomy 28.6 28.4 40.9 38.6 25.5 27.5 78.3 np 31.6 301
Prostatectomy 23.0 23.4 33.0 12.6 13.0 0 np np 24.3 155
Cataract surgery 2.5 2.9 5.1 3.1 2.5 4.1 0.9 10.1 3.1 167
Appendicectomy 20.5 19.8 23.9 35.1 26.7 36.5 14.3 37.7 22.0 583
(a)
(b)
(c)
The reported rate is the number of unplanned/unexpected readmissions per 1000 separations.
Only the first readmission following surgery was included. A readmission was not included if there was an intervening unrelated separation.
This indicator is limited to public hospitals.
REPORT ON
GOVERNMENT
SERVICES 2017
PUBLIC
HOSPITALS
PAGE 2 of TABLE 12A.50
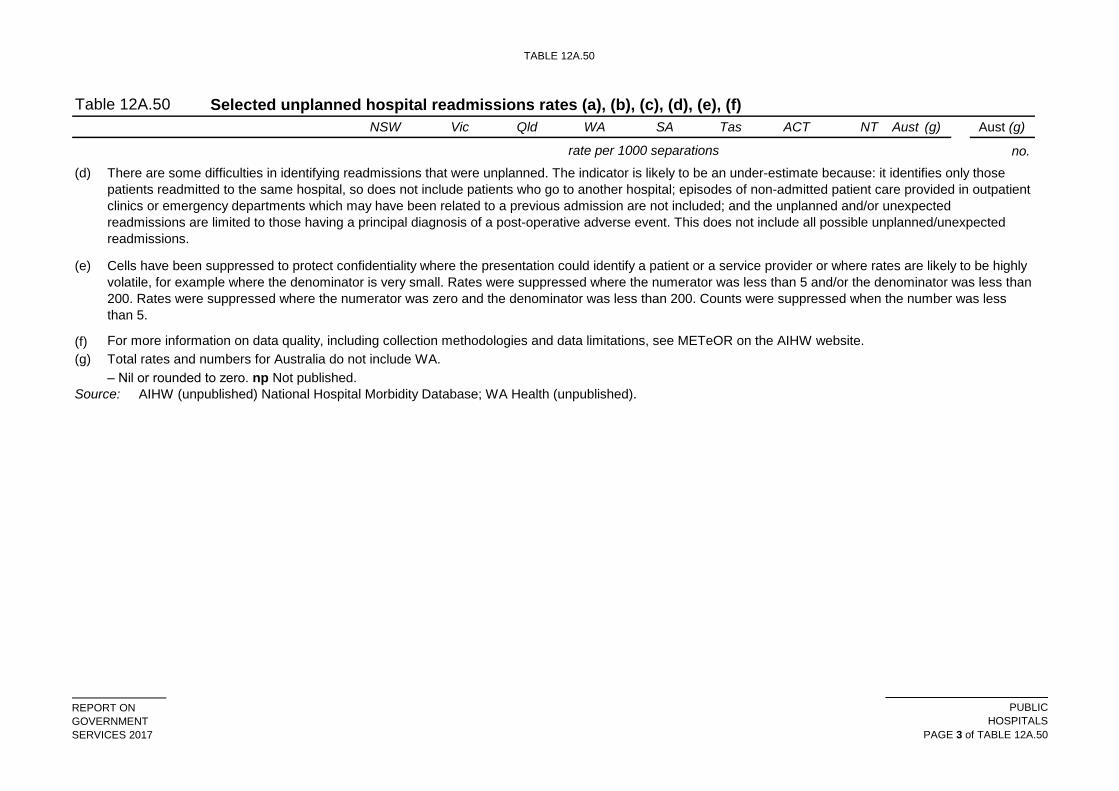
TABLE 12A.50
Table 12A.50
NSW Vic Qld WA SA Tas ACT NT Aust (g) Aust (g)
no.
Selected unplanned hospital readmissions rates (a), (b), (c), (d), (e), (f)
rate per 1000 separations
(d)
(e)
(f) For more information on data quality, including collection methodologies and data limitations, see METeOR on the AIHW website.
(g)
– Nil or rounded to zero. np Not published.
Source: AIHW (unpublished) National Hospital Morbidity Database; WA Health (unpublished).
Total rates and numbers for Australia do not include WA.
Cells have been suppressed to protect confidentiality where the presentation could identify a patient or a service provider or where rates are likely to be highly
volatile, for example where the denominator is very small. Rates were suppressed where the numerator was less than 5 and/or the denominator was less than
200. Rates were suppressed where the numerator was zero and the denominator was less than 200. Counts were suppressed when the number was less
than 5.
There are some difficulties in identifying readmissions that were unplanned. The indicator is likely to be an under-estimate because: it identifies only those
patients readmitted to the same hospital, so does not include patients who go to another hospital; episodes of non-admitted patient care provided in outpatient
clinics or emergency departments which may have been related to a previous admission are not included; and the unplanned and/or unexpected
readmissions are limited to those having a principal diagnosis of a post-operative adverse event. This does not include all possible unplanned/unexpected
readmissions.
REPORT ON
GOVERNMENT
SERVICES 2017
PUBLIC
HOSPITALS
PAGE 3 of TABLE 12A.50

TABLE 12A.51
Table 12A.51
Rate Number
Knee replacement
Hospital peer group
Principal referral and Women's and children's hospitals 29.3 84
Public acute group A hospitals 23.3 138
Public acute group B hospitals 19.3 37
Other hospitals 6.2 6
Indigenous status (f)
Indigenous 15.9 3
Other Australians 22.8 262
Remoteness of residence (g)
Major cities 21.9 145
Inner regional 22.2 75
Outer regional 25.4 37
Remote & Very remote 44.2 8
SEIFA of residence (h)
Quintile 1 24.8 92
Quintile 2 20.2 63
Quintile 3 26.4 59
Quintile 4 23.6 39
Quintile 5 12.9 12
Hip replacement
Hospital peer group
Principal referral and Women's and children's hospitals 23.3 60
Public acute group A hospitals 16.5 71
Public acute group B hospitals 14.2 18
Other hospitals 3.0 2
Indigenous status (f)
Indigenous 19.0 2
Other Australians 17.1 149
Remoteness of residence (g)
Major cities 16.4 82
Inner regional 18.6 48
Outer regional 17.5 19
Remote & Very remote 13.3 2
SEIFA of residence (h)
Quintile 1 20.1 50
Quintile 2 12.8 30
Quintile 3 20.5 36
Unplanned hospital readmission rates, by Indigenous status,
hospital peer group, remoteness and SEIFA IRSD quintiles,
2014-15 (a), (b), (c), (d), (e)
REPORT ON
GOVERNMENT
SERVICES 2017
PUBLIC
HOSPITALS
PAGE 1 of TABLE 12A.51

TABLE 12A.51
Table 12A.51
Rate Number
Unplanned hospital readmission rates, by Indigenous status,
hospital peer group, remoteness and SEIFA IRSD quintiles,
2014-15 (a), (b), (c), (d), (e)
Quintile 4 14.4 19
Quintile 5 17.8 16
Tonsillectomy and Adenoidectomy
Hospital peer group
Principal referral and Women's and children's hospitals 51.7 385
Public acute group A hospitals 34.1 263
Public acute group B hospitals 20.1 57
Other hospitals 15.2 47
Indigenous status (f)
Indigenous 51.9 73
Other Australians 34.5 679
Remoteness of residence (g)
Major cities 40.3 497
Inner regional 27.0 155
Outer regional 30.4 78
Remote & Very remote 52.4 22
SEIFA of residence (h)
Quintile 1 38.4 247
Quintile 2 31.7 171
Quintile 3 34.7 149
Quintile 4 33.9 107
Quintile 5 43.5 78
Hysterectomy
Hospital peer group
Principal referral and Women's and children's hospitals 31.0 118
Public acute group A hospitals 38.1 136
Public acute group B hospitals 21.2 28
Other hospitals 23.1 19
Indigenous status (f)
Indigenous 35.1 12
Other Australians 31.5 289
Remoteness of residence (g)
Major cities 34.2 191
Inner regional 29.2 74
Outer regional 25.9 31
Remote & Very remote 26.5 5
SEIFA of residence (h)
Quintile 1 27.1 76
REPORT ON
GOVERNMENT
SERVICES 2017
PUBLIC
HOSPITALS
PAGE 2 of TABLE 12A.51

TABLE 12A.51
Table 12A.51
Rate Number
Unplanned hospital readmission rates, by Indigenous status,
hospital peer group, remoteness and SEIFA IRSD quintiles,
2014-15 (a), (b), (c), (d), (e)
Quintile 2 31.5 71
Quintile 3 35.7 71
Quintile 4 32.8 50
Quintile 5 35.3 33
Prostatectomy
Hospital peer group
Principal referral and Women's and children's hospitals 28.9 58
Public acute group A hospitals 26.0 82
Public acute group B hospitals 9.9 6
Other hospitals 14.8 9
Indigenous status (f)
Indigenous np 5
Other Australians 23.8 150
Remoteness of residence (g)
Major cities 26.6 100
Inner regional 22.1 37
Outer regional 20.2 17
Remote & Very remote np 1
SEIFA of residence (h)
Quintile 1 23.2 45
Quintile 2 18.6 31
Quintile 3 23.9 30
Quintile 4 38.2 34
Quintile 5 24.2 15
Cataract surgery
Hospital peer group
Principal referral and Women's and children's hospitals 5.2 56
Public acute group A hospitals 2.6 34
Public acute group B hospitals 2.3 23
Other hospitals 2.6 54
Indigenous status (f)
Indigenous 7.3 9
Other Australians 3.0 158
Remoteness of residence (g)
Major cities 3.4 102
Inner regional 2.2 32
Outer regional 2.8 24
Remote & Very remote 5.6 8
REPORT ON
GOVERNMENT
SERVICES 2017
PUBLIC
HOSPITALS
PAGE 3 of TABLE 12A.51

TABLE 12A.51
Table 12A.51
Rate Number
Unplanned hospital readmission rates, by Indigenous status,
hospital peer group, remoteness and SEIFA IRSD quintiles,
2014-15 (a), (b), (c), (d), (e)
SEIFA of residence (h)
Quintile 1 2.9 49
Quintile 2 3.1 46
Quintile 3 3.6 37
Quintile 4 2.4 18
Quintile 5 3.5 16
Appendicectomy
Hospital peer group
Principal referral and Women's and children's hospitals 20.9 215
Public acute group A hospitals 23.8 279
Public acute group B hospitals 18.9 72
Other hospitals 26.0 17
Indigenous status (f)
Indigenous 25.9 28
Other Australians 21.9 555
Remoteness of residence (g)
Major cities 21.2 368
Inner regional 24.0 136
Outer regional 22.3 57
Remote & Very remote 30.5 16
SEIFA of residence (h)
Quintile 1 22.6 137
Quintile 2 20.1 113
Quintile 3 23.4 122
Quintile 4 25.4 130
Quintile 5 18.3 75
(a)
(b)
(c)
(d)
(e)
(f)
Total rates and numbers for Australia do not include WA.
This indicator is limited to public hospitals.
Cells have been suppressed to protect confidentiality where the presentation could identify a patient
or a service provider or where rates are likely to be highly volatile, for example where the
denominator is very small. Rates were suppressed where the numerator was less than 5 and/or the
denominator was less than 200. Rates were suppressed where the numerator was zero and the
denominator was less than 200. Counts were suppressed when the number was less than 5.
Only the first readmission following surgery was included. A readmission was not included if there
was an intervening unrelated separation.
Other Australians' includes separations for non-Indigenous people and those for whom Indigenous
status was not stated.
For more information on data quality, including collection methodologies and data limitations, see
METeOR on the AIHW website.
REPORT ON
GOVERNMENT
SERVICES 2017
PUBLIC
HOSPITALS
PAGE 4 of TABLE 12A.51

TABLE 12A.51
Table 12A.51
Rate Number
Unplanned hospital readmission rates, by Indigenous status,
hospital peer group, remoteness and SEIFA IRSD quintiles,
2014-15 (a), (b), (c), (d), (e)
(g)
(h)
AIHW (unpublished) National Hospital Morbidity Database; WA Health (unpublished).
np Not Published.
Source:
Disaggregation by remoteness area is by the patient's usual residence, not the location of hospital.
Hence, rates represent the number of separations for patients living in each remoteness area
divided by the total number of separations for people living in that remoteness area and hospitalised
in the reporting jurisdiction.
Socio-Economic Indexes for Areas (SEIFA) quintiles are based on the ABS Index of Relative Socio-
Economic Disadvantage (IRSD), with quintile 1 being the most disadvantaged and quintile 5 being
the least disadvantaged. Each SEIFA quintile represents approximately 20 per cent of the national
population, but does not necessarily represent 20 per cent of the population in each state or territory.
Disaggregation by SEIFA is by the patient's usual residence, not the location of the hospital. Hence,
rates represent the number of separations for patients in each SEIFA quintile divided by the total
number of separations for people living in that SEIFA quintile and hospitalised in the reporting
jurisdiction.
REPORT ON
GOVERNMENT
SERVICES 2017
PUBLIC
HOSPITALS
PAGE 5 of TABLE 12A.51

TABLE 12A.52
Table 12A.52
Unit 2006 2007 2008 2009 2010 2011 2012 2013 2014 2015
Nurses (registered and enrolled) in workforce
Major cities no. na 174 214 176 797 176 286 np 213 669 220 210 225 614 230 750 237 233
Inner regional no. na 55 701 56 742 59 076 np 59 342 56 716 57 522 58 141 59 154
Outer regional no. na 24 479 25 342 26 404 np 26 115 26 657 26 896 27 012 27 315
Remote and very remote no. na 5 867 6 680 6 579 np 7 064 7 334 7 098 7 127 6 932
Total no. na 277 297 282 968 291 246 np 306 414 311 176 317 988 323 711 331 015
Proportion of Nurses aged under 30
Major cities % na 15.0 15.0 14.7 na 16.5 16.6 17.4 17.6 17.9
Inner regional % na 10.2 9.9 10.6 na 10.9 10.9 11.7 12.3 12.5
Outer regional % na 10.2 10.5 11.0 na 11.7 12.2 12.9 13.0 13.5
Remote and very remote % na 11.3 12.5 12.0 na 13.4 13.7 14.2 14.1 14.2
Total % na 13.6 13.6 13.5 na 15.0 15.1 15.9 16.2 16.5
Proportion of Nurses aged 30 to 39
Major cities % na 24.6 23.5 23.4 na 22.0 21.8 21.7 21.8 22.4
Inner regional % na 21.1 19.0 19.7 na 16.7 16.5 16.7 16.7 17.2
Outer regional % na 20.6 19.3 20.4 na 17.4 17.3 17.2 17.5 17.7
Remote and very remote % na 24.8 23.0 21.5 na 20.5 19.8 20.1 20.0 20.7
Total % na 23.6 22.3 22.1 na 20.5 20.4 20.4 20.5 21.0
Proportion of Nurses aged 40 to 49
Major cities % na 29.3 28.6 28.0 na 26.5 25.8 25.3 24.8 24.4
Inner regional % na 33.6 32.6 30.6 na 28.4 27.1 25.9 25.4 24.5
Outer regional % na 33.5 32.8 31.0 na 27.3 26.5 25.6 24.6 23.8
Remote and very remote % na 30.6 29.2 29.8 na 24.5 24.4 23.5 23.1 21.8
Total % na 30.4 29.7 28.8 na 26.9 26.1 25.4 24.9 24.3
Proportion of Nurses aged 50 to 59
Major cities % na 24.1 25.4 25.9 na 25.8 26.0 25.5 25.2 24.5
Inner regional % na 28.1 30.5 30.8 na 33.8 34.4 33.8 33.0 32.1
Outer regional % na 27.5 29.2 29.3 na 33.0 32.6 32.2 32.1 31.3
Nursing workforce (includes midwives), by age group and remoteness area (a), (b), (c), (d), (e)
REPORT ON
GOVERNMENT
SERVICES 2017
PUBLIC
HOSPITALS
PAGE 1 of TABLE 12A.52

TABLE 12A.52
Table 12A.52
Unit 2006 2007 2008 2009 2010 2011 2012 2013 2014 2015
Nursing workforce (includes midwives), by age group and remoteness area (a), (b), (c), (d), (e)
Remote and very remote % na 26.7 27.4 28.8 na 31.5 30.9 30.6 30.7 29.7
Total % na 25.2 26.8 27.3 na 28.1 28.2 27.7 27.3 26.5
Proportion of Nurses aged 60+
Major cities % na 7.0 7.4 7.9 na 9.2 9.8 10.1 10.5 10.8
Inner regional % na 7.0 7.9 8.4 na 10.3 11.1 11.9 12.7 13.7
Outer regional % na 8.2 8.1 8.3 na 10.7 11.3 12.1 12.7 13.7
Remote and very remote % na 6.7 7.9 8.0 na 10.2 11.1 11.6 12.1 13.6
Total % na 7.2 7.7 8.2 na 9.5 10.2 10.6 11.1 11.6
(a)
(b)
(c)
(d)
(e)
Source :
na Not available. np Not published.
AIHW National Health Workforce Data Set; Nursing and midwifery labour force survey (unpublished).
No data collected for 2006 and 2010.
In 2008, 2009, 2011, 2012, 2013 and 2014 total include 'Not Stated' for ASGC Remoteness areas. Numbers of 'Not Stated' are significantly higher in 2008 and
2009 than in later years.
Nurses are allocated to a region based on postcode of main job where available; otherwise, postcode of principal practice is used as a proxy. If principal
practice details are unavailable, postocde of residence is used. Records with no information on all 3 locations are coded to 'not stated'. For 2011, region is
based on 2006 version Australian Standard Geographical Classification (ASGC) — Remoteness Areas. For 2012, 2013 and 2014, region is based on 2011
version Australian Statistical Geography Standard (ASGS) — Remoteness Areas. Previous versions of these data were supplied using a mix of 2001 and 2006
versions of the classification so these data may not match earlier supplies.
In 2008, 2009, 2011, 2012, 2013 and 2014 data include registered and enrolled nurses in the workforce: those who are employed in nursing, on extended leave
and looking for work in nursing.
2008 data has been revised due to the correction of an error in processing Victoria data.
REPORT ON
GOVERNMENT
SERVICES 2017
PUBLIC
HOSPITALS
PAGE 2 of TABLE 12A.52

TABLE 12A.53
Table 12A.53
Unit NSW Vic Qld WA SA Tas ACT NT Aust
Total
Major cties no. 68 225 67 376 43 789 27 480 24 940 – 5 423 – 237 233
Inner regional no. 19 054 18 417 11 523 2 307 1 723 6 116 14 – 59 154
Outer regional no. 4 898 4 118 8 832 2 369 2 982 1 722 – 2 394 27 315
Remote and very remote no. 507 87 1 658 2 049 861 149 – 1 621 6 932
Total no. 92 719 90 030 65 890 34 215 30 513 7 995 5 446 4 032 331 015
Nurses aged under 30
Major cties no. 12 013 13 186 7 511 4 981 3 848 – 904 – 42 443
Inner regional no. 2 072 2 568 1 480 240 138 877 3 – 7 378
Outer regional no. 520 549 1 266 292 350 196 – 507 3 680
Remote and very remote no. 72 11 261 278 132 10 – 219 983
Total no. 14 679 16 320 10 524 5 791 4 469 1 085 909 728 54 550
Nurses aged 30 to 39
Major cties no. 15 241 15 644 9 714 5 918 5 263 – 1 283 – 53 063
Inner regional no. 3 138 3 247 2 058 433 214 1 071 8 – 10 169
Outer regional no. 693 629 1 728 446 447 235 – 662 4 840
Remote and very remote no. 87 17 301 461 123 22 – 426 1 437
Total no. 19 169 19 545 13 816 7 261 6 048 1 329 1 292 1 091 69 601
Nurses aged 40 to 49
Major cties no. 15 878 16 169 11 543 6 886 6 160 – 1 356 – 57 992
Inner regional no. 4 432 4 547 2 988 584 450 1 497 1 – 14 499
Outer regional no. 1 069 953 2 267 572 739 393 – 519 6 512
Nursing workforce (includes midwives), by age group, 2015 (a), (b)
REPORT ON
GOVERNMENT
SERVICES 2017
PUBLIC
HOSPITALS
PAGE 1 of TABLE 12A.53

TABLE 12A.53
Table 12A.53
Unit NSW Vic Qld WA SA Tas ACT NT Aust
Nursing workforce (includes midwives), by age group, 2015 (a), (b)
Remote and very remote no. 108 20 337 483 179 29 – 358 1 514
Total no. 21 494 21 691 17 152 8 526 7 529 1 922 1 359 881 80 585
Nurses aged 50 to 59
Major cties no. 16 905 15 279 10 773 6 788 6 974 – 1 312 – 58 031
Inner regional no. 6 439 5 697 3 504 750 644 1 959 2 – 18 995
Outer regional no. 1 750 1 406 2 469 735 1 062 638 – 493 8 553
Remote and very remote no. 158 28 528 571 302 53 – 418 2 058
Total no. 25 263 22 424 17 309 8 849 8 985 2 651 1 318 917 87 749
Nurses aged 60+
Major cties no. 8 188 7 098 4 248 2 907 2 695 – 568 – 25 704
Inner regional no. 2 973 2 358 1 493 300 277 712 – – 8 113
Outer regional no. 866 581 1 102 324 384 260 – 213 3 730
Remote and very remote no. 82 11 231 256 125 35 – 200 940
Total no. 12 114 10 050 7 089 3 788 3 482 1 008 568 415 38 530
(a)
(b)
Source : AIHW National Health Workforce Data Set; Nursing and midwifery labour force survey (unpublished).
– Nil or rounded to zero.
Data are by derived state, derived from state and territory of main job where available; otherwise, state and territory of principal practice is used as a proxy. If
principal practice details unavailable, state and territory of residence is used. For records with no information on all three locations, they are coded to 'Not
stated'.
Data include registered and enrolled nurses in the workforce: those who are employed in nursing, on extended leave and looking for work in nursing.
REPORT ON
GOVERNMENT
SERVICES 2017
PUBLIC
HOSPITALS
PAGE 2 of TABLE 12A.53

TABLE 12A.54
Table 12A.54
Unit 2006 2007 2008 2009 2010 2011 2012 2013 2014 2015
Medical practitioners in workforce
Major cities no. 49 835 50 981 52 639 56 655 np 64 430 64 641 66 774 69 046 71 289
Inner regional no. 7 816 8 141 8 686 9 258 np 11 106 11 029 11 388 11 899 12 300
Outer regional no. 3 061 3 258 3 516 3 924 np 4 649 4 964 4 988 5 281 5 437
Remote and very remote no. 886 1 001 867 1 095 np 1 221 1 197 1 219 1 270 1 266
Total no. 63 688 68 812 70 193 74 260 np 81 751 81 910 84 613 87 693 90 383
Medical practitioners under 30
Major cities % 10.2 10.2 10.8 10.6 na 10.7 9.6 10.1 10.1 9.9
Inner regional % 7.4 8.2 8.1 8.8 na 9.3 7.8 9.1 9.0 9.0
Outer regional % 8.8 7.1 8.0 10.3 na 11.0 9.1 9.5 9.5 9.2
Remote and very remote % 13.0 9.6 5.9 15.5 na 8.9 9.6 10.0 8.8 7.8
Total % 9.8 9.7 10.2 10.6 na 10.5 9.3 10.0 9.8 9.7
Medical practitioners aged 30 to 39
Major cities % 25.7 27.1 27.2 27.1 na 29.1 28.2 27.9 27.8 27.9
Inner regional % 21.1 22.3 22.2 22.7 na 25.6 26.1 25.8 26.7 26.7
Outer regional % 22.6 24.7 26.8 24.4 na 27.8 28.2 28.1 29.0 29.3
Remote and very remote % 30.1 29.9 30.0 30.5 na 29.2 26.3 27.2 28.7 29.8
Total % 25.0 26.3 26.5 26.7 na 28.6 27.9 27.6 27.8 27.8
Medical practitioners aged 40 to 49
Major cities % 27.0 26.2 26.0 26.0 na 23.9 24.6 24.3 24.3 24.4
Inner regional % 29.8 29.0 27.7 27.1 na 25.4 25.4 25.3 24.7 25.3
Outer regional % 30.3 30.0 28.1 28.0 na 26.1 26.9 26.2 26.0 26.3
Remote and very remote % 27.2 28.8 32.4 27.9 na 25.4 27.0 25.4 25.6 23.6
Total % 27.4 26.7 26.3 26.1 na 24.3 24.9 24.6 24.5 24.6
Medical practitioners aged 50 to 59
Medical practitioner workforce, by age group and remoteness area (a), (b), (c), (d), (e)
REPORT ON
GOVERNMENT
SERVICES 2017
PUBLIC
HOSPITALS
PAGE 1 of TABLE 12A.54

TABLE 12A.54
Table 12A.54
Unit 2006 2007 2008 2009 2010 2011 2012 2013 2014 2015
Medical practitioner workforce, by age group and remoteness area (a), (b), (c), (d), (e)
Major cities % 21.1 20.4 20.5 20.5 na 20.1 20.7 20.5 20.4 20.3
Inner regional % 26.9 25.6 26.7 25.6 na 23.7 23.9 23.1 22.4 21.7
Outer regional % 23.6 24.0 22.5 23.2 na 21.0 21.1 21.2 20.0 19.3
Remote and very remote % 16.3 18.7 19.4 14.2 na 20.7 21.4 20.4 20.7 21.7
Total % 21.7 21.0 21.3 21.0 na 20.6 21.1 20.9 20.7 20.4
Medical practitioners aged 60+
Major cities % 16.0 16.1 15.5 15.8 na 16.2 16.9 17.2 17.4 17.6
Inner regional % 14.8 14.8 15.2 15.9 na 15.9 16.9 16.7 17.2 17.2
Outer regional % 14.7 14.3 14.6 14.0 na 14.1 14.6 15.0 15.4 15.9
Remote and very remote % 13.4 13.1 12.3 11.8 na 15.9 15.7 16.9 16.1 17.1
Total % 16.0 16.2 15.8 15.7 na 16.0 16.8 17.0 17.2 17.4
(a)
(b)
(c)
(d)
(e)
na Not available. np Not published.
Source : AIHW National Health Workforce Data Set; Medical labour force surveys (unpublished).
2012 and subsequent years excludes provisional registrants.
In 2008, 2009, 2011, 2012, 2013 and 2014 total include 'Not Stated' for ASGC Remoteness areas. Numbers of 'Not Stated' are significantly higher in 2008
and 2009 than in later years.
In 2008 and 2009 data include employed medical practitioners, registered medical practitioners on extended leave and registered medical practitioners
looking for work in medicine. In 2011, 2012, 2013 and 2014 data include employed medical practitioners.
In 2008, 2009, 2011, 2012, 2013 and 2014 Remote and very remote areas include Migratory areas. Estimates for remote and very remote areas should be
treated with caution due to the relatively small number of medical practitioners used to produce these estimates.
Medical practitioners are allocated to a region based on postcode of main job where available; otherwise, postcode of principal practice is used as a proxy. If
principal practice details are unavailable, postocde of residence is used. Records with no information on all 3 locations are coded to 'not stated'. In 2009,
2010 and 2011, region is based on 2006 version Australian Standard Geographical Classification (ASGC) — Remoteness Areas. In 2012 and 2013, region is
based on 2011 version Australian Statistical Geography Standard (ASGS) — Remoteness Areas. Previous versions of these data were supplied using a mix
of 2001 and 2006 versions of the classification so these data may not match earlier supplies.
REPORT ON
GOVERNMENT
SERVICES 2017
PUBLIC
HOSPITALS
PAGE 2 of TABLE 12A.54

TABLE 12A.55
Table 12A.55
Unit NSW Vic Qld WA SA Tas ACT NT Aust
Total
Major cties no. 23 808 19 033 12 703 7 845 6 125 – 1 774 – 71 289
Inner regional no. 4 219 2 989 2 733 508 273 1 577 1 – 12 300
Outer regional no. 762 482 2 298 432 392 343 – 728 5 437
Remote and very remote no. 62 8 276 392 81 35 – 412 1 266
Total no. 28 857 22 518 18 016 9 180 6 872 1 956 1 775 1 141 90 383
Medical practitioners under 30
Major cties no. 2 227 2 072 1 148 843 610 – 146 – 7 046
Inner regional no. 338 265 290 33 13 169 – – 1 108
Outer regional no. 48 36 258 29 25 18 – 86 500
Remote and very remote no. 1 – 30 22 7 1 – 38 99
Total no. 2 614 2 373 1 726 927 655 188 146 124 8 755
Medical practitioners aged 30 to 39
Major cties no. 6 279 5 397 3 629 2 407 1 671 – 491 – 19 874
Inner regional no. 1 079 881 765 122 71 361 – – 3 279
Outer regional no. 175 135 693 113 114 84 – 277 1 591
Remote and very remote no. 16 1 79 113 16 8 – 144 377
Total no. 7 551 6 417 5 166 2 756 1 872 454 491 421 25 154
Medical practitioners aged 40 to 49
Major cties no. 5 731 4 412 3 305 1 986 1 501 – 449 – 17 385
Inner regional no. 1 074 731 702 150 60 400 – – 3 117
Outer regional no. 209 119 599 137 103 90 – 174 1 431
Remote and very remote no. 19 3 58 99 16 9 – 95 299
Medical practitioner workforce, by age group, 2015 (a)
REPORT ON
GOVERNMENT
SERVICES 2017
PUBLIC
HOSPITALS
PAGE 1 of TABLE 12A.55

TABLE 12A.55
Table 12A.55
Unit NSW Vic Qld WA SA Tas ACT NT Aust
Medical practitioner workforce, by age group, 2015 (a)
Total no. 7 033 5 266 4 666 2 372 1 680 499 449 269 22 246
Medical practitioners aged 50 to 59
Major cties no. 4 808 3 807 2 674 1 495 1 268 – 399 – 14 451
Inner regional no. 901 658 556 124 70 365 1 – 2 675
Outer regional no. 168 80 456 75 83 74 – 112 1 048
Remote and very remote no. 9 2 63 96 20 12 – 73 275
Total no. 5 890 4 547 3 751 1 790 1 442 451 400 186 18 468
Medical practitioners aged 60+
Major cties no. 4 763 3 345 1 947 1 114 1 075 – 289 – 12 533
Inner regional no. 827 454 420 79 59 282 – – 2 121
Outer regional no. 162 112 292 78 67 77 – 79 867
Remote and very remote no. 17 2 46 62 22 5 – 62 216
Total no. 5 769 3 915 2 707 1 335 1 223 364 289 141 15 760
(a)
– Nil or rounded to zero.
Source : AIHW National Health Workforce Data Set; Medical labour force surveys (unpublished).
Data is by derived state, derived from state and territory of main job where available; otherwise, state and territory of principal practice is used as a proxy. If
principal practice details unavailable, state and territory of residence is used. For records with no information on all three locations, they are coded to 'Not
stated'.
REPORT ON
GOVERNMENT
SERVICES 2017
PUBLIC
HOSPITALS
PAGE 2 of TABLE 12A.55

TABLE 12A.56
Table 12A.56
NSW Vic Qld WA SA Tas ACT NT Aust
Separations
2013-14 1 483 1 322 1 036 494 340 107 93 122 4 997
2014-15 1 522 1 429 1 149 467 343 111 96 131 5 249
Weighted separations
2013-14 1 483 1 322 1 036 492 340 106 93 122 4 994
2014-15 1 522 1 425 1 149 466 343 111 96 131 5 243
Average cost per weighted separation
2013-14 4 972 4 274 4 846 5 889 5 606 5 114 6 883 7 064 4 970
2014-15 4 943 4 442 4 897 6 124 5 708 5 165 6 637 6 734 5 025
(a)
Source : IHPA, National Hospital Cost Data Collection, (unpublished).
Average cost per admitted acute weighted separation,
excluding depreciation, (a)
Average cost per weighted separation is calculated by multiplying the state’s separations which
have a Diagnosis Related Group (DRG) by the national public sector DRG cost weights. Only
separations that have a DRG are included in the calculation. In Round 18, 2617 separations were
excluded from the cost per weighted separation calculation and in Round 19, 6000 separations
were excluded.
REPORT ON
GOVERNMENT
SERVICES 2017
PUBLIC
HOSPITALS
PAGE 1 of TABLE 12A.56

TABLE 12A.57
Table 12A.57
Unit NSW Vic (c) Qld WA (c) SA Tas ACT NT (d) Aust
Land
Asset value at 30 June $m 2 047 1 206 513 398 259 35 29 33 4 521
User cost of capital $m 164 96 41 32 21 3 2 3 362
Weighted separations '000 1 522 1 425 1 149 466 343 111 96 131 5 243
Cost per weighted separation $ 108 68 36 68 60 25 24 20 69
Buildings
Asset value at 30 June $m 10 340 6 105 4 457 3 789 2 030 618 744 597 28 680
User cost of capital $m 827 488 357 303 162 49 60 48 2294
Annual depreciation $m 405 393 122 133 60 23 25 25 1186
Weighted separations '000 1 522 1 425 1 149 466 343 111 96 131 5 243
Cost per weighted separation $ 810 619 416 937 648 651 875 556 664
Equipment
Asset value at 30 June $m 915 2 509 873 515 119 49 46 21 5 047
User cost of capital $m 73 201 70 41 10 4 4 2 404
Annual depreciation $m 180 253 81 62 31 9 16 5 637
Weighted separations '000 1 522 1 425 1 149 466 343 111 96 131 5 243
Cost per weighted separation $ 166 318 131 222 120 114 202 51 199
Interest payments $m 113.4 99.2 – 18.3 1.5 – 0.2 – 232.6
Interest payments per separation $ 74.5 69.6 – 39.2 4.4 – 2.5 – 44.4
$ 901 867 548 1 120 763 765 1 075 608 818
(a)
(b)
(c)
(d)
Source :
Variation across jurisdictions in the collection of capital related data suggests the data are only indicative.
Total capital cost (excl. land)
per weighted separation
Indicative estimates of capital costs per weighted separation, 2014-15 (a), (b)
State and Territory governments (unpublished); IHPA, National Hospital Cost Data Collection, (unpublished).
Capital cost is defined as the user cost of capital (calculated at 8 per cent of the current value of non-current physical assets) plus the depreciation amount.
The asset values and depreciation amounts for Victoria and WA relate to inpatients only.
Interest payments are not reported.
– Nil or rounded to zero.
REPORT ON
GOVERNMENT
SERVICES 2017
PUBLIC
HOSPITALS
PAGE 1 of TABLE 12A.57

TABLE 12A.58
Table 12A.58
Unit NSW Vic Qld WA SA Tas ACT NT Aust
Hospitals no. 73 38 35 29 13 4 2 5 199
Presentations no. 605 531 508 260 443 280 193 895 140 446 37 606 35 542 42 252 2 006 812
Expenditure $m 675.6 435.6 423.5 170.1 121.7 47.4 56.4 39.8 1 970.1
$ 1 115.72 857.13 955.37 877.28 866.63 1 259.23 1 585.60 942.58 981.70
(a)
(b)
(c)
(d)
(e)
Source :
Average cost per admitted acute emergency department presentation, 2014-15 (a), (b), (c), (d), (e)
IHPA, National Hospital Cost Data Collection, (unpublished).
‘Work in progress’ admitted episodes and ED presentations, those that do not fall wholly within the financial year, have been excluded.
Refer to the Australian Hospital Patient Costing Standards version 3.1 for cost allocation methodologies.
Round 19 refers to the year 2014-15.
Jurisdictions supply Data Quality Statements as part of their data submissions. These can be accessed via Round 19 NHCDC cost report on IHPA website
when it is published in January 2017.
Data provided is based on the sample submitted to the National Hospital Cost Data Collection Round 19.
Average cost per
presentation
REPORT ON
GOVERNMENT
SERVICES 2017
PUBLIC
HOSPITALS
PAGE 1 of TABLE 12A.58

TABLE 12A.59
Table 12A.59
NSW Vic Qld WA SA Tas ACT NT Aust
Medical 1.00 0.90 0.83 0.93 1.01 0.97 1.03 1.05 0.94
Surgical 1.10 0.93 0.96 1.00 1.09 1.01 1.07 1.33 1.01
Other 1.11 0.92 0.95 0.96 1.12 0.97 1.16 1.23 1.02
1.03 0.91 0.87 0.95 1.04 0.98 1.05 1.13 0.96
(a)
(b)
Source :
Relative stay index, indirectly standardised, patients in public
hospitals, by medical, surgical and other type of diagnosis
related group 2014-15 (a), (b)
The indirectly standardised relative stay index is not technically comparable between cells but is a
comparison of the hospital group with the national average based on the casemix of that group.
AIHW (2016), Admitted patient care 2014–15: Australian hospital statistics , Health
services series no. 68. Cat. no. HSE 172.
Separations for which the care type was reported as acute or newborn with qualified days, or was
not reported. Relative stay index based on all hospitals using AR-DRG version 7.0.
All public hospitals
REPORT ON
GOVERNMENT
SERVICES 2017
PUBLIC
HOSPITALS
PAGE 1 of TABLE 12A.59

TABLE 12A.60
Table 12A.60
Unit NSW Vic Qld WA SA Tas ACT NT Aust
Hospitals no. 73 38 35 29 13 4 2 5 199
Presentations no. 1 641 828 1 048 339 1 012 323 546 157 306 830 112 620 94 325 99 894 4 862 316
Expenditure $m 619.3 410.6 537.2 315.2 153.4 44.8 54.5 49.6 2 184.7
$ 377.17 391.68 530.69 577.14 500.07 397.83 578.01 496.96 449.32
(a)
(b)
(c)
(d)
(e)
Source :
Jurisdictions supply Data Quality Statements as part of their data submissions. These can be accessed via Round 19 NHCDC cost report on IHPA website
when it is published in January 2017.
IHPA, National Hospital Cost Data Collection, (unpublished).
Average cost per non-admitted acute emergency department presentation, 2014-15 (a), (b), (c), (d), (e)
Average cost per
presentation
Data provided is based on the sample submitted to the National Hospital Cost Data Collection Round 19.
Round 19 refers to the year 2014-15.
‘Work in progress’ admitted episodes and ED presentations, those that do not fall wholly within the financial year, have been excluded.
Refer to the Australian Hospital Patient Costing Standards version 3.1 for cost allocation methodologies.
REPORT ON
GOVERNMENT
SERVICES 2017
PUBLIC
HOSPITALS
PAGE 1 of TABLE 12A.60

TABLE 12A.61
Table 12A.61
Unit NSW Vic Qld WA SA Tas ACT NT Aust
Hospitals no. 93 49 65 35 15 4 2 5 268
Service events no. 6 598 192 2 597 886 3 462 444 1 610 210 1 380 154 268 844 1 060 804 215 116 17 193 650
Expenditure $m 1 355 708 1 178 507 502 65 257 96 4 668
$ 205.33 272.69 340.14 315.07 363.53 242.96 242.44 444.77 271.51
(a)
(b)
(c)
(d)
Source : IHPA, National Hospital Cost Data Collection, (unpublished).
Average cost per non-admitted presentation, 2014-15 (a), (b), (c), (d)
Average cost per service
event
Data provided is based on the sample submitted to the National Hospital Cost Data Collection Round 19.
Round 19 refers to the year 2014-15.
Refer to the Australian Hospital Patient Costing Standards version 3.1 for cost allocation methodologies.
Jurisdictions supply Data Quality Statements as part of their data submissions. These can be accessed via Round 19 NHCDC cost report on IHPA website
when it is published in January 2017.
REPORT ON
GOVERNMENT
SERVICES 2017
PUBLIC
HOSPITALS
PAGE 1 of TABLE 12A.61