11 policies, dynamics & trends that are shaping today’s solar industry ctf solar subgroup...
TRANSCRIPT
11
Policies, Dynamics & Trends That are Shaping Today’s
Solar Industry
CTF Solar SubgroupApril 5, 2010
2
Government Policies - Dave Government Policies Update
• US Programs Dave Fraser• Copenhagen Dinah Cheng• Global trends Paritosh Rajora
PV Technology & Roadmap Wen-Ben Chou US Market Dynamics
• Status & Trends Ranjeet Pancholy
• VCs & Funding Dinah Cheng Key Countries
• Germany Ravinder Sachdeva
• Spain Ranjeet Pancholy• China Mike Hsieh• India Ranjeet Pancholy
Career Options Steve Campbell• Solar Subgroup landings Keith Imai
Summary & coordinator Keith Imai
3
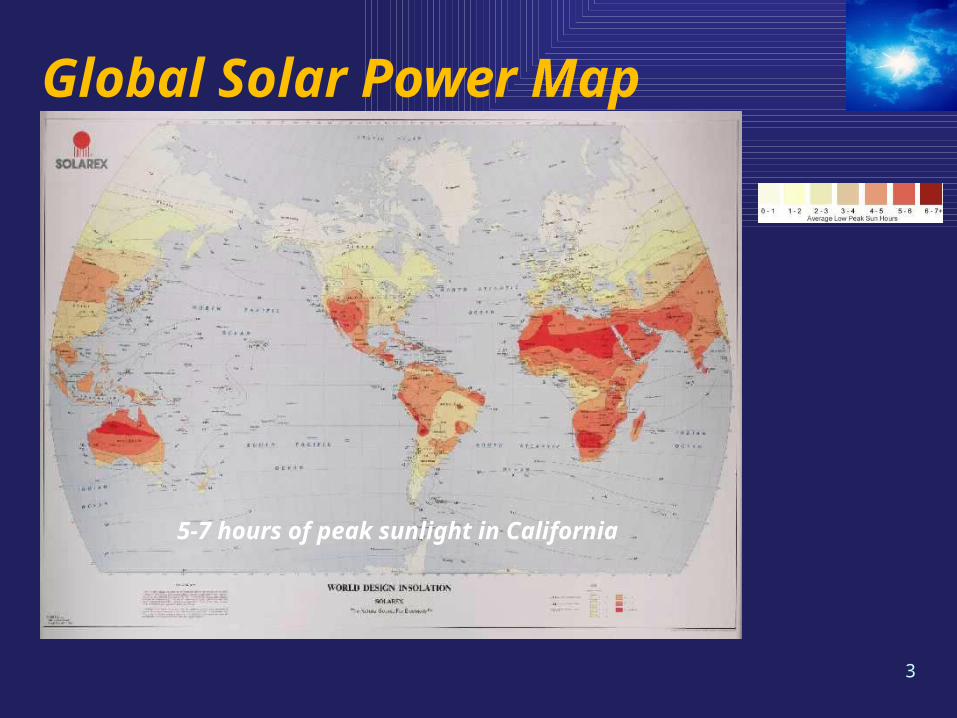
Global Solar Power Map
5-7 hours of peak sunlight in California
4
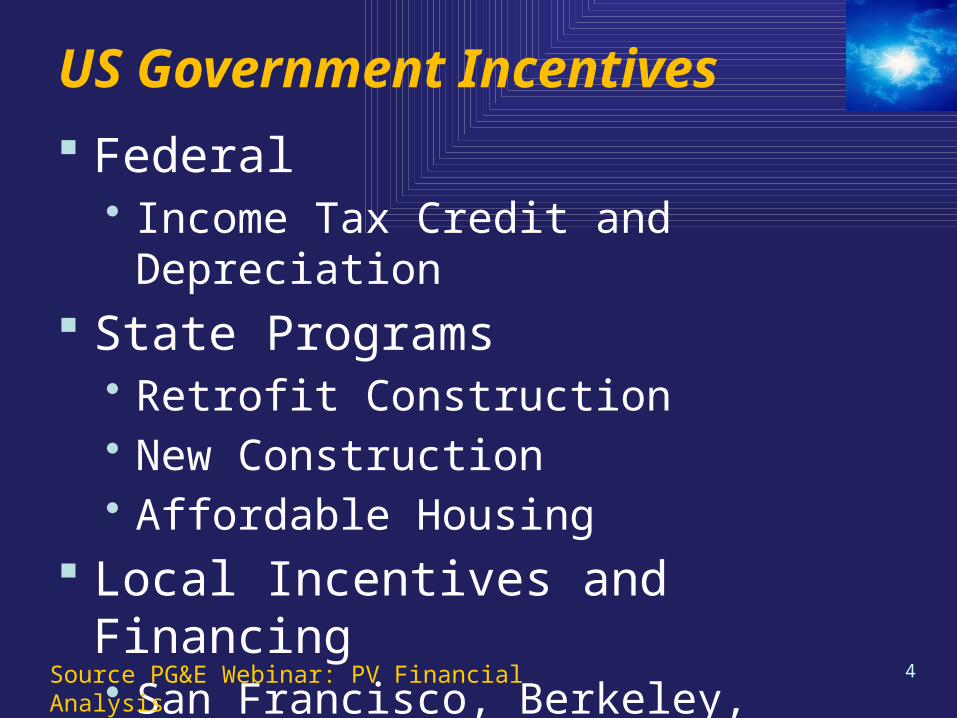
US Government Incentives
Federal • Income Tax Credit and Depreciation
State Programs• Retrofit Construction• New Construction• Affordable Housing
Local Incentives and Financing• San Francisco, Berkeley, Sonoma
Source PG&E Webinar: PV Financial Analysis
5
California Incentives
CSI – California Solar Initiative• Retrofit residential and non-residential• New construction non-residential• Incentives designed to decline over time
NSHP - New Solar Homes Partnership• New residential homes only• Builders, developers, custom homeowners
Source PG&E Webinar: PV Financial Analysis
6
California Incentives (cont.)
MASH and SASH• Multifamily Affordable Solar Homes• Single Family Affordable Solar Homes • Designed to encourage adoption for low
income housing residents
Over $1B in these programs! Solar feed in tariff coming soon
Source PG&E Webinar: PV Financial Analysis
7
Making Solar Affordable
“Energy Conservation First” strategyEnergy Audits Retrofit projects Smart Meters + home management systemsGovernment + PG+E incentives for conservation with rebates and tax credits
8
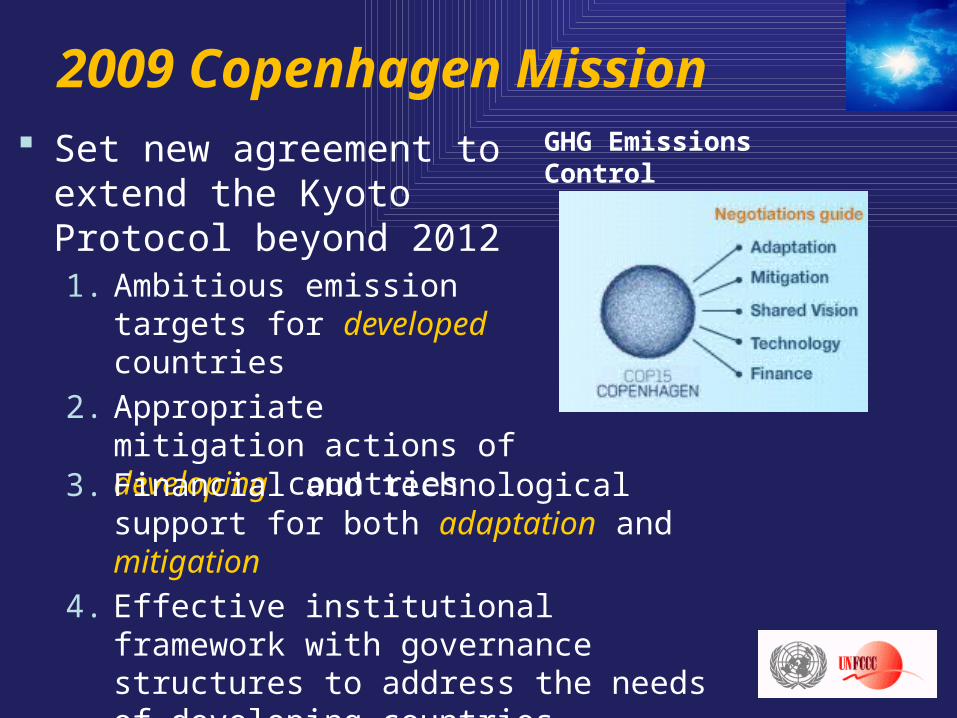
2009 Copenhagen Mission Set new agreement to
extend the Kyoto Protocol beyond 20121. Ambitious emission targets
for developed countries
2. Appropriate mitigation actions of developing countries
3. Financial and technological support for both adaptation and mitigation
4. Effective institutional framework with governance structures to address the needs of developing countries
GHG Emissions Control
9
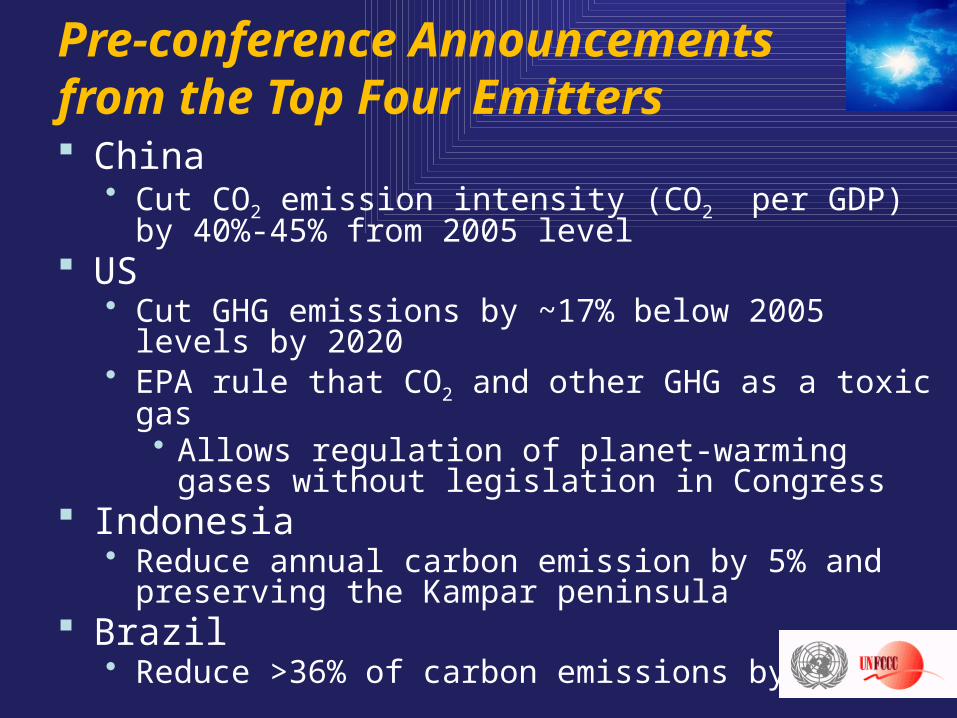
Pre-conference Announcements from the Top Four Emitters China
• Cut CO2 emission intensity (CO2 per GDP) by 40%-45% from 2005 level
US• Cut GHG emissions by ~17% below 2005 levels by 2020• EPA rule that CO2 and other GHG as a toxic gas
• Allows regulation of planet-warming gases without legislation in Congress
Indonesia• Reduce annual carbon emission by 5% and preserving
the Kampar peninsula Brazil
• Reduce >36% of carbon emissions by 2020
10
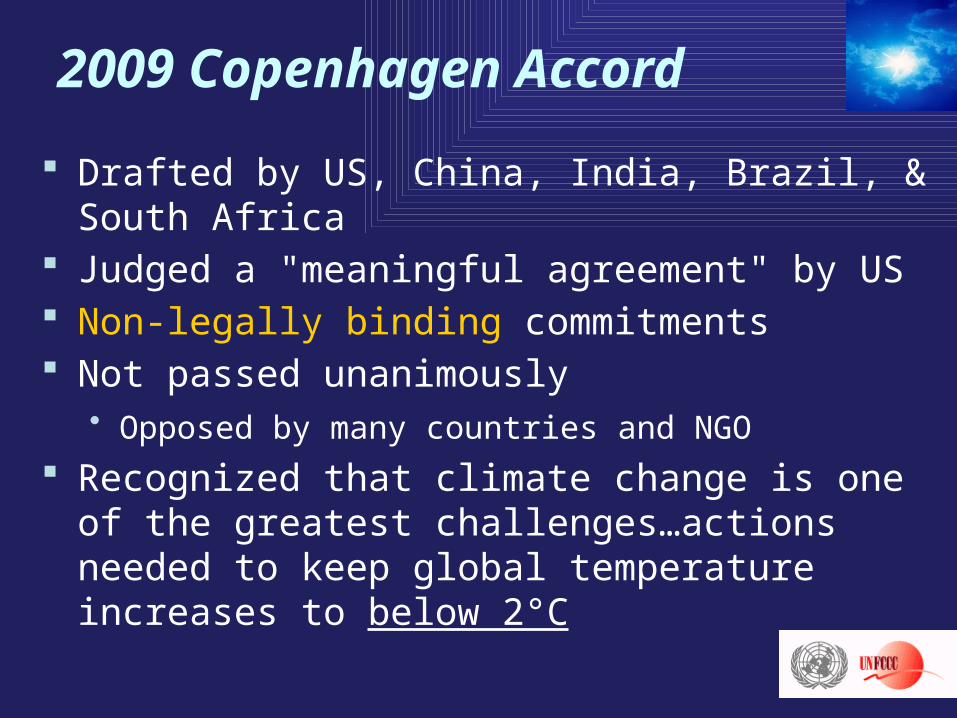
2009 Copenhagen Accord
Drafted by US, China, India, Brazil, & South Africa Judged a "meaningful agreement" by US Non-legally binding commitments Not passed unanimously
• Opposed by many countries and NGO Recognized that climate change is one of the
greatest challenges…actions needed to keep global temperature increases to below 2°C
11
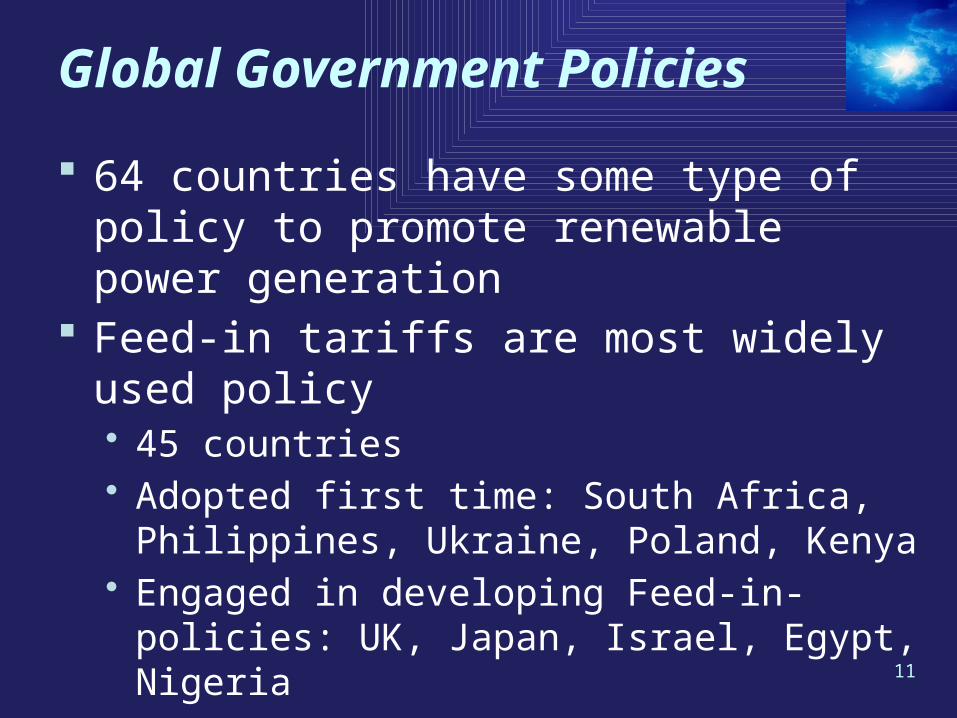
Global Government Policies
64 countries have some type of policy to promote renewable power generation
Feed-in tariffs are most widely used policy• 45 countries• Adopted first time: South Africa, Philippines,
Ukraine, Poland, Kenya• Engaged in developing Feed-in-policies: UK,
Japan, Israel, Egypt, Nigeria
12
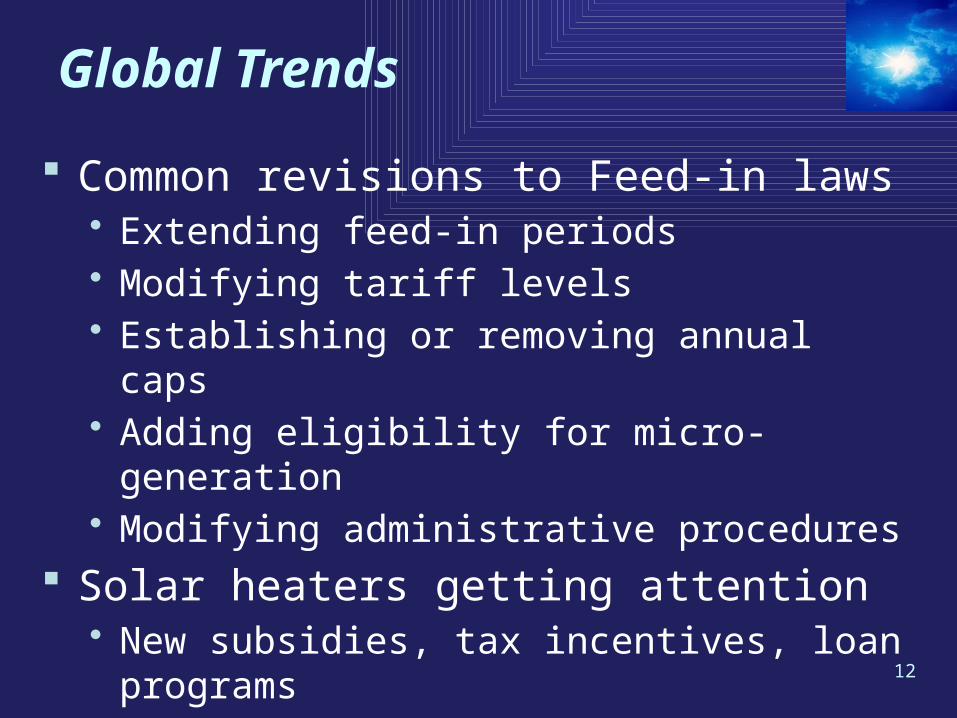
Global Trends
Common revisions to Feed-in laws• Extending feed-in periods• Modifying tariff levels• Establishing or removing annual caps• Adding eligibility for micro-generation• Modifying administrative procedures
Solar heaters getting attention• New subsidies, tax incentives, loan programs
13
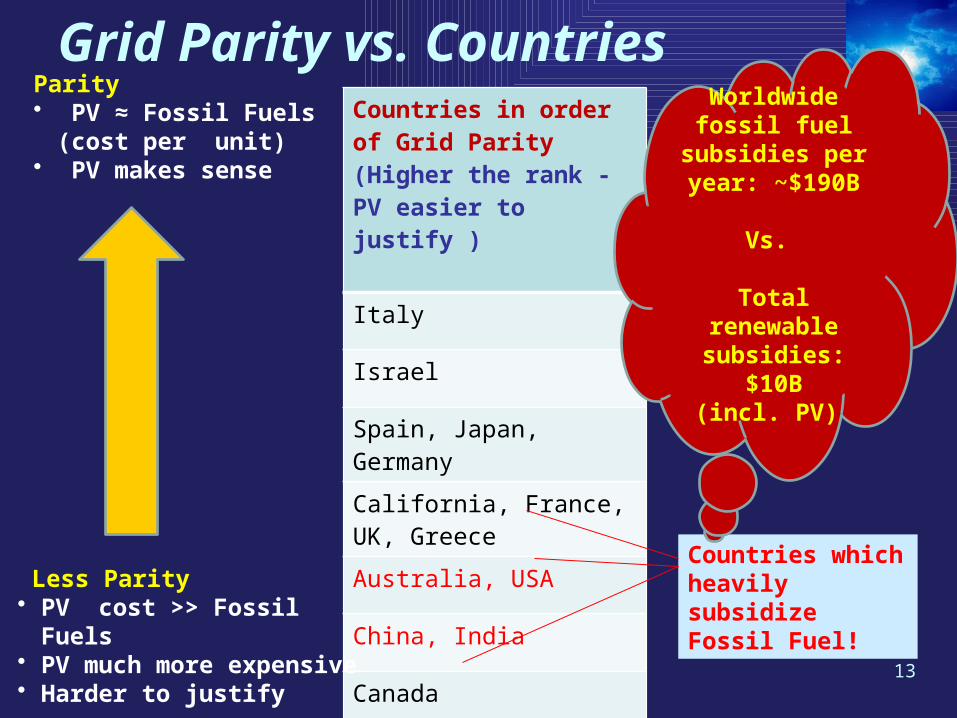
Grid Parity vs. CountriesCountries in order of Grid Parity(Higher the rank - PV easier to justify )
Italy
Israel
Spain, Japan, Germany
California, France, UK, Greece
Australia, USA
China, India
Canada
Russia
Parity • PV ≈ Fossil Fuels (cost
per unit)• PV makes sense
Less Parity• PV cost >> Fossil Fuels• PV much more expensive• Harder to justify
Countries which heavily subsidize Fossil Fuel!
Worldwidefossil fuel
subsidies per year: ~$190B
Vs.
Total renewable subsidies: $10B
(incl. PV)
14
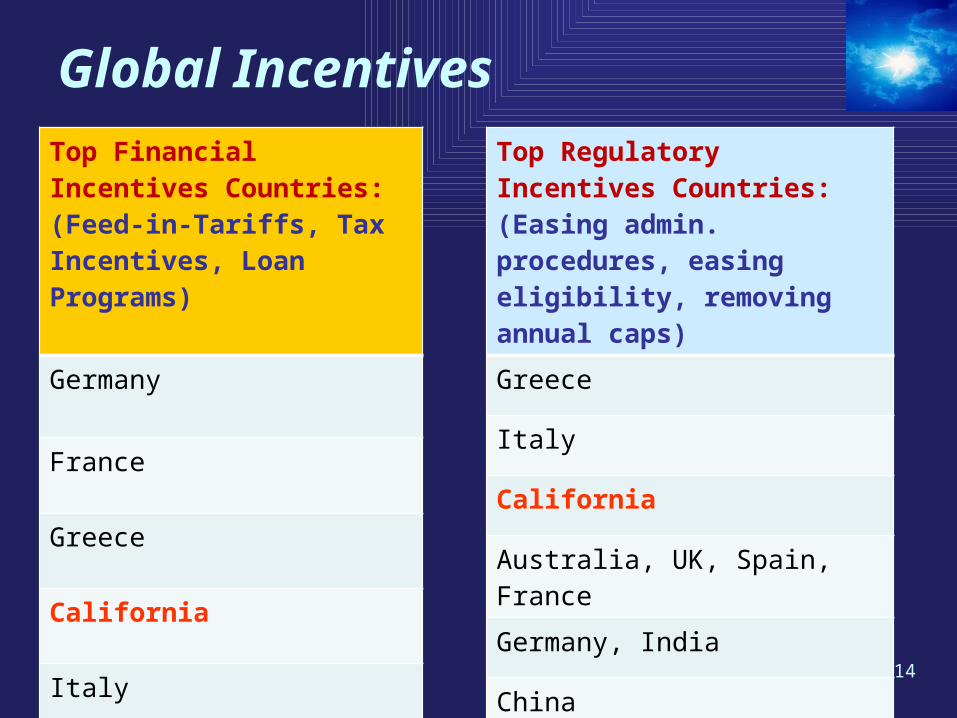
Global Incentives
Top Financial Incentives Countries: (Feed-in-Tariffs, Tax Incentives, Loan Programs)
Germany
France
Greece
California
Italy
USA
Top Regulatory Incentives Countries: (Easing admin. procedures, easing eligibility, removing annual caps)
Greece
Italy
California
Australia, UK, Spain, France
Germany, India
China
USA
15
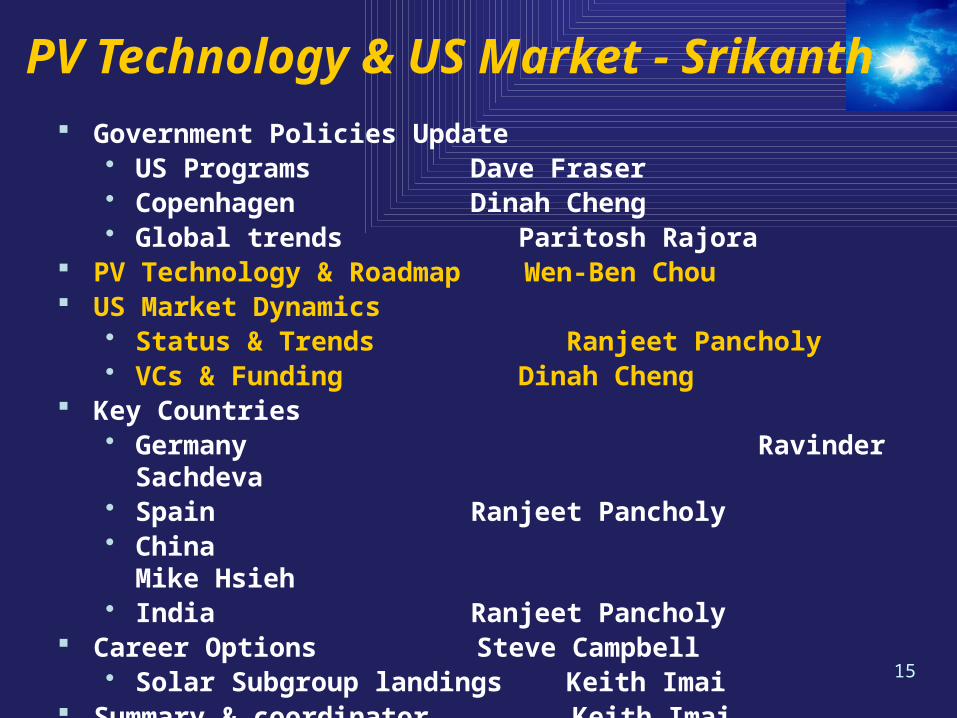
PV Technology & US Market - Srikanth Government Policies Update
• US Programs Dave Fraser• Copenhagen Dinah Cheng• Global trends Paritosh Rajora
PV Technology & Roadmap Wen-Ben Chou US Market Dynamics
• Status & Trends Ranjeet Pancholy
• VCs & Funding Dinah Cheng Key Countries
• Germany Ravinder Sachdeva
• Spain Ranjeet Pancholy• China Mike Hsieh• India Ranjeet Pancholy
Career Options Steve Campbell• Solar Subgroup landings Keith Imai
Summary & coordinator Keith Imai

16
PV Efficiency Roadmap
17
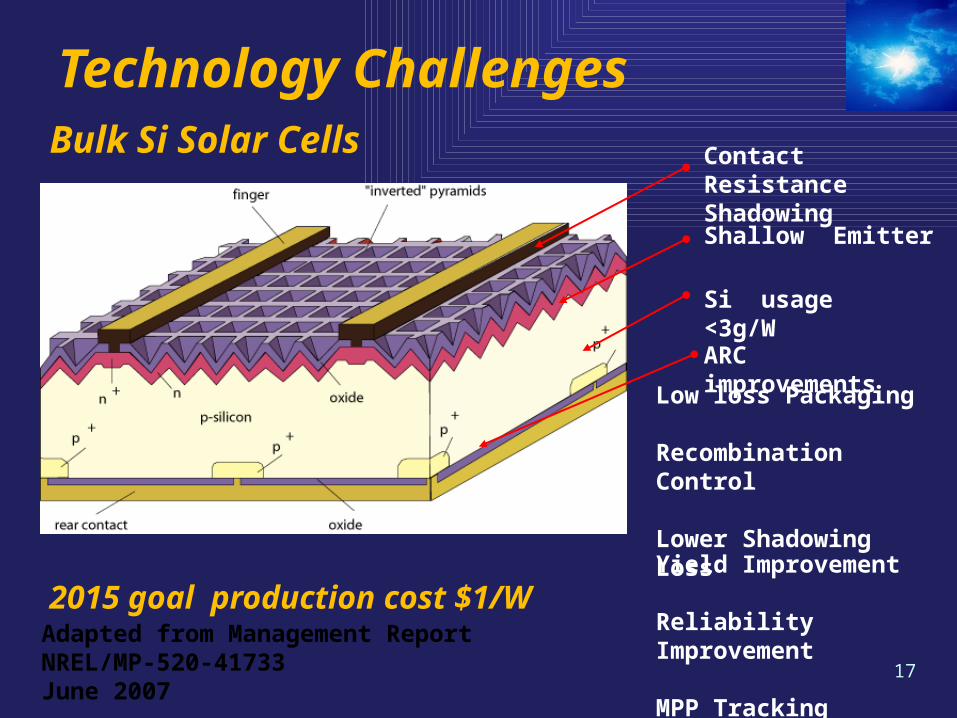
Technology Challenges
Si usage <3g/W
Contact ResistanceShadowing
Shallow Emitter
ARC improvements
Low loss Packaging
Recombination Control
Lower Shadowing Loss
Bulk Si Solar Cells
Yield Improvement
Reliability Improvement
MPP Tracking
2015 goal production cost $1/WAdapted from Management Report NREL/MP-520-41733 June 2007
18
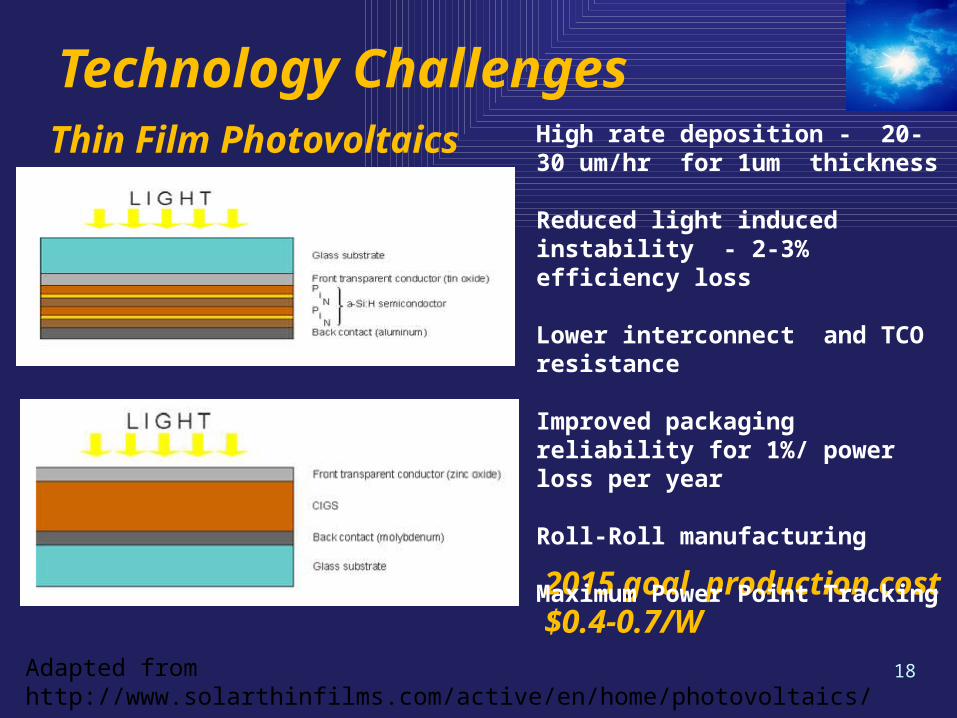
Technology Challenges
Adapted from http://www.solarthinfilms.com/active/en/home/photovoltaics/
2015 goal production cost $0.4-0.7/W
Thin Film Photovoltaics High rate deposition - 20-30 um/hr for 1um thickness
Reduced light induced instability - 2-3% efficiency loss
Lower interconnect and TCO resistance
Improved packaging reliability for 1%/ power loss per year
Roll-Roll manufacturing
Maximum Power Point Tracking
19
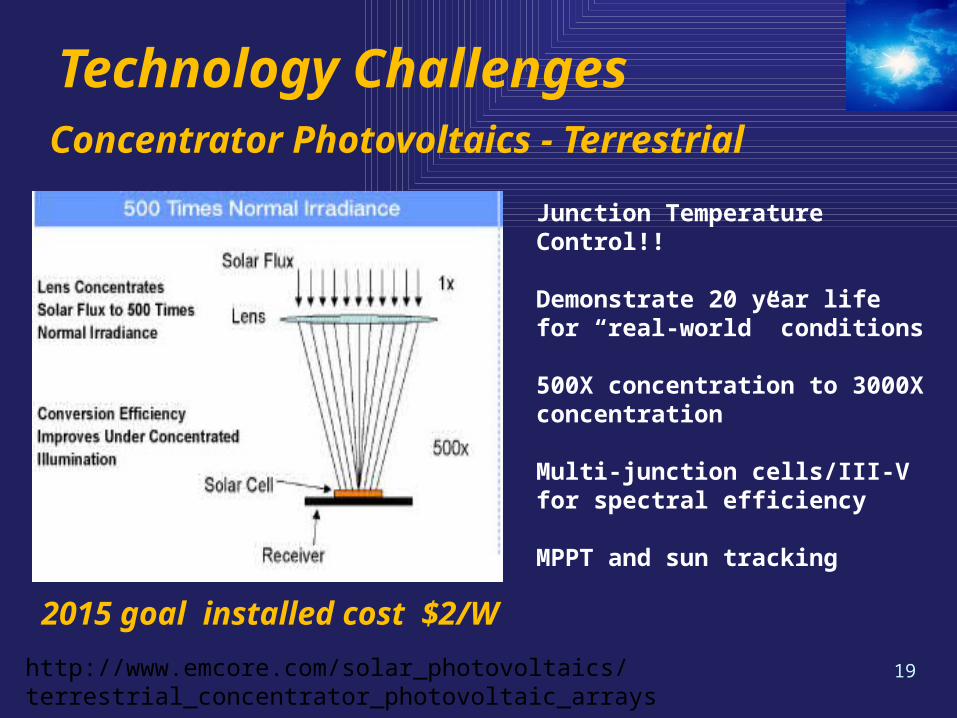
Technology Challenges
http://www.emcore.com/solar_photovoltaics/terrestrial_concentrator_photovoltaic_arrays
2015 goal installed cost $2/W
Concentrator Photovoltaics - Terrestrial
Junction Temperature Control!!
Demonstrate 20 year life for “real-world” conditions
500X concentration to 3000X concentration
Multi-junction cells/III-V for spectral efficiency
MPPT and sun tracking
20
Policy Requirements 2010 - 2020
Long term utility targets and supporting policies• Builds confidence for investment in manufacturing
capacity and deployment of utility scale PV systems
Implement incentive schemes and low cost financing• Catalyses consumer market creation• Incentives will be transitional and decrease over time
Increase R&D funding to sustain technology roadmap• Reduces production and ramp-up costs• Supports longer term technology breakthroughs
21
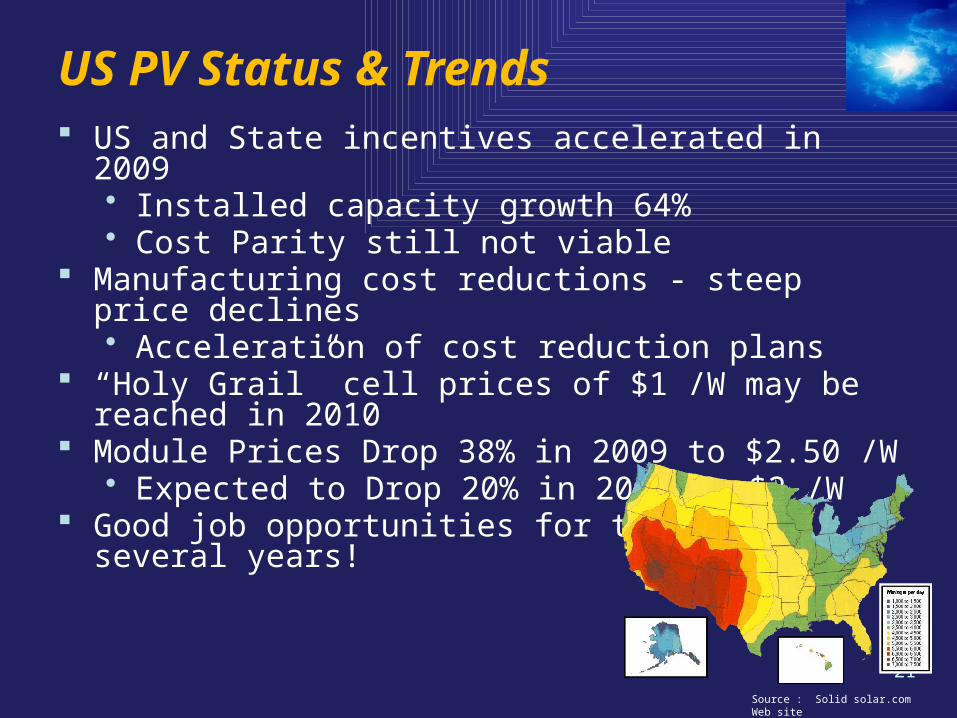
US PV Status & Trends US and State incentives accelerated in 2009
• Installed capacity growth 64%• Cost Parity still not viable
Manufacturing cost reductions - steep price declines• Acceleration of cost reduction plans
“Holy Grail” cell prices of $1 /W may be reached in 2010 Module Prices Drop 38% in 2009 to $2.50 /W
• Expected to Drop 20% in 2010 to $2 /W Good job opportunities for the next several years!
Source : Solid solar.com Web site
22
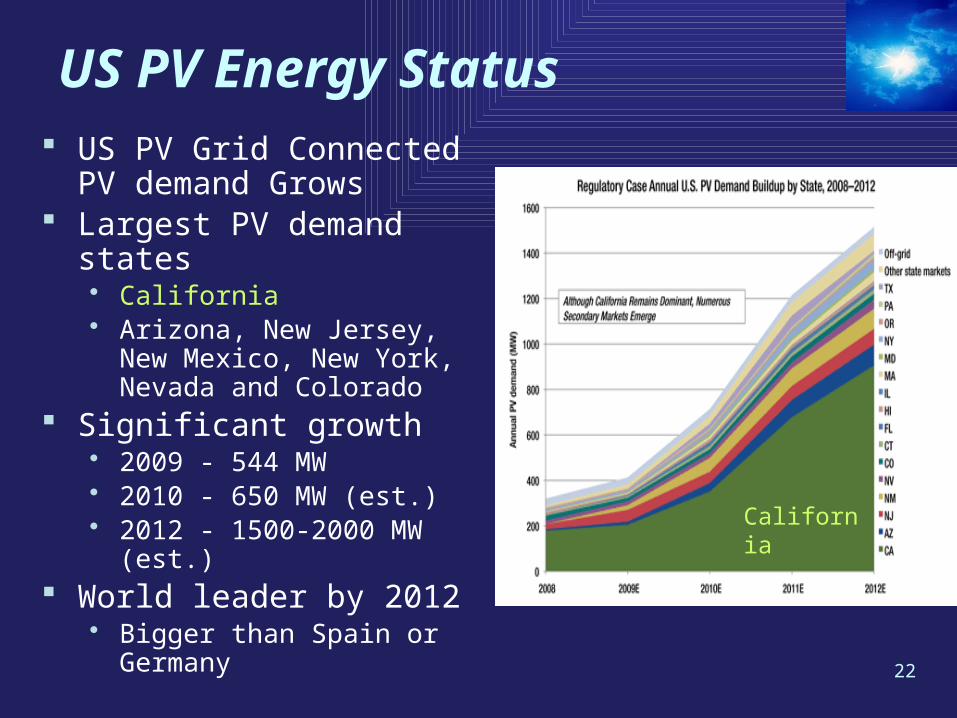
US PV Energy Status US PV Grid Connected PV
demand Grows Largest PV demand states
• California• Arizona, New Jersey, New
Mexico, New York, Nevada and Colorado
Significant growth• 2009 - 544 MW • 2010 - 650 MW (est.)• 2012 - 1500-2000 MW (est.)
World leader by 2012• Bigger than Spain or Germany
California
23
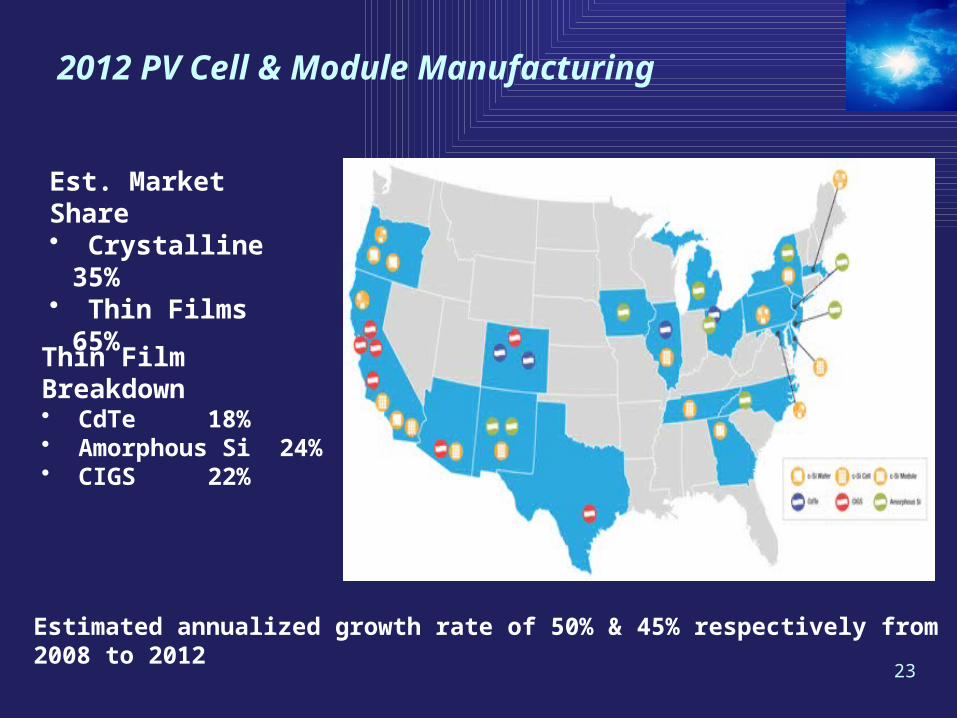
2012 PV Cell & Module Manufacturing
Est. Market Share• Crystalline 35%• Thin Films 65%
Thin Film Breakdown• CdTe 18%• Amorphous Si 24%• CIGS 22%
Estimated annualized growth rate of 50% & 45% respectively from 2008 to 2012
24
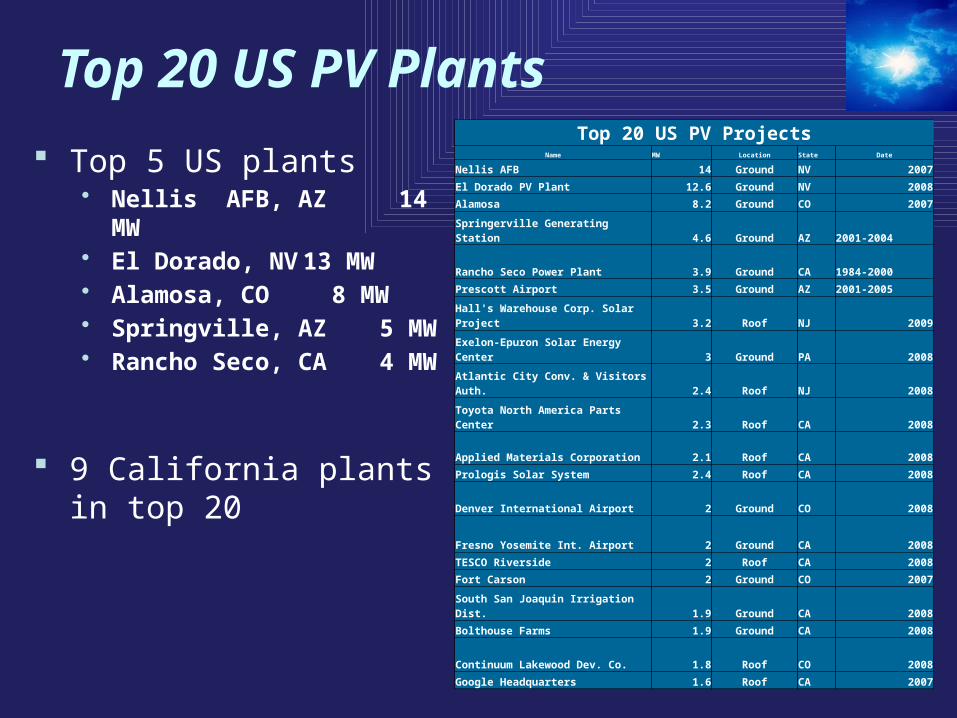
Top 20 US PV ProjectsName MW Location State Date
Nellis AFB 14 Ground NV 2007
El Dorado PV Plant 12.6 Ground NV 2008
Alamosa 8.2 Ground CO 2007
Springerville Generating Station 4.6 Ground AZ 2001-2004
Rancho Seco Power Plant 3.9 Ground CA 1984-2000
Prescott Airport 3.5 Ground AZ 2001-2005
Hall's Warehouse Corp. Solar Project 3.2 Roof NJ 2009
Exelon-Epuron Solar Energy Center 3 Ground PA 2008
Atlantic City Conv. & Visitors Auth. 2.4 Roof NJ 2008
Toyota North America Parts Center 2.3 Roof CA 2008
Applied Materials Corporation 2.1 Roof CA 2008
Prologis Solar System 2.4 Roof CA 2008
Denver International Airport 2 Ground CO 2008
Fresno Yosemite Int. Airport 2 Ground CA 2008
TESCO Riverside 2 Roof CA 2008
Fort Carson 2 Ground CO 2007
South San Joaquin Irrigation Dist. 1.9 Ground CA 2008
Bolthouse Farms 1.9 Ground CA 2008
Continuum Lakewood Dev. Co. 1.8 Roof CO 2008
Google Headquarters 1.6 Roof CA 2007
Top 20 US PV Plants
Top 5 US plants• Nellis AFB, AZ 14 MW • El Dorado, NV 13 MW• Alamosa, CO 8 MW• Springville, AZ 5 MW• Rancho Seco, CA 4
MW
9 California plants in top 20
25
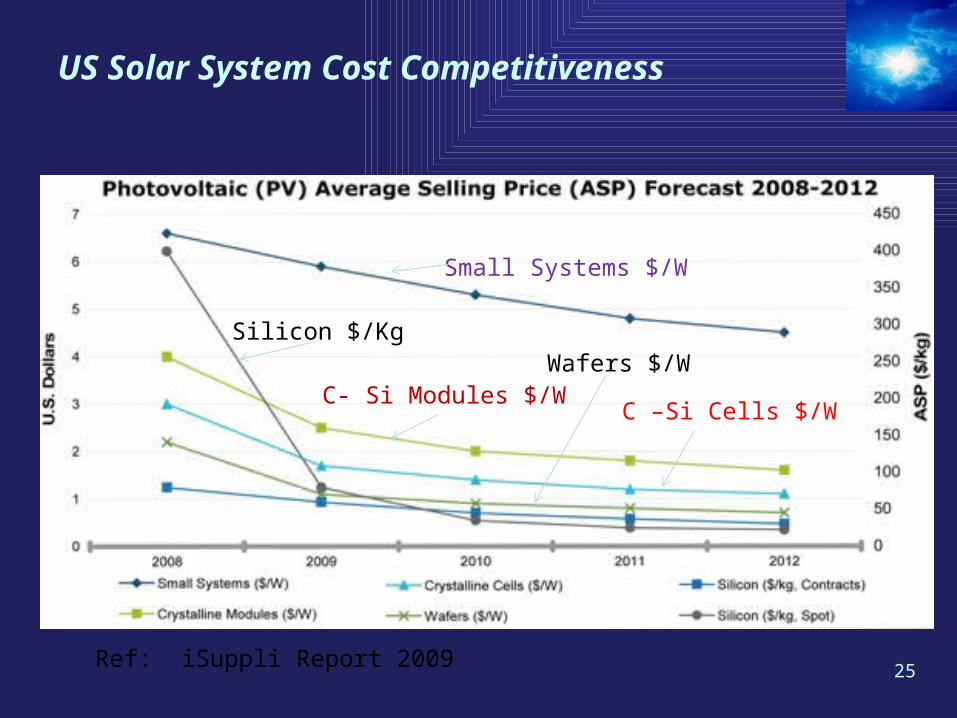
US Solar System Cost Competitiveness
Small Systems $/W
Silicon $/Kg
C- Si Modules $/WC –Si Cells $/W
Wafers $/W
Ref: iSuppli Report 2009
26
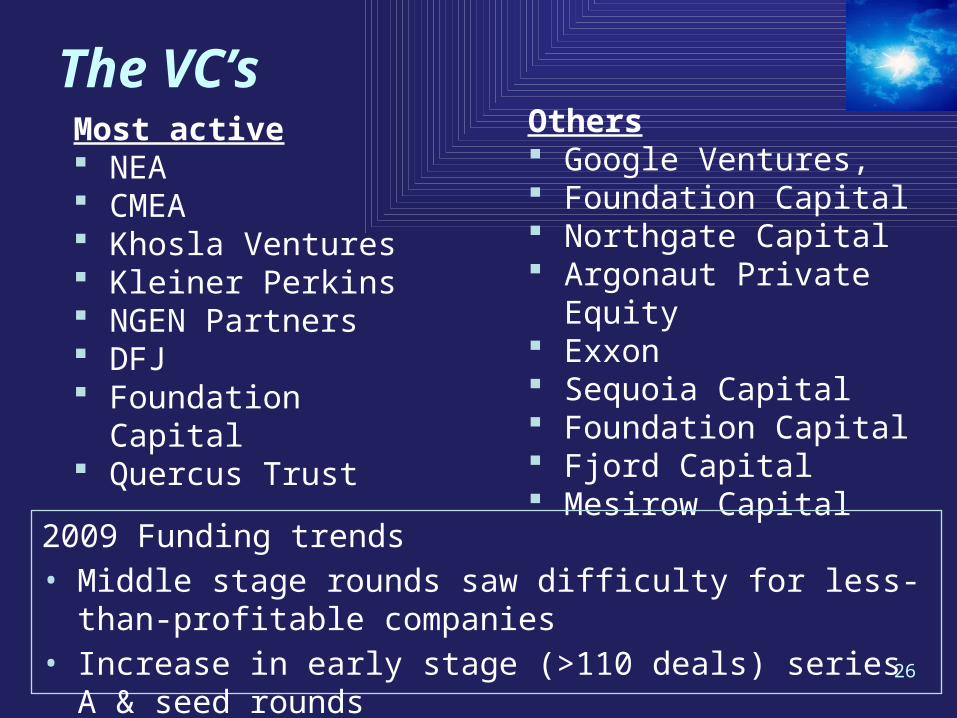
The VC’sMost active NEA CMEA Khosla Ventures Kleiner Perkins NGEN Partners DFJ Foundation Capital Quercus Trust
Others Google Ventures, Foundation Capital Northgate Capital Argonaut Private Equity Exxon Sequoia Capital Foundation Capital Fjord Capital Mesirow Capital
2009 Funding trends • Middle stage rounds saw difficulty for less-than-profitable
companies • Increase in early stage (>110 deals) series A & seed rounds
27
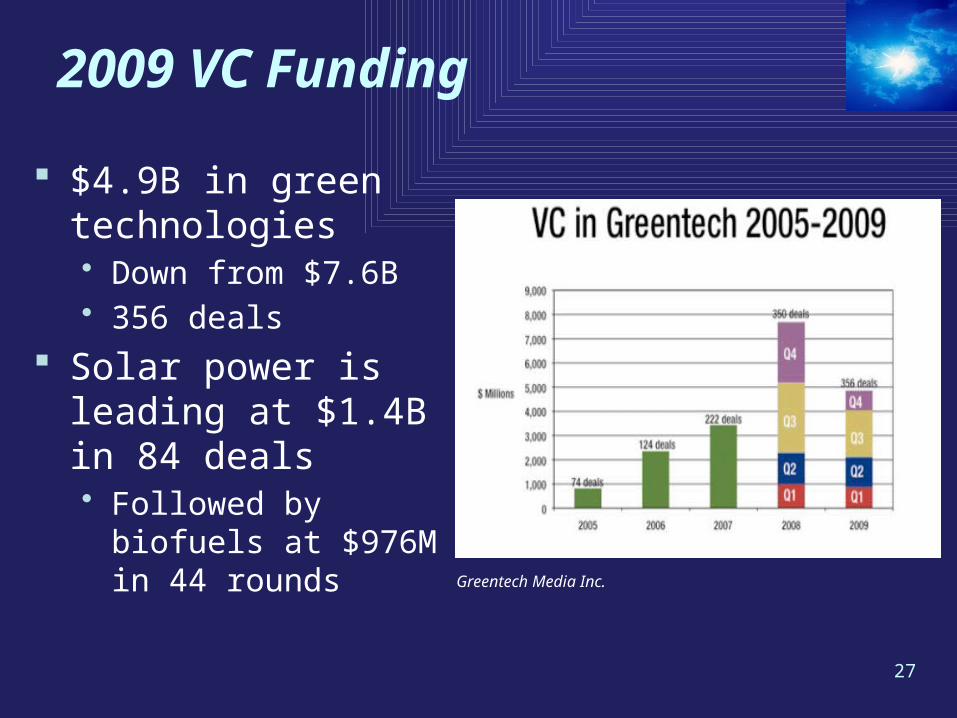
2009 VC Funding
$4.9B in green technologies • Down from $7.6B• 356 deals
Solar power is leading at $1.4B in 84 deals• Followed by biofuels at
$976M in 44 rounds
Greentech Media Inc.
28
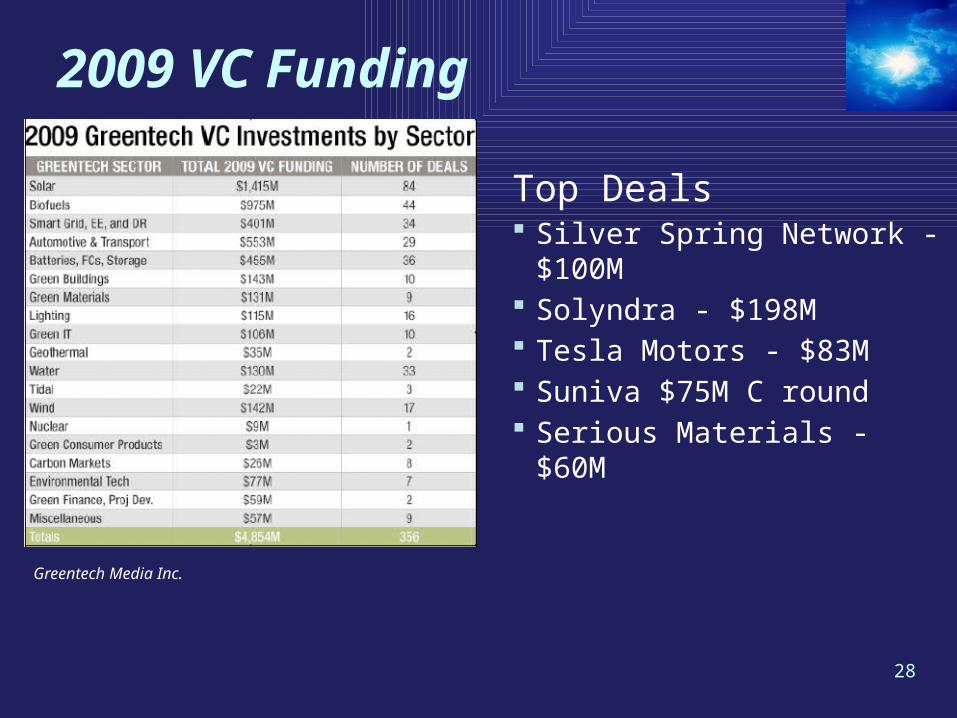
2009 VC Funding
Top Deals Silver Spring Network - $100M Solyndra - $198M Tesla Motors - $83M Suniva $75M C round Serious Materials - $60M
Greentech Media Inc.
29
Key Countries & Careers - Paritosh Government Policies Update
• US Programs Dave Fraser• Copenhagen Dinah Cheng• Global trends Paritosh Rajora
PV Technology & Roadmap Wen-Ben Chou US Market Dynamics
• Status & Trends Ranjeet Pancholy
• VCs & Funding Dinah Cheng Key Countries
• Germany Ravinder Sachdeva
• Spain Ranjeet Pancholy• China Mike Hsieh• India Ranjeet Pancholy
Career Options Steve Campbell• Solar Subgroup landings Keith Imai
Summary & coordinator Keith Imai
30
German Government to Lower Subsidies Subsidies for mature technology likely to decrease by mid
2010 Coalition suggests drastic cut by 30% in Feed-in-tariffs Four different models for subsidy reduction
• BSW (German Solar Business Association) suggests 3-5%• Solar World: Systems >1500MW, 1% reduction every 200mW• Sunpower suggested 1% reduction every 300MW• 15% drop in feed-in tariffs synchronized to production cost at
double of PV production Farmer’s Association pushing for elimination of
undeveloped area subsidies to operators of installations• First Solar uses undeveloped areas for their systems • Will push for rooftops - issue becomes cadmium on roof-tops?
31
Recycling First Solar’s CdTe Cells
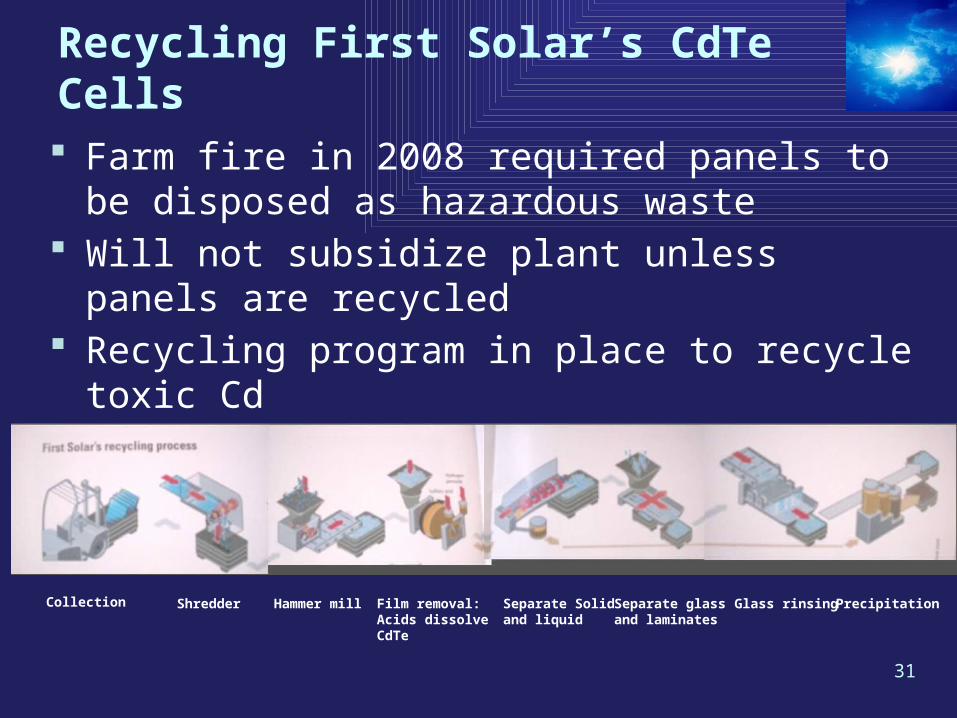
Farm fire in 2008 required panels to be disposed as hazardous waste
Will not subsidize plant unless panels are recycled Recycling program in place to recycle toxic Cd Recycling cost is part of production costs
Collection Shredder Hammer mill Film removal:Acids dissolveCdTe
Separate Solidand liquid
Separate glassand laminates
Glass rinsing Precipitation
32
Spain
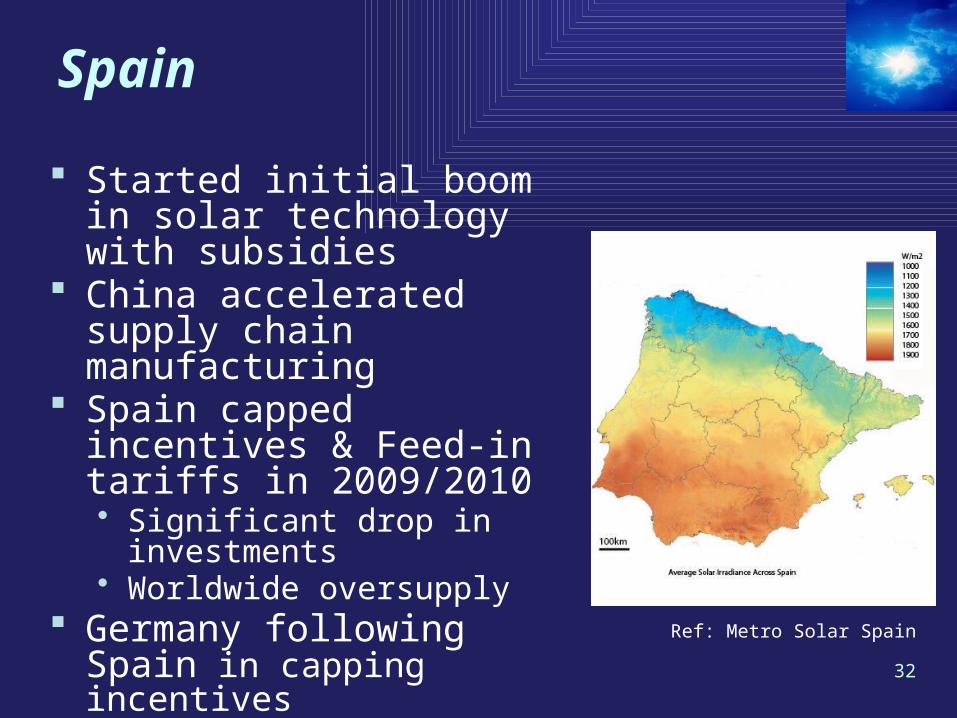
Started initial boom in solar technology with subsidies
China accelerated supply chain manufacturing
Spain capped incentives & Feed-in tariffs in 2009/2010• Significant drop in investments• Worldwide oversupply
Germany following Spain in capping incentives
Ref: Metro Solar Spain
33
China: Industry Landscape GDP growing ~10%/year Critical pollution problems 8 IPO’s since 2005 100+ solar fabs built ~49% of worldwide polysilicon volume in 2009 ~30% worldwide solar cell volume Vertical integration of solar industry
• Value chain covers polysilicon, wafers, solar cells, and solar PV modules
• Infrastructure includes solar production equipment and materials
Polysilicon production investments slowing down• Worldwide oversupply in 2009
3434
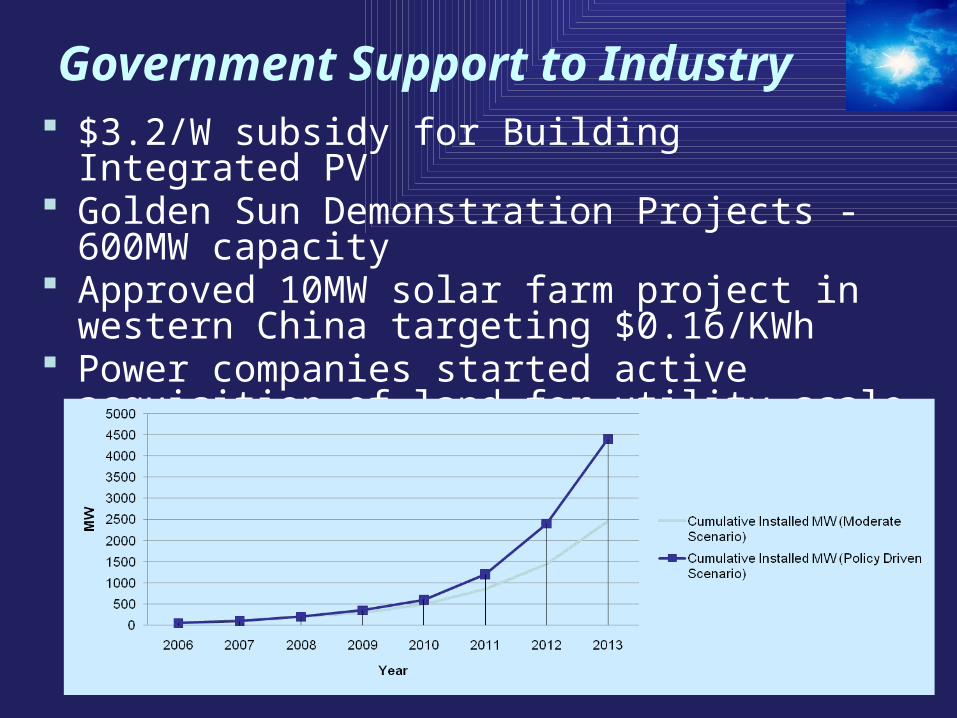
Government Support to Industry $3.2/W subsidy for Building Integrated PV Golden Sun Demonstration Projects - 600MW
capacity Approved 10MW solar farm project in western
China targeting $0.16/KWh Power companies started active acquisition of land
for utility scale solar farms in 2009
35
China: New Energy Stimulus Plan
Establish 15% renewable energy by 2020 Reduce carbon emission 40-45% per GDP from 2005
level by 2020 Increase installed solar power capacity from 100MW in
2009 to 20GW by 2020 • ~62% compound annual growth rate (CAGR)
Government to invest ~$450B in New Energy Industry• Nuclear, wind and solar
Experts estimated government to ultimately invest $700B • Will attract ~$1.5T investments from public & private
sectors
36
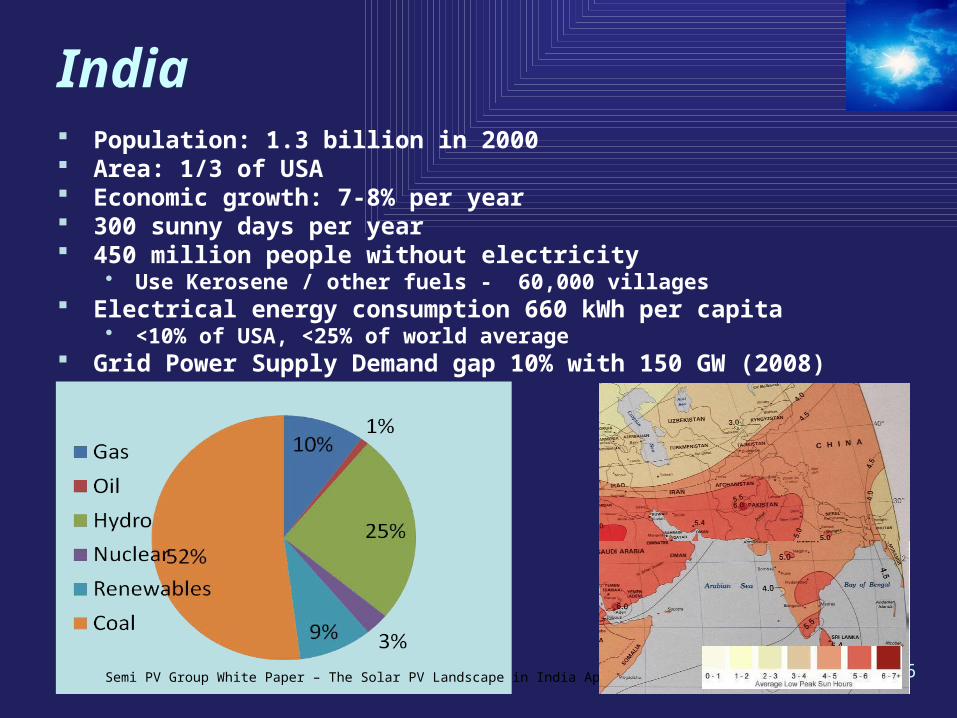
India Population: 1.3 billion in 2000 Area: 1/3 of USA Economic growth: 7-8% per year 300 sunny days per year 450 million people without electricity
• Use Kerosene / other fuels - 60,000 villages Electrical energy consumption 660 kWh per capita
• <10% of USA, <25% of world average Grid Power Supply Demand gap 10% with 150 GW (2008)
Semi PV Group White Paper – The Solar PV Landscape in India April 2009
37
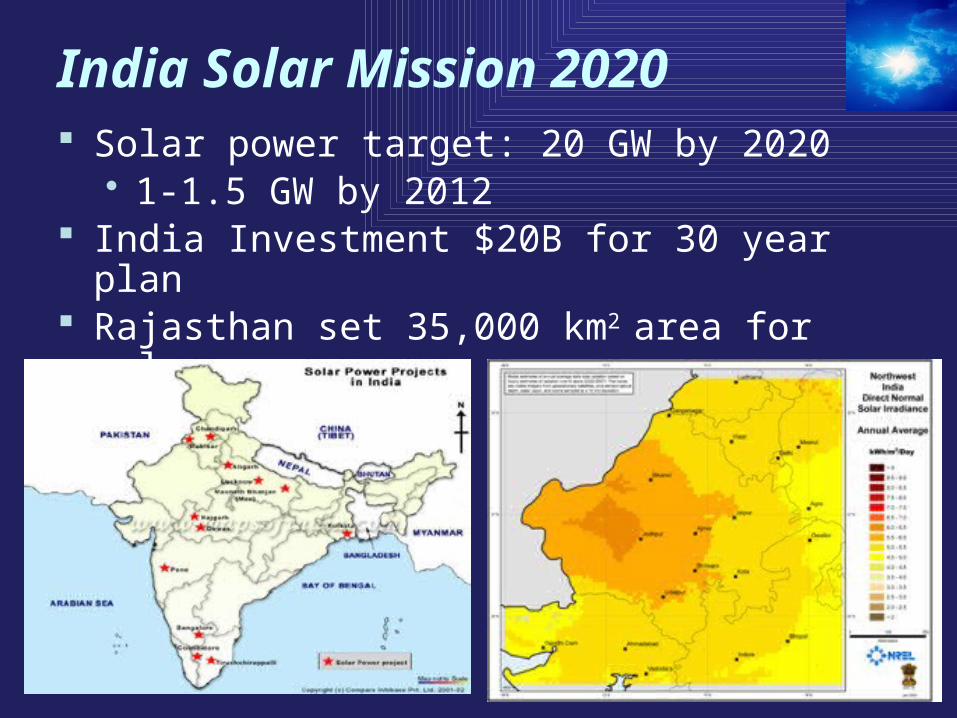
India Solar Mission 2020 Solar power target: 20 GW by 2020
• 1-1.5 GW by 2012 India Investment $20B for 30 year plan Rajasthan set 35,000 km2 area for solar
38
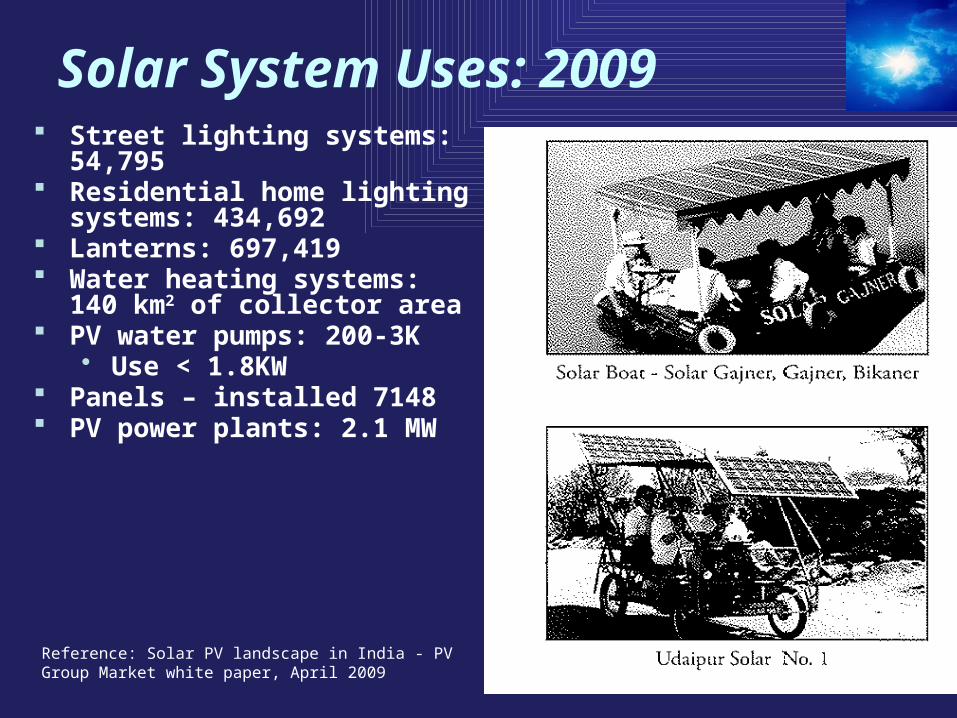
Solar System Uses: 2009 Street lighting systems: 54,795 Residential home lighting
systems: 434,692 Lanterns: 697,419 Water heating systems: 140 km2
of collector area PV water pumps: 200-3K
• Use < 1.8KW Panels – installed 7148 PV power plants: 2.1 MW
Reference: Solar PV landscape in India - PV Group Market white paper, April 2009
39
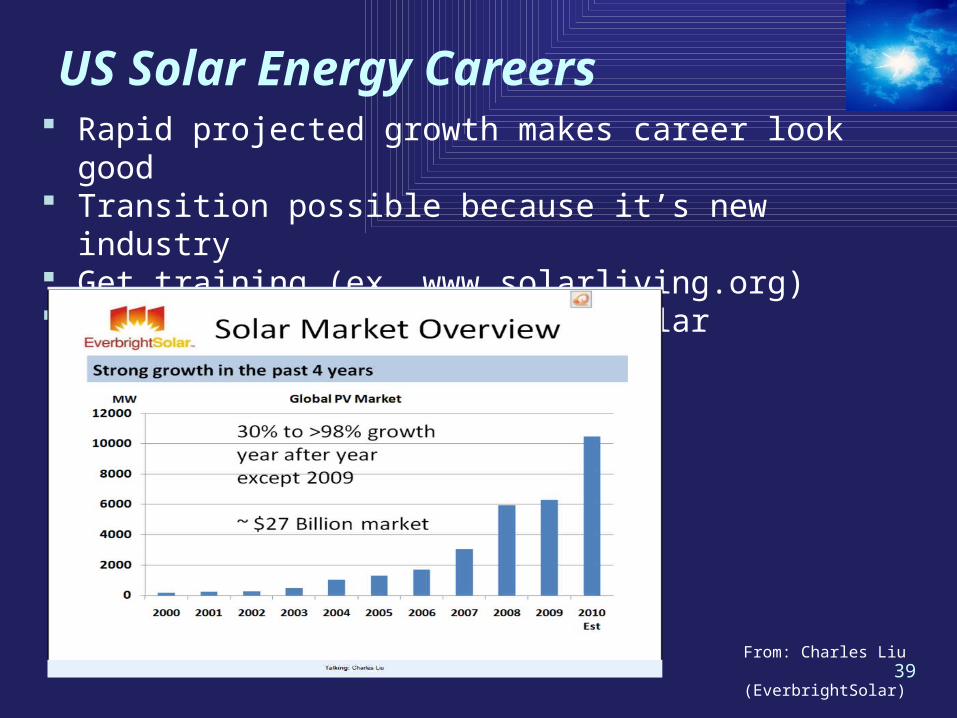
US Solar Energy Careers Rapid projected growth makes career look good Transition possible because it’s new industry Get training (ex. www.solarliving.org) Understand cost/benefits of solar (especially Sales people)
From: Charles Liu (EverbrightSolar)
40
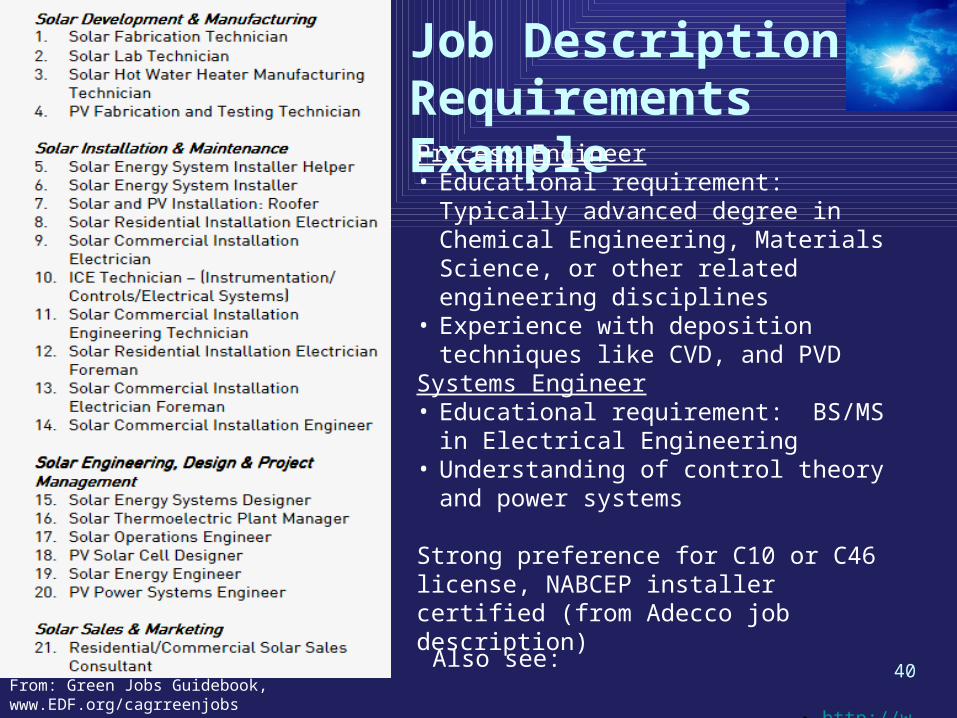
Job Description Requirements Example
From: Green Jobs Guidebook, www.EDF.org/cagrreenjobs
Process Engineer• Educational requirement: Typically advanced
degree in Chemical Engineering, Materials Science, or other related engineering disciplines
• Experience with deposition techniques like CVD, and PVD
Systems Engineer• Educational requirement: BS/MS in
Electrical Engineering• Understanding of control theory and power
systems
Strong preference for C10 or C46 license, NABCEP installer certified (from Adecco job description)
• http://www.greenforall.org/resources/green-jobs-guidebook
Also see:
41
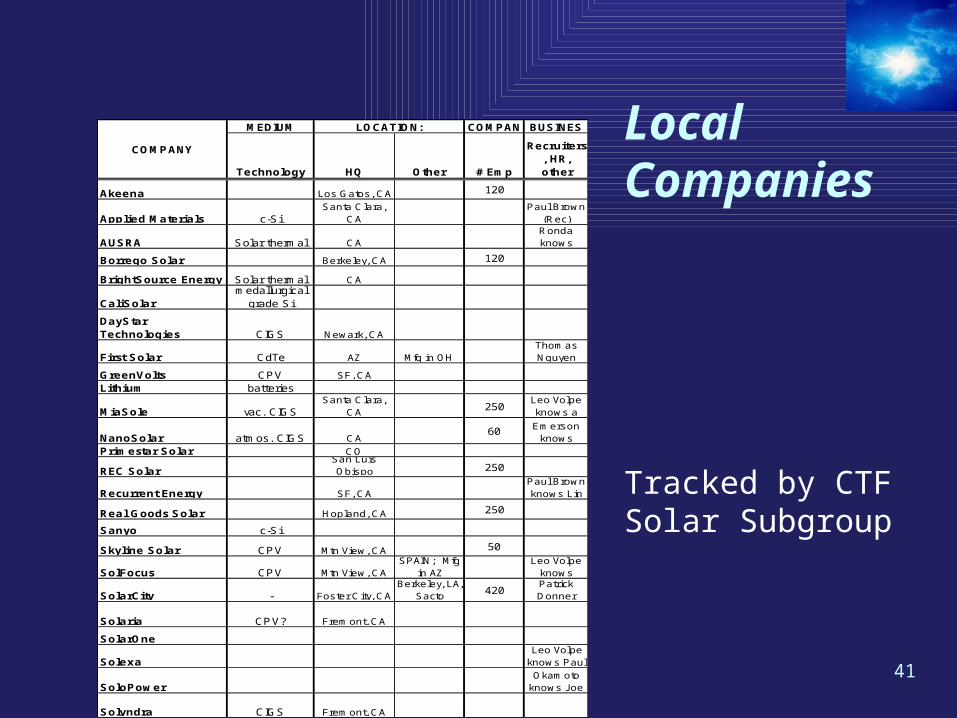
Local Companies
Tracked by CTF Solar Subgroup
MEDIUM
Technology HQ Other # Emp
Recruiters, HR, other
Akeena Los Gatos , CA 120
Applied Materials c-SiSanta Clara,
CAPaul Brown
(Rec)
AUSRA Solar thermal CARonda knows
Borrego Solar Berkeley, CA 120
BrightSource Energy Solar thermal CA
CaliSolarmedallurgical
grade Si
DayStar Technologies CIGS Newark, CA
First Solar CdTe AZ Mfg in OHThom as Nguyen
GreenVolts CPV SF, CA
Lithium batteries
MiaSole vac. CIGSSanta Clara,
CA250
Leo Volpe knows a
NanoSolar atmos. CIGS CA60
Carol Em erson
knows
Primestar Solar CO
REC SolarSan Luis Obispo 250
Recurrent Energy SF, CAPaul Brown knows Lin
Real Goods Solar Hopland, CA 250
Sanyo c-Si
Skyline Solar CPV Mtn View, CA 50
SolFocus CPV Mtn View, CASPAIN; Mfg
in AZLeo Volpe
knows
SolarCity - Fos ter City, CABerkeley, LA,
Sacto420
Patrick Donner
Solaria CPV? Frem ont, CA
SolarOne
SolexaLeo Volpe
knows Paul
SoloPower
Brian Okam oto
knows Joe
Solyndra CIGS Frem ont, CA
COMPANY
LOCATION: COMPAN BUSINES
42
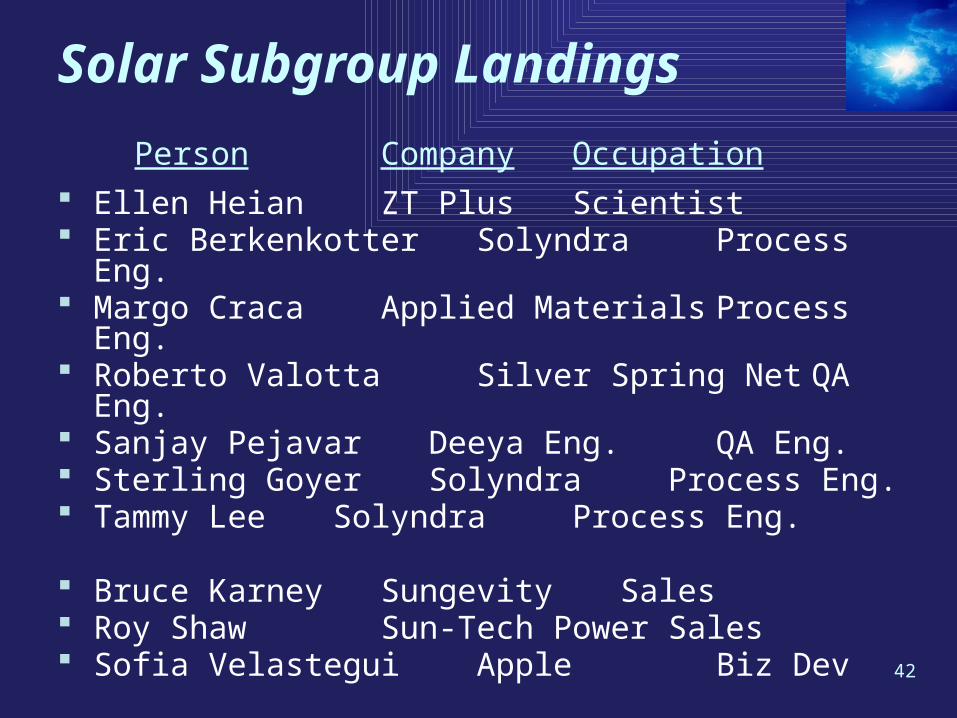
Solar Subgroup Landings
Person CompanyOccupation
Ellen Heian ZT Plus Scientist Eric Berkenkotter Solyndra Process
Eng. Margo Craca Applied Materials Process Eng. Roberto Valotta Silver Spring Net QA Eng. Sanjay Pejavar Deeya Eng. QA Eng. Sterling Goyer Solyndra Process
Eng. Tammy Lee Solyndra Process Eng.
Bruce Karney Sungevity Sales Roy Shaw Sun-Tech Power Sales Sofia Velastegui Apple Biz Dev
43
Summary
Solar industry has been & will continue to be driven by government policies
Global grid parity severely constrained by fossil fuel subsidies
USA solar VC funding of $1.4B, is largest green sector (30%)
Industry growth will continue to create jobs

44
CTF Solar Subgroup
New members always welcomed
Meets every Friday: 1:30 – 3:30pm• At Right Management
For questions, contact Co-leaders • Dinah Cheng – [email protected]• John Foggiato - [email protected]• Keith Imai – [email protected]