100 years of g - hartmannazurecdn.azureedge.net · 100 years and all set for the future agnete...
TRANSCRIPT
100 years of sustainable thinking
Think Hartmann
Annual report 2016
Contents
Management report
Highlights
4 2016 in two minutes
5 100 years and all set for the future
6 Financial highlights
7 Key figures and financial ratios
8 Hartmann at a glance
Business
11 2016 in review
15 Guidance and targets
16 Strategy
18 Markets and products
19 Risk
21 1917-2017
Governance
25 Corporate social responsibility
26 Shareholder information
27 Corporate governance
28 Board of directors and executive board
Financial statements
Financials
32 Statement of comprehensive income
33 Statement of cash flows
34 Balance sheet
35 Statement of changes in equity
37 Notes
80 Management statement
81 Independent auditor’s report
2H A R T M A N N A N N U A L R E P O R T 2 0 1 6
HIGHLIGHTS · BUSINESS · GOVERNANCE · FINANCIALS
Think fast
Highlights
4 2016 in two minutes
5 100 years and all set for the future
6 Financial highlights
7 Key figures and financial ratios
8 Hartmann at a glance
3H A R T M A N N A N N U A L R E P O R T 2 0 1 6
HIGHLIGHTS · BUSINESS · GOVERNANCE · FINANCIALShighlights indhold
2016 in two minutes
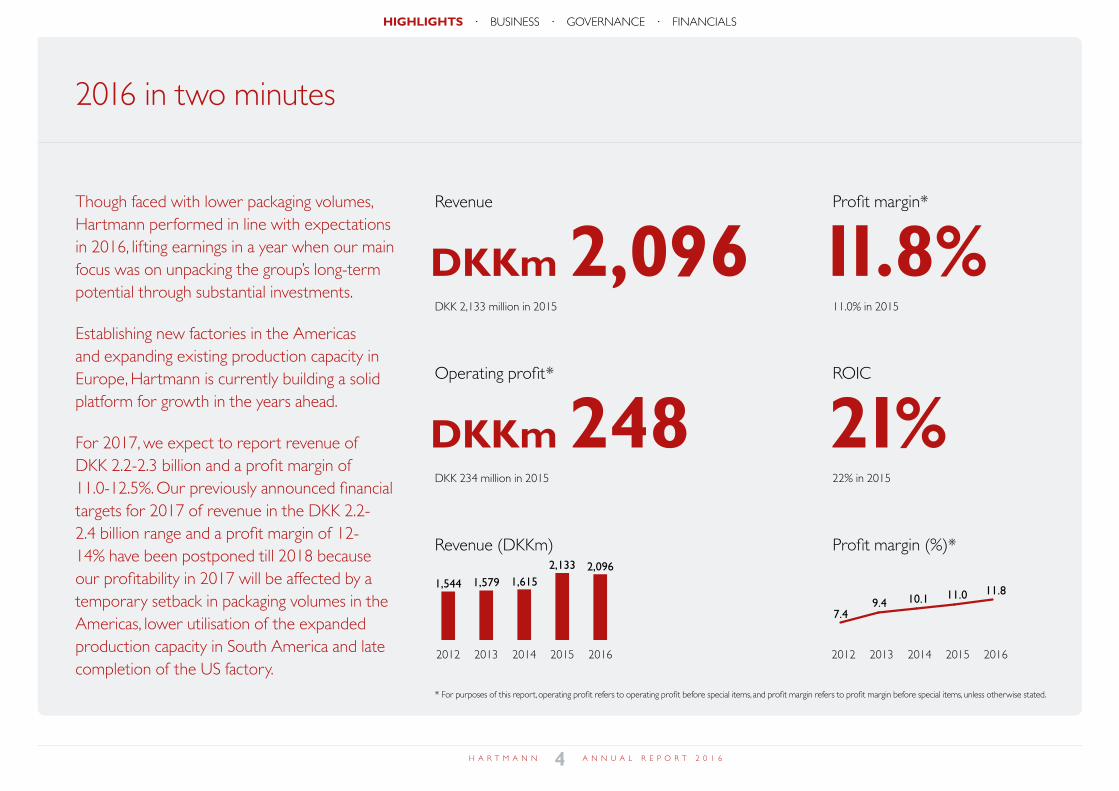
Though faced with lower packaging volumes, Hartmann performed in line with expectations in 2016, lifting earnings in a year when our main focus was on unpacking the group’s long-term potential through substantial investments.
Establishing new factories in the Americas and expanding existing production capacity in Europe, Hartmann is currently building a solid platform for growth in the years ahead.
For 2017, we expect to report revenue of DKK 2.2-2.3 billion and a profit margin of 11.0-12.5%. Our previously announced financial targets for 2017 of revenue in the DKK 2.2-2.4 billion range and a profit margin of 12-14% have been postponed till 2018 because our profitability in 2017 will be affected by a temporary setback in packaging volumes in the Americas, lower utilisation of the expanded production capacity in South America and late completion of the US factory.
Revenue
DKK 2,133 million in 2015
DKKm 2,096Profit margin*
11.0% in 2015
11.8%Operating profit*
DKK 234 million in 2015
DKKm 248ROIC
22% in 2015
21%
* For purposes of this report, operating profit refers to operating profit before special items, and profit margin refers to profit margin before special items, unless otherwise stated.
Revenue (DKKm)
2012 2013 2014 2015 2016
1,544 1,579 1,6152,133 2,096
2016
Profit margin (%)*
2012 2013 2014 2015
7.49.4 10.1 11.0 11.8
4H A R T M A N N A N N U A L R E P O R T 2 0 1 6
HIGHLIGHTS · BUSINESS · GOVERNANCE · FINANCIALShighlights two-minute review
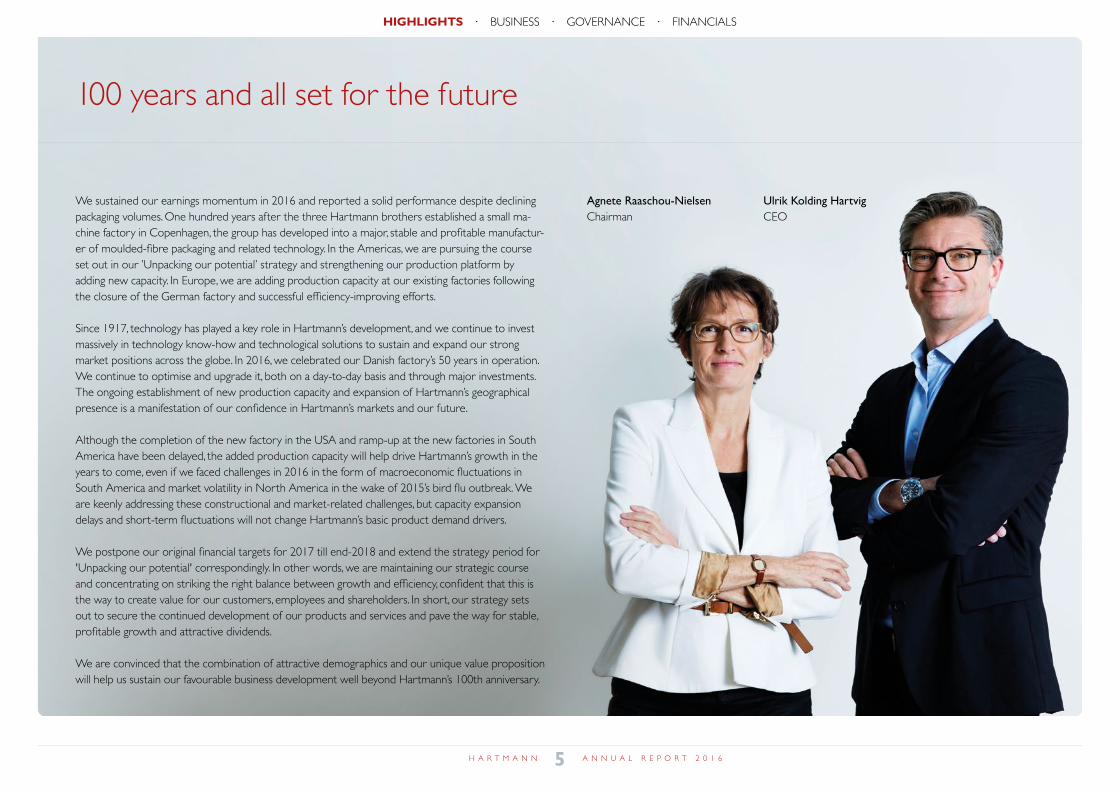
100 years and all set for the future
Agnete Raaschou-NielsenChairman
Ulrik Kolding HartvigCEO
We sustained our earnings momentum in 2016 and reported a solid performance despite declining packaging volumes. One hundred years after the three Hartmann brothers established a small ma-chine factory in Copenhagen, the group has developed into a major, stable and profitable manufactur-er of moulded-fibre packaging and related technology. In the Americas, we are pursuing the course set out in our ’Unpacking our potential’ strategy and strengthening our production platform by adding new capacity. In Europe, we are adding production capacity at our existing factories following the closure of the German factory and successful efficiency-improving efforts.
Since 1917, technology has played a key role in Hartmann’s development, and we continue to invest massively in technology know-how and technological solutions to sustain and expand our strong market positions across the globe. In 2016, we celebrated our Danish factory’s 50 years in operation. We continue to optimise and upgrade it, both on a day-to-day basis and through major investments. The ongoing establishment of new production capacity and expansion of Hartmann’s geographical presence is a manifestation of our confidence in Hartmann’s markets and our future.
Although the completion of the new factory in the USA and ramp-up at the new factories in South America have been delayed, the added production capacity will help drive Hartmann’s growth in the years to come, even if we faced challenges in 2016 in the form of macroeconomic fluctuations in South America and market volatility in North America in the wake of 2015’s bird flu outbreak. We are keenly addressing these constructional and market-related challenges, but capacity expansion delays and short-term fluctuations will not change Hartmann’s basic product demand drivers.
We postpone our original financial targets for 2017 till end-2018 and extend the strategy period for 'Unpacking our potential' correspondingly. In other words, we are maintaining our strategic course and concentrating on striking the right balance between growth and efficiency, confident that this is the way to create value for our customers, employees and shareholders. In short, our strategy sets out to secure the continued development of our products and services and pave the way for stable, profitable growth and attractive dividends.
We are convinced that the combination of attractive demographics and our unique value proposition will help us sustain our favourable business development well beyond Hartmann’s 100th anniversary.
5H A R T M A N N A N N U A L R E P O R T 2 0 1 6
HIGHLIGHTS · BUSINESS · GOVERNANCE · FINANCIALShighlights 100 years all set
Financial highlights
Although we were faced with declining packaging volumes, we sustained our earnings momentum in 2016 and made substantial investments to continue our positive growth trajectory in the years ahead.
Ulrik Kolding Hartvig, CEO
Q4 2016
• Revenue amounted to DKK 523 million (2015: DKK 564 million), and operating profit came to DKK 59 million (2015: DKK 78 million), taking the profit margin to 11.2% (2015: 13.9%). This per-formance was driven by lower average selling prices in Europe and reduced revenue from Hartmann Technology, coupled with a de-cline in packaging volumes and higher fixed costs in the Americas.
• The European business reported revenue of DKK 313 million (2015: DKK 348 million) and operating profit of DKK 50 million (2015: DKK 43 million), taking the profit margin to 16.1% (2015: 12.4%). Sustained high capacity utilisation and efficiency-improv-ing measures lifted profitability, supported by lower energy and transport costs.
• Revenue from the Americas totalled DKK 210 million (2015: DKK 216 million), and operating profit came to DKK 13 million (2015: DKK 41 million), corresponding to a profit margin of 6.3% (2015: 19.0%). This performance was the result of lower packaging volumes and higher depreciation charges and fixed costs resulting from the establishment of three new factories not contributing to the operating profit during ramp-up.
2016
• Revenue totalled DKK 2,096 million (2015: DKK 2,133 million), and operating profit increased to DKK 248 million (2015: DKK 234 million), taking the profit margin to 11.8% (2015: 11.0%). Our total capital expenditure was DKK 340 million against the guidance of DKK 300-325 million. The return on invested capital was 21% (2015: 22%).
• The board of directors proposes a dividend of DKK 9.50 (2015: DKK 9.50) per share.
• The European business grew revenue to DKK 1,258 million (2015: DKK 1,248 million) and operating profit to DKK 164 million (2015: DKK 112 million), bringing the profit margin to 13.1% (2015: 9.0%).
• Our business in the Americas reported revenue of DKK 838 million (2015: DKK 886 million), operating profit of DKK 116 million (2015: DKK 146 million) and a profit margin of 13.8% (2015: 16.5%).
• Foreign exchange developments reduced revenue by DKK 125 million and operating profit by DKK 15 million in 2016. Primarily related to the activities in South America, the currency effects were to some extent neutralised by inflation-induced price increases.
Guidance and targets
• Revenue is expected to amount to DKK 2.2-2.3 billion in 2017. The profit margin is expected to be 11.0-12.5%, impacted by a temporary setback in packaging volumes in the Americas and late completion of the US factory and commissioning of the expanded capacity in South America.
• Our total capital expenditure is expected to be about DKK 250 million in 2017, and the return on invested capital is estimated at 18%.
• Our previously announced financial targets for 2017 of revenue of DKK 2.2-2.4 billion and a profit margin of 12-14% have been postponed till end-2018.
6H A R T M A N N A N N U A L R E P O R T 2 0 1 6
HIGHLIGHTS · BUSINESS · GOVERNANCE · FINANCIALShighlights financial highlights
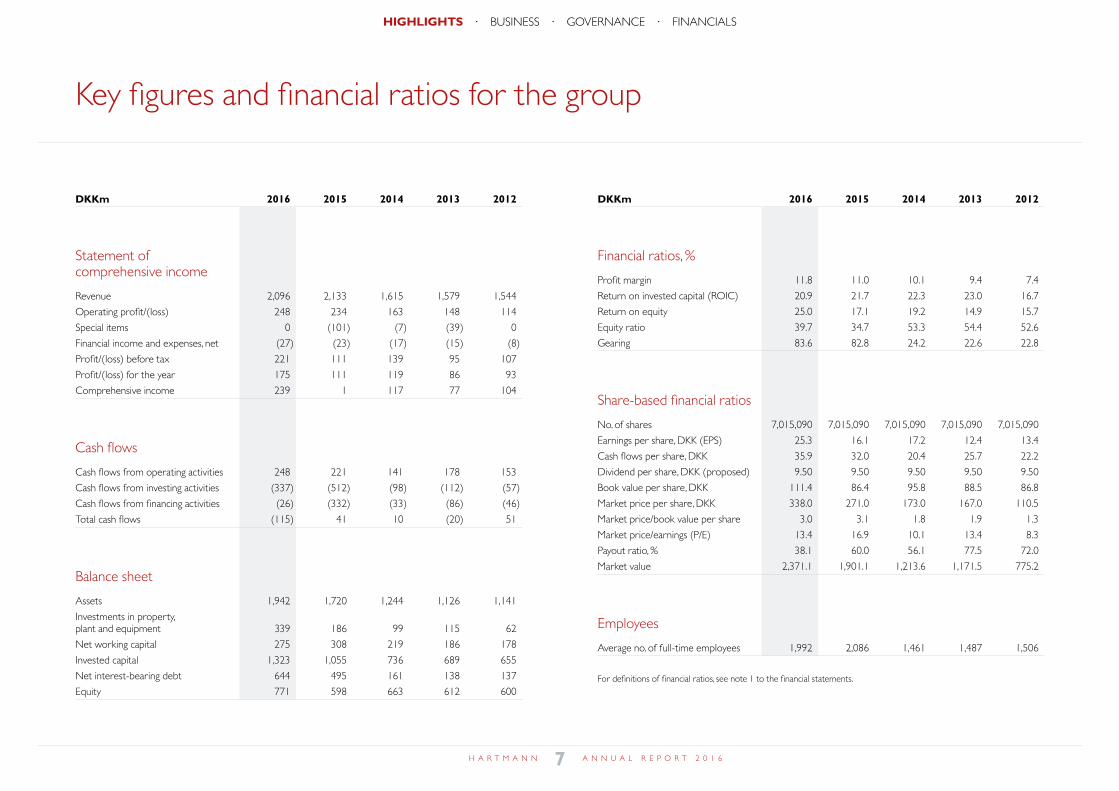
DKKm 2016 2015 2014 2013 2012
Statement of comprehensive income
Revenue 2,096 2,133 1,615 1,579 1,544
Operating profit/(loss) 248 234 163 148 114
Special items 0 (101) (7) (39) 0
Financial income and expenses, net (27) (23) (17) (15) (8)
Profit/(loss) before tax 221 111 139 95 107
Profit/(loss) for the year 175 111 119 86 93
Comprehensive income 239 1 117 77 104
Cash flows
Cash flows from operating activities 248 221 141 178 153
Cash flows from investing activities (337) (512) (98) (112) (57)
Cash flows from financing activities (26) (332) (33) (86) (46)
Total cash flows (115) 41 10 (20) 51
Balance sheet
Assets 1,942 1,720 1,244 1,126 1,141
Investments in property, plant and equipment 339 186 99 115 62
Net working capital 275 308 219 186 178
Invested capital 1,323 1,055 736 689 655
Net interest-bearing debt 644 495 161 138 137
Equity 771 598 663 612 600
DKKm 2016 2015 2014 2013 2012
Financial ratios, %
Profit margin 11.8 11.0 10.1 9.4 7.4
Return on invested capital (ROIC) 20.9 21.7 22.3 23.0 16.7
Return on equity 25.0 17.1 19.2 14.9 15.7
Equity ratio 39.7 34.7 53.3 54.4 52.6
Gearing 83.6 82.8 24.2 22.6 22.8
Share-based financial ratios
No. of shares 7,015,090 7,015,090 7,015,090 7,015,090 7,015,090
Earnings per share, DKK (EPS) 25.3 16.1 17.2 12.4 13.4
Cash flows per share, DKK 35.9 32.0 20.4 25.7 22.2
Dividend per share, DKK (proposed) 9.50 9.50 9.50 9.50 9.50
Book value per share, DKK 111.4 86.4 95.8 88.5 86.8
Market price per share, DKK 338.0 271.0 173.0 167.0 110.5
Market price/book value per share 3.0 3.1 1.8 1.9 1.3
Market price/earnings (P/E) 13.4 16.9 10.1 13.4 8.3
Payout ratio, % 38.1 60.0 56.1 77.5 72.0
Market value 2,371.1 1,901.1 1,213.6 1,171.5 775.2
Employees
Average no. of full-time employees 1,992 2,086 1,461 1,487 1,506
For definitions of financial ratios, see note 1 to the financial statements.
Key figures and financial ratios for the group
7H A R T M A N N A N N U A L R E P O R T 2 0 1 6
HIGHLIGHTS · BUSINESS · GOVERNANCE · FINANCIALShighlights key figures and ratios
ProductionO�ce
BrazilBrazil
Argentina
Brazil
ArgentinaArgentina
USA
Canada
Denmark
GermanyHungary
Croatia
Israel
2016
2016
2017
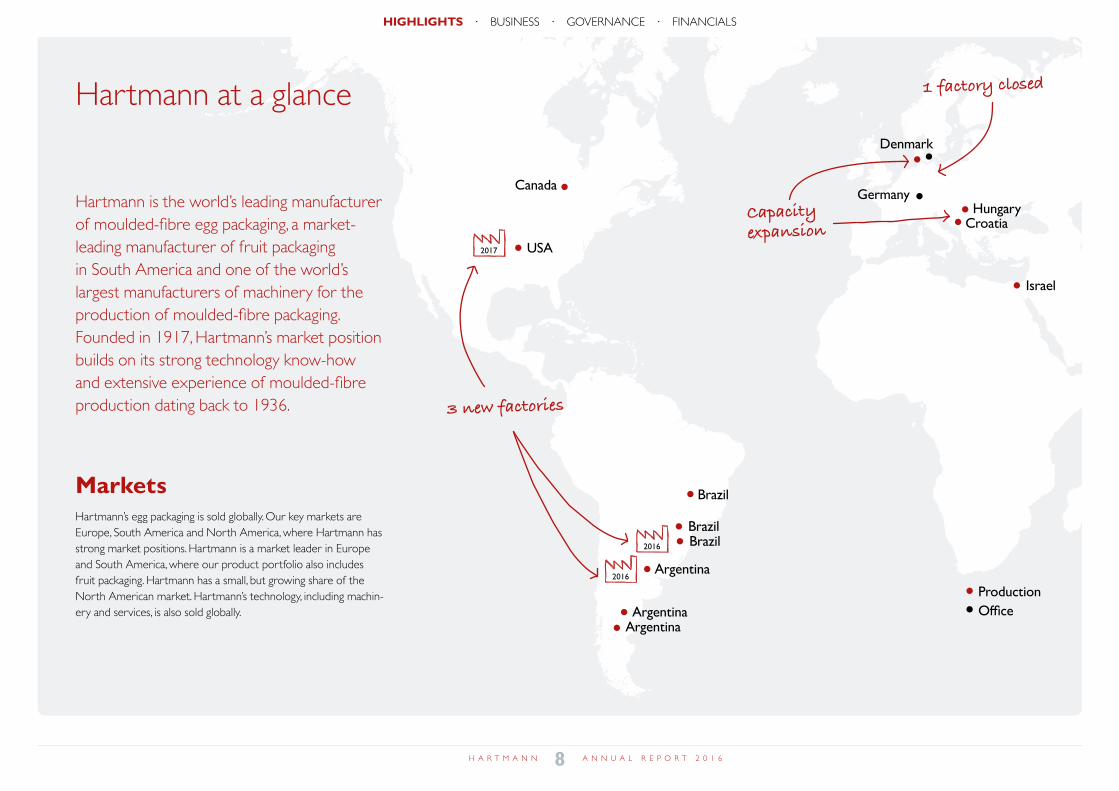
Hartmann at a glance
MarketsHartmann’s egg packaging is sold globally. Our key markets are Europe, South America and North America, where Hartmann has strong market positions. Hartmann is a market leader in Europe and South America, where our product portfolio also includes fruit packaging. Hartmann has a small, but growing share of the North American market. Hartmann’s technology, including machin-ery and services, is also sold globally.
Capacity expansion
Hartmann is the world’s leading manufacturer of moulded-fibre egg packaging, a market-leading manufacturer of fruit packaging in South America and one of the world’s largest manufacturers of machinery for the production of moulded-fibre packaging. Founded in 1917, Hartmann’s market position builds on its strong technology know-how and extensive experience of moulded-fibre production dating back to 1936.
1 factory closed
3 new factories
8H A R T M A N N A N N U A L R E P O R T 2 0 1 6
HIGHLIGHTS · BUSINESS · GOVERNANCE · FINANCIALShighlights hartmann glance
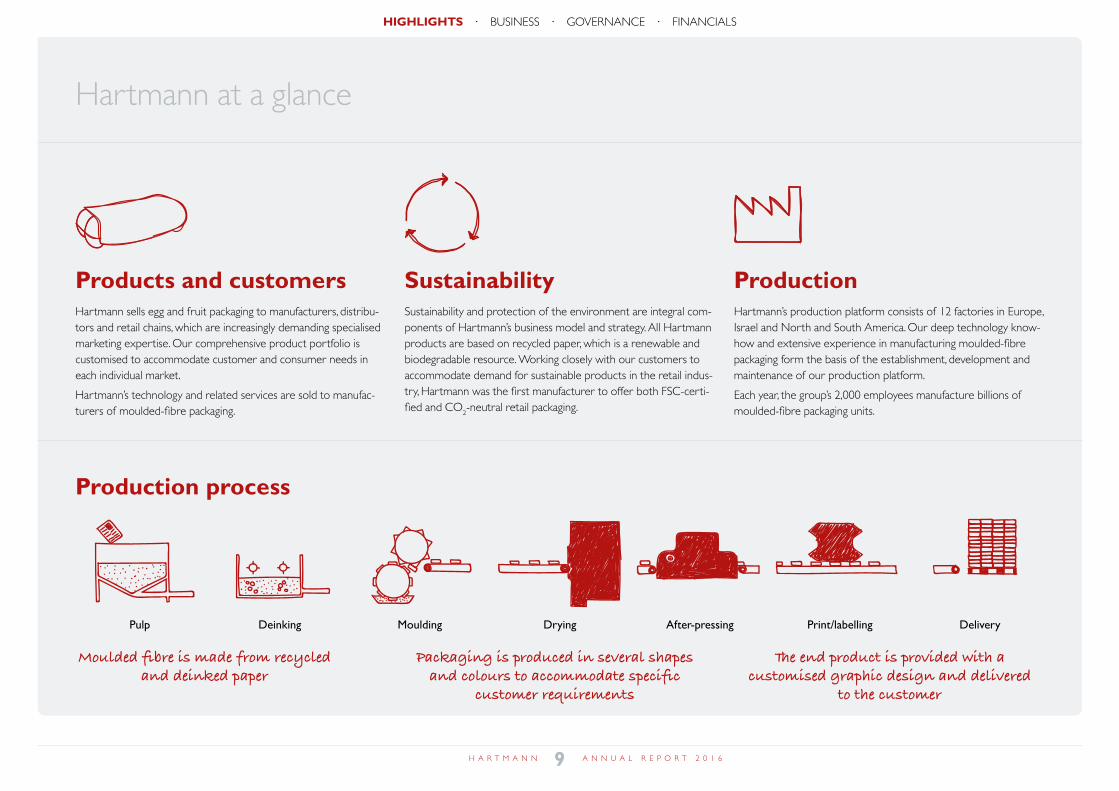
Hartmann at a glance
Products and customersHartmann sells egg and fruit packaging to manufacturers, distribu-tors and retail chains, which are increasingly demanding specialised marketing expertise. Our comprehensive product portfolio is customised to accommodate customer and consumer needs in each individual market.
Hartmann’s technology and related services are sold to manufac-turers of moulded-fibre packaging.
Production process
SustainabilitySustainability and protection of the environment are integral com-ponents of Hartmann’s business model and strategy. All Hartmann products are based on recycled paper, which is a renewable and biodegradable resource. Working closely with our customers to accommodate demand for sustainable products in the retail indus-try, Hartmann was the first manufacturer to offer both FSC-certi-fied and CO2-neutral retail packaging.
ProductionHartmann’s production platform consists of 12 factories in Europe, Israel and North and South America. Our deep technology know-how and extensive experience in manufacturing moulded-fibre packaging form the basis of the establishment, development and maintenance of our production platform.
Each year, the group’s 2,000 employees manufacture billions of moulded-fibre packaging units.
Pulp After-pressingMoulding DeliveryDeinking Print/labellingDrying
Moulded fibre is made from recycled and deinked paper
The end product is provided with a customised graphic design and delivered
to the customer
Packaging is produced in several shapes and colours to accommodate specific
customer requirements
9H A R T M A N N A N N U A L R E P O R T 2 0 1 6
HIGHLIGHTS · BUSINESS · GOVERNANCE · FINANCIALS
Think potential
Business
11 2016 in review
15 Guidance and targets
16 Strategy
18 Markets and products
19 Risk
21 1917-2017
10H A R T M A N N A N N U A L R E P O R T 2 0 1 6
HIGHLIGHTS · BUSINESS · GOVERNANCE · FINANCIALSbusiness indhold
2016 in review
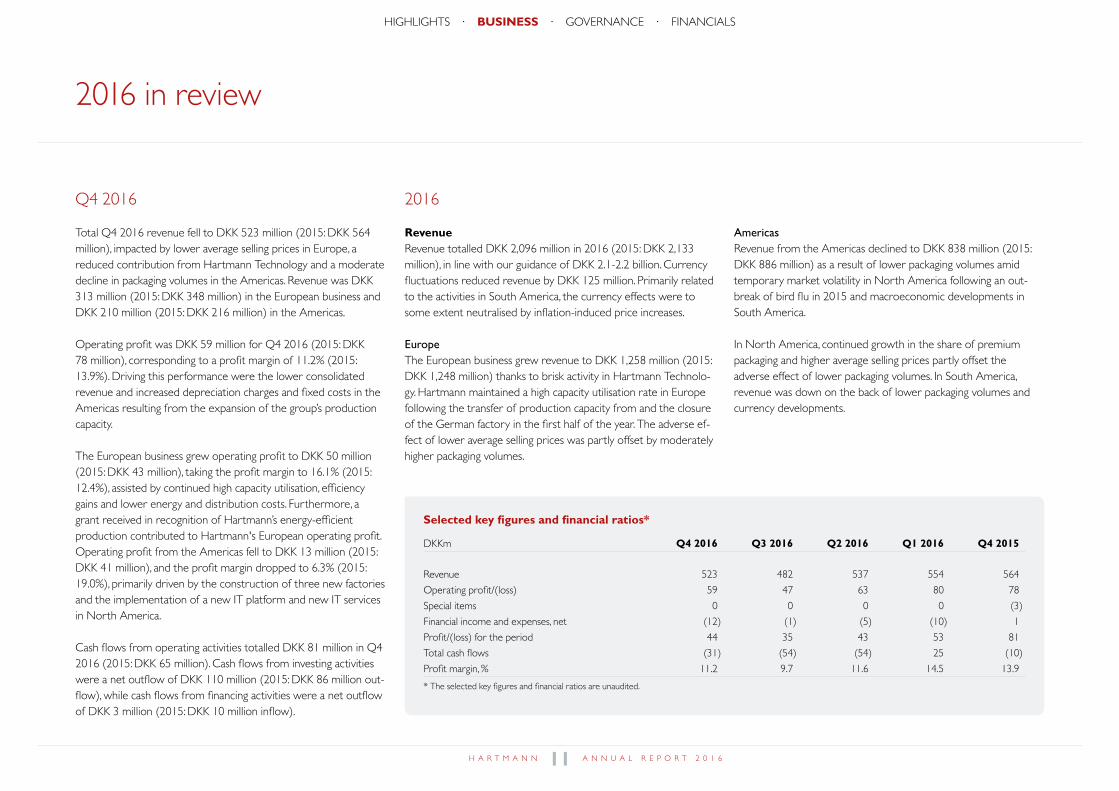
Q4 2016
Total Q4 2016 revenue fell to DKK 523 million (2015: DKK 564 million), impacted by lower average selling prices in Europe, a reduced contribution from Hartmann Technology and a moderate decline in packaging volumes in the Americas. Revenue was DKK 313 million (2015: DKK 348 million) in the European business and DKK 210 million (2015: DKK 216 million) in the Americas.
Operating profit was DKK 59 million for Q4 2016 (2015: DKK 78 million), corresponding to a profit margin of 11.2% (2015: 13.9%). Driving this performance were the lower consolidated revenue and increased depreciation charges and fixed costs in the Americas resulting from the expansion of the group’s production capacity.
The European business grew operating profit to DKK 50 million (2015: DKK 43 million), taking the profit margin to 16.1% (2015: 12.4%), assisted by continued high capacity utilisation, efficiency gains and lower energy and distribution costs. Furthermore, a grant received in recognition of Hartmann’s energy-efficient production contributed to Hartmann's European operating profit. Operating profit from the Americas fell to DKK 13 million (2015: DKK 41 million), and the profit margin dropped to 6.3% (2015: 19.0%), primarily driven by the construction of three new factories and the implementation of a new IT platform and new IT services in North America.
Cash flows from operating activities totalled DKK 81 million in Q4 2016 (2015: DKK 65 million). Cash flows from investing activities were a net outflow of DKK 110 million (2015: DKK 86 million out-flow), while cash flows from financing activities were a net outflow of DKK 3 million (2015: DKK 10 million inflow).
Selected key figures and financial ratios*
DKKm Q4 2016 Q3 2016 Q2 2016 Q1 2016 Q4 2015
Revenue 523 482 537 554 564
Operating profit/(loss) 59 47 63 80 78
Special items 0 0 0 0 (3)
Financial income and expenses, net (12) (1) (5) (10) 1
Profit/(loss) for the period 44 35 43 53 81
Total cash flows (31) (54) (54) 25 (10)
Profit margin, % 11.2 9.7 11.6 14.5 13.9
* The selected key figures and financial ratios are unaudited.
2016
RevenueRevenue totalled DKK 2,096 million in 2016 (2015: DKK 2,133 million), in line with our guidance of DKK 2.1-2.2 billion. Currency fluctuations reduced revenue by DKK 125 million. Primarily related to the activities in South America, the currency effects were to some extent neutralised by inflation-induced price increases.
EuropeThe European business grew revenue to DKK 1,258 million (2015: DKK 1,248 million) thanks to brisk activity in Hartmann Technolo-gy. Hartmann maintained a high capacity utilisation rate in Europe following the transfer of production capacity from and the closure of the German factory in the first half of the year. The adverse ef-fect of lower average selling prices was partly offset by moderately higher packaging volumes.
AmericasRevenue from the Americas declined to DKK 838 million (2015: DKK 886 million) as a result of lower packaging volumes amid temporary market volatility in North America following an out-break of bird flu in 2015 and macroeconomic developments in South America.
In North America, continued growth in the share of premium packaging and higher average selling prices partly offset the adverse effect of lower packaging volumes. In South America, revenue was down on the back of lower packaging volumes and currency developments.
11H A R T M A N N A N N U A L R E P O R T 2 0 1 6
HIGHLIGHTS · BUSINESS · GOVERNANCE · FINANCIALSbusiness 2016 review
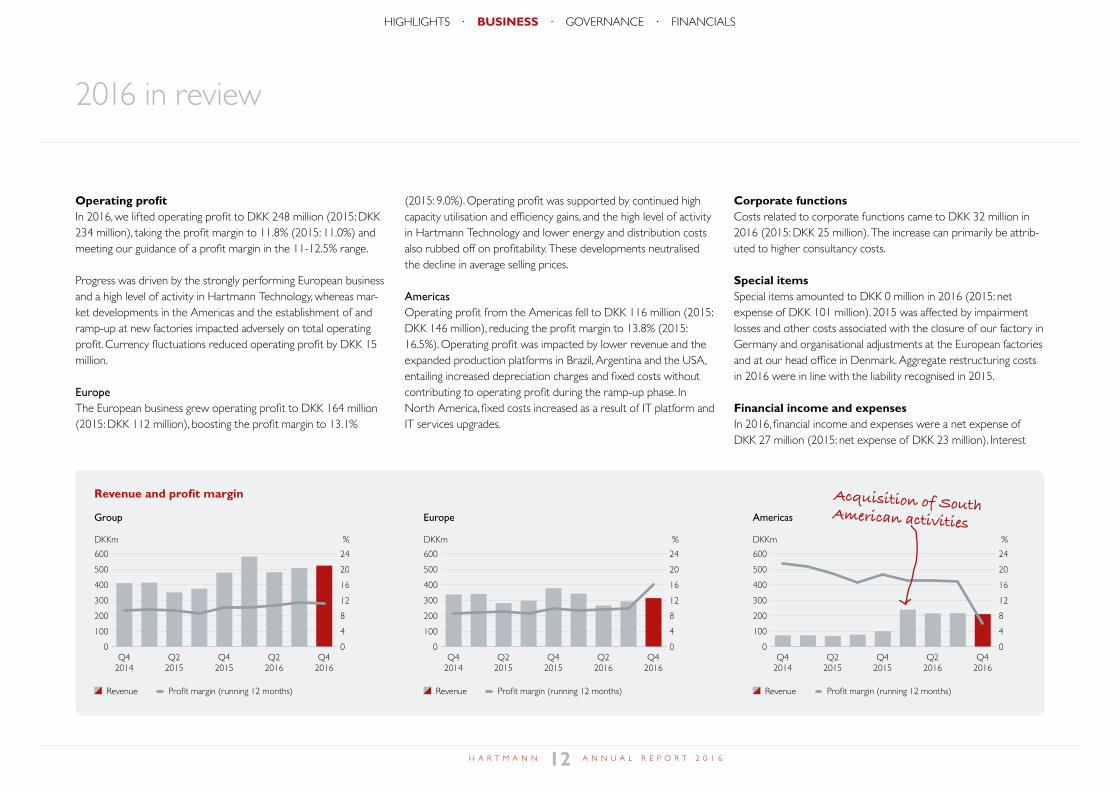
Revenue and profit margin
Group
Europe
Americas
Q42014
DKKm %
Q22015
Q42015
Q22016
Q42016
0
100
200
300
400
500
600
0
4
8
12
16
20
24
%
0
100
200
300
400
500
600
0
4
8
12
16
20
24
Q42014
DKKm
Q22015
Q42015
Q22016
Q42016
%
0
100
200
300
400
500
600
0
4
8
12
16
20
24
Q42014
DKKm
Q22015
Q42015
Q22016
Q42016
Operating profitIn 2016, we lifted operating profit to DKK 248 million (2015: DKK 234 million), taking the profit margin to 11.8% (2015: 11.0%) and meeting our guidance of a profit margin in the 11-12.5% range.
Progress was driven by the strongly performing European business and a high level of activity in Hartmann Technology, whereas mar-ket developments in the Americas and the establishment of and ramp-up at new factories impacted adversely on total operating profit. Currency fluctuations reduced operating profit by DKK 15 million.
EuropeThe European business grew operating profit to DKK 164 million (2015: DKK 112 million), boosting the profit margin to 13.1%
Revenue Profit margin (running 12 months) Revenue Profit margin (running 12 months) Revenue Profit margin (running 12 months)
(2015: 9.0%). Operating profit was supported by continued high capacity utilisation and efficiency gains, and the high level of activity in Hartmann Technology and lower energy and distribution costs also rubbed off on profitability. These developments neutralised the decline in average selling prices.
AmericasOperating profit from the Americas fell to DKK 116 million (2015: DKK 146 million), reducing the profit margin to 13.8% (2015: 16.5%). Operating profit was impacted by lower revenue and the expanded production platforms in Brazil, Argentina and the USA, entailing increased depreciation charges and fixed costs without contributing to operating profit during the ramp-up phase. In North America, fixed costs increased as a result of IT platform and IT services upgrades.
Corporate functionsCosts related to corporate functions came to DKK 32 million in 2016 (2015: DKK 25 million). The increase can primarily be attrib-uted to higher consultancy costs.
Special itemsSpecial items amounted to DKK 0 million in 2016 (2015: net expense of DKK 101 million). 2015 was affected by impairment losses and other costs associated with the closure of our factory in Germany and organisational adjustments at the European factories and at our head office in Denmark. Aggregate restructuring costs in 2016 were in line with the liability recognised in 2015.
Financial income and expensesIn 2016, financial income and expenses were a net expense of DKK 27 million (2015: net expense of DKK 23 million). Interest
2016 in review
Acquisition of South American activities
12H A R T M A N N A N N U A L R E P O R T 2 0 1 6
HIGHLIGHTS · BUSINESS · GOVERNANCE · FINANCIALS
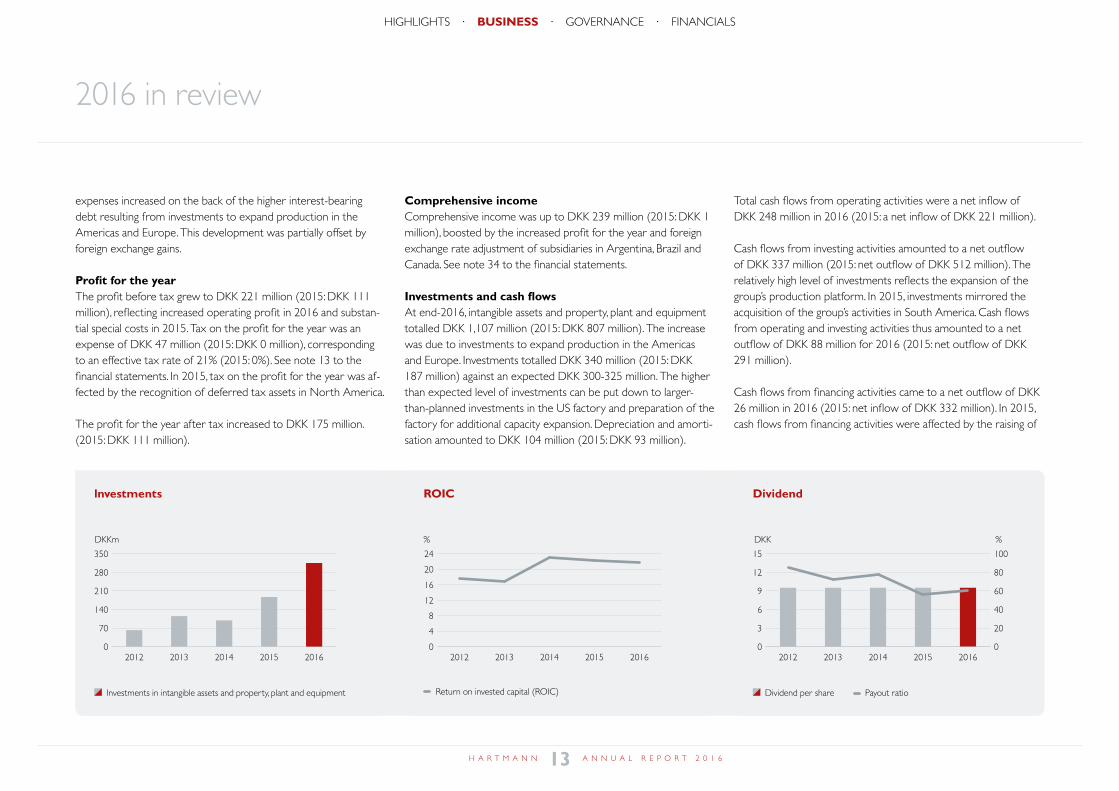
DividendROIClnvestments
%
0
4
8
12
16
20
24
2012 2013 2014 2015 2016
DKK %
0
3
6
9
12
15
0
20
40
60
80
100
2012 2013 2014 2015 2016
DKKm
0
70
140
210
280
350
2012 2013 2014 2015 2016
expenses increased on the back of the higher interest-bearing debt resulting from investments to expand production in the Americas and Europe. This development was partially offset by foreign exchange gains.
Profit for the yearThe profit before tax grew to DKK 221 million (2015: DKK 111 million), reflecting increased operating profit in 2016 and substan-tial special costs in 2015. Tax on the profit for the year was an expense of DKK 47 million (2015: DKK 0 million), corresponding to an effective tax rate of 21% (2015: 0%). See note 13 to the financial statements. In 2015, tax on the profit for the year was af-fected by the recognition of deferred tax assets in North America.
The profit for the year after tax increased to DKK 175 million. (2015: DKK 111 million).
Comprehensive incomeComprehensive income was up to DKK 239 million (2015: DKK 1 million), boosted by the increased profit for the year and foreign exchange rate adjustment of subsidiaries in Argentina, Brazil and Canada. See note 34 to the financial statements.
Investments and cash flowsAt end-2016, intangible assets and property, plant and equipment totalled DKK 1,107 million (2015: DKK 807 million). The increase was due to investments to expand production in the Americas and Europe. Investments totalled DKK 340 million (2015: DKK 187 million) against an expected DKK 300-325 million. The higher than expected level of investments can be put down to larger-than-planned investments in the US factory and preparation of the factory for additional capacity expansion. Depreciation and amorti-sation amounted to DKK 104 million (2015: DKK 93 million).
Total cash flows from operating activities were a net inflow of DKK 248 million in 2016 (2015: a net inflow of DKK 221 million).
Cash flows from investing activities amounted to a net outflow of DKK 337 million (2015: net outflow of DKK 512 million). The relatively high level of investments reflects the expansion of the group’s production platform. In 2015, investments mirrored the acquisition of the group’s activities in South America. Cash flows from operating and investing activities thus amounted to a net outflow of DKK 88 million for 2016 (2015: net outflow of DKK 291 million).
Cash flows from financing activities came to a net outflow of DKK 26 million in 2016 (2015: net inflow of DKK 332 million). In 2015, cash flows from financing activities were affected by the raising of
Dividend per share Payout ratio Return on invested capital (ROIC) Investments in intangible assets and property, plant and equipment
2016 in review
13H A R T M A N N A N N U A L R E P O R T 2 0 1 6
HIGHLIGHTS · BUSINESS · GOVERNANCE · FINANCIALS
non-current debt in connection with the acquisition of the South American activities.
Net interest-bearing debt at 31 December 2016 was DKK 644 million (2015: DKK 495 million). The increase in net interest-bear-ing debt was caused by the relatively high level of investments.
At the end of 2016, financial resources amounted to DKK 299 mil-lion, comprising cash and cash equivalents and undrawn loan and overdraft facilities. Hartmann’s loans are subject to customary financial covenants. See note 33 to the financial statements.
AssetsAssets totalled DKK 1,942 million at 31 December 2016 (2015: DKK 1,720 million).
ROICReturn on invested capital was 21% in 2016 against 22% in 2015.
EquityEquity at 31 December 2016 was DKK 771 million (2015: DKK 598 million), and the equity ratio was up to 40% (2015: 35%). The financial gearing was 84% (2015: 83%). These changes reflect retained earnings and the positive effect of foreign exchange rate adjustment of subsidiaries.
2016 in review
Earnings per share rose to DKK 25.3 (2015: DKK 16.1). At the annual general meeting to be held on 4 April 2017, the board of directors intends to propose a dividend of DKK 9.50 (2015: DKK 9.50) per share, corresponding to a payout ratio of 38% (2015: 69%).
Parent companyIn 2016, the parent company generated revenue of DKK 1,260 million (2015: DKK 1,299 million) and operating profit of DKK 85 million (2015: DKK 35 million). Profit for the year was DKK 96 million, down from DKK 297 million in 2015, when profits were boosted by a reversal of prior year impairment losses on invest-ments in subsidiaries.
Events after the balance sheet dateNo events have occurred in the period from the balance sheet date until the date of release of this annual report that would materially affect the evaluation of the annual report.
14H A R T M A N N A N N U A L R E P O R T 2 0 1 6
HIGHLIGHTS · BUSINESS · GOVERNANCE · FINANCIALS
Forward-looking statements
The forward-looking statements in this annual report reflect Hartmann’s current expectations for future events and financial results. Such state-ments are inherently subject to uncertainty, and actual results may therefore differ from expectations. Factors which may cause the actual results to deviate from expectations include general economic developments and developments in the financial markets, changes or amendments to legislation and regulation in our markets, changes in demand for products, competition and the prices of raw materials. See also the section on risk and note 33 to the financial statements.
Guidance and targets
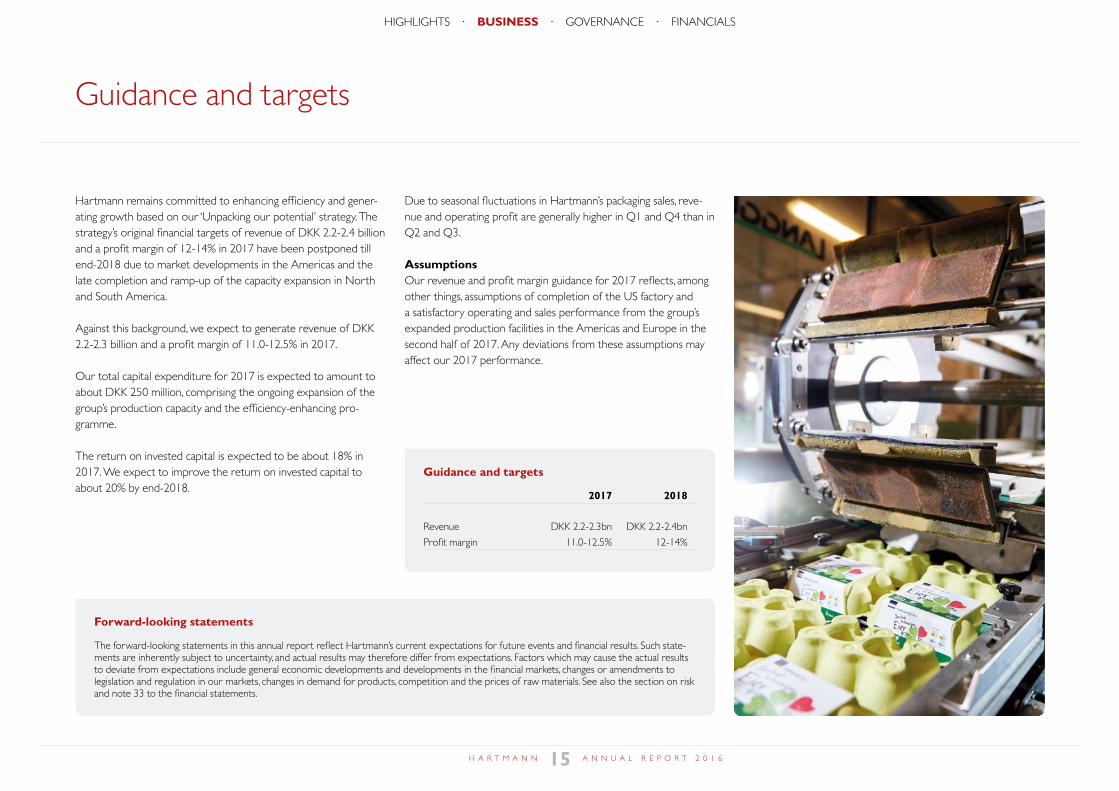
Hartmann remains committed to enhancing efficiency and gener-ating growth based on our ‘Unpacking our potential’ strategy. The strategy’s original financial targets of revenue of DKK 2.2-2.4 billion and a profit margin of 12-14% in 2017 have been postponed till end-2018 due to market developments in the Americas and the late completion and ramp-up of the capacity expansion in North and South America.
Against this background, we expect to generate revenue of DKK 2.2-2.3 billion and a profit margin of 11.0-12.5% in 2017.
Our total capital expenditure for 2017 is expected to amount to about DKK 250 million, comprising the ongoing expansion of the group’s production capacity and the efficiency-enhancing pro-gramme.
The return on invested capital is expected to be about 18% in 2017. We expect to improve the return on invested capital to about 20% by end-2018.
Due to seasonal fluctuations in Hartmann’s packaging sales, reve-nue and operating profit are generally higher in Q1 and Q4 than in Q2 and Q3.
AssumptionsOur revenue and profit margin guidance for 2017 reflects, among other things, assumptions of completion of the US factory and a satisfactory operating and sales performance from the group’s expanded production facilities in the Americas and Europe in the second half of 2017. Any deviations from these assumptions may affect our 2017 performance.
Guidance and targets
2017 2018
Revenue DKK 2.2-2.3bn DKK 2.2-2.4bn
Profit margin 11.0-12.5% 12-14%
15H A R T M A N N A N N U A L R E P O R T 2 0 1 6
HIGHLIGHTS · BUSINESS · GOVERNANCE · FINANCIALSbusiness guidance targets
We will also continue to customise our product portfolio, aiming to accommodate requirements in our different markets and drive the transition from standard to premium products to allow customers to enjoy the unique marketing and logistic benefits that Hartmann offers.
Through our efforts to realise our ‘Unpacking our potential’ strate-gy, we will strengthen our attractive value proposition and pave the way for progress and earnings growth following the expansion and commissioning of production capacity in the Americas and Europe.
We have extended the strategy period under 'Unpacking our potential' till end-2018, and our financial targets of revenue of DKK 2.2-2.4 billion and a profit margin of 12-14% have also been deferred from 2017 till end-2018.
Strategy
In 2016, we continued to pursue the objectives set out in our strategy, ‘Unpacking our potential’. We expanded our production platform by adding new capacity in the Americas and strengthened our competitiveness in Europe where, in a more competitive market, we managed to improve profitability through efficiency-en-hancing measures.
In 2016, we completed a number of strategic measures launched in 2015. Two factories started production in Argentina and Brazil, respectively, and we established the basis for commencing produc-tion in the USA in the first half of 2017.
In Europe, the German factory was closed down as planned. Under the auspices of Hartmann Technology, we also established a test centre that will support the development of new production methods and products. And we stepped up the expansion of pro-duction capacity in Europe after completing efficiency measures.
The European expansion programme will continue in 2017 with further capacity expansion and continued automation at existing factories. By means of this exercise, Hartmann aims to capture a substantial share of the expected growth in selected European markets.
In America and Europe, we continuously balance our two strategic focus areas, growth and efficiency. As from 2017, we will gradually redirect our strategic focus in the Americas to efficiency as the new production capacity in North and South America is commis-sioned. In Europe, our efficiency-enhancing measures paid off in 2016 and profitability increased significantly. We will continue our efficiency programme in the coming period but will redirect our primary focus from efficiency to growth and enhanced efforts to expand production capacity at our existing factories and grow our egg packaging sales volumes.
Leveraging and expanding our strong positions in existing markets and exploring our global growth potential through expansion of our production network and potential acquisitions of attractive businesses.
Applying and developing our proven technological competencies to optimise production, fuel machine sales and form new partnerships.
Tailoring our versatile product portfolio to the specific demand patterns of existing markets and increasing sales of transport packaging as well as standard and premium products.
Optimising and expanding our well-established production platform and increasing production efficiency and flexibility.
Potential
16H A R T M A N N A N N U A L R E P O R T 2 0 1 6
HIGHLIGHTS · BUSINESS · GOVERNANCE · FINANCIALSbusiness strategy
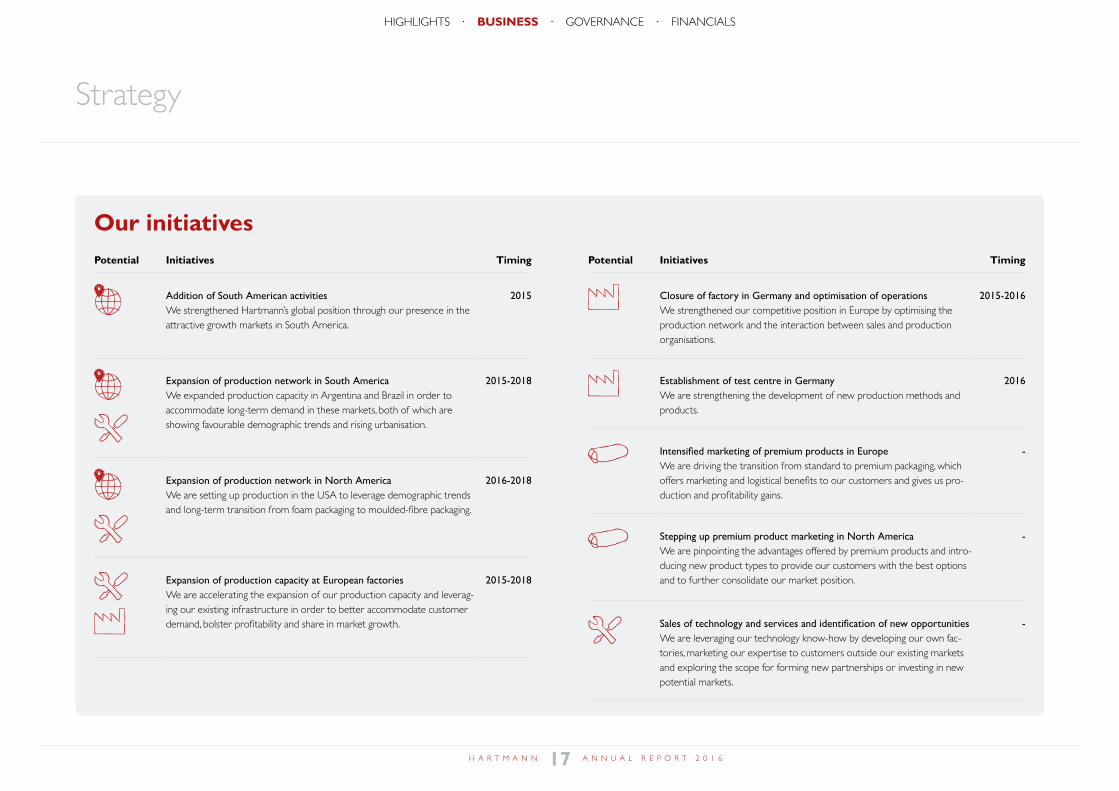
Potential Initiatives Timing
Addition of South American activitiesWe strengthened Hartmann’s global position through our presence in the attractive growth markets in South America.
2015
Expansion of production network in South AmericaWe expanded production capacity in Argentina and Brazil in order to accommodate long-term demand in these markets, both of which are showing favourable demographic trends and rising urbanisation.
2015-2018
Expansion of production network in North AmericaWe are setting up production in the USA to leverage demographic trends and long-term transition from foam packaging to moulded-fibre packaging.
2016-2018
Expansion of production capacity at European factoriesWe are accelerating the expansion of our production capacity and leverag-ing our existing infrastructure in order to better accommodate customer demand, bolster profitability and share in market growth.
2015-2018
Potential Initiatives Timing
Closure of factory in Germany and optimisation of operationsWe strengthened our competitive position in Europe by optimising the production network and the interaction between sales and production organisations.
2015-2016
Establishment of test centre in GermanyWe are strengthening the development of new production methods and products.
2016
Intensified marketing of premium products in EuropeWe are driving the transition from standard to premium packaging, which offers marketing and logistical benefits to our customers and gives us pro-duction and profitability gains.
-
Stepping up premium product marketing in North AmericaWe are pinpointing the advantages offered by premium products and intro-ducing new product types to provide our customers with the best options and to further consolidate our market position.
-
Sales of technology and services and identification of new opportunitiesWe are leveraging our technology know-how by developing our own fac-tories, marketing our expertise to customers outside our existing markets and exploring the scope for forming new partnerships or investing in new potential markets.
-
Our initiatives
Strategy
17H A R T M A N N A N N U A L R E P O R T 2 0 1 6
HIGHLIGHTS · BUSINESS · GOVERNANCE · FINANCIALS
Markets and products
As a manufacturer of moulded-fibre packaging, Hartmann operates in several diverse markets with varying product offerings that are continuously adapted to regional needs. Hartmann’s aggregate product portfolio comprises both retail packaging for eggs and transport pack-aging for eggs and fruit.
Retail packaging for eggs is our main product category. The segmen-tation into standard and premium products varies from market to market depending on factors such as the maturity of the retail trade, the penetration of moulded-fibre packaging and focus on sustainability.
For sales of egg and fruit packaging, our main markets are Europe and North and South America, while Hartmann Technology sells its ma-chinery and technology for manufacturing of moulded-fibre packaging and its services globally – and mostly outside of Hartmann’s markets.
Demand for egg and fruit packaging is generally stable and quite resilient to economic fluctuations. However, exchange rate fluctuations may affect South American fruit exports and, by extension, sales of fruit packaging, and demand for both egg and fruit packaging is to some extent seasonal. Hartmann’s primary markets are highly competi-tive and dominated by a few large and medium-sized players.
Hartmann has developed and launched new product lines which have been standard-setters for quality packaging. Developing innovative products strengthens Hartmann’s position as the customers’ preferred supplier and entails a number of advantages in relation to manufac-turing and transport. For this reason, we continuously protect our intellectual property rights in order to actively protect our products and trademarks.
In 2016, we stepped up our efforts to upgrade products and pro-duction methods by establishing a test centre in Germany. Hartmann
strives to accommodate customer demand for optimised marketing options in the premium segment for egg packaging and to develop other products that satisfy the needs of our customers and facilitate production process optimisation and production capacity enhance-ment at our factories. In 2016, these efforts included the introduction of additional transport packaging variants adapted to selected Euro-pean markets. In addition, we continued our efforts to improve digital interaction with our customers.
EuropeHolding a market share of about 40%, Hartmann is the leading man-ufacturer of egg packaging in the relatively mature European markets, many of which were characterised by fierce competition in 2016. CDL, one of Hartmann’s French competitors, acquired Omni-Pac, a major market player, in the final quarter of 2016, and the changed compet-itive landscape may cause market volatility. We expect to see average annual growth of 1-3% during the strategy period, varying across national borders but generally driven by growing demand for retail packaging on the back of continued penetration and professionalisation of the retail trade, along with the ongoing transition from plastic to moulded-fibre packaging.
We are strengthening the capacity of our existing production network in Europe.
North AmericaIn North America, our moulded-fibre products represent just over 15% of the total market for moulded-fibre and foam egg packaging. Average annual growth in the North American market for moulded-fi-bre products is expected to be around 3%, driven by conversion from foam packaging and an increasing consumption of eggs. Customers are increasingly demanding premium products, a segment in which Hartmann holds a strong market position and has recently launched an
innovative hybrid-packaging product combining a bottom of protec-tive moulded fibre with a top of folding carton, which offers excellent marketing potential.
Our North American capacity is being expanded through the estab-lishment of a factory in the state of Missouri, USA, with the aim of continuing the positive sales trend and offering our products to exist-ing and new customers based on added production capacity, broader geographical coverage and the ability to secure supplies in the event of unintentional production stoppages at a factory.
South AmericaHartmann has a market leading position in Brazil and Argentina where we sell both egg and fruit packaging, covering about one third of the demand for egg packaging.
Hartmann’s market share of fruit packaging is about 20% in Brazil and about 50% in Argentina. Following a period of subdued market growth, average annual market growth in South America is expected to be at the level of 4-7%, driven by growing demand, favourable demographics and continued urbanisation.
The two new factories in Brazil and Argentina are under commission-ing with a view to accommodating customer demand.
Hartmann TechnologyThe Hartmann group's technology, machinery and related services are sold globally, primarily outside our primary markets. Hartmann Tech-nology assists customers in meeting growing demand for moulded-fi-bre packaging and uses its technology know-how in the expansion and optimisation of Hartmann’s own production network.
18H A R T M A N N A N N U A L R E P O R T 2 0 1 6
HIGHLIGHTS · BUSINESS · GOVERNANCE · FINANCIALSbusiness markets and products
Hartmann is exposed to operating risks, which we monitor and actively address on an ongoing basis. The executive board is responsible for identifying and managing risks in compliance with the policies approved by the board of directors. Together with the audit committee and the board of directors, the executive board reviews the risks that may affect Hartmann’s operational and financial targets. The purpose of risk management is to identify risk areas, determine how to manage these risks and optimise the risk-return balance.
Commercial risks
Reliance on customersHartmann’s customer portfolio is well-diversified and consists of several large customers as well as many small customers. The trend in our customer portfolio is towards fewer and larger cus-tomers, and we expect to become more reliant on this customer group going forward.
Demand for eggs and fruitOur core business consists of sales of egg and fruit packaging, which are driven by demand for eggs and fruit. Consumption of eggs and fruit may be influenced by a variety of factors beyond our control, including disease outbreaks among laying hens and consumer fears of resulting health hazards, prevailing health per-ceptions, regional export and trading conditions, etc. Consumption and, by extension, demand for Hartmann’s products is driven by demographic trends and has historically been resilient to slow-downs in economic growth.
Risk
Reliance on suppliersWe contract with a number of suppliers of recycled paper, energy and other raw materials used in our production. If contracts with one or more of these suppliers are terminated or breached, or suppliers fail to meet their contractual obligations for other reasons, we may not be able to source the necessary raw materials, or we may be compelled to make purchases from alternative suppliers and not necessarily on the same terms.
Hartmann has contracted with several different suppliers of recy-cled paper, energy and other raw materials.
Fluctuations in raw materials pricesHartmann is exposed to changes in purchase prices of the raw materials used in our production. We are particularly sensitive to fluctuations in purchase prices of recycled paper and energy (electricity and gas), which are the most important raw materials used in our production.
There is limited scope for reducing sensitivity to developments in the price of recycled paper if supplies of the required volumes are to be secured and maintained.
We regularly sign fixed-price agreements with energy suppliers, typically for six or 12 months, covering a substantial part of our energy consumption. However, it is not possible to sign fixed-price agreements with energy suppliers in all the countries in which we operate.
We strive to reduce our sensitivity to fluctuations in raw materials prices through continuous implementation of technological innova-tion and optimisation of work processes.
Combined heat and power plantIn 2008, district heating company Tønder Fjernvarmeselskab filed a complaint with the Danish Energy Regulatory Authority concern-ing the pricing of district heating supplied by Hartmann’s combined heat and power plant. In 2015, the Secretariat of the Danish Energy Regulatory Authority made a decision on the principles guiding the calculation of heating prices in the period from 2003 up to and including 8 January 2015, when district heating supplies were discontinued. Hartmann appealed this decision to the Danish Energy Board of Appeal, which made a decision on 30 June 2016 that only considered the Danish Energy Regulatory Authority’s powers to impose forward orders. Since the contract between Tønder Fjernvarmeselskab and Hartmann has been terminated, the decision of the Danish Energy Board of Appeal only implies that an order will not be imposed on Hartmann.
In both the pending case and in related cases, the Danish Energy Regulatory Authority and the Danish Energy Board of Appeal have interpreted applicable law differently. Hartmann has therefore ap-pealed the decision of the Danish Energy Regulatory Authority to the Danish Energy Board of Appeal and brought an action against the Danish Energy Board of Appeal, see company announcement 16/2016 of 22 December 2016, with a view to clarifying the law governing these linked cases, including the collection of Hartmann’s DKK 39 million receivable from Tønder Fjernvarmeselskab.
Assuming that the final decision in the case will reflect the 2015 decision of the Danish Energy Regulatory Authority, Hartmann expects costs to amount to about DKK 50 million and estimates a negative cash flow effect of DKK 10 million. Tønder Fjernvarmesel-skab on its part has raised a claim of DKK 88 million.
19H A R T M A N N A N N U A L R E P O R T 2 0 1 6
HIGHLIGHTS · BUSINESS · GOVERNANCE · FINANCIALSbusiness risk
Risk
Based on an internal review of these decisions and indications from external advisers, management believes that the case will very likely be referred back to the Danish Energy Board of Appeal, resulting in a reversal of district heating pricing principles.
Social and environmental risks
Corporate social relations and risksWe give high priority to measures safeguarding health and safety at the workplace, protecting human values in society at large as well as the people who are in contact with Hartmann or Hartmann’s products. Hartmann has processes in place to ensure that health and safety conditions at the workplace comply with our group-wide regulations and that we handle our corporate social respon-sibility in an effective and efficient manner and act as a responsible player in the countries where we operate.
Environmental risksHartmann’s activities, including production, sales, use, storage and disposal of products, are subject to a number of environmental laws and regulations. Environmental risk is monitored both locally and centrally at our head office, in order to prevent, remedy or minimise any adverse effect on the external environment. We use and expect to continue to use considerable resources to observe and comply with environmental laws and regulations in the coun-tries in which we operate.
We are subject to various rules, including rules governing noise reduction, wastewater discharge and waste disposal and the rules of the EU CO2 emission trading system. Our policy is to operate all production facilities in an environmentally responsible manner
and in compliance with sustainability principles. A number of Hart-mann’s production facilities are ISO 14001-certified.
For more information about sustainable development, see ‘Corpo-rate social responsibility’ or visit csr2016.hartmann-packaging.com.
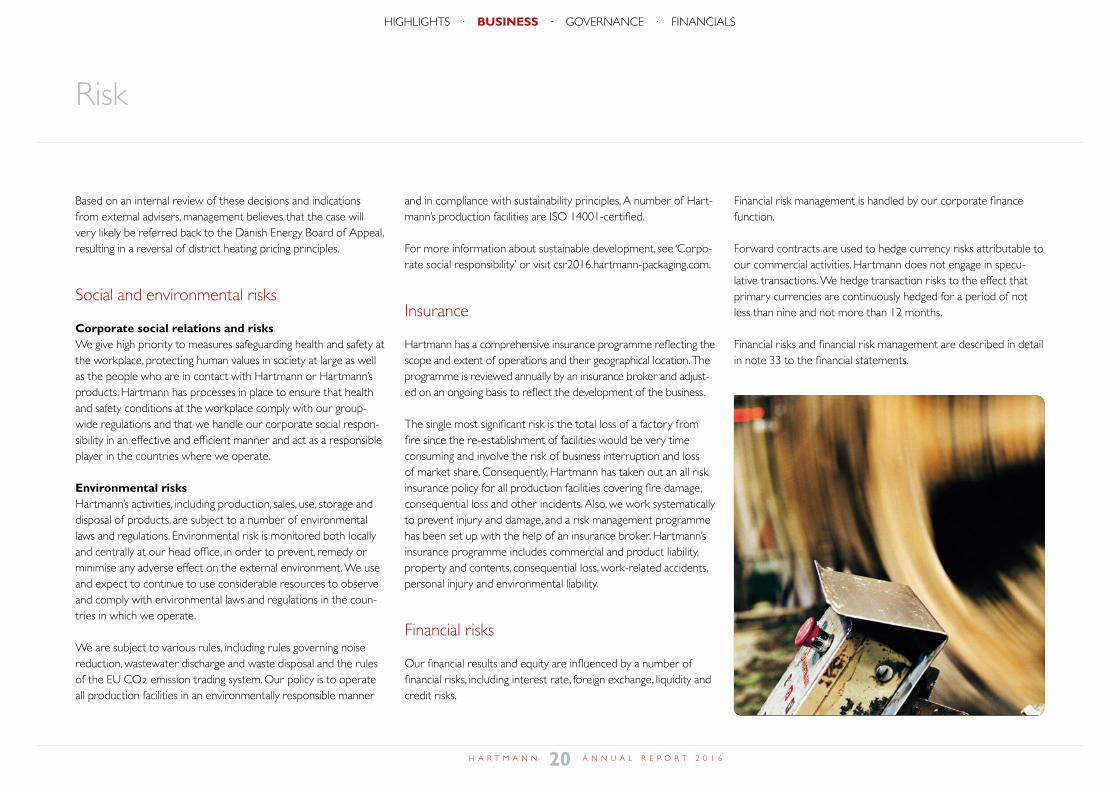
Insurance
Hartmann has a comprehensive insurance programme reflecting the scope and extent of operations and their geographical location. The programme is reviewed annually by an insurance broker and adjust-ed on an ongoing basis to reflect the development of the business.
The single most significant risk is the total loss of a factory from fire since the re-establishment of facilities would be very time consuming and involve the risk of business interruption and loss of market share. Consequently, Hartmann has taken out an all risk insurance policy for all production facilities covering fire damage, consequential loss and other incidents. Also, we work systematically to prevent injury and damage, and a risk management programme has been set up with the help of an insurance broker. Hartmann’s insurance programme includes commercial and product liability, property and contents, consequential loss, work-related accidents, personal injury and environmental liability.
Financial risks
Our financial results and equity are influenced by a number of financial risks, including interest rate, foreign exchange, liquidity and credit risks.
Financial risk management is handled by our corporate finance function.
Forward contracts are used to hedge currency risks attributable to our commercial activities. Hartmann does not engage in specu-lative transactions. We hedge transaction risks to the effect that primary currencies are continuously hedged for a period of not less than nine and not more than 12 months.
Financial risks and financial risk management are described in detail in note 33 to the financial statements.
20H A R T M A N N A N N U A L R E P O R T 2 0 1 6
HIGHLIGHTS · BUSINESS · GOVERNANCE · FINANCIALS
21H A R T M A N N A N N U A L R E P O R T 2 0 1 6
HIGHLIGHTS · BUSINESS · GOVERNANCE · FINANCIALSbusiness 1917-2017
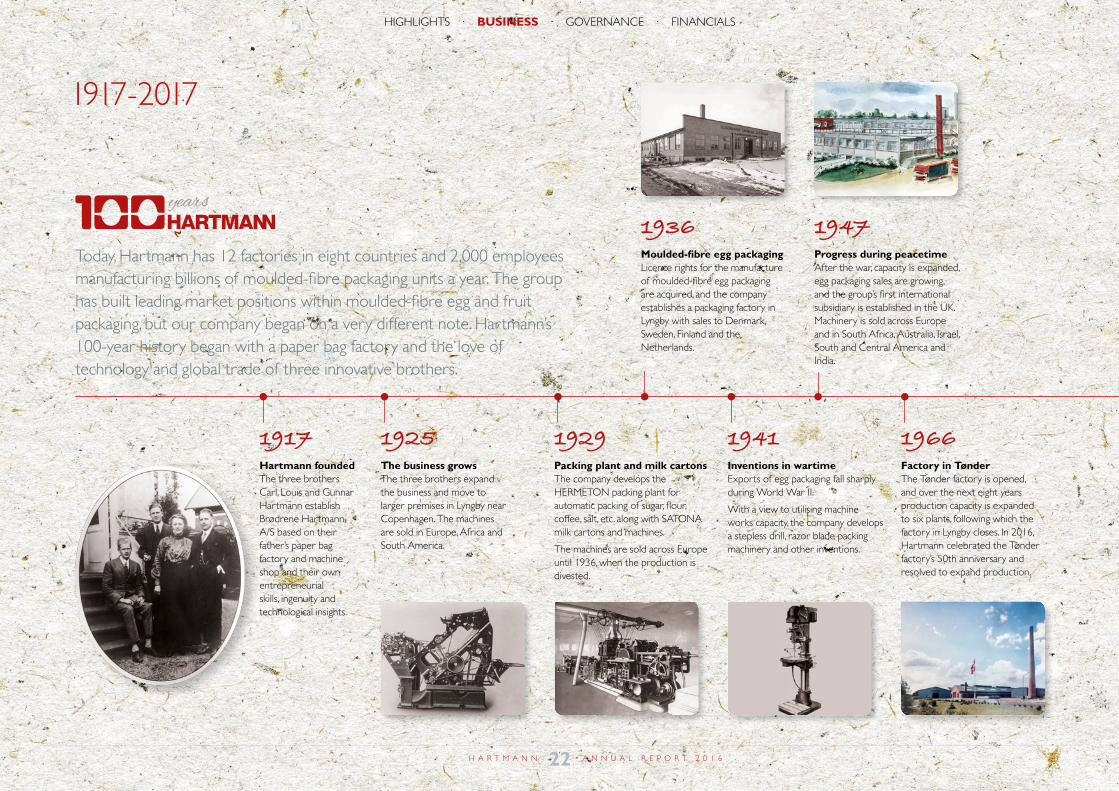
1917-2017
1917Hartmann foundedThe three brothers Carl, Louis and Gunnar Hartmann establish Brødrene Hartmann A/S based on their father’s paper bag factory and machine shop and their own entrepreneurial skills, ingenuity and technological insights.
1925The business growsThe three brothers expand the business and move to larger premises in Lyngby near Copenhagen. The machines are sold in Europe, Africa and South America.
1929Packing plant and milk cartonsThe company develops the HERMETON packing plant for automatic packing of sugar, flour, coffee, salt, etc. along with SATONA milk cartons and machines.
The machines are sold across Europe until 1936, when the production is divested.
1936Moulded-fibre egg packagingLicence rights for the manufacture of moulded-fibre egg packaging are acquired, and the company establishes a packaging factory in Lyngby with sales to Denmark, Sweden, Finland and the Netherlands.
1941Inventions in wartimeExports of egg packaging fall sharply during World War II.
With a view to utilising machine works capacity, the company develops a stepless drill, razor blade packing machinery and other inventions.
1947Progress during peacetimeAfter the war, capacity is expanded, egg packaging sales are growing, and the group’s first international subsidiary is established in the UK. Machinery is sold across Europe and in South Africa, Australia, Israel, South and Central America and India.
1966Factory in TønderThe Tønder factory is opened, and over the next eight years production capacity is expanded to six plants, following which the factory in Lyngby closes. In 2016, Hartmann celebrated the Tønder factory’s 50th anniversary and resolved to expand production.
Today, Hartmann has 12 factories in eight countries and 2,000 employees manufacturing billions of moulded-fibre packaging units a year. The group has built leading market positions within moulded-fibre egg and fruit packaging, but our company began on a very different note. Hartmann’s 100-year history began with a paper bag factory and the love of technology and global trade of three innovative brothers.
22H A R T M A N N A N N U A L R E P O R T 2 0 1 6
HIGHLIGHTS · BUSINESS · GOVERNANCE · FINANCIALS
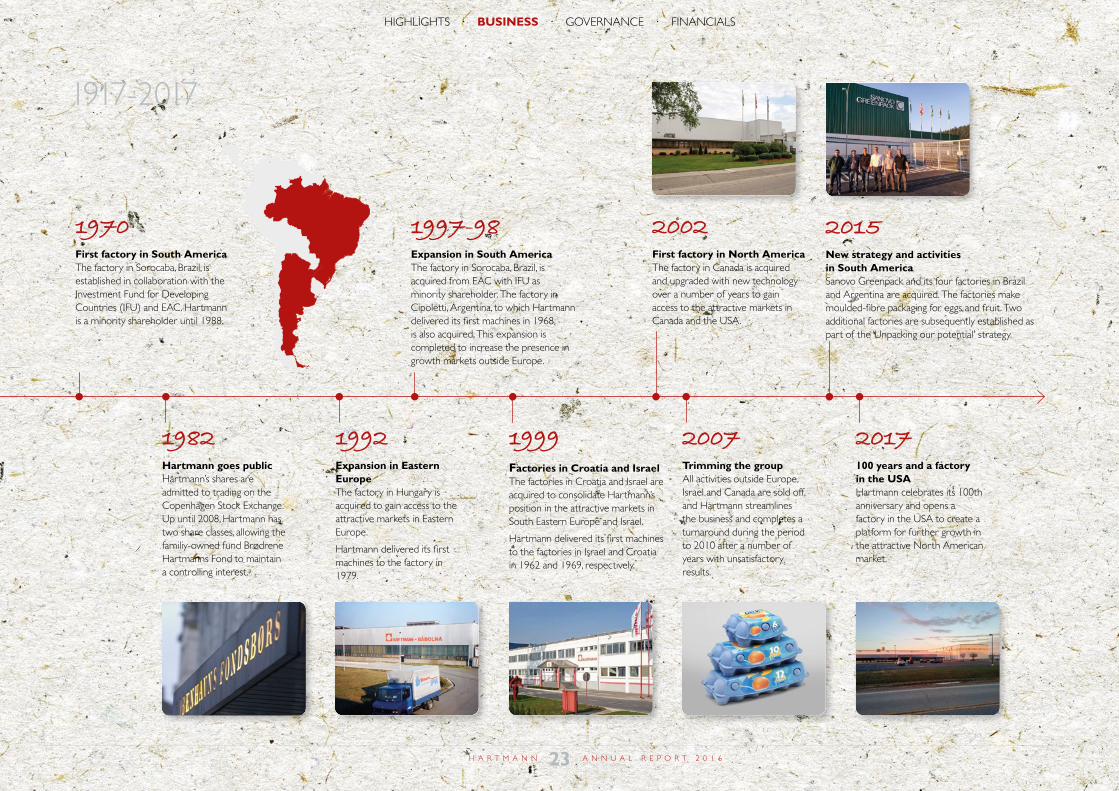
1917-2017
1970First factory in South AmericaThe factory in Sorocaba, Brazil, is established in collaboration with the Investment Fund for Developing Countries (IFU) and EAC. Hartmann is a minority shareholder until 1988.
1982Hartmann goes publicHartmann’s shares are admitted to trading on the Copenhagen Stock Exchange. Up until 2008, Hartmann has two share classes, allowing the familiy-owned fund Brødrene Hartmanns Fond to maintain a controlling interest.
1997-98Expansion in South AmericaThe factory in Sorocaba, Brazil, is acquired from EAC with IFU as minority shareholder. The factory in Cipoletti, Argentina, to which Hartmann delivered its first machines in 1968, is also acquired. This expansion is completed to increase the presence in growth markets outside Europe.
1999Factories in Croatia and IsraelThe factories in Croatia and Israel are acquired to consolidate Hartmann’s position in the attractive markets in South Eastern Europe and Israel.
Hartmann delivered its first machines to the factories in Israel and Croatia in 1962 and 1969, respectively.
2007Trimming the groupAll activities outside Europe, Israel and Canada are sold off, and Hartmann streamlines the business and completes a turnaround during the period to 2010 after a number of years with unsatisfactory results.
2017100 years and a factory in the USAHartmann celebrates its 100th anniversary and opens a factory in the USA to create a platform for further growth in the attractive North American market.
1992Expansion in Eastern EuropeThe factory in Hungary is acquired to gain access to the attractive markets in Eastern Europe.
Hartmann delivered its first machines to the factory in 1979.
2002First factory in North AmericaThe factory in Canada is acquired and upgraded with new technology over a number of years to gain access to the attractive markets in Canada and the USA.
2015New strategy and activities in South AmericaSanovo Greenpack and its four factories in Brazil and Argentina are acquired. The factories make moulded-fibre packaging for eggs and fruit. Two additional factories are subsequently established as part of the ‘Unpacking our potential’ strategy.
23H A R T M A N N A N N U A L R E P O R T 2 0 1 6
HIGHLIGHTS · BUSINESS · GOVERNANCE · FINANCIALS
Think ahead
Governance
25 Corporate social responsibility
26 Shareholder information
27 Corporate governance
28 Board of directors and executive board
24H A R T M A N N A N N U A L R E P O R T 2 0 1 6
HIGHLIGHTS · BUSINESS · GOVERNANCE · FINANCIALSmanagement indhold
0
25
50
75
100
125
2012 2013 2014 2015 2016 2017 2018 2019 2020
0
20
40
60
80
100
2015 2016
Our activities and achievements in relation to corporate social re-sponsibility are described in our Global Compact progress report for 2016, which is available at csr2016.hartmann-packaging.com in compliance with sections 99 a and 99 b of the Danish Financial Statements Act. Some of the CSR activities carried out in 2016 are described below.
Consumers and retail chains in mature markets increasingly emphasise the sustainability of packaging. Accordingly, our CSR activities form an integral part of our business model, and sustain-ability is a competitive advantage and an essential parameter in the marketing of many of our products.
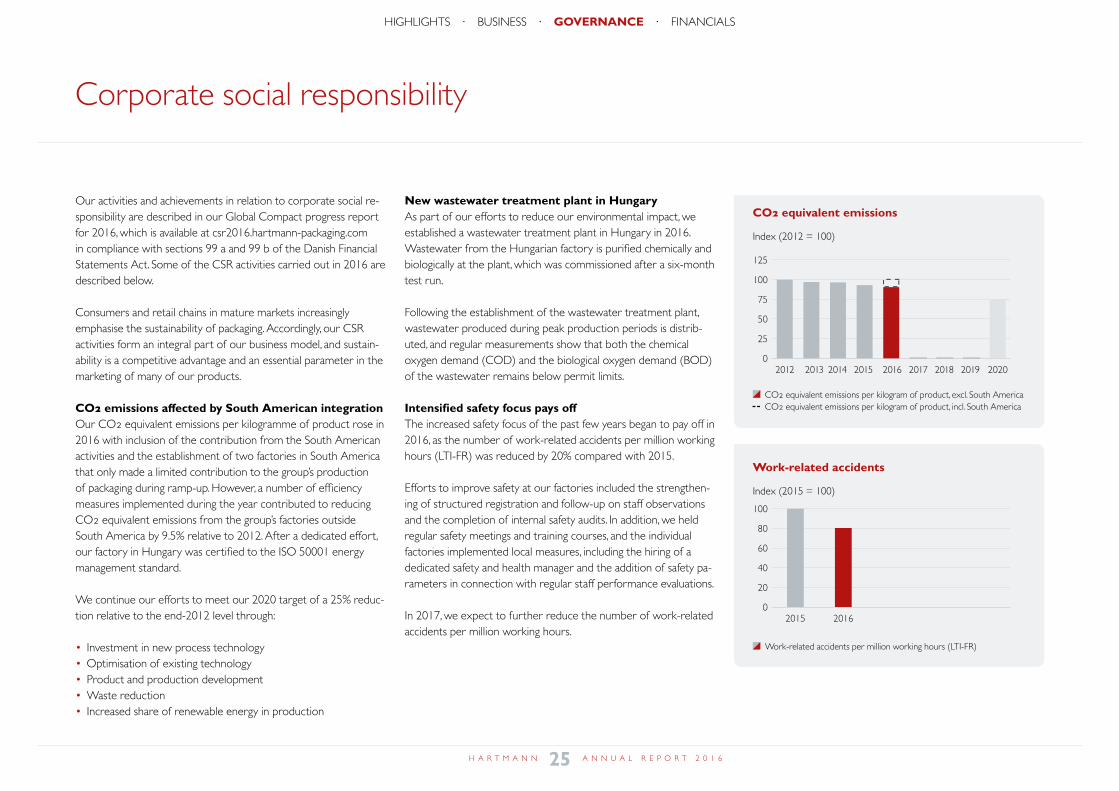
CO2 emissions affected by South American integrationOur CO2 equivalent emissions per kilogramme of product rose in 2016 with inclusion of the contribution from the South American activities and the establishment of two factories in South America that only made a limited contribution to the group’s production of packaging during ramp-up. However, a number of efficiency measures implemented during the year contributed to reducing CO2 equivalent emissions from the group’s factories outside South America by 9.5% relative to 2012. After a dedicated effort, our factory in Hungary was certified to the ISO 50001 energy management standard.
We continue our efforts to meet our 2020 target of a 25% reduc-tion relative to the end-2012 level through:
• Investment in new process technology • Optimisation of existing technology • Product and production development • Waste reduction • Increased share of renewable energy in production
New wastewater treatment plant in HungaryAs part of our efforts to reduce our environmental impact, we established a wastewater treatment plant in Hungary in 2016. Wastewater from the Hungarian factory is purified chemically and biologically at the plant, which was commissioned after a six-month test run.
Following the establishment of the wastewater treatment plant, wastewater produced during peak production periods is distrib-uted, and regular measurements show that both the chemical oxygen demand (COD) and the biological oxygen demand (BOD) of the wastewater remains below permit limits.
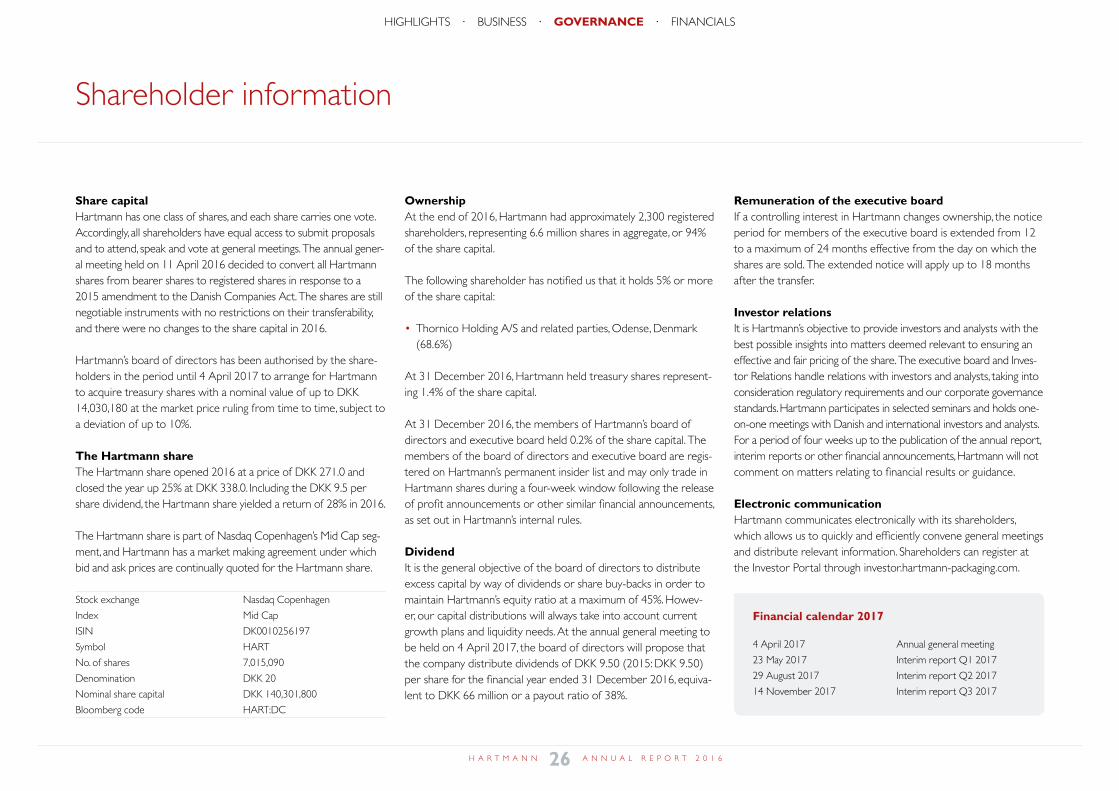
Intensified safety focus pays offThe increased safety focus of the past few years began to pay off in 2016, as the number of work-related accidents per million working hours (LTI-FR) was reduced by 20% compared with 2015.
Efforts to improve safety at our factories included the strengthen-ing of structured registration and follow-up on staff observations and the completion of internal safety audits. In addition, we held regular safety meetings and training courses, and the individual factories implemented local measures, including the hiring of a dedicated safety and health manager and the addition of safety pa-rameters in connection with regular staff performance evaluations.
In 2017, we expect to further reduce the number of work-related accidents per million working hours.
Corporate social responsibility
CO2 equivalent emissions per kilogram of product, excl. South America CO2 equivalent emissions per kilogram of product, incl. South America
Work-related accidents per million working hours (LTI-FR)
Work-related accidents
Index (2015 = 100)
CO2 equivalent emissions
Index (2012 = 100)
25H A R T M A N N A N N U A L R E P O R T 2 0 1 6
HIGHLIGHTS · BUSINESS · GOVERNANCE · FINANCIALSmanagement corporate social resp
Shareholder information
Share capitalHartmann has one class of shares, and each share carries one vote. Accordingly, all shareholders have equal access to submit proposals and to attend, speak and vote at general meetings. The annual gener-al meeting held on 11 April 2016 decided to convert all Hartmann shares from bearer shares to registered shares in response to a 2015 amendment to the Danish Companies Act. The shares are still negotiable instruments with no restrictions on their transferability, and there were no changes to the share capital in 2016.
Hartmann’s board of directors has been authorised by the share-holders in the period until 4 April 2017 to arrange for Hartmann to acquire treasury shares with a nominal value of up to DKK 14,030,180 at the market price ruling from time to time, subject to a deviation of up to 10%.
The Hartmann shareThe Hartmann share opened 2016 at a price of DKK 271.0 and closed the year up 25% at DKK 338.0. Including the DKK 9.5 per share dividend, the Hartmann share yielded a return of 28% in 2016.
The Hartmann share is part of Nasdaq Copenhagen’s Mid Cap seg-ment, and Hartmann has a market making agreement under which bid and ask prices are continually quoted for the Hartmann share.
Stock exchange Nasdaq Copenhagen
Index Mid Cap
ISIN DK0010256197
Symbol HART
No. of shares 7,015,090
Denomination DKK 20
Nominal share capital DKK 140,301,800
Bloomberg code HART:DC
OwnershipAt the end of 2016, Hartmann had approximately 2,300 registered shareholders, representing 6.6 million shares in aggregate, or 94% of the share capital.
The following shareholder has notified us that it holds 5% or more of the share capital:
• Thornico Holding A/S and related parties, Odense, Denmark (68.6%)
At 31 December 2016, Hartmann held treasury shares represent-ing 1.4% of the share capital.
At 31 December 2016, the members of Hartmann’s board of directors and executive board held 0.2% of the share capital. The members of the board of directors and executive board are regis-tered on Hartmann’s permanent insider list and may only trade in Hartmann shares during a four-week window following the release of profit announcements or other similar financial announcements, as set out in Hartmann’s internal rules.
DividendIt is the general objective of the board of directors to distribute excess capital by way of dividends or share buy-backs in order to maintain Hartmann’s equity ratio at a maximum of 45%. Howev-er, our capital distributions will always take into account current growth plans and liquidity needs. At the annual general meeting to be held on 4 April 2017, the board of directors will propose that the company distribute dividends of DKK 9.50 (2015: DKK 9.50) per share for the financial year ended 31 December 2016, equiva-lent to DKK 66 million or a payout ratio of 38%.
Financial calendar 2017
4 April 2017 Annual general meeting
23 May 2017 Interim report Q1 2017
29 August 2017 Interim report Q2 2017
14 November 2017 Interim report Q3 2017
Remuneration of the executive boardIf a controlling interest in Hartmann changes ownership, the notice period for members of the executive board is extended from 12 to a maximum of 24 months effective from the day on which the shares are sold. The extended notice will apply up to 18 months after the transfer.
Investor relationsIt is Hartmann’s objective to provide investors and analysts with the best possible insights into matters deemed relevant to ensuring an effective and fair pricing of the share. The executive board and Inves-tor Relations handle relations with investors and analysts, taking into consideration regulatory requirements and our corporate governance standards. Hartmann participates in selected seminars and holds one-on-one meetings with Danish and international investors and analysts. For a period of four weeks up to the publication of the annual report, interim reports or other financial announcements, Hartmann will not comment on matters relating to financial results or guidance.
Electronic communicationHartmann communicates electronically with its shareholders, which allows us to quickly and efficiently convene general meetings and distribute relevant information. Shareholders can register at the Investor Portal through investor.hartmann-packaging.com.
26H A R T M A N N A N N U A L R E P O R T 2 0 1 6
HIGHLIGHTS · BUSINESS · GOVERNANCE · FINANCIALSmanagement shareholder info
Corporate governance
Hartmann’s statutory report on corporate governance for the 2016 financial year (see section 107 b of the Danish Financial Statements Act) is available at corporategovernance2016.hart-mann-packaging.com.
This report contains a detailed account of Hartmann’s manage-ment structure as well as a description of the main elements of our internal controls and risk management systems relating to financial reporting.
The report furthermore describes our position on the recom-mendations of the Danish Committee on Corporate Govern-ance as implemented in Nasdaq Copenhagen’s Rules for issuers of shares. In 2016, we complied with the corporate governance recommendations except as stated below:
• The board of directors has not set up a nomination committee • The board of directors has not set up a remuneration commit-tee
Management structureHartmann operates a two-tier management structure comprising the board of directors and the executive board. The board of directors is elected by the shareholders and supervises the exec-utive board. The board of directors and the executive board are independent of each other.
The board of directors is responsible for the overall management of the company and resolves matters relating to strategic devel-opment, budgets, risk management, acquisitions and divestment as well as major development and investment projects.
In addition, the board of directors determines the executive board’s employment terms and salary, which consists of a fixed annual salary and a performance-related cash bonus. Hartmann’s remuneration policy is available at investor.hartmann-packaging.com, and the remuneration paid for 2016 is specified in note 9 to the financial statements.
The executive board is appointed by the board of directors and is responsible for the company’s day-to-day management, includ-ing operational development, results of operations and internal development. The executive board is responsible for executing the strategy and the general decisions approved by the board of directors.
The board of directors has set up an audit committee whose duties primarily comprise risk management, preparation of finan-cial statements, financial reporting and internal controls as well as monitoring and communicating with the auditor elected by the general meeting. The committee consists of two board members or more, and it convenes 4-5 times a year and reports regularly to the board of directors.
27H A R T M A N N A N N U A L R E P O R T 2 0 1 6
HIGHLIGHTS · BUSINESS · GOVERNANCE · FINANCIALSmanagement corporate gover
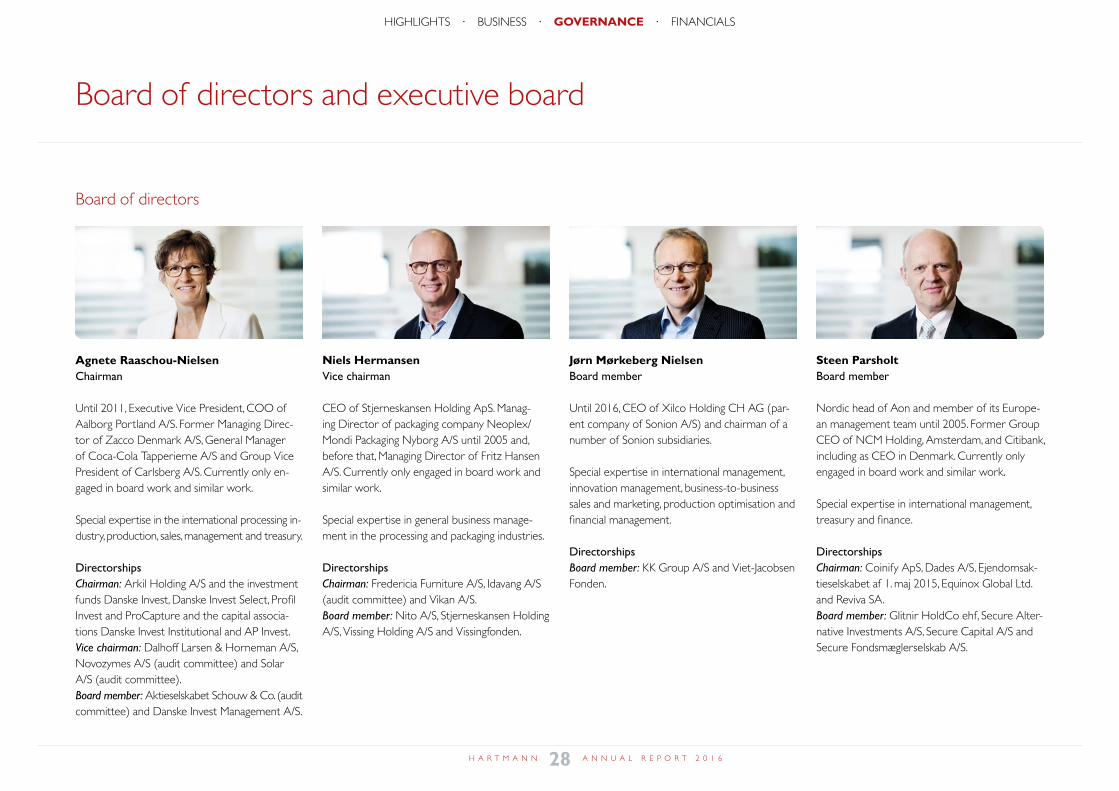
Agnete Raaschou-NielsenChairman
Until 2011, Executive Vice President, COO of Aalborg Portland A/S. Former Managing Direc-tor of Zacco Denmark A/S, General Manager of Coca-Cola Tapperierne A/S and Group Vice President of Carlsberg A/S. Currently only en-gaged in board work and similar work.
Special expertise in the international processing in-dustry, production, sales, management and treasury.
DirectorshipsChairman: Arkil Holding A/S and the investment funds Danske Invest, Danske Invest Select, Profil Invest and ProCapture and the capital associa-tions Danske Invest Institutional and AP Invest. Vice chairman: Dalhoff Larsen & Horneman A/S, Novozymes A/S (audit committee) and Solar A/S (audit committee). Board member: Aktieselskabet Schouw & Co. (audit committee) and Danske Invest Management A/S.
Niels HermansenVice chairman
CEO of Stjerneskansen Holding ApS. Manag-ing Director of packaging company Neoplex/Mondi Packaging Nyborg A/S until 2005 and, before that, Managing Director of Fritz Hansen A/S. Currently only engaged in board work and similar work.
Special expertise in general business manage-ment in the processing and packaging industries.
DirectorshipsChairman: Fredericia Furniture A/S, Idavang A/S (audit committee) and Vikan A/S. Board member: Nito A/S, Stjerneskansen Holding A/S, Vissing Holding A/S and Vissingfonden.
Jørn Mørkeberg NielsenBoard member
Until 2016, CEO of Xilco Holding CH AG (par-ent company of Sonion A/S) and chairman of a number of Sonion subsidiaries.
Special expertise in international management, innovation management, business-to-business sales and marketing, production optimisation and financial management.
DirectorshipsBoard member: KK Group A/S and Viet-Jacobsen Fonden.
Steen ParsholtBoard member
Nordic head of Aon and member of its Europe-an management team until 2005. Former Group CEO of NCM Holding, Amsterdam, and Citibank, including as CEO in Denmark. Currently only engaged in board work and similar work.
Special expertise in international management, treasury and finance.
DirectorshipsChairman: Coinify ApS, Dades A/S, Ejendomsak-tieselskabet af 1. maj 2015, Equinox Global Ltd. and Reviva SA. Board member: Glitnir HoldCo ehf, Secure Alter-native Investments A/S, Secure Capital A/S and Secure Fondsmæglerselskab A/S.
Board of directors and executive board
Board of directors
28H A R T M A N N A N N U A L R E P O R T 2 0 1 6
HIGHLIGHTS · BUSINESS · GOVERNANCE · FINANCIALSmanagement board of direct
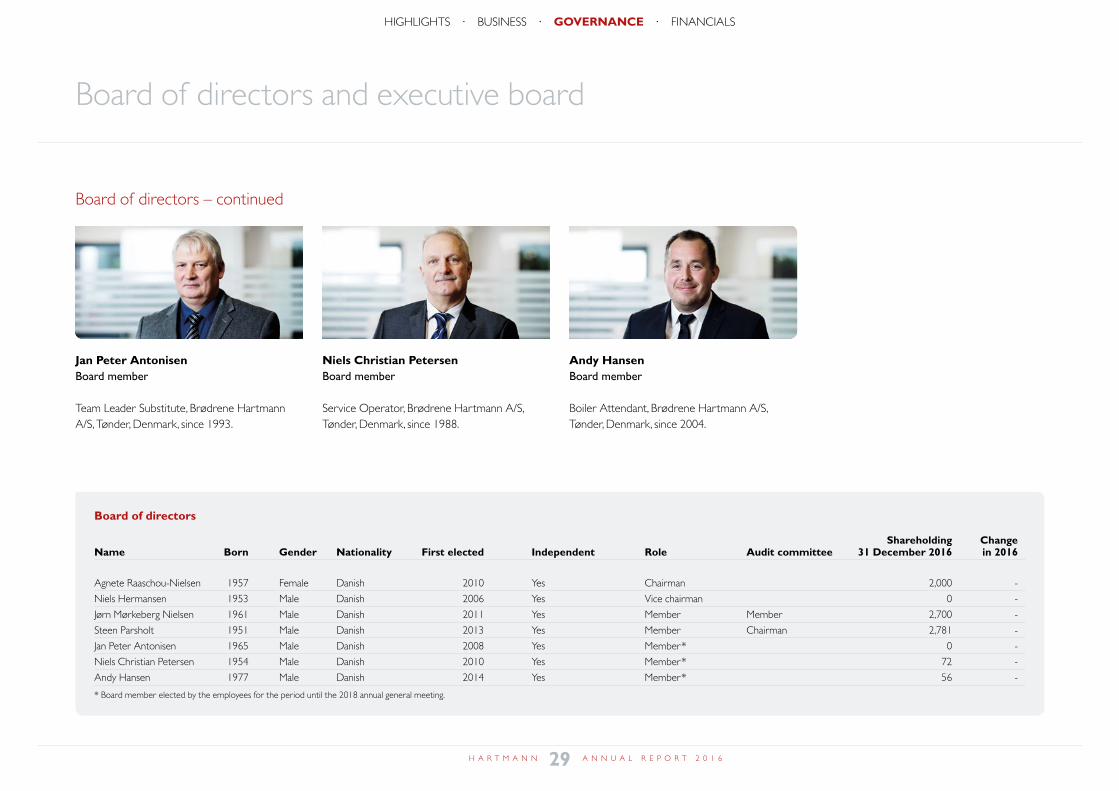
Jan Peter AntonisenBoard member
Team Leader Substitute, Brødrene Hartmann A/S, Tønder, Denmark, since 1993.
Andy HansenBoard member
Boiler Attendant, Brødrene Hartmann A/S, Tønder, Denmark, since 2004.
Niels Christian PetersenBoard member
Service Operator, Brødrene Hartmann A/S, Tønder, Denmark, since 1988.
Board of directors Shareholding Change Name Born Gender Nationality First elected Independent Role Audit committee 31 December 2016 in 2016
Agnete Raaschou-Nielsen 1957 Female Danish 2010 Yes Chairman 2,000 -
Niels Hermansen 1953 Male Danish 2006 Yes Vice chairman 0 -
Jørn Mørkeberg Nielsen 1961 Male Danish 2011 Yes Member Member 2,700 -
Steen Parsholt 1951 Male Danish 2013 Yes Member Chairman 2,781 -
Jan Peter Antonisen 1965 Male Danish 2008 Yes Member* 0 -
Niels Christian Petersen 1954 Male Danish 2010 Yes Member* 72 -
Andy Hansen 1977 Male Danish 2014 Yes Member* 56 -
* Board member elected by the employees for the period until the 2018 annual general meeting.
Board of directors and executive board
Board of directors – continued
29H A R T M A N N A N N U A L R E P O R T 2 0 1 6
HIGHLIGHTS · BUSINESS · GOVERNANCE · FINANCIALS
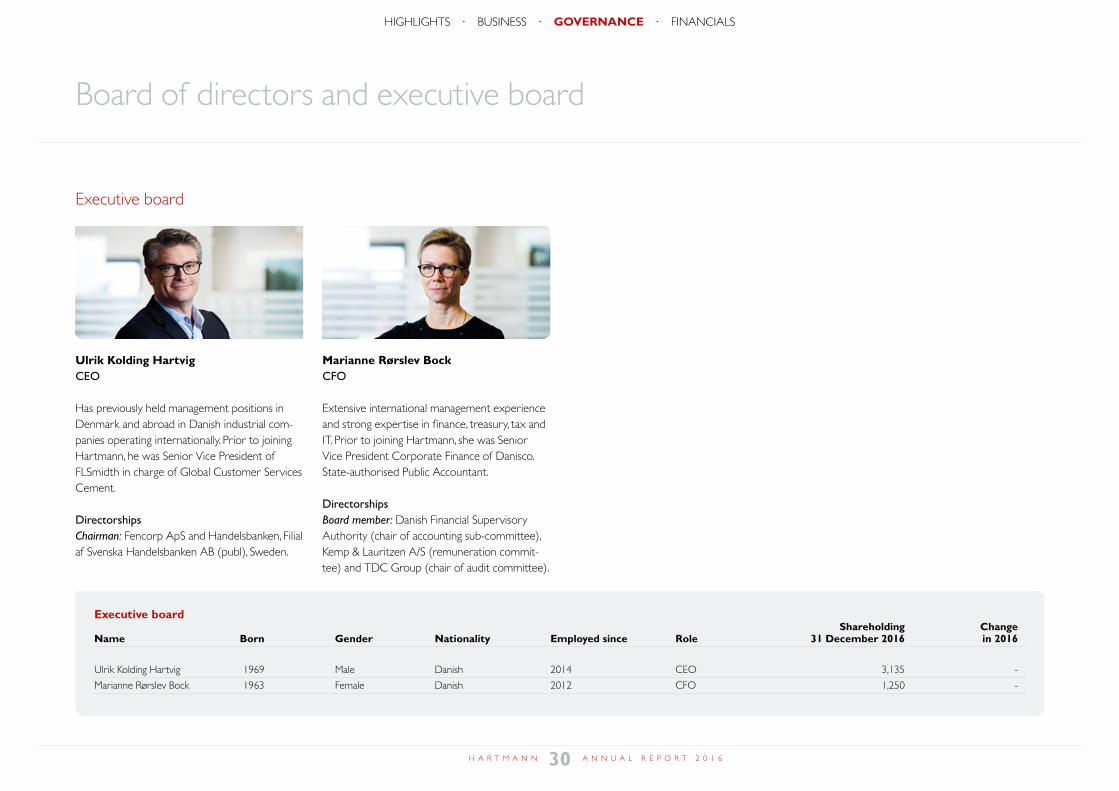
Executive board Shareholding Change Name Born Gender Nationality Employed since Role 31 December 2016 in 2016
Ulrik Kolding Hartvig 1969 Male Danish 2014 CEO 3,135 -
Marianne Rørslev Bock 1963 Female Danish 2012 CFO 1,250 -
Ulrik Kolding HartvigCEO
Has previously held management positions in Denmark and abroad in Danish industrial com-panies operating internationally. Prior to joining Hartmann, he was Senior Vice President of FLSmidth in charge of Global Customer Services Cement.
DirectorshipsChairman: Fencorp ApS and Handelsbanken, Filial af Svenska Handelsbanken AB (publ), Sweden.
Marianne Rørslev BockCFO
Extensive international management experience and strong expertise in finance, treasury, tax and IT. Prior to joining Hartmann, she was Senior Vice President Corporate Finance of Danisco. State-authorised Public Accountant.
DirectorshipsBoard member: Danish Financial Supervisory Authority (chair of accounting sub-committee), Kemp & Lauritzen A/S (remuneration commit-tee) and TDC Group (chair of audit committee).
Board of directors and executive board
Executive board
30H A R T M A N N A N N U A L R E P O R T 2 0 1 6
HIGHLIGHTS · BUSINESS · GOVERNANCE · FINANCIALS
Think performance
Financials
32 Statement of comprehensive income
33 Statement of cash flows
34 Balance sheet
35 Statement of changes in equity
37 Notes
80 Management statement
81 Independent auditor’s report
31H A R T M A N N A N N U A L R E P O R T 2 0 1 6
HIGHLIGHTS · BUSINESS · GOVERNANCE · FINANCIALSregnskab indhold
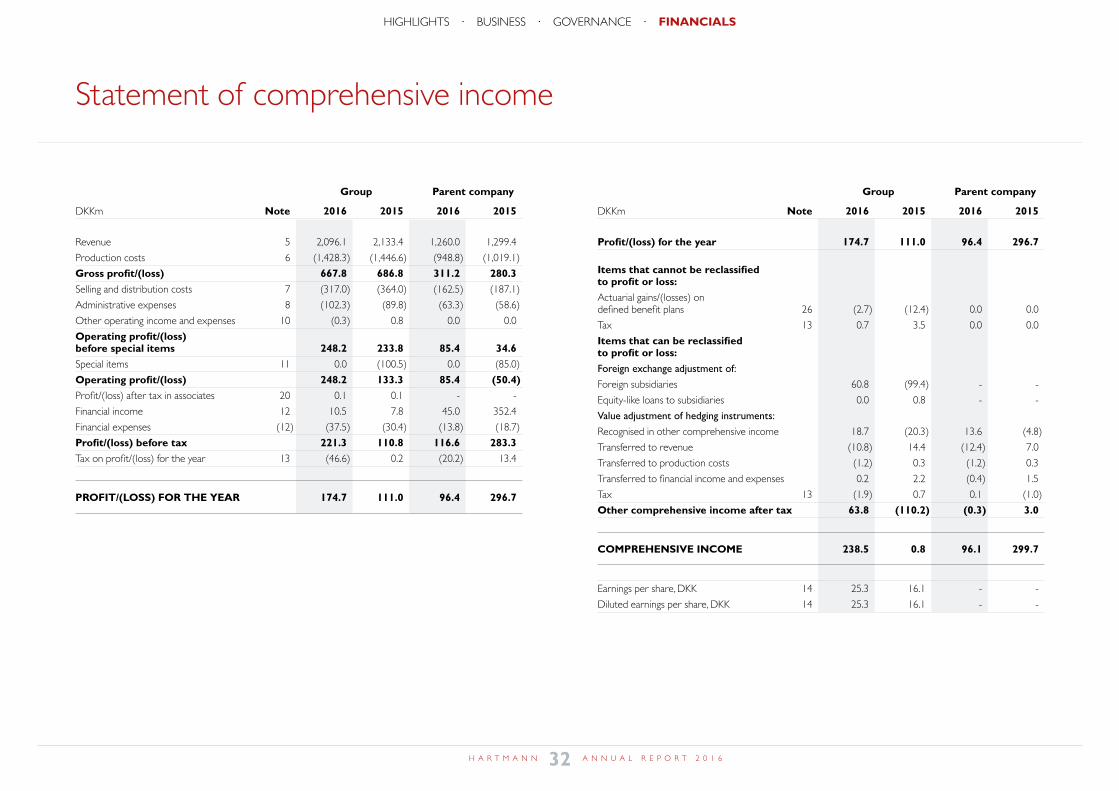
Statement of comprehensive income
Group Parent company
DKKm Note 2016 2015 2016 2015
Revenue 5 2,096.1 2,133.4 1,260.0 1,299.4
Production costs 6 (1,428.3) (1,446.6) (948.8) (1,019.1)
Gross profit/(loss) 667.8 686.8 311.2 280.3Selling and distribution costs 7 (317.0) (364.0) (162.5) (187.1)
Administrative expenses 8 (102.3) (89.8) (63.3) (58.6)
Other operating income and expenses 10 (0.3) 0.8 0.0 0.0
Operating profit/(loss) before special items 248.2 233.8 85.4 34.6Special items 11 0.0 (100.5) 0.0 (85.0)
Operating profit/(loss) 248.2 133.3 85.4 (50.4)Profit/(loss) after tax in associates 20 0.1 0.1 - -
Financial income 12 10.5 7.8 45.0 352.4
Financial expenses (12) (37.5) (30.4) (13.8) (18.7)
Profit/(loss) before tax 221.3 110.8 116.6 283.3Tax on profit/(loss) for the year 13 (46.6) 0.2 (20.2) 13.4
PROFIT/(LOSS) FOR THE YEAR 174.7 111.0 96.4 296.7
Group Parent company
DKKm Note 2016 2015 2016 2015
Profit/(loss) for the year 174.7 111.0 96.4 296.7 Items that cannot be reclassified to profit or loss:Actuarial gains/(losses) on defined benefit plans 26 (2.7) (12.4) 0.0 0.0
Tax 13 0.7 3.5 0.0 0.0
Items that can be reclassified to profit or loss:Foreign exchange adjustment of:
Foreign subsidiaries 60.8 (99.4) - -
Equity-like loans to subsidiaries 0.0 0.8 - -
Value adjustment of hedging instruments:
Recognised in other comprehensive income 18.7 (20.3) 13.6 (4.8)
Transferred to revenue (10.8) 14.4 (12.4) 7.0
Transferred to production costs (1.2) 0.3 (1.2) 0.3
Transferred to financial income and expenses 0.2 2.2 (0.4) 1.5
Tax 13 (1.9) 0.7 0.1 (1.0)
Other comprehensive income after tax 63.8 (110.2) (0.3) 3.0
COMPREHENSIVE INCOME 238.5 0.8 96.1 299.7
Earnings per share, DKK 14 25.3 16.1 - -
Diluted earnings per share, DKK 14 25.3 16.1 - -
32H A R T M A N N A N N U A L R E P O R T 2 0 1 6
HIGHLIGHTS · BUSINESS · GOVERNANCE · FINANCIALSregnskab comprehensive
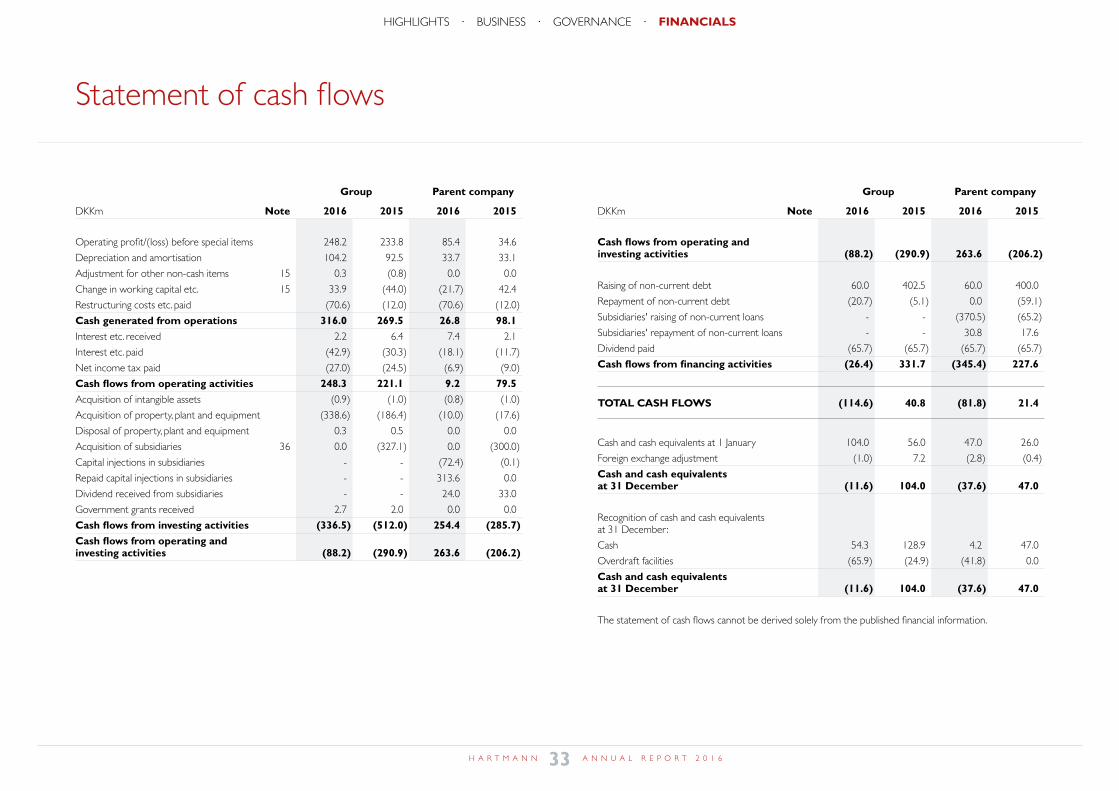
Statement of cash flows
Group Parent company
DKKm Note 2016 2015 2016 2015
Operating profit/(loss) before special items 248.2 233.8 85.4 34.6
Depreciation and amortisation 104.2 92.5 33.7 33.1
Adjustment for other non-cash items 15 0.3 (0.8) 0.0 0.0
Change in working capital etc. 15 33.9 (44.0) (21.7) 42.4
Restructuring costs etc. paid (70.6) (12.0) (70.6) (12.0)
Cash generated from operations 316.0 269.5 26.8 98.1Interest etc. received 2.2 6.4 7.4 2.1
Interest etc. paid (42.9) (30.3) (18.1) (11.7)
Net income tax paid (27.0) (24.5) (6.9) (9.0)
Cash flows from operating activities 248.3 221.1 9.2 79.5Acquisition of intangible assets (0.9) (1.0) (0.8) (1.0)
Acquisition of property, plant and equipment (338.6) (186.4) (10.0) (17.6)
Disposal of property, plant and equipment 0.3 0.5 0.0 0.0
Acquisition of subsidiaries 36 0.0 (327.1) 0.0 (300.0)
Capital injections in subsidiaries - - (72.4) (0.1)
Repaid capital injections in subsidiaries - - 313.6 0.0
Dividend received from subsidiaries - - 24.0 33.0
Government grants received 2.7 2.0 0.0 0.0
Cash flows from investing activities (336.5) (512.0) 254.4 (285.7)Cash flows from operating and investing activities (88.2) (290.9) 263.6 (206.2)
Group Parent company
DKKm Note 2016 2015 2016 2015
Cash flows from operating and investing activities (88.2) (290.9) 263.6 (206.2)
Raising of non-current debt 60.0 402.5 60.0 400.0
Repayment of non-current debt (20.7) (5.1) 0.0 (59.1)
Subsidiaries' raising of non-current loans - - (370.5) (65.2)
Subsidiaries' repayment of non-current loans - - 30.8 17.6
Dividend paid (65.7) (65.7) (65.7) (65.7)
Cash flows from financing activities (26.4) 331.7 (345.4) 227.6
TOTAL CASH FLOWS (114.6) 40.8 (81.8) 21.4
Cash and cash equivalents at 1 January 104.0 56.0 47.0 26.0
Foreign exchange adjustment (1.0) 7.2 (2.8) (0.4)
Cash and cash equivalents at 31 December (11.6) 104.0 (37.6) 47.0
Recognition of cash and cash equivalents at 31 December:
Cash 54.3 128.9 4.2 47.0
Overdraft facilities (65.9) (24.9) (41.8) 0.0
Cash and cash equivalents at 31 December (11.6) 104.0 (37.6) 47.0
The statement of cash flows cannot be derived solely from the published financial information.
33H A R T M A N N A N N U A L R E P O R T 2 0 1 6
HIGHLIGHTS · BUSINESS · GOVERNANCE · FINANCIALSregnskab cash flows
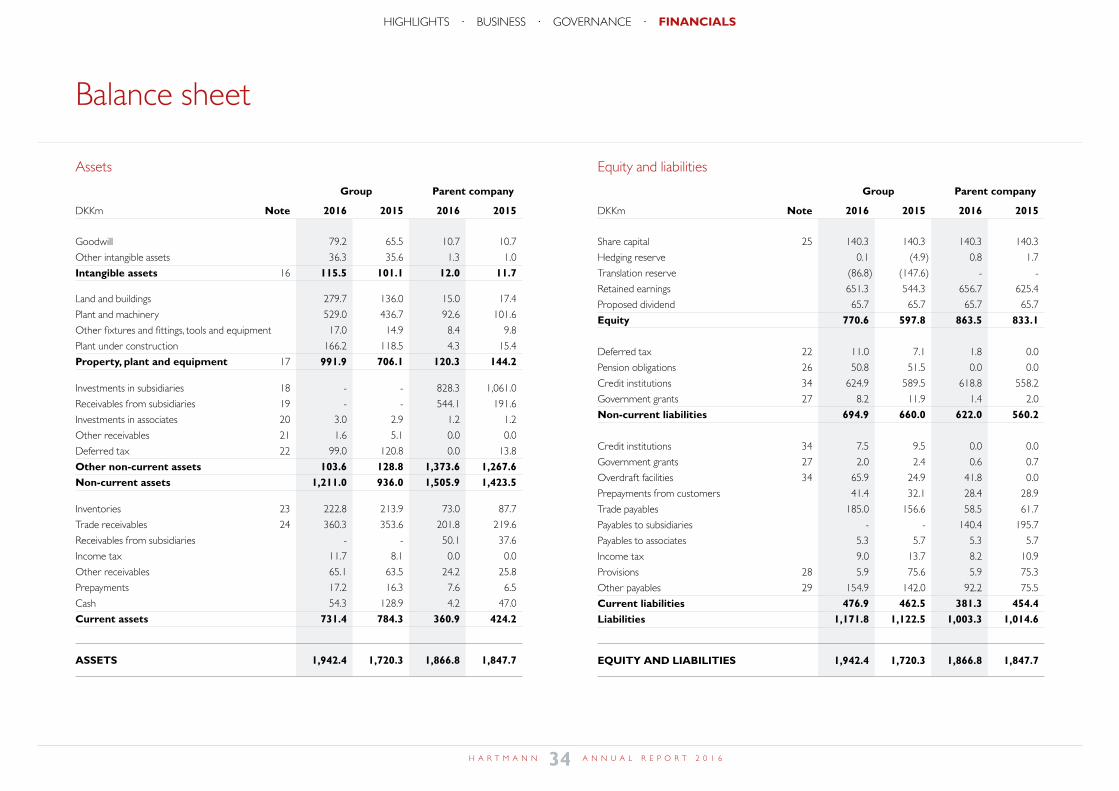
Balance sheet
Assets
Group Parent company
DKKm Note 2016 2015 2016 2015
Goodwill 79.2 65.5 10.7 10.7
Other intangible assets 36.3 35.6 1.3 1.0
Intangible assets 16 115.5 101.1 12.0 11.7 Land and buildings 279.7 136.0 15.0 17.4
Plant and machinery 529.0 436.7 92.6 101.6
Other fixtures and fittings, tools and equipment 17.0 14.9 8.4 9.8
Plant under construction 166.2 118.5 4.3 15.4
Property, plant and equipment 17 991.9 706.1 120.3 144.2 Investments in subsidiaries 18 - - 828.3 1,061.0
Receivables from subsidiaries 19 - - 544.1 191.6
Investments in associates 20 3.0 2.9 1.2 1.2
Other receivables 21 1.6 5.1 0.0 0.0
Deferred tax 22 99.0 120.8 0.0 13.8
Other non-current assets 103.6 128.8 1,373.6 1,267.6Non-current assets 1,211.0 936.0 1,505.9 1,423.5 Inventories 23 222.8 213.9 73.0 87.7
Trade receivables 24 360.3 353.6 201.8 219.6
Receivables from subsidiaries - - 50.1 37.6
Income tax 11.7 8.1 0.0 0.0
Other receivables 65.1 63.5 24.2 25.8
Prepayments 17.2 16.3 7.6 6.5
Cash 54.3 128.9 4.2 47.0
Current assets 731.4 784.3 360.9 424.2
ASSETS 1,942.4 1,720.3 1,866.8 1,847.7
Equity and liabilities
Group Parent company
DKKm Note 2016 2015 2016 2015
Share capital 25 140.3 140.3 140.3 140.3
Hedging reserve 0.1 (4.9) 0.8 1.7
Translation reserve (86.8) (147.6) - -
Retained earnings 651.3 544.3 656.7 625.4
Proposed dividend 65.7 65.7 65.7 65.7
Equity 770.6 597.8 863.5 833.1
Deferred tax 22 11.0 7.1 1.8 0.0
Pension obligations 26 50.8 51.5 0.0 0.0
Credit institutions 34 624.9 589.5 618.8 558.2
Government grants 27 8.2 11.9 1.4 2.0
Non-current liabilities 694.9 660.0 622.0 560.2
Credit institutions 34 7.5 9.5 0.0 0.0
Government grants 27 2.0 2.4 0.6 0.7
Overdraft facilities 34 65.9 24.9 41.8 0.0
Prepayments from customers 41.4 32.1 28.4 28.9
Trade payables 185.0 156.6 58.5 61.7
Payables to subsidiaries - - 140.4 195.7
Payables to associates 5.3 5.7 5.3 5.7
Income tax 9.0 13.7 8.2 10.9
Provisions 28 5.9 75.6 5.9 75.3
Other payables 29 154.9 142.0 92.2 75.5
Current liabilities 476.9 462.5 381.3 454.4Liabilities 1,171.8 1,122.5 1,003.3 1,014.6
EQUITY AND LIABILITIES 1,942.4 1,720.3 1,866.8 1,847.7
34H A R T M A N N A N N U A L R E P O R T 2 0 1 6
HIGHLIGHTS · BUSINESS · GOVERNANCE · FINANCIALSregnskab balance
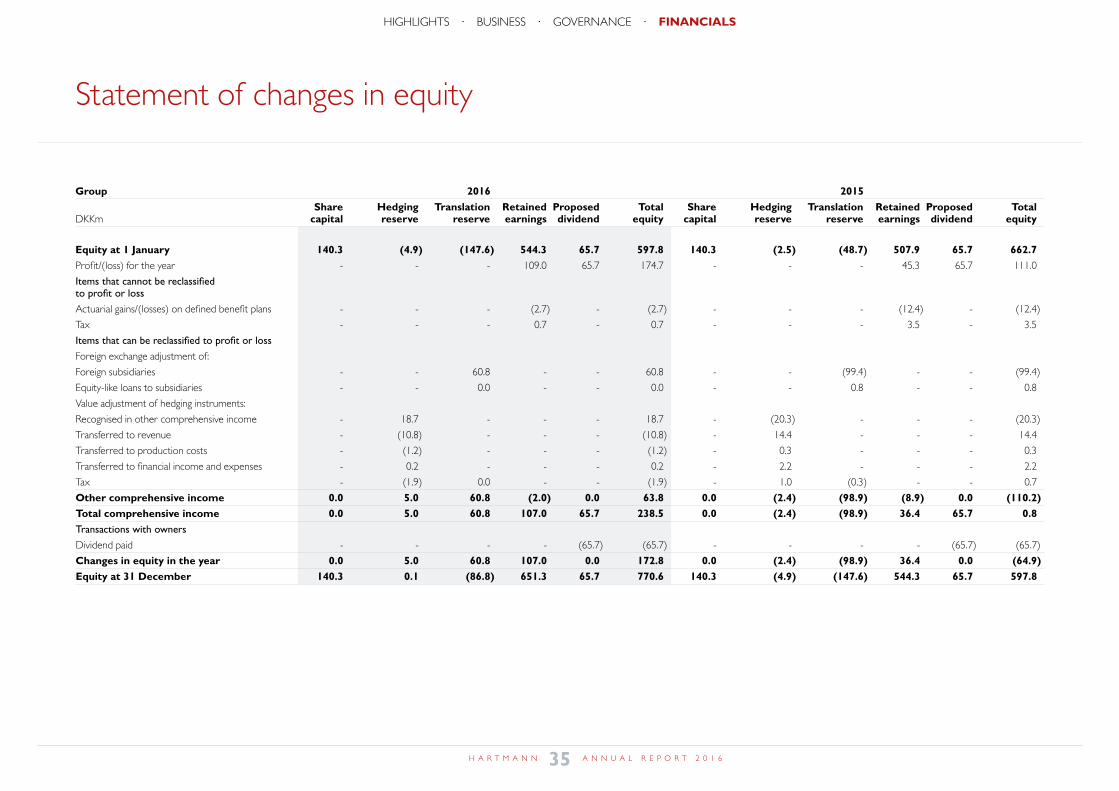
Statement of changes in equity
Group 2016 2015 Share Hedging Translation Retained Proposed Total Share Hedging Translation Retained Proposed Total DKKm capital reserve reserve earnings dividend equity capital reserve reserve earnings dividend equity
Equity at 1 January 140.3 (4.9) (147.6) 544.3 65.7 597.8 140.3 (2.5) (48.7) 507.9 65.7 662.7Profit/(loss) for the year - - - 109.0 65.7 174.7 - - - 45.3 65.7 111.0
Items that cannot be reclassified to profit or loss
Actuarial gains/(losses) on defined benefit plans - - - (2.7) - (2.7) - - - (12.4) - (12.4)
Tax - - - 0.7 - 0.7 - - - 3.5 - 3.5
Items that can be reclassified to profit or loss
Foreign exchange adjustment of:
Foreign subsidiaries - - 60.8 - - 60.8 - - (99.4) - - (99.4)
Equity-like loans to subsidiaries - - 0.0 - - 0.0 - - 0.8 - - 0.8
Value adjustment of hedging instruments:
Recognised in other comprehensive income - 18.7 - - - 18.7 - (20.3) - - - (20.3)
Transferred to revenue - (10.8) - - - (10.8) - 14.4 - - - 14.4
Transferred to production costs - (1.2) - - - (1.2) - 0.3 - - - 0.3
Transferred to financial income and expenses - 0.2 - - - 0.2 - 2.2 - - - 2.2
Tax - (1.9) 0.0 - - (1.9) - 1.0 (0.3) - - 0.7
Other comprehensive income 0.0 5.0 60.8 (2.0) 0.0 63.8 0.0 (2.4) (98.9) (8.9) 0.0 (110.2)Total comprehensive income 0.0 5.0 60.8 107.0 65.7 238.5 0.0 (2.4) (98.9) 36.4 65.7 0.8Transactions with owners
Dividend paid - - - - (65.7) (65.7) - - - - (65.7) (65.7)
Changes in equity in the year 0.0 5.0 60.8 107.0 0.0 172.8 0.0 (2.4) (98.9) 36.4 0.0 (64.9)Equity at 31 December 140.3 0.1 (86.8) 651.3 65.7 770.6 140.3 (4.9) (147.6) 544.3 65.7 597.8
35H A R T M A N N A N N U A L R E P O R T 2 0 1 6
HIGHLIGHTS · BUSINESS · GOVERNANCE · FINANCIALSregnskab change equity
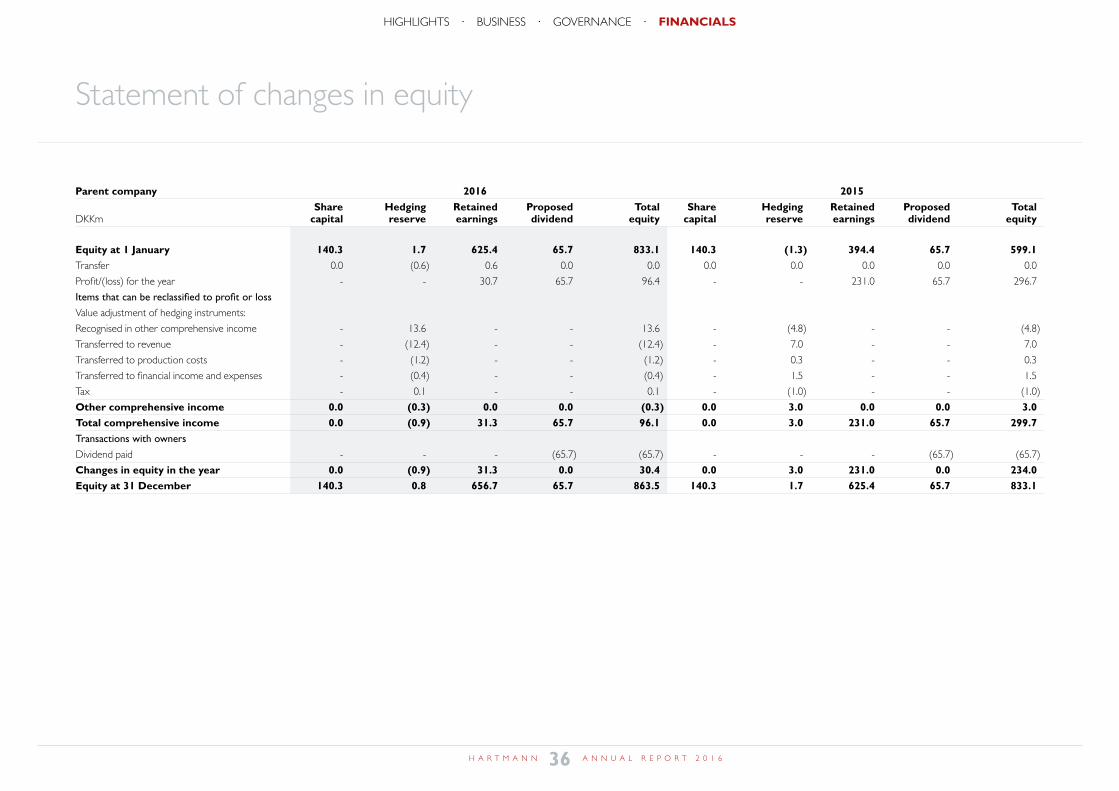
Statement of changes in equity
Parent company 2016 2015 Share Hedging Retained Proposed Total Share Hedging Retained Proposed Total DKKm capital reserve earnings dividend equity capital reserve earnings dividend equity
Equity at 1 January 140.3 1.7 625.4 65.7 833.1 140.3 (1.3) 394.4 65.7 599.1Transfer 0.0 (0.6) 0.6 0.0 0.0 0.0 0.0 0.0 0.0 0.0
Profit/(loss) for the year - - 30.7 65.7 96.4 - - 231.0 65.7 296.7
Items that can be reclassified to profit or loss
Value adjustment of hedging instruments:
Recognised in other comprehensive income - 13.6 - - 13.6 - (4.8) - - (4.8)
Transferred to revenue - (12.4) - - (12.4) - 7.0 - - 7.0
Transferred to production costs - (1.2) - - (1.2) - 0.3 - - 0.3
Transferred to financial income and expenses - (0.4) - - (0.4) - 1.5 - - 1.5
Tax - 0.1 - - 0.1 - (1.0) - - (1.0)
Other comprehensive income 0.0 (0.3) 0.0 0.0 (0.3) 0.0 3.0 0.0 0.0 3.0Total comprehensive income 0.0 (0.9) 31.3 65.7 96.1 0.0 3.0 231.0 65.7 299.7Transactions with owners
Dividend paid - - - (65.7) (65.7) - - - (65.7) (65.7)
Changes in equity in the year 0.0 (0.9) 31.3 0.0 30.4 0.0 3.0 231.0 0.0 234.0Equity at 31 December 140.3 0.8 656.7 65.7 863.5 140.3 1.7 625.4 65.7 833.1
36H A R T M A N N A N N U A L R E P O R T 2 0 1 6
HIGHLIGHTS · BUSINESS · GOVERNANCE · FINANCIALS
Notes
General
38 Note 01 Accounting policies
40 Note 02 Accounting regulations
40 Note 03 Significant accounting estimates and judgments
41 Note 04 Segment information
Statement of comprehensive income
43 Note 05 Revenue
43 Note 06 Production costs
44 Note 07 Selling and distribution costs
44 Note 08 Administrative expenses
44 Note 09 Staff costs
46 Note 10 Other operating income and expenses
46 Note 11 Special items
47 Note 12 Financial income and expenses
48 Note 13 Tax on profit/loss for the year
49 Note 14 Earnings per share
Statement of cash flows
49 Note 15 Cash flows
Balance sheet
49 Note 16 Intangible assets
52 Note 17 Property, plant and equipment
54 Note 18 Investments in subsidiaries
55 Note 19 Receivables from subsidiaries
55 Note 20 Investments in associates
56 Note 21 Other receivables
57 Note 22 Deferred tax
60 Note 23 Inventories
60 Note 24 Trade receivables
61 Note 25 Share capital
62 Note 26 Pension obligations
65 Note 27 Government grants
65 Note 28 Provisions
66 Note 29 Other payables
Other
66 Note 30 Fees to shareholder-appointed auditor
66 Note 31 Collateral and contingent liabilities
67 Note 32 Operating leases
67 Note 33 Financial risks
70 Note 34 Financial instruments
77 Note 35 Related parties
77 Note 36 Acquisitions
79 Note 37 Events after the balance sheet date
37H A R T M A N N A N N U A L R E P O R T 2 0 1 6
HIGHLIGHTS · BUSINESS · GOVERNANCE · FINANCIALSregnskab noter
Notes
01 Accounting policies
Basis of preparationThe consolidated financial statements and the parent company financial statements for the year ended 31 December 2016 of the group and Brødrene Hartmann A/S, respectively, have been prepared in accordance with International Financial Reporting Standards as adopted by the EU and additional disclosure requirements in the Danish Financial Statements Act. Brødrene Hartmann A/S is a limited liability company and has its registered office in Denmark.
The consolidated financial statements and the parent company financial statements are presented in Danish kroner (DKK), which is the presenta-tion currency used for the group’s operations and the functional currency of the parent company.
The consolidated financial statements and the parent company financial statements are prepared on the basis of the historical cost convention, with the exception of derivative financial instruments, which are measured at fair value.
The accounting policies have been applied consistently in the financial year and to comparative figures.
Consolidated financial statementsThe consolidated financial statements comprise the parent company, Brødrene Hartmann A/S, and entities in which the parent company directly or indirectly holds the majority of voting rights or which the parent company in some other way controls (subsidiaries). Entities in which the group holds between 20% and 50% of the voting rights and over which it exercises significant influence, but which it does not control, are considered associates. The consolidated financial statements are prepared on the basis of the financial statements of the parent company and the subsidiaries by combining like items. The financial statements used for the annual report of the group have been prepared in accordance with the group’s accounting policies. On consolidation, intra-group income and expenses, sharehold-ings, dividends, balances, and realised and unrealised gains and losses on intra-group transactions are eliminated. The parent company’s investments in the consolidated subsidiaries are set off against the parent company’s share of the subsidiaries’ fair value of identified net assets determined at the date of consolidation.
Foreign currency translationA functional currency is designated for each of the reporting entities in the group. The functional currency is the currency used in the primary economic environment in which the reporting entity operates. Transactions denominated in currencies other than the functional currency are transac-tions in foreign currency. On initial recognition, transactions denominated in foreign currency are translated into the functional currency at the exchange rate at the transaction date. Gains and losses arising between the rate at the transaction date and the rate at the date of payment are recognised in the statement of comprehensive income under financial income and expenses, net. Receivables, payables and other monetary items denominated in foreign currency are translated into the functional currency at the exchange rate at the balance sheet date. Differences between the rate at the balance sheet date and the rate at the transaction date or the exchange rate stated in the latest annual report are recognised in the statement of comprehensive income under financial income and expenses, net. On recognition of foreign subsidiaries and associates with functional currencies other than DKK, comprehensive income statement items are translated at the rate at the transaction date, and balance sheet items including goodwill are translated at the rate at the balance sheet date. The rate at the transaction date is calculated as the average rate of the individual months.
Foreign exchange differences arising on the translation of opening equity of these entities at the rate at the balance sheet date and on the translation of comprehensive income statement items from average rates to the rate at the balance sheet date are recognised in the consolidated financial statements under other comprehensive income in equity as a separate translation reserve. Foreign exchange adjustments of intra-group balances with foreign subsidiaries that are considered part of the net investment in subsidiaries with functional currencies other than DKK are recognised in the consolidated financial statements in other comprehensive income.
On full or partial divestment of a foreign entity or on the settlement of in-tra-group balances that are considered part of the net investment, the part of accumulated foreign exchange adjustment that is recognised in equity and that is attributable to that entity is recognised in profit or loss for the year together with any gains or losses from the divestment.
Business combinationsThe accounting policies applied to business combinations are described in the respective notes to the financial statements.
Statement of comprehensive incomeThe accounting policies applied to the items in the statement of compre-hensive income are described in the respective notes to the statement of comprehensive income.
Statement of cash flowsThe statement of cash flows shows the group's cash flows from operating, investing and financing activities for the year, the year's changes in cash and bank debt and the opening and closing cash and bank debt.
Cash flows from operating activitiesCash flows from operating activities are determined using the indirect method as operating profit/loss before special items adjusted for non-cash items, changes in working capital, interest paid and interest received, income taxes paid and restructuring costs paid.
Cash flows from investing activitiesCash flows from investing activities comprise payments in connection with acquisition and disposal of intangible assets and property, plant and equip-ment, acquisition of subsidiaries, capital injections in subsidiaries, dividend received from associates and subsidiaries and government grants received.
Cash flows from financing activitiesCash flows from financing activities comprise the raising and repayment of loans, changes in the amount or composition of the share capital, including purchase and sale of treasury shares and related costs, and dividend pay-ments to shareholders.
Cash and cash equivalentsCash and cash equivalents comprise cash and current bank debt.
Balance sheetThe accounting policies applied to the items in the balance sheet are described in the respective notes to the balance sheet, except as stated below.
Income taxCurrent tax payable and receivable is recognised in the balance sheet as tax computed on the taxable income for the year, adjusted for tax on the taxable income of prior years and for tax paid on account. Joint taxation contributions payable and receivable are recognised as income tax in the balance sheet.
38H A R T M A N N A N N U A L R E P O R T 2 0 1 6
HIGHLIGHTS · BUSINESS · GOVERNANCE · FINANCIALSnote 01
Notes
Definitions of financial ratios
Net working capital
Inventories + receivables + other current operating
assets - trade payables - other current operating liabilities
(excluding restructuring)
Invested capital
Net working capital + intangible assets + property, plant
and equipment + other non-current receivables - pension
obligations - government grants
Net interest-bearing debt
Credit institutions + overdraft facilities - cash
Profit margin
Operating profit before special items x 100
Revenue
Return on invested capital (ROIC)
Operating profit before special items x 100
Average invested capital
Return on equity
Profit for the year x 100
Average equity
Equity ratio
Equity at year-end x 100
Assets at year-end
Gearing
Net interest-bearing debt x 100
Equity at year-end
Earnings per share (EPS)
Profit for the year
Average no. of shares (excluding treasury shares)
Cash flow per share
Cash flows from operating activities
Average no. of shares (excluding treasury shares)
Book value per share
Equity at year-end
No. of shares (excluding treasury shares) at year-end
Market price/earnings (P/E)
Market price
Earnings per share (EPS)
Payout ratio
Total dividend paid x 100
Profit for the year
Earnings per share (EPS) are calculated according to IAS 33.
Profit margin and return on invested capital (ROIC) are calculated on the basis of operating profit before special items as this is the group’s key performance indicator.
Other financial ratios are calculated in accordance with 'Recommen-dations & Financial Ratios 2015' issued by the Danish Finance Society.
01 Accounting policies – continued
PrepaymentsPrepayments include expenses paid in respect of subsequent financial years.
EquityDividendThe amount proposed in dividends for the year is stated as a separate item in equity. Proposed dividend is recognised as a liability at the time it is adopted at the annual general meeting.
Treasury sharesCosts of acquisition and divestment and dividend received on treasury shares acquired by the parent company or the subsidiaries are recognised in equity as retained earnings.
Translation reserveThe translation reserve in the consolidated financial statements includes accumulated foreign exchange differences on the translation of the financial statements of foreign subsidiaries from their functional currency to the presentation currency of the group.
Hedging reserveThe hedging reserve contains the accumulated net change in the fair value of hedging transactions qualifying as cash flow hedges for which the hedged transaction has not yet been realised.
Financial liabilitiesFinancial liabilities comprise payables to credit institutions, trade payables, payables to subsidiaries and associates and other payables.
Payables to credit institutions are recognised at the date of borrowing at the net proceeds received less transaction costs paid. In subsequent periods, payables to credit institutions are measured at amortised cost, corresponding to the capitalised value using the effective interest rate. Accordingly, the difference between the proceeds and the nominal value (capital loss) is recognised in profit or loss over the term of the loan.
Other liabilities are measured at net realisable value.
39H A R T M A N N A N N U A L R E P O R T 2 0 1 6
HIGHLIGHTS · BUSINESS · GOVERNANCE · FINANCIALS
Notes
02 Accounting regulations
New financial reporting standards and interpretations in 2016Hartmann has implemented all new and revised financial reporting stand-ards and interpretations adopted by the EU that are effective for financial years beginning on 1 January 2016. In our assessment, these are either not relevant to the group or the parent company, or not of significant importance.
New financial reporting standards which have not yet come into force and which have not been adopted earlyThe IASB has issued a number of financial reporting standards, amend-ments and interpretations that must be implemented by the group and the parent company for financial years beginning on or after 1 January 2017.
The financial reporting standards, amendments and interpretations that have not yet come into force are not considered to significantly affect the consolidated financial statements or the parent company financial statements in future financial years. However, the analysis of the expected impact of implementing IFRS 9, IFRS 15 and IFRS 16 has not been finalised. See below.
IFRS 9 ‘Financial Instruments’, which replaces IAS 39, changes the classifi-cation and subsequent measurement of financial assets and liabilities. The standard introduces a more logical approach to classification of financial assets based on the business model applied in the entity and the charac-teristics of the underlying cash flows. The standard also introduces a new impairment model for all financial assets.
IFRS 15 ‘Revenue from Contracts with Customers’, which replaces the cur-rent revenue standards (IAS 11 and IAS 18) and interpretations, introduces a new framework for recognition and measurement of revenue from sales contracts with customers. The new standard provides a five-step model to be applied to all sales contracts with customers to determine when and how revenue is to be recognised in the statement of comprehensive income.
Under IFRS 16 ‘Leases’, replacing IAS 17, practically all leases must be recognised in the balance sheet of the lessee’s financial statements in the form of a lease obligation and an asset representing the lessee’s right to
use the underlying asset. Operating leases and finance leases are no longer distinguished from one another.
IFRS 9 and IFRS 15 will be effective for financial years beginning on or after 1 January 2018, and IFRS 16 will be effective for financial years beginning on or after 1 January 2019 if adopted by the EU.
03 Significant accounting estimates and judgments
In applying the group’s and the parent company’s accounting policies, management is required to make judgments, estimates and assumptions concerning the carrying amount of assets and liabilities that cannot be immediately inferred from other sources.
The judgments, estimates and assumptions made are based on historical experience and other relevant factors which management considers reasonable under the circumstances, but which are inherently uncertain and unpredictable.
Estimates and underlying assumptions are assessed on an ongoing basis. Changes to accounting estimates are recognised in the reference period in which the change occurs and in future reference periods if the change affects both the period in which the change occurs and subsequent refer-ence periods.
Significant accounting estimates, assumptions and uncertaintiesThe recognition and measurement of assets and liabilities often depend on future events that are somewhat uncertain. In that connection, it is neces-sary to make an assumption that reflects management’s assessment of the most likely course of events. A number of assumptions and uncertainties are worth noting since they have had a significant influence on the assets and liabilities recognised in the consolidated financial statements and the parent company financial statements and may necessitate corrections in subsequent financial years if the assumed course of events fails to material-ise as expected. Except as stated below, these assumptions and uncertain-ties are described in the respective notes to the financial statements.
Combined heat and power plant in TønderIn 2008, district heating company Tønder Fjernvarmeselskab filed a com-plaint with the Danish Energy Regulatory Authority concerning the pricing of district heating supplied by Hartmann’s combined heat and power plant. In 2015, the Secretariat of the Danish Energy Regulatory Authority made a decision on the principles guiding the calculation of heating prices in the period from 2003 up to and including 8 January 2015, when district heating supplies were discontinued. Hartmann appealed this decision to the Danish Energy Board of Appeal, which made a decision on 30 June 2016 that only considered the Danish Energy Regulatory Authority’s powers to impose forward orders. Since the contract between Tønder Fjernvarmeselskab and Hartmann has been terminated, the decision of the Danish Energy Board of Appeal only implies that an order will not be imposed on Hartmann.
In the pending and related cases, the Danish Energy Regulatory Authority and the Danish Energy Board of Appeal have put varying interpretations on applicable law. Hartmann has therefore appealed the decision of the Danish Energy Regulatory Authority to the Danish Energy Board of Appeal and brought an action against the Danish Energy Board of Appeal, see company announcement 16/2016 of 22 December 2016, with a view to clarifying the law governing these linked cases, including the collection of Hartmann’s DKK 39 million receivable from Tønder Fjernvarmeselskab.
Assuming that the final decision in the case will reflect the 2015 decision of the Danish Energy Regulatory Authority, Hartmann expects costs to amount to about DKK 50 million and estimates the cash flow effect at a negative DKK 10 million. Tønder Fjernvarmeselskab on its part has raised a claim of DKK 88 million.
Based on an internal review of these decisions and indications from external advisers, management believes that the case is very likely to be referred back to the Danish Energy Board of Appeal, resulting in a reversal of district heating pricing principles.
40H A R T M A N N A N N U A L R E P O R T 2 0 1 6
HIGHLIGHTS · BUSINESS · GOVERNANCE · FINANCIALSnote 02+03
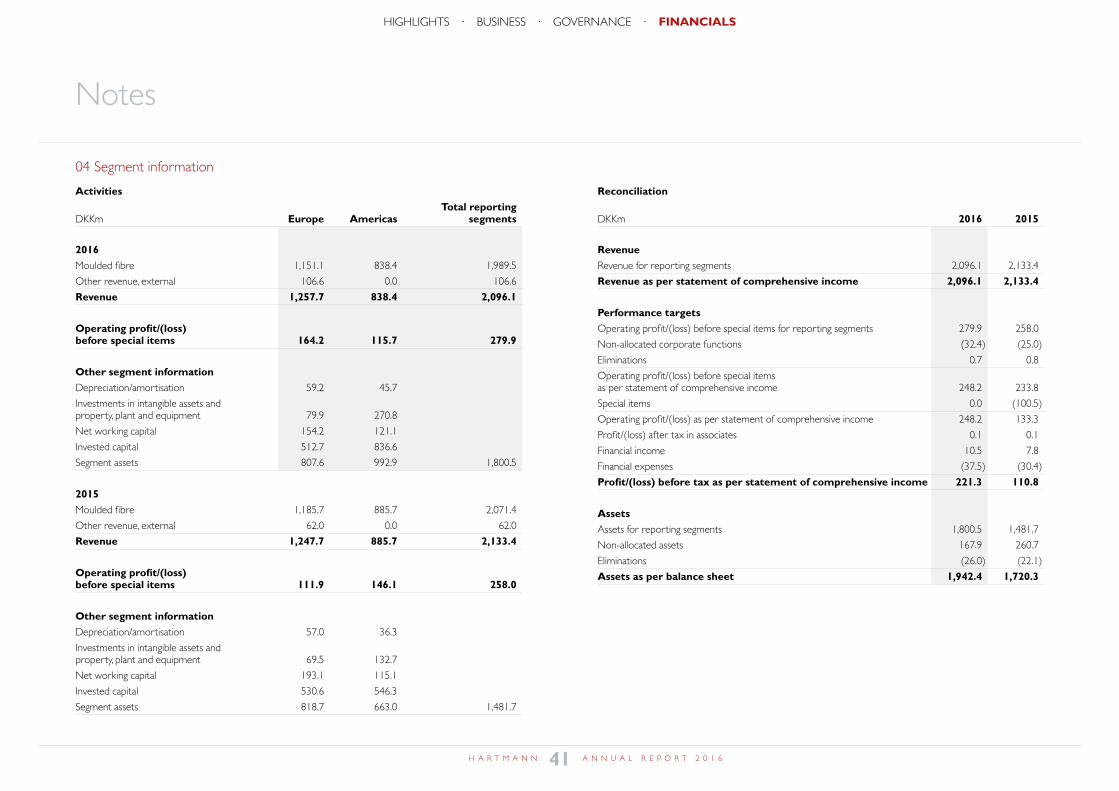
Notes
04 Segment information
Activities Total reporting DKKm Europe Americas segments
2016Moulded fibre 1,151.1 838.4 1,989.5
Other revenue, external 106.6 0.0 106.6
Revenue 1,257.7 838.4 2,096.1
Operating profit/(loss) before special items 164.2 115.7 279.9
Other segment informationDepreciation/amortisation 59.2 45.7
Investments in intangible assets and property, plant and equipment 79.9 270.8
Net working capital 154.2 121.1
Invested capital 512.7 836.6
Segment assets 807.6 992.9 1,800.5
2015Moulded fibre 1,185.7 885.7 2,071.4
Other revenue, external 62.0 0.0 62.0
Revenue 1,247.7 885.7 2,133.4
Operating profit/(loss) before special items 111.9 146.1 258.0
Other segment informationDepreciation/amortisation 57.0 36.3
Investments in intangible assets and property, plant and equipment 69.5 132.7
Net working capital 193.1 115.1
Invested capital 530.6 546.3
Segment assets 818.7 663.0 1,481.7
04 Segment information
Reconciliation
DKKm 2016 2015
RevenueRevenue for reporting segments 2,096.1 2,133.4
Revenue as per statement of comprehensive income 2,096.1 2,133.4
Performance targets Operating profit/(loss) before special items for reporting segments 279.9 258.0
Non-allocated corporate functions (32.4) (25.0)
Eliminations 0.7 0.8
Operating profit/(loss) before special items as per statement of comprehensive income 248.2 233.8
Special items 0.0 (100.5)
Operating profit/(loss) as per statement of comprehensive income 248.2 133.3
Profit/(loss) after tax in associates 0.1 0.1
Financial income 10.5 7.8
Financial expenses (37.5) (30.4)
Profit/(loss) before tax as per statement of comprehensive income 221.3 110.8
Assets Assets for reporting segments 1,800.5 1,481.7
Non-allocated assets 167.9 260.7
Eliminations (26.0) (22.1)
Assets as per balance sheet 1,942.4 1,720.3
41H A R T M A N N A N N U A L R E P O R T 2 0 1 6
HIGHLIGHTS · BUSINESS · GOVERNANCE · FINANCIALSnote 04
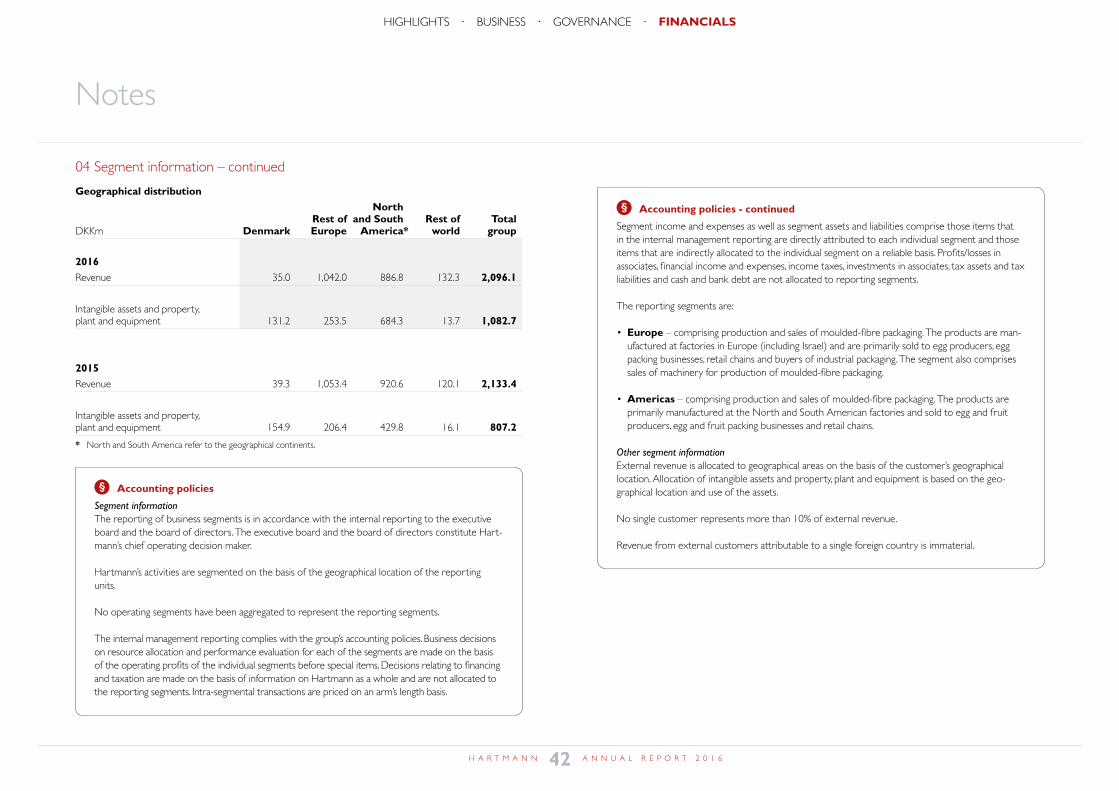
Notes
04 Segment information – continued
Geographical distribution North Rest of and South Rest of Total DKKm Denmark Europe America* world group
2016Revenue 35.0 1,042.0 886.8 132.3 2,096.1
Intangible assets and property, plant and equipment 131.2 253.5 684.3 13.7 1,082.7
2015Revenue 39.3 1,053.4 920.6 120.1 2,133.4
Intangible assets and property, plant and equipment 154.9 206.4 429.8 16.1 807.2
* North and South America refer to the geographical continents.
Accounting policies - continued
Segment income and expenses as well as segment assets and liabilities comprise those items that in the internal management reporting are directly attributed to each individual segment and those items that are indirectly allocated to the individual segment on a reliable basis. Profits/losses in associates, financial income and expenses, income taxes, investments in associates, tax assets and tax liabilities and cash and bank debt are not allocated to reporting segments.
The reporting segments are:
• Europe – comprising production and sales of moulded-fibre packaging. The products are man-ufactured at factories in Europe (including Israel) and are primarily sold to egg producers, egg packing businesses, retail chains and buyers of industrial packaging. The segment also comprises sales of machinery for production of moulded-fibre packaging.
• Americas – comprising production and sales of moulded-fibre packaging. The products are primarily manufactured at the North and South American factories and sold to egg and fruit producers, egg and fruit packing businesses and retail chains.
Other segment informationExternal revenue is allocated to geographical areas on the basis of the customer’s geographical location. Allocation of intangible assets and property, plant and equipment is based on the geo-graphical location and use of the assets.
No single customer represents more than 10% of external revenue.
Revenue from external customers attributable to a single foreign country is immaterial.
Accounting policies
Segment information The reporting of business segments is in accordance with the internal reporting to the executive board and the board of directors. The executive board and the board of directors constitute Hart-mann’s chief operating decision maker.
Hartmann’s activities are segmented on the basis of the geographical location of the reporting units.
No operating segments have been aggregated to represent the reporting segments.
The internal management reporting complies with the group’s accounting policies. Business decisions on resource allocation and performance evaluation for each of the segments are made on the basis of the operating profits of the individual segments before special items. Decisions relating to financing and taxation are made on the basis of information on Hartmann as a whole and are not allocated to the reporting segments. Intra-segmental transactions are priced on an arm’s length basis.
42H A R T M A N N A N N U A L R E P O R T 2 0 1 6
HIGHLIGHTS · BUSINESS · GOVERNANCE · FINANCIALS
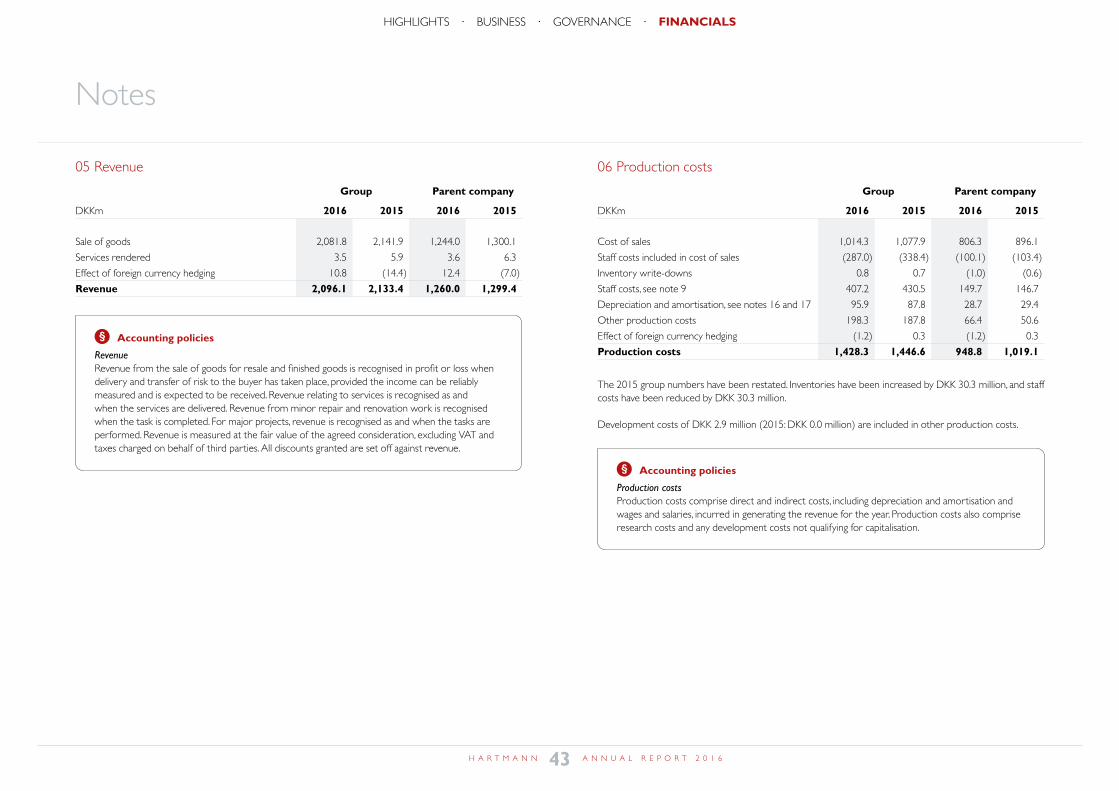
Notes
05 Revenue
Group Parent company
DKKm 2016 2015 2016 2015
Sale of goods 2,081.8 2,141.9 1,244.0 1,300.1
Services rendered 3.5 5.9 3.6 6.3
Effect of foreign currency hedging 10.8 (14.4) 12.4 (7.0)
Revenue 2,096.1 2,133.4 1,260.0 1,299.4
Accounting policies
Revenue Revenue from the sale of goods for resale and finished goods is recognised in profit or loss when delivery and transfer of risk to the buyer has taken place, provided the income can be reliably measured and is expected to be received. Revenue relating to services is recognised as and when the services are delivered. Revenue from minor repair and renovation work is recognised when the task is completed. For major projects, revenue is recognised as and when the tasks are performed. Revenue is measured at the fair value of the agreed consideration, excluding VAT and taxes charged on behalf of third parties. All discounts granted are set off against revenue.
06 Production costs
Group Parent company
DKKm 2016 2015 2016 2015
Cost of sales 1,014.3 1,077.9 806.3 896.1
Staff costs included in cost of sales (287.0) (338.4) (100.1) (103.4)
Inventory write-downs 0.8 0.7 (1.0) (0.6)
Staff costs, see note 9 407.2 430.5 149.7 146.7
Depreciation and amortisation, see notes 16 and 17 95.9 87.8 28.7 29.4
Other production costs 198.3 187.8 66.4 50.6
Effect of foreign currency hedging (1.2) 0.3 (1.2) 0.3
Production costs 1,428.3 1,446.6 948.8 1,019.1
The 2015 group numbers have been restated. Inventories have been increased by DKK 30.3 million, and staff costs have been reduced by DKK 30.3 million.
Development costs of DKK 2.9 million (2015: DKK 0.0 million) are included in other production costs.
Accounting policies
Production costsProduction costs comprise direct and indirect costs, including depreciation and amortisation and wages and salaries, incurred in generating the revenue for the year. Production costs also comprise research costs and any development costs not qualifying for capitalisation.
43H A R T M A N N A N N U A L R E P O R T 2 0 1 6
HIGHLIGHTS · BUSINESS · GOVERNANCE · FINANCIALSnote 05+06
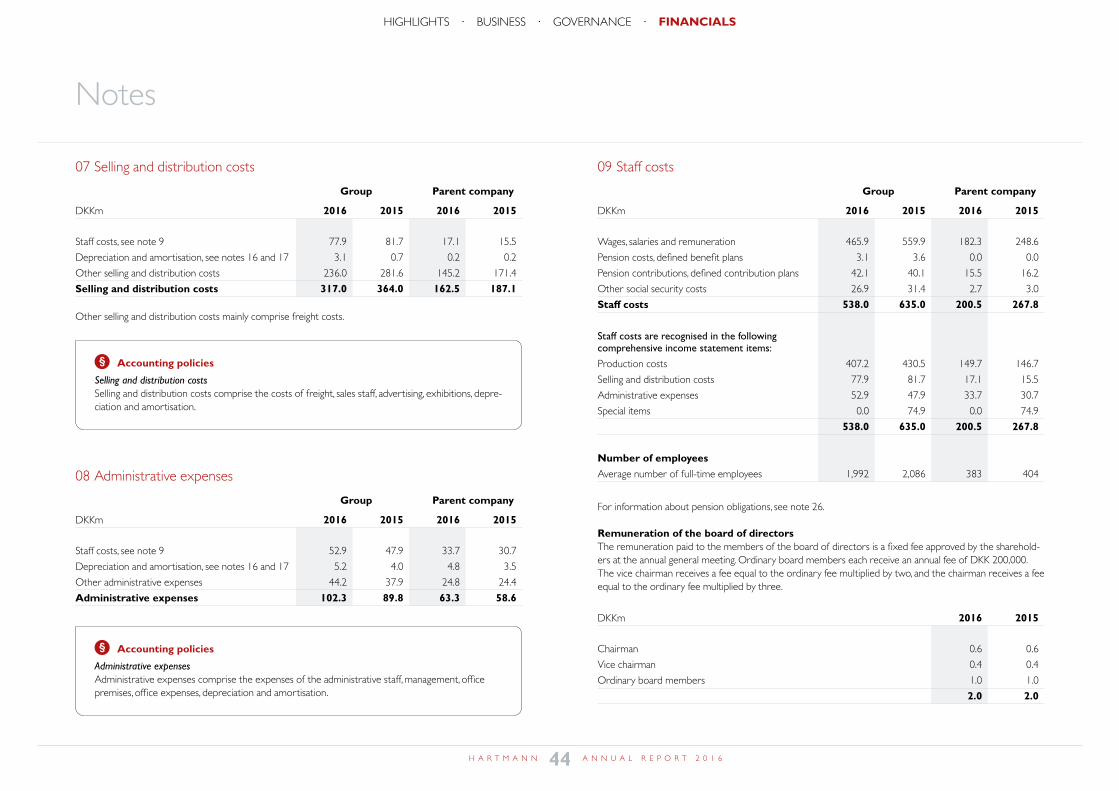
Notes
07 Selling and distribution costs
Group Parent company
DKKm 2016 2015 2016 2015
Staff costs, see note 9 77.9 81.7 17.1 15.5
Depreciation and amortisation, see notes 16 and 17 3.1 0.7 0.2 0.2
Other selling and distribution costs 236.0 281.6 145.2 171.4
Selling and distribution costs 317.0 364.0 162.5 187.1
Other selling and distribution costs mainly comprise freight costs.
08 Administrative expenses
Group Parent company
DKKm 2016 2015 2016 2015
Staff costs, see note 9 52.9 47.9 33.7 30.7
Depreciation and amortisation, see notes 16 and 17 5.2 4.0 4.8 3.5
Other administrative expenses 44.2 37.9 24.8 24.4
Administrative expenses 102.3 89.8 63.3 58.6
Accounting policies
Selling and distribution costs Selling and distribution costs comprise the costs of freight, sales staff, advertising, exhibitions, depre-ciation and amortisation.
Accounting policies
Administrative expensesAdministrative expenses comprise the expenses of the administrative staff, management, office premises, office expenses, depreciation and amortisation.
09 Staff costs
Group Parent company
DKKm 2016 2015 2016 2015
Wages, salaries and remuneration 465.9 559.9 182.3 248.6
Pension costs, defined benefit plans 3.1 3.6 0.0 0.0
Pension contributions, defined contribution plans 42.1 40.1 15.5 16.2
Other social security costs 26.9 31.4 2.7 3.0
Staff costs 538.0 635.0 200.5 267.8
Staff costs are recognised in the following comprehensive income statement items:
Production costs 407.2 430.5 149.7 146.7
Selling and distribution costs 77.9 81.7 17.1 15.5
Administrative expenses 52.9 47.9 33.7 30.7
Special items 0.0 74.9 0.0 74.9
538.0 635.0 200.5 267.8
Number of employees Average number of full-time employees 1,992 2,086 383 404
For information about pension obligations, see note 26.
Remuneration of the board of directorsThe remuneration paid to the members of the board of directors is a fixed fee approved by the sharehold-ers at the annual general meeting. Ordinary board members each receive an annual fee of DKK 200,000. The vice chairman receives a fee equal to the ordinary fee multiplied by two, and the chairman receives a fee equal to the ordinary fee multiplied by three.
DKKm 2016 2015
Chairman 0.6 0.6
Vice chairman 0.4 0.4
Ordinary board members 1.0 1.0
2.0 2.0
44H A R T M A N N A N N U A L R E P O R T 2 0 1 6
HIGHLIGHTS · BUSINESS · GOVERNANCE · FINANCIALSnote 07+08+09
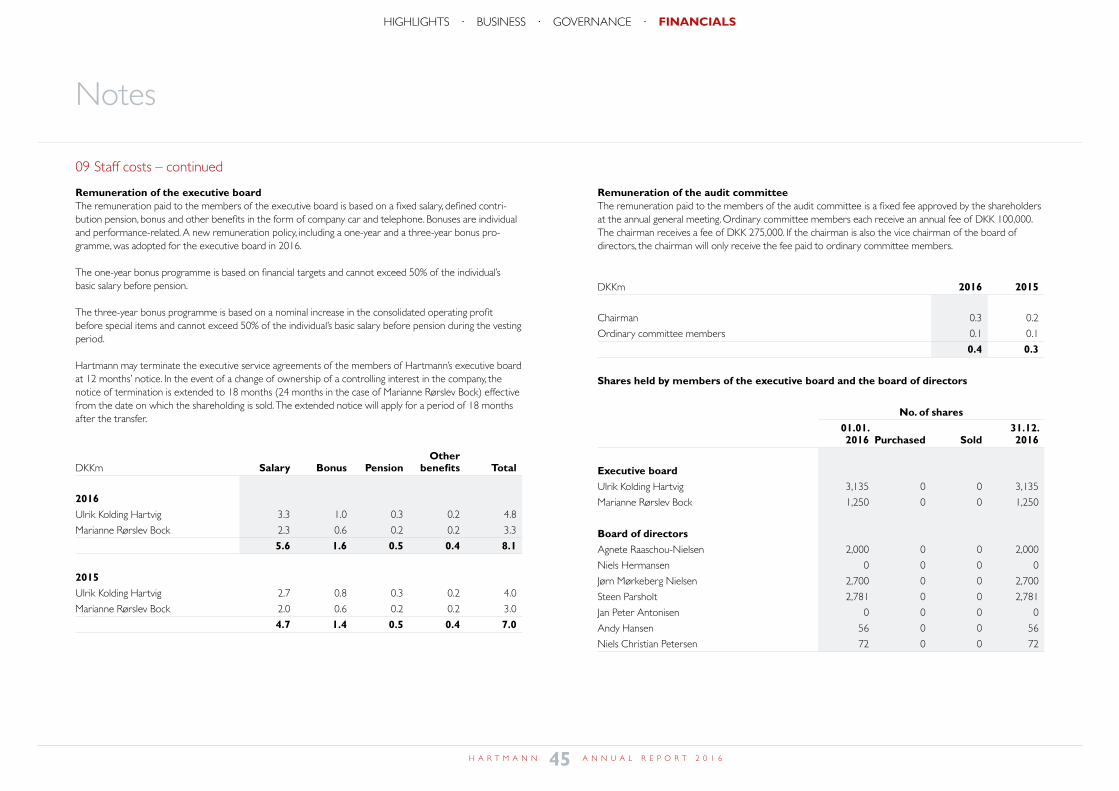
Notes
09 Staff costs – continued
Remuneration of the executive boardThe remuneration paid to the members of the executive board is based on a fixed salary, defined contri-bution pension, bonus and other benefits in the form of company car and telephone. Bonuses are individual and performance-related. A new remuneration policy, including a one-year and a three-year bonus pro-gramme, was adopted for the executive board in 2016.
The one-year bonus programme is based on financial targets and cannot exceed 50% of the individual’s basic salary before pension.
The three-year bonus programme is based on a nominal increase in the consolidated operating profit before special items and cannot exceed 50% of the individual’s basic salary before pension during the vesting period.
Hartmann may terminate the executive service agreements of the members of Hartmann’s executive board at 12 months’ notice. In the event of a change of ownership of a controlling interest in the company, the notice of termination is extended to 18 months (24 months in the case of Marianne Rørslev Bock) effective from the date on which the shareholding is sold. The extended notice will apply for a period of 18 months after the transfer.
Other DKKm Salary Bonus Pension benefits Total
2016Ulrik Kolding Hartvig 3.3 1.0 0.3 0.2 4.8
Marianne Rørslev Bock 2.3 0.6 0.2 0.2 3.3
5.6 1.6 0.5 0.4 8.1
2015Ulrik Kolding Hartvig 2.7 0.8 0.3 0.2 4.0
Marianne Rørslev Bock 2.0 0.6 0.2 0.2 3.0
4.7 1.4 0.5 0.4 7.0
09 Staff costs – cont'd
Remuneration of the audit committeeThe remuneration paid to the members of the audit committee is a fixed fee approved by the shareholders at the annual general meeting. Ordinary committee members each receive an annual fee of DKK 100,000. The chairman receives a fee of DKK 275,000. If the chairman is also the vice chairman of the board of directors, the chairman will only receive the fee paid to ordinary committee members.
DKKm 2016 2015
Chairman 0.3 0.2
Ordinary committee members 0.1 0.1
0.4 0.3
Shares held by members of the executive board and the board of directors
No. of shares 01.01. 31.12. 2016 Purchased Sold 2016
Executive board Ulrik Kolding Hartvig 3,135 0 0 3,135
Marianne Rørslev Bock 1,250 0 0 1,250
Board of directors Agnete Raaschou-Nielsen 2,000 0 0 2,000
Niels Hermansen 0 0 0 0
Jørn Mørkeberg Nielsen 2,700 0 0 2,700
Steen Parsholt 2,781 0 0 2,781
Jan Peter Antonisen 0 0 0 0
Andy Hansen 56 0 0 56
Niels Christian Petersen 72 0 0 72
45H A R T M A N N A N N U A L R E P O R T 2 0 1 6
HIGHLIGHTS · BUSINESS · GOVERNANCE · FINANCIALS
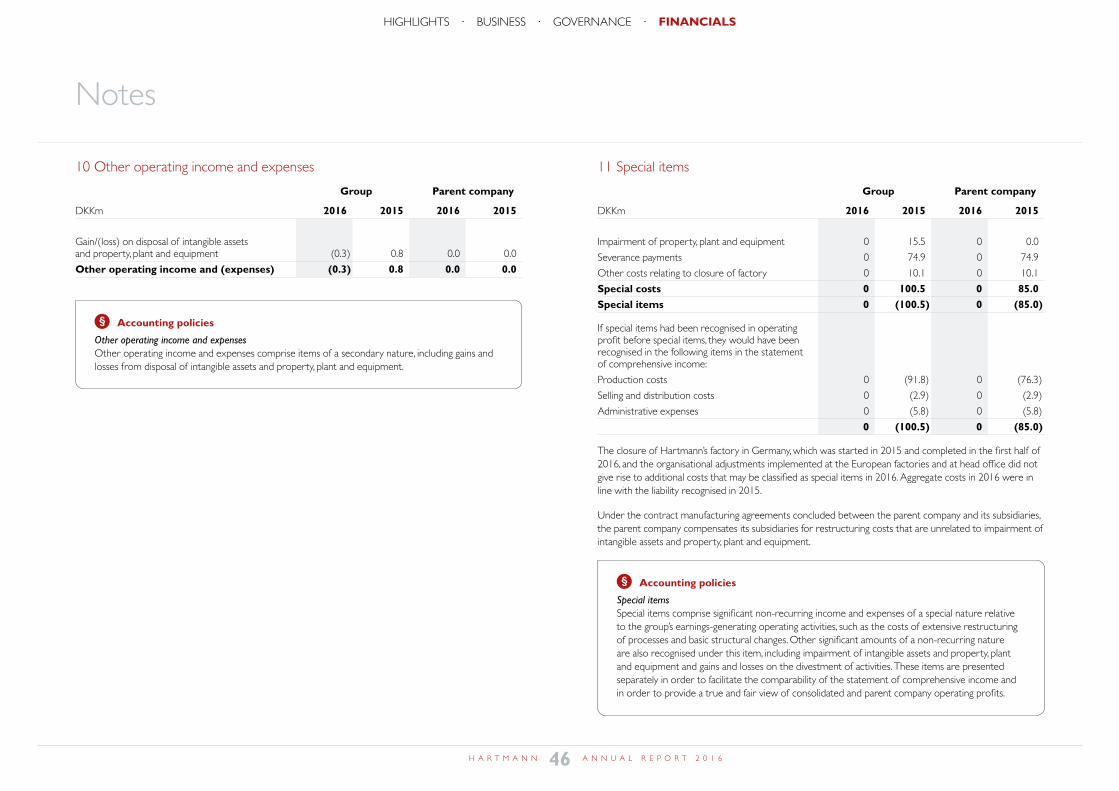
Notes
10 Other operating income and expenses
Group Parent company
DKKm 2016 2015 2016 2015
Gain/(loss) on disposal of intangible assets and property, plant and equipment (0.3) 0.8 0.0 0.0
Other operating income and (expenses) (0.3) 0.8 0.0 0.0
Accounting policies
Other operating income and expenses Other operating income and expenses comprise items of a secondary nature, including gains and losses from disposal of intangible assets and property, plant and equipment.
11 Special items
Group Parent company
DKKm 2016 2015 2016 2015
Impairment of property, plant and equipment 0 15.5 0 0.0
Severance payments 0 74.9 0 74.9
Other costs relating to closure of factory 0 10.1 0 10.1
Special costs 0 100.5 0 85.0Special items 0 (100.5) 0 (85.0)
If special items had been recognised in operating profit before special items, they would have been recognised in the following items in the statement of comprehensive income:
Production costs 0 (91.8) 0 (76.3)
Selling and distribution costs 0 (2.9) 0 (2.9)
Administrative expenses 0 (5.8) 0 (5.8)
0 (100.5) 0 (85.0)
The closure of Hartmann’s factory in Germany, which was started in 2015 and completed in the first half of 2016, and the organisational adjustments implemented at the European factories and at head office did not give rise to additional costs that may be classified as special items in 2016. Aggregate costs in 2016 were in line with the liability recognised in 2015.
Under the contract manufacturing agreements concluded between the parent company and its subsidiaries, the parent company compensates its subsidiaries for restructuring costs that are unrelated to impairment of intangible assets and property, plant and equipment.
Accounting policies
Special items Special items comprise significant non-recurring income and expenses of a special nature relative to the group’s earnings-generating operating activities, such as the costs of extensive restructuring of processes and basic structural changes. Other significant amounts of a non-recurring nature are also recognised under this item, including impairment of intangible assets and property, plant and equipment and gains and losses on the divestment of activities. These items are presented separately in order to facilitate the comparability of the statement of comprehensive income and in order to provide a true and fair view of consolidated and parent company operating profits.
46H A R T M A N N A N N U A L R E P O R T 2 0 1 6
HIGHLIGHTS · BUSINESS · GOVERNANCE · FINANCIALSnote 10+11
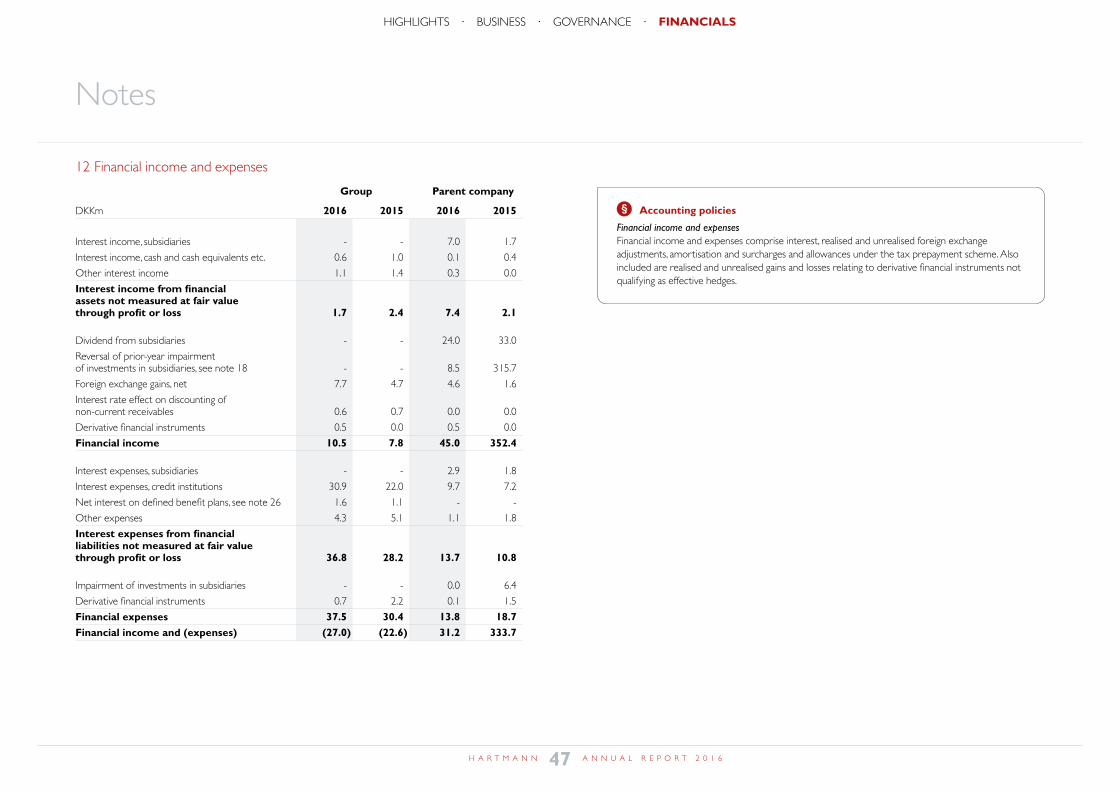
Notes
12 Financial income and expenses
Group Parent company
DKKm 2016 2015 2016 2015
Interest income, subsidiaries - - 7.0 1.7
Interest income, cash and cash equivalents etc. 0.6 1.0 0.1 0.4
Other interest income 1.1 1.4 0.3 0.0
Interest income from financial assets not measured at fair value through profit or loss 1.7 2.4 7.4 2.1 Dividend from subsidiaries - - 24.0 33.0
Reversal of prior-year impairment of investments in subsidiaries, see note 18 - - 8.5 315.7
Foreign exchange gains, net 7.7 4.7 4.6 1.6
Interest rate effect on discounting of non-current receivables 0.6 0.7 0.0 0.0
Derivative financial instruments 0.5 0.0 0.5 0.0
Financial income 10.5 7.8 45.0 352.4 Interest expenses, subsidiaries - - 2.9 1.8
Interest expenses, credit institutions 30.9 22.0 9.7 7.2
Net interest on defined benefit plans, see note 26 1.6 1.1 - -
Other expenses 4.3 5.1 1.1 1.8
Interest expenses from financial liabilities not measured at fair value through profit or loss 36.8 28.2 13.7 10.8
Impairment of investments in subsidiaries - - 0.0 6.4
Derivative financial instruments 0.7 2.2 0.1 1.5
Financial expenses 37.5 30.4 13.8 18.7Financial income and (expenses) (27.0) (22.6) 31.2 333.7
Accounting policies
Financial income and expensesFinancial income and expenses comprise interest, realised and unrealised foreign exchange adjustments, amortisation and surcharges and allowances under the tax prepayment scheme. Also included are realised and unrealised gains and losses relating to derivative financial instruments not qualifying as effective hedges.
47H A R T M A N N A N N U A L R E P O R T 2 0 1 6
HIGHLIGHTS · BUSINESS · GOVERNANCE · FINANCIALSnote 12
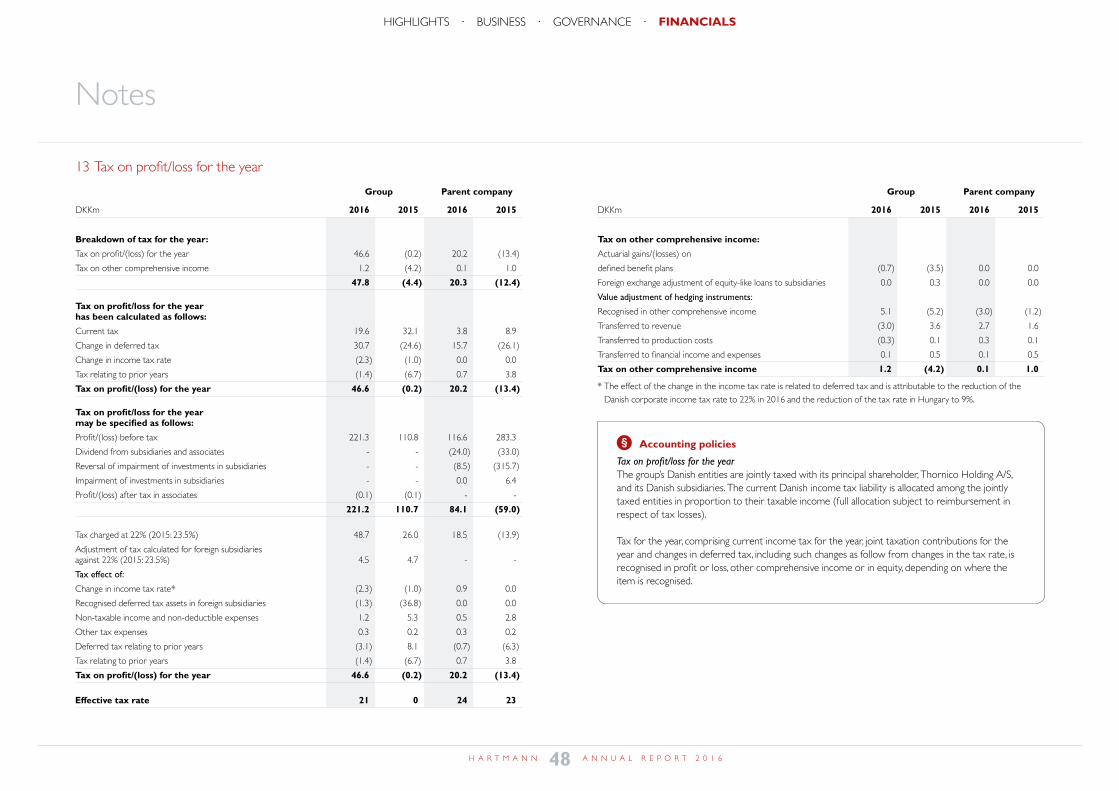
Notes
13 Tax on profit/loss for the year
Group Parent company
DKKm 2016 2015 2016 2015
Breakdown of tax for the year:
Tax on profit/(loss) for the year 46.6 (0.2) 20.2 (13.4)
Tax on other comprehensive income 1.2 (4.2) 0.1 1.0
47.8 (4.4) 20.3 (12.4)
Tax on profit/loss for the year has been calculated as follows:
Current tax 19.6 32.1 3.8 8.9
Change in deferred tax 30.7 (24.6) 15.7 (26.1)
Change in income tax rate (2.3) (1.0) 0.0 0.0
Tax relating to prior years (1.4) (6.7) 0.7 3.8
Tax on profit/(loss) for the year 46.6 (0.2) 20.2 (13.4)
Tax on profit/loss for the year may be specified as follows:
Profit/(loss) before tax 221.3 110.8 116.6 283.3
Dividend from subsidiaries and associates - - (24.0) (33.0)
Reversal of impairment of investments in subsidiaries - - (8.5) (315.7)
Impairment of investments in subsidiaries - - 0.0 6.4
Profit/(loss) after tax in associates (0.1) (0.1) - -
221.2 110.7 84.1 (59.0)
Tax charged at 22% (2015: 23.5%) 48.7 26.0 18.5 (13.9)
Adjustment of tax calculated for foreign subsidiaries against 22% (2015: 23.5%) 4.5 4.7 - -
Tax effect of:
Change in income tax rate* (2.3) (1.0) 0.9 0.0
Recognised deferred tax assets in foreign subsidiaries (1.3) (36.8) 0.0 0.0
Non-taxable income and non-deductible expenses 1.2 5.3 0.5 2.8
Other tax expenses 0.3 0.2 0.3 0.2
Deferred tax relating to prior years (3.1) 8.1 (0.7) (6.3)
Tax relating to prior years (1.4) (6.7) 0.7 3.8
Tax on profit/(loss) for the year 46.6 (0.2) 20.2 (13.4)
Effective tax rate 21 0 24 23
13 Tax on profit/(loss) for the year
Group Parent company
DKKm 2016 2015 2016 2015
Tax on other comprehensive income:
Actuarial gains/(losses) on
defined benefit plans (0.7) (3.5) 0.0 0.0
Foreign exchange adjustment of equity-like loans to subsidiaries 0.0 0.3 0.0 0.0
Value adjustment of hedging instruments:
Recognised in other comprehensive income 5.1 (5.2) (3.0) (1.2)
Transferred to revenue (3.0) 3.6 2.7 1.6
Transferred to production costs (0.3) 0.1 0.3 0.1
Transferred to financial income and expenses 0.1 0.5 0.1 0.5
Tax on other comprehensive income 1.2 (4.2) 0.1 1.0
* The effect of the change in the income tax rate is related to deferred tax and is attributable to the reduction of the Danish corporate income tax rate to 22% in 2016 and the reduction of the tax rate in Hungary to 9%.
Accounting policies
Tax on profit/loss for the yearThe group’s Danish entities are jointly taxed with its principal shareholder, Thornico Holding A/S, and its Danish subsidiaries. The current Danish income tax liability is allocated among the jointly taxed entities in proportion to their taxable income (full allocation subject to reimbursement in respect of tax losses).
Tax for the year, comprising current income tax for the year, joint taxation contributions for the year and changes in deferred tax, including such changes as follow from changes in the tax rate, is recognised in profit or loss, other comprehensive income or in equity, depending on where the item is recognised.
48H A R T M A N N A N N U A L R E P O R T 2 0 1 6
HIGHLIGHTS · BUSINESS · GOVERNANCE · FINANCIALSnote 13
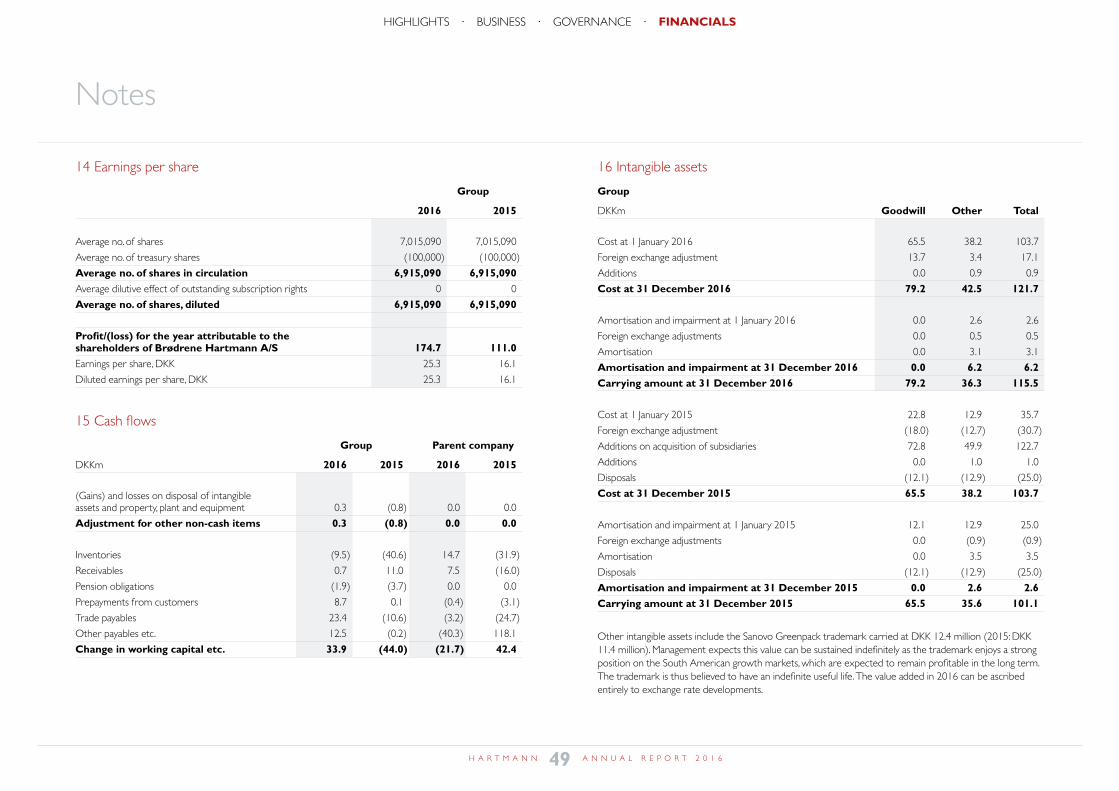
Notes
14 Earnings per share
Group
2016 2015
Average no. of shares 7,015,090 7,015,090
Average no. of treasury shares (100,000) (100,000)
Average no. of shares in circulation 6,915,090 6,915,090Average dilutive effect of outstanding subscription rights 0 0
Average no. of shares, diluted 6,915,090 6,915,090
Profit/(loss) for the year attributable to the shareholders of Brødrene Hartmann A/S 174.7 111.0Earnings per share, DKK 25.3 16.1
Diluted earnings per share, DKK 25.3 16.1
15 Cash flows
Group Parent company
DKKm 2016 2015 2016 2015
(Gains) and losses on disposal of intangible assets and property, plant and equipment 0.3 (0.8) 0.0 0.0
Adjustment for other non-cash items 0.3 (0.8) 0.0 0.0
Inventories (9.5) (40.6) 14.7 (31.9)
Receivables 0.7 11.0 7.5 (16.0)
Pension obligations (1.9) (3.7) 0.0 0.0
Prepayments from customers 8.7 0.1 (0.4) (3.1)
Trade payables 23.4 (10.6) (3.2) (24.7)
Other payables etc. 12.5 (0.2) (40.3) 118.1
Change in working capital etc. 33.9 (44.0) (21.7) 42.4
16 Intangible assets
Group
DKKm Goodwill Other Total
Cost at 1 January 2016 65.5 38.2 103.7
Foreign exchange adjustment 13.7 3.4 17.1
Additions 0.0 0.9 0.9
Cost at 31 December 2016 79.2 42.5 121.7
Amortisation and impairment at 1 January 2016 0.0 2.6 2.6
Foreign exchange adjustments 0.0 0.5 0.5
Amortisation 0.0 3.1 3.1
Amortisation and impairment at 31 December 2016 0.0 6.2 6.2Carrying amount at 31 December 2016 79.2 36.3 115.5
Cost at 1 January 2015 22.8 12.9 35.7
Foreign exchange adjustment (18.0) (12.7) (30.7)
Additions on acquisition of subsidiaries 72.8 49.9 122.7
Additions 0.0 1.0 1.0
Disposals (12.1) (12.9) (25.0)
Cost at 31 December 2015 65.5 38.2 103.7
Amortisation and impairment at 1 January 2015 12.1 12.9 25.0
Foreign exchange adjustments 0.0 (0.9) (0.9)
Amortisation 0.0 3.5 3.5
Disposals (12.1) (12.9) (25.0)
Amortisation and impairment at 31 December 2015 0.0 2.6 2.6Carrying amount at 31 December 2015 65.5 35.6 101.1
Other intangible assets include the Sanovo Greenpack trademark carried at DKK 12.4 million (2015: DKK 11.4 million). Management expects this value can be sustained indefinitely as the trademark enjoys a strong position on the South American growth markets, which are expected to remain profitable in the long term. The trademark is thus believed to have an indefinite useful life. The value added in 2016 can be ascribed entirely to exchange rate developments.
49H A R T M A N N A N N U A L R E P O R T 2 0 1 6
HIGHLIGHTS · BUSINESS · GOVERNANCE · FINANCIALSnote 14+15+16
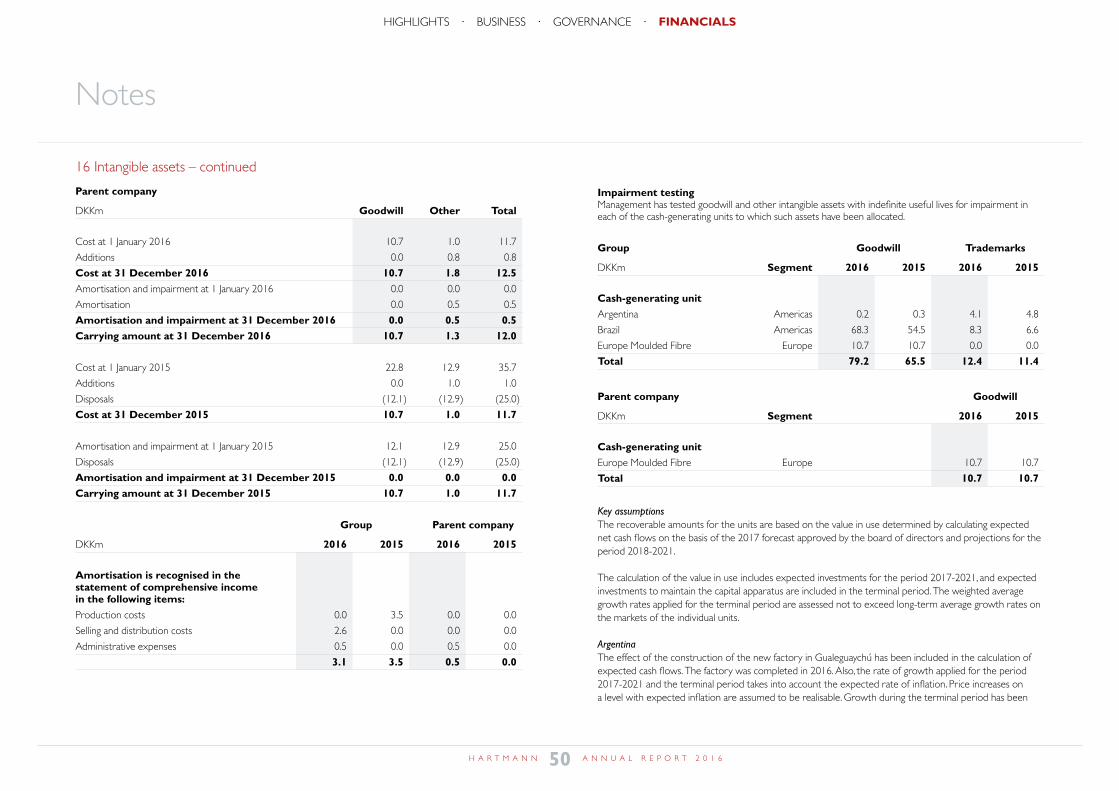
Notes
16 Intangible assets – continued
Parent company
DKKm Goodwill Other Total
Cost at 1 January 2016 10.7 1.0 11.7
Additions 0.0 0.8 0.8
Cost at 31 December 2016 10.7 1.8 12.5Amortisation and impairment at 1 January 2016 0.0 0.0 0.0
Amortisation 0.0 0.5 0.5
Amortisation and impairment at 31 December 2016 0.0 0.5 0.5Carrying amount at 31 December 2016 10.7 1.3 12.0
Cost at 1 January 2015 22.8 12.9 35.7
Additions 0.0 1.0 1.0
Disposals (12.1) (12.9) (25.0)
Cost at 31 December 2015 10.7 1.0 11.7
Amortisation and impairment at 1 January 2015 12.1 12.9 25.0
Disposals (12.1) (12.9) (25.0)
Amortisation and impairment at 31 December 2015 0.0 0.0 0.0Carrying amount at 31 December 2015 10.7 1.0 11.7
Group Parent company
DKKm 2016 2015 2016 2015
Amortisation is recognised in the statement of comprehensive income in the following items:Production costs 0.0 3.5 0.0 0.0
Selling and distribution costs 2.6 0.0 0.0 0.0
Administrative expenses 0.5 0.0 0.5 0.0
3.1 3.5 0.5 0.0
Impairment testingManagement has tested goodwill and other intangible assets with indefinite useful lives for impairment in each of the cash-generating units to which such assets have been allocated.
Group Goodwill Trademarks
DKKm Segment 2016 2015 2016 2015
Cash-generating unitArgentina Americas 0.2 0.3 4.1 4.8
Brazil Americas 68.3 54.5 8.3 6.6
Europe Moulded Fibre Europe 10.7 10.7 0.0 0.0
Total 79.2 65.5 12.4 11.4
Parent company Goodwill
DKKm Segment 2016 2015
Cash-generating unitEurope Moulded Fibre Europe 10.7 10.7
Total 10.7 10.7
Key assumptionsThe recoverable amounts for the units are based on the value in use determined by calculating expected net cash flows on the basis of the 2017 forecast approved by the board of directors and projections for the period 2018-2021.
The calculation of the value in use includes expected investments for the period 2017-2021, and expected investments to maintain the capital apparatus are included in the terminal period. The weighted average growth rates applied for the terminal period are assessed not to exceed long-term average growth rates on the markets of the individual units.
ArgentinaThe effect of the construction of the new factory in Gualeguaychú has been included in the calculation of expected cash flows. The factory was completed in 2016. Also, the rate of growth applied for the period 2017-2021 and the terminal period takes into account the expected rate of inflation. Price increases on a level with expected inflation are assumed to be realisable. Growth during the terminal period has been
50H A R T M A N N A N N U A L R E P O R T 2 0 1 6
HIGHLIGHTS · BUSINESS · GOVERNANCE · FINANCIALS
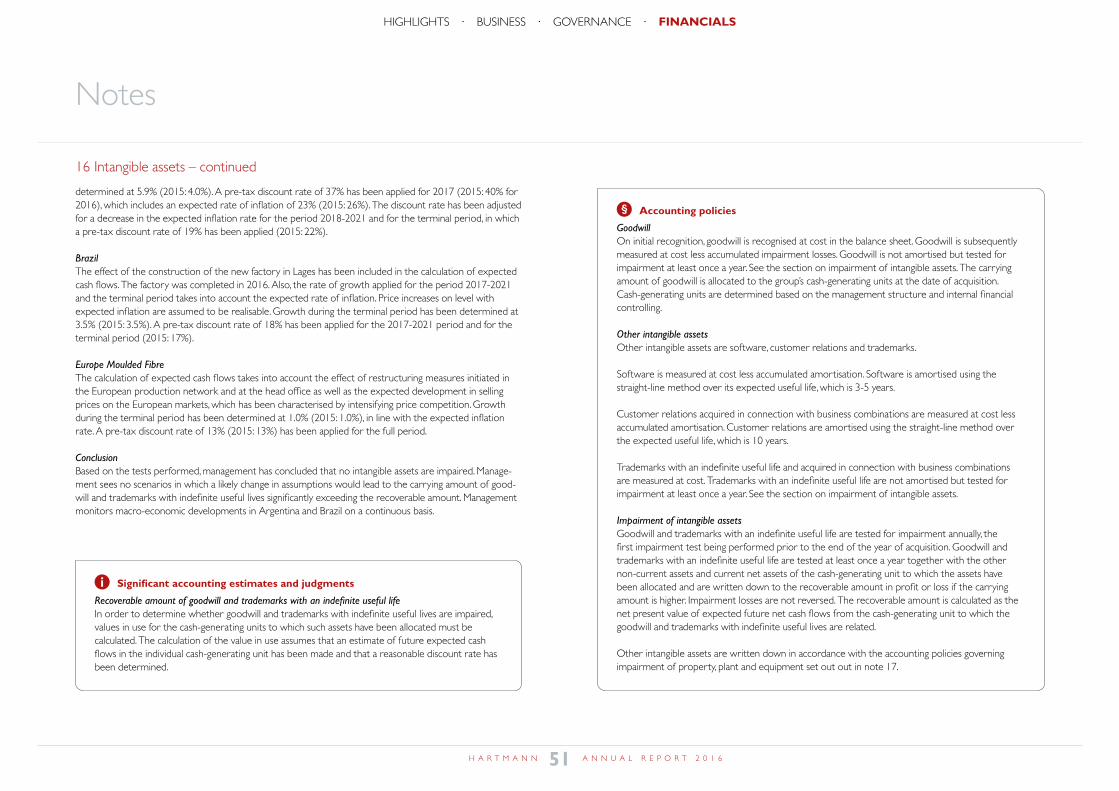
Notes
16 Intangible assets – continued
determined at 5.9% (2015: 4.0%). A pre-tax discount rate of 37% has been applied for 2017 (2015: 40% for 2016), which includes an expected rate of inflation of 23% (2015: 26%). The discount rate has been adjusted for a decrease in the expected inflation rate for the period 2018-2021 and for the terminal period, in which a pre-tax discount rate of 19% has been applied (2015: 22%).
BrazilThe effect of the construction of the new factory in Lages has been included in the calculation of expected cash flows. The factory was completed in 2016. Also, the rate of growth applied for the period 2017-2021 and the terminal period takes into account the expected rate of inflation. Price increases on level with expected inflation are assumed to be realisable. Growth during the terminal period has been determined at 3.5% (2015: 3.5%). A pre-tax discount rate of 18% has been applied for the 2017-2021 period and for the terminal period (2015: 17%).
Europe Moulded FibreThe calculation of expected cash flows takes into account the effect of restructuring measures initiated in the European production network and at the head office as well as the expected development in selling prices on the European markets, which has been characterised by intensifying price competition. Growth during the terminal period has been determined at 1.0% (2015: 1.0%), in line with the expected inflation rate. A pre-tax discount rate of 13% (2015: 13%) has been applied for the full period.
ConclusionBased on the tests performed, management has concluded that no intangible assets are impaired. Manage-ment sees no scenarios in which a likely change in assumptions would lead to the carrying amount of good-will and trademarks with indefinite useful lives significantly exceeding the recoverable amount. Management monitors macro-economic developments in Argentina and Brazil on a continuous basis.
Accounting policies
GoodwillOn initial recognition, goodwill is recognised at cost in the balance sheet. Goodwill is subsequently measured at cost less accumulated impairment losses. Goodwill is not amortised but tested for impairment at least once a year. See the section on impairment of intangible assets. The carrying amount of goodwill is allocated to the group’s cash-generating units at the date of acquisition. Cash-generating units are determined based on the management structure and internal financial controlling.
Other intangible assetsOther intangible assets are software, customer relations and trademarks.
Software is measured at cost less accumulated amortisation. Software is amortised using the straight-line method over its expected useful life, which is 3-5 years.
Customer relations acquired in connection with business combinations are measured at cost less accumulated amortisation. Customer relations are amortised using the straight-line method over the expected useful life, which is 10 years.
Trademarks with an indefinite useful life and acquired in connection with business combinations are measured at cost. Trademarks with an indefinite useful life are not amortised but tested for impairment at least once a year. See the section on impairment of intangible assets.
Impairment of intangible assetsGoodwill and trademarks with an indefinite useful life are tested for impairment annually, the first impairment test being performed prior to the end of the year of acquisition. Goodwill and trademarks with an indefinite useful life are tested at least once a year together with the other non-current assets and current net assets of the cash-generating unit to which the assets have been allocated and are written down to the recoverable amount in profit or loss if the carrying amount is higher. Impairment losses are not reversed. The recoverable amount is calculated as the net present value of expected future net cash flows from the cash-generating unit to which the goodwill and trademarks with indefinite useful lives are related.
Other intangible assets are written down in accordance with the accounting policies governing impairment of property, plant and equipment set out out in note 17.
Significant accounting estimates and judgments
Recoverable amount of goodwill and trademarks with an indefinite useful lifeIn order to determine whether goodwill and trademarks with indefinite useful lives are impaired, values in use for the cash-generating units to which such assets have been allocated must be calculated. The calculation of the value in use assumes that an estimate of future expected cash flows in the individual cash-generating unit has been made and that a reasonable discount rate has been determined.
51H A R T M A N N A N N U A L R E P O R T 2 0 1 6
HIGHLIGHTS · BUSINESS · GOVERNANCE · FINANCIALS
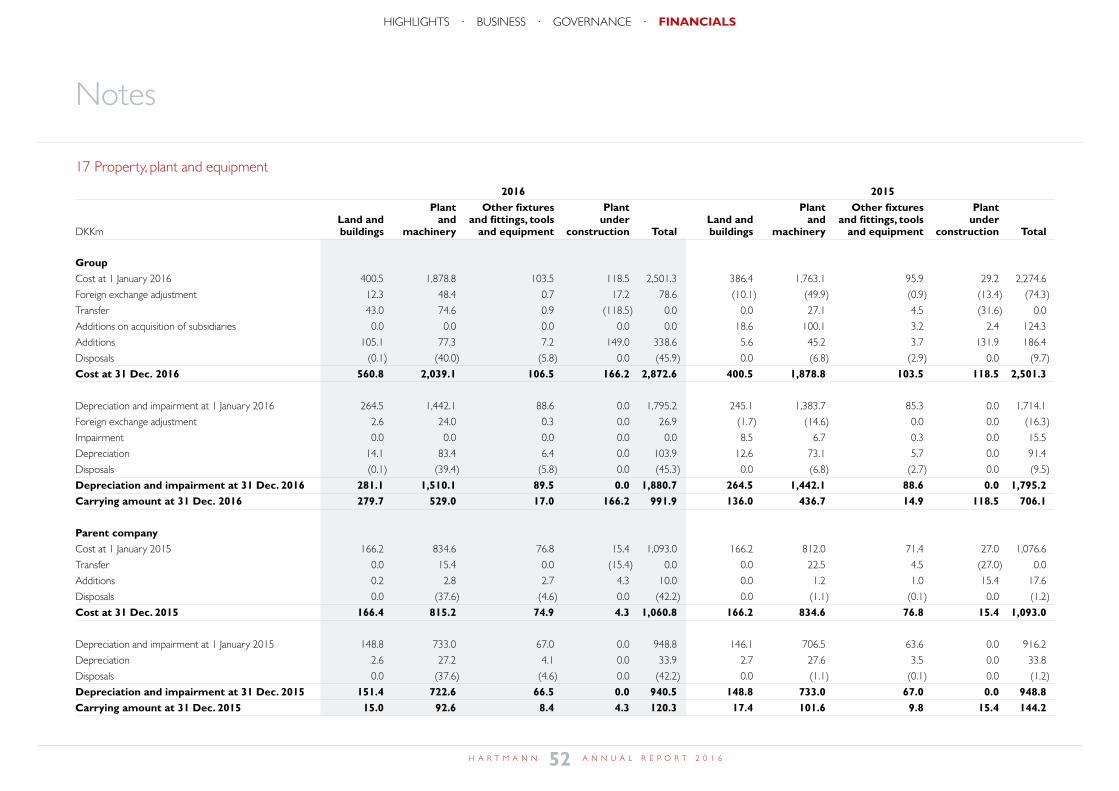
Notes
17 Property, plant and equipment
2016 2015 Plant Other fixtures Plant Plant Other fixtures Plant Land and and and fittings, tools under Land and and and fittings, tools under DKKm buildings machinery and equipment construction Total buildings machinery and equipment construction Total
GroupCost at 1 January 2016 400.5 1,878.8 103.5 118.5 2,501.3 386.4 1,763.1 95.9 29.2 2,274.6
Foreign exchange adjustment 12.3 48.4 0.7 17.2 78.6 (10.1) (49.9) (0.9) (13.4) (74.3)
Transfer 43.0 74.6 0.9 (118.5) 0.0 0.0 27.1 4.5 (31.6) 0.0
Additions on acquisition of subsidiaries 0.0 0.0 0.0 0.0 0.0 18.6 100.1 3.2 2.4 124.3
Additions 105.1 77.3 7.2 149.0 338.6 5.6 45.2 3.7 131.9 186.4
Disposals (0.1) (40.0) (5.8) 0.0 (45.9) 0.0 (6.8) (2.9) 0.0 (9.7)
Cost at 31 Dec. 2016 560.8 2,039.1 106.5 166.2 2,872.6 400.5 1,878.8 103.5 118.5 2,501.3
Depreciation and impairment at 1 January 2016 264.5 1,442.1 88.6 0.0 1,795.2 245.1 1,383.7 85.3 0.0 1,714.1
Foreign exchange adjustment 2.6 24.0 0.3 0.0 26.9 (1.7) (14.6) 0.0 0.0 (16.3)
Impairment 0.0 0.0 0.0 0.0 0.0 8.5 6.7 0.3 0.0 15.5
Depreciation 14.1 83.4 6.4 0.0 103.9 12.6 73.1 5.7 0.0 91.4
Disposals (0.1) (39.4) (5.8) 0.0 (45.3) 0.0 (6.8) (2.7) 0.0 (9.5)
Depreciation and impairment at 31 Dec. 2016 281.1 1,510.1 89.5 0.0 1,880.7 264.5 1,442.1 88.6 0.0 1,795.2Carrying amount at 31 Dec. 2016 279.7 529.0 17.0 166.2 991.9 136.0 436.7 14.9 118.5 706.1
Parent companyCost at 1 January 2015 166.2 834.6 76.8 15.4 1,093.0 166.2 812.0 71.4 27.0 1,076.6
Transfer 0.0 15.4 0.0 (15.4) 0.0 0.0 22.5 4.5 (27.0) 0.0
Additions 0.2 2.8 2.7 4.3 10.0 0.0 1.2 1.0 15.4 17.6
Disposals 0.0 (37.6) (4.6) 0.0 (42.2) 0.0 (1.1) (0.1) 0.0 (1.2)
Cost at 31 Dec. 2015 166.4 815.2 74.9 4.3 1,060.8 166.2 834.6 76.8 15.4 1,093.0
Depreciation and impairment at 1 January 2015 148.8 733.0 67.0 0.0 948.8 146.1 706.5 63.6 0.0 916.2
Depreciation 2.6 27.2 4.1 0.0 33.9 2.7 27.6 3.5 0.0 33.8
Disposals 0.0 (37.6) (4.6) 0.0 (42.2) 0.0 (1.1) (0.1) 0.0 (1.2)
Depreciation and impairment at 31 Dec. 2015 151.4 722.6 66.5 0.0 940.5 148.8 733.0 67.0 0.0 948.8Carrying amount at 31 Dec. 2015 15.0 92.6 8.4 4.3 120.3 17.4 101.6 9.8 15.4 144.2
52H A R T M A N N A N N U A L R E P O R T 2 0 1 6
HIGHLIGHTS · BUSINESS · GOVERNANCE · FINANCIALSnote 17
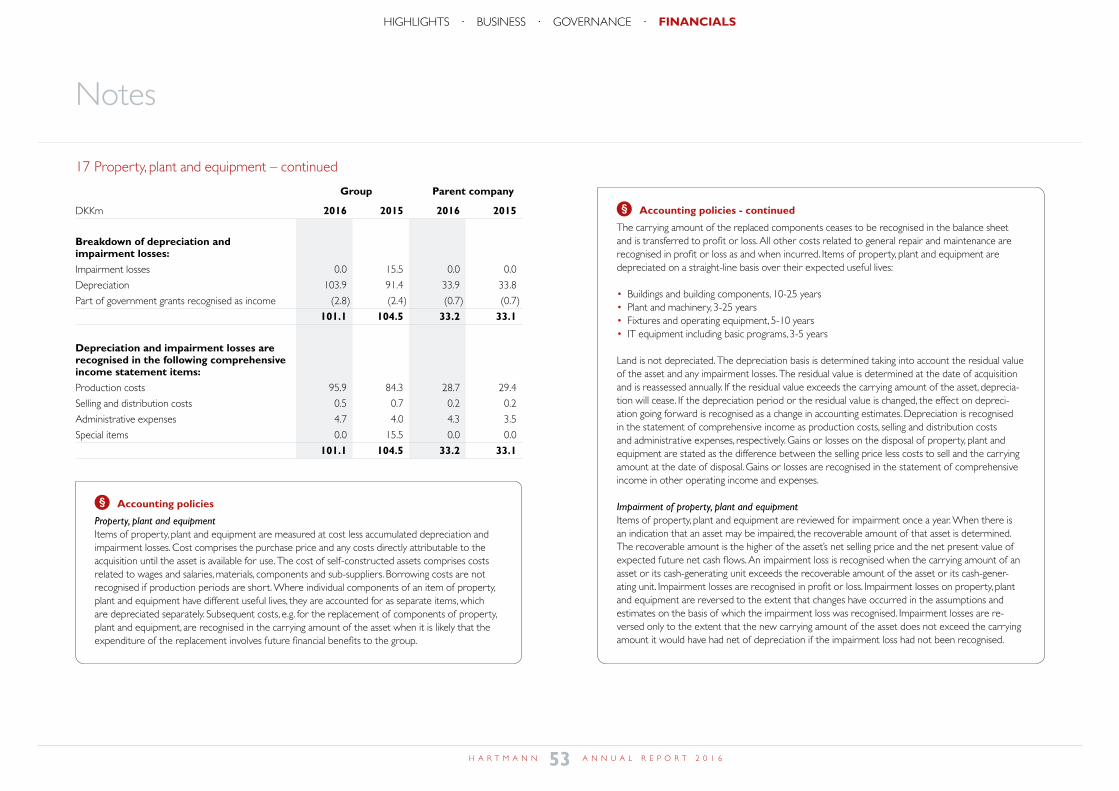
Notes
17 Property, plant and equipment – continued
Group Parent company
DKKm 2016 2015 2016 2015
Breakdown of depreciation and impairment losses:Impairment losses 0.0 15.5 0.0 0.0
Depreciation 103.9 91.4 33.9 33.8
Part of government grants recognised as income (2.8) (2.4) (0.7) (0.7)
101.1 104.5 33.2 33.1
Depreciation and impairment losses are recognised in the following comprehensive income statement items:Production costs 95.9 84.3 28.7 29.4
Selling and distribution costs 0.5 0.7 0.2 0.2
Administrative expenses 4.7 4.0 4.3 3.5
Special items 0.0 15.5 0.0 0.0
101.1 104.5 33.2 33.1
Accounting policies
Property, plant and equipmentItems of property, plant and equipment are measured at cost less accumulated depreciation and impairment losses. Cost comprises the purchase price and any costs directly attributable to the acquisition until the asset is available for use. The cost of self-constructed assets comprises costs related to wages and salaries, materials, components and sub-suppliers. Borrowing costs are not recognised if production periods are short. Where individual components of an item of property, plant and equipment have different useful lives, they are accounted for as separate items, which are depreciated separately. Subsequent costs, e.g. for the replacement of components of property, plant and equipment, are recognised in the carrying amount of the asset when it is likely that the expenditure of the replacement involves future financial benefits to the group.
Accounting policies - continued
The carrying amount of the replaced components ceases to be recognised in the balance sheet and is transferred to profit or loss. All other costs related to general repair and maintenance are recognised in profit or loss as and when incurred. Items of property, plant and equipment are depreciated on a straight-line basis over their expected useful lives:
• Buildings and building components, 10-25 years• Plant and machinery, 3-25 years• Fixtures and operating equipment, 5-10 years• IT equipment including basic programs, 3-5 years
Land is not depreciated. The depreciation basis is determined taking into account the residual value of the asset and any impairment losses. The residual value is determined at the date of acquisition and is reassessed annually. If the residual value exceeds the carrying amount of the asset, deprecia-tion will cease. If the depreciation period or the residual value is changed, the effect on depreci-ation going forward is recognised as a change in accounting estimates. Depreciation is recognised in the statement of comprehensive income as production costs, selling and distribution costs and administrative expenses, respectively. Gains or losses on the disposal of property, plant and equipment are stated as the difference between the selling price less costs to sell and the carrying amount at the date of disposal. Gains or losses are recognised in the statement of comprehensive income in other operating income and expenses.
Impairment of property, plant and equipmentItems of property, plant and equipment are reviewed for impairment once a year. When there is an indication that an asset may be impaired, the recoverable amount of that asset is determined. The recoverable amount is the higher of the asset’s net selling price and the net present value of expected future net cash flows. An impairment loss is recognised when the carrying amount of an asset or its cash-generating unit exceeds the recoverable amount of the asset or its cash-gener-ating unit. Impairment losses are recognised in profit or loss. Impairment losses on property, plant and equipment are reversed to the extent that changes have occurred in the assumptions and estimates on the basis of which the impairment loss was recognised. Impairment losses are re-versed only to the extent that the new carrying amount of the asset does not exceed the carrying amount it would have had net of depreciation if the impairment loss had not been recognised.
53H A R T M A N N A N N U A L R E P O R T 2 0 1 6
HIGHLIGHTS · BUSINESS · GOVERNANCE · FINANCIALS
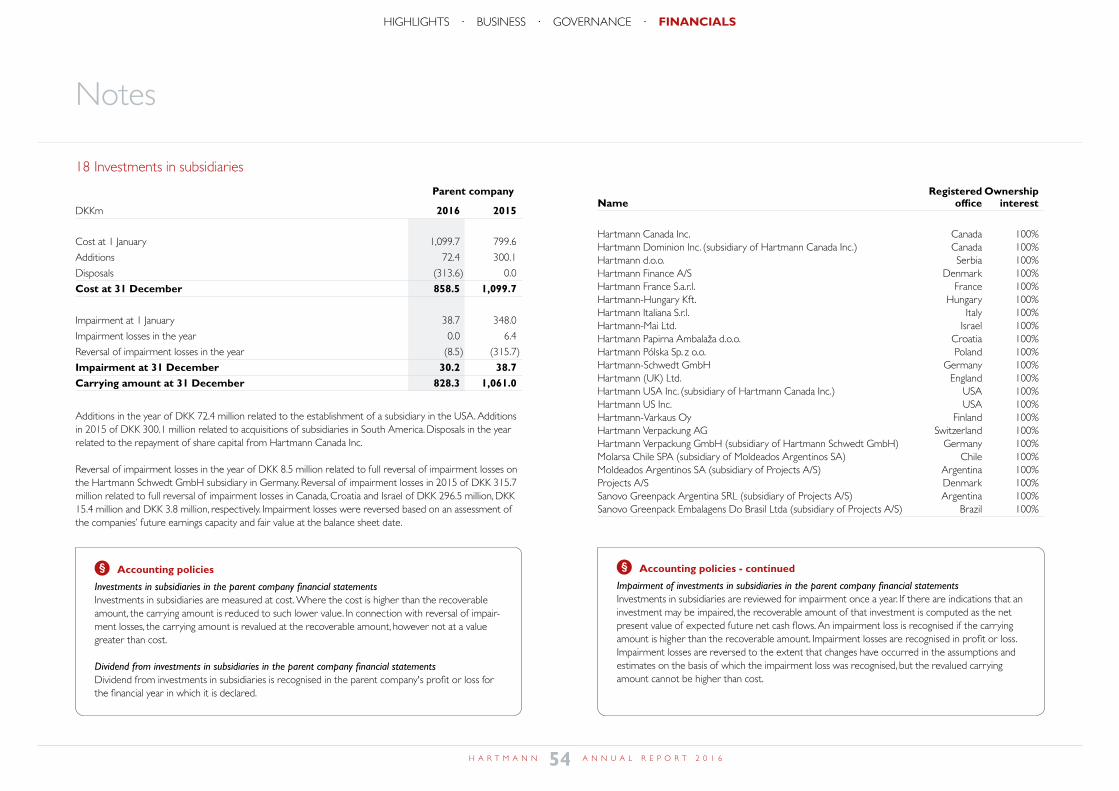
Notes
18 Investments in subsidiaries – cont’d
Registered Ownership Name office interest
Hartmann Canada Inc. Canada 100%Hartmann Dominion Inc. (subsidiary of Hartmann Canada Inc.) Canada 100%Hartmann d.o.o. Serbia 100%Hartmann Finance A/S Denmark 100%Hartmann France S.a.r.l. France 100%Hartmann-Hungary Kft. Hungary 100%Hartmann Italiana S.r.l. Italy 100%Hartmann-Mai Ltd. Israel 100%Hartmann Papirna Ambalaža d.o.o. Croatia 100%Hartmann Pólska Sp. z o.o. Poland 100%Hartmann-Schwedt GmbH Germany 100%Hartmann (UK) Ltd. England 100%Hartmann USA Inc. (subsidiary of Hartmann Canada Inc.) USA 100%Hartmann US Inc. USA 100%Hartmann-Varkaus Oy Finland 100%Hartmann Verpackung AG Switzerland 100%Hartmann Verpackung GmbH (subsidiary of Hartmann Schwedt GmbH) Germany 100%Molarsa Chile SPA (subsidiary of Moldeados Argentinos SA) Chile 100%Moldeados Argentinos SA (subsidiary of Projects A/S) Argentina 100%Projects A/S Denmark 100%Sanovo Greenpack Argentina SRL (subsidiary of Projects A/S) Argentina 100%Sanovo Greenpack Embalagens Do Brasil Ltda (subsidiary of Projects A/S) Brazil 100%
18 Investments in subsidiaries
Parent company
DKKm 2016 2015
Cost at 1 January 1,099.7 799.6
Additions 72.4 300.1
Disposals (313.6) 0.0
Cost at 31 December 858.5 1,099.7
Impairment at 1 January 38.7 348.0
Impairment losses in the year 0.0 6.4
Reversal of impairment losses in the year (8.5) (315.7)
Impairment at 31 December 30.2 38.7Carrying amount at 31 December 828.3 1,061.0
Additions in the year of DKK 72.4 million related to the establishment of a subsidiary in the USA. Additions in 2015 of DKK 300.1 million related to acquisitions of subsidiaries in South America. Disposals in the year related to the repayment of share capital from Hartmann Canada Inc.
Reversal of impairment losses in the year of DKK 8.5 million related to full reversal of impairment losses on the Hartmann Schwedt GmbH subsidiary in Germany. Reversal of impairment losses in 2015 of DKK 315.7 million related to full reversal of impairment losses in Canada, Croatia and Israel of DKK 296.5 million, DKK 15.4 million and DKK 3.8 million, respectively. Impairment losses were reversed based on an assessment of the companies’ future earnings capacity and fair value at the balance sheet date.
Accounting policies
Investments in subsidiaries in the parent company financial statementsInvestments in subsidiaries are measured at cost. Where the cost is higher than the recoverable amount, the carrying amount is reduced to such lower value. In connection with reversal of impair-ment losses, the carrying amount is revalued at the recoverable amount, however not at a value greater than cost.
Dividend from investments in subsidiaries in the parent company financial statementsDividend from investments in subsidiaries is recognised in the parent company's profit or loss for the financial year in which it is declared.
Accounting policies - continued
Impairment of investments in subsidiaries in the parent company financial statementsInvestments in subsidiaries are reviewed for impairment once a year. If there are indications that an investment may be impaired, the recoverable amount of that investment is computed as the net present value of expected future net cash flows. An impairment loss is recognised if the carrying amount is higher than the recoverable amount. Impairment losses are recognised in profit or loss. Impairment losses are reversed to the extent that changes have occurred in the assumptions and estimates on the basis of which the impairment loss was recognised, but the revalued carrying amount cannot be higher than cost.
54H A R T M A N N A N N U A L R E P O R T 2 0 1 6
HIGHLIGHTS · BUSINESS · GOVERNANCE · FINANCIALSnote 18
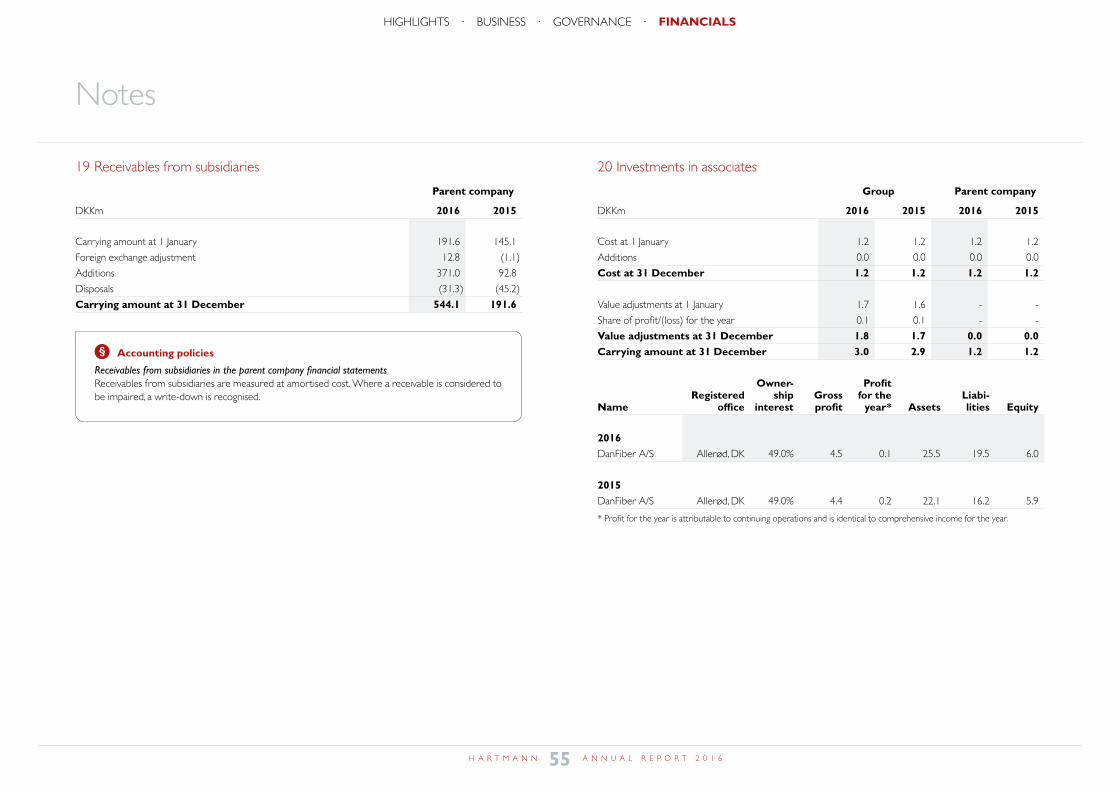
Notes
20 Investments in associates
Group Parent company
DKKm 2016 2015 2016 2015
Cost at 1 January 1.2 1.2 1.2 1.2
Additions 0.0 0.0 0.0 0.0
Cost at 31 December 1.2 1.2 1.2 1.2
Value adjustments at 1 January 1.7 1.6 - -
Share of profit/(loss) for the year 0.1 0.1 - -
Value adjustments at 31 December 1.8 1.7 0.0 0.0Carrying amount at 31 December 3.0 2.9 1.2 1.2
Owner- Profit Registered ship Gross for the Liabi- Name office interest profit year* Assets lities Equity
2016DanFiber A/S Allerød, DK 49.0% 4.5 0.1 25.5 19.5 6.0
2015DanFiber A/S Allerød, DK 49.0% 4.4 0.2 22.1 16.2 5.9
* Profit for the year is attributable to continuing operations and is identical to comprehensive income for the year.
19 Receivables from subsidiaries
Parent company
DKKm 2016 2015
Carrying amount at 1 January 191.6 145.1
Foreign exchange adjustment 12.8 (1.1)
Additions 371.0 92.8
Disposals (31.3) (45.2)
Carrying amount at 31 December 544.1 191.6
Accounting policies
Receivables from subsidiaries in the parent company financial statementsReceivables from subsidiaries are measured at amortised cost. Where a receivable is considered to be impaired, a write-down is recognised.
55H A R T M A N N A N N U A L R E P O R T 2 0 1 6
HIGHLIGHTS · BUSINESS · GOVERNANCE · FINANCIALSnote 19+20
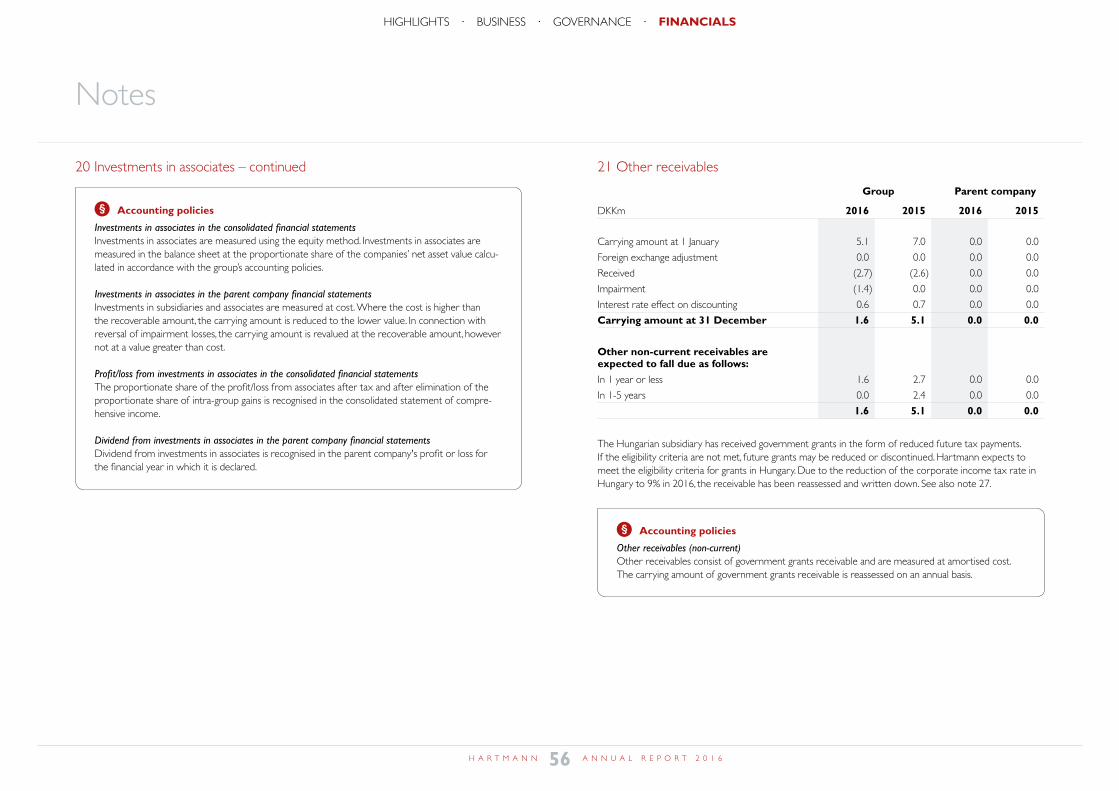
Notes
21 Other receivables
Group Parent company
DKKm 2016 2015 2016 2015
Carrying amount at 1 January 5.1 7.0 0.0 0.0
Foreign exchange adjustment 0.0 0.0 0.0 0.0
Received (2.7) (2.6) 0.0 0.0
Impairment (1.4) 0.0 0.0 0.0
Interest rate effect on discounting 0.6 0.7 0.0 0.0
Carrying amount at 31 December 1.6 5.1 0.0 0.0
Other non-current receivables are expected to fall due as follows:In 1 year or less 1.6 2.7 0.0 0.0
In 1-5 years 0.0 2.4 0.0 0.0
1.6 5.1 0.0 0.0
The Hungarian subsidiary has received government grants in the form of reduced future tax payments. If the eligibility criteria are not met, future grants may be reduced or discontinued. Hartmann expects to meet the eligibility criteria for grants in Hungary. Due to the reduction of the corporate income tax rate in Hungary to 9% in 2016, the receivable has been reassessed and written down. See also note 27.
20 Investments in associates – continued
Accounting policies
Investments in associates in the consolidated financial statementsInvestments in associates are measured using the equity method. Investments in associates are measured in the balance sheet at the proportionate share of the companies’ net asset value calcu-lated in accordance with the group’s accounting policies.
Investments in associates in the parent company financial statementsInvestments in subsidiaries and associates are measured at cost. Where the cost is higher than the recoverable amount, the carrying amount is reduced to the lower value. In connection with reversal of impairment losses, the carrying amount is revalued at the recoverable amount, however not at a value greater than cost.
Profit/loss from investments in associates in the consolidated financial statementsThe proportionate share of the profit/loss from associates after tax and after elimination of the proportionate share of intra-group gains is recognised in the consolidated statement of compre-hensive income.
Dividend from investments in associates in the parent company financial statementsDividend from investments in associates is recognised in the parent company's profit or loss for the financial year in which it is declared.
Accounting policies
Other receivables (non-current)Other receivables consist of government grants receivable and are measured at amortised cost. The carrying amount of government grants receivable is reassessed on an annual basis.
56H A R T M A N N A N N U A L R E P O R T 2 0 1 6
HIGHLIGHTS · BUSINESS · GOVERNANCE · FINANCIALSnote 21
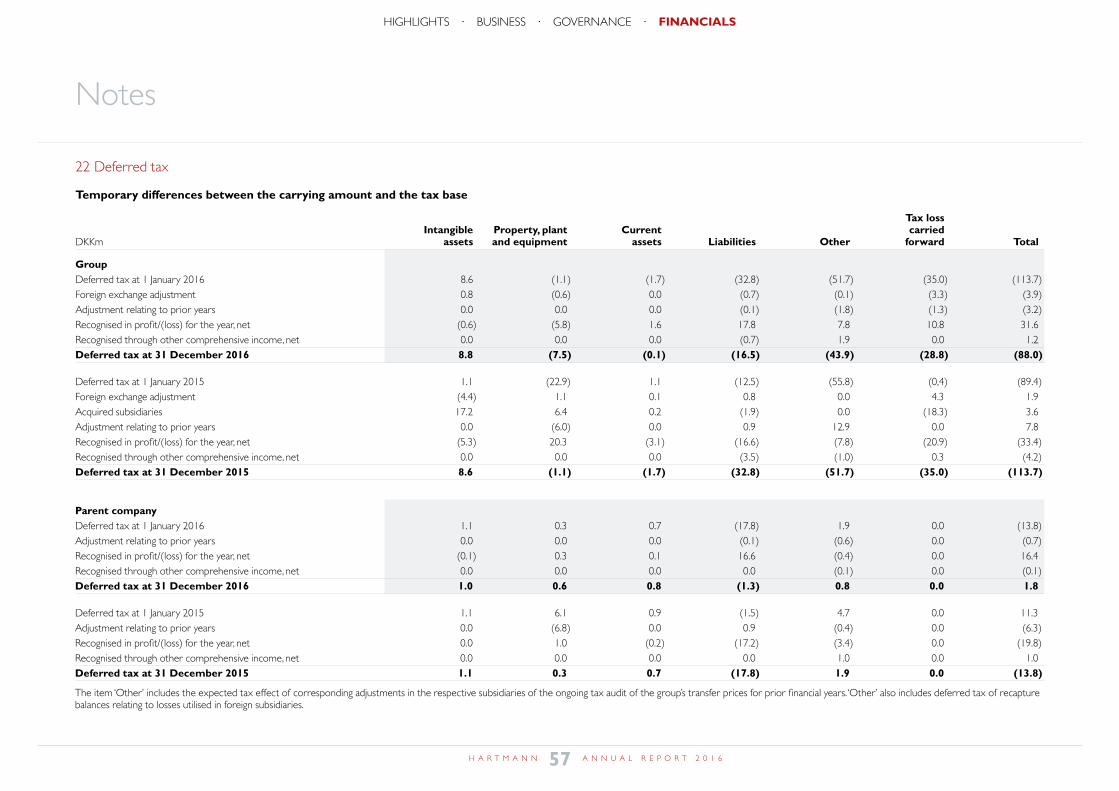
Notes
22 Deferred tax
Temporary differences between the carrying amount and the tax base
Tax loss Intangible Property, plant Current carried DKKm assets and equipment assets Liabilities Other forward Total
GroupDeferred tax at 1 January 2016 8.6 (1.1) (1.7) (32.8) (51.7) (35.0) (113.7)Foreign exchange adjustment 0.8 (0.6) 0.0 (0.7) (0.1) (3.3) (3.9)Adjustment relating to prior years 0.0 0.0 0.0 (0.1) (1.8) (1.3) (3.2)Recognised in profit/(loss) for the year, net (0.6) (5.8) 1.6 17.8 7.8 10.8 31.6Recognised through other comprehensive income, net 0.0 0.0 0.0 (0.7) 1.9 0.0 1.2Deferred tax at 31 December 2016 8.8 (7.5) (0.1) (16.5) (43.9) (28.8) (88.0)
Deferred tax at 1 January 2015 1.1 (22.9) 1.1 (12.5) (55.8) (0,4) (89.4)Foreign exchange adjustment (4.4) 1.1 0.1 0.8 0.0 4.3 1.9Acquired subsidiaries 17.2 6.4 0.2 (1.9) 0.0 (18.3) 3.6Adjustment relating to prior years 0.0 (6.0) 0.0 0.9 12.9 0.0 7.8Recognised in profit/(loss) for the year, net (5.3) 20.3 (3.1) (16.6) (7.8) (20.9) (33.4)Recognised through other comprehensive income, net 0.0 0.0 0.0 (3.5) (1.0) 0.3 (4.2)Deferred tax at 31 December 2015 8.6 (1.1) (1.7) (32.8) (51.7) (35.0) (113.7)
Parent companyDeferred tax at 1 January 2016 1.1 0.3 0.7 (17.8) 1.9 0.0 (13.8)Adjustment relating to prior years 0.0 0.0 0.0 (0.1) (0.6) 0.0 (0.7)Recognised in profit/(loss) for the year, net (0.1) 0.3 0.1 16.6 (0.4) 0.0 16.4Recognised through other comprehensive income, net 0.0 0.0 0.0 0.0 (0.1) 0.0 (0.1)Deferred tax at 31 December 2016 1.0 0.6 0.8 (1.3) 0.8 0.0 1.8
Deferred tax at 1 January 2015 1.1 6.1 0.9 (1.5) 4.7 0.0 11.3Adjustment relating to prior years 0.0 (6.8) 0.0 0.9 (0.4) 0.0 (6.3)Recognised in profit/(loss) for the year, net 0.0 1.0 (0.2) (17.2) (3.4) 0.0 (19.8)Recognised through other comprehensive income, net 0.0 0.0 0.0 0.0 1.0 0.0 1.0Deferred tax at 31 December 2015 1.1 0.3 0.7 (17.8) 1.9 0.0 (13.8)
The item ‘Other’ includes the expected tax effect of corresponding adjustments in the respective subsidiaries of the ongoing tax audit of the group’s transfer prices for prior financial years. ‘Other’ also includes deferred tax of recapture balances relating to losses utilised in foreign subsidiaries.
57H A R T M A N N A N N U A L R E P O R T 2 0 1 6
HIGHLIGHTS · BUSINESS · GOVERNANCE · FINANCIALSnote 22
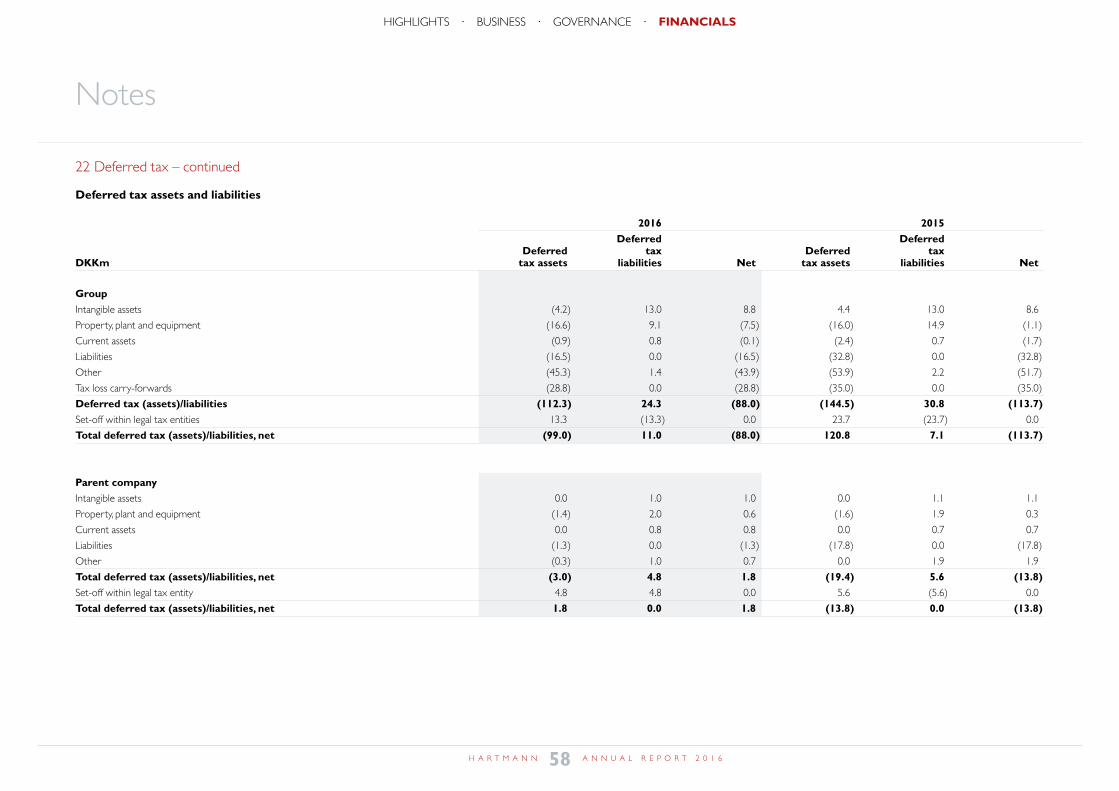
Notes
22 Deferred tax – continued
Deferred tax assets and liabilities
2016 2015 Deferred Deferred Deferred tax Deferred tax DKKm tax assets liabilities Net tax assets liabilities Net
GroupIntangible assets (4.2) 13.0 8.8 4.4 13.0 8.6
Property, plant and equipment (16.6) 9.1 (7.5) (16.0) 14.9 (1.1)
Current assets (0.9) 0.8 (0.1) (2.4) 0.7 (1.7)
Liabilities (16.5) 0.0 (16.5) (32.8) 0.0 (32.8)
Other (45.3) 1.4 (43.9) (53.9) 2.2 (51.7)
Tax loss carry-forwards (28.8) 0.0 (28.8) (35.0) 0.0 (35.0)
Deferred tax (assets)/liabilities (112.3) 24.3 (88.0) (144.5) 30.8 (113.7)Set-off within legal tax entities 13.3 (13.3) 0.0 23.7 (23.7) 0.0
Total deferred tax (assets)/liabilities, net (99.0) 11.0 (88.0) 120.8 7.1 (113.7)
Parent companyIntangible assets 0.0 1.0 1.0 0.0 1.1 1.1
Property, plant and equipment (1.4) 2.0 0.6 (1.6) 1.9 0.3
Current assets 0.0 0.8 0.8 0.0 0.7 0.7
Liabilities (1.3) 0.0 (1.3) (17.8) 0.0 (17.8)
Other (0.3) 1.0 0.7 0.0 1.9 1.9
Total deferred tax (assets)/liabilities, net (3.0) 4.8 1.8 (19.4) 5.6 (13.8)Set-off within legal tax entity 4.8 4.8 0.0 5.6 (5.6) 0.0
Total deferred tax (assets)/liabilities, net 1.8 0.0 1.8 (13.8) 0.0 (13.8)
58H A R T M A N N A N N U A L R E P O R T 2 0 1 6
HIGHLIGHTS · BUSINESS · GOVERNANCE · FINANCIALS
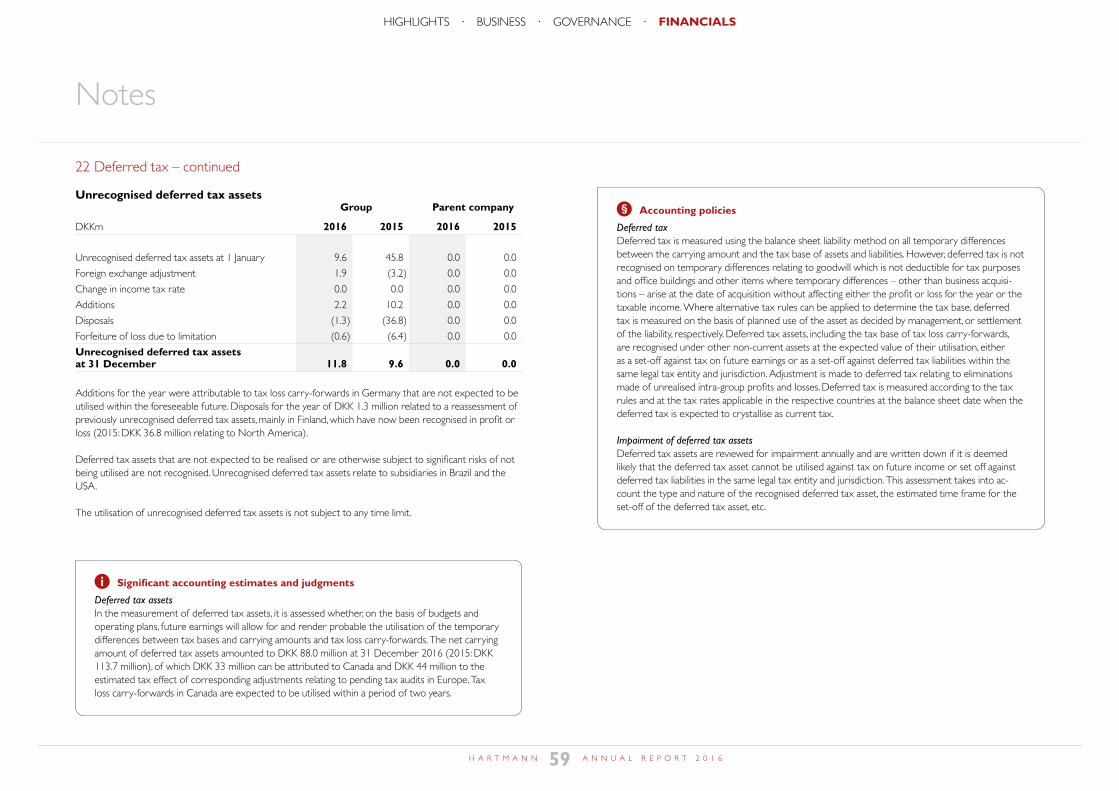
Notes
22 Deferred tax – continued
Unrecognised deferred tax assets Group Parent company
DKKm 2016 2015 2016 2015
Unrecognised deferred tax assets at 1 January 9.6 45.8 0.0 0.0
Foreign exchange adjustment 1.9 (3.2) 0.0 0.0
Change in income tax rate 0.0 0.0 0.0 0.0
Additions 2.2 10.2 0.0 0.0
Disposals (1.3) (36.8) 0.0 0.0
Forfeiture of loss due to limitation (0.6) (6.4) 0.0 0.0
Unrecognised deferred tax assets at 31 December 11.8 9.6 0.0 0.0
Additions for the year were attributable to tax loss carry-forwards in Germany that are not expected to be utilised within the foreseeable future. Disposals for the year of DKK 1.3 million related to a reassessment of previously unrecognised deferred tax assets, mainly in Finland, which have now been recognised in profit or loss (2015: DKK 36.8 million relating to North America).
Deferred tax assets that are not expected to be realised or are otherwise subject to significant risks of not being utilised are not recognised. Unrecognised deferred tax assets relate to subsidiaries in Brazil and the USA.
The utilisation of unrecognised deferred tax assets is not subject to any time limit.
Accounting policies
Deferred taxDeferred tax is measured using the balance sheet liability method on all temporary differences between the carrying amount and the tax base of assets and liabilities. However, deferred tax is not recognised on temporary differences relating to goodwill which is not deductible for tax purposes and office buildings and other items where temporary differences – other than business acquisi-tions – arise at the date of acquisition without affecting either the profit or loss for the year or the taxable income. Where alternative tax rules can be applied to determine the tax base, deferred tax is measured on the basis of planned use of the asset as decided by management, or settlement of the liability, respectively. Deferred tax assets, including the tax base of tax loss carry-forwards, are recognised under other non-current assets at the expected value of their utilisation, either as a set-off against tax on future earnings or as a set-off against deferred tax liabilities within the same legal tax entity and jurisdiction. Adjustment is made to deferred tax relating to eliminations made of unrealised intra-group profits and losses. Deferred tax is measured according to the tax rules and at the tax rates applicable in the respective countries at the balance sheet date when the deferred tax is expected to crystallise as current tax.
Impairment of deferred tax assetsDeferred tax assets are reviewed for impairment annually and are written down if it is deemed likely that the deferred tax asset cannot be utilised against tax on future income or set off against deferred tax liabilities in the same legal tax entity and jurisdiction. This assessment takes into ac-count the type and nature of the recognised deferred tax asset, the estimated time frame for the set-off of the deferred tax asset, etc.
Significant accounting estimates and judgments
Deferred tax assetsIn the measurement of deferred tax assets, it is assessed whether, on the basis of budgets and operating plans, future earnings will allow for and render probable the utilisation of the temporary differences between tax bases and carrying amounts and tax loss carry-forwards. The net carrying amount of deferred tax assets amounted to DKK 88.0 million at 31 December 2016 (2015: DKK 113.7 million), of which DKK 33 million can be attributed to Canada and DKK 44 million to the estimated tax effect of corresponding adjustments relating to pending tax audits in Europe. Tax loss carry-forwards in Canada are expected to be utilised within a period of two years.
59H A R T M A N N A N N U A L R E P O R T 2 0 1 6
HIGHLIGHTS · BUSINESS · GOVERNANCE · FINANCIALS
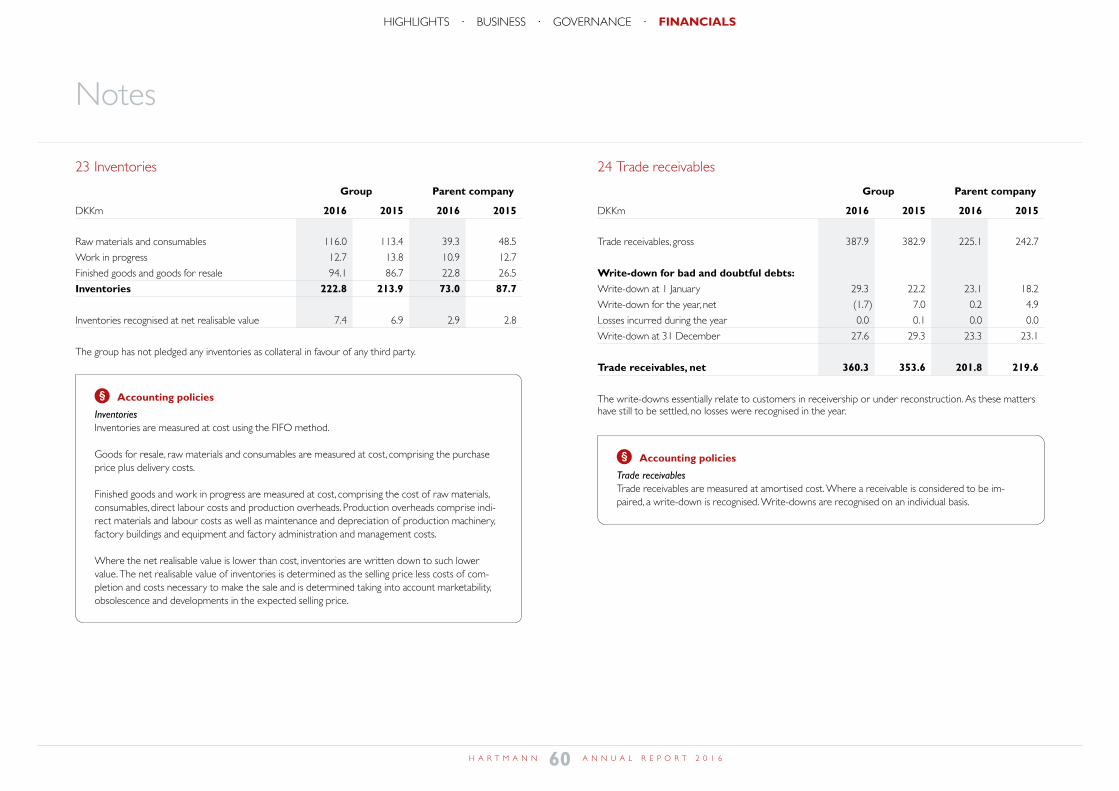
Notes
Accounting policies
Trade receivablesTrade receivables are measured at amortised cost. Where a receivable is considered to be im-paired, a write-down is recognised. Write-downs are recognised on an individual basis.
24 Trade receivables
Group Parent company
DKKm 2016 2015 2016 2015
Trade receivables, gross 387.9 382.9 225.1 242.7
Write-down for bad and doubtful debts: Write-down at 1 January 29.3 22.2 23.1 18.2
Write-down for the year, net (1.7) 7.0 0.2 4.9
Losses incurred during the year 0.0 0.1 0.0 0.0
Write-down at 31 December 27.6 29.3 23.3 23.1
Trade receivables, net 360.3 353.6 201.8 219.6
The write-downs essentially relate to customers in receivership or under reconstruction. As these matters have still to be settled, no losses were recognised in the year.
23 Inventories
Group Parent company
DKKm 2016 2015 2016 2015
Raw materials and consumables 116.0 113.4 39.3 48.5
Work in progress 12.7 13.8 10.9 12.7
Finished goods and goods for resale 94.1 86.7 22.8 26.5
Inventories 222.8 213.9 73.0 87.7
Inventories recognised at net realisable value 7.4 6.9 2.9 2.8
The group has not pledged any inventories as collateral in favour of any third party.
Accounting policies
InventoriesInventories are measured at cost using the FIFO method.
Goods for resale, raw materials and consumables are measured at cost, comprising the purchase price plus delivery costs.
Finished goods and work in progress are measured at cost, comprising the cost of raw materials, consumables, direct labour costs and production overheads. Production overheads comprise indi-rect materials and labour costs as well as maintenance and depreciation of production machinery, factory buildings and equipment and factory administration and management costs.
Where the net realisable value is lower than cost, inventories are written down to such lower value. The net realisable value of inventories is determined as the selling price less costs of com-pletion and costs necessary to make the sale and is determined taking into account marketability, obsolescence and developments in the expected selling price.
60H A R T M A N N A N N U A L R E P O R T 2 0 1 6
HIGHLIGHTS · BUSINESS · GOVERNANCE · FINANCIALSnote 23+24
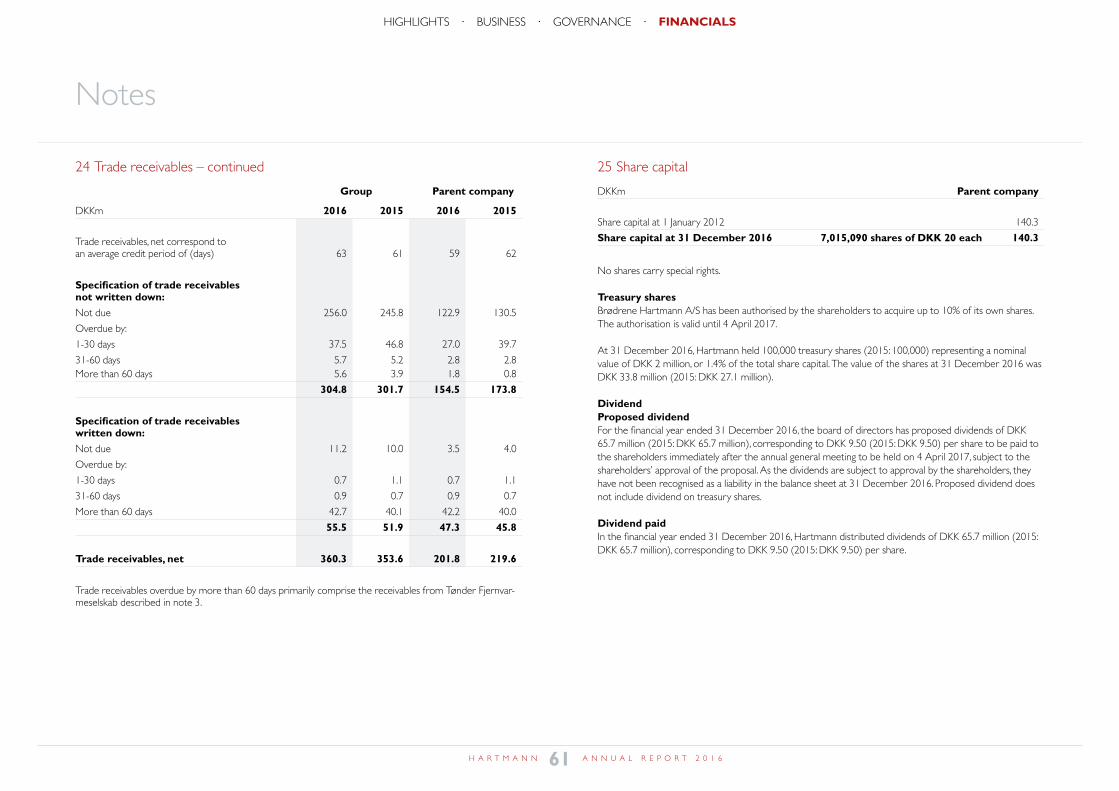
Notes
24 Trade receivables – continued
Group Parent company
DKKm 2016 2015 2016 2015
Trade receivables, net correspond to an average credit period of (days) 63 61 59 62
Specification of trade receivables not written down: Not due 256.0 245.8 122.9 130.5
Overdue by:
1-30 days 37.5 46.8 27.0 39.7
31-60 days 5.7 5.2 2.8 2.8More than 60 days 5.6 3.9 1.8 0.8
304.8 301.7 154.5 173.8
Specification of trade receivables written down:Not due 11.2 10.0 3.5 4.0
Overdue by:
1-30 days 0.7 1.1 0.7 1.1
31-60 days 0.9 0.7 0.9 0.7
More than 60 days 42.7 40.1 42.2 40.0
55.5 51.9 47.3 45.8
Trade receivables, net 360.3 353.6 201.8 219.6
Trade receivables overdue by more than 60 days primarily comprise the receivables from Tønder Fjernvar-meselskab described in note 3.
25 Share capital
DKKm Parent company
Share capital at 1 January 2012 140.3
Share capital at 31 December 2016 7,015,090 shares of DKK 20 each 140.3
No shares carry special rights.
Treasury sharesBrødrene Hartmann A/S has been authorised by the shareholders to acquire up to 10% of its own shares. The authorisation is valid until 4 April 2017.
At 31 December 2016, Hartmann held 100,000 treasury shares (2015: 100,000) representing a nominal value of DKK 2 million, or 1.4% of the total share capital. The value of the shares at 31 December 2016 was DKK 33.8 million (2015: DKK 27.1 million).
DividendProposed dividendFor the financial year ended 31 December 2016, the board of directors has proposed dividends of DKK 65.7 million (2015: DKK 65.7 million), corresponding to DKK 9.50 (2015: DKK 9.50) per share to be paid to the shareholders immediately after the annual general meeting to be held on 4 April 2017, subject to the shareholders’ approval of the proposal. As the dividends are subject to approval by the shareholders, they have not been recognised as a liability in the balance sheet at 31 December 2016. Proposed dividend does not include dividend on treasury shares.
Dividend paidIn the financial year ended 31 December 2016, Hartmann distributed dividends of DKK 65.7 million (2015: DKK 65.7 million), corresponding to DKK 9.50 (2015: DKK 9.50) per share.
61H A R T M A N N A N N U A L R E P O R T 2 0 1 6
HIGHLIGHTS · BUSINESS · GOVERNANCE · FINANCIALSnote 25
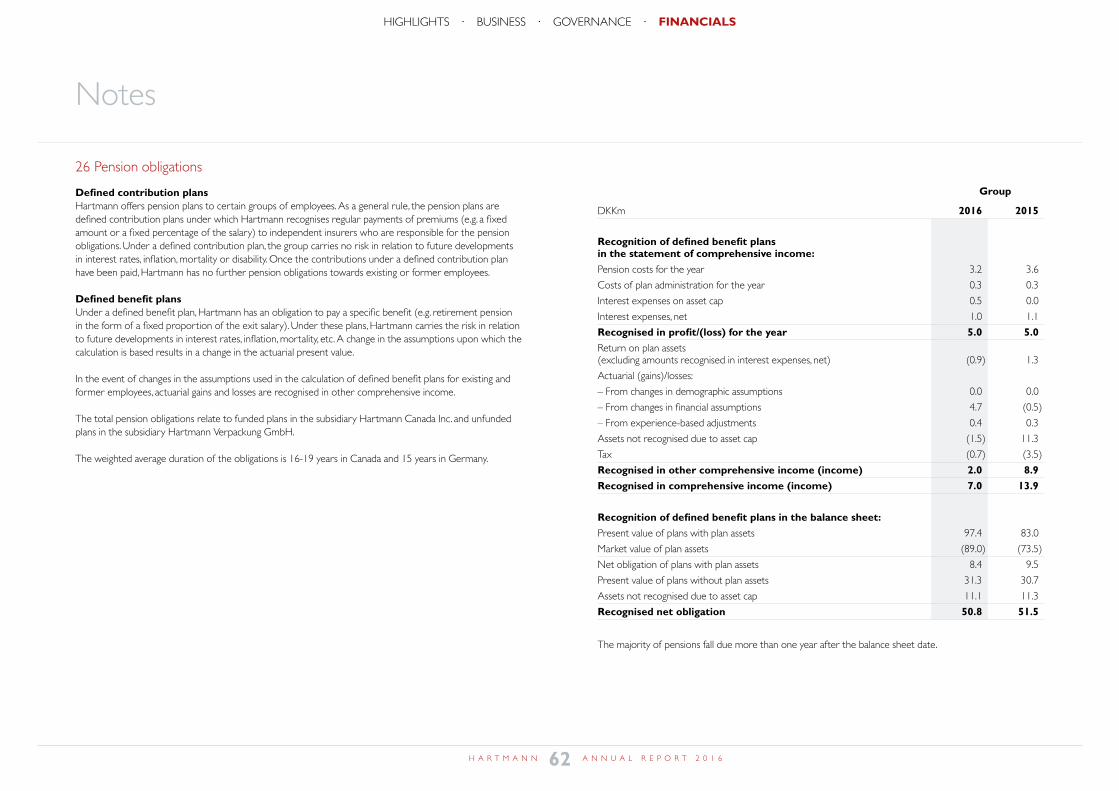
Notes
26 Pension obligations
Defined contribution plansHartmann offers pension plans to certain groups of employees. As a general rule, the pension plans are defined contribution plans under which Hartmann recognises regular payments of premiums (e.g. a fixed amount or a fixed percentage of the salary) to independent insurers who are responsible for the pension obligations. Under a defined contribution plan, the group carries no risk in relation to future developments in interest rates, inflation, mortality or disability. Once the contributions under a defined contribution plan have been paid, Hartmann has no further pension obligations towards existing or former employees.
Defined benefit plansUnder a defined benefit plan, Hartmann has an obligation to pay a specific benefit (e.g. retirement pension in the form of a fixed proportion of the exit salary). Under these plans, Hartmann carries the risk in relation to future developments in interest rates, inflation, mortality, etc. A change in the assumptions upon which the calculation is based results in a change in the actuarial present value.
In the event of changes in the assumptions used in the calculation of defined benefit plans for existing and former employees, actuarial gains and losses are recognised in other comprehensive income.
The total pension obligations relate to funded plans in the subsidiary Hartmann Canada Inc. and unfunded plans in the subsidiary Hartmann Verpackung GmbH.
The weighted average duration of the obligations is 16-19 years in Canada and 15 years in Germany.
26 Pension obligations – cont'd
Group
DKKm 2016 2015
Recognition of defined benefit plans in the statement of comprehensive income:Pension costs for the year 3.2 3.6
Costs of plan administration for the year 0.3 0.3
Interest expenses on asset cap 0.5 0.0
Interest expenses, net 1.0 1.1
Recognised in profit/(loss) for the year 5.0 5.0Return on plan assets (excluding amounts recognised in interest expenses, net) (0.9) 1.3
Actuarial (gains)/losses:
– From changes in demographic assumptions 0.0 0.0
– From changes in financial assumptions 4.7 (0.5)
– From experience-based adjustments 0.4 0.3
Assets not recognised due to asset cap (1.5) 11.3
Tax (0.7) (3.5)
Recognised in other comprehensive income (income) 2.0 8.9Recognised in comprehensive income (income) 7.0 13.9
Recognition of defined benefit plans in the balance sheet:Present value of plans with plan assets 97.4 83.0
Market value of plan assets (89.0) (73.5)
Net obligation of plans with plan assets 8.4 9.5
Present value of plans without plan assets 31.3 30.7
Assets not recognised due to asset cap 11.1 11.3
Recognised net obligation 50.8 51.5
The majority of pensions fall due more than one year after the balance sheet date.
62H A R T M A N N A N N U A L R E P O R T 2 0 1 6
HIGHLIGHTS · BUSINESS · GOVERNANCE · FINANCIALSnote 26
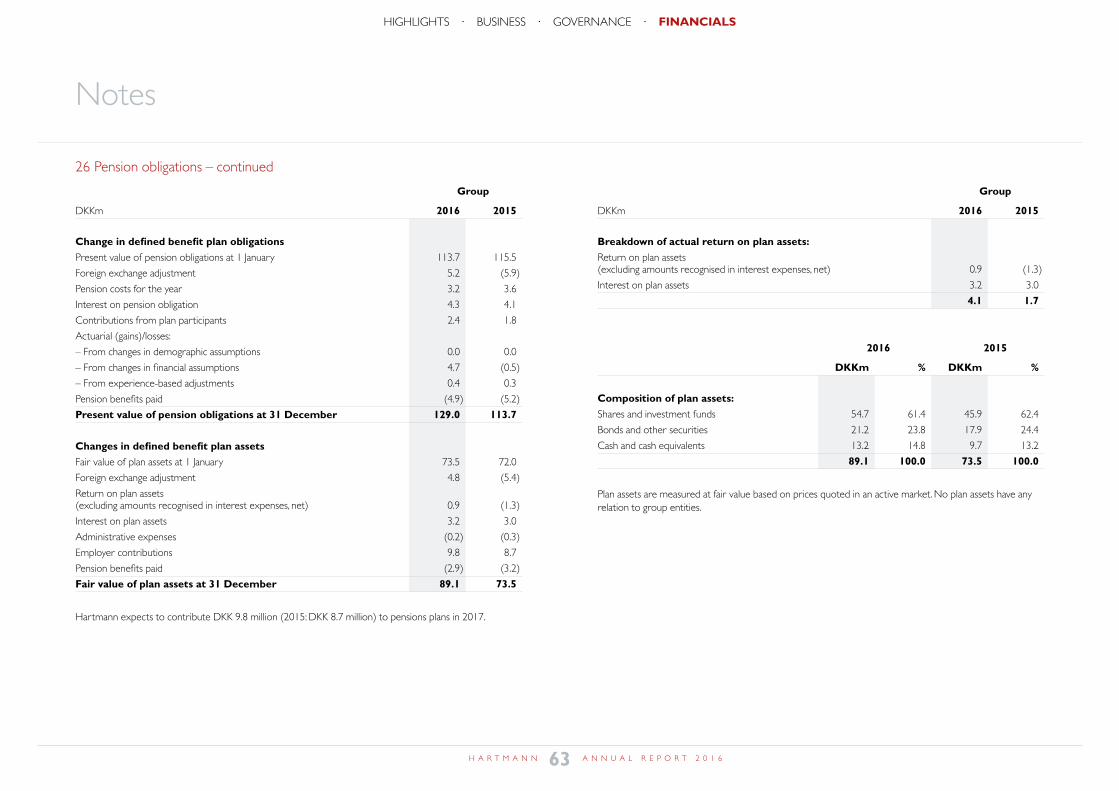
Notes
26 Pension obligations – continued
Group
DKKm 2016 2015
Change in defined benefit plan obligationsPresent value of pension obligations at 1 January 113.7 115.5
Foreign exchange adjustment 5.2 (5.9)
Pension costs for the year 3.2 3.6
Interest on pension obligation 4.3 4.1
Contributions from plan participants 2.4 1.8
Actuarial (gains)/losses:
– From changes in demographic assumptions 0.0 0.0
– From changes in financial assumptions 4.7 (0.5)
– From experience-based adjustments 0.4 0.3
Pension benefits paid (4.9) (5.2)
Present value of pension obligations at 31 December 129.0 113.7
Changes in defined benefit plan assetsFair value of plan assets at 1 January 73.5 72.0
Foreign exchange adjustment 4.8 (5.4)
Return on plan assets (excluding amounts recognised in interest expenses, net) 0.9 (1.3)
Interest on plan assets 3.2 3.0
Administrative expenses (0.2) (0.3)
Employer contributions 9.8 8.7
Pension benefits paid (2.9) (3.2)
Fair value of plan assets at 31 December 89.1 73.5
Hartmann expects to contribute DKK 9.8 million (2015: DKK 8.7 million) to pensions plans in 2017.
26 Pension obligations – cont'd
Group
DKKm 2016 2015
Breakdown of actual return on plan assets:Return on plan assets (excluding amounts recognised in interest expenses, net) 0.9 (1.3)
Interest on plan assets 3.2 3.0
4.1 1.7
2016 2015
DKKm % DKKm %
Composition of plan assets:Shares and investment funds 54.7 61.4 45.9 62.4
Bonds and other securities 21.2 23.8 17.9 24.4
Cash and cash equivalents 13.2 14.8 9.7 13.2
89.1 100.0 73.5 100.0
Plan assets are measured at fair value based on prices quoted in an active market. No plan assets have any relation to group entities.
63H A R T M A N N A N N U A L R E P O R T 2 0 1 6
HIGHLIGHTS · BUSINESS · GOVERNANCE · FINANCIALS
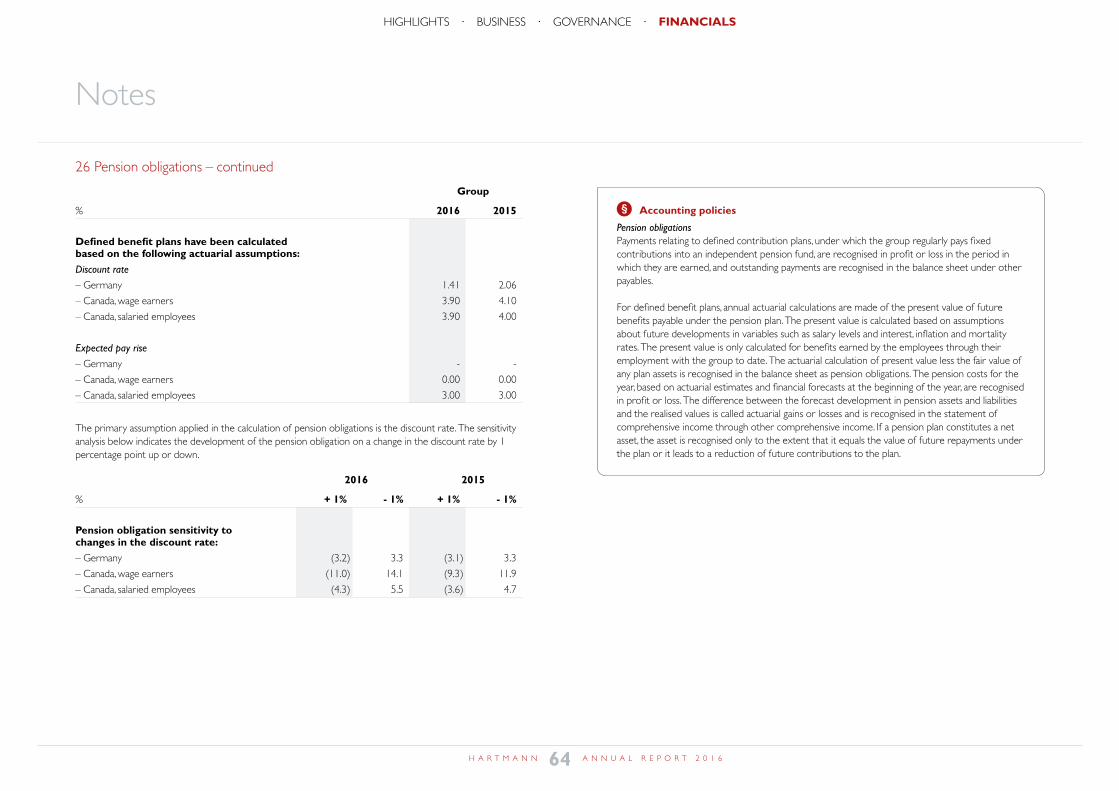
Notes
26 Pension obligations – continued
Group
% 2016 2015
Defined benefit plans have been calculated based on the following actuarial assumptions:Discount rate
– Germany 1.41 2.06
– Canada, wage earners 3.90 4.10
– Canada, salaried employees 3.90 4.00
Expected pay rise
– Germany - -
– Canada, wage earners 0.00 0.00
– Canada, salaried employees 3.00 3.00
The primary assumption applied in the calculation of pension obligations is the discount rate. The sensitivity analysis below indicates the development of the pension obligation on a change in the discount rate by 1 percentage point up or down.
2016 2015
% + 1% - 1% + 1% - 1%
Pension obligation sensitivity to changes in the discount rate: – Germany (3.2) 3.3 (3.1) 3.3
– Canada, wage earners (11.0) 14.1 (9.3) 11.9
– Canada, salaried employees (4.3) 5.5 (3.6) 4.7
Accounting policies
Pension obligationsPayments relating to defined contribution plans, under which the group regularly pays fixed contributions into an independent pension fund, are recognised in profit or loss in the period in which they are earned, and outstanding payments are recognised in the balance sheet under other payables.
For defined benefit plans, annual actuarial calculations are made of the present value of future benefits payable under the pension plan. The present value is calculated based on assumptions about future developments in variables such as salary levels and interest, inflation and mortality rates. The present value is only calculated for benefits earned by the employees through their employment with the group to date. The actuarial calculation of present value less the fair value of any plan assets is recognised in the balance sheet as pension obligations. The pension costs for the year, based on actuarial estimates and financial forecasts at the beginning of the year, are recognised in profit or loss. The difference between the forecast development in pension assets and liabilities and the realised values is called actuarial gains or losses and is recognised in the statement of comprehensive income through other comprehensive income. If a pension plan constitutes a net asset, the asset is recognised only to the extent that it equals the value of future repayments under the plan or it leads to a reduction of future contributions to the plan.
64H A R T M A N N A N N U A L R E P O R T 2 0 1 6
HIGHLIGHTS · BUSINESS · GOVERNANCE · FINANCIALS
Notes
27 Government grants
Group Parent company
DKKm 2016 2015 2016 2015
Government grants at 1 January 14.3 17.1 2.7 3.4
Foreign exchange adjustment 0.1 0.2 - -
Disposals (1.4) (0.6) 0.0 0.0
Recognised in statement of comprehensive income (2.8) (2.4) (0.7) (0.7)
Government grants at 31 December 10.2 14.3 2.0 2.7
Of which recognised as non-current liabilities 8.2 11.9 1.4 2.0
Of which recognised as current liabilities 2.0 2.4 0.6 0.7
10.2 14.3 2.0 2.7
Hartmann regularly receives government grants for development-related and energy-saving projects.
In 1995, Brødrene Hartmann A/S received a major grant for the construction of its combined heat and power plant.
In addition, the Hungarian subsidiary has received government grants in the form of direct grants and reduced future tax payments. The grants are capped at 50% of the DKK 72.3 million investment made in the period 2006-2008, of which direct grants represent DKK 9.0 million. If the eligibility criteria are not met, future grants in the form of reduced tax payments may be reduced or discontinued. Government grants received in the form of reduced tax payments were an accumulated DKK 24.1 million at 31 December 2016 (2015: DKK 21.4 million). The eligibility criteria are expected to be met.
The grants are currently not subject to any repayment obligations.
28 Provisions
Group Parent company
DKKm 2016 2015 2016 2015
Warranty commitments at 1 January 2.6 2.6 2.3 2.1
Additions 2.8 1.7 2.8 1.4
Disposals (1.9) (1.7) (1.6) (1.2)
Warranty commitments at 31 December 3.5 2.6 3.5 2.3
Restructuring at 1 January 73.0 0.0 73.0 0.0
Additions 0.0 85.0 0.0 85.0
Paid (70.6) (12.0) (70.6) (12.0)
Restructuring at 31 December 2.4 73.0 2.4 73.0
Provisions at 31 December 5.9 75.6 5.9 75.3
Provision has been made for warranty commitments in cover of contract-related warranty complaints for goods already delivered. Provisions for restructuring comprise restructuring measures decided and announced in 2015 in connection with organisational adjustments of the European production network and the head office, as well as costs related to the closure of Hartmann’s German factory.
Accounting policies
Government grants Government grants relating to property, plant and equipment are recognised in the balance sheet under liabilities. The grants are recognised in profit or loss over the useful lives of the assets.
Accounting policies
Provisions Provisions are recognised when, as a result of events occurring before or at the balance sheet date, the group has a legal or constructive obligation and it is probable that an outflow of resources embodying economic benefits will be required to settle the obligation. Provisions are measured at management’s best estimate of the amount required to settle the obligation at the balance sheet date.
Warranty commitments are recognised as goods are sold and are calculated on the basis of histor-ical warranty costs.
Restructuring costs are recognised as liabilities when a detailed, formal restructuring plan has been announced not later than at the balance sheet date to the parties affected by the plan.
65H A R T M A N N A N N U A L R E P O R T 2 0 1 6
HIGHLIGHTS · BUSINESS · GOVERNANCE · FINANCIALSnote 27+28
Notes
31 Collateral and contingent liabilities
GuaranteesBrødrene Hartmann A/S has provided a parent company guarantee to Hartmann (UK) Ltd. to allow that company to claim exemption from audit under section 479A of the British Companies Act 2006. At 31 December 2016, the amount owed to creditors of Hartmann (UK) Ltd. was DKK 0.4 million (2015: DKK 0.8 million).
Joint taxationBrødrene Hartmann A/S and its Danish subsidiaries are taxed jointly with Thornico Holding A/S, which is the management company. The company and its Danish subsidiaries thus have secondary liability with re-spect to income taxes etc. and any obligations to withhold taxes on interest, royalties and dividends applying to the jointly taxed entities. Such secondary liability is, however, capped at an amount equal to the portion of the share capital in the company held directly or indirectly by the ultimate parent company. The total tax obligation of the jointly taxed entities is disclosed in the financial statements of the management company.
Pending litigationAs stated in note 3, Hartmann is a party to a dispute with district heating company Tønder Fjernvarme-selskab. In 2008, Tønder Fjernvarmeselskab filed a complaint with the Danish Energy Regulatory Authority concerning the pricing of district heating supplied by Hartmann’s combined heat and power plant. In 2015, the Secretariat of the Danish Energy Regulatory Authority made a decision on the principles guiding the calculation of heating prices in the period from 2003 up to and including 8 January 2015, when district heating supplies were discontinued. Hartmann appealed this decision to the Danish Energy Board of Appeal, which made a decision on 30 June 2016 that only considered the Danish Energy Regulatory Authority’s powers to impose forward orders. Since the contract between Tønder Fjernvarmeselskab and Hartmann has been terminated, the decision of the Danish Energy Board of Appeal only implies that an order will not be imposed on Hartmann. In the pending and related cases, the Danish Energy Regulatory Authority and the Danish Energy Board of Appeal have put varying interpretations on applicable law. Hartmann has therefore appealed the decision of the Danish Energy Regulatory Authority to the Danish Energy Board of Appeal and brought an action against the Danish Energy Board of Appeal, see company announcement 16/2016 of 22 December 2016, with a view to clarifying the law governing these linked cases, including the collection of Hartmann’s DKK 39 million receivable from Tønder Fjernvarmeselskab. Assuming that the final decision in the case will reflect the 2015 decision of the Danish Energy Regulatory Authority, Hartmann expects costs to amount to about DKK 50 million and estimates the cash flow effect at a negative DKK 10 million. Tønder Fjernvarmeselskab on its part has raised a claim of DKK 88 million. Based on an internal review of these de-cisions and indications from external advisers, management believes that the case is very likely to be referred back to the Danish Energy Board of Appeal, resulting in a reversal of district heating pricing principles.
Furthermore, the group is a party to a limited number of lawsuits and disputes. In management’s opinion, these lawsuits and disputes will not significantly affect the financial position of the group or the parent company.
29 Other payables
Group Parent company
DKKm 2016 2015 2016 2015
Wages, salaries and holiday pay, etc. 86.5 79.3 42.9 38.8
VAT and other indirect taxes 2.8 0.1 1.9 0.0
Forward exchange contracts 4.4 9.4 3.5 1.2
Other debt 61.2 53.2 43.9 35.5
Other payables 154.9 142.0 92.2 75.5
Accounting policies
Other payablesOther payables are measured at net realisable value.
30 Fees to shareholder-appointed auditor
Group Parent company
DKKm 2016 2015 2016 2015
Fees to DeloitteStatutory audit 3.2 2.8 1.6 1.2
Assurance engagements other than audits 0.0 0.1 0.0 0.1
Tax and VAT-related services 0.5 0.1 0.4 0.0
Other services 1.4 1.1 1.3 1.1
Fees to shareholder-appointed auditor 5.1 4.1 3.3 2.4
66H A R T M A N N A N N U A L R E P O R T 2 0 1 6
HIGHLIGHTS · BUSINESS · GOVERNANCE · FINANCIALSnote 29+30+31
Notes
32 Operating leases
Group Parent company
DKKm 2016 2015 2016 2015
Expected maturityIn 1 year or less 14.3 13.6 6.3 6.5
In 1-5 years 18.7 30.4 7.1 12.7
After 5 years 0.0 0.0 0.0 0.0
Rental and leasing obligations 33.0 44.0 13.4 19.2
Rental and leasing expenses, operating leases 13.6 12.9 6.5 6.4
33 Financial risks
GeneralHartmann’s financial results and equity are influenced by a number of financial risks, including interest rate, currency, liquidity and credit risks.
See note 34 for a specification of financial instruments.
Financial risk managementThe guidelines for managing Hartmann’s financial risks are set out in the group’s finance and credit policy, which is approved by the board of directors once a year.
Hartmann uses financial instruments to hedge some of the financial risks that arise out of the group’s com-mercial activities. The group does not engage in transactions for the purpose of speculation.
Hartmann has centralised the management of financial risks in its finance function, which also acts as a service centre to all subsidiaries.
Interest rate riskHartmann’s interest rate risk relates mainly to the group’s interest-bearing debt to credit institutions.
Management of interest rate riskIt is Hartmann’s policy to seek to reduce to the greatest extent possible the impact of interest rate fluctua-tions on its profits and financial position.
Financing is primarily arranged in the form of non-current, committed credit facilities in DKK or EUR.
It is Hartmann’s policy to assess on an ongoing basis if benefits may be gained from converting a proportion of the group’s non-current credit facilities into fixed-rate facilities using interest-rate swaps.
The group’s credit facilities carry a floating rate, and Hartmann has opted not to convert them into fixed-rate facilities.
A 1 percentage point change in the general interest rate level related to committed credit facilities in DKK would affect pre-tax profits by approximately DKK 6 million (2015: approx. DKK 6 million).
A floating-rate and a fixed-rate loan were taken out in connection with the establishment of the new factory in Argentina in 2015. The floating-rate loan has been repaid in the wake of a significant increase in Argentinian interest rates in 2016.
Currency riskHartmann’s currency risks consist of transaction risks and translation risks.
Hartmann is exposed to transaction risks due to cross-border transactions leading to contractual cash flows in foreign currency.
The USD/CAD exchange rate exposure constitutes one of the group’s single largest transaction risks. This exposure results from the main part of sales generated in the North American business being invoiced in USD, while costs are mainly incurred in CAD.
Other significant transaction risks relate to the currencies CHF, EUR, GBP, HRK, HUF and PLN.
Due to our foreign subsidiaries, Hartmann is exposed to translation risks insofar as a part of the group’s earnings and net assets derives from these foreign subsidiaries and is therefore translated and included in the consolidated financial statements, which are presented in DKK.
In terms of net position, foreign subsidiaries reporting in the currencies ARS, BRL, CAD, HRK, HUF and ILS represent Hartmann’s greatest translation exposure.
67H A R T M A N N A N N U A L R E P O R T 2 0 1 6
HIGHLIGHTS · BUSINESS · GOVERNANCE · FINANCIALSnote 32+33
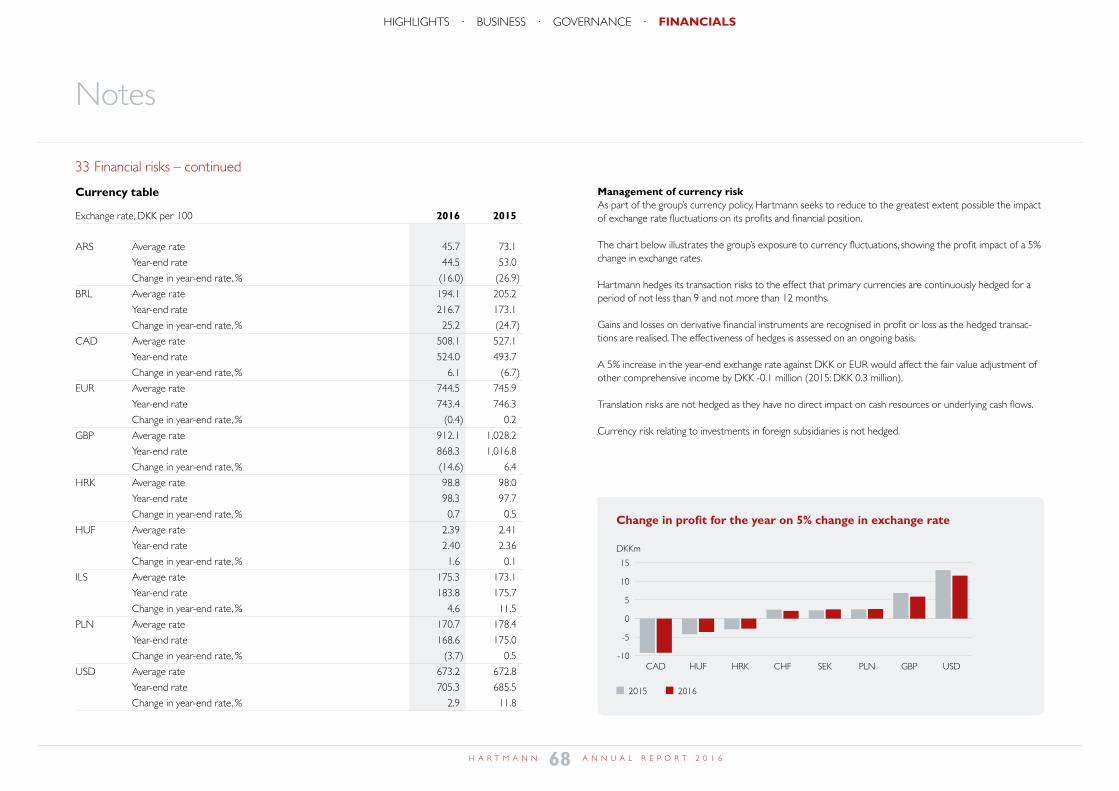
Notes
Change in profit for the year on 5% change in exchange rate
CAD
DKKm
HUF HRK CHF SEK PLN GBP USD-10
-5
0
5
10
15
2015 2016
Management of currency riskAs part of the group’s currency policy, Hartmann seeks to reduce to the greatest extent possible the impact of exchange rate fluctuations on its profits and financial position.
The chart below illustrates the group’s exposure to currency fluctuations, showing the profit impact of a 5% change in exchange rates.
Hartmann hedges its transaction risks to the effect that primary currencies are continuously hedged for a period of not less than 9 and not more than 12 months.
Gains and losses on derivative financial instruments are recognised in profit or loss as the hedged transac-tions are realised. The effectiveness of hedges is assessed on an ongoing basis.
A 5% increase in the year-end exchange rate against DKK or EUR would affect the fair value adjustment of other comprehensive income by DKK -0.1 million (2015: DKK 0.3 million).
Translation risks are not hedged as they have no direct impact on cash resources or underlying cash flows.
Currency risk relating to investments in foreign subsidiaries is not hedged.
33 Financial risks – continued
Currency table
Exchange rate, DKK per 100 2016 2015
ARS Average rate 45.7 73.1
Year-end rate 44.5 53.0
Change in year-end rate, % (16.0) (26.9)
BRL Average rate 194.1 205.2
Year-end rate 216.7 173.1
Change in year-end rate, % 25.2 (24.7)
CAD Average rate 508.1 527.1
Year-end rate 524.0 493.7
Change in year-end rate, % 6.1 (6.7)
EUR Average rate 744.5 745.9
Year-end rate 743.4 746.3
Change in year-end rate, % (0.4) 0.2
GBP Average rate 912.1 1,028.2
Year-end rate 868.3 1,016.8
Change in year-end rate, % (14.6) 6.4
HRK Average rate 98.8 98.0
Year-end rate 98.3 97.7
Change in year-end rate, % 0.7 0.5
HUF Average rate 2.39 2.41
Year-end rate 2.40 2.36
Change in year-end rate, % 1.6 0.1
ILS Average rate 175.3 173.1
Year-end rate 183.8 175.7
Change in year-end rate, % 4.6 11.5
PLN Average rate 170.7 178.4
Year-end rate 168.6 175.0
Change in year-end rate, % (3.7) 0.5
USD Average rate 673.2 672.8
Year-end rate 705.3 685.5
Change in year-end rate, % 2.9 11.8
68H A R T M A N N A N N U A L R E P O R T 2 0 1 6
HIGHLIGHTS · BUSINESS · GOVERNANCE · FINANCIALS
Notes
33 Financial risks – continued
Liquidity riskLiquidity risk is the risk that Hartmann will be unable to meet its obligations as they fall due because of its inability to liquidate assets or obtain adequate funding.
Management of liquidity riskIt is Hartmann’s policy to maintain maximum flexibility and sufficient cash resources to allow the company to continue to operate adequately in case of unforeseen fluctuations in liquidity.
The group's non-current committed facility is a loan of DKK 350 million. In 2015, the group raised a five-year loan of DKK 400 million for the purpose of acquiring subsidiaries in South America. In 2016, Hartmann exercised its option to extend the DKK 350 million facility to the effect that both loans now expire at 31 December 2019.
The interest margin on both loans is floating and is fixed each quarter based on the group’s earnings.
The loans are subject to standard covenants which Hartmann must observe in order to maintain the loans, including financial covenants concerning the financial ratios ‘solvency’ and ‘net interest-bearing debt’ relative to ‘operating profit/loss before depreciation, amortisation and impairment’. The group complied with all covenants in 2016.
The agreement on the loans further contains a number of provisions whereby significant credit facilities may be withdrawn in the event of a change of control of Hartmann.
The agreement also contains cross-default clauses.
The group’s short-term liquidity is managed primarily by the transfer of liquidity from the subsidiaries to the parent company for the purpose of directing cash to units with cash requirements. Cash pooling is used to effectively manage the group’s liquidity in GBP, PLN and EUR.
Financing in Hartmann’s subsidiaries is primarily arranged through the parent company. However, local condi-tions may result in financing being arranged through one of the group’s foreign banks.
The drawing rights are short-term credit facilities on which the group may draw and which may at any time be terminated by the bank.
The group’s undrawn credit facilities with banks amounted to DKK 244 million at 31 December 2016 (2015: DKK 309 million). Cash amounted to DKK 54 million at 31 December 2016 (2015: DKK 129 million). Total liquidity available to the group thus amounted to DKK 299 million at 31 December 2016 (2015: DKK 438 million). The group’s total liquidity has been calculated with due consideration to compliance with covenants.
Management believes the group has sufficient cash resources to cover planned operations and ongoing investments.
Credit riskHartmann’s credit risk arises in relation to the risk of losses on receivables, financial instruments with a positive fair value and cash.
Management of credit riskIt is Hartmann’s policy to take out credit insurance on its trade receivables. Local conditions may make it impossible to take out credit insurance. In these cases, Hartmann applies a stricter internal credit assessment procedure, retrieving credit information from various sources.
Write-downs for bad and doubtful debts are made individually. The credit risk in relation to receivables is therefore considered to be reflected in carrying amounts.
It is Hartmann’s policy to limit trading in derivative financial instruments and investments of surplus liquidity to banks with satisfactory credit ratings from one or more credit rating agencies.
Hartmann does not have any significant credit risk in relation to derivative financial instruments or cash. The maximum credit risk corresponds to the carrying amount.
Capital structureIt is the group’s objective to maintain a level of flexibility sufficient to carry out and fulfil its strategic objec-tives while at the same time delivering competitive returns to its shareholders. The group also strives to secure financial stability for the purpose of reducing the cost of capital.
It is the board of directors’ general objective to distribute excess capital in the form of dividends or share buy-backs in order to generally maintain Hartmann’s equity ratio at a maximum of 45%. However, the level of dividend declared will always take into account Hartmann’s growth plans and liquidity requirements. The loan agreement further contains restrictions with respect to Brødrene Hartmann A/S’s possibility of distrib-uting dividends, since changes in the general dividend policy are subject to consent from the bank.
At the annual general meeting to be held on 4 April 2017, the board of directors will propose that the company distribute dividends of DKK 9.50 per share for the financial year ended 31 December 2016.
69H A R T M A N N A N N U A L R E P O R T 2 0 1 6
HIGHLIGHTS · BUSINESS · GOVERNANCE · FINANCIALS
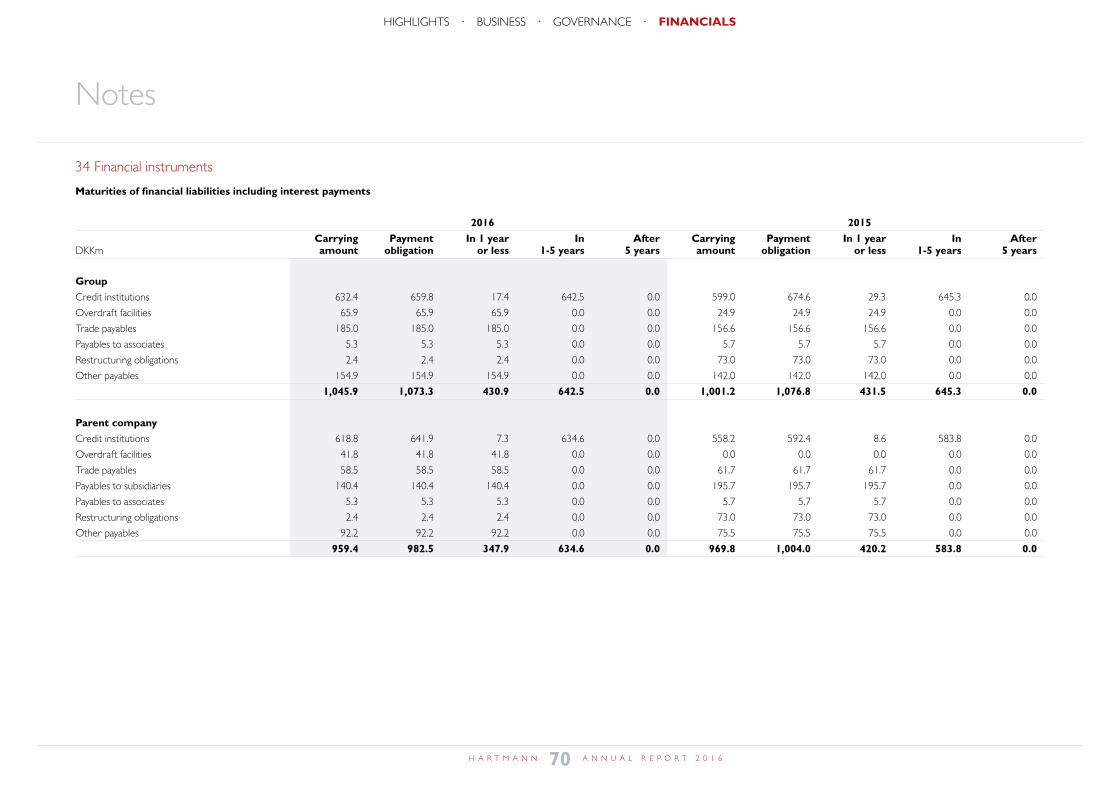
Notes
34 Financial instruments
Maturities of financial liabilities including interest payments
2016 2015 Carrying Payment In 1 year In After Carrying Payment In 1 year In After DKKm amount obligation or less 1-5 years 5 years amount obligation or less 1-5 years 5 years
GroupCredit institutions 632.4 659.8 17.4 642.5 0.0 599.0 674.6 29.3 645.3 0.0
Overdraft facilities 65.9 65.9 65.9 0.0 0.0 24.9 24.9 24.9 0.0 0.0
Trade payables 185.0 185.0 185.0 0.0 0.0 156.6 156.6 156.6 0.0 0.0
Payables to associates 5.3 5.3 5.3 0.0 0.0 5.7 5.7 5.7 0.0 0.0
Restructuring obligations 2.4 2.4 2.4 0.0 0.0 73.0 73.0 73.0 0.0 0.0
Other payables 154.9 154.9 154.9 0.0 0.0 142.0 142.0 142.0 0.0 0.0
1,045.9 1,073.3 430.9 642.5 0.0 1,001.2 1,076.8 431.5 645.3 0.0
Parent company Credit institutions 618.8 641.9 7.3 634.6 0.0 558.2 592.4 8.6 583.8 0.0
Overdraft facilities 41.8 41.8 41.8 0.0 0.0 0.0 0.0 0.0 0.0 0.0
Trade payables 58.5 58.5 58.5 0.0 0.0 61.7 61.7 61.7 0.0 0.0
Payables to subsidiaries 140.4 140.4 140.4 0.0 0.0 195.7 195.7 195.7 0.0 0.0
Payables to associates 5.3 5.3 5.3 0.0 0.0 5.7 5.7 5.7 0.0 0.0
Restructuring obligations 2.4 2.4 2.4 0.0 0.0 73.0 73.0 73.0 0.0 0.0
Other payables 92.2 92.2 92.2 0.0 0.0 75.5 75.5 75.5 0.0 0.0
959.4 982.5 347.9 634.6 0.0 969.8 1,004.0 420.2 583.8 0.0
70H A R T M A N N A N N U A L R E P O R T 2 0 1 6
HIGHLIGHTS · BUSINESS · GOVERNANCE · FINANCIALSnote 34
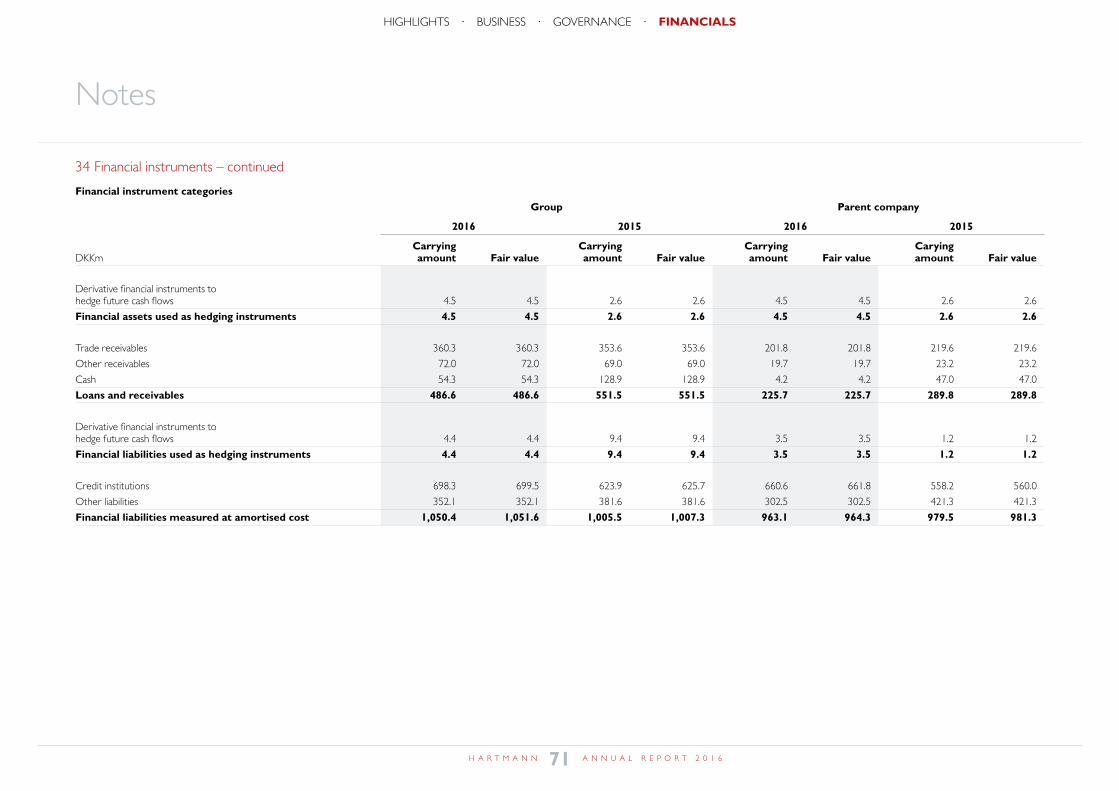
Notes
34 Financial instruments – continued
Financial instrument categories Group Parent company
2016 2015 2016 2015
Carrying Carrying Carrying Carying DKKm amount Fair value amount Fair value amount Fair value amount Fair value
Derivative financial instruments to hedge future cash flows 4.5 4.5 2.6 2.6 4.5 4.5 2.6 2.6
Financial assets used as hedging instruments 4.5 4.5 2.6 2.6 4.5 4.5 2.6 2.6
Trade receivables 360.3 360.3 353.6 353.6 201.8 201.8 219.6 219.6
Other receivables 72.0 72.0 69.0 69.0 19.7 19.7 23.2 23.2
Cash 54.3 54.3 128.9 128.9 4.2 4.2 47.0 47.0
Loans and receivables 486.6 486.6 551.5 551.5 225.7 225.7 289.8 289.8
Derivative financial instruments to hedge future cash flows 4.4 4.4 9.4 9.4 3.5 3.5 1.2 1.2
Financial liabilities used as hedging instruments 4.4 4.4 9.4 9.4 3.5 3.5 1.2 1.2
Credit institutions 698.3 699.5 623.9 625.7 660.6 661.8 558.2 560.0
Other liabilities 352.1 352.1 381.6 381.6 302.5 302.5 421.3 421.3
Financial liabilities measured at amortised cost 1,050.4 1,051.6 1,005.5 1,007.3 963.1 964.3 979.5 981.3
71H A R T M A N N A N N U A L R E P O R T 2 0 1 6
HIGHLIGHTS · BUSINESS · GOVERNANCE · FINANCIALS
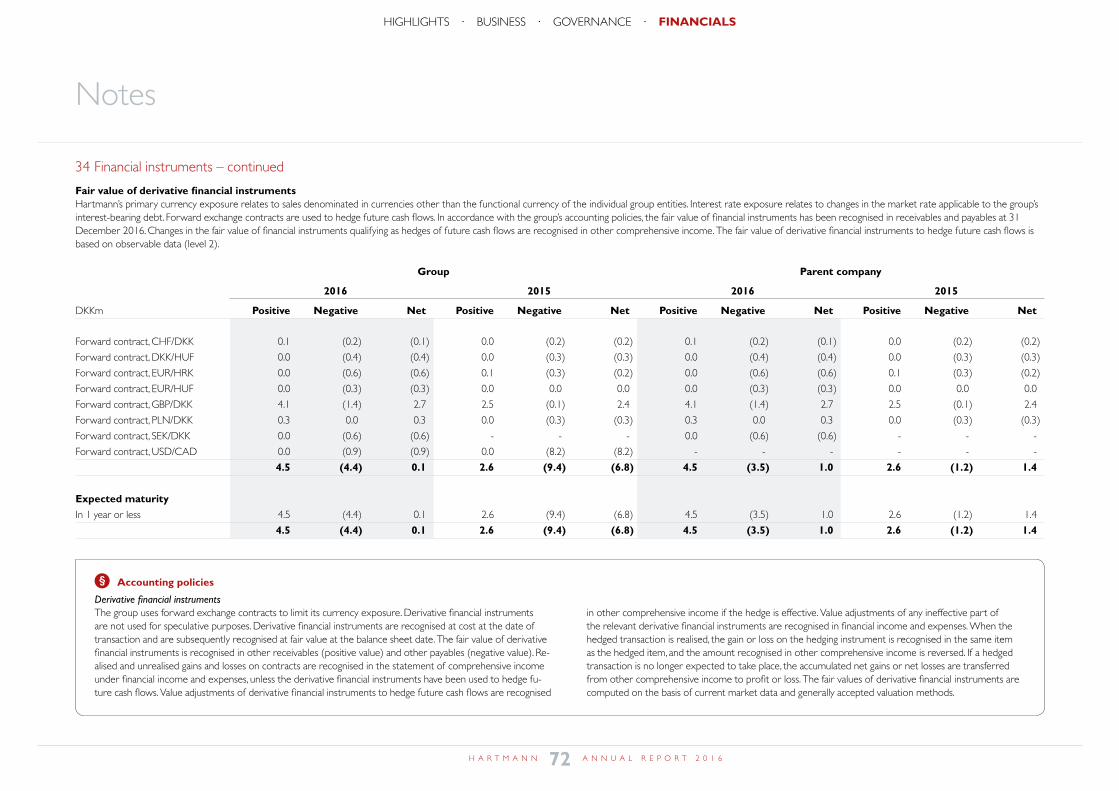
Notes
34 Financial instruments – continued
Fair value of derivative financial instrumentsHartmann’s primary currency exposure relates to sales denominated in currencies other than the functional currency of the individual group entities. Interest rate exposure relates to changes in the market rate applicable to the group’s interest-bearing debt. Forward exchange contracts are used to hedge future cash flows. In accordance with the group’s accounting policies, the fair value of financial instruments has been recognised in receivables and payables at 31 December 2016. Changes in the fair value of financial instruments qualifying as hedges of future cash flows are recognised in other comprehensive income. The fair value of derivative financial instruments to hedge future cash flows is based on observable data (level 2).
Group Parent company
2016 2015 2016 2015
DKKm Positive Negative Net Positive Negative Net Positive Negative Net Positive Negative Net
Forward contract, CHF/DKK 0.1 (0.2) (0.1) 0.0 (0.2) (0.2) 0.1 (0.2) (0.1) 0.0 (0.2) (0.2)
Forward contract, DKK/HUF 0.0 (0.4) (0.4) 0.0 (0.3) (0.3) 0.0 (0.4) (0.4) 0.0 (0.3) (0.3)
Forward contract, EUR/HRK 0.0 (0.6) (0.6) 0.1 (0.3) (0.2) 0.0 (0.6) (0.6) 0.1 (0.3) (0.2)
Forward contract, EUR/HUF 0.0 (0.3) (0.3) 0.0 0.0 0.0 0.0 (0.3) (0.3) 0.0 0.0 0.0
Forward contract, GBP/DKK 4.1 (1.4) 2.7 2.5 (0.1) 2.4 4.1 (1.4) 2.7 2.5 (0.1) 2.4
Forward contract, PLN/DKK 0.3 0.0 0.3 0.0 (0.3) (0.3) 0.3 0.0 0.3 0.0 (0.3) (0.3)
Forward contract, SEK/DKK 0.0 (0.6) (0.6) - - - 0.0 (0.6) (0.6) - - -
Forward contract, USD/CAD 0.0 (0.9) (0.9) 0.0 (8.2) (8.2) - - - - - -
4.5 (4.4) 0.1 2.6 (9.4) (6.8) 4.5 (3.5) 1.0 2.6 (1.2) 1.4
Expected maturity In 1 year or less 4.5 (4.4) 0.1 2.6 (9.4) (6.8) 4.5 (3.5) 1.0 2.6 (1.2) 1.4
4.5 (4.4) 0.1 2.6 (9.4) (6.8) 4.5 (3.5) 1.0 2.6 (1.2) 1.4
Accounting policies
Derivative financial instrumentsThe group uses forward exchange contracts to limit its currency exposure. Derivative financial instruments are not used for speculative purposes. Derivative financial instruments are recognised at cost at the date of transaction and are subsequently recognised at fair value at the balance sheet date. The fair value of derivative financial instruments is recognised in other receivables (positive value) and other payables (negative value). Re-alised and unrealised gains and losses on contracts are recognised in the statement of comprehensive income under financial income and expenses, unless the derivative financial instruments have been used to hedge fu-ture cash flows. Value adjustments of derivative financial instruments to hedge future cash flows are recognised
in other comprehensive income if the hedge is effective. Value adjustments of any ineffective part of the relevant derivative financial instruments are recognised in financial income and expenses. When the hedged transaction is realised, the gain or loss on the hedging instrument is recognised in the same item as the hedged item, and the amount recognised in other comprehensive income is reversed. If a hedged transaction is no longer expected to take place, the accumulated net gains or net losses are transferred from other comprehensive income to profit or loss. The fair values of derivative financial instruments are computed on the basis of current market data and generally accepted valuation methods.
72H A R T M A N N A N N U A L R E P O R T 2 0 1 6
HIGHLIGHTS · BUSINESS · GOVERNANCE · FINANCIALS
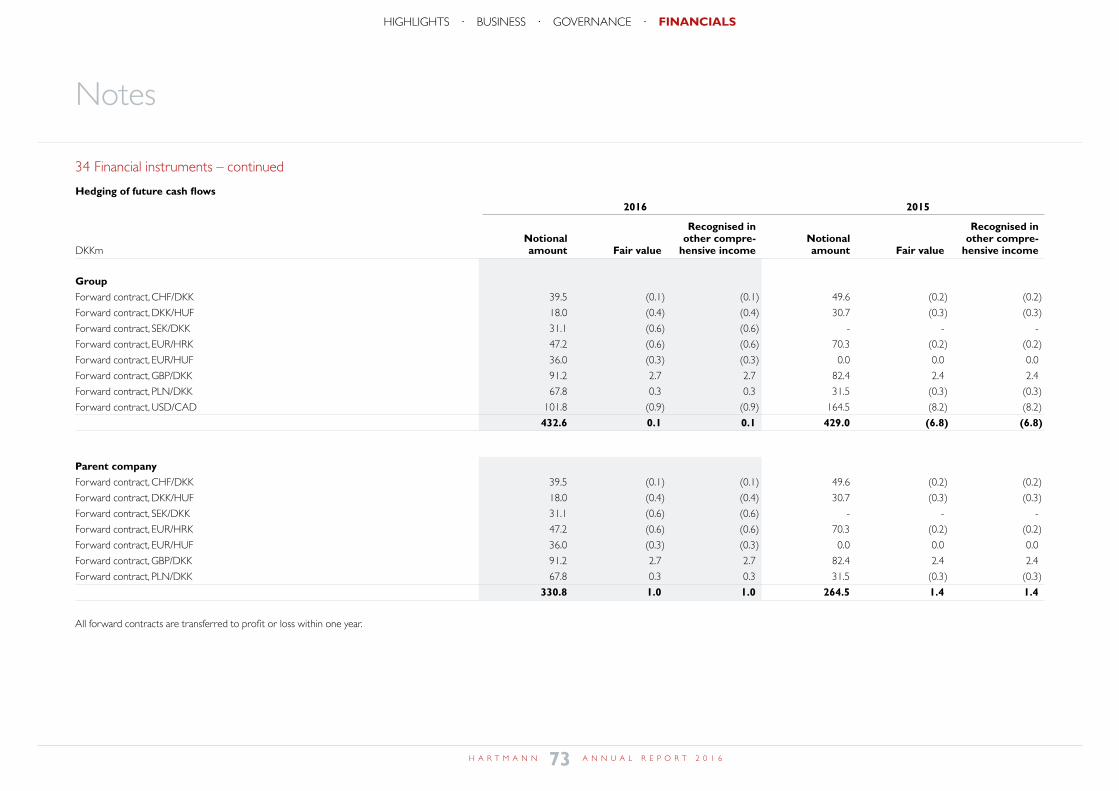
Notes
34 Financial instruments – continued
Hedging of future cash flows 2016 2015
Recognised in Recognised in Notional other compre- Notional other compre- DKKm amount Fair value hensive income amount Fair value hensive income
GroupForward contract, CHF/DKK 39.5 (0.1) (0.1) 49.6 (0.2) (0.2)
Forward contract, DKK/HUF 18.0 (0.4) (0.4) 30.7 (0.3) (0.3)
Forward contract, SEK/DKK 31.1 (0.6) (0.6) - - -
Forward contract, EUR/HRK 47.2 (0.6) (0.6) 70.3 (0.2) (0.2)
Forward contract, EUR/HUF 36.0 (0.3) (0.3) 0.0 0.0 0.0
Forward contract, GBP/DKK 91.2 2.7 2.7 82.4 2.4 2.4
Forward contract, PLN/DKK 67.8 0.3 0.3 31.5 (0.3) (0.3)
Forward contract, USD/CAD 101.8 (0.9) (0.9) 164.5 (8.2) (8.2)
432.6 0.1 0.1 429.0 (6.8) (6.8)
Parent company Forward contract, CHF/DKK 39.5 (0.1) (0.1) 49.6 (0.2) (0.2)
Forward contract, DKK/HUF 18.0 (0.4) (0.4) 30.7 (0.3) (0.3)
Forward contract, SEK/DKK 31.1 (0.6) (0.6) - - -
Forward contract, EUR/HRK 47.2 (0.6) (0.6) 70.3 (0.2) (0.2)
Forward contract, EUR/HUF 36.0 (0.3) (0.3) 0.0 0.0 0.0
Forward contract, GBP/DKK 91.2 2.7 2.7 82.4 2.4 2.4
Forward contract, PLN/DKK 67.8 0.3 0.3 31.5 (0.3) (0.3)
330.8 1.0 1.0 264.5 1.4 1.4
All forward contracts are transferred to profit or loss within one year.
73H A R T M A N N A N N U A L R E P O R T 2 0 1 6
HIGHLIGHTS · BUSINESS · GOVERNANCE · FINANCIALS
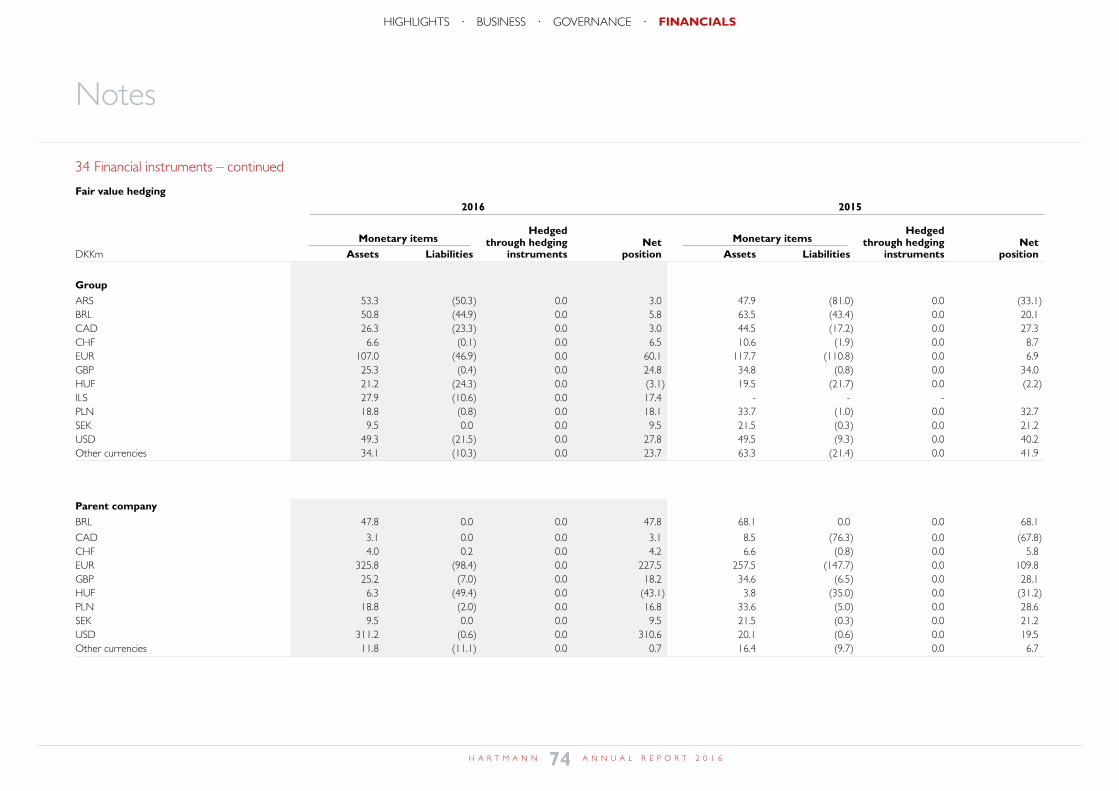
Notes
34 Financial instruments – continued
Fair value hedging 2016 2015
Hedged Hedged Monetary items through hedging Net Monetary items through hedging NetDKKm Assets Liabilities instruments position Assets Liabilities instruments position
GroupARS 53.3 (50.3) 0.0 3.0 47.9 (81.0) 0.0 (33.1)BRL 50.8 (44.9) 0.0 5.8 63.5 (43.4) 0.0 20.1CAD 26.3 (23.3) 0.0 3.0 44.5 (17.2) 0.0 27.3CHF 6.6 (0.1) 0.0 6.5 10.6 (1.9) 0.0 8.7EUR 107.0 (46.9) 0.0 60.1 117.7 (110.8) 0.0 6.9GBP 25.3 (0.4) 0.0 24.8 34.8 (0.8) 0.0 34.0HUF 21.2 (24.3) 0.0 (3.1) 19.5 (21.7) 0.0 (2.2)ILS 27.9 (10.6) 0.0 17.4 - - -PLN 18.8 (0.8) 0.0 18.1 33.7 (1.0) 0.0 32.7SEK 9.5 0.0 0.0 9.5 21.5 (0.3) 0.0 21.2USD 49.3 (21.5) 0.0 27.8 49.5 (9.3) 0.0 40.2Other currencies 34.1 (10.3) 0.0 23.7 63.3 (21.4) 0.0 41.9
Parent companyBRL 47.8 0.0 0.0 47.8 68.1 0.0 0.0 68.1
CAD 3.1 0.0 0.0 3.1 8.5 (76.3) 0.0 (67.8)CHF 4.0 0.2 0.0 4.2 6.6 (0.8) 0.0 5.8EUR 325.8 (98.4) 0.0 227.5 257.5 (147.7) 0.0 109.8GBP 25.2 (7.0) 0.0 18.2 34.6 (6.5) 0.0 28.1HUF 6.3 (49.4) 0.0 (43.1) 3.8 (35.0) 0.0 (31.2)PLN 18.8 (2.0) 0.0 16.8 33.6 (5.0) 0.0 28.6SEK 9.5 0.0 0.0 9.5 21.5 (0.3) 0.0 21.2USD 311.2 (0.6) 0.0 310.6 20.1 (0.6) 0.0 19.5Other currencies 11.8 (11.1) 0.0 0.7 16.4 (9.7) 0.0 6.7
74H A R T M A N N A N N U A L R E P O R T 2 0 1 6
HIGHLIGHTS · BUSINESS · GOVERNANCE · FINANCIALS
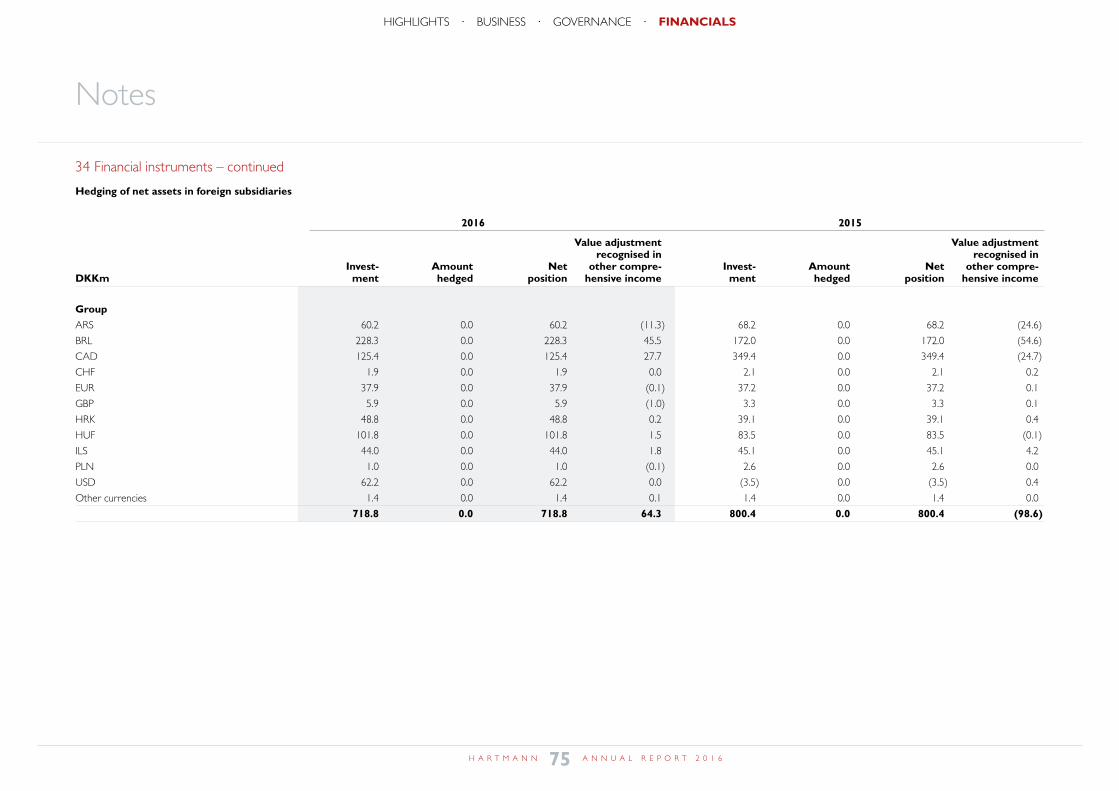
Notes
34 Financial instruments – continued
Hedging of net assets in foreign subsidiaries
2016 2015
Value adjustment Value adjustment recognised in recognised in Invest- Amount Net other compre- Invest- Amount Net other compre- DKKm ment hedged position hensive income ment hedged position hensive income
GroupARS 60.2 0.0 60.2 (11.3) 68.2 0.0 68.2 (24.6)
BRL 228.3 0.0 228.3 45.5 172.0 0.0 172.0 (54.6)
CAD 125.4 0.0 125.4 27.7 349.4 0.0 349.4 (24.7)
CHF 1.9 0.0 1.9 0.0 2.1 0.0 2.1 0.2
EUR 37.9 0.0 37.9 (0.1) 37.2 0.0 37.2 0.1
GBP 5.9 0.0 5.9 (1.0) 3.3 0.0 3.3 0.1
HRK 48.8 0.0 48.8 0.2 39.1 0.0 39.1 0.4
HUF 101.8 0.0 101.8 1.5 83.5 0.0 83.5 (0.1)
ILS 44.0 0.0 44.0 1.8 45.1 0.0 45.1 4.2
PLN 1.0 0.0 1.0 (0.1) 2.6 0.0 2.6 0.0
USD 62.2 0.0 62.2 0.0 (3.5) 0.0 (3.5) 0.4
Other currencies 1.4 0.0 1.4 0.1 1.4 0.0 1.4 0.0
718.8 0.0 718.8 64.3 800.4 0.0 800.4 (98.6)
75H A R T M A N N A N N U A L R E P O R T 2 0 1 6
HIGHLIGHTS · BUSINESS · GOVERNANCE · FINANCIALS
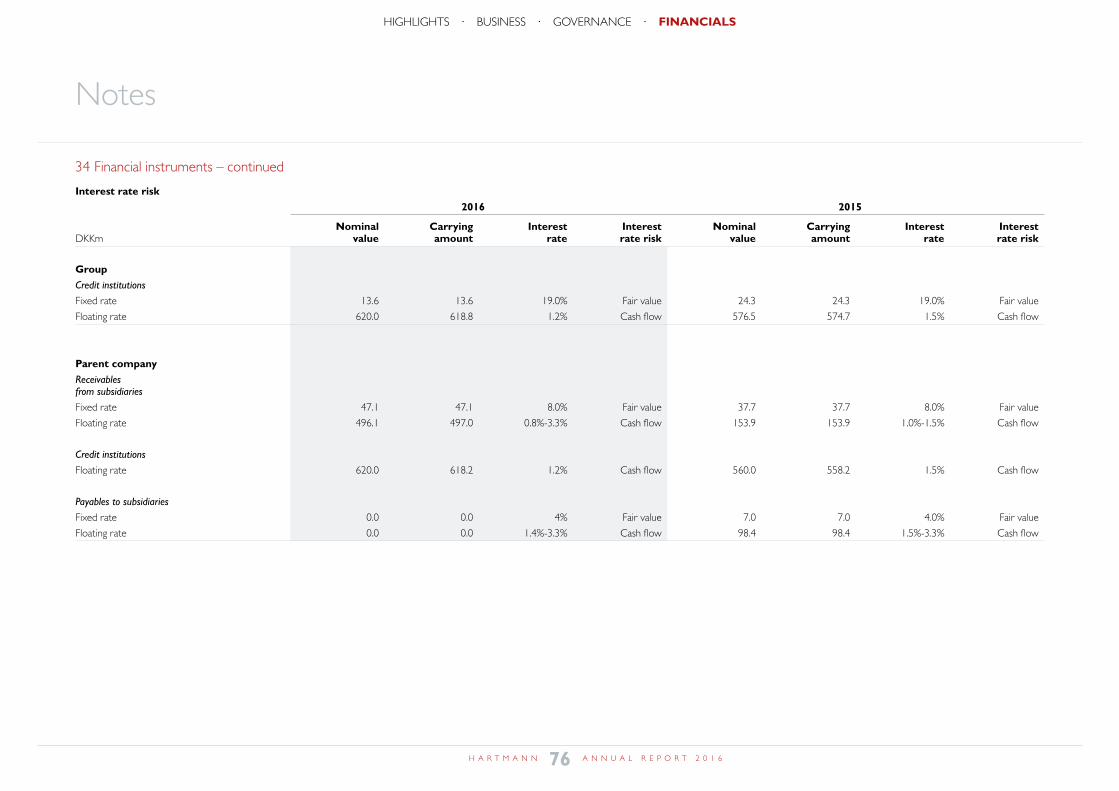
Notes
34 Financial instruments – continued
Interest rate risk 2016 2015
Nominal Carrying Interest Interest Nominal Carrying Interest Interest DKKm value amount rate rate risk value amount rate rate risk
GroupCredit institutions
Fixed rate 13.6 13.6 19.0% Fair value 24.3 24.3 19.0% Fair value
Floating rate 620.0 618.8 1.2% Cash flow 576.5 574.7 1.5% Cash flow
Parent companyReceivables from subsidiaries
Fixed rate 47.1 47.1 8.0% Fair value 37.7 37.7 8.0% Fair value
Floating rate 496.1 497.0 0.8%-3.3% Cash flow 153.9 153.9 1.0%-1.5% Cash flow
Credit institutions
Floating rate 620.0 618.2 1.2% Cash flow 560.0 558.2 1.5% Cash flow
Payables to subsidiaries
Fixed rate 0.0 0.0 4% Fair value 7.0 7.0 4.0% Fair value
Floating rate 0.0 0.0 1.4%-3.3% Cash flow 98.4 98.4 1.5%-3.3% Cash flow
76H A R T M A N N A N N U A L R E P O R T 2 0 1 6
HIGHLIGHTS · BUSINESS · GOVERNANCE · FINANCIALS
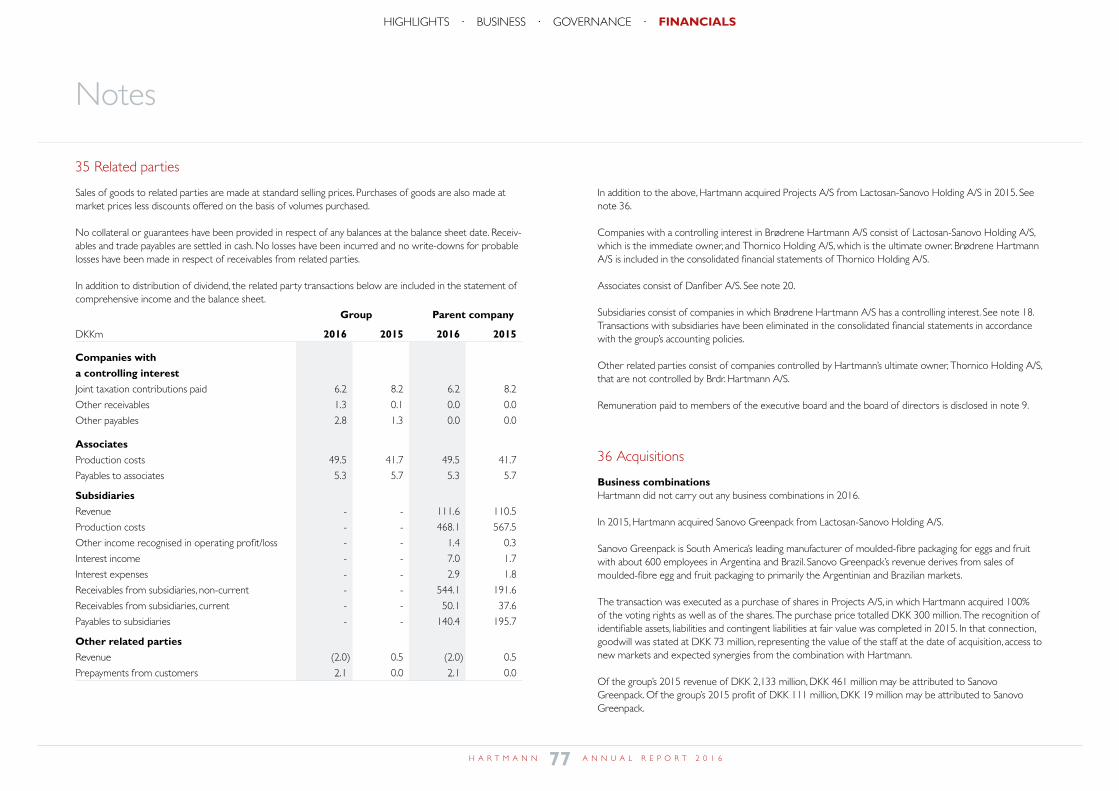
Notes
35 Related parties
Sales of goods to related parties are made at standard selling prices. Purchases of goods are also made at market prices less discounts offered on the basis of volumes purchased.
No collateral or guarantees have been provided in respect of any balances at the balance sheet date. Receiv-ables and trade payables are settled in cash. No losses have been incurred and no write-downs for probable losses have been made in respect of receivables from related parties.
In addition to distribution of dividend, the related party transactions below are included in the statement of comprehensive income and the balance sheet.
Group Parent company
DKKm 2016 2015 2016 2015
Companies with a controlling interestJoint taxation contributions paid 6.2 8.2 6.2 8.2
Other receivables 1.3 0.1 0.0 0.0
Other payables 2.8 1.3 0.0 0.0
AssociatesProduction costs 49.5 41.7 49.5 41.7
Payables to associates 5.3 5.7 5.3 5.7
SubsidiariesRevenue - - 111.6 110.5
Production costs - - 468.1 567.5
Other income recognised in operating profit/loss - - 1.4 0.3
Interest income - - 7.0 1.7
Interest expenses - - 2.9 1.8
Receivables from subsidiaries, non-current - - 544.1 191.6
Receivables from subsidiaries, current - - 50.1 37.6
Payables to subsidiaries - - 140.4 195.7
Other related partiesRevenue (2.0) 0.5 (2.0) 0.5
Prepayments from customers 2.1 0.0 2.1 0.0
35 Related parties
In addition to the above, Hartmann acquired Projects A/S from Lactosan-Sanovo Holding A/S in 2015. See note 36.
Companies with a controlling interest in Brødrene Hartmann A/S consist of Lactosan-Sanovo Holding A/S, which is the immediate owner, and Thornico Holding A/S, which is the ultimate owner. Brødrene Hartmann A/S is included in the consolidated financial statements of Thornico Holding A/S.
Associates consist of Danfiber A/S. See note 20.
Subsidiaries consist of companies in which Brødrene Hartmann A/S has a controlling interest. See note 18. Transactions with subsidiaries have been eliminated in the consolidated financial statements in accordance with the group’s accounting policies.
Other related parties consist of companies controlled by Hartmann’s ultimate owner, Thornico Holding A/S, that are not controlled by Brdr. Hartmann A/S.
Remuneration paid to members of the executive board and the board of directors is disclosed in note 9.
36 Acquisitions
Business combinationsHartmann did not carry out any business combinations in 2016.
In 2015, Hartmann acquired Sanovo Greenpack from Lactosan-Sanovo Holding A/S.
Sanovo Greenpack is South America’s leading manufacturer of moulded-fibre packaging for eggs and fruit with about 600 employees in Argentina and Brazil. Sanovo Greenpack’s revenue derives from sales of moulded-fibre egg and fruit packaging to primarily the Argentinian and Brazilian markets.
The transaction was executed as a purchase of shares in Projects A/S, in which Hartmann acquired 100% of the voting rights as well as of the shares. The purchase price totalled DKK 300 million. The recognition of identifiable assets, liabilities and contingent liabilities at fair value was completed in 2015. In that connection, goodwill was stated at DKK 73 million, representing the value of the staff at the date of acquisition, access to new markets and expected synergies from the combination with Hartmann.
Of the group’s 2015 revenue of DKK 2,133 million, DKK 461 million may be attributed to Sanovo Greenpack. Of the group’s 2015 profit of DKK 111 million, DKK 19 million may be attributed to Sanovo Greenpack.
77H A R T M A N N A N N U A L R E P O R T 2 0 1 6
HIGHLIGHTS · BUSINESS · GOVERNANCE · FINANCIALSnote 35
Notes
Accounting policies
Business combinationsNewly acquired enterprises are recognised in the consolidated financial statements from the date of acquisition. The date of acquisition is the date on which control of the company is de facto taken over.
In the acquisition of new enterprises where the group obtains control over the acquired enter-prise, the acquisition method is used, under which the acquired enterprises’ identifiable assets, liabilities and contingent liabilities are measured at fair value at the date of acquisition. Restructuring costs are recognised in the pre-acquisition balance sheet only if they constitute an obligation for the acquired enterprise. The tax effect of the revaluations performed is taken into account.
The consideration for an enterprise consists of the fair value of the consideration paid for the acquired enterprise. If the final determination of the consideration is contingent on one or more future events, such events are recognised at fair value at the date of acquisition. Costs relating to the acquisition are recognised in profit or loss when incurred.
Positive balances (goodwill) between the purchase consideration for the acquired enterprise and the fair value of the acquired assets, liabilities and contingent liabilities are recognised as an asset in intangible assets and tested for impairment at least once a year. If the carrying amount of the asset is higher than its recoverable amount, it is written down to the lower recoverable amount.
If at the date of acquisition there is uncertainty about the identification or measurement of ac-quired assets, liabilities or contingent liabilities or the determination of the purchase consideration, initial recognition is made on the basis of initially calculated values. These values may be adjusted or additional assets or liabilities may be recognised until 12 months after the acquisition, if new information is obtained about circumstances that existed at the date of acquisition and which would have affected the calculation of the values at the date of acquisition had the information been known.
Subsequent changes in estimates of conditional purchase considerations are generally recognised directly in profit or loss.
36 Acquisitions – cont’d36 Acquisitions – continued
Significant accounting estimates and judgments
Allocation of purchase priceIn acquisitions of companies, the acquired companies’ assets, liabilities and contingent liabilities are recognised in accordance with the acquisition method.
For a substantial part of the assets and liabilities acquired, no efficient markets exist for determining the fair value. This applies to intangible assets acquired in particular. Therefore, management makes estimates when determining the fair value of the acquired assets, liabilities and contingent liabilities. Depending on the nature of the item, the fair value determination may be subject to uncertainty and possibly to subsequent adjustment. The non-allocated purchase price (positive amount) is recognised in the balance sheet as goodwill, which is allocated to cash-generating units.
The present value of estimated future cash flows is based on budgets and business plans, pro-jections for subsequent years and management’s expectations for future developments. Essential parameters are revenue development, profit margin, future investments in property, plant and equipment as well as growth expectations for subsequent years. Management believes that the purchase price recognised in the consolidated financial statements is the best estimate of the total fair value of the companies and thus the allocation of goodwill.
TrademarksIn business combinations, an estimate is made of the value of the acquired trademarks as well as the expected useful lives of these. The fair value of acquired trademarks is calculated by discount-ing the royalty payments that will be saved through owning the right of use of the trademark (the relief-from-royalty method).
Customer portfolios In business combinations, the value of the acquired customer portfolios is estimated. The value is calculated as the present value of the net cash flow generated through sales to customers less return on other cash-generating assets.
78H A R T M A N N A N N U A L R E P O R T 2 0 1 6
HIGHLIGHTS · BUSINESS · GOVERNANCE · FINANCIALSnote 36
Notes
36 Acquisitions – continued
Significant accounting estimates and judgments – continued
Purchase price allocation – fair value of property, plant and equipment The fair value of land and buildings and of plant and machinery acquired in business combinations is as far as possible based on the fair value of a similar asset in similar condition which can be pur-chased and sold in an efficient market. The fair value of property, plant and equipment for which there is no reliable market documentation of the fair value is determined on the basis of a calcu-lated value of the depreciated replacement cost. The determination is based on the replacement value of an equivalent asset that has the same functionality and capacity. The calculated replace-ment value of each asset is then reduced to reflect the functional and physical wear and tear.
The expected synergies and user-specific intentions with the use of the individual assets are not included in the estimation of the fair value.
37 Events after the balance sheet date
No significant events have occurred after the balance sheet date of significance to the consolidated financial statements or the parent company financial statements other than what has been recognised or mentioned in this annual report.
79H A R T M A N N A N N U A L R E P O R T 2 0 1 6
HIGHLIGHTS · BUSINESS · GOVERNANCE · FINANCIALSnote 37
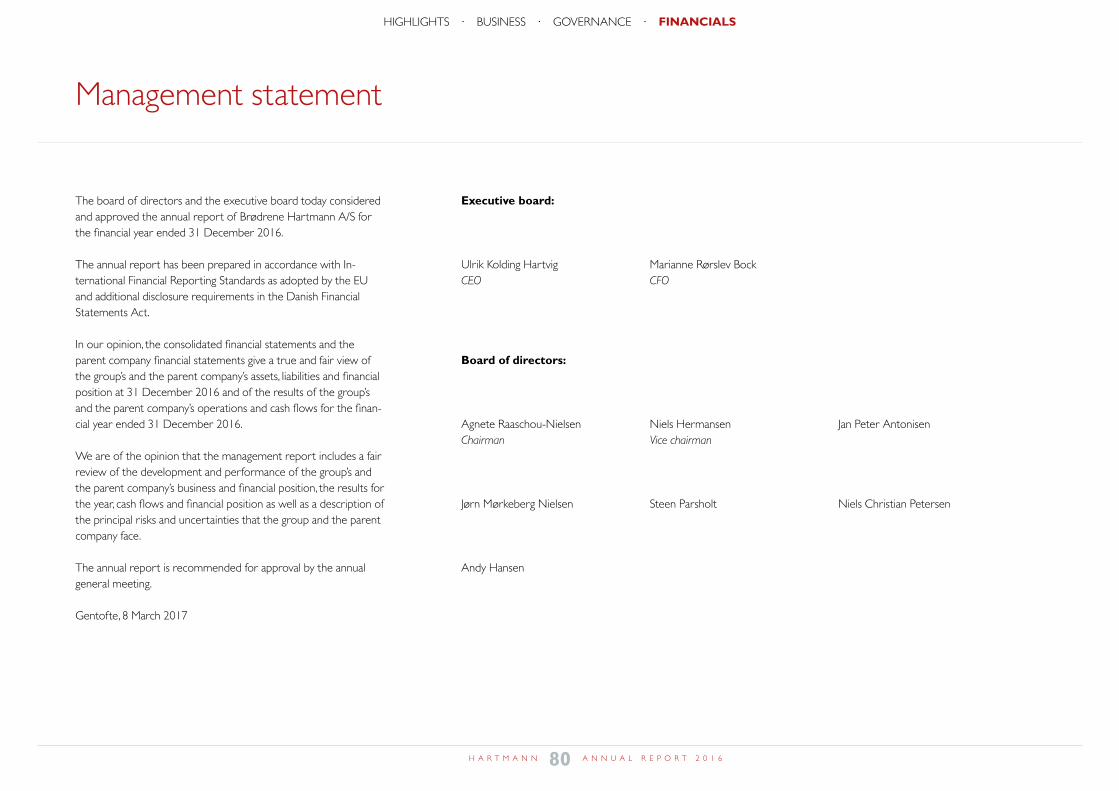
Management statement
The board of directors and the executive board today considered and approved the annual report of Brødrene Hartmann A/S for the financial year ended 31 December 2016.
The annual report has been prepared in accordance with In-ternational Financial Reporting Standards as adopted by the EU and additional disclosure requirements in the Danish Financial Statements Act.
In our opinion, the consolidated financial statements and the parent company financial statements give a true and fair view of the group’s and the parent company’s assets, liabilities and financial position at 31 December 2016 and of the results of the group’s and the parent company’s operations and cash flows for the finan-cial year ended 31 December 2016.
We are of the opinion that the management report includes a fair review of the development and performance of the group’s and the parent company’s business and financial position, the results for the year, cash flows and financial position as well as a description of the principal risks and uncertainties that the group and the parent company face.
The annual report is recommended for approval by the annual general meeting.
Gentofte, 8 March 2017
Executive board:
Ulrik Kolding Hartvig Marianne Rørslev BockCEO CFO
Board of directors:
Agnete Raaschou-Nielsen Niels Hermansen Jan Peter AntonisenChairman Vice chairman
Jørn Mørkeberg Nielsen Steen Parsholt Niels Christian Petersen
Andy Hansen
80H A R T M A N N A N N U A L R E P O R T 2 0 1 6
HIGHLIGHTS · BUSINESS · GOVERNANCE · FINANCIALSregnskab ledelsespåtegning
Independent auditor’s report
To the shareholders of Brødrene Hartmann A/S
OpinionWe have audited the consolidated financial statements and the parent company financial statements of Brødrene Hartmann A/S for the financial year 1 January - 31 December 2016, which com-prise the income statement, statement of comprehensive income, balance sheet, statement of changes in equity, statement of cash flows and notes, including the accounting policies, for the group as well as the parent company. The consolidated financial statements and the parent company financial statements are prepared in accordance with International Financial Reporting Standards as adopted by the EU and additional disclosure requirements in the Danish Financial Statements Act.
In our opinion, the consolidated financial statements and the par-ent company financial statements give a true and fair view of the financial position of the group and the parent company at 31 De-cember 2016 and of the results of their operations and cash flows for the financial year 1 January - 31 December 2016 in accordance with International Financial Reporting Standards as adopted by the EU and additional disclosure requirements in the Danish Financial Statements Act.
Basis for opinionWe conducted our audit in accordance with International Standards on Auditing and additional requirements applicable in Denmark. Our responsibilities under those standards and require-ments are further described in the 'Auditor’s responsibilities for the audit of the consolidated financial statements and the parent company financial statements' section of our report. We are inde-pendent of the group in accordance with the International Ethics Standards Board for Accountants’ Code of Ethics for Professional
Accountants (IESBA Code) and additional requirements applicable in Denmark, and we have fulfilled our other ethical responsibilities in accordance with these rules and requirements. We believe that the audit evidence we have obtained is sufficient and appropriate to provide a basis for our opinion.
Key audit mattersKey audit matters are those matters that, in our professional judge-ment, were of most significance in our audit of the consolidated financial statements and the parent company financial statements for the financial year 2016. These matters were addressed in the context of our audit of the consolidated financial statements and the parent company financial statements as a whole, and in forming our opinion thereon, and we do not provide a separate opinion on these matters.
Impairment testing of goodwill and intangible assets with indefinite useful lives and other non-current assetsConsolidated goodwill has been allocated to three cash-generating units; Argentina, Brazil and Europe Moulded Fibre as stated in note 16, which provides a detailed description of the annual impairment test performed by management. No impairment losses were recognised in the year.
In performing our audit procedures, we focused on this area because impairment testing relies on significant, complex manage-ment estimates concerning future earnings.
In performing our audit procedures, we focused in particular on the impairment tests performed in relation to Argentina and Brazil because both these regions face a high rate of inflation and a depreciating currency and consequently rely to the greatest
extent on estimates and account for the largest proportion of the total carrying amount of goodwill and other intangible assets with indefinite useful lives.
How our audit addressed the matterAs part of our audit procedures, we assessed whether the method applied to calculate values in use is appropriate and whether management’s expectations regarding future earnings and the doc-umentation submitted provide a reasonable basis for a calculation of values in use. We:
• obtained supportive documentation for accounting judg-ments and significant assumptions applied for purposes of the impairment testing, focused on expectations regarding revenue, earnings and inflation, and discussed these with management;
• compared estimates of future results with the latest forecast approved by the board of directors and historical results;
• evaluated the assumptions applied for purposes of the impair-ment testing, including the use of dynamic discount rates in the impairment test performed in relation to Argentina based on the country’s high level of inflation, and, consulting our internal valuation experts, evaluated whether the impairment test was prepared on a consistent basis and using generally recognised terms and methods;
• tested management’s sensitivity calculations; and
• assessed whether the disclosures are in accordance with the re-quirements of applicable accounting standards and are sufficient and adequate.
81H A R T M A N N A N N U A L R E P O R T 2 0 1 6
HIGHLIGHTS · BUSINESS · GOVERNANCE · FINANCIALSregnskab revisionspåtegning
Independent auditor’s report
Action against Tønder FjernvarmeselskabBrødrene Hartmann A/S is a party to a pending lawsuit against Tønder Fjernvarmeselskab concerning the collection of a receiva-ble relating to district heating supplied to Tønder Fjernvarmesel-skab from Brødrene Hartmann’s combined heat and power plant during the 2003-2014 period. Tønder Fjernvarmeselskab disagrees in the pricing and has raised a counterclaim as described in note 3, which Brødrene Hartmann A/S has rejected.
We attached significance to this area because the outcome of the case is subject to uncertainty. If the outcome of the case is differ-ent than anticipated by management, this may have a significant adverse impact on the consolidated financial statements.
How our audit addressed the matterAs part of our audit of management’s assessment of the case and its accounting treatment, we:
• discussed the pending case with management and responsible employees and obtained management’s memo concerning the case and the estimates made in relation thereto;
• reviewed relevant documentation supporting management’s assessment of the case, including correspondence in the case and decisions made by the Danish Energy Regulatory Authority and the Danish Energy Board of Appeal, and the counterclaim raised by Tønder Fjernvarmeselskab;
• obtained an assessment from and conducted discussions with the group’s external legal advisers to ensure that the legal assess-ments obtained support the accounting treatment, including the decision not to make a provision for the counterclaim raised by Tønder Fjernvarmeselskab; and
• reviewed the disclosures to ensure that they adequately de-scribe the case, the uncertainty associated with its outcome and its potential impact on the financial statements.
Statement on the management reportManagement is responsible for the management report.
Our opinion on the consolidated financial statements and the par-ent company financial statements does not cover the management report, and we do not express any assurance conclusion thereon.
In connection with our audit of the consolidated financial state-ments and the parent company financial statements, our responsi-bility is to read the management report and, in doing so, consider whether the management report is materially inconsistent with the consolidated financial statements or the parent company financial statements, or our knowledge obtained during the audit, or otherwise appears to be materially misstated.
Moreover, it is our responsibility to consider whether the manage-ment report provides the information required under the Danish Financial Statements Act.
Based on the work we have performed, we conclude that the management report is in accordance with the consolidated finan-cial statements and the parent company financial statements and has been prepared in accordance with the requirements of the Danish Financial Statements Act. We did not identify any material misstatement of the management report.
Management’s responsibilities for the consolidated financial statements and the parent company financial statementsManagement is responsible for the preparation of consolidated financial statements and parent company financial statements that give a true and fair view in accordance with International Financial Reporting Standards as adopted by the EU and additional disclo-sure requirements in the Danish Financial Statements Act, and for such internal control as management determines is necessary to enable the preparation of consolidated financial statements and parent company financial statements that are free from material misstatement, whether due to fraud or error.
In preparing the consolidated financial statements and the parent company financial statements, management is responsible for assessing the group’s and the parent company’s ability to continue as a going concern, disclosing, as applicable, matters related to going concern and using the going concern basis of accounting in prepar-ing the consolidated financial statements and the parent company financial statements unless management either intends to liquidate the group or the parent company or to cease operations, or has no realistic alternative but to do so.
Auditor’s responsibilities for the audit of the consolidated financial statements and the parent company financial statementsOur objectives are to obtain reasonable assurance about whether the consolidated financial statements and the parent company fi-nancial statements as a whole are free from material misstatement, whether due to fraud or error, and to issue an auditor’s report that includes our opinion. Reasonable assurance is a high level of assurance, but is not a guarantee that an audit conducted in accordance with International Standards on Auditing and additional
82H A R T M A N N A N N U A L R E P O R T 2 0 1 6
HIGHLIGHTS · BUSINESS · GOVERNANCE · FINANCIALS
Independent auditor’s report
requirements applicable in Denmark will always detect a material misstatement when it exits. Misstatements can arise from fraud or error and are considered material if, individually or in the aggre-gate, they could reasonably be expected to influence the economic decisions of users taken on the basis of these consolidated financial statements and parent company financial statements.
As part of an audit conducted in accordance with International Standards on Auditing and additional requirements applicable in Denmark, we exercise professional judgement and maintain pro-fessional scepticism throughout the audit. We also:
• identify and assess the risks of material misstatement of the consolidated financial statements and the parent company financial statements, whether due to fraud or error, design and perform audit procedures responsive to those risks, and obtain audit evidence that is sufficient and appropriate to provide a basis for our opinion. The risk of not detecting a material mis-statement resulting from fraud is higher than for one resulting from error as fraud may involve collusion, forgery, intentional omissions, misrepresentations, or the override of internal control;
• obtain an understanding of internal control relevant to the audit in order to design audit procedures that are appropriate in the circumstances, but not for the purpose of expressing an opinion on the effectiveness of the group’s and the parent company’s internal control;
• evaluate the appropriateness of accounting policies used and the reasonableness of accounting estimates and related disclosures made by management;
• conclude on the appropriateness of management’s use of the going concern basis of accounting in preparing the consolidated financial statements and the parent company financial state-ments and, based on the audit evidence obtained, whether a material uncertainty exists related to events or conditions that may cast significant doubt on the group’s and the parent compa-ny’s ability to continue as a going concern. If we conclude that a material uncertainty exists, we are required to draw attention in our auditor’s report to the related disclosures in the consol-idated financial statements and the parent company financial statements or, if such disclosures are inadequate, to modify our opinion. Our conclusion is based on the audit evidence obtained up to the date of our auditor’s report. However, future events or conditions may cause the group and the parent company to cease to continue as a going concern;
• evaluate the overall presentation, structure and contents of the consolidated financial statements and the parent company financial statements, including the disclosures, and whether the consolidated financial statements and the parent company finan-cial statements represent the underlying transactions and events in a manner that gives a true and fair view; and
• obtain sufficient appropriate audit evidence regarding the financial information of the entities or business activities within the group to express an opinion on the consolidated financial statements. We are responsible for the direction, supervision and performance of the group audit. We remain solely responsi-ble for our audit opinion.
We communicate with those charged with governance regarding, among other matters, the planned scope and timing of the audit and significant audit findings, including any significant deficiencies in internal control that we identify during our audit.
We also provide those charged with governance with a statement that we have complied with relevant ethical requirements regard-ing independence and communicate with them all relationships and other matters that may reasonably be thought to bear on our independence, and where applicable, related safeguards.
From the matters communicated with those charged with govern-ance, we determine those matters that were of most significance in the audit of the consolidated financial statements and the parent company financial statements of the current period and are therefore the key audit matters. We describe these matters in our auditor’s report unless law or regulation precludes public disclo-sure about the matter or when, in extremely rare circumstances, we determine that a matter should not be communicated in our report because the adverse consequences of doing so would reasonably be expected to outweigh the public interest benefits of such communication.
Copenhagen, 8 March 2017
DeloitteStatsautoriseret RevisionspartnerselskabCentral Business Registration No 33 96 35 56
Kim Takata Mücke Morten Dandanell KiærskouState-authorised State-authorised public accountant public accountant
83H A R T M A N N A N N U A L R E P O R T 2 0 1 6
HIGHLIGHTS · BUSINESS · GOVERNANCE · FINANCIALS
Brødrene Hartmann A/SØrnegårdsvej 18DK-2820 Gentofte
Tel: (+45) 45 97 00 00Fax: (+45) 45 97 00 01E-mail: [email protected]: hartmann-packaging.com
CVR no. 63 04 96 11
This annual report was released in Danish and English through Nasdaq Copenhagen as company announcement no. 2/2017. In case of discrepancies between the two versions, or in case of doubt, the Danish version prevails. All trademarks such as trade names and other names and designations highlighted in this report are trademarks protected and owned by Brødrene Hartmann A/S. © 2017 Brødrene Hartmann A/S