10-1 program requirements assess risks evaluate risk handling options evaluate subcontractor risks...
TRANSCRIPT

10-1
Program Requirements
AssessRisks
Evaluate RiskHandling Options
EvaluateSubcontractor
Risks
Establish CostSchedule/Perf Impacts
ManageRisks
Manage Risks
EstablishIndicators
EvaluateIndicators
Management Review
ManagementAction
ReassessRisks
Evaluate NewHandling Options
• TPM’s• Metrics• Cost Reports• Schedules• Reports• Watchlists• Demonstrations

10-2

10-3
Risk Management Plan
• Risk Management Strategy - See Risk Management Best Practices notes
• Responsibilities:
- Who identifies- Who constructs abatement plan options- Who selects options to implement- Who updates identification, assessment, and abatement plans

10-4
Risk Management Plan (Cont.)
• Risk management activities– Identification methods (structured baseline)– Assessment methods (definitions, QRA?)– Abatement planning (waterfall chart with
accompanying text)– Monitoring/Decision Making

10-5
Risk Management Process Flow
ProgramManagerSystemsEng
IPTLeads
TechnicalExp.
Subcontractor
ProgramMilestones LOA SRR SDR/SFR PDR
Ris
k A
sses
smen
t
Ris
k A
bate
men
t Pla
ns
Customer
Risk Fac.
Rev. & Appr.Rev. & Appr.
RMP/Process
TNG/Com.
RiskList
List of Options
Database Revised Database

10-6

10-7

10-8

10-9

10-10

10-11

10-12

10-13

10-14
Decision Making Cycle
Define DecisionDefine Decision
Collect/Capture Data
Collect/Capture Data
Assess Uncertaintyin Data
Assess Uncertaintyin Data
DetermineValue of
Reducing Uncertainty
DetermineValue of
Reducing Uncertainty
Make Decision
Make Decision
Gather AdditionalData
Gather AdditionalData
N Y
Bayes TheoremBayes Theorem

10-15
Derivation of Bayes Theorem
B A
C
C is a universe of outcomes such
that P(C) = 1.
P(A) = Area A / Area CP(A|B) = P(A and B) / P(B), so by substitution, P(B|A) = P(B and A) / P(A)P(A|B) * P(B) = P(B|A) * P(A)
P(A|B) = [ P(B|A) * P(A) ] / P(B)
Bayes TheoremBayes Theorem

10-16
Bayes Theorem (Cont.)
Outcome 1
Outcome 2
Outcome 3
Outcome 4
A
AB
B
B
B
P(A) + P(A) = 1,P(B) + P(B) = 1
P(B) = P(B|A) * P(A) +P(B|A) * P(A)
P(A|B) =
[P(B|A) * P(A)]
[P(B|A) * P(A) + P(B|A) * P(A)]
Bayes TheoremRestated
Bayes TheoremRestated

10-17
.9
.1
.1
.2.7
.2
.5
.3
Original Design Meets Cust. Req.
Original Design Does NOT Meet Cust. Req.
No Redesign
Minor Redesign
Major Redesign
No Redesign
Minor Redesign
Major Redesign
Example
.63
.18
.09
.02
.03
.05
1

10-18
Bayesian Estimation
In general, there are two types of approaches to estimation of parameters:
• Frequentist - Estimates an unknown parameter based only on observed data and an adopted model - Characterized by scientific objectivity
• Bayesian - Estimates an unknown parameter by appropriately combining prior intuition or knowledge with information from observed data - Characterized by subjective nature of prior opinion
Each approach is valid when applied under specific circumstances.Neither approach will uniformly dominate the other

10-19
Bayes’ Theorem ExerciseMany combat aircraft carry air-to-air missiles. A warning light will notify the pilot if the missile is defective. If the missile is defective an alternative missile may be used or the mission may need to be aborted. The missile may or may not be defective when the warning light is on. Given the warning light indicates a bad missile - what is the probability the missile is really defective?
Approach:
Define Event A as the missile is a dud.
Define Event B as the warning device signals the missile is a dud.
From product specs it is known that:
P(A) = .0001 i.e., one missile in 10000 is a dud.
P(B|A) = .9998 i.e., the probability of the avionics hardware and software detecting and reporting a defective missile is .9998
P(B|not A) = .002 i.e., probability of a false warning is .002

10-20
Present Value Notes
$100 1 YR. @ 10% = $110 = $100*(.1) + 100 = $100*(1.1)
2 YR. = $100*(1.1)*(1.1)
3 YR. = $100*(1.1)*(1.1)*(1.1)
Future Value = (Present Value)(1+R)n at year n
Present Value = Future Value/(1+R)n
Present Value = i=1n [ (Future Value @yr = i) / (1+R)i ] (All Years)
Net Present Value = Income - Expenses
= - Initial Outlay + [I1/1+R] + [I2/(1+R)2]...+ [In/(1+R)n]
Note: R is the Hurdle Rate

10-21
Example 1: Present Value
R = 6% Jan 1, 2002 Dec 31, 2003 Dec 31, 2004 Dec 31, 2005
Cost
Income 100K 150K 200K
X
PV = 100K/(1.06)2 + 150K/(1.06)3 + 200K/(1.06)4 = 373K

10-22
Year Beg. 2002 End 2003 End 2004 End 2005
Cost
Income 100K 150K 200K
X
Rate 6% 7% 8% 5%
PV = 100K/(1.06)(1.07) + 150K/(1.06)(1.07)(1.08)
+ 200K/(1.06)(1.07)(1.08)(1.05)
Example 2: Present Value
10-23
Question
How can you determine a funding upper bound for a risk abatement alternative during development?
First - Should you be trying to minimize risk or maximize profit?

10-24
Probability of Win Based on Bid
1
.8
.6
.4
.2
-10 -8 -6 -4 -2 0 2 4 6 8 10% Below % Above
Probability of Winning
Expected Competitive Bid

10-25
Return $ Based on Bid
-10 -8 -6 -4 -2 0 2 4 6 8 10% Below % Above
Expected Competitive Bid
Return $
10%

10-26
Expected Return Based on Bid
-10 -8 -6 -4 -2 0 2 4 6 8 10% Below % Above
Expected Competitive Bid
.-2.2%
Return $ Discountedby Prob. of Win
Marginal Return $ X
Prob. Win

10-27
Technology RoadmapDevelopment Process

10-28
Roadmap Development Overview
Baseline ForceCapability
PreliminaryRanking of
ConfigurationOptions
OtherConsiderations
TechnologyPush
Pre-DesignStudies
RequirementsAnalysis
Master ConfigurationRoadmap

10-29
Roadmap Development Activities

10-30
Baseline Capability
• Missions/Tasks for Each Own Force Aircraft Must Be Identified Based on Warfare Objectives
• Evaluations of Effectiveness Must Account for Mission/Tasks within Air-to-Air and Air-to-Ground Categories. Summations of Kills “Over Time” Across Both Categories Are Particularly Meaningful.

10-31
Sample Multirole Aircraft Missions/Tasks
Warfare Objectives to Be Achieved
Top-Level Multirole AircraftRequirements Identification
Massive Firepower In-Theater“At a Pace and in Numbers Sufficientto Field an Over-Whelming Force”
Direct Support of the GroundCampaign“Slow the Enemy’s Offensive Tempuntil Friendly Ground Forces Can Massand Counter the Advance”
Establish Air Superiority“Denying the Enemy Use of His Airpower and Defenses”
Reconstitution“The ability to Reconstitute a CredibleDefense Faster Than Any Potential Opponent Can Generate an Over-Whelming Offense”
1. In-theatre Sortie Generation2. Supportable
3. Kill Armored Vehicles4. Destroy Critical Chokepoints
5. Destroy Enemy Aircraft in Air and on Ground6. Destroy Enemy Air Defenses
7. Reconstitutable

10-32

10-33

10-34
Technology Push
• Sources of Options– Government Labs - Defense Industry– Commercial Organizations - Educational Institutes
• Upgrade Option Categories– Airframe - Electronic Warfare– Propulsion - Avionics Architecture– Fuel Carriage - Comm/Nav/Ident– Materials - Weapons Int./Carriage– Takeoff/Landing Systems - Mission Planning– Flight Controls - Training Systems– Pilot Vehicle Interface - Reliability/Maint./Supp.– Sensors - C3I

10-35
Technology Upgrade Option Candidates
• Airframe– Structure– Wing– Tail– Inlet– Electroluminescent Strip
Lighting– Signature Improvements
• Propulsion– Improved Engine– Nozzle– Thrust Vectoring
• Electronic Warfare- Threat Warning- Threat Info Management- Dispensers- Expendables- Towed Countermeasures- Electronic Countermeasures
• Avionics Architecture- Data Bus- Processor Memory- Processor Throughput- Tactical Data Management

10-36
Technology Upgrade Option Candidates(Cont.)
• Fuel Carriage– External Tanks– Conformal Tanks– Dorsal Tanks
• Materials– Composites– Advanced Metals
• Takeoff/Landing– Gear– Drag Chute– Braking– Thrust Reversers– Longer Life Tires
• Comm/Nav/Ident– Anti-Jam Voice Data Link– Global Positioning System– Improved IFF– Infrared Navigation
• Weapons Int/Carriage– Standoff Weapon– Air-to-Air Missiles– Air-to-Surface Weapon– Digital Store Management System
• Mission Planning– Automated Planning Aids

10-37
Technology Upgrade Option Candidates(Cont.)
• Flight Controls– Terrain Following/Avoidance– Ground Proximity Warning
• Pilot Vehicle Interface– Color Moving Map– Night Vision– Helmet-Mounted Display– Tactical Situation Awareness
Display• Sensors
– Radar– Infrared Targeting– All Weather Targeting– Day/Night Capability– Laser Designators– Synthetic Aperture Radar
• Training Systems– Pilot– Mission
• Reliability/Maint./Supp.– Modular Avionics– Auxiliary Power Unit– Integrated Diagnostics Testing
• C3I– Real-Time Intelligence to Cockpit– On-Board Data Fusion

10-38
Format For Technology Summaries
• Description– Basic System Characteristics– Integration Issues– Manufacturers
• Benefits/Costs– Operational Improvements– Performance Impacts– Reliability and Maintainability– System Impacts (Weight, Volume, Cooling, Power)– Development Cost– Unit Cost
• Status– Development Required– Availability– Risk and Other Considerations

10-39
Other Considerations
• Known/Suspected Threat Change Plans• Projected New Technology Capability Must Be Accepted and Embrace by
Both Military and Civilian Leadership• Technology Must Allow Appropriate Self-Sufficienecy• Technology Must Be Compatible with Manpower, Training, and Skill Levels
Political Drivers

10-40
Other Considerations (Cont’d)
• Must Enhance Future Market Potential• In-Country Support Concept Must Be Workable• Availability to Tailor Subsystems to Specific Foreign Customer Needs
(Example : Adaptability to Existing Weapons)
International Market Competitiveness
• Must Be Affordable in Relation to Baseline Aircraft Cost• Technology Must Be Low to Moderate Risk in Timeframe Planned for Implementation
Budget/Timeframe

10-41
Preliminary Ranking

10-42
Quantifying Technology Upgrade Benefit
10-43
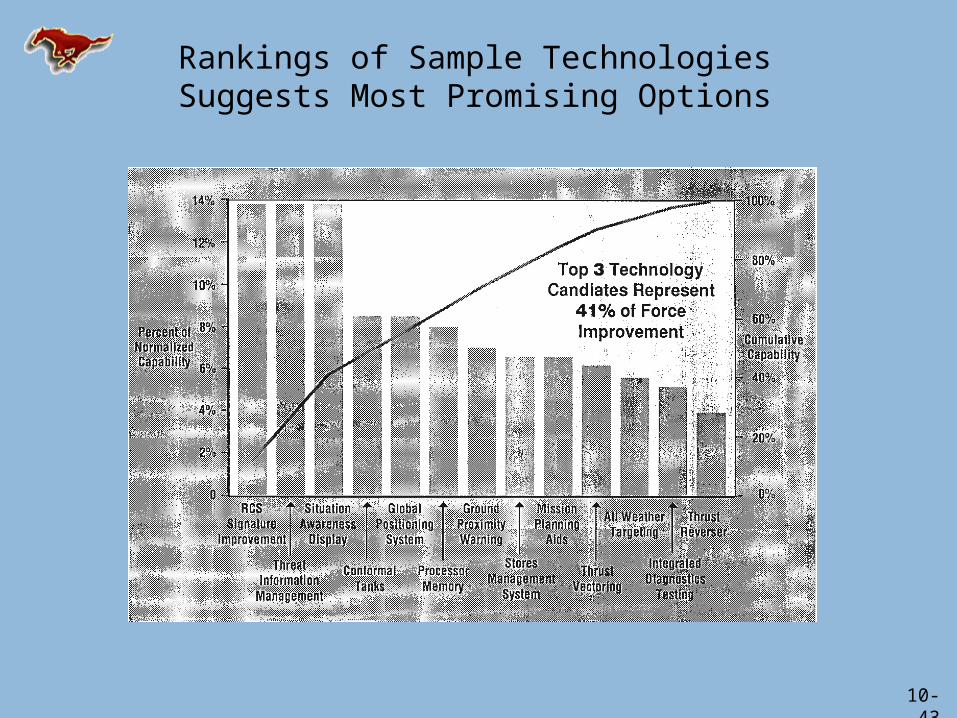
Rankings of Sample TechnologiesSuggests Most Promising Options

10-44
Pre-Design Studies
• Cost - Estimate Life Cycle Cost Components of Technology• Availability - Determine Earliest Implementation Timeframe• Feasibility - Assessment of Technology Impact on Design Margins (i.e., Available
Volume, Weight, Cooling, and Electrical Power). Define Feasible Upgrade Options without Regard to Implementation Time Sequence

10-45
Life Cycle Cost Composition
WEAPON SYSTEM COST
• Tech Data• Publication• Contractor Service• Support Equipment• Training Equipment• Factory Training
• Management• Hardware• Software• Nonrecurring "Start-up"• Allowance for Changes
FLYAWAY COST
PLUS PLUSPLUSPLUS• Initial
Spares• RDT&E• Facility Construction
• Operations & Support (Includes Post-Produc- tion Support)
• Disposal
PROCUREMENT COST
PROGRAM ACQUISITION COST
LIFE CYCLE COST

10-46

10-47
Requirements Analysis

10-48
Principal Steps in ComprehensiveRequirements Analysis Assessments
1. Identify Decision Factors within Broad Decision Categories (Note: This Step Can Be Performed Before or During Pre-Design Studies)
2. Quantify Decision Factors for Each Configuration
3. Analyze Customer Preferences for Each Decision Factor (Note: This Step Can Also Be Performed Before or During Pre-Design)
4. Assign Weights to Decision Factors
5. Score Each Configuration (Sum Weights x Preferences)
6. Perform Sensitivity Analysis on Weights If Configuration Scoring is Close)

10-49
Sample Configuration Decision Categories
Air Vehicle
Effectiveness Cost Risk
Threat AcquisitionAvoidance
Hit AvoidableGiven Acquisition
Sortie Survival Given Hit
Target Acquisition
Target KillGiven Acquisition
Kills per Sortie
Targets KilledOver Time
Flyaway
Weapon System
Procurement
Program Acquisition
Life Cycle
Technical
Cost
Schedule
Producibility
Supportability
Management

10-50
Utility Functions - Preference Indicators
• Utility Functions Provide a Good Technique for Translating Diverse Criteria Into a Common Scale. (i.e., Range in NMi, MTBF in Hours, etc.)• Utility Scores Range From 0 to 1 With 0 Being Least Preferred and 1 Being Most Preferred.
Range in MNi MTBF in hoursThreshold Objective
1 1
Examples
Utility for Range Utility for MTBF
Threshold Objective

10-51
Hints for Determiningthe Shape of Utility Functions
After Establishing theMinimum Requirementsand Goal, Draw NeutralPreference Position asShown Neutral
Preference
1
2 Divide Decision Factorinto Quartiles and Assess 25%, 50%, and 75% Points Relative toNeutral Preference
Req Decision Factor Goal
Req Decision Factor Goal
1
1
Critical,Risk Prone
Non-Critical,Risk Average

10-52
Final Steps in Development of Master Configuration Roadmap
• Time Phase Prioritized Technologies with Yearly Budgets for Upgrades (i.e., Pace Upgrade Implementations with Planned Budgets)
• Resequence Time Phased Prioritized Technology Upgrades as Necessary Dependent on Implementation Availability for New or Emerging Technologies

10-53

10-54
How to Determine a FundingProfile for Program Phases
QUESTION: How to select the development cost so that development and production cost is minimum?
Key Factors: Design Margins Extent of Risk Reduction
Development +Production Cost
Development Cost

10-55
Relating Risk Resolution toDevelopment Cost
Design MarginsRequired
Extentof Risk
Resolution
Extentof Risk
Resolution
DevelopmentCost
H
L
.
.
When risks are resolved development cost increases.

10-56
Relating Design Margins to Production Cost
Design MarginsRequired
Extentof Risk
Resolution
Extentof Risk
Resolution
DevelopmentCost
H
L
.
.
Design MarginsRequired
ProductionCost
When design margins are increased, production costs increase.

10-57
Relating Production Cost and RiskResolution to Development Cost
Design MarginsRequired
Extentof Risk
Resolution
Extentof Risk
Resolution
DevelopmentCost
H
L
Design MarginsRequired
ProductionCost
..
ProductionCost
DevelopmentCost

10-58
Observation
When development cost goes up (due to risk resolution in order to decrease design margins), production cost goes down.
Question: How can development and production cost be balanced?

10-59
How to Determine Development Cost
Development +Production Cost
Development Cost
Sum the development and production cost and graph as a function of development cost.

10-60
Summary of Course
Review different Systems Engineering sub-processes from the perspective of
1. Existing industry standard (i.e., current state-of-the art)
2. Emerging trend not widely implemented
3. Idea for improvement

10-61
Fear Tigers Not Mice
Work to identify risks and decide how to best handle them.
In the absence of periodic focus on risks your program teams will focus on accomplishable tasks.

10-62
Concluding Thoughts
Each of you can implement systems engineering and/or risk management process improvements in areas you are responsible for, assuming existing company procedures do not already dictate a procedure. When company procedures exist, a new procedure “pilot” will many times be a good tack for gaining approval to proceed.
Suggestions for improvements in areas outside your responsibility may be considered and not implemented.
Choose wisely!