1. types of silica glasses - lehigh university jncs silica.pdf · types of silica glasses; ......
TRANSCRIPT

JOURNAL OF NON-CRYSTALLINE SOLIDS 5 (1970) 123--175 © North-Holland Publishing Co.
P R O P E R T I E S AND STRUCTURE OF VITREOUS SILICA. I
R. BROCKNER Max-Planck Institut fiir Silikatforschung, Wiirzburg, Germany
Received 29 January 1970
This review is concerned with the properties and structure of silica glass. The following topics are treated: Types of silica glasses; The vitreous state of silica glasses: thermodynamical approach, atomistic approach; Optical properties: absorption and fluorescence, refractive index and homogeneity; Mechanical and thermal properties: specific volume, volume relaxation, volume and pressure, elastic and internal friction bebaviour, heat capacity and heat conduction, strength, crystallization.
Introduction
The ability of silica to form a series of not less than 22 modifications 1) (not all are modifications in the strong crystallographic sense) from the nearly perfect crystalline quartz to the highly disordered amorphous silica-M, an amorphous phase formed by the action of high speed neutrons, and to the silica glass, is responsible for the great interest in the chemically simple substance SiO z. Furthermore three main reasons are responsible for another great practical and theoretical interest in SiO2, especially in that of silica glass: a) the excellent physical (mechanical, thermal and optical)properties simultaneously connected with excellent chemical resistance, b) the character- istic anomalies of silica glass in comparison to other glasses of mixed type, among these also is the group of silicate glasses, and other glass formers, and c) last but not least, is the significance of SiO 2 as the chief component of the wide variety class of silicate glasses.
It is beyond the scope of this article to present a complete stand of know- ledge of the head-line topic, because this would demand a book-like scale. But it will be tried under this restriction to give a review with considerations and aspects on more recent developments in the termed field with befitting regard to the respectable precedent investigations.
1. Types of silica glasses
The increasing and different demands in the properties of silica glasses in
123
124 R.BRUCKNER
the last two decades required increasing effort in melting processes of silica. This development has not come to an end yet but is still in vigorous progress. To day we have to distinguish between different kinds of silica glasses with respect to properties and structure, there are about four types commercially available 2):
Type I - silica glasses are produced from natural quartz by electrical fusion under vacuum or under an inert gas atmosphere. They contain nearly no OH-groups (about 5 ppm or less) but relatively high metallic impurities of the order of 30-100 ppm AI and 4 ppm Na (all in weight fractions). Commer- cial names are Infrasil3), IR-Vitreosil4), G. E. 105, 201,2045).
Type H - silica glasses are produced from quartz crystal powder by flame fusion (Verneuille-process). Because of the partial volatilization and the absence of any crucible material the metallic impurities are less than in type I silica glasses, but the atmosphere of the hydrogen-oxygen flame causes an OH-content of about 150-400ppm. Trade names are Herasil, Homosil, Optosil3), O.G. Vitreosil4), G.E. 1045). A special thermal treatment in oxygen atmosphere, causing a good optical transparency in the ultraviolet range, leads to Ultrasil 3) silica glass.
Type I I I - silica glasses are synthetic vitreous silicas produced by hydroly- zation of SiCI 4 when spraying into an oxygen-hydrogen flame. This material is practically free from metallic impurities, but contains a high amount of OH, in the order of 1000 ppm, and because of the starting material C1 in quantities of the order of 100 ppm. Trade names: SuprasilS), Spectrosil4), Corning 79406).
Type I V - silica glasses are also synthetic vitreous silicas produced from SiC14 in a water vapour-free plasma flame. These silica glasses are similar to type II1 but contain only about 0.4 ppm OH and about 200 ppm C1. Trade names: Suprasil Wa), Spectrosil WF4), Corning 79436). Another type was produced but only in a single case and on a laboratory scaler). The starting material was silicon of semiconductor-quality which was oxidized in pure oxygen high-frequency plasma flame. The impurity content, especially the OH-content, was extremely low.
The different types of silica glasses have different selective properties and therefore characteristic differences in their network fine structure. This fact and especially the numerous anomalous properties of silica glass at all will be considered in the following sections.
2. The vitreous state of silica glasses
2.1. THERMODYNAMICAL APPROACH
Silica has the ability to form a supercooled liquid by cooling down from

PROPERTIES AND STRUCTURE OF VITREOUS SILICA. I 125
temperatures above the melting point of the high temperature modification of cristobalite and to freeze-in to a solid glass. In spite of the fact that the silicate glasses owe their ability of glass-forming mostly to the silica content, the properties of the silica glass itself differ widely from those of the silicate glasses, although silica is the chief component of all silicate glasses.
I f one considers the typical behaviour of a common silicate glass as a function of temperature, it is evident, that for a glass-forming substance on cooling down the melt will undercool, freeze-in 9) and change to a glass
measurable by a discontinuity in form of a crack of any thermodynamical property, the enthalpy H, the free energy F, or the volume V respectively, or in a break of the first differential quotient. This crack is neither a transfor- mation point of a first nor such of a second order in the sence of Ehrenfest 8), but a transition, in the English terminology: a glass transition "point" , tg.
The characteristic difference between such a point and a second-order transformation point t 2 is given by the kinetic behaviour of these points. When a substance with a second-order transition point is quenched from high temperatures, that point will be shifted to lower temperatures in com- parison to a slower cooling rate.
On the other hand the glass transition point will be shifted to higher tem- peratures by those two treatments (fig. 1). This is the typical behaviour which differentiates the group of glasses from other materials, especially from crystalline and possibly from most other amorphous materials 9) . .
In the case of silica glass we have to consider a first anomalous behaviourU). The volume-temperature curve shows a minimum at a temperature of about 1500°C in the structural (metastable) equilibrium of the (undercooled) melt 12) and also a minimum at about - 80°C in the glassy state. The volume behaviour on quenching in the high-temperature branch of the equilibrium curve (above 1500°C, see fig. 2) is the same as in the case of the common silicate glasses (fig. 1) but not measurable (because of crystallization and of too short relaxation times). In the anomalous region (1000-1500°C) the behaviour is different, especially if one considers the volume behaviour on reheating of a quenched sample (arrows in fig. 2). The volume shifts in the direction of the equilibrium curve are contrary to those of common silicate and other glasses (compare fig. 1): but the qualitatively similar behaviour is the direction of the temperature-shift of the glass transition "poin t" on quenching to higher temperatures with increasing quenching rate. Therefore vitreous silica is "really a glass".
For experimental determination, when the metastable structural equili-
* It was tried theoretically to correlate these two points t2 and tg, and pointed out in ref. 10 that under the special case of very low cooling rates tg may be considered as a t2-point and treated as that to a certain degree.

126 R.BRUCKNER
Y Glass Transition /
o< .-,,~.
.no(moa .~- ---''~ /" , heating ! ] C ° / I E
J i i . i ~ L
Vitreous State / / , r c ' ~ i Stable i l Melt
tgs tgf tm
Second Order T r a n s ~
s~o, ~ co o~:~g / / '
t2f t2s - - ~ " Temperature
Fig. 1. Schemat ic d iag ram of vo l ume- t empe ra t u r e plot for c o m m o n glasses under var ious cooling rates in compar i son to subs tances with a second-order transi t ion. Here, tg = glass t rans i t ion tempera ture ; t2 = second order t r ans fo rmat ion tempera ture ; f - fast, s = slow
cooling rate; tm ~ mel t ing or l iquidus temperature .
brium curve of any substance expected to be a glass is not so easily available as in the case o f typical glasses (because crystallization or decom- position might occur at temperatures above tg), the following method may be applied. The quenched sample is held at a constant tempe- rature below the presumable tg at which the volume relaxation times are experimentally desirable and at which the sample is not altered by crystalli-

P R O P E R T I E S A N D S T R U C T U R E O F V I T R E O U S S I L I C A . I 127
/ Glass Transition of Vitreous Silica /
I
I I I I I
Vitreous Stote Metctstabte or Undercooled Melti ~ Stable Melt I ,,
I I
tg s tgf tg s tgf m
Temperature
Fig. 2. Schematic diagram of volume- tempera ture plot for vitreous silica (types I and lI). On the abscissa, tgs means glass transition temperature for slow and tgf for fast cooling. On the left side of the minimum, the cooling time may range from seconds ("fast" cooling) up to days ("slow" cooling), however, on the right side, they may be of the order of milli- seconds (or shorter) for "fast" cooling, and one tenth of a second for "slow" cooling.
zation or decomposition, and the volume change is observed after different quenching rates. This procedure is repeated at several, or at least at two,
temperatures. Two informations are obtained from those experiments: the
sign and possibly also the amount of the slope of the metastable equilibrium curve and the shift of tg with increasing quenching rate of the sample, and
therefore the decision whether the material in question is a real glass or not.
2.2. ATOMISTIC APPROACH
As known from X-ray 13-2°) and neutron diffraction el,z2) of silica glass
the structural unit consists, like that of most crystalline modifications of
silica, of four oxygen atoms placed at the corners of a tetrahedron with a silicon atom at the center. This statement is well accepted by all authors, as well as the distances between Si-O (1.58/~), O-O (2.6 A), and Si-Si (3.2/~) but not the arrangement of the tetrahedrons forming the cooperative
structure. The geometrical structure concept of oxide glasses at all are very closely
related to those of the silica glass structure and may be divided into four groups.
Group I is due to the concept of the random network hypothesis originally stated by Zachariasen2Z), X-ray proofed by Warren et al. 18 15), confirmed

128 R.BRUCKNER
and modified by a series of authors as Dietze124), Stevels e5 27), Sun28) and Huggins 29).
Group II is based on the concept of the crystallite hypothesis by Lebedev3°), X-ray examined by Randall, Rooksby et aJ.ls), Hartleif 19) and modified by Porai-Koshits 20) and Botvinkin 31).
Group III is based on the microheterogeneous structure concept first claimed by Dietze124,51) as "latent decomposition" in systems with an S- shaped liquidus curve, put forward by Vogel 32 34) and brought to a ther- modynamic-statistical base of phase separation, nucleation and decompo- sition by Cahn 35, 36, 38), Hillig 37), Turnbul139, 40) and Charles 41).
Group IV includes all those hypotheses which are based either on a special a priori-model as that of Tilton's 42) vitron model (pentagonal dode- cahedra), Robinson's 43) rod-like model and so on, or based on pure statisti- cal models of certain partitition functions as put forward by Bell, Dean et al. 44,45).
Besides these geometrical pictures of glass structure, the more energetic structural concepts of oxide glasses are to be distinguished; they may be divided into two other groups.
Group V is characterized by the mixed binding concept of Smeka146,47). In oxide glasses the mixed binding forces are of covalent and heterovalent character and in silica glass this mixture is about 50: 50~. Similar statements were made by Grjotheim and Krogh-Moe 48) who postulated electronega- tivities around 24-0.2 eV as a supposition for glass forming. Winter 49) suggested that the p-electrons should be responsible for glass forming. In addition to Smekal's concept a third kind of binding force is discussed by NollSO), the double bonding between Si and O, so that three mixed binding forces, with almost equal proportions, are acting in silica.
Group VI is due to the concept of the field strength after Dietze124,51), based on the simple electrostatic Coulomb attraction force and due to the concept of the screening theory after Wey152,sa). In both concepts the im- portant factor is the polarization of anions and cations, which, as a first approximation, might be regarded as the covalent part of the mixed binding force concept.
To day, glass scientists tend to regard the groups I and I[ as ideal types or as limit models of possible glass structures and in this sense they are very helpful for the understanding of special kinds of behaviour of glasses. A better approach to the real glass structure gives group III when groups [ and I[ are included, while group IV starts from a more formalistic point of view. All these geometrical concepts give no answer to the question: why is a substance able to go into the vitreous state? Interpretations were tried on account of the more or less polymeric overall network, that the undercooled

PROPERTIES AND STRUCTURE OF VITREOUS SILICA. I 129
melt of substances of that kind has a high viscosity in the neighbourhood of the glass transition range and therefore nucleation and crystallization rates are very low. That means, that the glass forming process is a kinetic problem and therefore depends in principle only on the rate of quenching. But this is not a true interpretation, because it only shifts the problem from one proper- ty to another one.
In the author's opinion the energetic structural concepts are going back to deeper origins. While the field strength concept is concerned with the binding forces between cations and anions, the screening theory 5a), and also former considerations on the coordination tendency51), consider the rela- tions in and between the polyeders, and factors are to be regarded as the polarization, the coordination number and, in the case of multi-component glasses, the ratio of network forming to network modifying cations, trying to regard the whole cooperative problem of the structure of glasses.
Possibly a further step forward in the future will be made in a more definite way than was done by Smekal's mixed binding hypothesis (many non-glass-forming substances have also mixed binding forces) by the appli- cation of the hybrid-function concept, which was successfully applied to amorphous semiconductor materials and non-oxide glasses (chalcogenide glasses) by Krebs54). While the former concept only claims a mixed bonding in general, the hybrid-function concept may give a more specified selection of glass-forming substances because one may get information on the direc- tions of the covalent part of the binding forces and possibly on their distri- bution around the building units.
3. Optical properties
3.l. A B S O R P T I O N A N D F L UORE S CE NCE
The optical absorption behaviour of silica glasses is determined by impu- rities and defects in the structural arrangement in addition to transitions of the electrons of the bridging oxygens into the conduction band (uv-edge) and of the Si-O atomic resonance vibrations (infrared bands).
a) The ultraviolet-edge limits the transmission of an electromagnetic wave to the high frequency side by the interaction with the electrons of a material. This interaction will occur at higher frequencies for stronger bonded elec- trons. That means not only in the case of glasses will the uv-edge be shifted to shorter wavelengths, but this will also occur where higher binding strengths between the atoms and cations and a smaller amount of weak crystalline or amorphous network defects are. Therefore the most "perfect" silica glasses, regarded as especially "pure", like the type HI and IV silica glasses, have the best: transmittance properties [(fig. 3, see also b), next page].

130 R. BROCKNER
100
E c 50 o
Ultrasil
/ ,,/,'-'\ ! \ ~/ ,. \
Type Il l and IV $iIicc: Glasses "ypeIII \ ~\
Somp[e Thickness : 10 mm ' ~ -
0 I . . . . ~- [ F ] 0.16 0.20 0.30 2.0 3.0 4.0
_ - - - WoJelength [ pm ]
Fig. 3. Transmiss ion curves as a func t ion o f wavelength?2).
b) The effect of impurities and network imperfections on the absorption of light is due to the energy loss produced by the so-called colour centers con- sisting of electrons and defect electrons, possibly forming a paramagnetic centre. Those centres give rise to absorption at definite frequencies of electro- magnetic waves.
The absorption band near 0.240 pm (fig. 3) observed in type [ and [[ silica glasses only, corresponds to the fluorescence radiation at 0.280 and 0.390 lam. Its origin is not yet totally clear but it may be contributed to both reduction and impurities, above all germanium and aluminium 55-58). Partial reduction of SiO2 to SiO2_x, where x is of the order of 10 -4.5 (ref. 56), especially at locations of impurity atoms, causes a weakening of the network bonding which means that the electrons at these centres are pushed into the conduc- tion band and have lower energies than those of the network and therefore absorb lower energy of light.
Type II[ and IV silica glasses do not show the 0.240 Ixm absorption and the corresponding fluorescence radiation because they contain nearly no impurities, except hydroxyl groups. But the binding force of the proton is so strong that the energy of the electrons at the SiOH-centres will not be reduced in comparison to those of the perfect SiOa-network. This is independent of the fact, that OH-groups weaken the glass network as a whole considerably (see sections 4.4. and 5.4.)
When silica glasses of type 1 and II are irradiated by X-rays, y-rays or

P R O P E R T I E S A N D S T R U C T U R E OF V I T R E O U S S ILICA. I [ 31
neutrons they become as brown as smoky quartz and show three absorption bands near 0.220, 0.300 and 0.550 ~m; these bands are stronger for type I than for type II at comparable doses 59,6°). This is due to colour centres with adequate lower energy states of the corresponding electrons. These energy states depend on the type of the network imperfections especially caused by Al-centres damaged in different manners for which Stevels 61) gives special structural plausible interpretations, according to which the removal of an oxygen from the AlO4-complex leaves behind a vacancy (0.550 ~tm band) or is excited by radiation processes into an existing vacancy of a double Al-centre (0.300 pm band). It is possible to heal the defect centres by heating the glass to moderate temperatures ( ~ 400 °C); meanwhile definite luminescence glow curves are observed at 160, 2 l 5 (weak) 380 and 590 °K 62-64).
In irradiated silica glasses of type IIl and IV no visible colour effects occur, but only the 0.2201am absorption band is slightly shifted to 0.215 ~tm. The origin of this absorption is not clear, a certain connection with OH- groups is believed to be evident 59,6°) by optical and ESR-measurements. Possibly it is due to an electron transition of a non-bridging oxygen into the conduction band. The corresponding electron transition of a bridging oxygen is due to an absorption below 0. ! 80 pm.
c) Going to longer wave lengths one observes the next absorption at 2.78 ~tm with higher combination vibrations or overtones at 2.4 and 2.2 ~tm, produced by the oscillations of the OH-group. As in other oxide glass formers (B203, GeO/), only the free OH-group exists in silica glasses, contrary to the mixed silicate glasses in which also bonded OH-groups with more or less strong hydrogen bridges to other non-bridging oxygens exist corresponding to 3.6 and 4.2 ~m absorption bands respectively 65, 66).
d) The Si-O oscillations produce absorptions at 9.0, 12.5 and 21 ~m in the infrared and at 12.5 lam in the Raman-spectrum in the form of broad bands in comparison to quartz and cristobalite. The broadening effect is usual for all glasses and is the result of the amorphous structure giving rise to a broader distribution of the possible oscillations than in the ordered arrangements of the corresponding crystalline modifications. The 9.0 ~tm band is associated with the antisymmetrical Si-O valency vibration ( ~ S i - O ~ ~Si), the 21 pm band with the bending vibration of Si-O-Si and O-Si-O respectively, and the 12.5 ~tm band with the symmetrical Si-O valency vibration ( ~ S i - O - S i ~ ) which should be infrared inactive and which is the strongest Raman- line6V-69). Possibly anisometrical influences resulting from cooperative net- work deformations give rise to an antisymmetrical component of the symme- tric pumping vibration at 12.5 pm with an electric dipole moment.
With reference to thermal history, there was observed a slight but measu- rable shift of the 12.5 lam band in transmitting light to shorter wave lengths

132 R. BRUCKNER
with increasing density7°) as a function of fictive temperature (see section 4.1.); no shift of the other two bands was observed. On the other hand, also a shift of the 9.0 and 21 lam band, but to longer wave lengths, was observed in reflecting lightVX).
A calculation of the force constants 68) leads to a value of Ksi_o=4.0 × 10 5 dyne/cm, which is higher in comparison to the GeO2 and BeFz-glasses by a factor of 1.2 and 3.6 respectively being in good agreement with calculated relative Coulombic binding forces.
3.2. R E F R A C T I V E INDEX A N D H O M O G E N E I T Y
The refractive index is shown in fig. 472) as a function of wavelength, from which the dispersion function may be obtained by differentiation.
There is a very slight difference (in the order of about 0.0002) between the
1,5oo.
1,46o
1,420
I I
1,540 t
Q2 0,5 7,0 2.0 3.0 Wavelength [ prn ]
Fig. 4. Refractive index as a function of wavelength 72).
refractive index [and density75)] of type IH and type II silica glasses, the index of the natural silica glasses being the higher one. It is obvious that this difference is due to the water content, according to ref, 73, in contrast to mixed silicate glasses 7a) and to B20 3 glass75,76). This behaviour may be interpreted as follows: in silica glass only the free OH-group, without hy- drogen bonding, is existent, whereas in mixed silicate glasses the existence of hydrogen bonding causes shrinkage in the glass network, which results in

PROPERTIES AND STRUCTURE OF VITREOUS SILICA. I 133
an increase in the refractive index (and also in the density)74) with increasing
OH-content*. The temperature function of the refractive index n is connected to the
thermal expansion coefficient ~:
d n On c~n ~3~o On ~3n d T = ? T + tT~ g T = tTT - 3c~ 3 ~ ' ~o = d e n s i t y .
U s u a l l y t he t o t a l t e m p e r a t u r e coef f ic ien t dn/dT is m e a s u r e d . F o r s i l ica
g lasses t h i s v a l u e is pos i t i ve a n d o f t he o r d e r o f 95 to 103 x 10 - 7 b e t w e e n 15
~n 10 -3
o c O 100 200 300
Fig. 5. Refractive index as a function of temperature 7s).
1, 4,590 t i
86
02,-
1.4500- 120,
J I ~----°C l
L i 4 - i 1 GO0 2 000
Fig. 6. Refractive index as a function of fictive temperature.
* That the B2Oz-glass shows an increase of n with increasing water content although only free OH-groups are present as in the case of silica, is interpreted by local network con- tractions in the neighbourhood of free OH-groups caused by the lower valency and the fiat arrangement of the BOa-group; if a B-O-bond is "b roken" by one proton and an OH- group, the connection of B to the network is only two-fold leading to a closer contact of a BOH-group to the network and to a general contraction 77).

134 R. BR[JCKNER
and 35°C. But for changes of optical lengths in optical arrangements not only dn/dT but also Onfi3Tis of importance.
In fig. 5 the total temperature dependence of n is given for a type I[ silica glass. The discontinuities at 250 and 500 °C are regarded as a result of crys- talline structural units78).
As a function of thermal history, the refractive index shows a maximum as in the case of the density (see section 4.1 .) at a fictive temperature of about 1500°C (fig. 6)75). The values are measured from water-quenched samples which were brought into structural equilibrium at the corresponding fictive temperature. Structural equilibrium means that no changes in n take place with time at constant fictive temperature. The scattering of measurements mainly arises from the birefringence of the quenched samples, caused by thermal stresses. This effect and also the discontinuities of n=n (T) are discussed later in connection with volume and diffusion.
Two kinds of optical inhomogeneities are observed in silica glasses: steady changes of the refractive index and the so-called grain structure. To day, qualities are produced with long range inhomogeneities of the order of
(a) (b)
Fig. 7. Pin-hole pictures of Herasil (a) and Homosil sillica glass (b)72)
An = 2.5 x 10⁻⁶ or better 79, 80). Silica glasses which are not carefully homo- genized (second and third class quality) show a grain structure (fig. 7) when observed with the pin hole method 72). This grain structure obviously is the result of an uncomplete melting process.
4. Mechanical and thermal properties
4.1. SPECIFIC VOLUME
The principal volume-temperature behaviour was already described in section 2.1., fig. 2, but it should be shown in more detail with respect to two

PROPERTIES AND STRUCTURE OF VITREOUS SILICA. I ] 35
groups of silica glasses, the type I and I[ (natural) and type [ [ [ (synthetic silica glasses) respectively (figs. 8 and 9)v0, 75). Both groups differ distinctly and are well measurable in density at room temperature; both groups show the characteristic maximum corresponding to a fictive temperature of 1550 °C (type l/I[ glasses) and 1460°C (type [[I glasses) respectively. But if one calcu- lates the specific volume for the metastable equilibrium fictive temperatures with the help of thermal expansion measurements (see fig. 12), two qualita- tively and quantitatively different structural equilibrium curves are obtained (figs. 8a and 8b). While the type I/[I silica glasses show a minimum volume at 1550°C, the type IIl silica glasses do not show this; the "anomalous" vo- lume branch from 1000 to 1500 °C is turned to a more "normal" branch with a very low positive volume-temperature coefficient. This coefficient is so small with respect to that of the glass, that at room temperature still an "anomalous" volume behaviour results (fig. 9). The high-temperature volume behaviour (fig. 8) is easy to understand if the action of the high OH- content of the type III glasses is similar to that of the alkalioxides, because if one regards the OH-content as impurity, the type IlI glasses are more ira-
i I 0 2 V ( T ) I !
4555 ~-
/ / / . / /
' o,fl/Y
_. ! o C
-200 0 600 1200 1800
(a)
136 R. BROCKNER
45,65
45,60
45,55
45,50
45,45
45.40
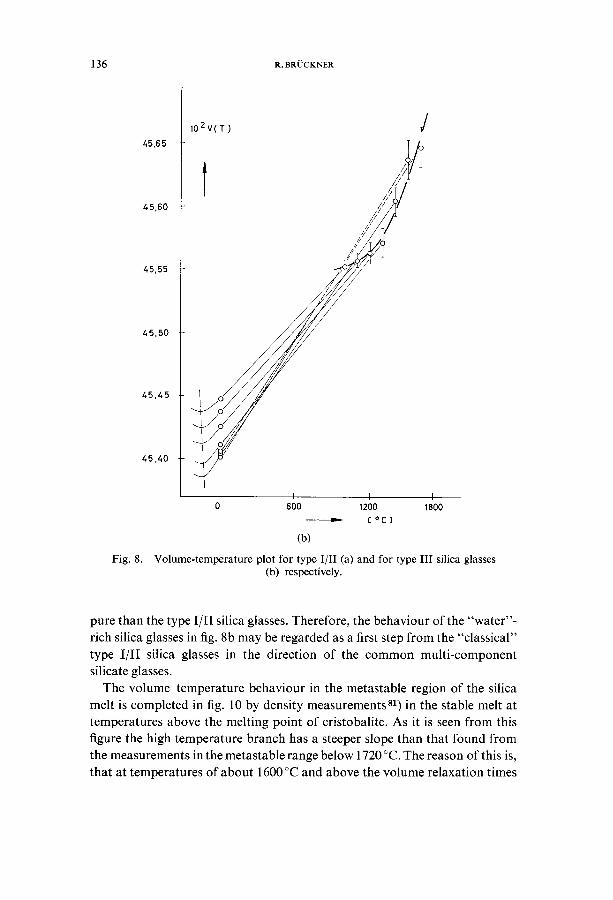
Fig. 8.
102V(T) ////,t /
l ,,T/,
I I = I I 0 600 1200 1800
---m.- [ oc] (b)
Volume-temperature plot for type I/lI (a) and for type II[ silica glasses (b) respectively.
pure than the type I/[I silica glasses. Therefore, the behaviour of the "water"- rich silica glasses in fig. 8b may be regarded as a first step from the "classical" type I/I[ silica glasses in the direction of the common multi-component silicate glasses.
The volume-temperature behaviour in the metastable region of the silica melt is completed in fig. 10 by density measurements 81) in the stable melt at temperatures above the melting point of cristobalite. As it is seen from this figure the high temperature branch has a steeper slope than that found from the measurements in the metastable range below 1720 °C. The reason of this is, that at temperatures of about 1600 °C and above the volume relaxation times

PROPERTIES AND STRUCTURE OF VITREOUS SILICA. I 137
i E u
Z 2 , 2 0 5 0
2,2040
2.2030-
2,2020.
2,2010-
, . m - - - m _
f~
/ ~-~-~"--<D- - - \~ ] . . . . D -He
/ /),,- % o \ .
% \ /[9 - - o
2 O ]n f ras i l (g) Fo. Heroeus • \ CJ Herasi [ (He) ,,
/ !
/
0 Suprasi l (S ) FQ. Heraeus
[] Spectrosi l (SpV)Fe.ThermaI -Synd ica te
O / / / & Spec t ros i i (SpH) , ,
Temperature [ °C ] 2,2002 I 1 I ) I I I I I
000 1 200 1 400 1 600 1 800
Fig. 9. Density, of different silica glasses of type I/II and III, as a function of fictive temperature. • Vitreosil (JR) Fa. Thermal-Syndicate; • Homosil (H) Fa. Heraeus;
• Ultrasil (U) Fa. Heraeus.
b e c o m e smal ler than the q u e n c h i n g t i m e o f the s a m p l e s * [ concern ing the
m e t h o d o f these m e a s u r e m e n t s in the m e t a s t a b l e range it is referred to the
or ig ina l l i terature 7~)].
T h e v o l u m e - t e m p e r a t u r e b e h a v i o u r in the g lassy state is s h o w n in fig. 11
* Within the scope of this review it only may be said that the metastable equilibrium curve of fig. 8 is obtained by keeping the (thin) samples as long, at constant temperatures, as a constant density is measured at room temperature after quenching into water. Correc- tions of the room temperature values to the fictive temperature were carried out by thermal expansion measurements (see below) of samples with the same thermal history (fictive temperatures).

138 R. BRUCKNER
52
51
50
49
48
/-,7
46
45
~02VCT) / o
o
ol
0
/ / !
I i i i I 0 600 1200 1800 2400
- - a , . ~ [ ° C ]
Fig. 10. Volume-temperature diagram including measurements 81) at temperatures above the melting point of cristobalite. © type I/II; V type III silica glasses.
in the form of thermal expansion curves of type II silica glass samples of different fictive temperatures. Those samples with a fictive temperature corresponding to the minimum of the specific volume at 1550°C or 1460°C respectively have the highest thermal expansion, those of higher or lower fictive temperatures have a lower thermal expansion (fig. 12). This is in agreement with the Grtineisen relation :
flcv/o~V = constant,
where fl=compressibility, cv= specific heat, ~=expansion coefficient and V= specific volume.

PROPERTIES AND STRUCTURE OF VITREOUS SILICA. I 139
Fig. 11.
6ao~
6o0- 1°sla~° I I
520.
440.
360~
!
2oo~ i i
!
200--
120-- - " , ,
t
+ 4 0 - \X\ ~ \L
0 I'~
! i\ - 4 0 1 I
- 200
I
I I000 °C -S~mple a
2 : 1720 ° o
3 : lO00 o bl
4 . 1530 o al
,/ I
l 1 1 A 0 200 400 600 O00 lO00
Thermal expansion of silica glasses (type I/II) of different flctive temperatures. Vertical bars: range of older literature data; ©: values at 5 °K after
Keesom and Doborzynski 83).
In the low temperature range, below room temperature, another relation between fictive temperature and volume exists. A characteristic point is the low temperature minimum of the volume. It is shifted to higher tempera- tures with increasing fictive temperature, regardless of the high temperature volume minimum. There is a linear relationship between minimum tempe- rature and fictive temperature within the limit of error (fig. 13). Again a diffe- rence between the group of natural and synthetic silica glasses is found. According to a lower high temperature minimum of the synthetic silica

140 R.BRUCKNER
80
72
64
,2° I 100
80
I0 8 ~ m
©
.o j I !
000
tO 8 ~.rn
1
/ /o o~
/ /
I I I
1400 1800
//,//!// I I
I00O
II 1\ \ b \
\
I I I 1400 1800
- - I r a , , , - Temperature £o C .7
Fig. 12. Thermal expansion coefficient of type I/II (a), and 1II (b), silica glasses as a function of fictive temperature.
glasses, a lower low temperature minimum is found in comparison to the
natural silica glasses. The effect of low temperature negative thermal expansion of vitreous silica,
as well as that of high-cristobalite and high-quartz, may be understood qualitatively with special regard to the transverse vibrations of the oxygen atoms and with the concept that the major contribution to the thermal be- haviour is from transverse oxygen vibrations83), due to the openness of structure and the great freedom of transverse vibrations. It should be ex- pected that most frequencies of the vibrations in an ionic crystal increase when the structure shrinks, because the ions have to move against the strong
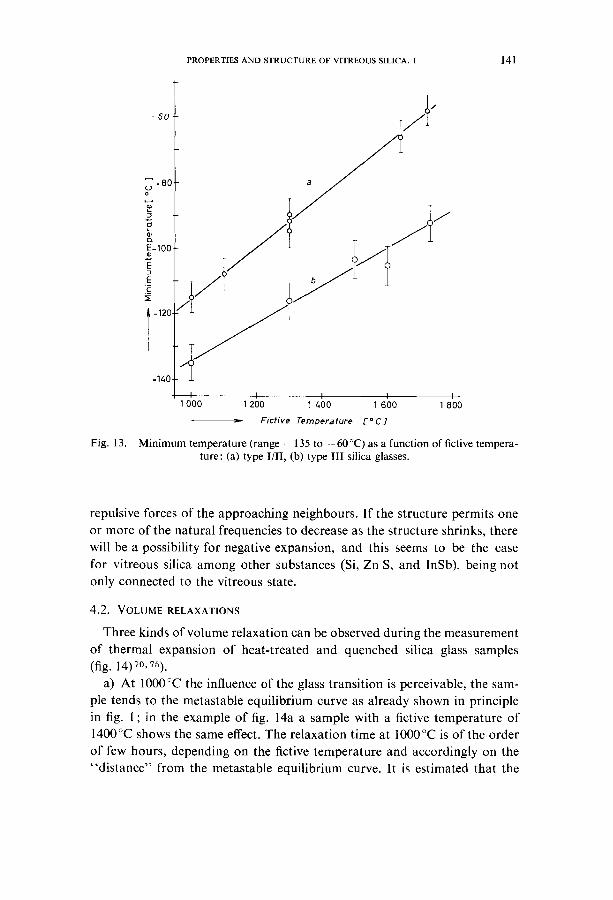
Fig. 13.
P R O P E R T I E S A N D S T R U C T U R E O F V I T R E O U S SILICA. I 141
-,o[ ~ ' - 8 0 o
3 0
~-I0O -g
E c_
-120
-140
/ t /
I I I I 000 1 200 1 400 1 600 1 800
Fictive Temperature [ ° C ]
Minimum temperature (range --135 to --60 °C) as a function of fictive tempera- ture: (a) type I/II, (b) type lII silica glasses.
repulsive forces of the approaching neighbours. If the structure permits one or more of the natural frequencies to decrease as the structure shrinks, there will be a possibility for negative expansion, and this seems to be the case for vitreous silica among other substances (Si, Zn S, and lnSb), being not only connected to the vitreous state.
4.2. VOLUME RELAXATIONS
Three kinds of volume relaxation can be observed during the measurement of thermal expansion of heat-treated and quenched silica glass samples (fig. 14)70,75).
a) At 1000°C the influence of the glass transition is perceivable, the sam- ple tends to the metastable equilibrium curve as already shown in principle in fig. 1 ; in the example of fig. 14a a sample with a fictive temperature of 1400°C shows the same effect. The relaxation time at 1000°C is of the order of few hours, depending on the fictive temperature and accordingly on the "dis tance" from the metastable equilibrium curve. It is estimated that the

142 R. BRE)CKNER
glass transition temperature is about 1100°C for the group of natural silica glasses.
The group of artificial silica glasses has a lower glass transition temperature at about 1000°C. This may be seen from fig. 14b as an example of a 1300°C fictive temperature sample. The trend to the metastable equilibrium curve starts at 800°C and at 1000°C no isothermal volume change is detected within the time of measurement.
b) Between 750 and 950°C a tendency of volume contraction is observed in samples of natural silica glasses in the first expansion curve after quench- ing (fig. 14). The higher the fictive temperature the larger is this effect. The same is true for artificial silica glass at lower temperatures (500-700°C, fig. 14b). These contractions may be attributed to the relaxation of internal structural stresses produced by quenching, because these contractions al- most disappeared in the second expansion curves. It is suggested that the relaxation process in this temperature range is partly connected with a healing process for "open bonds" and that during the first heating up chance
480
I I
4 0 0 -
320
2~oL i
160--
8 0 -
° t - 4 0 f - 200
106 A_.J_l Io
4- o
1400 o -Sornple
I 200
/
2~ I I _~L I l
400 600 k - - i I
800 1000
14a

PROPERTIES AND STRUCTURE OF VITREOUS SILICA. I 143
50
AO
3Of-
20'
A I 10 5 to
/ i
!
o
// i I d
4'
,o i / - 200 0 + 200
/ p
~90 i
--70
I
I ~o L
~Tempera tu re [ °C ]
i - - . i i i
400 600 800 1 000
14b
Fig. 14. The rma l expans ion curves o f type I/II (a), and type III silica glass (b), quenched f rom fictive tempera tures o f 1400°C (a) and 1300°C (b).

144 R. BR/2CKNER
occasional linking of Si-O bonds by regroupings of SiO4-tetrahedra occurs. Accordingly, it should be pointed out that in silica glasses there is the
possibility for compression stresses as well as for tension stresses in the outer part of a sample, and vice versa for the interior part. If a sample is quenched from temperatures above 1550 °C, the usual permanent stress distribution is built up by the latter contraction of the interior rather than the outer part. This produces tension in the temperature range of possible flow in the inte- rior, and a compressive stress in the outer part. But if a sample is quenched from below 1550°C in a not too rapid manner, the latter expansion of the interior part in comparison to the outer one (see fig. 2) produces, by flow in the corresponding temperature range of low enough viscosity, a compression stress in the interior and a tension stress in the outer part.
c) A third volume relaxation of quenched samples is found in the tempe- rature range of 200-300 °C. The characterization of this volume change is the relatively large amount of change, the short relaxation time and the dis- appearance after reheating and slow cooling of the samples. There are two further characterizations, first, that these volume changes are only found in samples which were quenched from temperatures below 1550°C, and secondly, that the natural silica glasses show a contraction whereas the artificial silica glasses show a dilatation (figs. 14a and 14b). Again the relaxa- tion time is shorter for the latter than for the former, possibly due to the high OH-content. It is remarkable, that the relaxation times in this low temperature range are shorter than those at 1000°C; for example, the mean relaxation times for a natural silica glass at 1000°C are extensively larger than 1000 sec, whereas at 200-300°C they are distinctly smaller than 1000 sec. The relaxation process is a very complicated one and cannot be descri- bed by only one mean relaxation time 7~).
Some indications predict that also at 500-600°C volume changes take placer5). Although this effect is small as compared to that at 200-300°C, however, it is not definite that the real effect is also small. This effect is only small in the sense of the sensibility of the thermal expansion measurements and of sample condition, because the volume'relaxation at 500-600°C is only measurable after that at 200-300 °C, which causes a decrease in the sen- sitivity for volume relaxation by a partly healing process in the form of a destruction of internal structural stress caused by transition processes 75, 84).
An interpretation of the complex volume behaviour (sections 4.1 and 4.2) was attempted in the following manner s4) with the help of temperature or density fluctuations and by the existence of preordered regions. Suppose, in the temperature range between the melting point of cristobalite and about 150 °C below the melting point these fluctuations lead to agglomerations of SiO4/2-tetrahedron fragments having properties very similar to those of the

PROPERTIES AND STRUCTURE OF VITREOUS SILICA. I 145
corresponding crystalline phase. These heterophasic* fluctuations could be understood from a statistical point of view in the sense of "embryos" after Volmer and Weber86), and Fischer, Hol lomon and TurnbullS7), being very small and having a high degree of disorder so that by X-ray diffraction no crystallinity will be detectable.
With the help of the postulate of preordered regions the complex volume behaviour may be interpreted**.
a) The branch of the negative thermal expansion (1550-1000°C) may be connected to the negative expansion coefficient of cristobalite in this range; that means, the preordered regions are very similar to cristobalite. Above 1550°C a "thermal decomposit ion" or a "premelt ing" of the preordered regions takes place and the volume temperature curve behaves normally. The "water"-content of the synthetic silica glasses causes a lower viscosity (see section 5.4.) and therefore a lower premelting temperature.
b) The contractions of the natural silica glasses at 200-300 °C will be due to the volume shrinkage of the rapidly quenched preordered regions which will still have "high temperature modification" character and which have the chance, on slow heating during the measurement, to change to the "low- temperature modification"t. The observated volume expansion instead of a contraction in the synthetic silica glasses is attributed to the looser and more open structure and to the higher mobility of the tetrahedra caused by the "water"-content. Therefore the high-temperature preordered state will not be frozen in by quenching as in the case of the natural silica glasses and so a slight and rapid expansion occurs instead of a shrinkage.
c) The negative expansion at low temperatures may be a result of a pre- ferred oscillation of the bending (transverse) vibration mode opposed to longitudinal vibration modes 83) (see last paragraph of section 4.1). The shift in the minimum temperature region with thermal history ( - 135 to - 6 0 °C) seems to be connected to internal structural stresses caused by the quenching process and to the more or less open structure with a different degree of open bonds.
4.3. VOLUME AND PRESSURE
The effects of pressure on glasses can be divided into three categories. First, the applied pressure on the glass below the glass transition temperature
* The concept "heterophasic" should be understood not in the classical thermodynamical sense, but in the sense of the statistical theories of fluctuations85), where the one phase is the undercooled melt and the other one the preordered regions. ** For a more detailed discussion it is referred to ref. 84. * Instead of the expression "modification" it would be better to say "preordered state", or high- or low-temperature preordered state respectively; instead of transformation point: transition range etc. s4)
146 R.BRUCKNER
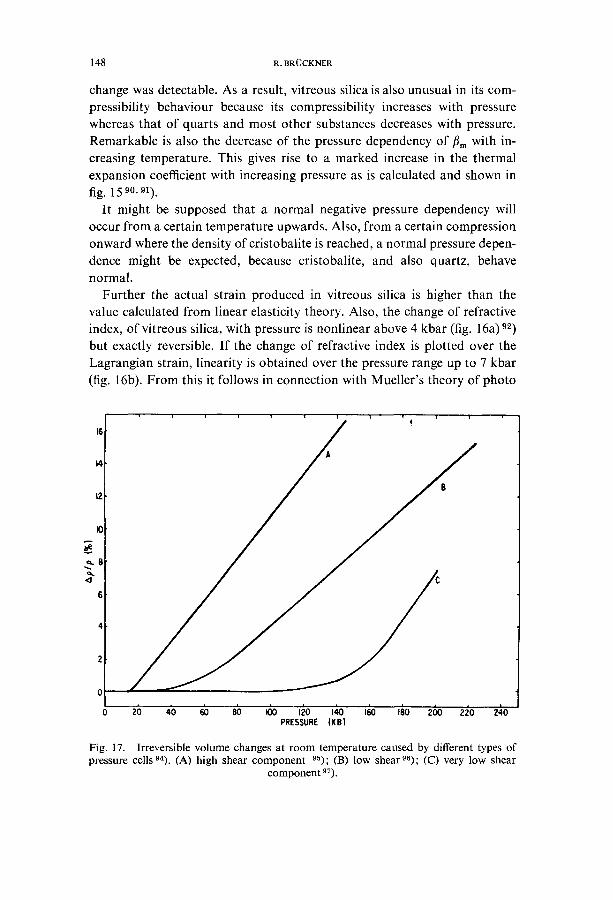
may be low enough for reversibility of the density to be guaranteed; this behaviour is characterized by the volume compressibility. The pressure range of reversibility is strongly dependent on the kind of the pressure cell in question or on the amount of applied shear 94). The better the isostatic con- dition is realized the larger is the pressure range of volume reversibility (fig. 17). The best isostatic conditions are obtained by a silver chloride cell or by any liquid pressure cell.
Second, the applied pressure or the amount of the shear component is large enough to produce "irreversible" or "permanent" (with regard to low enough temperature) volume changes (densification) of glasses in the rigid state.
Third, the glass may be compressed at or above the glass transition tem- perature where the volume relaxation times are usually shorter. Here, large increase in density is possible under relative low applied pressures (below l 0 kbar). Cooling under pressure makes the densification "permanent" if the end temperature is low enough.
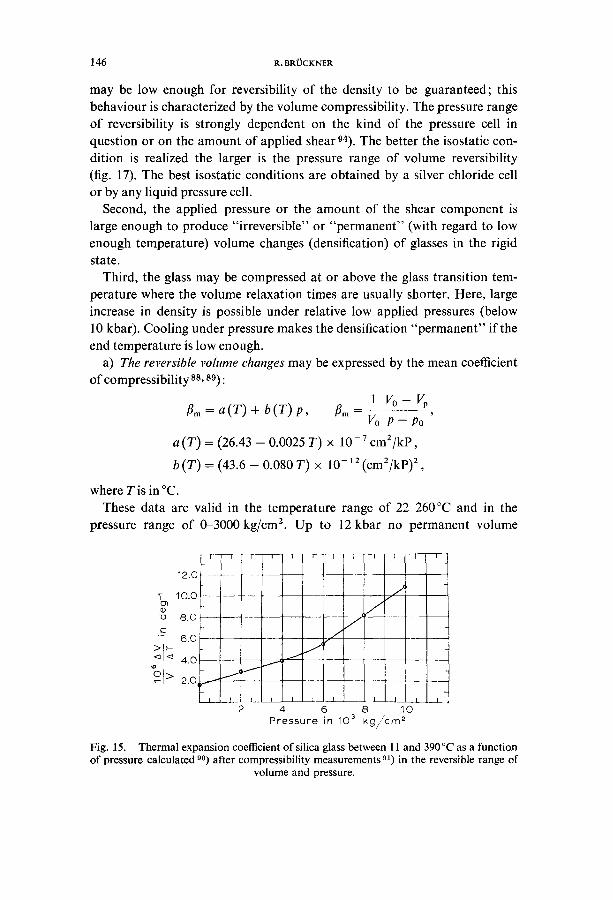
a) The reversible volume changes may be expressed by the mean coefficient of compressibility ss, s9):
IVo-V ~m = a ( T ) + b ( T ) P, ~m --
Vo P - P o
a (T) = (26.43 - 0.0025 T) x 10-7 cm2/kp,
b (T) = (43.6 - 0.080 T) x 10-12 (cm2/kp)2,
where Tis in °C. These data are valid in the temperature range of 22-260°C and in the
pressure range of 0-3000 kg/cm z. Up to 12 kbar no permanent volume
1 2 . 0 - ~ I ~ ~ ' ~
T lO.O D 3
• ] 8 , 0 c
" - 6 .0
"~l'~ 4.0 ~ ,
°i> 2o,t.-J' 2
I I I i i I i
J J
J J
I I I I f I 1 I I I
4 6 8 10 P r e s s u r e in 10 ~ k g / / ' c m 2
Fig. 15. Thermal expansion coefficient of silica glass between 11 and 390 °C as a function of pressure calculated 90) after compressibility measurements 91) in the reversible range of
volume and pressure.

P R O P E R T I E S A N D S T R U C T U R E OF V I T R E O U S S ILICA. I ] 47
6 £
x 4.C
z
u.i
I,.-
~ 2 C
z
z
0
X = 5 8 9 3 ,~
o
o / *
/
9 . / o c/s J
I S O S T A T I C P R E S S U R E ( K , I o b o r )
(a)
o S A M P L E 1
S A M P L E 2
X : 5 8 9 3
= S A M P L E I
° S A M P L E 2
,o I
4.0 laJ
I . -
al:
2: - - 20 L*J ~.~ Z
" r 0
- 0 . 5 - I . 0 - I . 5 - 2 . 0
S T R A I N , z~ V/Vc) ( % )
(b)
Fig. 16. Change of refractive index as a function of pressure (a) and strain (b) in the reversible volume-pressure range 92).
148 R. BRUCKNER
change was detectable. As a result, vitreous silica is also unusual in its com- pressibility behaviour because its compressibility increases with pressure whereas that of quarts and most other substances decreases with pressure. Remarkable is also the decrease of the pressure dependency of tim with in- creasing temperature. This gives rise to a marked increase in the thermal expansion coefficient with increasing pressure as is calculated and shown in fig. 15 90, 91).
It might be supposed that a normal negative pressure dependency will occur from a certain temperature upwards. Also, from a certain compression onward where the density of cristobalite is reached, a normal pressure depen- dence might be expected, because cristobalite, and also quartz, behave normal.
Further the actual strain produced in vitreous silica is higher than the value calculated from linear elasticity theory. Also, the change of refractive index, of vitreous silica, with pressure is nonlinear above 4 kbar (fig. 16a)92) but exactly reversible. If the change of refractive index is plotted over the Lagrangian strain, linearity is obtained over the pressure range up to 7 kbar (fig. 16b). From this it follows in connection with Mueller's theory of photo
14
t2
~e
0 20 40 60 80 I00 120 140 160 180 200 220 " 240 PRESSURE (KB)
Fig. 17. Irreversible volume changes at room temperature caused by different types of pressure cells 94). (A) high shear component 95); (B) low shear96); (C) very low shear
component 97).

P R O P E R T I E S A N D S T R U C T U R E OF V I T R E O U S S ILICA. I 149
elasticity 93), that the voids in vitreous silica are gradually being filled when the medium is elastically compressed. The most probable mechanism may be the gradual movement of some of the voids surrounding oxygen ions by a preferred displacement of the oxygen ions towards the voids in connection with the transverse optical vibration modes of the Si-O-Si bond1°1,1°2).
b) At higher pressures, with more or less shear stress components, irrever- sible volume changes take place up to 15~o densification even at room tempe- rature (fig. 17). At higher temperatures the densification process is facilitated, for instance at 400°C a permanent volume change of 14~o at a pressure of 80 kbar, of 4~o at 60 kbar and no change at 40 kbar is observed in a silver chloride cell 94), whereas no change at 80 kbar pressure is obtained at room temperature. The mechanism of densification is mainly connected with "flow" under shear action (fig. 18)94). First the material undergoes elastic
shrinkage. At higher, not entirely isostatic pressure, rupture of some SiO bonds is produced. The compression in conjunction with a shear stress leads to an interlocking of two parts of the network; this can be attributed to variations in the mutual orientation of SiO4 tetrahedra.
The densification process is influenced by the impurities of vitreous silica. At a constant pressure of 50 kbar at 500 and 600 °C, the densification in- creases in the following manner: Type IV (Suprasil W ) ~ t y p e I I I (Suprasil)~ type I (Infrasil)97). This behaviour may be attributed to the more open
P P P
i i k__
p p p 111 12) (31 141
(a) NO SHEAR
P P t
~ p (11 (21 (31 (4)
Fig. 18.
(b) WITH SHEAR
Possible role of shear on densification of rigid glass (schematic) 94).

150 R. B R U C K N E R
structure of Suprasil due to the high hydroxil content (1200 ppm) as compared with Suprasil W (250 ppm C1). However this does not hold for Infrasil. But, obviously, the higher content of metallic impurities, and the oxygen defi- ciency of Infrasil (240 nm absorption), may affect a densification much more strongly than do hydroxyl groups.
The annealing or the volume expansion with time at atmospheric pressure is a very complex process as shown in figs. 19 and 20 94). At the beginning of annealing, a rapid volume increase within a few minutes is observed. The higher the annealing temperature, the higher is this first volume increase. Later, the rate of volume change decreases markedly. The annealing process is dependent on the mechanical and thermal history. A densified sample, partly annealed at 500 °C, shows another annealing behaviour when further
26
~--
2 5 -
o
mz
l I I
_---o--
700" C
24 -F
' , j
500%
"O-
300%
I I I .I 0 0.5 1,0 1.5
TIME (HR)
,O----
Fig. 19. Annealing of densified silica glass of V0 =23.83 cma/mole at 300, 500 and 700 °C 94).

P R O P E R T I E S A N D S T R U C T U R E O F V I T R E O U S S I L I C A . I 151
26
z5 v
_1 O >
cr
fl~ 24
23
Fig. 20.
700"C
(AI
5000
I I ] I l I I I i I 0 5 I0
TIME (HR)
Annealing o f two specimens of densified silica glass. Effect o f thermal history on initial annealing behaviour at A and B o4).
annealed at 700°C as compared to a less densified sample which was not pre- annealed at 500°C (fig. 20) in spite of the fact that the starting point is the same for both samples (A and B) before the treatment at 700 °C.
Usually, the rate of the first volume increase is the higher the larger the densification. The extent of internal deformations of the network under the applied high pressures is seen from the fact that at the surface of samples, with densities above 2.33 g/cm 3, cristobalite is formed during annealing at a temperature as low as 500 °C.
An estimation of the activation energy of internal °'flow" from initial slopes of the annealing curves gives surprisingly low values of 1-10 kcal/ mole94). A further phenomenological treatment of the second part of the annealing curves by a mathematical formalism of a distribution (spectrum) of activation energies leads to somewhat higher values ranging from 34 to 76 kcal/mole with a sharp maximum at 41 kcal/mole and two broad maxima centred at about 54 and 70 kcal/mole 98.) All values are considerably lower than the activation energies of viscous flow. Care must be taken of the physi- cal significance of these data, but an indication may be given that the compa- ratively low activation energies can be interpreted as being mainly due to reorientations of SiO4 tetrahedra with occasional linking of Si-O bonds taking place during annealing in contrary to real viscous flow.
152 R.BRUCKNER
Measurements of microhardness on densified silica glasses of type l l I at room temperature show interesting irregularities at those densifications (varying from 2.2021 to 2.567 g/cm3), corresponding to the densities of cristobalite, quartz, keatite and stishovite. Also the refractive index shows a similar relation to these modifications 99). This fact is of interest with regard to the concept of preordered regions (section 4.2.). For still higher pressures (up to 120 kbar) and temperatures at which a transition to the crystalline modifications (quartz, coessite, stishovit) takes place, the reader is referred to StUffier and Arndt 99).
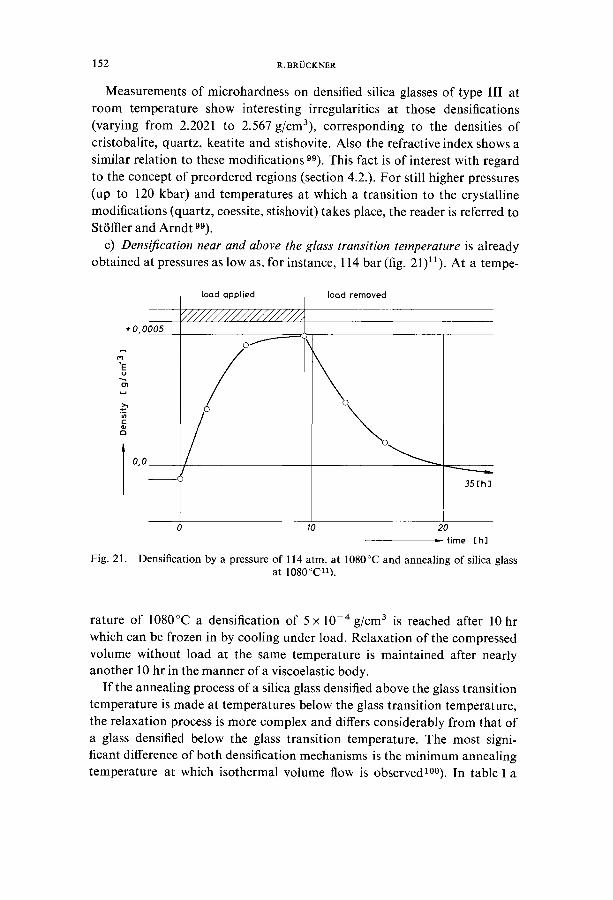
c) Densification near and above the glass transition temperature is already obtained at pressures as low as, for instance, 114 bar (fig. 21)11). At a tempe-
+0,0005
X 'E u
r ~
0,0
toad applied
/
[ood removed
35[h]
Fig. 21.
0 10 20
time [hi
Densification by a pressure of 114 atm. at 1080°C and annealing of silica glass at 1080°C11).
rature of 1080°C a densification of 5 x 10 -4 g/cm 3 is reached after 10 hr which can be frozen in by cooling under load. Relaxation of the compressed volume without load at the same temperature is maintained after nearly another 10 hr in the manner of a viscoelastic body.
I f the annealing process of a silica glass densified above the glass transition temperature is made at temperatures below the glass transition temperature, the relaxation process is more complex and differs considerably from that of a glass densified below the glass transition temperature. The most signi- ficant difference of both densification mechanisms is the minimum annealing temperature at which isothermal volume flow is observedlO0). In table 1 a

PROPERTIES AND STRUCTURE OF VITREOUS SILICA. I 153
TABLE 1
C o m p a r i s o n o f m i n i m u m tempera ture To at which anneal ing is observed in 30 min for densified glasses 1°°)
M i n i m u m tempera ture (°C) Glass t ransi t ion
tempera ture In non-r igid (°C) In rigid state state densified
densified glass glass mel t
B2Oa 230 25 150 SiO2 1200 200 700
comparison between this minimum temperature is listed for densified S i O 2
and B2Oa-glass whereby the annealing time of 30 min is arbitrarily chosen. In the case of silica densifications of 100 AQ/Q = 3.71 to 3.76 were measured
at 1600°C and 15 kbar, in the case of B20 3 a densification of 5.80 at 650°C is obtained at 15 kbar and of 7.50 at 900 °C at a 20 kbar pressurelO0).
For a structural consideration these results show that the amount of densification increases qualitatively with increasing free volume, viz. with increasing temperature, and further more, the densification process in the non-rigid state leaves far less open Si-O or B-O bonds than in the rigid state, because above the glass transition temperature the densification is accompanied by a real viscous flow, and during cooling under pressure, it is accompanied by a thermal healing process. Therefore the glass which is densified in the non-rigid state behaves more stable, below the glass tran- sition temperature, than the rigid state densified glass.
4.4. ELASTIC AND INTERNAL FRICTION BEHAVIOUR
It is a well-known fact, that the elastic moduli also show anomalous beha- viour in two points: the temperature coefficient and the coefficient of large longitudinal elastic strain (of fibers) of the elastic moduli are positive. The latter may be expressed by the experimentally determined expressionsl03):
E = 7.33 (1 + 5.75 5) × 103 kg/mm 2 ,
G = 3.21(1 + 3.065) x 103kg/mm 2,
were E is Young's modulus, G is the rigidity modulus and e the elongation. This behaviour was not only measured on fibers but also on silica glass
rodslO4). This is a consequence of the positive pressure coefficient of the compressibility (see section 4.3a), viz. the equation
1 1 E K . . . . . a - b p -
flm a + b p 3 (1 - 2v) '

1 5 4 R. BROCKNER
where K is the bulk modulus and v Poisson's ratio, holds for compression stress, that means E must increase with increasing tensile stress. Therefore it will be referred to section 4.3a for a discussion on this point.
Both, Young's and the shear modulus versus temperature are increasing in the temperature range - 2 0 0 to 1000 °C1°5,106,10s). Nearly linearity is found from 25 to 800°C. Near 60°K the moduli have a minimum z°7) accompanied by an internal friction peak in the neighbourhood of 35°K at 50-100 kc/s. Above 60°K together with the moduli (Young's and shear) also the Poisson's ratio increases continuously with increasing temperature.
The increase in Young's modulus is in a qualitative way most easily inter- preted as being analogous to the case of rubber stretchingl04,10s). But also other interpretations were given, reducing the problem to the extreme low coefficient of expansion 1°9, no). Considering any modulus M as a function of volume Vand temperature T, M = M(V, T), the total temperature dependence is given by
dT \ c3VJr + OT v
l(aov ) - = coefficient of expansion. ° ¢ = V p
o
o
0 l 280
Fig. 22.
0.278
0 2 7 6
0 274
O. 272
0 2 7 0
0.268
0 2 6 6
900 °
S
\ \ \ % I.R, VIT
• ~5oo-c \
CORNING 7 9 4 0 ~%Ql400oC~ " ,ooP.,O. \
L I I I I a 2.200 2.201 2 2 0 2 2.203 2 .204 2.205 2.206
DENSITY ( g e m ' 3 )
Compressibility of three silica glasses as a function of densityZZZ).

PROPERTIES AND STRUCTURE OF VITREOUS SILICA. I 155
0.175
0.173
0.171
0 I -
0.169 - - 03 -z o (,9
0.167-
QI65
0163
0.161 2 .200
F i g . 23.
5.99
u~ 5 . 9 8 - E u
% ~ 5.97 -- >. F- G o J ~ 5 .96 --
z 0 , ~ 5.95 - -
_J
5 . 9 4 - -
5 . 9 3 2.200
Fig . 24.
1500"o
OPT I •
GE 104 " ~ 140C = •
O.G.VIT •
GEl05 • /
GE 105
/ • INFRASIL
OPT m"
• O . G V I T
'900* I I & I I t
2.201 2.202 2 .203 2 2 0 4 2.205 2.206
DENSITY ( g c m "3)
Po isson 's r a t i o as a f u n c t i o n o f density111).
/
, / / 4 -
o o
c I -o-
/P / x -
# 0 -0--- / O - -
/ o - / " -
/ , , -
i - / + -
I [ r 2.201 2.202 2 .205
LOH SUPRASIL INFRASIL SPECTROSIL CORNING 7 9 4 0 LR. VITREOSIL ACICULAR I , R , VITREOSIL O.G. VITREOSIL OPTOSI L I OPTOSIL rrr GE 104 GE 105
I l 2.204 2.205 2 2 0 6
DENSITY ( g c m - 3 )
D i l a t a t i o n a l v e l o c i t y a s a f u n c t i o n o f d e n s i t y f o r v a r i o u s s i l ica g l a s s e s m ) .

156 R.BRUCKNER
I t follows from this equation that the sign of dM/dT will be governed by the sign of (OM/OT)v, if ~ is negligibly small. As well in the case of a Born-von K~irm~in solid as in the case of a Debye and GriJneisen solid it was shown1°9,11°), that dM/dT is negative at low temperature and large ~, and
positive at high temperature and small ~. For the positive temperature coefficient of M of silica glass the small thermal expansion coefficient plays two important roles: first, the small value of c~ eliminates the always negative volume term (OM/OV)r and second, at small ~ the pure temperature term (OM/8T)v becomes positive from a moderate temperature upward.
As a function of density, produced by thermal history and "water"- content, elastic properties measured at room temperature at acoustic fre- quencies show the following behaviour. The shear velocity, the shear modulus and the compressibility decrease with increasing density, whereas the dilatational velocity, the Lam6 parameter 2 and Poisson's ratio increase with increasing density 1H) (figs. 22-25). While the behaviour of compressi- bility, Poisson's ratio and Young's modulus (from dilatational velocity and from the density itself and from the Griineisen equat ion: / /c~ = const, x ~ V, and from the Lam6 parameter 2) is immediately well understood, an inter- pretation of the behaviour of the shear velocity and shear modulus seems to
Fig. 25.
E ¢J
z >,- ci
¥ 0
::k
420
4 0 0
380
360
540
520
3O0
;;'80
2 6 0
2 4 0
220
2 0 0
180
160
140
3.1120 2 .200
_ ~ O.G. ~/IT \ • II INFRASIL
(~ 9 0 0 * \ • OPT "1[
-- \ • G E 104 •
• ACICULAR "\% v , T
- I \ 4 ,, \ \0 . LOH ,~ "~ \ sup "-- ~25o°
• ~ . e GE 105 \ \ ----.~
\ ~ 1400=
~NIIO0 o GE 104 • • .,9 \ INFRASIL ~,,~, ~ ' \ O.G. V I T •
~ \ . OPT I • '~9 / . \ 1 5 0 0 1400 °
;~, ~ . - 1250 a \ % ~400 o
I I I I l 2 201 2 . 2 0 2 2 2 0 3 2 2 0 4 2 205 2 2 0 6
DENSITY ( g c m -3)
Shear modulus (rigidity) as a function of density for a number of silica glasses111).

PROPERTIES AND STRUCTURE OF VITREOUS SILICA. I 157
be difficult, but it may be indicated that internal stresses in the quenched samples and open bonds or other kinds of inhomogeneities such as the preor- dered regions in the random glass network matrix section (4.2) may be responsible for the shear velocity dependence.
According to the general theory of dispersion any change of an energy- connected variable is related to an energy absorption peak. The deviation of Young's modulus from linear positive temperature dependency at 800 to 1000 °C is connected with an increase of internal friction measured at about 10 c/s in air (fig. 26)7o). In this temperature range the low temperature side of the glass-transition-internal-friction peak is noticeable. Structurally, this friction loss is related to the initial break-down of the polymer network from a rigid glassy state to an undercooled liquid metastable state. As in many other cases again a marked difference is found between the "water"-rich
I 16-
I 14,
12"
10 •
) . 10 - 3
i
~ o - O -
20 ' 26o 4;0
H
U - - -
. . . . I ! /
./
/ 6 ; 0 I I 800 1 000
- ~ T e m p e r a t u r e [ °C ]
( 2 6 a )
"20
14

158 R.BRUCKNER
100"
80,
;k.lO "3
P I
u n t i l 166 a t 1 000 o
SpY-
SpH
116
I00
80
60, S . . . . ~ 60 o
40' ©:
/; 20. =~i' '///:1~o ///H
20 260 I 400 660 8~o 1 o'oo - ~ T e m p e r a t u r e [ °C ]
(26b)
Fig. 26. Internal friction of type I/II and of type III silica glasses (b) as a function of tem- perature (fictive temperature = 1300°C). H = Homosil, U = Ultrasil, I = Infrasil (types
I/II); S = Suprasil, SpV = Spectrosil, SPH = Spectrosil H (types III).
artifical and the "water"-poor natural silica glasses (type I/II). The higher "water"-content o f the type 1II silica glasses causes a shift in the glass- transition temperature to lower temperatures. Here an example exists where silica glasses show a similar behaviour as mult i-component silicate and other oxide glasses. The influence o f OH-content on internal friction in the glass- transition range is closely connected to the viscosity (see section 5.4), which is lowered considerably by the incorporation of OH-groups.
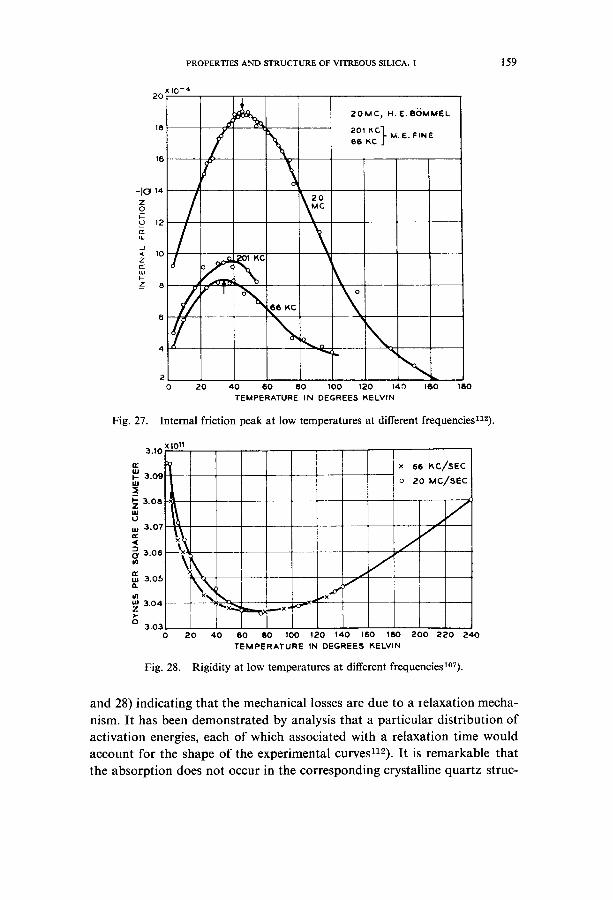
At very low temperatures and high frequencies (ultrasonic, longitudinal waves in the kc/s and Mc/s range) another internal-friction peak is observed together with a minimum of rigidity 1°7,112). The peak and also the minimum of rigidity shift to higher temperatures with increasing frequencies (figs. 27
P R O P E R T I E S A N D S T R U C T U R E O F V I T R E O U S SILICA. 1 159
Fig. 27.
20 X 10 - 4
~ 6 KC 6
~ °
20MC~ H. E ,BOMMEL
201F,C]. M, E. FIN E 66 ~C J
2 0 20 40 60 80 100 120 140 180
TEMPERATURE IN DEGREES I~ELVIN
\ x,..
160
Internal friction peak at low temperatures at different frequenciesn2).
UJ
Z W U W e~
0.
UJ Z
3.10 X 10¹¹
3.09 !
3 . 0 8
3.07 ×
3.06
3.05 T~X~.
3.04
3.03 0 2O
I
I
I I
...-.x- '°"x'~ Lx'~ 40
x 66 KC//SEC
o 9.0 MC/SEC
, / / J
Fig. 28.
60 80 100 120 140 160 180 TEMPERATURE IN DEGREES KELVIN
200 2 2 0 240
Rigidity at low temperatures at different frequenciesZ°7).
and 28) indicating that the mechanical losses are due to a relaxation mecha- nism. It has been demonstrated by analysis that a particular distribution of activation energies, each of which associated with a relaxation time would account for the shape of the experimental curvesn2). It is remarkable that
the absorption does not occur in the corresponding crystalline quartz struc-

160 g. BRCICKNER
ture. The amount of the measured activation energy of 1.03 kcal/mole will be too small for an atomic diffusion process or for a molecular rotation, but too large for the absorption of a shear elastic wave. Therefore the losses are interpreted 112) as being due to Si-O-Si bond deformation vibrations of
those oxygen atoms having alternative positions of equal energies. This hypothesis is confirmed by the successful extrapolation of the relaxation frequencies from the ultrasonic range at low temperatures (35 to 48 °K) to the Raman frequency of 30 c m - 1 at room temperature after the Eyring-type equation
k T -q/kT Zo = - - e with q = 1.03 kcal/mole.
h
Again, differences were observed between type I and type IH silica glasses. The temperature of maximum ultrasonic loss is 43.5°K for an Infrasil "water" - f ree and 47.5°K for a Suprasil synthetic silica glass containing about l03 ppm OH ions, both samples measured at a frequency of 20 Mc/s (longitudinal) 118).
It could be confirmed by recent measurements and by an extend on other fundamental oxide glass formers like GeO2, B203 and AS203114), as well as sodium germanate glassesnS), that the low temperature internal friction effect is attributed to a relaxation of transverse vibrating bridging oxygen atoms 112) in spite of the fact that also a two-bond-length model, based on studies of fast neutron irradiated specimens of silica glass, involving a longi- tudinal motion of bridging oxygen atoms which have two stress-sensitive equivalent equilibrium positions, can explain the effect114).
4.5. HEAT CAPACITY AND HEAT CONDUCTION
According to the expression for the temperature dependency of specific heat
cv = 3 R ~ , E i ( X i ) ,
in which Eis the Einstein function
E ( x ) = x 2 eX / ( e x - - 1) 2 ,
where x = h v / k T = O / T ,
h=Planck ' s constant, v = frequency of proper oscillation, k=Bol t zmann ' s constant, R = g a s constant and 0 = D e b y e temperature, Smyth and co- workers 11~) calculated the specific heat of vitreous silica and showed that best agreement with experimental values is obtained (fig. 29) if the following three characteristic temperatures are chosen: 0s= I100°K for each of the

PROPERTIES AND STRUCTURE OF VITREOUS SILICA. I
' I i i ~ . ~
-L 1 /
~ i t "~ tf
0 ~ I I . 5 0 0 t O 0 0 1500
Temp ( *K)
161
Fig. 29. Heat capacity of vitreous silica as a function of temperature. Solid line: measured liT); dashed line: calculated116).
three silicium vibrations, 0T = 370 °K for each of the three transverse oxygen
vibration modes, and 0L = 1220°K for each of the two longitudinal oxygen oscillations; the 0 i correspond to vibrations in the infrared range o f 23 x l 0 ' z, 7.7 x 10 a / a n d 25.4 x 10¹¹ c/s.
The experimental data in fig. 29, composed by SosmanalV), show a discon- tinuity at about 1100°C. It is remarkable that not all authors have measured
this increase. Possibly, this increase o f the heat content is o f structural origin and may depend on thermal history, because in this temperature range the glass transit ion o f silica takes place. Similar to the increase o f the heat con-
tent at the t ransformat ion of a crystal to its melt, also an increase may be expected, when a glass is heated across the transition temperature, which is called the " regrouping" heat by some authorsllS), because endotherm peaks
in differential thermoanalysis o f some glasses were measured.
It is o f further interest to note, that an excess specific heat o f vitreous silica exists at very low temperaturesllg), whereas no such excess is obser-
vable in quartz and other crystalline substances. This excess heat is the
difference between Cv measured, and Cv calculated from the Debye tempe-
rature and the elastic constants:
C v ( e x c e s s ) : C v ( m e a s . ) - C v ( c a l c . )
Cv(meas.) ~ 2 to 5 X Cv(¢~,c.),

162 R.BRUCKNER
where 1
0(elastic ) = k Cm'
h=Planck 's constant, k=Bol tzmann 's constant, cm=mean sound velocity determined from the density and the elastic constants, n = number of degrees of freedom per cell for lattice vibrations, V¢=volume per cell, D(O/T) is the Debye formula and S = 3R for Si-O-Si, or S = 4 R for the SiO¢ tetrahedron as a vibrational unit. Although no exact explanation can be given for the excess specific heat at temperatures below 20°K, especially below 5 °K, it is important that, in a qualitative way [inconsistent with lattice dynamicsl~0)], a model in which the Si-O-Si bending vibrations can be made responsible for all the low-temperature specific heat 119) and that all of the frequencies required to account for this heat capacity are to be found in the region of optical modes of very low frequencies with an intense continuum extending from 560 cm-1 down to 8 c m - ' as can be shown directly by the Raman spectrum and the Brillouin scattering spectra of silica glass lzl, 122).
A characteristic difference between the vitreous and crystalline state is evident through the temperature dependence of heat-conduction (fig. 30).
cal/cm' sec °C i
/ ~[ge H a a s a B , e r ~ I \ I
\ : i
! ~-T'ffuar/z Crys/a/ : /o,I .1¶ (OAx~s)
A ~([ucken)!
~ i ~ l ~ i " ,o~i --+---- ! ~ ' ~
I ~ ! CaFz r J
"]---~----"-
~ " 7 s~o~.~s -I I Thurmglan g/ass
/0-~ / (PH Keesom)
l~ log 200 300 #00 oK 5L~ T = Fig. 30. Thermal conductivity in crystalline and glassy materialslZZ'124).

P R O P E R T I E S A N D S T R U C T U R E O F V I T R E O U S S I L I C A . l 1 6 3
In analogy with the photons in optical energy transport, the conception of the phonons (high frequency thermoelastic lattice waves), with certain mean free paths, proved important in heat conduction problems (phonon conduc- tion). The longer the mean free path l, the higher the thermal conductivity
~th:
/] 'th : ½cvl, q = - - 2 thAT /Ax ,
where c is the heat capacity per unit volume, v the average sound velocity, q the rate of heat transfer through a unit area per unit time, and Ax the space between the temperature drop AT. According to the regular atomic arrange- ments in crystal layers the crystals have large/-values at low temperatures and therefore a great 2th. The lack of periodicity and symmetry of a lattice in glasses causes large interchange energies between thermoelastic waves such that the mean free path, I is short. It is stated 12~) that in case of glasses l is constant, independent of temperature, except for long wave lengths at low temperatures. Therefore 2th is widely proportional to the specific heat at most temperatures. This is shown for silica glass in fig. 31126) for tempe-
0.0 5O D
6 d
>- ~_O.OlOO _>
2 g
j 0.050 ~[
o
Fig. 31.
I I i i I 1 i I I /
/ /
KINGERY (1955) -.,~/ (INCLUDING RADIATION) /
/ /
/ /
/ WRAY 8~ CONNOLLY (1959) / / J / {EXCLUDING RADIATION
RATCLIFFE (1959) / . ~ - . - - " _ . ~ - -
/ BERMAN 119511 I l I L l l I 1 I
4 0 0 800 1200 1600 200~ TEMP (°C)
Thermal conductivity of silica glass at high temperatureslZ6).
ratures above room temperature. Here, the radiation conductivity (photon conduction)
16an2T 3

164 R.BRUCKNER
(a=Stefan-Bol tzmann constant, n=refract ive index, and x=abso rp t ion coefficient) is eliminated (difference between dashed and solid line)127).
The proportionality between )~th and c v is valid to temperatures as low as liquid-oxygen temperature. At lower temperatures the conductivity decreases more slowly corresponding to an increase in mean free path of the low- frequency thermal waves. In general this is plausible because the disorder of the silica network becomes less important for longer wave lengths. But a more sensitive analysis at temperatures below 20°K have led to difficulties in interpreting the higher values and the "knee" in the thermal conductivity curve around 10°K (fig. 32). These were overcome by assuming a much
I ~4
7 E u
7
[ I 1 i I l / /
/ / / / '
I[I / ,' / /
/ / 1 / / / • /
3 / / /
- /// ,'
21 /'
t , ' / ' - . . . . . . T ( *K) 0 L.~,r" i I J I I J [ I
10 20 30 40 50 60 70 80 90 100
Fig. 32. Thermal conductivity of silica glass at very low temperatures, calculated (curves I, II, 111) 125) and measured13°). Explanations see text.
longer mean free path for the longitudinal than for the transverse waves129,a30): At high frequencies and temperatures, a strong interaction between the two polarization branches, by means of three-phonon processes, result in an effective mean free path of the longitudinal waves, which is nearly the same as that of the transverse waves. This results in a conductivity, given by curve II of fig. 32. At lower frequencies the three-phonon processes are not sufficiently numerous to tie the mean free path of both, longitudinal and transversal, waves. This leads to completely uncoupled longitudinal waves with lengths very much longer than those of the transverse waves,

PROPERTIES AND STRUCTURE OF VITREOUS SILICA. I 165
giving rise to an additional conductivity proportional to T in the range of 0-5°K. Above this temperature the partial coupling causes a decrease (curve D and the superposition leads to the measured "knee" of the total conductivity (curve liD. As in some foregoing sections (4.1 and 4.4), it is remarkable that the available experimental data cannot be explained withoul the assumption that very low frequency waves exist in both the optical and the acoustical branch.
Besides thermal fluctuations, also defects and voids with low-frequency mechanical resonances are to be considered giving rise to spin-"lattice" interactions and relaxations, and to unusual scattering of phonons which influence the short mean free path especially of the transverse phonons131). Therefore, a dependence of thermal conductivity, on thermal history and on type [/[1 as well as on type [[[ silica glasses, is to be expected, and possibly vice versa, from that information on the structural defects.
4.6. STRENGTH
The expression "strength" usually refers to the tensile or bending strength of a material. It is obvious that this property depends on the weakest part of the material and this is mainly the surface, because the surface will be attacked chemically or mechanically. Surface flaws are usually cracks. A glass surface, which was thoroughly fire-polished or etched by hydrofluoric acid, should be free of cracks and should have theoretically maximum tensile fracture strength of ~ of Young's modulus. In the case of silica, this means a strength of about 1.43 x l03 kP/mm 2, or taking into consideration the rela- tion E = E0 (1 + a e) from section 4.4, the intrinsic cohesive strength of vitreous silica is expected to exceed 2.25 × 10³ kP/mm 2. The highest observed strengths reported for silica glass fibers are: 1.5 and 1.6× 10³ kP/mm213%133); the highest strength observed for bulk vitreous silica at 78°K is 1.38 × l03 kP/mm 2 104).
The slightest mechanical damage, such as produced by touching the sam- ple with dirty fingers, causes a serious weakening. Therefore, the usual values are around 600 kP/mm 2. The causes of surface damage are studied exten- sively and described in refs. 104 and 134. Here, only very briefly, should be listed the different types of strength lowering effects: cracks, crystallization, condensation and adsorption of fluids (especially water) and gases, stress corrosion, "static fatigue", and volume fluctuations.
It seems, that a fluctuation process is a practical barrier in achieving the ultimate strength experimentally. But it was shown1°4), that at a temperature of 78 °K the fluctuations are unimportant and that further lowering of the temperature causes no apparent increase in ultimate strength. It can be concluded that the volume fluctuation processes are the reason why the

166 R. BRUCKNER
1500
~ I0OO
! ~oo
Fig . 33.
x X )<X ×XX × X × X X X X X
X X
o o o c o o o o o o o o o o o % ~ ° o °
0 0 o o C O o C ~ O O C O 0 0 0 0 0 0
0 0 0 0 0
• • • o b" lweew m o o o o
• 0o ~ o . . . o . ~ o ~ _ , 0 o • •
lday lmon~.h lyoar 0 1 [ I I I r F I
10 -z 10 ° 10 ~ 104 10 ~ t ime to fracture (rain)
Tens i l e s t r e n g t h a n d s t a t i c f a t i gue of s i l ica g lass f ibers a t r o o m t e m p e r a t u r e in a i r ( O ) a n d in v a c u o ( © ) , a n d a t 1 9 6 ° C in v a c u o ( × ) l z z ) .
strength of silica glass increases with decreasing, and not with increasing, temperature as it could be expected according to the increase in Young's modulus.
Fig. 33 shows the features of the two main reasons of static fatigue of carefully prepared silica glass fibers (20 to 40 ~tm, drawn from a 1 mm dia- meter Vitreosil rod, i.e. type I silica-glass)133); in vacuo at 78°K nearly no fatigue is observed, in vacuo at room temperature only about half of the strength at 78 °C is observed, and fatigue is measured (fluctuation processes), and in air at room temperature, the strength is about ½ that at 78 °K and a stronger fatigue than in vacuo is observed (stress corrosion by water vapour) 134).
Regarding the ultimate strengths (at 78 °K) of silica glass rods 1°4) (1.38 x 10³ kP/mm 2) and silica glass fibers 13z,133) (1.5 × 10³ and 1.6 × 10³ kP/mm2), one might come to the conclusion, that the strength will be practically equal in both cases and the small difference will be due to the greater probability to get a flawless piece of silica glass in the case of fibers. But, if one compares the measurements at room temperature in air, not only between different author groupsl°4,132,133), but also among one and the same team133), a similar difference is found between the strength of about 1 mm rods (580 for the ultimate and 520 kP/mm 2 for the most probable strength) and the strength of fibers (710 for the ultimate and 620 kP/mm 2 for the most probable

P R O P E R T I E S A N D S T R U C T U R E OF V I T R E O U S S ILICA. I 167
strength) in spite of the fact, that the air condition reduces the strength, as compared to vacuo and low temperatures, far more by surface attack and fluctuations than the indicated differences. This fact should give rise to the conclusion that the structure of a drawn fiber is different from that of the bulk glass. This seems to be confirmed in the literature on glass fibers of multi-component composition*, although, partly very inconsistent conclu- sions, and experimental suppositions, yet fiber drawing conditions and results were found. An analysis of the possible silica glass fiber structure was pointed out 140) which led to a model as pictured in fig. 34. This figure does
D i r e c t i o n o f s t r e s s
Fig. 34. Possible structure of silica glass fibers in regions of no preordered habitus.
not show the whole structure but that part of the deformed fluid-like struc- ture without the preordered regions of section 4.2. It will be noted that there are three characteristic points differing from the isotropic structure: first, preferred orientation of silicon tetrahedra rows (double "chain-like") and deformation of the free volume in the drawing direction (arrow); second, the tetrahedra are distorted, slightly stretched in the drawing direction and slightly contracted perpendicular to it; third, the "broken" or "open" bonds may be partly of thermal and partly of mechanical origin. This picture is based on the anisotropy of silica glass fibers, of refractive index (birefrin- gence An,,~ 270 nm/cm of 12 gm fibers), of density, of infrared absorption bands and of oriented crystallization (section 4.7).
4.7. CRYSTALLIZATION
Vitreous silica is one of the few interesting oxide glasses in which the com- position of the crystalline phase is the same as the glass. Heterogeneous
* It is outside the scope of this article to consider that literature; the reader will be direct- ed to refs. 108, 135 139, where also further literature will be cited.

168 R.BRUCKNER
crystallization seems to be the only method to t ransform pure silica glass into cristobalite as the only modification. The heterogeneities are either
surface or impuri ty centres. Even under very pure furnace conditions, very pure vitreous silica crys-
tallizes in the surface at, and above, l l00°C after sufficient long time.
Measurable differences are to be expected between different silica glasses. It is also expected that the crystallization f rom the surface obeys a reaction law
of zero order, i.e. the growth rate is constant (linear kinetics), and that the "water"- r ich silica glasses will crystallize faster than type I / I I silica glasses
f rom the surface, whereas the latter will also crystallize f rom impurity centres if these are of sufficient concentrat ion.
This concept holds true without one exception: the type I silica glasses ("water"-poor , electrically melted) have diffusion-controlled growth kinetics in both water vapour and in oxygen atmospheres 141 143). It is evident, that
this behaviour is determined by oxygen deficiency and by the absence of structural ly-combined water in this silica glass, i.e. in type I (SiO2_x, where x is o f the order o f 10-4.5)56), and that the growth mechanism is controlled by
diffusion of oxygen bearing species too, and by the activation at the glass- crystal interface142). The observed growth rates at 1460°C in a 478 m m
water vapour a tmosphere are: 0.98 lam/min for type I11, and 132 I~m2/min
for an oxygen-deficient (SiO2_ x) silica glass which was prepared from type I l I by de-watering and melting with 70 ppm of silicon (the x-value being
undefinite)*. An increase o f the crystallization rate is found with increasing temperature,
o f course, with increasing water vapour pressure (from a certain pressure on
the growth rate propor t ional to the square roo t o f water vapour pressure) in both types, and with increased oxygen pressure only in the non-stoichio- metric silica glass, the influence of water vapour being larger, by a factor of more than two, than that o f oxygen. In the absence o f oxygen, the crystalliza- t ion o f the latter will also occur, but at a lower rate 143,144). It can be con-
cluded, that an oxygen atmosphere is only impor tant if there is an oxygen
deficiency in the glass, and that a water vapour atmosphere is accelerating the crystallization in two ways: H 2 0 acts as a source of oxygen and as a
* The value of 132 pm2/min in parabolic form represents a slower mean diffusion velocity than the linear one of 0.98 lam/min, i.e. after the same comparable time the thickness of the crystallized layer will be larger in the linear case (0.98/am/rain) than in the parabolic case (132 lam2/min). The crystallization rates, of type I silica glasses, are of the same order as that of the de-watered and reduced type III silica glass (100-200 lam2/min at 1460°C and 480 mm water vapour pressure) depending on the impurity content other than OH and on the degree of oxygen deficiency. It is remarkable that a type IV silica glass (Corning 7943) shows also parabolic growth kinetics (about 30 lam2/min only), that means, it was produced under reducing conditions141).
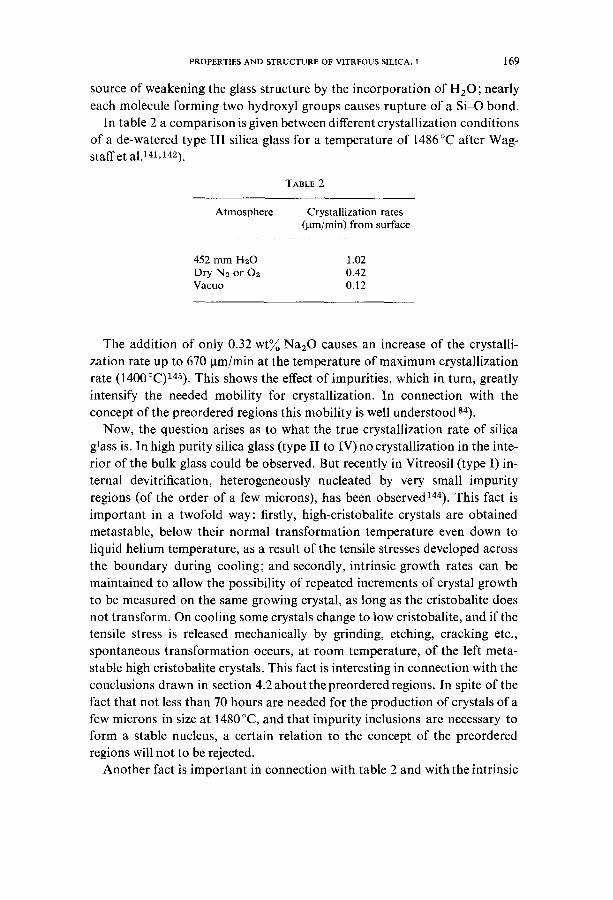
PROPERTIES AND STRUCTURE OF VITREOUS SILICA. I 169
source of weakening the glass structure by the incorporation of H20; nearly each molecule forming two hydroxyl groups causes rupture of a Si-O bond.
I n table 2 a comparison is given between different crystallization conditions of a de-watered type III silica glass for a temperature of 1486°C after Wag- staff et al. 141,142).
TABLE 2
Atmosphere Crystallization rates (lam/min) from surface
452 mm H~O 1.02 Dry N2 or O3 0.42 Vacuo 0.12
The addition of only 0.32 w t~ Na20 causes an increase of the crystalli- zation rate up to 670 gm/min at the temperature of maximum crystallization rate (1400°C)145). This shows the effect of impurities, which in turn, greatly intensify the needed mobility for crystallization. In connection with the concept of the preordered regions this mobility is well understood s4).
Now, the question arises as to what the true crystallization rate of silica glass is. In high purity silica glass (type II to IV) no crystallization in the inte- rior of the bulk glass could be observed. But recently in Vitreosil (type I) in- ternal devitrification, heterogeneously nucleated by very small impurity regions (of the order of a few microns), has been observed144). This fact is important in a twofold way: firstly, high-cristobalite crystals are obtained metastable, below their normal transformation temperature even down to liquid helium temperature, as a result of the tensile stresses developed across the boundary during cooling; and secondly, intrinsic growth rates can be maintained to allow the possibility of repeated increments of crystal growth to be measured on the same growing crystal, as long as the cristobalite does not transform. On cooling some crystals change to low cristobalite, and if the tensile stress is released mechanically by grinding, etching, cracking etc., spontaneous transformation occurs, at room temperature, of the left meta- stable high cristobalite crystals. This fact is interesting in connection with the conclusions drawn in section 4.2 about the preordered regions. In spite of the fact that not less than 70 hours are needed for the production of crystals of a few microns in size at 1480 °C, and that impurity inclusions are necessary to form a stable nucleus, a certain relation to the concept of the preordered regions will not to be rejected.
Another fact is important in connection with table 2 and with the intrinsic

170 R. BRUCKNER
crystal growth rate. At a temperature of 1486°C a growth rate of 0.02 gm/ min occurs and an activation energy very similar to that of viscosity (see section 5.4.)144). This indicates, that even in vacuo very small quantities of impurity cannot be totally excluded. A further fact is, that the growth rate is linear with time, although an electrically melted silica glass of type [ (oxygen deficiency) was used; this shows the overwhelming effect of the presence of oxygen on surface crystallization for type I silica glasses.
The crystallization of pure silica glass to tridymite or quartz under normal atmospheric conditions has not yet been observed. The tridymite transfor- mation above 870°C and the quartz transformation below 870°C is only possible in the presence of mineralizers 1,146).
Under the action of high pressure the high pressure modifications of silica are obtained: keatite, coesite (above 20-40 kbar), and stishovite (above 97-130 kbar). A complete phase diagram is recently presented 147) including quartz, cristobalite, tridymite, coesite and stishovite.
A remarkable fact is, that the transformation under pressure to quartz and to coesite from silica glass is again dependent on water content of the sur- rounding atmosphere and of the compressed silica glass sample, and on the OH-content in the silica glass samplO48). As a result, at a temperature of 500°C and a pressure of 40 kbar, the rate of crystallization to quartz and coesite decreases in the series: silica gel--*GE 204 (wet loading) --.GE 204 and spectrosil (air loading)~spectrosil (dry load ing)~GE 204 (dry loading) ~ G E 204 (ultra-dry loading). The difference between the higher crystalliza- tion rate, of the "water"-rich sample spectrosil and that of the "water"-poor sample GE 204 on the one hand, and the difference between the higher crystallization rate in water vapour and the lower one in dry atmosphere on the other hand, gives rise to the conclusion that water vapour and OH con- tent have a catalytic influence on the crystallization mechanism. It is sugges- ted, that a possible existence of a water-rich region in the vicinity of the interface should be responsible for this behaviour14S). Both these effects, the catalytic influence and the water-rich region, should be enhanced by pressure.
Preferred orientation of cristobalite crystallization on the surface of vitreous silica was observed in two cases.
First, the devitrified surface of a silica glass plate heated at 1200°C for 6 hours shows a habit plane or an orientation to some degree with respect to the surface, but only for the (101) planes of the low-temperature cristobalite, whereas, a completely random orientation is found for the other major c~-cristobalite planes (111), (102) and (200)149).
Second, silica glass fibers, when crystallized at 1200 or 1300°C, show preferred orientation of high- and also of low-temperature crystobalite (fig. 35a). This is only the case if the fibers were fresh and not annealed before

PROPERTIES AND STRUCTURE OF VITREOUS SILICA. I 171
(a)
(b)
Fig. 35. Crystallization of silica glass fibers; (a) crystallized at 1270°C without annealing before crystallization; (b) crystallized at 1270°C after annealing at 1000 °C.
172 R. BRUCKNER
crystallization, because anneal ing causes structural regroupings and a loss
of the glass fiber anisotropy. Therefore no preferred or ientat ion of the
crystallized fiber is detectable when a 10 hours anneal ing at 1000 °C preceded
the crystall ization (fig. 35b). This behaviour is regarded as an evidence that
no surface-influenced crystallization leads to the texture effect as in the
former case, but that the influence of the anisotropic structure of the silica
glass fiber 140) gives rise to the oriented crystallization of the silica glass fiber
to cristobalite.
References
1) R.B. Sosman, The Phases of Silica (Rutgers Univ. Press, New Brunswick, N.J., 1964). 2) G. Hetherington, K. H. Jack and M. W. Ramsay, Phys. Chem. Glasses 3 (1962) 129;
6 (1965) 6. 3) Trademark ofW. C. Heraeus-Schott Comp., Germany, and Amersil Quartz Division,
Engelhard Industries, Inc. 4) Trademark of Thermal Syndicate Ltd., England. 5) Trademark of General Electric Comp., U.S.A. 6) Trademark of Corning Glass Comp., U.S.A. 7) J. H. Rosolowski, Am. Ceram. Soc. Bull. (1966) 68, 381 ; Annual Meeting of the Am.
Ceram. Soc. 8) P. Ehrenfest, Commun. Kamerlingh Onnes Lab. Leiden Suppl. 75b (1933). 9) E. Jenckel, Die glasige Erstarrung der Hochpolymere, in: Die Physik der Hochpoly-
meren, Vol. IIi, Ed. H. A. Stuart (Springer, Berlin, 1955) pp. 608-638; F. Simon, Z. Anorgan. Allgem. Chem. 233 (1931) 219; C. Tammann, Der Glaszustand(Leipzig, 1933); R. Haase, Thermodynamik der Mischphasen (Springer, Berlin, 1956).
10) J. H. Gibbs, Nature of the Glass Transition and the Vitreous State, in: Modern Aspects of the Vitreous State, Vol. I, Ed. J. D. Mackenzie (Butterworth, London, 1960) p. 152; J. H. Gibbs and E. A. DiMarzio, J. Chem. Phys. 28 (1958) 373.
11) R. W. Douglas and J. O. Isard, J. Soc. Glass Technol. 35 (1951) 206. 12) R. Br0ckner, Glastech. Ber. 37 (1964) 459. 13) B. E. Warren, Z. Krist. 86 (1933) 349. 14) B. E. Warren, H. Krutter and O. Morningstar, J. Am. Ceram. Soc. 19 (1936) 202. 15) B. E. Warren and J. Biscoe, J. Am. Ceram. Soc. 21 (1938) 49. 16) W. O. Milligan, H. A. Levy and S. W. Peterson, Phys. Rev. 83 (1951) 226. 17) J. Zarzycki, in: Compt. Rend. IVe Congr. Intern. du Verre, Paris, 1956, p. 323. 18) J. T. Randall, H. P. Rooksby and B. S. Cooper, J. Soc. Glass Technol. 14 (1930) 219. 19) G. Hartleif, Z. Anorgan. Allgem. Chem. 238 (1938) 353. 20) E. A. Porai-Koshits, in: Structure of Glass (Acad. Sci. U.S.S.R., Moscow, 1960)
(Transl. 1960) pp. 9-16. 21) R. J. Breen and A. H. Wever, Glass Structure Research Fellowship, St. Louis Univ.
Rept. July 1, 1952. 22) E. Lorch, Brit. J. Phys. C (Solid State Phys.) 2 (1969) 229. 23) W. H. Zachariasen, J. Am. Chem. Soc. 54 (1932) 3841 ; Glastech. Ber. 11 (1933) 120. 24) A. Dietzel, Glastech. Ber. 22 (1948) 41, 81,212. 25) J. M. Stevels, Progress in the Theory of the Physical Properties o[" Glass (Elsevier,
Amsterdam, 1948). 26) J. M. Stevels, Glass Ind. 35 (1954) 69, 100, 102, 135, 160. 27) J. M. Stevels, Philips Techn. Rev. 22 (1960/61) 300, 337. 28) K. H. Sun, J. Am. Ceram. Soc. 30 (1947) 277.

P R O P E R T I E S A N D S T R U C T U R E OF V I T R E O U S S I L I C A . I 173
29) M. L. Huggins, J. Am. Ceram. Soc. 38(1955) 172. 30) A. A. Lebedev, Tr. Gos. Optich. Inst. Leningrad z (1921) No. 10; Bull. Acad. Sci.
USSR, Sci. Phys. 4 (1940) 584. 31) O. A. Botvinkin, in: Compt. Rend. 1Ve Congr. Intern. du Verre, Paris, 1956, p. 451. 32) W. Vogel and K. Gerth, Glastech. Ber. 31 (1958) 15. 33) W. Vogel, Silikat Tech. 10 (1959) 241 ; Proc. All-Union Conf. Glassy State Leningrad
3 (159) 17. 34) W. Vogel and H. G. Byhan, Silikat Tech. 15 (1965) 212, 239. 35) J. W. Cahn and J. E. Hilliard, J. Chem. Phys. 31 (1959) 688. 36) J. W. Cahn, J. Chem. Phys. 42 (1965) 93. 37) W. B. Hillig, in: Symp. Nucleation and Crystallization in Glasses and Melts, Toronto,
1961 (Ceramic Soc., Columbia, Ohio, 1962) p. 78. 38) J. W. Cahn and R. J. Charles, Phys. Chem. Glasses 6 (1965) 181. 39) D. Turnbull, J. Phys. Chem. 66 (! 962) 609; J. Appl. Phys. 21 (1950) 1022. 40) D. Turnbull, in: Symp. Nucleation ans Crystallization of Glasses and Melts, Toronto,
1961 (Ceramic Soc., Columbia, Ohio, 1962) p. 75. 41) R.J . Charles, J. Am. Ceram. Soc. 46 (1963) 235 ; 47 (1964) 559 ; 49 (1966) 55. 42) L. W. Tilton, J. Res. Natl. Bur. Std. 59 (1957) 139. 43) H.A. Robinson, J. Phys. Chem. Solids 26 (1965) 209. 44) R.J . Bell and P. Dean, Nature 212 (1966) 1354. 45) R. J. Bell, N. F. Bird and P. Dean, Brit, J. Phys. C (Proc. Phys. Soc.) [2] 1 (1968) 299. 46) A. Smekal, Novo Acta Leopoldina N F 11 (1942). 47) A. Smekal, Glastech. Ber. 22 (1949) 278; J. Soc. Glass Technol. 35 (1951) 411. 48) K. Grjotheim and J. Krogh-Moe, Glastek. Tidskr. 11 (1956) 47. 49) A. Winter, J. Am. Ceram. Soc. 40 (1957) 54. 50) W. Noll, Naturwissenschaften 49 (1962) 505 ; Angew. Chem. 75 (1963) 123. 51) A. Dietzel, Z. Elektrochem. 48 (1942) 9. 52) W. A. Weyl, J. Soc. Glass Technol. 35 (1951) 421 ; Glastech. Ber. 30 (1957) 53) W. A. Weyl and E. Ch. Marboe, The Constitution of Glasses; A Dynamic Interpreta-
tion, Vols. 1 and 2 (Wiley-Interscience, New York, 1962, 1965). 54) H. Krebs, Angew. Chem. 70 (1958) 615 ; 78 1966) 577. 55) V. Garino-Canina, Verres R6fractairees 10 (1956) 63, 151. 56) T. Bell, G. Hetherington and K. H. Jack, Phys. Chem. Glasses 3 (1962) 141. 57) A.J. Cohen, Phys. Rev. 105 (1957) 1151. 58) A.J . Cohen, J. Chem. Phys. 23 (1955) 765. 59) J. S. van Wieringen and A. Kats, Philips Res. Rept. 12 (1957) 423. 60) R. A. Weeks and E. Lell, J. Appl Phys. 35 (1964) 1932. 61) J. M. Stevels, Glastech. Ber. 32 (1959) 307; Philips Res. Rept. 11 (1956) 103; in:
NonCrystalline Solids, 1958, Ed. V. D. Fr6chette (Wiley, New York, 1960) pp. 412~148.
62) R. Yokota, Phys. Rev. 91 (1953) 1913. 63) M. Lautout, J. Chim. Phys. 52 (1955) 169. 64) S. Cohen, Bull. Soc. Franc. Ceram. No. 56 (1962) 29; Verres R6fractaires 23 (1969)
189. 65) A.J . Harrison, J. Am. Ceram. Soc. 30 (1947) 362. 66) H. Scholze, Glastech. Ber. 32 (1959) 81,142. 67) E. R. Lippingcott, A. van Valkenburg, Ch .E . Weir and E. N. Bunting, J. Res. Natl.
Bur. Std. 61 (1958) 61. 68) J. Zarzycki and F. Naudin, Verres R6fractaires 14 (1960) 1. 69) P. H. Gaskell, Trans. Faraday Soc. 62 (1966) 1493, 1505. 70) R. Briickner, Glastech. Ber. 37 (1964) 500. 71) P .H. Gaskell and F. J. Grove, in: Compt Rend. Vile Congr. Intern. du Verre, Brussels,
1965, No. 363. 72) H. Mohn, in: 60 Jahre Quarzglas, 25 Jahre Hochvakuumtechnik, Ed. W. C. Heraeus
(1961) pp. 105-130.

174 R.BRUCKNER
73) G. Hetherington and K. H. Jack, Phys. Chem. Glasses 3 (1962) 129. 74) H. Scholze, H. Franz and L. Merker, Glastech. Ber. 32 (1959) 421. 75) R. Briickner, Glastech. Ber. 37 (1964) 459; 38 (1965) 153. 76) W. Poch, Glastech. Ber. 37 (1964) 533. 77) H. Scholze, Glas-Email-Keramo-Tech. 19(1968) 389. 78) A. Winter and M. J. Cabannes, Compt. Rend. (Paris) 240 (1955) 2397. 79) H. Rau, in: 60 Jahre Quarzglas, 25 Jahre Hochvakuumtechnik, Ed. W. C. Heraeus
(1961) pp. 77-104. 80) V. Garino-Canina, Rev. Opt. Th6or. Instr. 34 (1955) 323. 81) J. F. Bacon, A. A. Hasapis and J. W. Wholley, Phys. Chem. Glasses 1 (1960) 90. 82) W. H. Keesom and D. W. Doborzynski, Physica I (1934) 1058. 83) H. T. Smyth, J. Am. Ceram. Soc. 38 (1955) 140. 84) R. Brfickner, Glastech. Ber. 37 (1964) 536. 85) J .I . Frenkel, Statistische Physik (Akademie-Verlag, Berlin, 1957) ch. IX;
J. I. Frenkel, Theory of Fluids (Akademie-Verlag, Berlin, 1957) ch. VII. 86) M. Volmer and A. Wever, Z. Physik. Chem. 119 (1926) 277. 87) J. C. Fischer, J. H. Hollomon and D. Turnbull, J. Appl. Phys. 19 (1948) 775. 88) P. W. Bridgman, Am. J. Sci. 10 (1925) 359. 89) J. Reitzel, J. Simon and J. A. Walker, Rev. Sci. Instr. 28 (1957) 828. 90) C. L. Babcock, S. W. Barber and K. Fajans, in: III Congr. Intern. de Vetro, Venezia,
1953, p. 202. 91) F. Birch and R. B. Dow, Bull. Geol. Soc. Am. 47 (1936) 1235. 92) K. Vedam, E. D. D. Schmidt and R. Roy, J. Am. Ceram Soc. 49 (1966) 531. 93) H. Mueller, Physica 6 (1935) 179. 94) J. D. Mackenzie, J. Am. Ceram. Soc. 46 (1963) 461,470. 95) R. Roy and H. M. Cohen, Nature 190 (1961) 789; Phys. Chem. Glasses 6 (1965) 149. 96) E.B. Christiansen, S. S. Kistler and W. B. Gogartz, J. Am. Ceram. Soc. 45 (1962) 172. 97) P. W. Bridgman and J. Simon, J. Appl. Phys. 24 (1953) 405 ;
J. Arndt, J. Am. Ceram Soc. 52 (1969) 285. 98) R. M. Kimmel and D. R. Uhlmann, Phys. Chem. Glasses 10 (1969) 12. 99) J. Arndt and D. St6ffler, Phys. Chem. Glasses 10 (1969) 117;
D. StOffler and J. Arndt, Naturwissenschaften 56 (1969) 100. 100) J .D. Mackenzie, J. Am. Ceram. Soc. 47 (1964) 76. 101) H.T. Smyth, J. W. Londree and G. E. Lorey, J. Am. Ceram. Soc. 36 (1953) 238. 102) 14. T. Smyth, J. Am. Ceram. Soc. 42 (1959) 276. 103) F. P. Mallinder and B. A. Proctor, Phys. Chem. Glasses 5 (1964) 91. 104) W. B. Hillig, in: Symposium sur la R~sistance M~chanique du Verre et les Moyens de
l'Amdliorer, Florence, 1961 (Union Scientifique Continentale du Verre, Charleroi, Belgium, 1962) pp. I-1/1-31.
105) J. W. Marx and J. M. Sivertsen, J. Appl. Phys. 24 (1953) 81. 106) H.J . McSkimin, J. Appl. Phys. 24(1953) 988. 107) M. E. Fine, H. van Duyne and N. T. Kenney, J. Appl. Phys. 25 (1954) 402. 108) E. Deeg, Glastech. Ber. 31 (1958) 124;
S. Spinner and G. W. Cleek, J. Appl. Phys. 31 (1960) 1407. 109) G.J . Dienes, J. Phys. Chem. Solids 7 (1958) 290. 110) O. L. Anderson and G. J. Dienes, in: Non-Crystalline Solids, 1958, Ed. V. D. Fr6-
chette (Wiley, New York, 1960) pp. 449-490. 111) D. B. Fraser, J. Appl. Phys. 39 (1968) 5868. 112) O. L. Anderson and H. E. B6mmel, J. Am. Ceram. Soc. 38 (1955) 125. 113) J .T. Krause, J. Am. Ceram. Soc. 47 (1964) 103. 114) R. E. Strakna and H. T. Savage, J. Appl. Phys. 35 (1964) 1445. 115) C. R. Kurkjian and J. T. Krause, J. Am. Ceram. Soc. 49 (1966) 134. 116) H.T. Smyth, H. S. Skogen and W. B. Harsell, J. Am. Ceram. Soc. 36 (1953) 327. 117) R. B. Sosman, The Properties of Silica (The Chemical Catalog Comp., New York,
1927) p. 313.

P R O P E R T I E S A N D S T R U C T U R E O F V I T R E O U S SILICA. I 175
118) W. Geffcken and N. Neuroth, Glastech. Ber. Sonderband 32K (1959) V/48-53. 119) O. L. Anderson, J. Phys. Chem. Solids 12 (1959) 41. 120) M. Born and K. Huang, Dynamic Theory of Lattices (Oxford Univ. Press, 1954) ch. 3. 121) P, Fulbacher, A. J. Leadbetter, J. A. Morrison and B. P. Stoicheff, J. Phys. Chem.
Solids 12 (1959) 53 ; A. J. Leadbetter, J. Chem. Phys. 51 (1969) 779.
122) St. M. Shapiro, R. W. Gammon and H. Z. Cummins, Appl. Phys. Letters 9 (1966) 157 123) J. M. Stevels, in: Encyclopedia of Physics, Vol. 13, Ed. S. Fliigge (Springer, Berlin,
1962) p. 577. 124) C. Kittel, Phys. Rev. 75 (1949) 972. 125) P. G. Klemens, in: Non-Crystalline Solids, 1958, Ed. V. D. Fr6chette (Wiley, New
York, 1960) pp. 508-528. 126) W. D. Kingery, J. Am. Ceram. Soc. 38 (1955) 251 ; 44 (1961) 302. 127) K. L. Wray and T. J. Connolly, J. Appl. Phys. 30 (1959) 1702. 128) E. H, Ratchiff, Brit. J. Appl. Phys. 10 (1951) 108. 129) P. G. Klemens, Proc. Roy, Soc. (London) A 208 (1951) 108. 130) R. Berman, Proc. Roy. Soc. (London) A 208 (1951) 90, 131) P. G. Klemens, J. G. Castle and D. W. Feldman, Plays. Chem. Glasses 2 (1964) 104. 132) J. G. Morley, P. A. Andrews and J. Whetney, Phys. Chem. Glassew 5 (1964) 1. 133) B. A. Proctor, I. Whitney and J. W. Johnson, Proc. Roy. Soc. (London) A 297 (1967)
534. 134) R. J. Charles and W. B. HiUig, in: Symposium sur la R~sistance M~chanique du Verre
et les Moyens de l'Amdliorer, Florence, 1961 (Union Scientifique Continentale du Verre, Charleroi, Belgium, 1962) pp. II-3/1-17.
135) J. B. Murgatroyd, J. Soc. Glass Technol. 28 (1944) 368, 388. 136) S. Bateson, J. Soc. Glass Technol. 37 (1953) 302. 137) W. F. Thomas, Nature 181 (1958) 1006; Phys. Chem. Glasses 1 (1960)4. 138) W. H. Otto, J. Am. Ceram. Soc. 44 (1961) 68. 139) L. Merker, in: Symposium sur la R~sistance Mdchanique du Verre et les Moyens de
l'Am~liorer, Florence, 1961 (Union Scientifique Continentale du Verre, Charleroi, Belgium, 1962) pp. 567-687.
140) R. Brfickner, in: Compt. Rend. Vile Congr. Intern. du Verre, Brussels, 1965 No. 38/ 1-12, 1.3.2.
141) F. E. Wagstaff, S. D. Brown and I. B. Cutler, Phys. Chem. Glasses 5 (1964) 76. 142) F. E. Wagstaff and K. J. Richards, J. Am. Ceram. Soc. 48 (1965) 382; 49 (1966) 118. 143) J. Hlavac and L. Vaskova, Silicaty 9 (1965) 237. 144) F. E. Wagstaff, J. Am. Ceram. Soc. 51 (1968) 449. 145) A. Dietzel and H. Wickert, Glastech. Ber. 29 (1956) 1. 146) O. W. Fl6rke, Ber. Deut. Keram. Ges. 38 (1961) 89. 147) D. St6ffler and J. Arndt, Naturwissenschaften 56 (1969) 100. 148) D. R. Uhlmann, J. F. Hays and D. Turnbull, Phys. Chem. Glasses 7 (1966) 159. 149) R. F. Hochman and J. D. Fleming, J. Am. Ceram. Soc. 47 (1964) 104.