1. summary of developments 2002 - · pdf file2.1.4. air transport movements, scheduled...
TRANSCRIPT

555
1. Summary ofDevelopments 2002
Developments
Statistical Annual Review 2002

1.1.1.
Employment, area Amsterdam Airport Schiphol 1993-2002*)
1993 1994 1995 1996 1997 1998 1999 2000 2001 2002 Compared to
2001 in %
North 944 1,500 1,699 1,196 1,025 1,418 1,642 1,365 1,413 1,447 + 2.4
South 2,097 2,639 2,849 2,953 3,043 2,670 2,554 2,706 2,902 2,636 - 9.2
East 7,317 6,214 6,284 6,664 7,391 7,998 8,678 9,444 9,118 9,651 + 5.8
South-east - - - - 213 1,214 1,664 2,712 2,975 3,394 + 14.1
Centre 27,203 28,300 30,041 32,588 34,847 35,917 36,555 38,352 38,446 39,442 + 2.6
Grand total 37,561 38,653 40,873 43,401 46,519 49,217 51,093 54,579 54,854 56,570 + 3.1
*) Number of employees (temporary employees included, Fokker employees excluded)

111111
2. Air Transport Movements
Statistical Annual Review 2002
MovementsMovements

2.1.1.
Air transport movements, per country/continent annual totals 1993 - 2002
1993 1994 1995 1996 1997 1998 1999 2000 2001 2002 Compared to2001 in %
Austria 5,062 4,759 5,534 6,791 7,378 7,735 9,216 11,416 11,221 10,418 - 7.2
Belgium 8,396 8,662 8,539 8,640 9,351 9,306 10,946 10,665 10,385 5,754 - 44.6
Denmark 7,173 7,065 7,747 8,602 8,814 8,555 8,353 8,776 8,812 8,851 + 0.4
Finland 1,860 1,949 2,165 2,188 2,582 3,653 3,645 3,704 4,021 3,474 - 13.6
France 16,758 17,535 18,990 20,579 23,434 24,270 26,518 25,434 24,746 23,671 - 4.3
Germany 29,494 30,069 30,288 35,593 39,058 46,428 47,071 49,905 44,360 40,884 - 7.8
Great Britain 58,650 63,464 65,482 73,442 79,907 85,117 87,117 94,208 96,824 93,990 - 2.9
Greece 6,676 7,368 6,636 6,373 7,007 7,366 8,594 8,933 9,006 8,854 - 1.7
Ireland 1,787 1,924 2,235 3,098 3,795 4,253 5,081 4,686 5,433 5,137 - 5.4
Italy 10,942 10,978 11,771 13,744 15,549 17,914 19,648 22,724 22,600 22,310 - 1.3
Luxembourg 1,452 1,519 1,505 1,766 2,252 2,395 2,844 2,566 2,129 2,101 - 1.3
Netherlands 8,107 8,078 10,769 12,680 13,216 12,921 8,388 7,718 7,401 6,589 - 11.0
Portugal 2,847 3,277 3,426 3,334 3,485 4,024 4,673 5,077 6,166 6,790 + 10.1
Spain 14,136 15,113 15,747 15,885 17,247 19,348 20,730 22,032 25,179 26,015 + 3.3
Sweden 9,261 8,782 8,764 9,814 11,284 12,099 13,231 13,536 12,197 8,966 - 26.5
Total E.U.*) 182,601 190,542 199,598 222,529 244,359 265,384 276,055 291,380 290,480 273,804 - 5.7
Rest of Europe 34,263 37,618 39,677 43,274 45,705 49,165 53,629 57,340 58,216 58,764 + 0.9
Total Europe 216,864 228,160 239,275 265,803 290,064 314,549 329,684 348,720 348,696 332,568 - 4.6
North America 15,140 16,046 17,901 19,440 20,442 21,746 22,922 23,419 22,554 22,516 - 0.2
Latin America 4,615 4,546 5,223 5,677 6,400 6,715 6,537 6,813 7,746 8,228 + 6.2
Africa 6,903 7,595 7,841 8,451 8,770 9,266 10,131 10,810 11,485 12,454 + 8.4
Middle East 6,392 7,099 7,861 8,550 9,290 9,706 9,662 9,515 9,373 9,639 + 2.8
Far East 9,761 10,618 12,588 13,858 14,510 14,828 14,670 15,651 16,608 15,980 - 3.8
Total intercontinental 42,811 45,904 51,414 55,976 59,412 62,261 63,922 66,208 67,766 68,817 + 1.6
Grand total 259,675 274,064 290,689 321,779 349,476 376,810 393,606 414,928 416,462 401,385 - 3.6
*) The 15 official members of the European Union

2.1.2.
Air transport movements, main European origins/destinations 1993 - 2002
1993 1994 1995 1996 1997 1998 1999 2000 2001 2002 Compared to2001 in %
Europe
1. London Heathrow 16,966 16,255 16,318 16,713 16,276 17,105 17,121 16,754 17,358 17,381 + 0.1
2. Paris Charles de Gaulle 8,262 8,524 8,456 8,713 9,450 9,844 11,359 12,330 11,776 11,483 - 2.5
3. Barcelona 2,649 2,875 2,507 2,452 2,928 4,181 4,339 5,451 7,185 8,096 + 12.7
4. Manchester 6,111 6,571 6,811 6,657 7,676 8,347 8,756 9,968 8,985 8,063 - 10.3
5. London Gatwick 3,620 3,454 3,367 5,791 5,477 6,057 5,689 4,776 5,820 7,405 + 27.2
6. Zürich 5,648 5,741 5,753 5,927 6,439 6,842 7,038 7,076 6,961 7,095 + 1.9
7. Madrid 4,247 3,802 3,217 3,485 3,646 5,006 5,377 5,999 6,395 6,876 + 7.5
8. Birmingham 2,726 3,622 5,245 5,641 5,644 6,455 6,796 7,726 6,960 6,820 - 2.0
9. Frankfurt 5,682 5,049 5,436 5,522 5,303 5,684 6,246 6,960 7,004 6,811 - 2.8
10. Copenhagen 5,550 4,994 5,038 5,226 5,400 6,122 6,326 6,691 6,742 6,767 + 0.4
11. Munich 3,183 3,778 3,971 4,399 5,017 5,391 5,726 6,545 6,989 6,565 - 6.1
12. Stockholm 4,426 4,422 4,018 4,672 5,389 5,947 6,241 6,274 6,345 5,832 - 8.1
13. Milan Malpensa 1,929 1,232 369 298 332 1,011 4,214 5,097 5,341 5,399 + 1.1
14. Vienna 3,558 2,927 3,090 4,077 5,000 5,083 5,258 5,654 5,516 5,398 - 2.1
15. Oslo - 1 1 1 1 1,178 5,253 5,169 5,148 5,159 + 0.2
16. Geneva 3,084 3,961 3,493 3,053 3,137 3,876 3,912 4,916 5,015 5,008 - 0.1
17. Edinburgh 183 1,391 1,839 2,050 2,763 3,171 3,507 4,065 5,353 4,941 - 7.7
18. Hamburg 3,674 4,132 3,706 3,440 3,409 3,733 3,754 3,498 4,175 4,877 + 16.8
19. Brussels 5,583 5,701 5,583 5,748 6,371 6,492 7,726 7,564 7,422 4,779 - 35.6
20. Rome Fiumicino 3,785 3,703 3,641 3,726 3,759 4,379 4,377 5,181 5,004 4,643 - 7.2
Rest of Europe 125,998 136,025 147,416 168,212 186,647 198,645 200,669 211,026 207,202 193,170 - 6.8
Total Europe 216,864 228,160 239,275 265,803 290,064 314,549 329,684 348,720 348,696 332,568 - 4.6
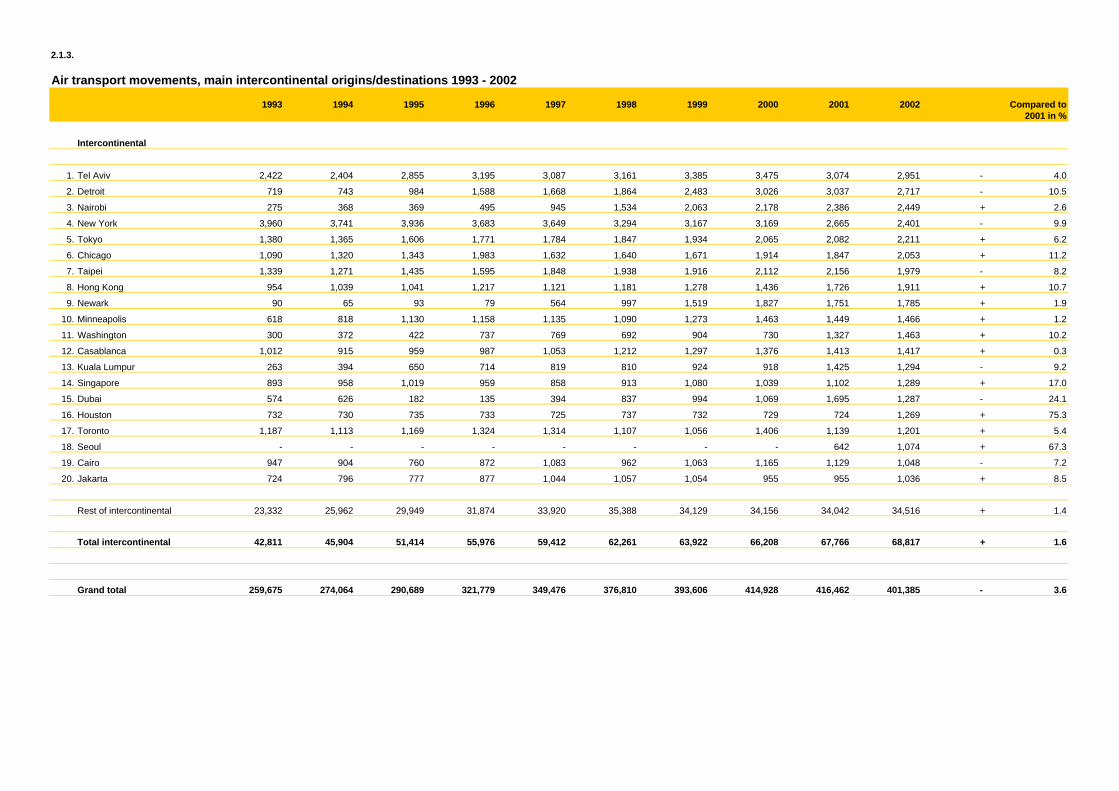
2.1.3.
Air transport movements, main intercontinental origins/destinations 1993 - 2002
1993 1994 1995 1996 1997 1998 1999 2000 2001 2002 Compared to2001 in %
Intercontinental
1. Tel Aviv 2,422 2,404 2,855 3,195 3,087 3,161 3,385 3,475 3,074 2,951 - 4.0
2. Detroit 719 743 984 1,588 1,668 1,864 2,483 3,026 3,037 2,717 - 10.5
3. Nairobi 275 368 369 495 945 1,534 2,063 2,178 2,386 2,449 + 2.6
4. New York 3,960 3,741 3,936 3,683 3,649 3,294 3,167 3,169 2,665 2,401 - 9.9
5. Tokyo 1,380 1,365 1,606 1,771 1,784 1,847 1,934 2,065 2,082 2,211 + 6.2
6. Chicago 1,090 1,320 1,343 1,983 1,632 1,640 1,671 1,914 1,847 2,053 + 11.2
7. Taipei 1,339 1,271 1,435 1,595 1,848 1,938 1,916 2,112 2,156 1,979 - 8.2
8. Hong Kong 954 1,039 1,041 1,217 1,121 1,181 1,278 1,436 1,726 1,911 + 10.7
9. Newark 90 65 93 79 564 997 1,519 1,827 1,751 1,785 + 1.9
10. Minneapolis 618 818 1,130 1,158 1,135 1,090 1,273 1,463 1,449 1,466 + 1.2
11. Washington 300 372 422 737 769 692 904 730 1,327 1,463 + 10.2
12. Casablanca 1,012 915 959 987 1,053 1,212 1,297 1,376 1,413 1,417 + 0.3
13. Kuala Lumpur 263 394 650 714 819 810 924 918 1,425 1,294 - 9.2
14. Singapore 893 958 1,019 959 858 913 1,080 1,039 1,102 1,289 + 17.0
15. Dubai 574 626 182 135 394 837 994 1,069 1,695 1,287 - 24.1
16. Houston 732 730 735 733 725 737 732 729 724 1,269 + 75.3
17. Toronto 1,187 1,113 1,169 1,324 1,314 1,107 1,056 1,406 1,139 1,201 + 5.4
18. Seoul - - - - - - - - 642 1,074 + 67.3
19. Cairo 947 904 760 872 1,083 962 1,063 1,165 1,129 1,048 - 7.2
20. Jakarta 724 796 777 877 1,044 1,057 1,054 955 955 1,036 + 8.5
Rest of intercontinental 23,332 25,962 29,949 31,874 33,920 35,388 34,129 34,156 34,042 34,516 + 1.4
Total intercontinental 42,811 45,904 51,414 55,976 59,412 62,261 63,922 66,208 67,766 68,817 + 1.6
Grand total 259,675 274,064 290,689 321,779 349,476 376,810 393,606 414,928 416,462 401,385 - 3.6

2.1.4.
Air transport movements, scheduled airlines 2002
Airline Scheduled Non-scheduled Total Compared to Airline Scheduled Non-scheduled Total Compared tomovements movements 2001 in % movements movements 2001 in %
1. K.L.M. 106,057 186 106,243 - 4.5 28. Maersk Air 2,068 4 2,072 + 0.7
2. K.L.M. cityhopper 48,692 668 49,360 + 19.0 29. Singapore Airlines 1,743 11 1,754 - 0.9
3. K.L.M. uk 38,678 237 38,915 - 10.7 30. Eurowings 1,606 25 1,631 - 80.9
4. Transavia Airlines (Incl. Basiqair) 14,209 11,158 25,367 + 8.4 31. United Airlines 1,530 2 1,532 + 15.8
5. easyJet 16,250 78 16,328 + 32.0 32. THY Turkish Airlines 1,493 37 1,530 + 9.8
6. Martinair Holland 1,741 7,982 9,723 + 0.0 33. Delta Air Lines 1,450 4 1,454 + 1.7
7. Air France 8,352 22 8,374 - 13.0 34. easyJet Switzerland 1,452 1 1,453 + 0.5
8. British Airways 8,353 18 8,371 + 2.1 35. LOT Polish Airlines 1,432 6 1,438 + 0.6
9. Northwest Airlines 7,993 20 8,013 - 4.1 36. Meridiana 1,426 8 1,434 - 0.3
10. bmi british midland 7,522 9 7,531 - 4.8 37. Finnair 1,314 1,314 - 7.1
11. S.A.S. Scandinavian Airlines 7,473 19 7,492 - 5.4 38. Nippon Cargo Airlines 1,210 1,210 - 3.2
12. K.L.M. exel 5,742 30 5,772 - 37.3 39. Royal Air Maroc 1,183 23 1,206 + 3.6
13. Swiss 5,166 14 5,180 - 40. Continental Airlines 1,182 1,182 + 70.8
14. Iberia 4,941 11 4,952 + 3.0 41. Malaysia Airlines System 1,129 23 1,152 + 17.6
15. Air Alps Aviation 4,916 5 4,921 - 12.8 42. Air Dolomiti 1,081 1 1,082 + 22.1
16. Alitalia 4,859 12 4,871 - 2.3 43. Braathens 1,035 11 1,046 - 75.5
17. Lufthansa 4,625 15 4,640 + 8.4 44. Crossair 985 2 987 - 71.0
18. Aer Lingus 4,621 12 4,633 - 3.8 45. Lithuanian Airlines 963 1 964 + 7.6
19. CityFlyer Express 4,272 2 4,274 - 8.5 46. Trans Travel Airlines 930 11 941 + 62.2
20. Lufthansa CityLine 3,037 2 3,039 - 24.9 47. Croatia Airlines 924 924 + 6.5
21. Austrian Airlines 2,592 4 2,596 + 20.0 48. Japan Airlines 854 854 -
22. Malev Hungarian Airlines 2,381 4 2,385 + 66.7 49. China Airlines 850 2 852 - 8.0
23. Czech Airlines 2,362 4 2,366 + 11.9 50. Olympic Airways 770 770 - 22.5
24. Maersk Air Ltd (BA) 2,317 3 2,320 - 15.3 51. Cyprus Airways 746 746 - 3.6
25. El-Al 2,139 113 2,252 + 18.6 52. Air Malta 740 6 746 + 7.5
26. Scot Airways 2,175 4 2,179 - 46.0 53. US Airways 706 706 + 36.3
27. TAP Air Portugal 2,160 2 2,162 + 37.4 54. Ukraine International Airlines 702 2 704 + 35.9

2.1.4. (Continuation)
Air transport movements, scheduled airlines 2002
Airline Scheduled Non-scheduled Total Compared to Airline Scheduled Non-scheduled Total Compared to movements movements 2001 in % movements movements 2001 in %
55. Aeroflot 699 1 700 - 2.0 82. VLM 240 4 244 -
56. Kenya Airways 694 2 696 - 2.8 83. Air Canada 236 236 + 490.0
57. Aurigny Air Services 601 3 604 - 1.9 84. Egypt Air 220 220 - 28.6
58. JAT Yugoslav Airlines 594 2 596 + 36.7 85. Pulkovo Airlines 204 16 220 - 6.8
59. Buzz 585 4 589 - 86. Varig 216 216 -
60. Swisswings 546 546 - 72.3 87. T.M.A of Lebanon 191 22 213 - 27.1
61. Cathay Pacific Airways 520 520 - 32.5 88. China Southern Airlines 210 210 + 1.0
62. Icelandair 496 3 499 - 17.9 89. Macedonian Airlines 202 4 206 - 6.4
63. Ethiopean Airlines 464 464 + 146.8 90. Asiana Airlines 186 186 - 3.1
64. Emirates 445 11 456 + 23.6 91. Transat 99 79 178 - 31.0
65. Dutch Caribbean Airlines 420 34 454 + 447.0 92. T.A.C.V. Cabo Verde 104 2 106 + 71.0
66. Westair Aviation 401 43 444 + 87.3 93. Air Bosna 102 102 -
67. Dragonair 432 432 + 51.6 94. Armenian Airlines 36 36 - 80.2
68. Kuwait Airways 418 418 + 1.0 95. Libyan Arab Airlines 22 22 - 21.4
69. Polar Air Cargo 393 18 411 - 0.0 96. Airzena Georgian Airlines 8 8 - 92.5
70. EVA Airways 400 400 - 3.8 97. Flymetropolis 4 3 7 - 88.3
71. Adria Airways 396 396 + 6.5
72. Iran Air 342 4 346 - 2.0
73. bmibaby 344 344 -
74. Royal Jordanian Airlines 340 1 341 - 45.5
75. Skynet 320 320 -
76. Garuda Indonesian Airways 314 314 + 0.6
77. Tarom 314 314 - 44.5 Subtotal 369,089 21,093 390,182 - 3.6
78. PIA Pakistan International 312 312 - 14.8
79. Korean Airlines 310 310 + 14.8 Charter airlines - 11,203 11,203 - 3.0
80. Tunis Air 280 22 302 - 7.4
81. Syrian Arab Airlines 271 1 272 + 6.3 Grand Total 369,089 32,296 401,385 - 3.6

2.1.5.
Air transport movements, charter airlines 2002
Airline Total Airline Total Airline Total
1. Dutchbird 2,570 20. Condor Flugdienst 54 39. Khartago 8
2. Air Anatolia 1,557 21. Helios Airways 48 40. Lloyd Aero Boliviano 8
3. Pegasus Airlines 1,164 22. TNT Int. 46 41. Polet Aviakompania 8
4. Onur Air 1,013 23. Sky Airlines 44 42. Skyservice 7
5. Air Holland 969 24. Atlanta 35 43. Antonov 6
6. DAS Air 770 25. MK aircargo 34 44. Aero-Charter Ukraione 6
7. Inter Airlines 508 26. Cargolux 27 45. Azzura Air 6
8. Alfa Airlines 326 27. Air One 25 46. Farnair 6
9. Tristar Airlines 312 28. Hapag Lloyd 21 47. LTU Int. Aiarways 6
10. Fly Air 255 29. Lotus Air 18 48. Pskovavia 6
11. Sobelair 242 30. MNG Cargo Airlines 18 49. Vega Airlines 6
12. Átlas Air Inc. 167 31. Air 2000 16 50. Volara Avi 6
13. Israir 156 32. European Air Tr. 12 51. Aeris 4
14. Arkia Israel Airlines 112 33. Eurofly 12 52. Air Berlin 4
15. Iberworld Airlines 103 34. Atlas International 10 53. Air Europe 4
16. Cargo Air Lines 102 35. Air Jet 8 54. Balkan Bulkarian Airlines 4
17. Sunexpress 94 36. Avia Express 8 55. Birmingham 4
18. Bosphorus 84 37. Delsey Airlines 8 56. Britannia 4
19. Free Bird 66 38. Evergreen 8 57. Delta Air Transport 4

2.1.5. (Continuation)
Air transport movements, charter airlines 2002
Airline Total Airline Total Airline Total
58. Flightline 4 77. Federal Express 2 96. Welcome Air 2
59. Futura 4 78. Gandalf 2 97. Aberdeen 1
60. JMC Airlines 4 79. Genesis 2 98. Air Namibia 1
61. Newair 4 80. Heavylift Cargo Airlines 2 99. Atlantic Island Air 1
62. British Med. Airlines 3 81. Kalitta Air 2 100. ATS Aircharter 1
63. LTE Int. Airlines 3 82. Lauda Air 2 101. Brymon Airways 1
64. Luxair 3 83. Omni Air International 2 102. European Air Transport 1
65. Proteus Airlines 3 84. Qantas 2 103. Express Airways 1
66. AC West 2 85. Sabre Airways 2 104. Monarch Airlines 1
67. Air Liberte 2 86. SAR 2 105. Norwegian 1
68. Aero Lloyd 2 87. Southern Air 2 106. Schreiner Airways 1
69. Air OPS 2 88. Spanair 2 107. Titan Air 1
70. Avanti Air 2 89. Sterling European Airlines 2 108. Virgin Atlantic 1
71. Channel 2 90. Sun D'or International 2
72. Cirrus Airlines 2 91. Transjet 2
73. Daallo Airlines 2 92. Ukrainian 2
74. Donbass Ukrainian Airl. 2 93. Virgin Express 2
75. Euralair 2 94. Viva Air 2 Subtotal 11,203
76. Excel Airways 2 95. Volga Cargo Airlines 2
Scheduled airlines 390,182
Grand Total 401,385

2.1.6.
Air transport movements according to type, passenger or mixed version 2002
MTOW*)Class Aircraft type Average Average Air transport MTOW Class Aircraft type Average Average Air transport(tonnes) MTOW seat capacity movements (tonnes) MTOW seat capacity movements
(tonnes) (tonnes)
> 300 Boeing 747-400MC 397 2,289,491 8,371 100-200 Boeing 757-300 123 19,508 72
Boeing 747-400P 393 2,538,418 6,226 Boeing 757-200MC 112 68,833 340
Boeing 747-300P 378 1,555,553 4,045 Boeing 757-200P 107 2,437,279 11,523
Boeing 747-200P 375 439,598 1,169 Tupolev 154 102 40,108 248
Boeing 747-200MC 370 1,440 4
Boeing 747-100P 346 2,200 4 70-100 Boeing 727-200 96 756 4
Boeing 747SP 305 5,184 16 Airbus A321 85 1,186,005 6,123
Boeing 737-800W 79 126,585 702
200-300 Boeing 777-200 280 791,166 2,674 Boeing 737-800 77 6,529,567 38,338
MD11 278 1,945,647 6,660 Boeing 737-900 77 1,061,091 5,962
Airbus A340-313 275 129,526 524 Airbus A320-2 73 2,467,141 15,871
DC10-30P 261 1,465,609 5,362 MD88 73 63,984 372
Airbus A340-211 259 9,900 38 MD83 72 106,695 726
Airbus A340-311 258 111,886 404 MD90-30 71 14,664 104
DC10-40 250 1,704 6 Airbus A320-1 70 166,849 1,050
Tristar 500 231 11,840 44
Airbus A330 230 84,630 258 50-70 Boeing 737-700 67 1,117,290 7,617
Airbus A330-300 215 880 2 MD82 67 637,834 4,686
DC 10-10P 207 1,520 4 Airbus A319 65 1,061,262 8,298
Boeing 767-400 205 46,980 190 Boeing 737-400 64 4,110,678 28,932
MD81 64 145,040 1,018
100-200 Boeing 767-300 180 3,882,810 16,510 MD87 62 249,152 2,226
Airbus A300-6P 170 227,742 762 Boeing 737-600 59 331,100 3,186
Boeing 767-200 169 333,841 1,754 Boeing 737-300 58 6,135,106 46,984
Airbus A300-4P 162 282,770 858 YAK42 58 240 2
Airbus A310-3P 156 146,188 693 Boeing 737-200P 56 1,816 16
Airbus A300 150 540 2 Boeing 737-200ADVP 56 512 4
Airbus A310-2P 140 38,166 159 Boeing 737-500 54 1,083,764 9,662
*) Maximum take off weight

2.1.6. (Continuation)
Air transport movements according to type, passenger or mixed version 2002
MTOW*)Class Aircraft type Average Average Air transport MTOW Class Aircraft type Average Average Air transport(tonnes) MTOW seat capacity movements (tonnes) MTOW seat capacity movements
(tonnes) (tonnes)
50-70 Boeing 717 53 5,040 48 0-25 ATR42 17 217,264 4,746
DC9-40 52 630 6 ATR42-300 17 48,684 1,064
Dash 8-100/200 16 80 2
25-50 BAE146 46 316,027 2,868 Dornier 328JET 16 62 2
BAE 146-300 46 256,706 2,585 Dornier 328-100 14 247,026 7,920
BAE 146-RJ85 44 47,854 584 Saab SF340 13 37,830 1,118
Fokker 100 42 2,910,140 28,512 EMB-120 12 4,500 150
BAE 146-100 42 360 4 Beech 1900C 8 14,497 763
BAE 146-200P 41 181,912 2,117 Beech 1900D 8 3,135 165
Fokker 70 38 2,704,892 33,908 Beech 200 6 224 16
Canadair RJ700 34 55,152 835
Dash 8-400 29 14,744 210
0-25 BAE ATP 24 72 1
Canadair100/200ER 24 313,234 6,303
Canadair CL600 24 219 5
Saab 2000 23 114,494 2,294
ATR72-202 22 265,696 3,971
Bombardier CL604 22 12 1
EMB-145 21 250,137 5,035
Fokker 50 21 1,483,684 29,670
Dash 8-300 20 506 11
ATR42-500 19 95,088 2,078
EMB 135 19 57,696 1,468 Subtotal 389,265
Full-freighter version 12,120
Grand total 401,385
*) Maximum take off weight

2.1.7.
Air transport movements according to type, full-freighter version 2002MTOW*) Class Aircraft type Average Air transport MTOW Class Aircraft type Average Air transport(tonnes) MTOW movements (tonnes) MTOW movements
(tonnes) (tonnes)
> 300 Antonov 124 403 16 50-100 Boeing 727F 81 2
Boeing 747-400F 396 1,597 Hercules M382 71 1
Boeing 747-300MC 378 456 Antonov 12 64 18
Boeing 747-200F 377 4,232 YAK42 58 2
Boeing 747-200P 375 1,056
Boeing 747-200MC 370 157 0-50 DC6A 48 2
Boeing 747-100F 341 14 Antonov 74 35 2
Antonov 26 24 20
200-300 MD11F 281 2,112 BAE ATP 24 419
DC10-30P 268 4 BAE HS 748 22 2
DC10F 259 774 FK27-500 21 24
Falcon 20 14 4
100-200 Airbus A300F 165 421 Short 360 13 2
Airbus A300-4P 165 33 Beech 1900C 8 2
DC8-63F 162 2 Beech 200 6 1
DC8F 154 8 Cessna 406 5 1
Boeing 707F 151 36 Cessna 406F 5 18
Airbus A310F 142 192 Piper 31 NA 4 223
Boeing 757-200F 116 264
Boeing 757-200P 114 1
Belfast 105 2 Subtotal 12,120
Passenger version 389,265
Grand Total 401,385
*) Maximum take off weight

2.1.8.
Air transport movements, average maximum take off weight and average seat capacity
1993 1994 1995 1996 1997 1998 1999 2000 2001 2002 Compared to2001 in %
I. Number of air transport movements
Passenger services 250,906 264,393 279,240 308,849 336,455 364,092 381,089 403,048 404,781 389,265 - 3.8
Full-freighter services 8,769 9,671 11,449 12,930 13,021 12,718 12,517 11,880 11,681 12,120 + 3.8
Total 259,675 274,064 290,689 321,779 349,476 376,810 393,606 414,928 416,462 401,385 - 3.6
II. Maximum take off weight (x1.000 tonnes)
Passenger services 21,860 22,851 24,517 26,757 28,957 31,060 32,214 33,804 34,040 33,419 - 1.8
Full-freighter services 1,803 1,977 2,540 3,111 3,224 3,382 3,714 3,612 3,585 3,817 + 6.5
Total 23,663 24,828 27,057 29,868 32,181 34,442 35,928 37,416 37,625 37,236 - 1.0
III. Average maximum take off weight (tonnes)
Passenger services 87.1 86.4 87.8 86.6 86.1 85.3 84.5 83.9 84.1 85.9 + 2.1
Full-freighter services 205.6 204.4 221.9 240.6 247.6 265.9 296.7 304.0 306.9 315.0 + 2.6
Total 91.1 90.6 93.1 92.8 92.1 91.4 91.3 90.2 90.3 92.8 + 2.7
IV. Seat capacity *) 33,671,736 35,281,765 36,993,877 40,806,609 45,493,929 49,564,012 52,482,195 54,951,675 56,010,031 55,155,685 - 1.5
V. Average seat capacity 134.2 133.4 132.5 132.1 135.2 136.1 137.7 136.3 138.4 141.7 + 2.4
*) Seat capacity on passenger services

2.1.9.
Punctuality of passenger services, monthly totals 2002
January February March April May June July August September October November December
I.Arrivals
Scheduled flights
Total number of flights 14,508 13,267 14,972 15,053 15,756 15,308 16,094 16,003 15,506 15,760 14,652 14,012
Flights delayed up to 15 min. 10,316 9,170 13,064 12,789 13,554 12,866 13,538 13,455 13,359 12,509 11,950 10,746
% punctuality 71.1 69.1 87.3 85.0 86.0 84.0 84.1 84.1 86.2 79.4 81.6 76.7
Non-scheduled flights
Total number of flights 445 476 647 1019 1575 1481 1924 1965 1565 1509 588 546
Flights delayed up to 15 min. 211 235 408 646 1100 1087 1388 1383 1071 924 391 319
% punctuality 47.4 49.4 63.1 63.4 69.8 73.4 72.1 70.4 68.4 61.2 66.5 58.4
Total arrivals
Total number of flights 14,953 13,743 15,619 16,072 17,331 16,789 18,018 17,968 17,071 17,269 15,240 14,558
Flights delayed up to 15 min. 10,527 9,405 13,472 13,435 14,654 13,953 14,926 14,838 14,430 13,433 12,341 11,065
% punctuality 70.4 68.4 86.3 83.6 84.6 83.1 82.8 82.6 84.5 77.8 81.0 76.0
II.Departures
Scheduled flights
Total number of flights 14,510 13,263 14,983 15,046 15,760 15,311 16,090 15,988 15,514 15,754 14,654 13,994
Flights delayed up to 15 min. 9,265 7,688 11,642 11,598 11,874 10,631 10,767 11,476 11,236 10,654 10,599 9,018
% punctuality 63.9 58.0 77.7 77.1 75.3 69.4 66.9 71.8 72.4 67.6 72.3 64.4
Non-scheduled flights
Total number of flights 455 479 652 1017 1579 1483 1921 1986 1547 1518 584 546
Flights delayed up to 15 min. 250 240 360 596 939 961 1087 1192 906 858 379 303
% punctuality 54.9 50.1 55.2 58.6 59.5 64.8 56.6 60.0 58.6 56.5 64.9 55.5
Total arrivals
Total number of flights 14,965 13,742 15,635 16,063 17,339 16,794 18,011 17,974 17,061 17,272 15,238 14,540
Flights delayed up to 15 min. 9,515 7,928 12,002 12,194 12,813 11,592 11,854 12,668 12,142 11,512 10,978 9,321
% punctuality 63.6 57.7 76.8 75.9 73.9 69.0 65.8 70.5 71.2 66.7 72.0 64.1

2.2.0
Punctuality of passenger services, annual totals 1993-2002
1993 1994 1995 1996 1997 1998 1999 2000 2001 2002 Compared to2001 in %
I.Arrivals
Scheduled flights
Total number of flights 115,288 121,607 127,946 142,906 156,196 169,674 177,249 187,151 187,720 180,891 - 3.6
Flights delayed up to 15 min. 96,549 101,238 103,848 115,356 120,303 120,811 134,079 145,434 144,903 147,316 + 1.7
% punctuality 83.7 83.3 81.2 80.7 77.0 71.2 75.6 77.7 77.2 81.4 + 5.5
Non-scheduled flights
Total number of flights 10,161 10,606 11,684 11,531 12,015 12,370 13,330 14,349 14,670 13,740 - 6.3
Flights delayed up to 15 min. 5,503 5,801 6,549 6,521 6,598 5,757 5,335 7,099 8,118 9,163 + 12.9
% punctuality 54.2 54.7 56.1 56.6 54.9 46.5 40.0 49.5 55.3 66.7 + 20.6
Total arrivals
Total number of flights 125,449 132,213 139,630 154,437 168,211 182,044 190,579 201,500 202,390 194,631 - 3.8
Flights delayed up to 15 min. 102,052 107,039 110,397 121,877 126,901 126,568 139,414 152,533 153,021 156,479 + 2.3
% punctuality 81.3 81.0 79.1 78.9 75.4 69.5 73.2 75.7 75.6 80.4 + 6.3
II.Departures
Scheduled flights
Total number of flights 115,308 121,608 127,971 142,896 156,219 169,521 177,128 187,270 187,735 180,867 - 3.7
Flights delayed up to 15 min. 94,009 94,288 97,479 104,828 107,133 98,621 112,582 122,736 122,291 126,448 + 3.4
% punctuality 81.5 77.5 76.2 73.4 68.6 58.2 63.6 65.5 65.1 69.9 + 7.4
Non-scheduled flights
Total number of flights 10,150 10,571 11,639 11,516 12,025 12,527 13,382 14,278 14,654 13,767 - 6.1
Flights delayed up to 15 min. 6,046 6,284 7,034 6,786 6,725 5,526 5,294 6,516 7,345 8,071 + 9.9
% punctuality 59.6 59.4 60.4 58.9 55.9 44.1 39.6 45.6 50.1 58.6 + 17.0
Total arrivals
Total number of flights 125,458 132,179 139,610 154,412 168,244 182,048 190,510 201,548 202,389 194,634 - 3.8
Flights delayed up to 15 min. 100,055 100,572 104,513 111,614 113,858 104,147 117,876 129,252 129,636 134,519 + 3.8
% punctuality 79.8 76.1 74.9 72.3 67.7 57.2 61.9 64.1 64.1 69.1 + 7.8

212121
3. Passenger Transport
Passenger
Statistical Annual Review 2002
21

3.1.1.
Passenger transport per country/continent, annual totals 1993 - 2002
1993 1994 1995 1996 1997 1998 1999 2000 2001 2002 Compared to2001 in %
Austria 294,816 312,955 362,819 375,517 426,290 456,388 493,035 548,759 513,461 499,002 - 2.8
Belgium 262,752 307,366 300,825 309,791 351,281 387,040 394,460 448,298 364,488 241,024 - 33.9
Denmark 351,845 390,659 429,994 488,408 546,895 576,197 592,386 646,431 658,296 749,458 + 13.8
Finland 124,461 144,803 156,895 171,559 208,118 245,395 274,435 296,094 294,984 331,958 + 12.5
France 1,048,793 1,126,045 1,190,182 1,227,613 1,468,769 1,593,739 1,698,790 1,775,253 1,784,728 1,833,535 + 2.7
Germany 1,520,945 1,593,858 1,727,333 1,822,196 2,120,308 2,220,111 2,453,607 2,631,460 2,316,526 2,191,943 - 5.4
Great Britain 3,401,077 3,690,818 3,921,595 4,537,430 5,396,398 6,098,951 6,356,230 6,629,912 6,940,134 7,405,541 + 6.7
Greece 886,827 993,145 886,657 845,685 967,303 1,062,143 1,240,587 1,312,607 1,296,218 1,320,363 + 1.9
Ireland 137,794 154,008 178,830 231,784 278,736 331,368 408,444 457,753 490,405 520,533 + 6.1
Italy 832,794 942,238 1,004,569 1,100,393 1,234,424 1,405,131 1,530,209 1,655,086 1,668,127 1,760,886 + 5.6
Luxembourg 31,960 43,820 48,271 49,695 59,384 78,290 85,005 80,021 70,724 70,235 - 0.7
Netherlands 112,250 126,386 147,114 174,422 188,532 190,084 163,397 170,500 142,348 130,717 - 8.2
Portugal 419,028 521,145 532,707 549,655 590,938 679,897 744,519 775,815 814,375 862,061 + 5.9
Spain 1,605,163 1,911,484 1,983,558 2,045,322 2,298,015 2,642,409 2,955,194 3,144,673 3,423,426 3,722,527 + 8.7
Sweden 431,859 475,899 526,404 561,867 641,365 701,930 778,340 891,780 830,595 778,948 - 6.2
Total E.U.*) 11,462,364 12,734,629 13,397,753 14,491,337 16,776,756 18,669,073 20,168,638 21,464,442 21,608,835 22,418,731 + 3.7
Rest of Europe 2,422,268 2,623,088 2,850,829 3,179,990 3,612,277 3,957,201 4,113,896 4,896,334 5,192,698 5,635,892 + 8.5
Total Europe 13,884,632 15,357,717 16,248,582 17,671,327 20,389,033 22,626,274 24,282,534 26,360,776 26,801,533 28,054,623 + 4.7
North America 3,025,256 3,307,514 3,658,704 4,110,389 4,607,577 4,903,958 5,323,228 5,552,826 5,010,847 4,933,648 - 1.5
Latin America 940,264 1,051,008 1,162,112 1,262,360 1,430,467 1,466,396 1,407,060 1,485,723 1,608,797 1,648,586 + 2.5
Africa 761,604 857,697 961,595 1,095,996 1,223,391 1,293,242 1,472,105 1,615,441 1,678,236 1,798,750 + 7.2
Middle East 548,824 661,718 764,471 909,542 963,791 1,052,831 1,147,935 1,178,460 1,168,416 1,148,894 - 1.7
Far East 1,609,770 1,833,711 2,061,253 2,212,430 2,406,743 2,609,447 2,792,251 3,077,384 3,041,612 3,003,061 - 1.3
Total intercontinental 6,885,718 7,711,648 8,608,135 9,590,717 10,631,969 11,325,874 12,142,579 12,909,834 12,507,908 12,532,939 + 0.2
Grand total 20,770,350 23,069,365 24,856,717 27,262,044 31,021,002 33,952,148 36,425,113 39,270,610 39,309,441 40,587,562 + 3.3
*) The 15 official members of the European Union

3.1.2.
Passenger transport, main European origins/destinations 1993 - 2002
1993 1994 1995 1996 1997 1998 1999 2000 2001 2002 Compared to2001 in %
Europe
1. London Heathrow 1,655,388 1,748,188 1,841,272 1,861,141 1,970,405 2,124,679 2,233,541 2,326,133 2,133,129 2,043,420 - 4.2
2. Barcelona 240,983 269,499 291,721 332,821 402,839 488,123 543,746 645,341 814,319 1,093,196 + 34.2
3. Paris Charles de Gaulle 707,512 770,509 738,554 731,742 816,244 889,053 975,933 1,065,826 1,040,206 1,002,850 - 3.6
4. Madrid 288,621 284,051 301,880 310,262 344,305 450,380 549,462 664,110 682,505 785,926 + 15.2
5. London Gatwick 254,209 252,865 259,600 370,771 397,552 454,910 465,180 330,090 436,366 675,540 + 54.8
6. Copenhagen 311,254 337,116 360,119 376,614 401,768 437,873 463,038 505,438 526,803 598,554 + 13.6
7. Antalya 122,946 103,930 110,742 120,789 140,778 163,415 143,537 329,732 487,278 596,698 + 22.5
8. Frankfurt 431,755 398,651 430,986 438,339 469,297 475,945 559,651 651,954 635,347 573,609 - 9.7
9. Zurich 391,613 423,287 435,433 468,748 517,512 558,924 555,822 620,101 550,800 531,407 - 3.5
10. Manchester 348,172 388,102 388,148 419,468 493,902 524,922 531,207 545,395 530,509 511,472 - 3.6
11. Rome Fiumicino 324,678 343,738 344,436 362,698 371,784 426,397 485,676 539,069 491,835 505,588 + 2.8
12. Stockholm 256,084 283,904 303,202 326,073 374,708 405,809 441,246 497,587 491,929 504,065 + 2.5
13. London Luton 2,467 523 8,873 112,494 169,966 197,773 247,518 388,352 471,111 489,384 + 3.9
14. Geneva 218,978 234,784 243,160 246,266 266,413 297,674 324,808 452,029 456,361 480,905 + 5.4
15. Edinburgh 82,240 105,818 117,383 157,578 218,597 239,462 251,798 286,253 448,497 459,061 + 2.4
16. Oslo - - - - - 73,280 345,609 398,528 400,080 451,369 + 12.8
17. Milan Malpensa 111,774 79,409 16,915 3,855 1,967 53,287 333,601 422,481 426,491 440,513 + 3.3
18. Lisbon 156,350 175,675 170,817 175,480 192,041 242,235 252,407 277,216 336,026 415,153 + 23.5
19. Nice 133,287 114,793 123,068 116,694 201,319 240,076 238,626 282,138 399,037 410,954 + 3.0
20. Liverpool - - 1,548 939 10,935 68,091 116,213 245,446 354,238 410,690 + 15.9
Rest of Europe 7,846,321 9,042,875 9,760,725 10,738,555 12,626,701 13,813,966 14,223,915 14,887,557 14,688,666 15,074,269 + 2.6
Total Europe 13,884,632 15,357,717 16,248,582 17,671,327 20,389,033 22,626,274 24,282,534 26,360,776 26,801,533 28,054,623 + 4.7

3.1.3.
Passenger transport, main intercontinental origins/destinations 1993 - 2002
1993 1994 1995 1996 1997 1998 1999 2000 2001 2002 Compared to2001 in %
Intercontinental
1. Detroit 180,047 215,366 368,086 483,454 602,083 646,045 832,231 941,892 789,852 746,044 - 5.5
2. New York 561,684 548,406 583,519 568,224 590,468 558,493 531,926 531,026 450,509 426,693 - 5.3
3. Minneapolis 146,773 248,221 342,803 377,636 390,609 391,561 453,640 494,264 418,988 412,389 - 1.6
4. Tokyo 222,231 275,662 274,022 281,242 291,363 335,284 354,718 391,767 367,186 380,432 + 3.6
5. Toronto 289,044 310,196 360,718 357,103 369,746 352,428 351,943 417,463 360,064 374,319 + 4.0
6. Bangkok 261,843 262,806 251,892 241,510 255,092 285,565 240,566 308,860 359,391 363,642 + 1.2
7. Newark 13,367 14,017 18,904 17,052 126,851 207,909 293,218 350,592 270,260 332,173 + 22.9
8. Washington 130,471 177,422 185,718 286,450 312,152 324,531 366,173 339,691 307,758 318,837 + 3.6
9. Tel Aviv 194,984 217,075 249,413 279,070 297,748 326,281 372,033 412,121 358,724 301,645 - 15.9
10. Nairobi 43,718 45,153 51,902 54,652 95,295 143,384 211,988 282,300 304,438 297,609 - 2.2
11. Hong Kong 115,288 134,497 154,162 193,894 194,786 214,272 220,451 239,457 268,985 290,467 + 8.0
12. Curaçao 169,168 181,116 188,504 180,629 183,991 190,848 182,575 177,362 270,911 287,164 + 6.0
13. Singapore 191,294 214,314 229,269 237,547 235,717 242,807 254,097 272,923 271,336 284,464 + 4.8
14. Chicago 172,030 168,047 156,723 189,954 193,258 195,768 206,031 236,960 280,814 273,748 - 2.5
15. Houston 145,534 148,762 161,261 172,910 179,314 177,838 177,079 181,479 163,059 244,821 + 50.1
16. Montreal - - - - 61,651 206,890 191,757 201,989 250,139 244,641 - 2.2
17. Kuala Lumpur 41,243 57,697 64,576 70,299 90,200 110,882 177,128 225,305 272,378 226,897 - 16.7
18. Osaka - 20,832 114,175 162,328 181,241 182,445 207,190 227,108 194,277 221,404 + 14.0
19. Mumbai 69,819 73,465 81,589 86,239 105,495 159,100 178,625 182,668 212,115 210,827 - 0.6
20. Johannesburg 66,836 89,345 103,899 123,759 141,575 147,362 148,142 142,067 153,377 209,592 + 36.7
Rest of intercontinental 3,870,344 4,309,249 4,667,000 5,226,765 5,733,334 5,926,181 6,191,068 6,352,540 6,183,347 6,085,131 - 1.6
Total intercontinental 6,885,718 7,711,648 8,608,135 9,590,717 10,631,969 11,325,874 12,142,579 12,909,834 12,507,908 12,532,939 + 0.2
Grand total 20,770,350 23,069,365 24,856,717 27,262,044 31,021,002 33,952,148 36,425,113 39,270,610 39,309,441 40,587,562 + 3.3

3.1.4.
Passenger transport, passenger load factor *)
1993 1994 1995 1996 1997 1998 1999 2000 2001 2002 Compared to2001 in %
I. Seat capacity
Scheduled flights 29,530,719 31,039,460 32,346,136 36,004,526 40,344,391 44,101,537 46,801,286 48,835,545 49,742,459 49,276,870 - 0.9
Non-scheduled flights 4,141,017 4,242,305 4,647,741 4,802,083 5,149,538 5,462,475 5,680,909 6,116,130 6,267,572 5,878,815 - 6.2
Total 33,671,736 35,281,765 36,993,877 40,806,609 45,493,929 49,564,012 52,482,195 54,951,675 56,010,031 55,155,685 - 1.5
II. Passenger transport
Scheduled flights 17,715,938 19,883,171 21,480,181 23,789,314 27,304,883 29,956,021 32,099,597 34,496,436 34,597,071 36,102,477 + 4.4
Non-scheduled flights 3,054,412 3,186,193 3,376,536 3,472,730 3,716,119 3,996,127 4,325,516 4,774,174 4,712,370 4,485,085 - 4.8
Total 20,770,350 23,069,364 24,856,717 27,262,044 31,021,002 33,952,148 36,425,113 39,270,610 39,309,441 40,587,562 + 3.3
III. Transit-direct passengers
Scheduled flights 442,878 424,180 431,947 464,495 453,097 397,659 312,687 311,192 191,108 127,524 - 33.3
Non-scheduled flights 61,179 65,911 66,343 68,334 95,878 70,336 34,215 25,123 30,574 20,923 - 31.6
Total 504,057 490,091 498,290 532,829 548,975 467,995 346,902 336,315 221,682 148,447 - 33.0
IV. Passenger load factor (%)
Scheduled flights 63.0 66.8 69.1 68.7 69.9 69.7 69.9 71.9 70.3 73.8 + 4.9
Non-scheduled flights 76.7 78.2 75.5 75.2 75.9 75.7 77.3 78.9 76.2 77.0 + 1.1
Total 64.7 68.2 69.9 69.4 70.6 70.4 70.7 72.7 71.0 74.1 + 4.4
*) Passenger load factor = Terminal-passengers + 2x transit passengers, expressed in a percentage of the capacity

3.1.5.
Dutch leisure travel; main destinations, annual totals 1994 - 2002 *) (x 1.000 departing passengers)
1994 1995 1996 1997 1998 1999 2000 2001 2002 Compared to2001 in %
Worldwide main destinations
Spain 670 700 695 805 925 1,015 990 1,075 1,110 + 3.3
of wich:
Canary Islands 300 300 290 345 400 440 440 460 435 - 5.4
Balearic Islands 135 130 120 130 130 155 135 140 125 - 10.7
Mainland 235 270 285 330 395 420 415 475 550 + 15.8
Turkey 245 275 285 320 360 280 405 605 755 + 24.8
Greece 400 345 325 360 410 490 520 500 475 - 5.0
Great Britain 195 215 280 295 290 275 250 295 360 + 22.0
Portugal 175 175 180 185 225 245 250 260 260 + 0.0
United States of America 220 235 270 260 310 310 275 240 235 - 2.1
Italy 85 90 100 120 135 150 185 185 195 + 5.4
France 60 60 60 95 105 110 115 155 175 + 12.9
Netherlands Antilles 75 75 75 80 80 80 75 95 105 + 10.5
Egypt 10 20 40 60 50 90 110 100 100 + 0.0
Thailand 40 40 45 35 60 60 60 95 85 - 10.5
Canada 50 45 60 75 70 90 80 80 75 - 6.3
Switzerland 25 35 35 30 30 45 50 65 70 + 7.7
Surinam 20 25 25 35 45 50 40 50 65 + 30.0
Indonesia 70 70 60 60 45 55 50 55 60 + 9.1
Per continent
Europe 2,120 2,195 2,250 2,510 2,820 2,985 3,210 3,560 3,815 + 7.2
North America 275 280 300 335 380 405 355 320 315 - 1.6
Latin America 195 220 265 290 310 330 315 335 350 + 4.5
Africa 150 175 205 235 240 300 320 310 315 + 1.6
Middle East 65 95 95 90 85 120 105 90 60 - 33.3
Far East 235 240 240 260 280 325 335 360 335 - 6.9
Grand total 3,040 3,205 3,355 3,720 4,115 4,465 4,640 4,975 5,190 + 4.3
*) Main destinations of Dutch travellers in the leisure market segment

272727
4. Cargo Transport
Statistical Annual Review 2002
Cargo

4.1.1.
Cargo transport, incoming/outgoing monthly totals 2002 (in tonnes)
January February March April May June July August September October November December Total
I. Incoming
E.U.*) 1,755 1,956 2,047 1,736 1,864 1,879 1,891 1,890 1,829 1,919 1,643 1,589 21,998
Rest of Europe 559 639 730 707 632 593 628 592 692 717 684 686 7,859
North America 7,593 8,036 10,052 8,282 8,088 9,101 7,830 8,565 8,466 8,813 9,008 8,205 102,038
Latin America 5,336 5,312 5,342 4,656 4,699 4,444 4,173 4,531 4,850 5,399 5,408 5,969 60,117
Africa 8,135 7,652 8,918 6,951 7,059 6,186 4,992 5,136 5,765 7,095 7,261 7,501 82,649
Middle East 7,128 6,736 8,795 7,430 6,851 6,809 5,980 6,030 6,020 6,927 9,674 9,689 88,069
Far East 15,115 17,039 21,150 19,185 18,027 18,826 19,081 18,924 20,953 23,264 23,756 19,586 234,905
Subtotal 45,620 47,369 57,033 48,948 47,218 47,838 44,575 45,668 48,574 54,134 57,432 53,224 597,635
II. Outgoing
E.U.*) 2,386 2,487 2,297 2,376 2,274 2,477 2,278 2,149 2,165 2,163 2,074 1,949 27,075
Rest of Europe 803 797 882 891 832 896 813 862 1,103 1,169 1,276 1,336 11,658
North America 10,867 11,802 13,931 12,599 12,861 14,028 14,244 13,105 13,565 14,343 15,935 13,650 160,929
Latin America 4,704 5,730 6,556 6,021 6,256 5,555 5,610 4,946 5,386 5,632 5,726 5,364 67,486
Africa 4,403 4,423 5,849 5,079 5,149 5,021 4,396 4,553 4,450 5,312 5,247 4,719 58,602
Middle East 7,271 6,657 8,570 7,277 7,840 7,855 7,290 7,550 6,633 7,032 8,808 8,300 91,084
Far East 15,109 16,574 20,364 17,931 17,823 19,754 19,050 17,882 19,612 20,024 21,601 19,708 225,432
Subtotal 45,542 48,469 58,449 52,172 53,036 55,586 53,681 51,048 52,915 55,675 60,666 55,026 642,265
Total air transport 91,162 95,839 115,482 101,120 100,253 103,424 98,256 96,716 101,489 109,809 118,098 108,250 1,239,900
*) The 15 official members of the European Union

4.1.2.
Cargo transport, incoming/outgoing annual totals 1993 - 2002 (in tonnes)
1993 1994 1995 1996 1997 1998 1999 2000 2001 2002 Compared to2001 in %
I. Incoming
E.U.*) 45,297 48,969 46,552 50,881 58,880 57,031 56,473 44,869 31,599 21,998 - 30.4
Rest of Europe 8,259 8,844 9,278 9,668 9,891 10,601 10,450 9,770 8,150 7,859 - 3.6
North America 120,302 119,183 136,176 141,065 132,371 124,995 122,487 115,544 102,608 102,038 - 0.6
Latin America 21,070 23,554 31,062 36,347 43,817 52,454 52,176 48,731 52,064 60,117 + 15.5
Africa 32,045 35,953 40,949 51,144 57,143 58,889 63,583 81,256 81,321 82,649 + 1.6
Middle East 57,092 58,359 81,773 98,091 103,807 98,073 98,815 84,612 74,880 88,069 + 17.6
Far East 111,849 117,002 139,553 160,052 173,040 178,373 183,568 207,653 207,819 234,905 + 13.0
Subtotal 395,914 411,864 485,343 547,248 578,949 580,416 587,552 592,436 558,441 597,635 + 7.0
II. Outgoing
E.U.*) 49,176 47,856 48,190 47,962 60,520 63,198 63,870 59,595 38,690 27,075 - 30.0
Rest of Europe 12,420 13,728 19,511 17,102 17,667 16,586 12,556 12,877 11,412 11,658 + 2.2
North America 108,059 118,602 133,069 148,266 148,180 154,325 158,962 162,428 142,167 160,929 + 13.2
Latin America 27,517 34,931 40,697 42,980 56,810 68,475 68,951 67,298 73,130 67,486 - 7.7
Africa 22,075 27,243 29,055 30,305 36,560 39,603 37,629 41,362 54,197 58,602 + 8.1
Middle East 65,847 62,819 68,043 80,273 92,027 90,023 83,187 83,866 83,756 91,084 + 8.7
Far East 94,378 121,084 153,623 168,710 170,521 158,630 168,010 202,732 221,415 225,432 + 1.8
Subtotal 379,472 426,263 492,188 535,598 582,285 590,840 593,165 630,158 624,767 642,265 + 2.8
Total air transport 775,386 838,127 977,531 1,082,846 1,161,234 1,171,256 1,180,717 1,222,594 1,183,208 1,239,900 + 4.8
*) The 15 official members of the European Union

4.1.3.
Cargo transport, per country/continent annual totals 1993 - 2002 (in tonnes)
1993 1994 1995 1996 1997 1998 1999 2000 2001 2002 Compared to2001 in %
Austria 4,982 5,386 5,892 6,397 7,929 7,103 1,730 1,366 1,401 1,470 + 4.9
Belgium 340 292 263 123 105 301 551 282 280 241 - 13.9
Denmark 2,428 2,831 2,263 2,291 2,202 2,214 1,871 1,622 1,381 1,545 + 11.9
Finland 1,370 1,559 1,718 1,751 2,330 3,465 3,801 4,189 6,556 2,075 - 68.3
France 6,765 6,081 5,282 4,510 5,053 4,225 2,978 2,445 2,993 3,960 + 32.3
Germany 7,183 7,579 6,698 6,263 6,634 5,571 4,570 4,077 3,451 3,135 - 9.2
Great Britain 31,594 31,694 34,722 31,802 33,567 32,726 35,151 35,512 15,986 11,282 - 29.4
Greece 3,385 2,538 2,692 2,329 3,051 2,544 2,132 2,111 1,487 1,612 + 8.4
Ireland 768 834 1,646 5,659 8,813 11,190 12,480 11,765 12,409 3,081 - 75.2
Italy 12,542 12,904 9,288 10,905 11,852 13,617 14,137 10,595 5,179 5,640 + 8.9
Luxembourg 46 46 146 28 31 59 52 842 220 68 - 69.1
Netherlands 2 - - 9 12 7 - - 4 - -
Portugal 5,779 5,958 6,513 7,125 8,346 8,588 11,154 12,658 10,099 6,667 - 34.0
Spain 9,008 9,855 8,813 7,581 11,129 10,327 13,807 8,863 7,110 6,382 - 10.2
Sweden 8,281 9,268 8,806 12,070 18,345 18,292 15,927 8,135 1,735 1,917 + 10.5
Total E.U.*) 94,473 96,825 94,742 98,843 119,399 120,229 120,343 104,464 70,289 49,072 - 30.2
Rest of Europe 20,679 22,572 28,789 26,770 27,559 27,186 23,006 22,647 19,562 19,517 - 0.2
Total Europe 115,151 119,397 123,531 125,613 146,958 147,415 143,349 127,111 89,851 68,589 - 23.7
North America 228,361 237,785 269,245 289,331 280,552 279,321 281,449 277,972 244,775 262,968 + 7.4
Latin America 48,587 58,485 71,759 79,327 100,627 120,929 121,127 116,028 125,194 127,603 + 1.9
Africa 54,120 63,196 70,004 81,449 93,702 98,492 101,212 122,619 135,518 141,251 + 4.2
Middle East 122,939 121,178 149,816 178,364 195,834 188,096 182,002 168,478 158,636 179,153 + 12.9
Far East 206,227 238,086 293,176 328,762 343,561 337,003 351,578 410,385 429,234 460,336 + 7.2
Total Intercontinental 660,235 718,730 854,000 957,233 1,014,276 1,023,841 1,037,368 1,095,483 1,093,357 1,171,311 + 7.1
Grand total 775,386 838,127 977,531 1,082,846 1,161,234 1,171,256 1,180,717 1,222,594 1,183,208 1,239,900 + 4.8
*) The 15 official members of the European Union

4.1.4.
Cargo transport, main European origins/destinations 1993 - 2002 (in tonnes)
1993 1994 1995 1996 1997 1998 1999 2000 2001 2002 Compared to2001 in %
Europe
1. London Heathrow 16,219 15,319 20,257 20,713 20,230 18,102 17,560 17,887 9,911 8,205 - 17.2
2. Oporto 2,732 2,926 2,836 3,546 4,140 4,127 7,564 8,723 7,803 4,459 - 42.9
3. Milan Malpensa 35 63 370 622 1,333 2,241 8,807 7,109 3,629 4,374 + 20.5
4. Istanbul 3,129 2,927 4,316 3,858 3,013 3,882 5,004 6,448 4,045 4,052 + 0.2
5. Paris Ch. de Gaulle 5,083 4,740 3,958 3,447 3,815 3,015 1,675 1,580 2,261 3,181 + 40.7
6. Dublin 750 801 1,641 5,646 8,811 11,168 12,250 11,750 12,391 3,045 - 75.4
7. Madrid 4,793 4,515 3,787 2,680 2,763 2,434 6,989 4,185 2,723 2,692 - 1.1
8. Moscow Sheremetyevo 1,756 2,885 4,434 4,947 4,664 4,232 1,368 2,032 2,098 2,300 + 9.6
9. Budapest 1,241 1,188 1,180 1,011 1,192 1,325 1,529 1,323 1,329 2,284 + 71.8
10. Barcelona 3,049 3,940 3,215 2,611 3,089 2,901 3,141 2,478 2,377 2,239 - 5.8
11. Lisbon 3,040 2,988 3,581 3,546 4,126 4,365 3,464 3,885 2,258 2,182 - 3.3
12. Helsinki 1,370 1,536 1,718 1,751 2,330 3,465 3,801 4,189 6,556 2,075 - 68.4
13. Zurich 4,138 4,461 4,176 3,937 4,272 4,031 3,200 2,142 1,898 1,838 - 3.1
14. Frankfurt 3,273 3,264 3,215 3,234 3,012 2,159 2,017 2,014 1,849 1,788 - 3.3
15. Athens 3,078 2,277 2,382 2,061 2,811 2,324 1,971 1,950 1,318 1,557 + 18.1
16. Copenhagen 2,408 2,752 2,254 2,254 2,126 2,162 1,824 1,585 1,355 1,535 + 13.3
17. Vienna 2,473 2,104 2,211 2,284 7,112 2,595 1,716 1,363 1,401 1,470 + 4.9
18. Oslo 2,113 2,043 1,572 1,587 1,893 1,783 1,820 1,565 1,402 1,346 - 4.0
19. Stockholm 1,665 1,790 1,492 4,536 2,372 1,688 1,478 1,513 1,191 1,277 + 7.2
20. London Gatwick 825 418 22 1,744 3,416 4,313 4,982 8,505 1,973 1,217 - 38.3
Rest of Europe 51,981 56,460 54,914 49,598 60,438 65,103 51,190 34,886 20,083 15,473 - 23.0
Total Europe 115,151 119,397 123,531 125,613 146,958 147,415 143,349 127,111 89,851 68,589 - 23.7

4.1.5.
Cargo transport, main intercontinental origins/destinations 1993 - 2002 (in tonnes)
1993 1994 1995 1996 1997 1998 1999 2000 2001 2002 Compared to2001 in %
Intercontinental
1. Tel Aviv 78,514 79,095 89,763 103,575 102,975 97,481 96,650 91,070 79,938 81,691 + 2.2
2. Hong Kong 26,051 27,943 29,375 33,893 33,734 32,984 39,765 53,499 58,833 69,701 + 18.5
3. Dubai 9,599 10,902 24,882 32,719 42,347 41,606 42,540 43,180 50,469 61,274 + 21.4
4. Tokyo 32,729 36,993 40,508 42,900 48,869 51,164 51,547 58,650 55,151 60,101 + 9.0
5. Kuala Lumpur 5,917 13,144 28,846 26,107 28,230 28,279 27,243 21,559 40,548 55,060 + 35.8
6. Nairobi 12,610 14,312 16,479 23,609 31,029 38,538 47,063 52,951 55,057 54,147 - 1.7
7. Singapore 34,265 43,058 40,212 41,425 34,041 33,518 39,911 48,325 47,935 53,264 + 11.1
8. Chicago 27,661 36,885 45,574 44,968 42,256 43,475 41,797 36,154 34,080 42,716 + 25.3
9. New York 53,062 50,191 54,688 60,757 61,534 59,209 58,131 55,510 46,952 41,977 - 10.6
10. Seoul 8,714 11,370 21,458 23,353 31,949 34,576 40,454 49,519 40,910 40,434 - 1.2
11. Taipei 34,679 32,915 43,412 47,702 44,076 40,324 40,793 47,693 41,811 30,112 - 28.0
12. Mexico City 15,419 14,340 13,645 14,176 17,360 29,660 27,783 26,357 31,753 29,832 - 6.1
13. Osaka - 1,739 7,945 12,601 15,398 22,549 23,227 24,510 30,662 29,306 - 4.4
14. Houston 18,657 21,155 20,234 20,693 20,225 20,685 22,128 22,380 23,473 26,984 + 15.0
15. Johannesburg 7,585 12,535 15,483 16,773 25,184 26,519 19,783 15,481 16,166 24,890 + 54.0
16. Los Angeles 23,040 22,618 28,092 31,105 25,850 23,963 20,959 21,341 21,978 24,577 + 11.8
17. Bangkok 12,147 12,781 15,421 18,698 19,299 15,667 14,121 20,370 27,026 23,492 - 13.1
18. Delhi 10,250 13,096 12,245 10,017 16,296 14,031 11,829 9,747 10,721 18,609 + 73.6
19. Harare 8,307 10,135 11,311 15,247 14,534 11,082 11,502 20,655 23,595 18,608 - 21.1
20. Detroit 17,041 18,324 20,852 25,997 15,752 15,117 17,034 19,816 15,975 17,278 + 8.2
Rest of intercontinental 241,029 253,523 294,427 336,915 359,090 343,414 343,108 356,716 340,324 367,258 + 7.9
Total intercontinental 660,235 718,730 854,000 957,233 1,014,276 1,023,841 1,037,368 1,095,483 1,093,357 1,171,311 + 7.1
Grand total 775,386 838,127 977,531 1,082,846 1,161,234 1,171,256 1,180,717 1,222,594 1,183,208 1,239,900 + 4.8

4.1.6.
Mail transport, incoming/outgoing monthly totals 2002 (in tonnes)
January February March April May June July August September October November December Total
I. Incoming
E.U.*) 675 612 677 648 681 593 621 539 577 631 609 682 7,546
Rest of Europe 181 163 199 199 205 193 208 182 171 219 257 320 2,497
North America 472 495 581 289 225 200 191 207 237 277 423 633 4,229
Latin America 59 53 60 61 66 73 71 90 66 76 87 102 864
Africa 55 54 68 59 63 65 60 63 55 74 70 77 761
Middle East 325 96 339 108 106 102 98 95 131 93 134 127 1,754
Far East 263 219 303 211 227 216 220 226 216 232 257 369 2,959
Subtotal 2,029 1,692 2,225 1,575 1,573 1,442 1,470 1,401 1,454 1,603 1,837 2,310 20,609
II. Outgoing
E.U.*) 646 568 680 544 560 525 533 534 586 641 683 881 7,380
Rest of Europe 440 343 403 415 413 372 364 344 362 406 389 527 4,777
North America 475 457 573 411 393 357 350 327 337 401 596 742 5,419
Latin America 148 127 149 128 147 123 131 128 127 132 165 204 1,709
Africa 221 208 238 219 247 247 246 237 239 264 269 283 2,918
Middle East 228 221 242 183 194 175 158 148 126 141 152 148 2,115
Far East 348 300 353 277 307 309 313 295 296 316 356 328 3,799
Subtotal 2,506 2,224 2,639 2,176 2,260 2,109 2,095 2,012 2,073 2,302 2,609 3,112 28,117
Total air transport 4,534 3,916 4,864 3,751 3,832 3,550 3,565 3,413 3,527 3,905 4,446 5,422 48,726
*) The 15 official members of the European Union