1 nmr practical aspects (i) processes involving in a nmr study: 1. sample preparation/considerations...
TRANSCRIPT

1
NMR Practical Aspects (I)
Processes involving in a NMR study:
1. Sample Preparation/Considerations
2. Setting up Spectrometer
3. Setting up acquisition parameters and carrying out experiment
4. Processing raw NMR fid data into NMR spectrum
5. Plotting of NMR Spectrum (1D with integrals of peak intensities)
6. Analysis of NMR data
References:Basics of NMR: http://www.cis.rit.edu/htbooks/nmr Practical: http://arrhenius.rider.edu/nmr/NMR_tutor/pages/nmr_tutor_home.html
2
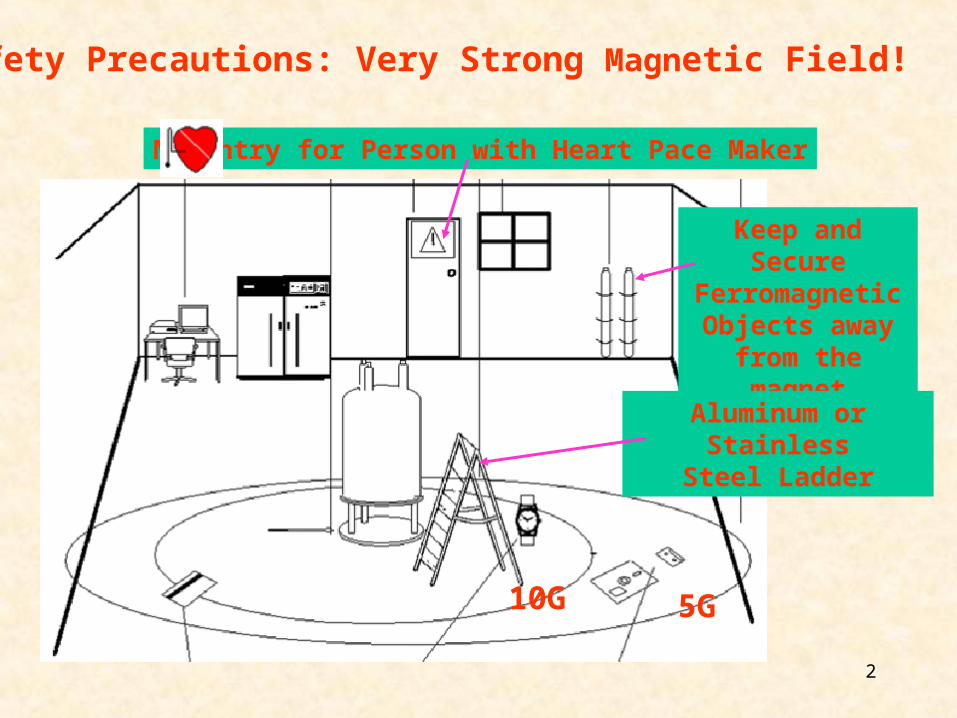
Safety Precautions: Very Strong Magnetic Field!
10G 5G
No Entry for Person with Heart Pace Maker
Keep and Secure Ferromagnetic
Objects away from the magnet
Aluminum or StainlessSteel Ladder

3
Sample Considerations:
•Molecular weight (MW): Larger molecules => tumbling slower (c ) => relax faster (i.e. shorter T2)
=> broader line-widths => lower sensitivities
MW
MW

4
•Concentration: relatively high conc. required because of low sensitivity. At least ~0.1 mM for small organics; 1- 5mM for protein or large macromolecules. For a given S/N, half conc. takes four times longer expt. time.
•Solubility ( => S/N ), aggregation or polymerization (S/N ). •Stability – tens of hours in the spectrometer may be required. E.g. oxidation, microbial contamination, hydrolytic breakdown.
•Temperatures for data collection: T => S/N need to consider the temperature dependence of stability
•Buffer/solvent selection: affect solubility, stability, position of spectral absorption lines can be solvent dependent, viscosity ( => S/N )
•Sample size: standard 5 mm tube need ~0.5ml sample volumn other tubes to enhance sensitivity e.g. 10 mm tube, Shigemi tube
Sample Considerations:

5
Setting up Spectrometer procedures:1. Insert Sample and set Temperature
2. Locking : Manual or Auto-locking
3. Tuning the probe: Manual or Auto-tuning
4. Shimming: Manual, Gradient shimming or Auto-shimming

6
•Even in the best spectrometers the field strength varies to some extent over time
•The position of the deuterium peak is monitored
• To counteract the field drift a lock field is applied to maintain a constant deuterium resonance position
Locking the deuterium signal from solvent to maintain high magnetic field stability and high line resolution
Setting up Spectrometer: Locking
Deuteriated solvent is usually used to provide the Deuterium Lock signal e.g.CDCl3, D2O, CD3OD

7
Setting up Spectrometer: Tuning the Probe
• Variations in the polarity and dielectric constant of the
solvent will affect the probe tuning.
•Tune each coil to be resonant at the Larmor frequency for the corresponding nucleus: e.g. 1H, 13C, 15N
•Two capacitors (tune and match) are adjusted to achieve maximum power transfer into and out of the probe
Minimize reflected power to get best match
Align the minimumto expected freq to get best tune
Expected freq of the selected nucleus
Tuning with ‘wobb’ curve

8
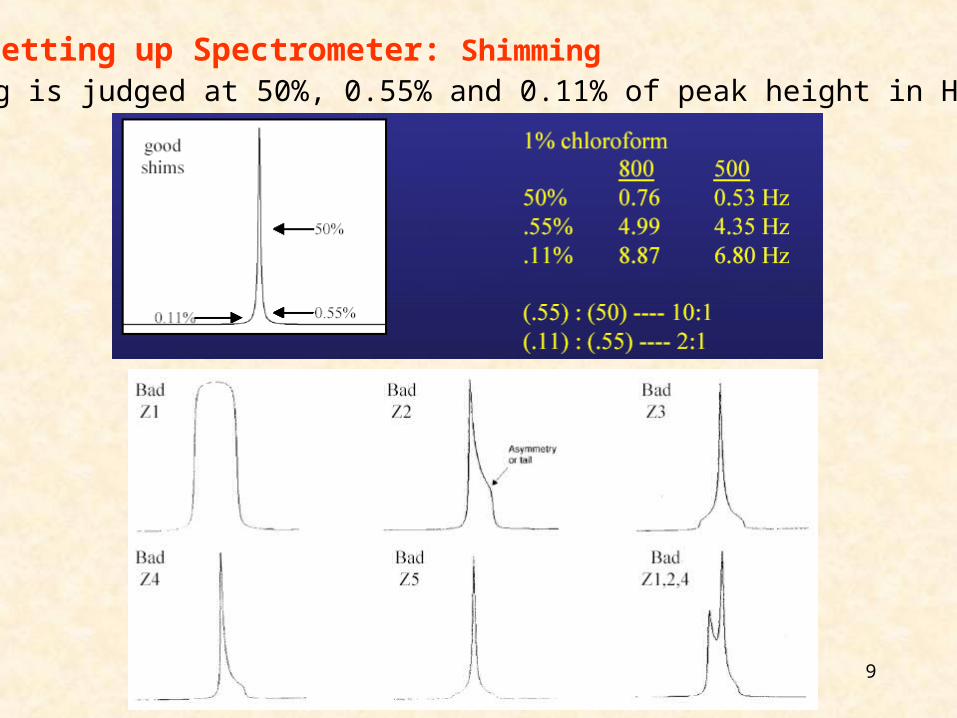
•The process of making the magnetic fieldsurrounding the sample as homogenous as possible•A series of shim coils correct minor inhomogeneitiesin the static magnetic field
•Good Shims => Sharp lines!All the nuclei in the sample “feel” the same magnetic field
•Poor Shims =>Broad lines and poor line-shapes!Variable magnetic field across thesample – nuclei in different regionsof the sample will resonate atslightly different frequencies
Setting up Spectrometer: Shimming
9
Setting up Spectrometer: ShimmingShimming is judged at 50%, 0.55% and 0.11% of peak height in Hz

10
Spinning Sidebands observed at multiples of spinning rate
What is thespinning rate
here?24 Hz
No spinning for biomolecule samples because natural linewidth is large

11
Setting up acquisition parameters
For each dimension: • Spectral Frequency (sf) : Center of all NMR peaks or H2O peak
position for aqueous sample • Spectral Width (sw) in Hz : Covering all NMR peaks • Number of data points (np) for direct detection dimension or number of increments for indirect dimensions: Depends of digital resolution required or experimental time available. • Calibrate the 90 degree pulse width (pw90 in us) and set power
(in dB) for the pulses.
Global parameters: • Recycling delay (d1) : >= 5T1
• Number of scans per fid (nt) : signal averaging to get better signal to noise (S/N)
• Receiver Gain (rg) : maximize DAC usage

12
tof is the transmitter offset frequency from a base frequency e.g. 600.13 MHz
Presaturation Experiment on protein Sample in H2O
[H2O]=55 M >> [protein]=1mM> DAC resolution (e.g. 65535)
=> can’t see weak protein signalssw
sf
sf+sw/2 sf-sw/2

13
Some useful terminologies and relationships:
Sampling rate: sr = 1/(dt) in Hz; dt=dwell time
Optimal sampling rate is based on Nyquist criterion => sw = sr / 2
i.e. highest observable frequency = sample rate / 2
or dt = 1/(2*sw) in second
Acquisition time:
aq = dt * np0.05 0.1 0.15 0.2
-1
-0.5
0.5
1
These two frequencies are 10 and 110 Hz sampled at Dt=0.01 seconds. The FT would have a SW of 100 Hz, and the two peaks are indistinguishable. This is called aliasing and can be a big experimental problem if you are not careful.
How to detect aliasing peaks?
Alter sw

14
Digital Resolution:
dr = sw / np in Hz should be < natural line width
Improve dr either by np or sw
line width (lw)= 1/( T2)Larger for bigger molecules
lw < 1 Hz for most organics10-30 Hz for proteins

15

16

17
Relationship between pulse width, power and Bandwidth
Bandwidth (bw) = 1/(4 * pw) should be > spectral width
Power 6dB => pw90 by a factor of 2Therefore can increase power until pw90 gives large enough bw
FT

18

19
Therefore the actual number of increments for indirect dimensions is usually a compromise between digital resolution required and experimental time available.
3D data will requires increments onni and ni2 dimensions
i.e. ni * ni2 FID’sTotal time is in the order of 10 to 100 hours

20
Optimal Recycling Delay:
For full relaxation and restoration of equilibrium MagnetizationRecycling delay (d1) >= 5T1
But T1 can be very long for some nucleus e.g. 13C => very long acquisition time for full relaxation
And signal averaging gives S/N
Therefore one can get best use of experimental time (Texp) to get best S/N by using the Ernst angle (e) for excitation in 1D experiment:
cos e = exp(-Texp/ T1)
t1
t1
e