1 mitochondrial genomic rearrangements in songbirds
Post on 20-Dec-2015
234 views
TRANSCRIPT
1
Mitochondrial Genomic Rearrangements in Songbirds
2
Introduction Mitochondrial genome is conserved among verte
brates. Examination of similarity of mitochondrial rearran
gement can be used to classification. Most avian orders have the rearrangement betwe
en the cytochrome b and 12S rRNA. The main mechanisms causing the avian mitoch
ondrial rearrangement were purposed to tandem duplication and inversion and other gene recombinations.
Two assumption:
1.Mitochondrial rearrangement are rare.
2.A shared organization reflect a common
ancestry.
3
Key Words and Methods Control region (CR) and noncoding regio
n (NC) Tandem duplication and inversion. Polymerase chain reaction (PCR) Sequencing Ancestral arrangement Derived arrangement Willow warbler (Phylloscopus trochilus)
4
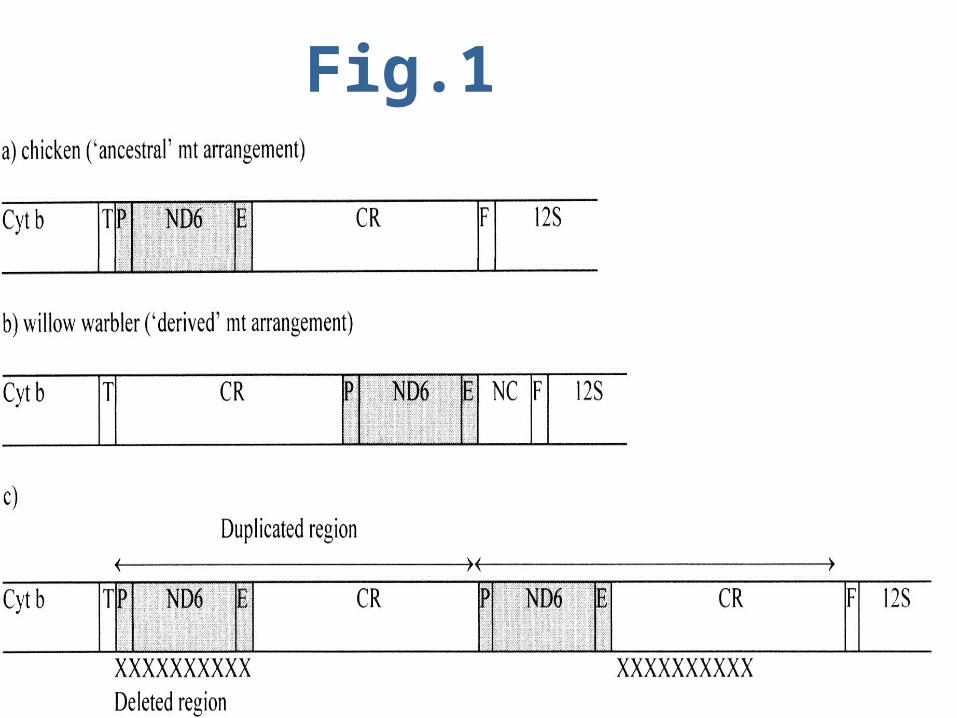
Content Typical vertebrate gene order—single tra
nslocation of NADH6 and tRNAGlu .
Most avian orders gene order--tRNAThr / tRNAPro / NADPH6 / tRNAGlu / CR / tRNAPhe
Another avian mitochondrial arrangement– tRNAThr / CR / tRNAPro /NADPH6 / tRNAGlu / NC / tRNAPhe
has least two evolutionary changes.
5
Fig.1
6
Suppose Derived mitochondrial arrangement is ev
olution from ancestral mitochondrial arrangement and passed through a tandem duplication and a deletion.
Noncoding region is a part of control region.
Control region and noncoding region are homologous.
Comparing the similarity of NC and CR in different genus or spices can know the relatives of the each kinds.

7
Table 1
8
Analysis Control Region
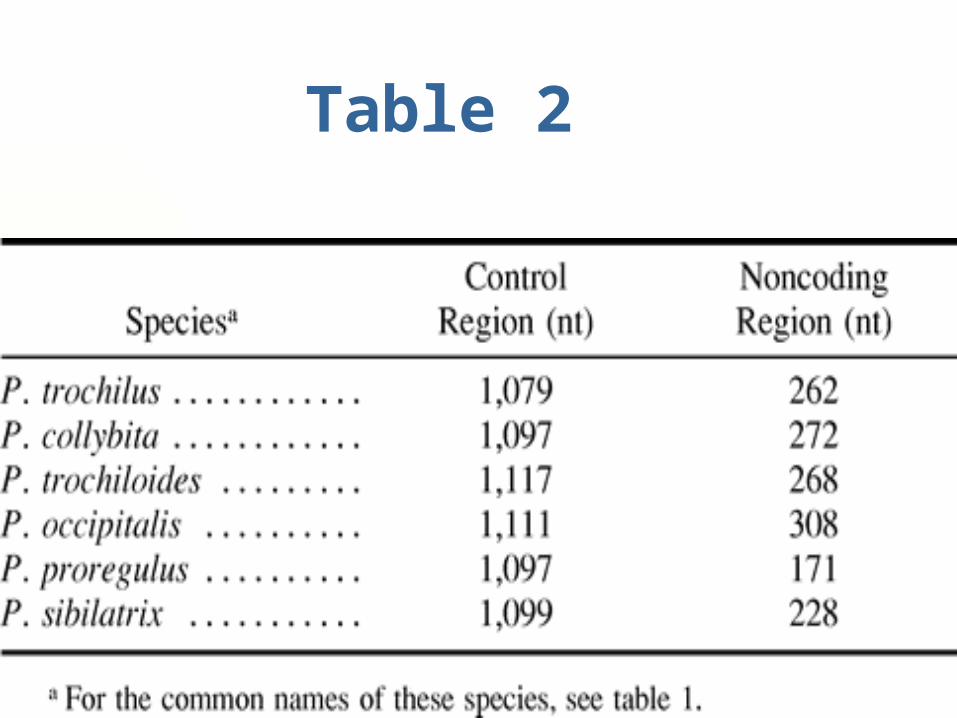
We can find that the control regions are about 1100 nt long in all of the phylloscopus species.

9
Table 2
10
Analysis Control Region
We can find that the control regions are about 1100 nt long in all of the Phylloscopus species.
The similarity between the control region of the six Phylloscopus species showed >63%
11
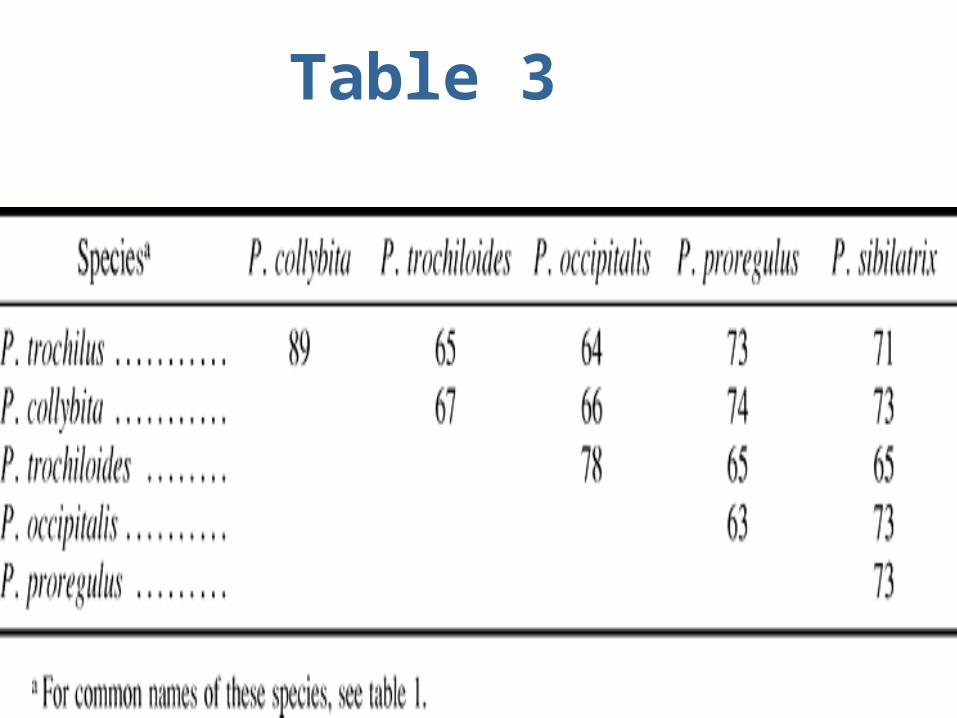
Table 3
12
Analysis Control Region
We can find that the control regions are about 1100 nt long in all of the Phylloscopus species.
The similarity between the control region of the six Phylloscopus species showed >63%
Contrast the others warblers,the control region is quite different.
13
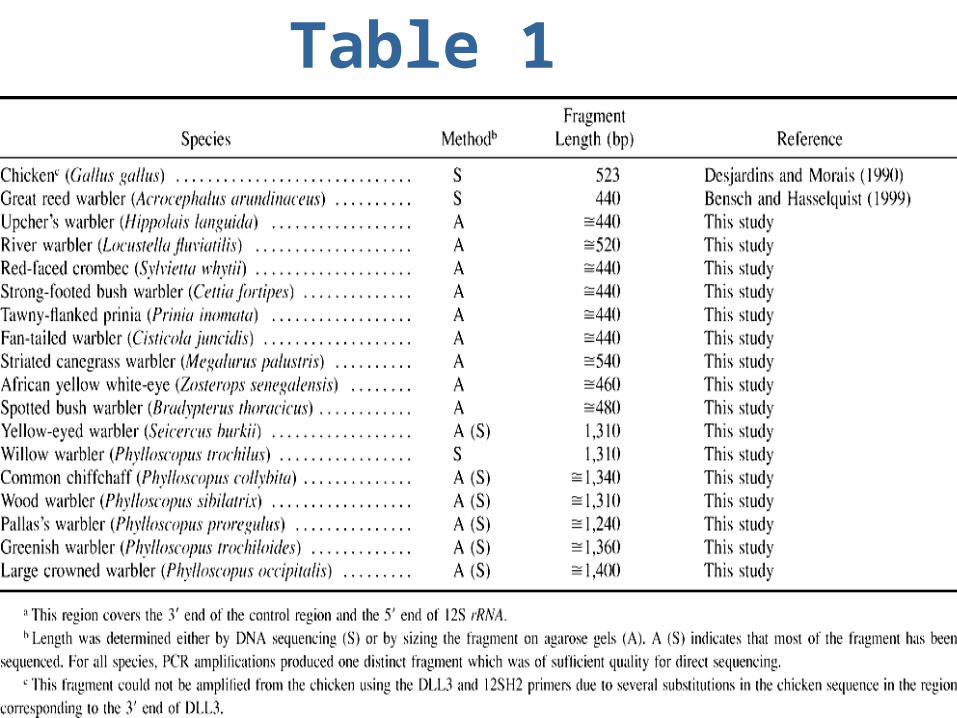
Table 1
14
Analysis Control Region We can find that the control regions are
about 1100 nt long in all of the Phylloscopus species.
The similarity between the control region of the six Phylloscopus species showed >63%
Contrast the others warblers,the control region is quite different.
Suppose that the higher degrees of similarity between the CR , the relatives of the avian was closer.
15
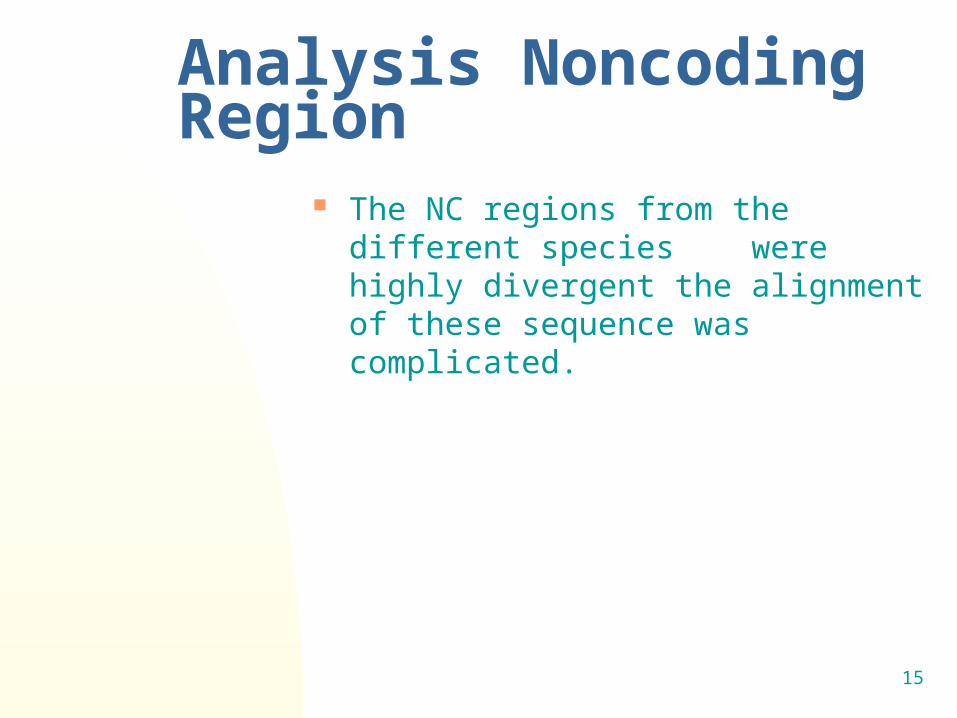
Analysis Noncoding Region
The NC regions from the different species were highly divergent the alignment of these sequence was complicated.
16
Table 2
17
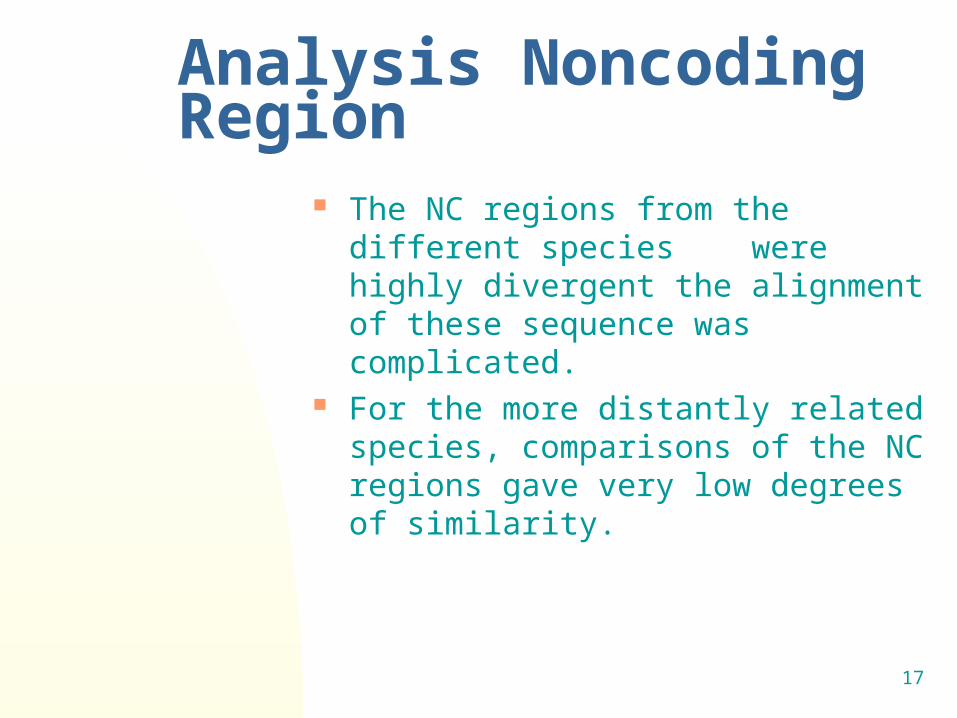
Analysis Noncoding Region
The NC regions from the different species were highly divergent the alignment of these sequence was complicated.
For the more distantly related species, comparisons of the NC regions gave very low degrees of similarity.
18
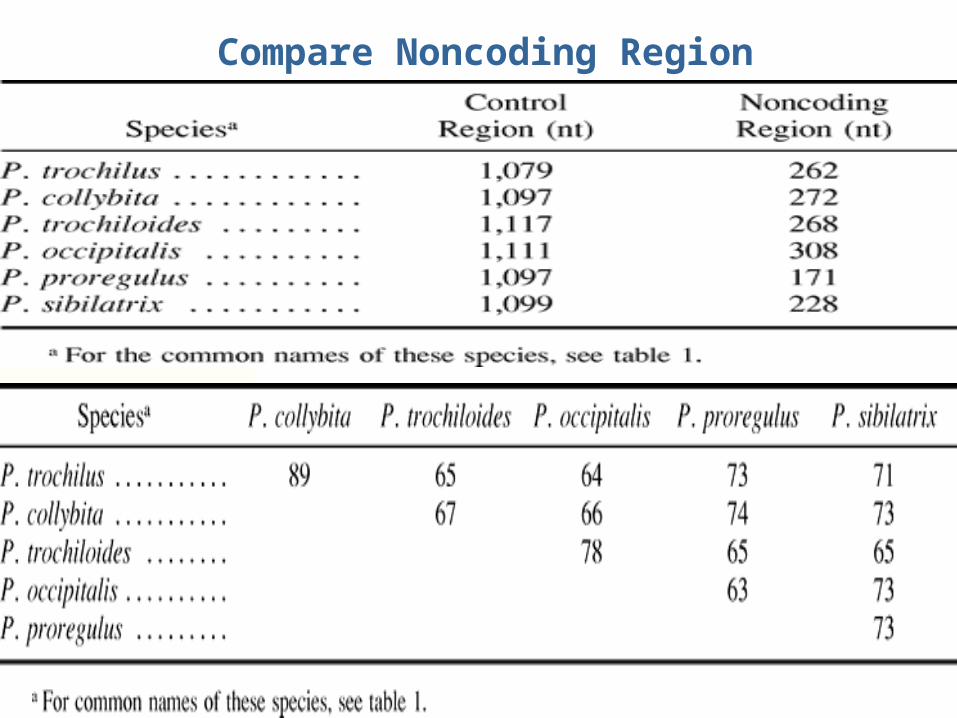
Compare Noncoding Region
19
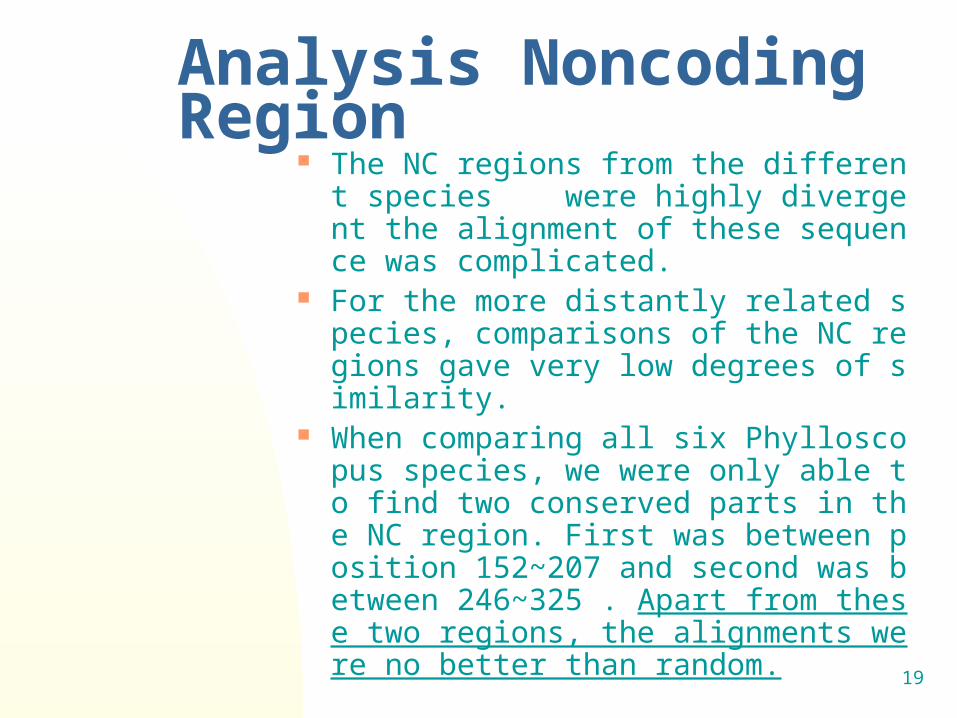
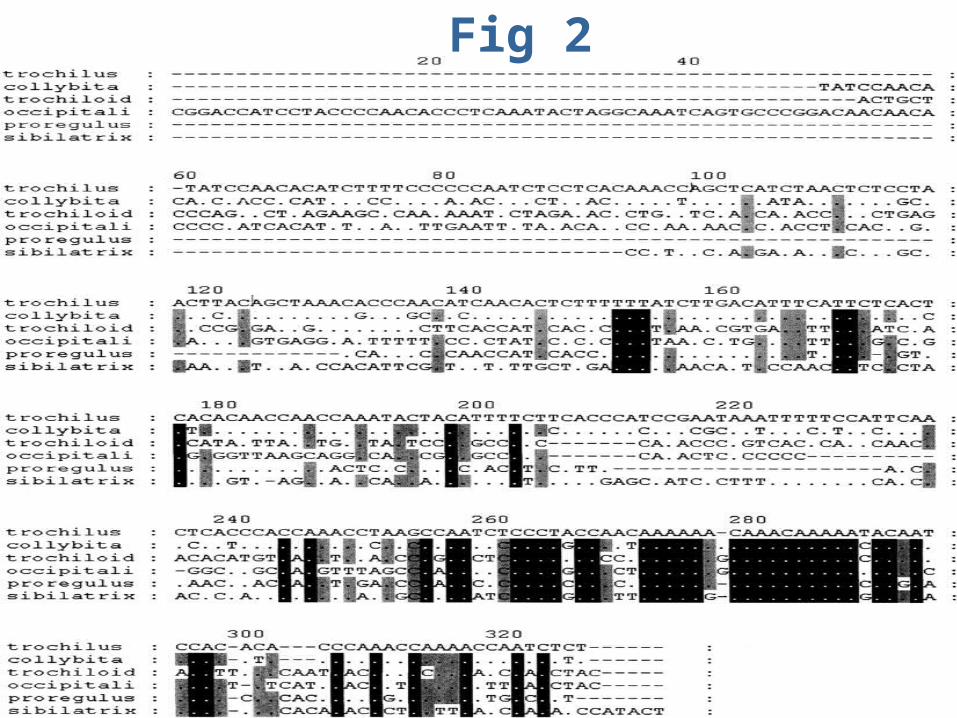
Analysis Noncoding Region The NC regions from the different specie
s were highly divergent the alignment of these sequence was complicated.
For the more distantly related species, comparisons of the NC regions gave very low degrees of similarity.
When comparing all six Phylloscopus species, we were only able to find two conserved parts in the NC region. First was between position 152~207 and second was between 246~325 . Apart from these two regions, the alignments were no better than random.
20
Fig 2
21
Comparisons Between the CR and the NC Region
Only parts of the NC region of each species could be aligned with the CR of that species. However, each species’s NC region had short stretches which showed high similarity to a portion of the CR from that species.
22
Fig 3
23
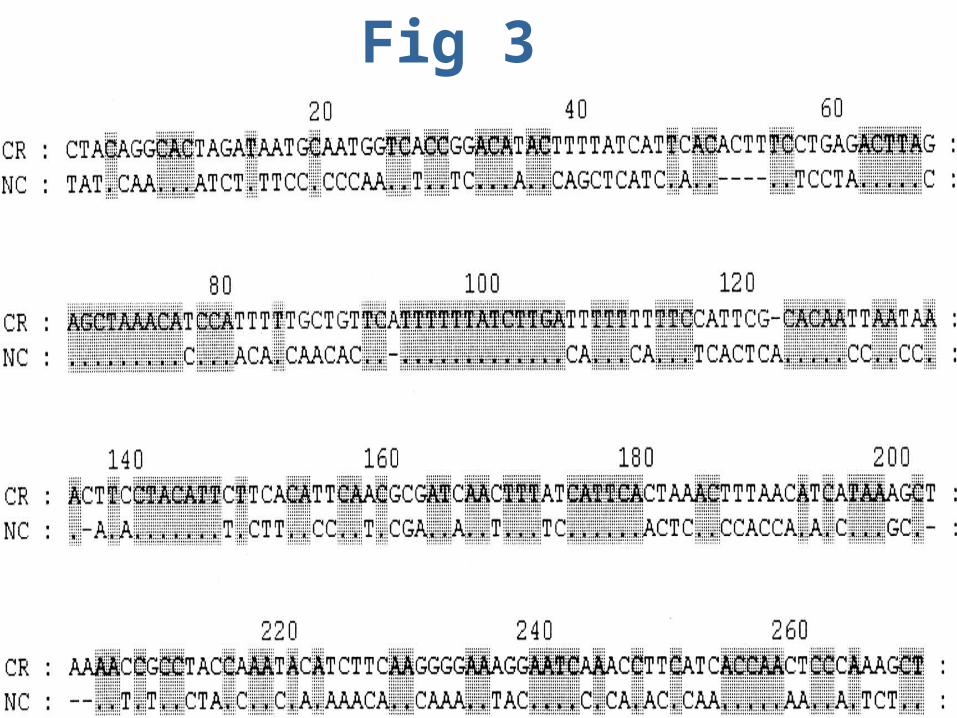
Comparisons Between the CR and the NC Region
Only parts of the NC region of each species could be aligned with the CR of that species. However, each species’s NC region had short stretches which showed high similarity to a portion of the CR from that species.
The detected similarity between the CR and the NC region supports the hypothesis that the control and NC regions are homologous and that the derived gene order arose through a tandem duplication followed by deletions.

24
Fig.1
25
Conclusion and Discussion The high degree of similarity between positions 867
and 1136 of the CR and the NC region from each Phylloscopus species, respectively, strongly suggests that the CR and the NC region of each species are homologous and that the mechanism which caused this rearrangement was a tandem duplication followed by multiple deletions.
If we assume that the NC region is a partially deleted and degraded copy of the CR and that the rearrangement occurred in the common ancestor of Phylloscopus, we would expect the NC region of each species to be more similar to the NC regions of other species than to the CR of that species.
26
Discussion and Conclusion However, the similarities between the CR and the N
C region of each species were less pronounced than those between the different NC regions when we compared closely related species.
Why are the three genes tRNApro ,NADH6 ,and tRNAGlu prone to move together and prone to moving to the same site in different lineages? One possible explanation is that most mitochondrial rearrangements must be deleterious. Even if duplications and deletions occur relatively frequently , only a few gene combinations might be viable and thus reach fixation. Hence, the observed positions of the three genes either downstream or upstream of the control region in birds might be two of very few function location for these genes.

27