1 learning to live in euroland the role of france and germany conference france and germany in the...
Post on 22-Dec-2015
214 views
TRANSCRIPT
1
Learning to live in EurolandThe role of France and Germany
Conference
France and Germany in the International Division of Labour
Centre Saint-Gobain for Economic Studies
Paris, 9-10 December 2004
Stefan Collignon
Professor of European Political Economy LSE

2
Learning to live in Euroland Professor Stefan Collignon
Franceallemagne as motor of European integration?
“Red lanterns” in Euroland ?
Rigid labour markets ?
An out-dated social model ?
A more complex reality
Fundamental change is the monetary system
from Bretton Woods to EMS to EMU
Adjustment to the new reality takes more than labour market reforms

3
Learning to live in Euroland Professor Stefan Collignon
Economic convergence as a precondition for political union
A remarkable degree of convergence has taken place
Germany suffers from German unification
Fiscal policy suffers from institutional deficiencies and this blocs economic growth and employment in Euroland
Unless political initiative emerges from France and Germany, 50 years of integration will perish
Economic stagnation is systemic
Collective action problem in EU25
bad policy output undermines legitimacy
But France and Germany have ideologically converged
4
Learning to live in Euroland Professor Stefan Collignon
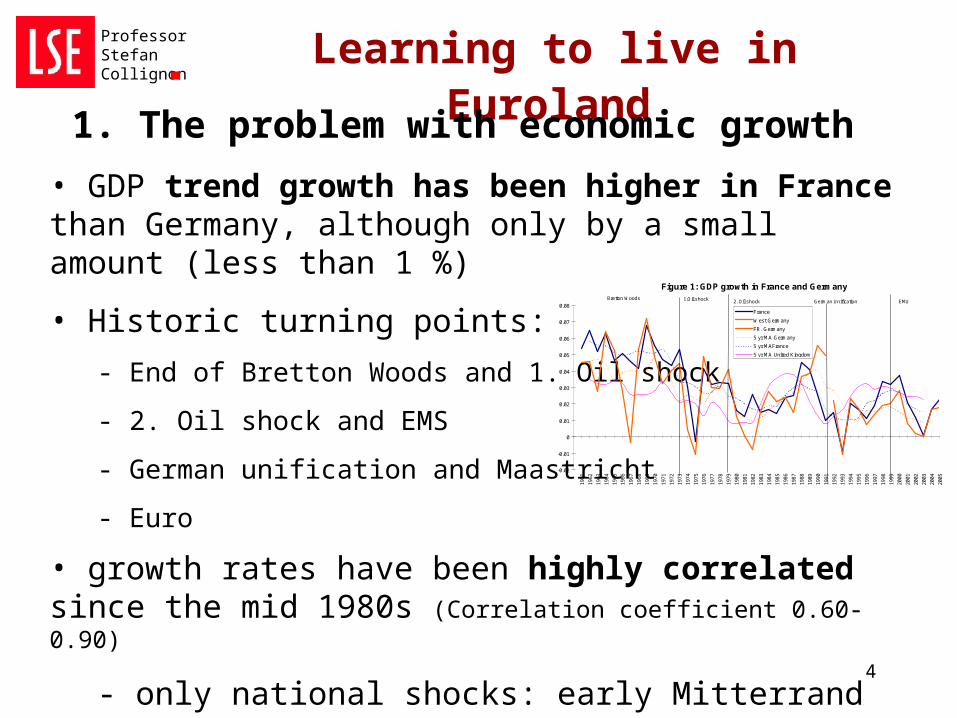
1. The problem with economic growth
• GDP trend growth has been higher in France than Germany, although only by a small amount (less than 1 %)
• Historic turning points:
- End of Bretton Woods and 1. Oil shock
- 2. Oil shock and EMS
- German unification and Maastricht
- Euro
• growth rates have been highly correlated since the mid 1980s (Correlation coefficient 0.60-0.90)
- only national shocks: early Mitterrand years and German unification
Figure 1: GDP growth in France and Germany
-0.02
-0.01
0
0.01
0.02
0.03
0.04
0.05
0.06
0.07
0.08
1961
1962
1963
1964
1965
1966
1967
1968
1969
1970
1971
1972
1973
1974
1975
1976
1977
1978
1979
1980
1981
1982
1983
1984
1985
1986
1987
1988
1989
1990
1991
1992
1993
1994
1995
1996
1997
1998
1999
2000
2001
2002
2003
2004
2005
France
West Germany
FR. Germany
5 yr MA Germany
5 yr MAFrance
5 yr MA United Kingdom
EMU2. Oil shockBretton Woods 1.Oil shock German Unification
5
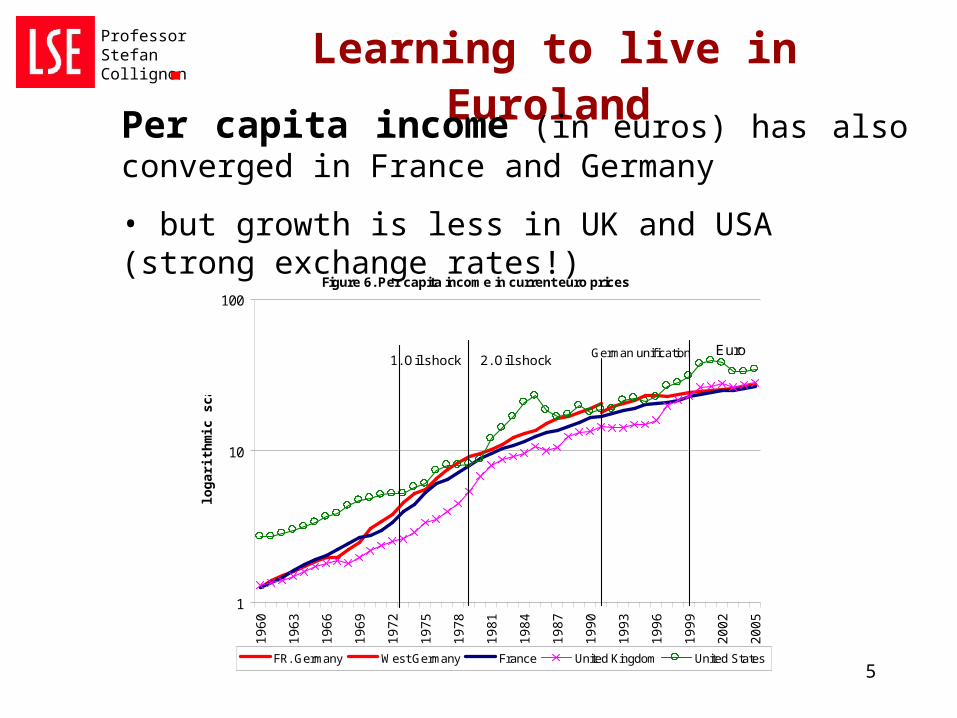
Learning to live in Euroland Professor Stefan Collignon
Per capita income (in euros) has also converged in France and Germany
• but growth is less in UK and USA (strong exchange rates!)
Figure 6. Per capita income in current euro prices
1
10
100
19
60
19
63
19
66
19
69
19
72
19
75
19
78
19
81
19
84
19
87
19
90
19
93
19
96
19
99
20
02
20
05
log
ari
thm
ic s
ca
le
FR. Germany West Germany France United Kingdom United States
1. Oil shock 2. Oil shockGerman unif ication Euro
6
Learning to live in Euroland Professor Stefan Collignon
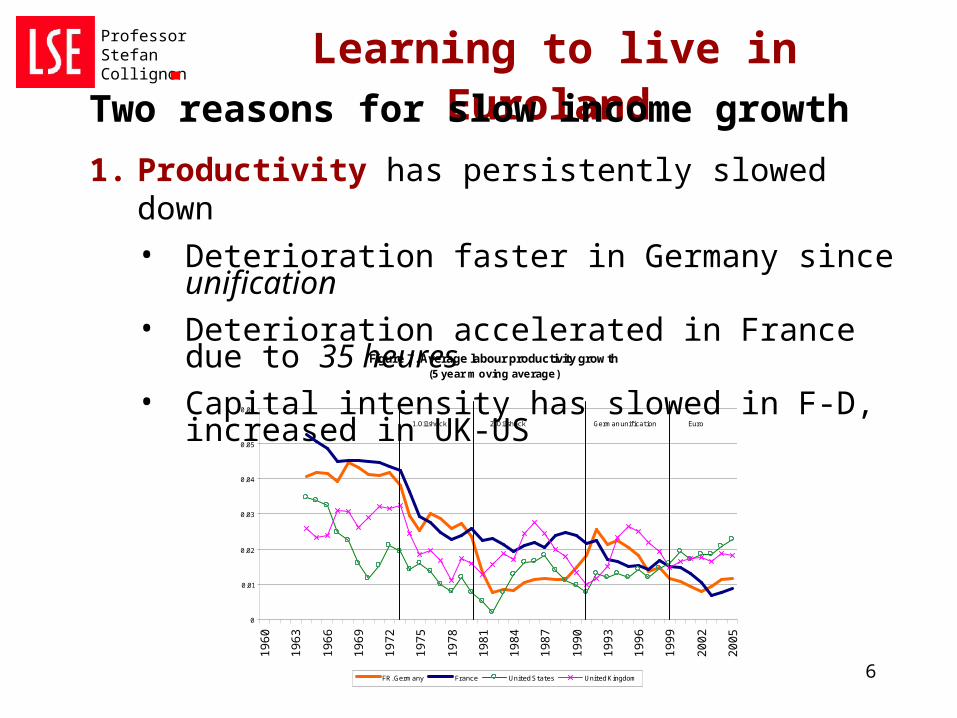
Two reasons for slow income growth
1. Productivity has persistently slowed down
• Deterioration faster in Germany since unification• Deterioration accelerated in France due to 35 heures• Capital intensity has slowed in F-D, increased in UK-US
Figure 7. Average labour productivity growth (5 year moving average)
0
0.01
0.02
0.03
0.04
0.05
0.06
19
60
19
63
19
66
19
69
19
72
19
75
19
78
19
81
19
84
19
87
19
90
19
93
19
96
19
99
20
02
20
05
FR. Germany France United States United Kingdom
1. Oil shock 2. Oil shock German unification Euro
7
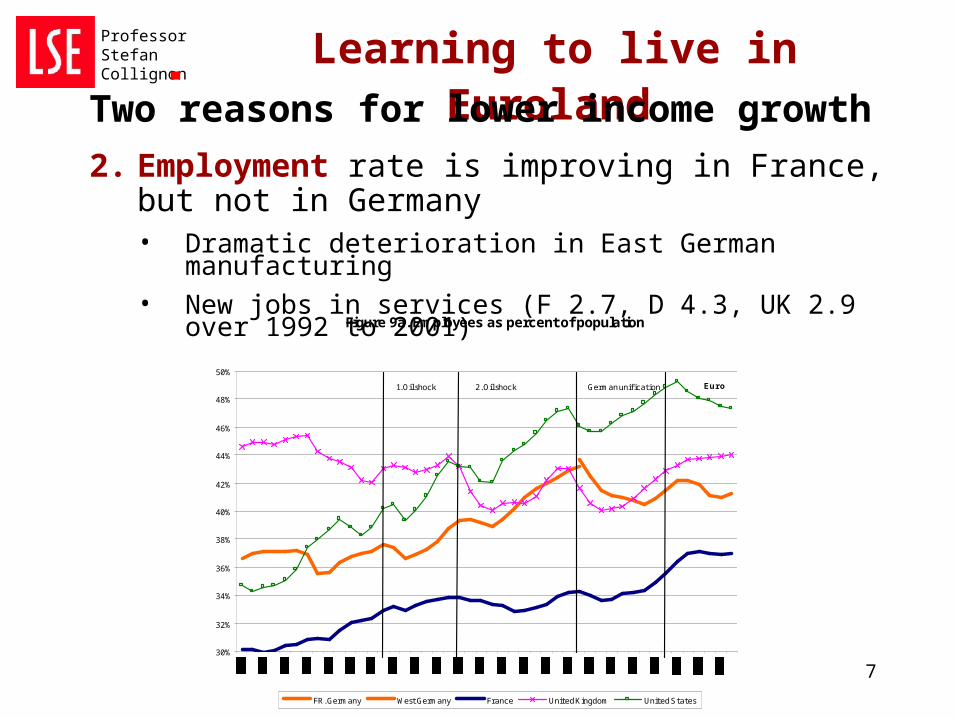
Learning to live in Euroland Professor Stefan Collignon
Two reasons for lower income growth
2. Employment rate is improving in France, but not in Germany• Dramatic deterioration in East German manufacturing• New jobs in services (F 2.7, D 4.3, UK 2.9 over 1992 to 2001)
Figure 9a. Employees as percent of population
30%
32%
34%
36%
38%
40%
42%
44%
46%
48%
50%
FR. Germany West Germany France United Kingdom United States
EuroGerman unification2. Oil shock 1. Oil shock

8
Learning to live in Euroland Professor Stefan Collignon
Job creation is low when GDP growth is below productivity growth Figure 13a. J ob creating growth in Germany
(5-year moving average)
0
1
2
3
4
5
6
job creation
growth of real GDP
labour productivity
EMUGerman unifi cation1. Oil shock 2. Oil shock
Kohl
Figure 13b. J ob creating growth in France(5-year moving average)
0
1
2
3
4
5
6
7
job creationgrowth of real GDP
labour productivity
Germany
France
9
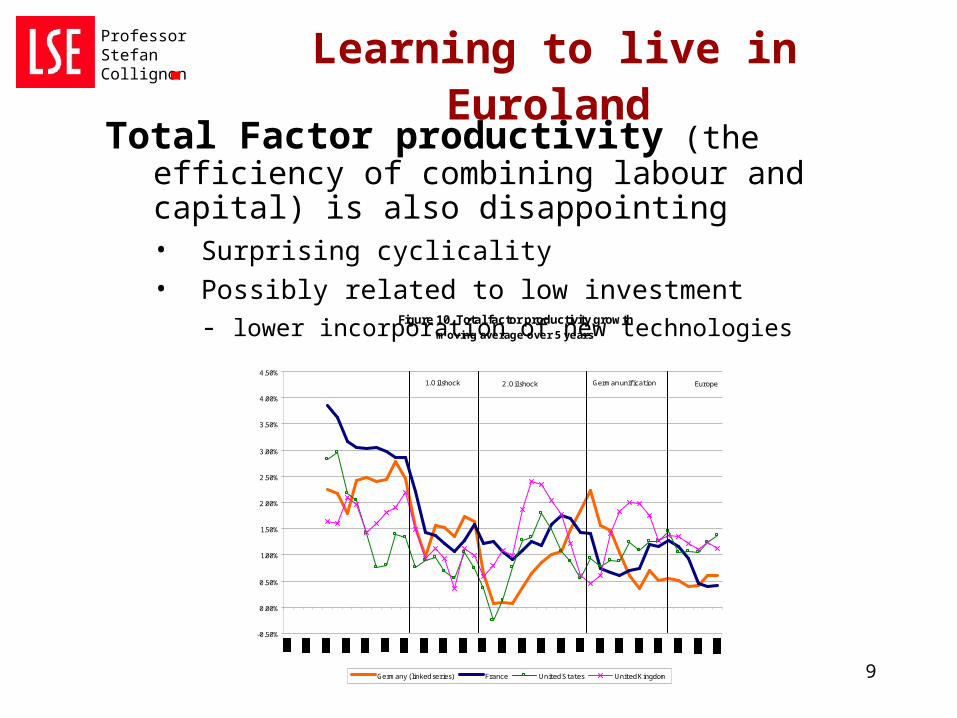
Learning to live in Euroland Professor Stefan Collignon
Total Factor productivity (the efficiency of combining labour and capital) is also disappointing • Surprising cyclicality• Possibly related to low investment
- lower incorporation of new technologiesFigure 10. Total factor productivity growth
moving average over 5 years
-0.50%
0.00%
0.50%
1.00%
1.50%
2.00%
2.50%
3.00%
3.50%
4.00%
4.50%
Germany (linked series) France United States United Kingdom
EuropeGerman unification2. Oil shock1. Oil shock
10
Learning to live in Euroland Professor Stefan Collignon
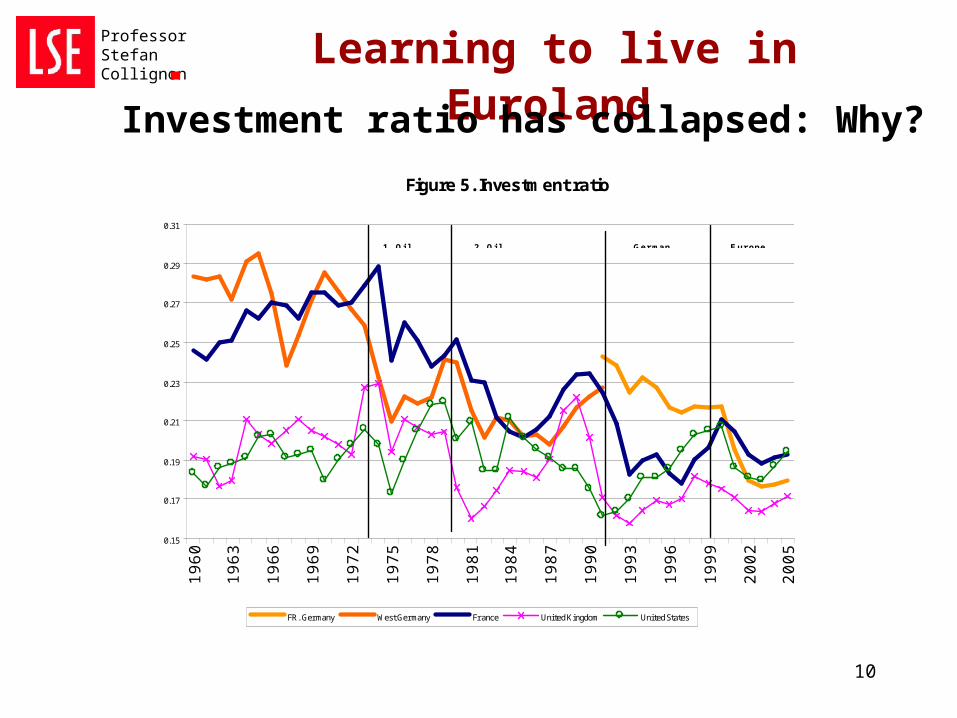
Investment ratio has collapsed: Why?
Figure 5. Investment ratio
0.15
0.17
0.19
0.21
0.23
0.25
0.27
0.29
0.31
1960
1963
1966
1969
1972
1975
1978
1981
1984
1987
1990
1993
1996
1999
2002
2005
FR. Germany West Germany France United Kingdom United States
1. Oi l 2. Oi l Ger man Eur ope
11
Learning to live in Euroland Professor Stefan Collignon
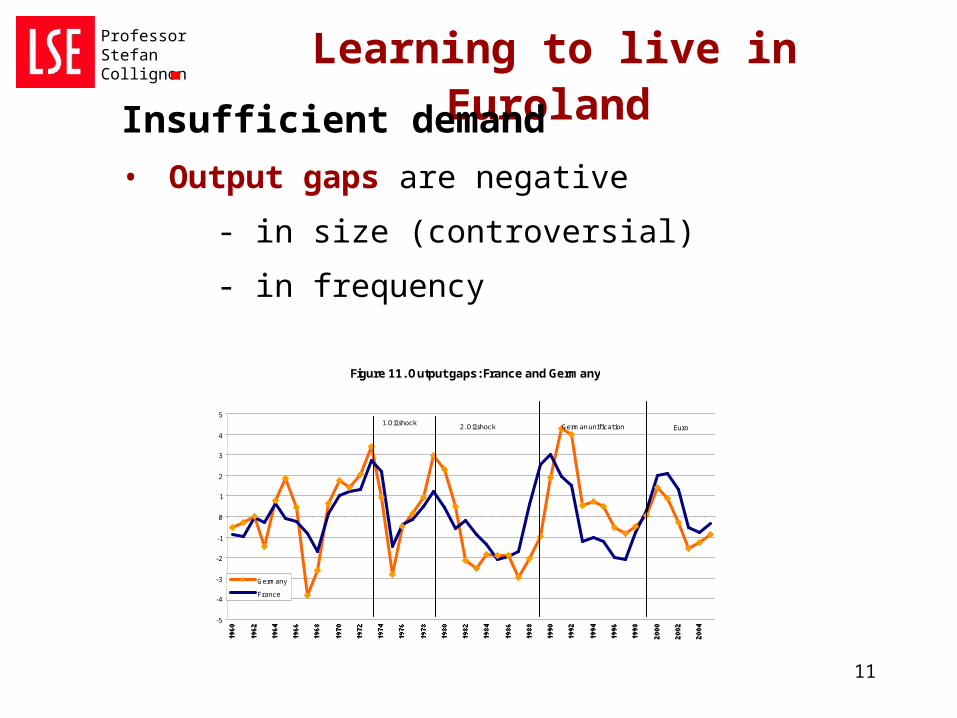
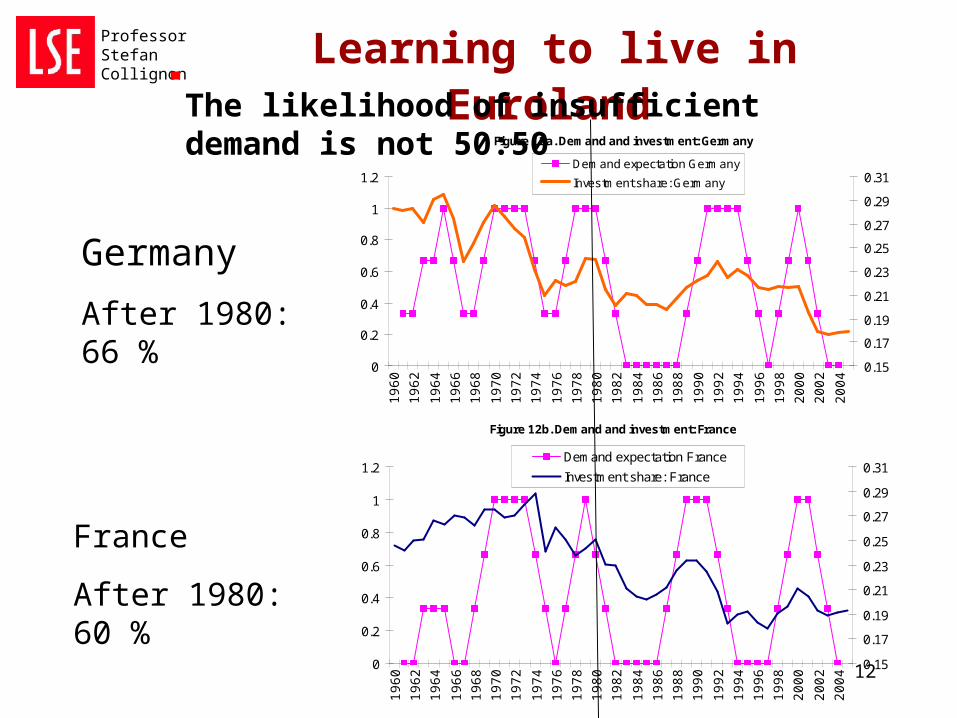
Insufficient demand
• Output gaps are negative
- in size (controversial)
- in frequency
Figure 11. Output gaps: France and Germany
-5
-4
-3
-2
-1
0
1
2
3
4
5
Germany
France
1. Oil shock 2. Oil shock German unification Euro
12
Learning to live in Euroland Professor Stefan Collignon
Figure 12a. Demand and investment: Germany
0
0.2
0.4
0.6
0.8
1
1.2
1960
1962
1964
1966
1968
1970
1972
1974
1976
1978
1980
1982
1984
1986
1988
1990
1992
1994
1996
1998
2000
2002
2004
0.15
0.17
0.19
0.21
0.23
0.25
0.27
0.29
0.31Demand expectation Germany
Investment share: Germany
Figure 12b. Demand and investment: France
0
0.2
0.4
0.6
0.8
1
1.2
1960
1962
1964
1966
1968
1970
1972
1974
1976
1978
1980
1982
1984
1986
1988
1990
1992
1994
1996
1998
2000
2002
2004
0.15
0.17
0.19
0.21
0.23
0.25
0.27
0.29
0.31Demand expectation France
Investment share: France
Germany
After 1980: 66 %
France
After 1980: 60 %
The likelihood of insufficient demand is not 50:50
13
Learning to live in Euroland Professor Stefan Collignon
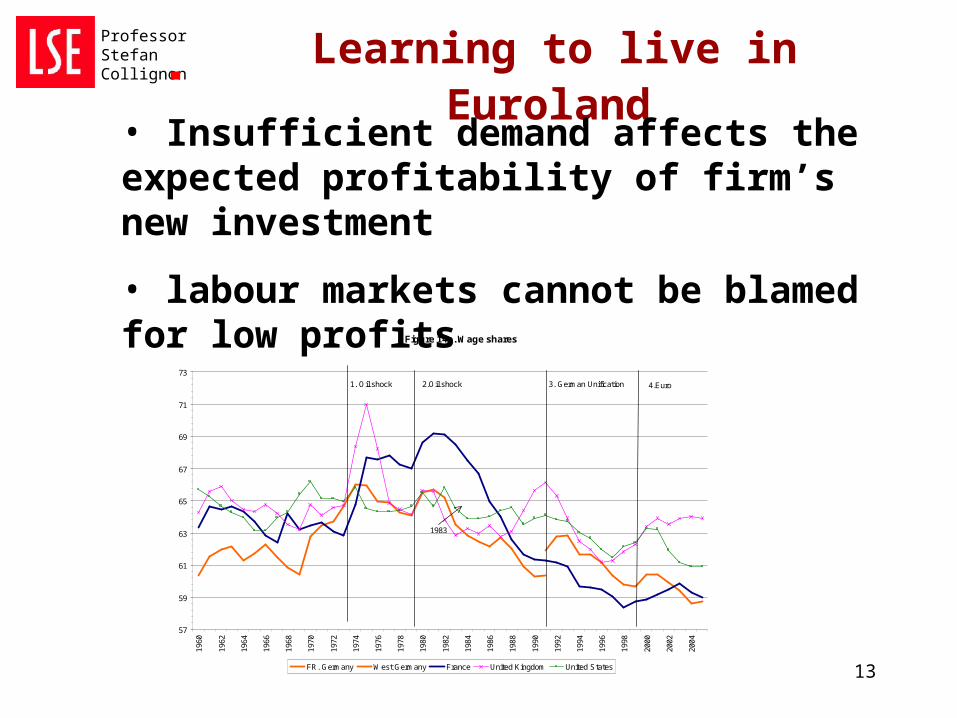
• Insufficient demand affects the expected profitability of firm’s new investment
• labour markets cannot be blamed for low profits
Figure 14a. Wage shares
57
59
61
63
65
67
69
71
73
1960
1962
1964
1966
1968
1970
1972
1974
1976
1978
1980
1982
1984
1986
1988
1990
1992
1994
1996
1998
2000
2002
2004
FR. Germany West Germany France United Kingdom United States
1. Oil shock 2.Oil shock 3. German Unification 4.Euro
1983
14
Learning to live in Euroland Professor Stefan Collignon
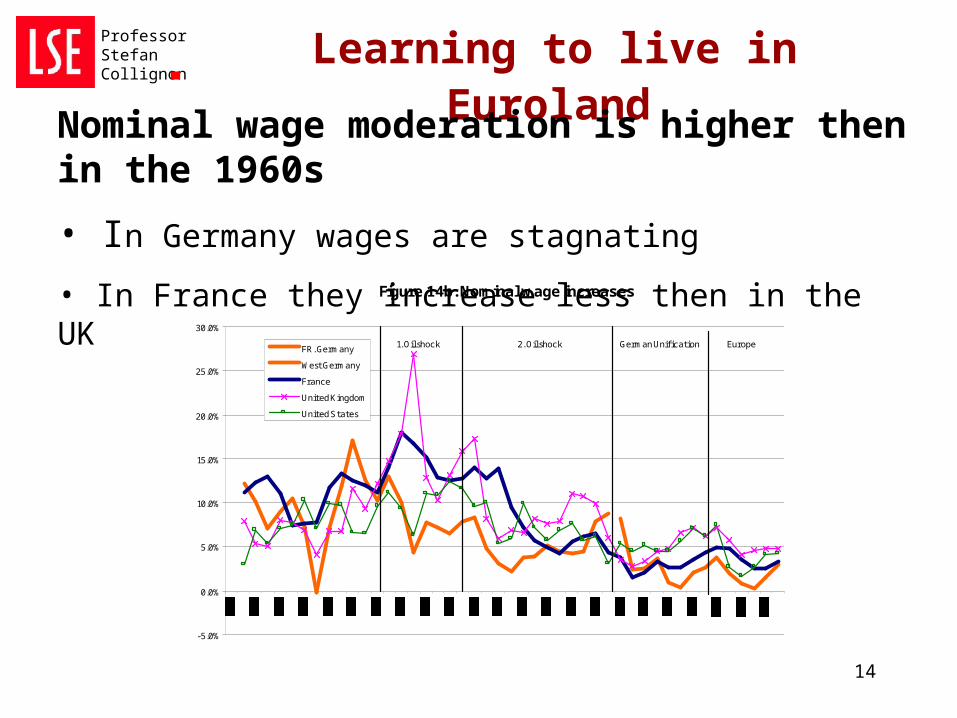
Nominal wage moderation is higher then in the 1960s
• In Germany wages are stagnating
• In France they increase less then in the UKFigure 14b. Nominal wage increases
-5.0%
0.0%
5.0%
10.0%
15.0%
20.0%
25.0%
30.0%
FR. Germany
West Germany
France
United Kingdom
United States
Europe2. Oil shock1. Oil shock German Unification
15
Learning to live in Euroland Professor Stefan Collignon
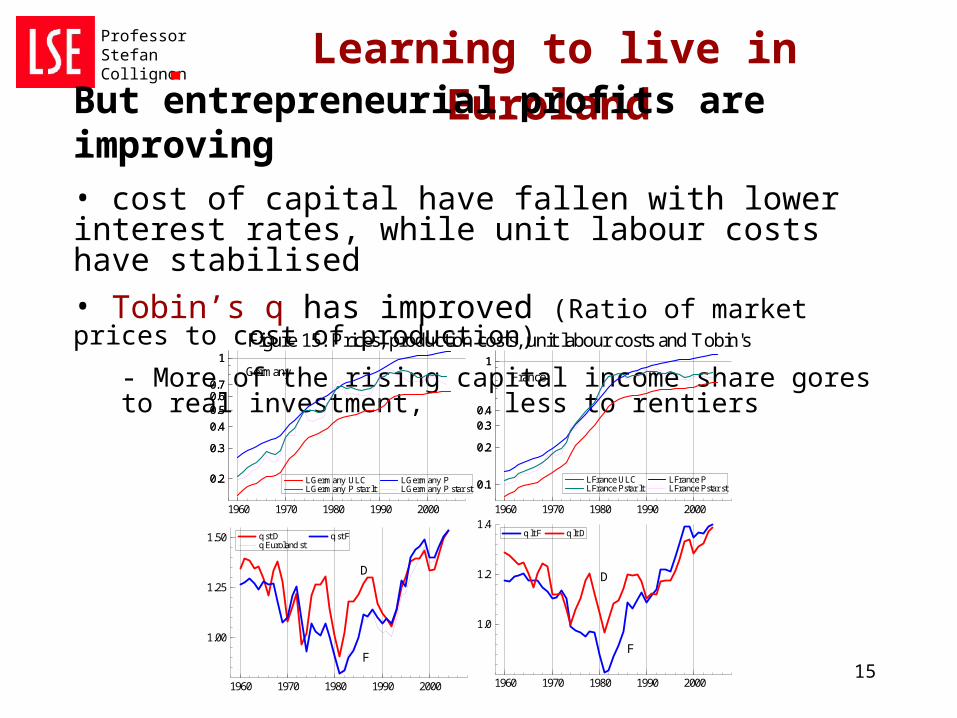
But entrepreneurial profits are improving• cost of capital have fallen with lower interest rates, while unit labour costs have stabilised
• Tobin’s q has improved (Ratio of market prices to cost of production)
- More of the rising capital income share gores to real investment, less to rentiers
0.2
0.3
0.4
0.50.60.7
1
0.2
0.3
0.4
0.50.60.7
1
1960 1970 1980 1990 2000
Figure 15. Prices, production costs, unit labour costs and Tobin's q
Germany
LGermany ULC LGermany P star lt
LGermany P LGermany P star st 0.1
0.2
0.30.4
1
0.1
0.2
0.30.4
1
1960 1970 1980 1990 2000
France
LFrance ULC LFrance Pstar lt
LFrance P LFrance Pstar st
1960 1970 1980 1990 2000
1.00
1.25
1.50
F
D
q st D q Euroland st
q st F
1960 1970 1980 1990 2000
1.0
1.2
1.4
F
D
q lt F q lt D
16
Learning to live in Euroland Professor Stefan Collignon
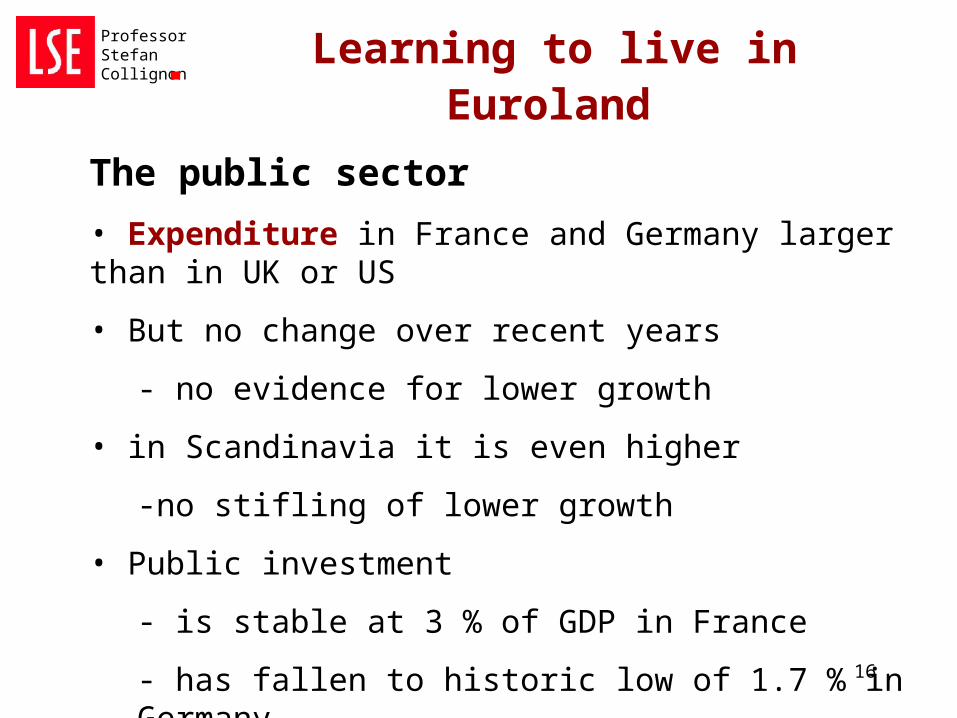
The public sector
• Expenditure in France and Germany larger than in UK or US
• But no change over recent years
- no evidence for lower growth
• in Scandinavia it is even higher
-no stifling of lower growth
• Public investment
- is stable at 3 % of GDP in France
- has fallen to historic low of 1.7 % in Germany
17
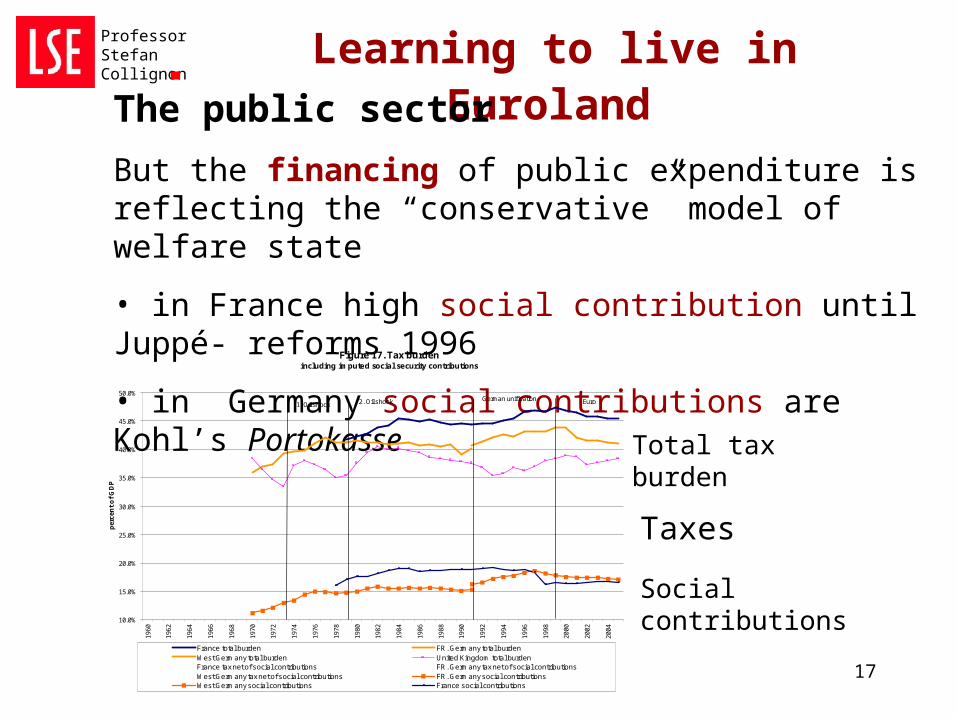
Learning to live in Euroland Professor Stefan Collignon
The public sector
But the financing of public expenditure is reflecting the “conservative” model of welfare state
• in France high social contribution until Juppé- reforms 1996
• in Germany social contributions are Kohl’s PortokasseFigure 17. Tax burden
including imputed social security contributions
10.0%
15.0%
20.0%
25.0%
30.0%
35.0%
40.0%
45.0%
50.0%
1960
1962
1964
1966
1968
1970
1972
1974
1976
1978
1980
1982
1984
1986
1988
1990
1992
1994
1996
1998
2000
2002
2004
per
cen
t o
f G
DP
France total burden FR. Germany total burdenWest Germany total burden United Kingdom total burdenFrance tax net of social contributions FR. Germany tax net of social contributionsWest Germany tax net of social contributions FR. Germany social contributionsWest Germany social contributions France social contributions
EuroGerman unif ication2. Oil shock1. Oil shock
Total tax burden
Taxes
Social contributions

18
Learning to live in Euroland Professor Stefan Collignon
To summarise:
• Economic structures in France and Germany have converged
- they are more alike than anglo-saxon economies
• The handicap is macroeconomic policy
- in EMU this is a matter of the policy mix
- monetary policy interacts with fiscal and wage policies
• Can Francallemagne improve their situation by “economic reforms”?

19
Learning to live in Euroland Professor Stefan Collignon
1. Is the labour market too rigid?
• Mobility: high in Germany led to same wage levels in East and West
• Are wages too high?
- Unskilled workers: reforms have happened
- Average wages reflect productivity: unit labour costs
20
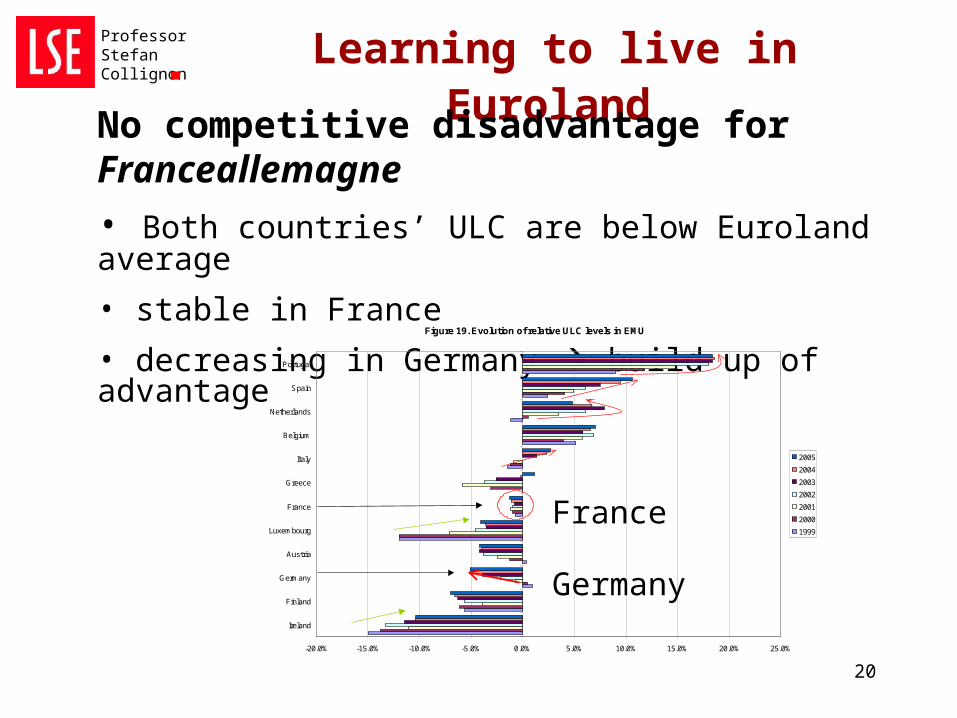
Learning to live in Euroland Professor Stefan Collignon
No competitive disadvantage for Franceallemagne
• Both countries’ ULC are below Euroland average
• stable in France
• decreasing in Germany build up of advantageFigure 19. Evolution of relative ULC levels in EMU
-20.0% -15.0% -10.0% -5.0% 0.0% 5.0% 10.0% 15.0% 20.0% 25.0%
Ireland
Finland
Germany
Austria
Luxembourg
France
Greece
Italy
Belgium
Netherlands
Spain
Portugal
2005
2004
2003
2002
2001
2000
1999France
Germany
21
Learning to live in Euroland Professor Stefan Collignon
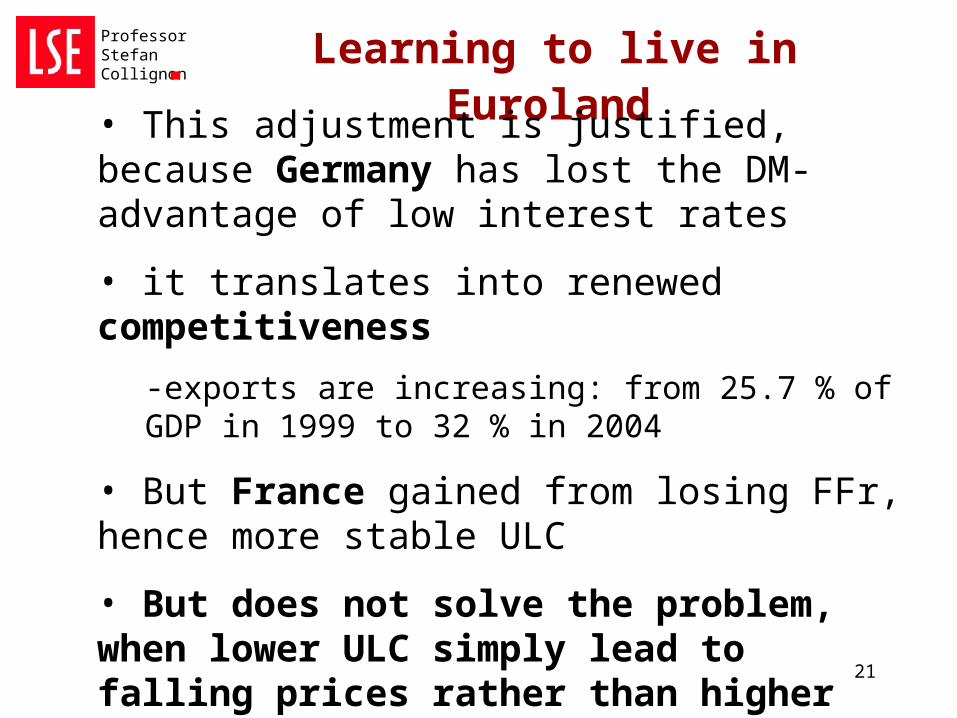
• This adjustment is justified, because Germany has lost the DM-advantage of low interest rates
• it translates into renewed competitiveness
-exports are increasing: from 25.7 % of GDP in 1999 to 32 % in 2004
• But France gained from losing FFr, hence more stable ULC
• But does not solve the problem, when lower ULC simply lead to falling prices rather than higher profits
- problem of large countries
22
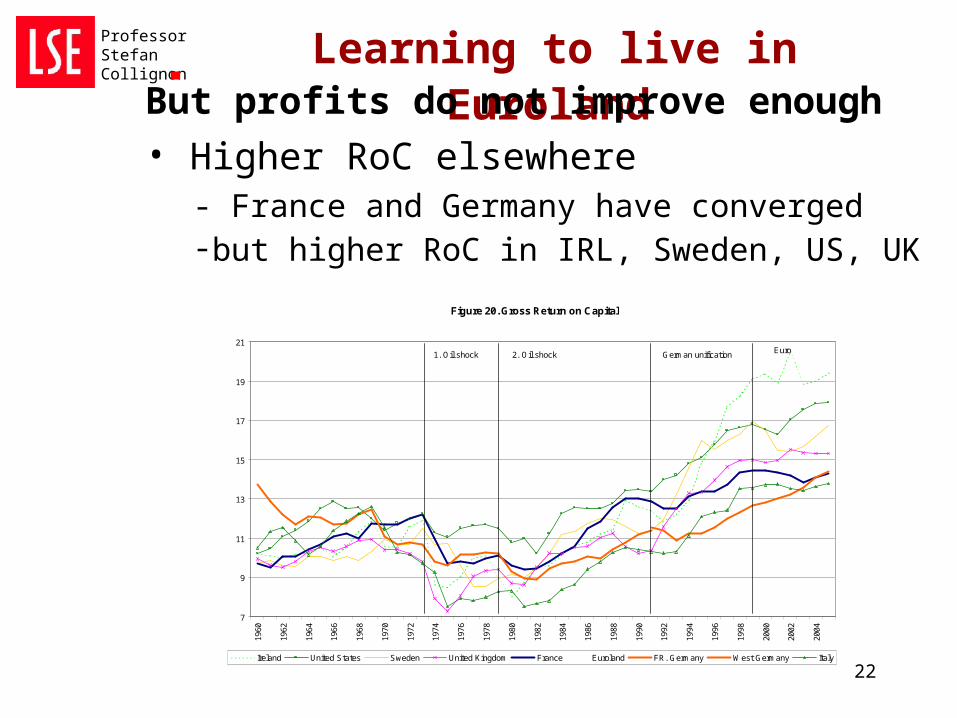
Learning to live in Euroland Professor Stefan Collignon
But profits do not improve enough
• Higher RoC elsewhere- France and Germany have converged-but higher RoC in IRL, Sweden, US, UK
Figure 20. Gross Return on Capital
7
9
11
13
15
17
19
21
1960
1962
1964
1966
1968
1970
1972
1974
1976
1978
1980
1982
1984
1986
1988
1990
1992
1994
1996
1998
2000
2002
2004
Ireland United States Sweden United Kingdom France Euroland FR. Germany West Germany Italy
EuroGerman unification2. Oil shock1. Oil shock

23
Learning to live in Euroland Professor Stefan Collignon
1. Average productivity of capital stock is higher in anglosaxon and Scandinavian countries
• job protection versus income protection?
• low investment rate slows modernisation of capital stock
2. Investment reponds to Tobin’s q
• q responds to monetary policy
• In Franceallemagne still below Euroland average
• although ULC are falling, prices are also falling relative to Euroland price level: why?

24
Learning to live in Euroland Professor Stefan Collignon
The policy mix
• Overriding priority of price stability
• ECB must respond to ULC-developments (supply side)
• ECB must respond to fiscal policy (demand side)
- Aggregate fiscal stance for Euroland
- National responsibility
- Coordination only by SGP
25
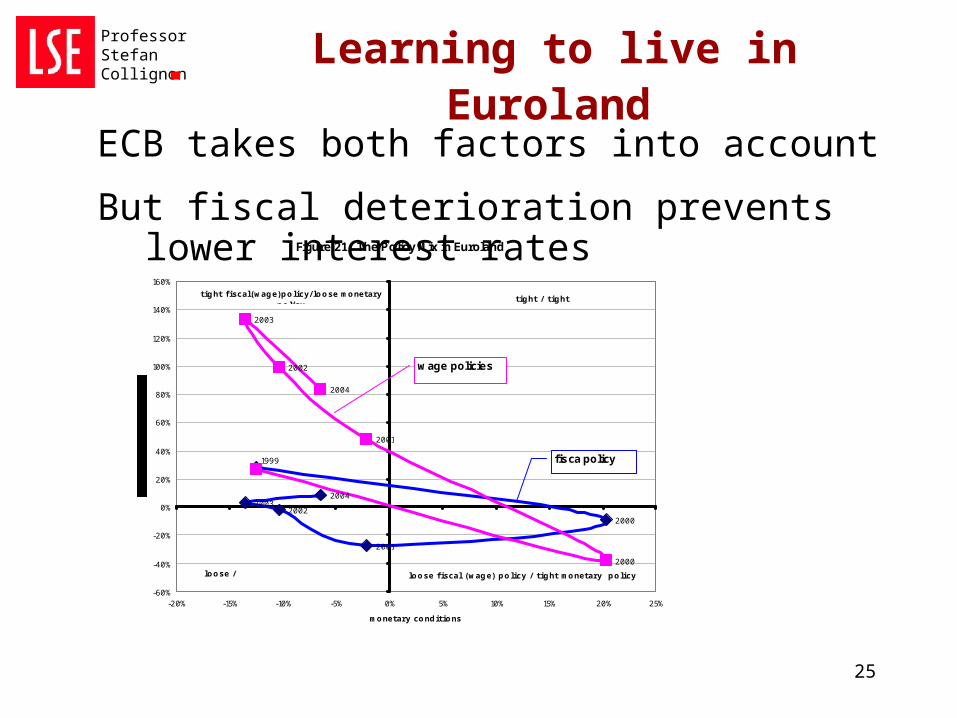
Learning to live in Euroland Professor Stefan Collignon
ECB takes both factors into account
But fiscal deterioration prevents lower interest ratesFigure 21. The Policy Mix in Euroland
1999
2000
2001
20022003
2004
2000
2001
2002
2003
2004
-60%
-40%
-20%
0%
20%
40%
60%
80%
100%
120%
140%
160%
-20% -15% -10% -5% 0% 5% 10% 15% 20% 25%
monetary conditions
loose / loose
tight fiscal(wage)policy/ loose monetary policy
tight / tight
loose fiscal (wage) policy / tight monetary policy
fisca policy
wage policies
26
Learning to live in Euroland Professor Stefan Collignon
• ECB is more concerned about fiscal than wage policy
• SGP is not implemented
• Commission has no ultimate power
• Therefore: there exists no European fiscal policy and policy mix is sub-optimal

27
Learning to live in Euroland Professor Stefan Collignon
The solution
• Define aggregate fiscal stance for Euroland at EU-level
• Allocate deficit permits to member states for implementation
• But: binding obligation is only possible with full democratic backing
- vote by European parliament
- create European political Union with full democracy

28
Learning to live in Euroland Professor Stefan Collignon
This is where France and Germany have a role to play
But ultimately it is up to European citizens to charge the institutions with the proper management of their common affairs
European democracy is the next step!
29
Learning to live in Euroland Professor Stefan Collignon
Ceterum censeo: pactum stabilitatis esse delendum
Et rem publicam europaeam esse errigendam