1 introduction to statistics chapter 1 msis 111 prof. nick dedeke
TRANSCRIPT
1
Introduction to Statistics
Chapter 1MSIS 111 Prof. Nick Dedeke
2
Objectives
Define statisticsDifferentiate between descriptive and inferential statisticsDefine statistical variablesClassifying numbers
3
What is Statistics?
A general way to view statistics is as follows: it is a language and the set of rules that enables us to make sense of data about events, people, places and things.
4
Valid Statistic?: Example 1An online survey conducted recently led some to the conclusion that Apple’s iphone product will not succeed in the U.S. market. 75% of the men and 89% of the women surveyed answered “never” when asked the question: Would you buy an ipod?
5
Valid Statistic?: Example 2When you vote consider this information. A mail survey showed that in the years when Democrats controlled the Congress, U.S. had a higher number of destructive, level 5 hurricanes. In the years that the Republicans controlled Congress, the U.S. have more days with extremely cold and extremely hot days.
6
Valid Statistic?: Example 3If you are seeking to have a job quickly after you graduate, do not wear a clothing with a white color during your interview. A recent phone survey of fifty human resources managers at the top 10 retail firms in America revealed that only 2% of them wear white clothing to work.
7
FactsThere is such a thing as bad statistics Poor methods, sample, and/or
interpretation
You can always make bad statistics say anything you want it to sayThe cure for bad statistics is good statistics
8
Do we really need statistics?
Imagine a government never gathers data about population growth. Imagine a hospital that never stores data about patient data and care Imagine a car firm that never analyzes data about vehicle rolloversImagine an insurance firm that never interprets the causes for the increases in health care costs
9
Definition of statistics?Statistics is a science dealing with the collection, organization, analysis, interpretation and presentation of quantitative and qualitative data.
Statistics is a means to an end. The objective is not statistics for its own sake, it is the effective use of statistics for decision-making that matters for firms.
10
Challenge of statistics?Statistics has two primary challenges: Describing a group of entities using a segment
of the group. For example, we have over 300 million U.S. citizens. I have the question to answer. How tall are Americans? This kind is called descriptive statistics. FOCUS – Present or Past
Generating conclusions about future trends of a large group of data using smaller set from the same or related group. For example, I have the question: At which rate are we depleting fishes in our rivers? This kind is called inferential statistics. FOCUS – Present or Future
11
Terminologies in statistics?
Census: Gathering of data from every member of a group or population, e.g. all voters in a presidential election, all subscribers to cable TV
Sample: A randomly sampled set of members of a population (fraction of the size of a census)
Variable: Attribute of interest of each member of group
Observation or measurement: The value of a variable for a member of a group (population or sample)
12
Exercise 1:
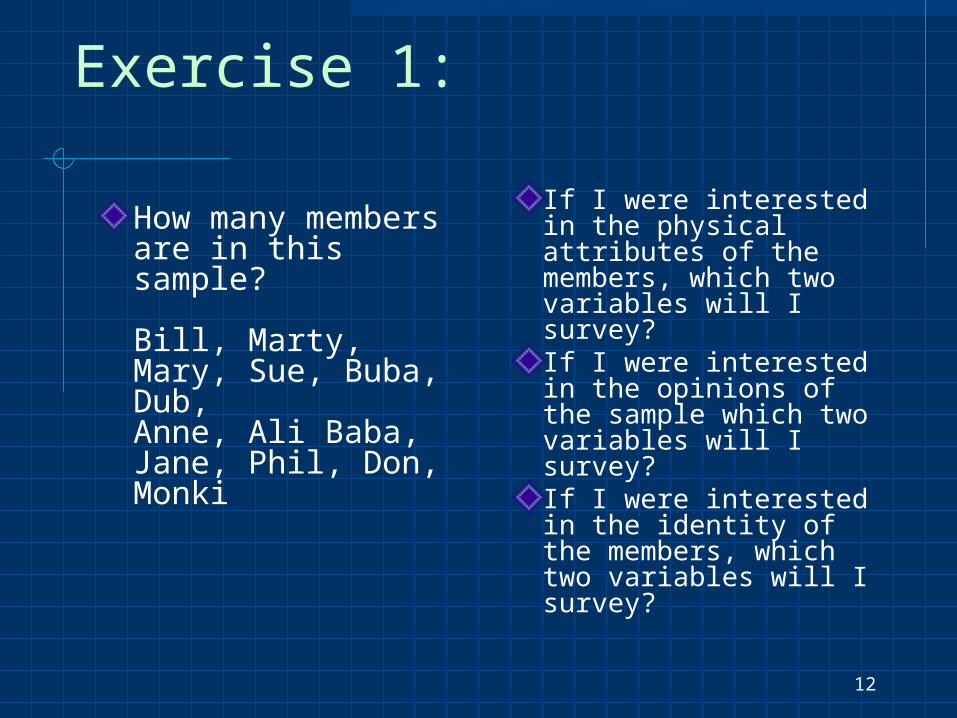
How many members are in this sample?
Bill, Marty, Mary, Sue, Buba, Dub, Anne, Ali Baba, Jane, Phil, Don, Monki
If I were interested in the physical attributes of the members, which two variables will I survey?If I were interested in the opinions of the sample which two variables will I survey?If I were interested in the identity of the members, which two variables will I survey?
13
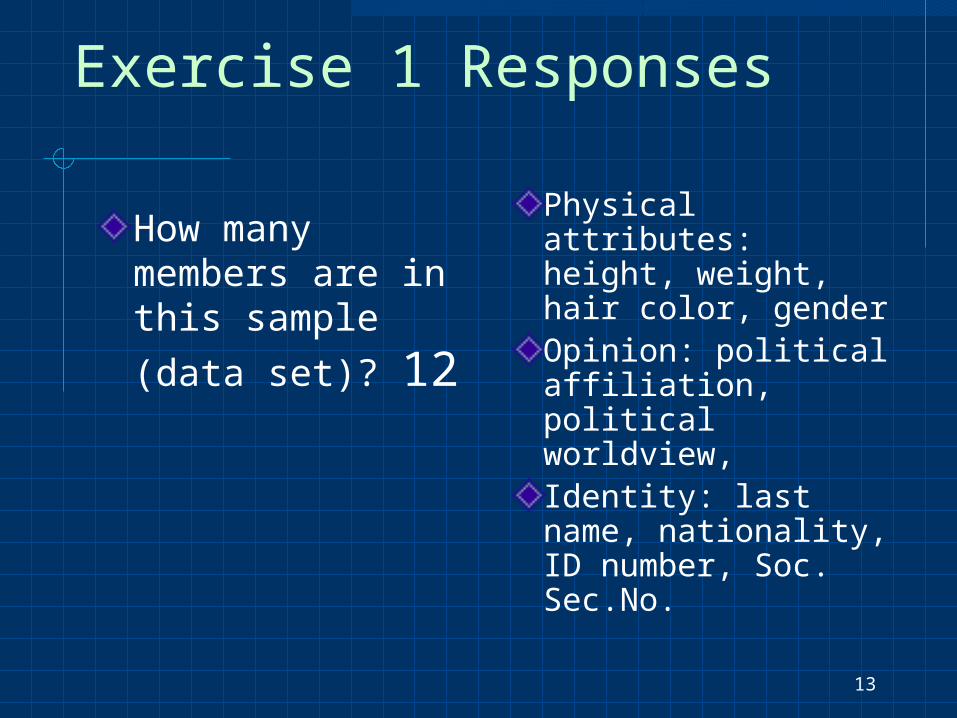
Exercise 1 Responses
How many members are in this sample (data
set)? 12
Physical attributes: height, weight, hair color, genderOpinion: political affiliation, political worldview,Identity: last name, nationality, ID number, Soc. Sec.No.
14
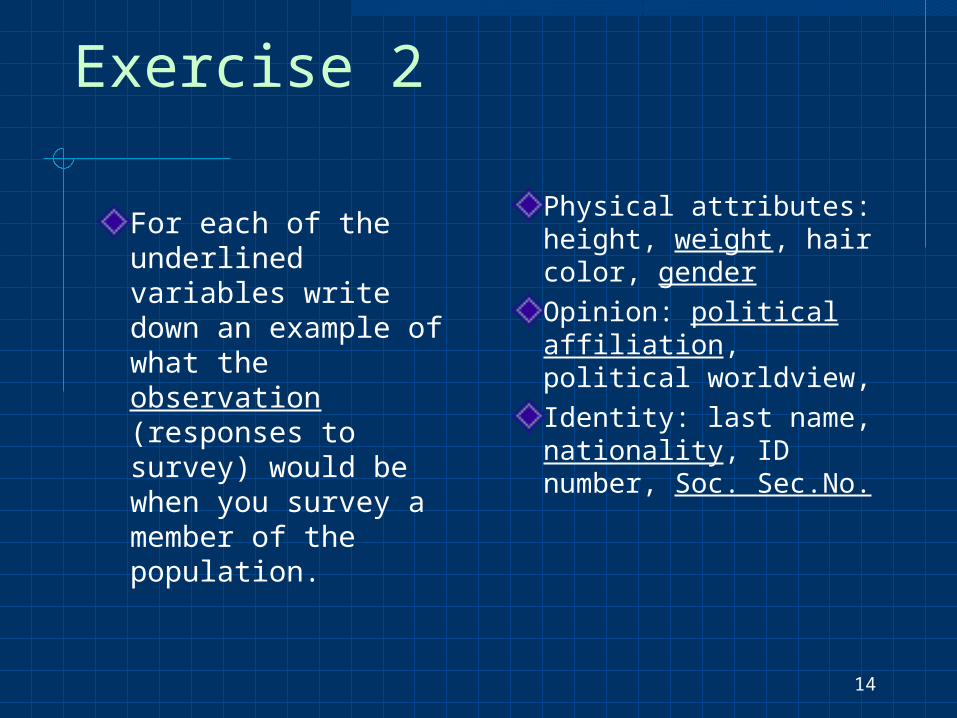
Exercise 2
For each of the underlined variables write down an example of what the observation (responses to survey) would be when you survey a member of the population.
Physical attributes: height, weight, hair color, genderOpinion: political affiliation, political worldview,Identity: last name, nationality, ID number, Soc. Sec.No.
15
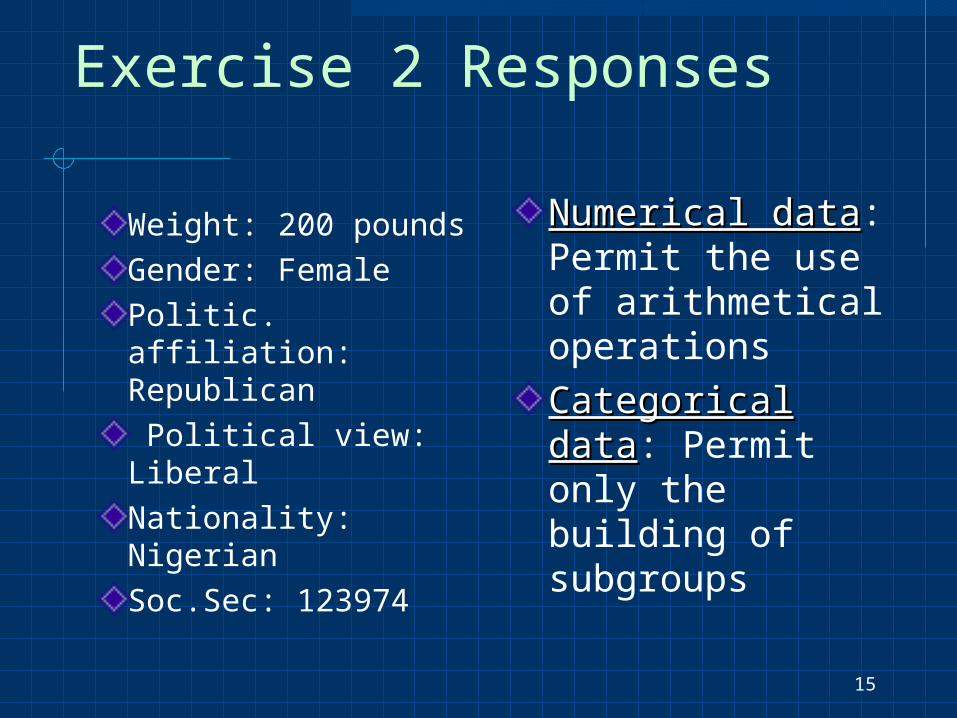
Exercise 2 Responses
Weight: 200 poundsGender: FemalePolitic. affiliation: Republican Political view: LiberalNationality: NigerianSoc.Sec: 123974
Numerical dataNumerical data: Permit the use of arithmetical operations
Categorical dataCategorical data: Permit only the building of subgroups
16
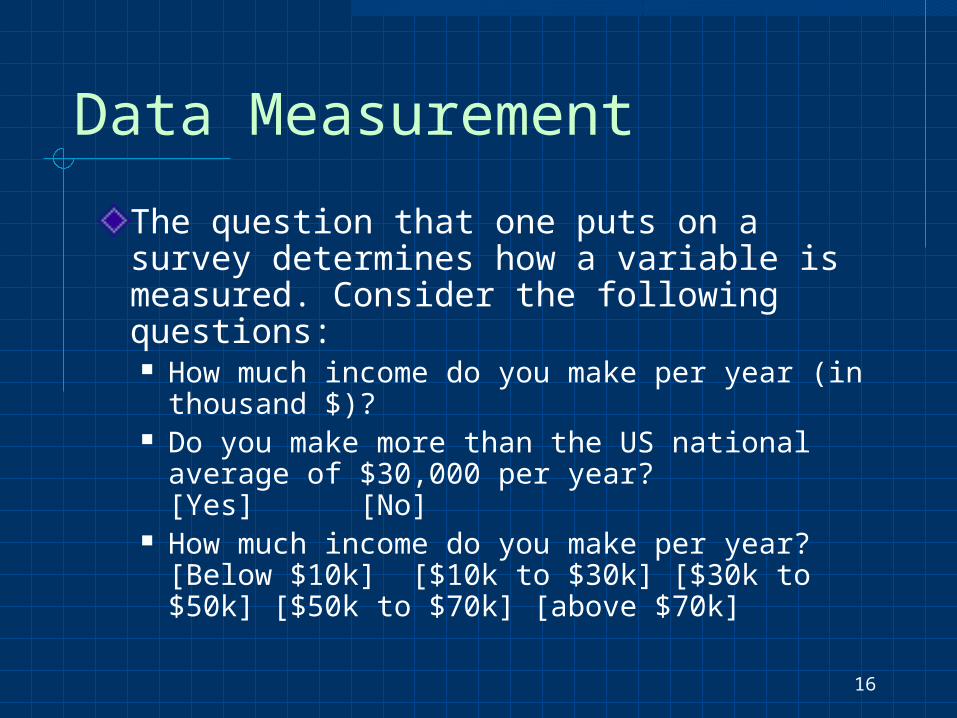
Data Measurement
The question that one puts on a survey determines how a variable is measured. Consider the following questions: How much income do you make per year (in
thousand $)? Do you make more than the US national
average of $30,000 per year?[Yes] [No]
How much income do you make per year?[Below $10k] [$10k to $30k] [$30k to $50k] [$50k to $70k] [above $70k]
17
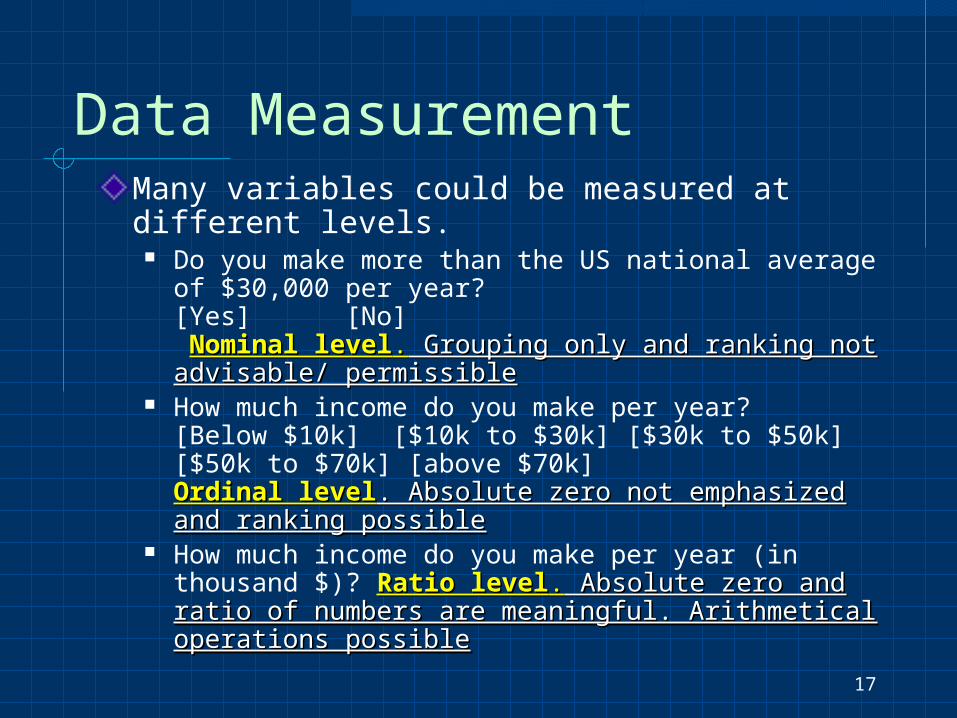
Data MeasurementMany variables could be measured at different levels.
Do you make more than the US national average of $30,000 per year?[Yes] [No] Nominal levelNominal level.. Grouping only and ranking not Grouping only and ranking not advisable/ permissibleadvisable/ permissible
How much income do you make per year?[Below $10k] [$10k to $30k] [$30k to $50k] [$50k to $70k] [above $70k] Ordinal levelOrdinal level. Absolute zero not emphasized and . Absolute zero not emphasized and ranking possibleranking possible
How much income do you make per year (in thousand $)? Ratio levelRatio level.. Absolute zero and ratio of Absolute zero and ratio of numbers are meaningful. Arithmetical operations numbers are meaningful. Arithmetical operations possiblepossible
18
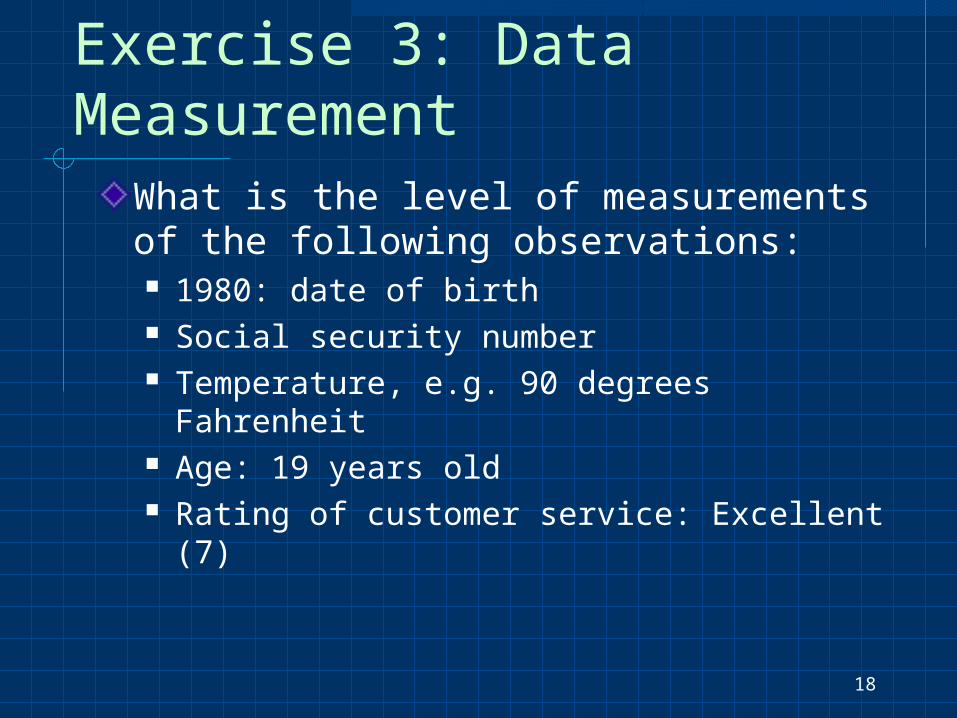
Exercise 3: Data Measurement
What is the level of measurements of the following observations: 1980: date of birth Social security number Temperature, e.g. 90 degrees Fahrenheit Age: 19 years old Rating of customer service: Excellent (7)
19
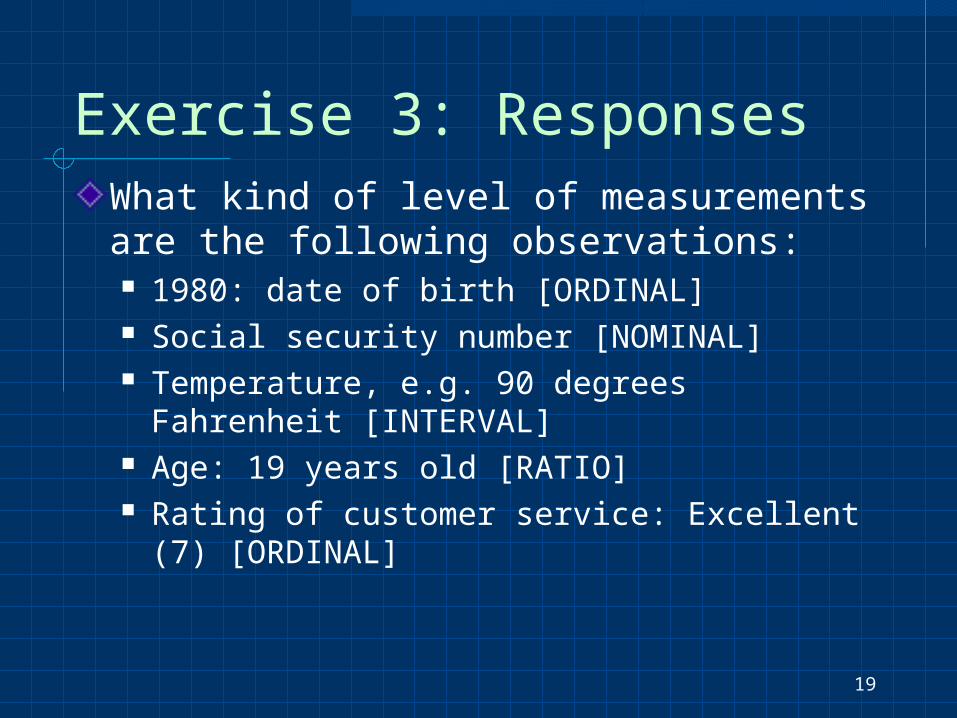
Exercise 3: ResponsesWhat kind of level of measurements are the following observations: 1980: date of birth [ORDINAL] Social security number [NOMINAL] Temperature, e.g. 90 degrees Fahrenheit
[INTERVAL] Age: 19 years old [RATIO] Rating of customer service: Excellent (7)
[ORDINAL]
20
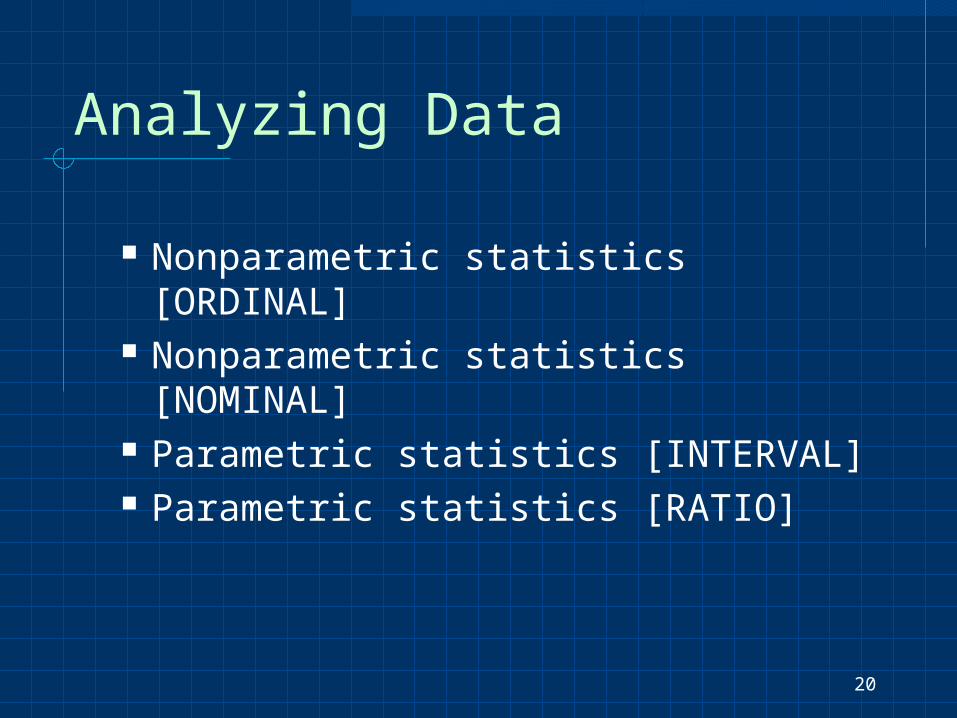
Analyzing Data
Nonparametric statistics [ORDINAL] Nonparametric statistics [NOMINAL] Parametric statistics [INTERVAL] Parametric statistics [RATIO]
21
Data Measurement: Examples
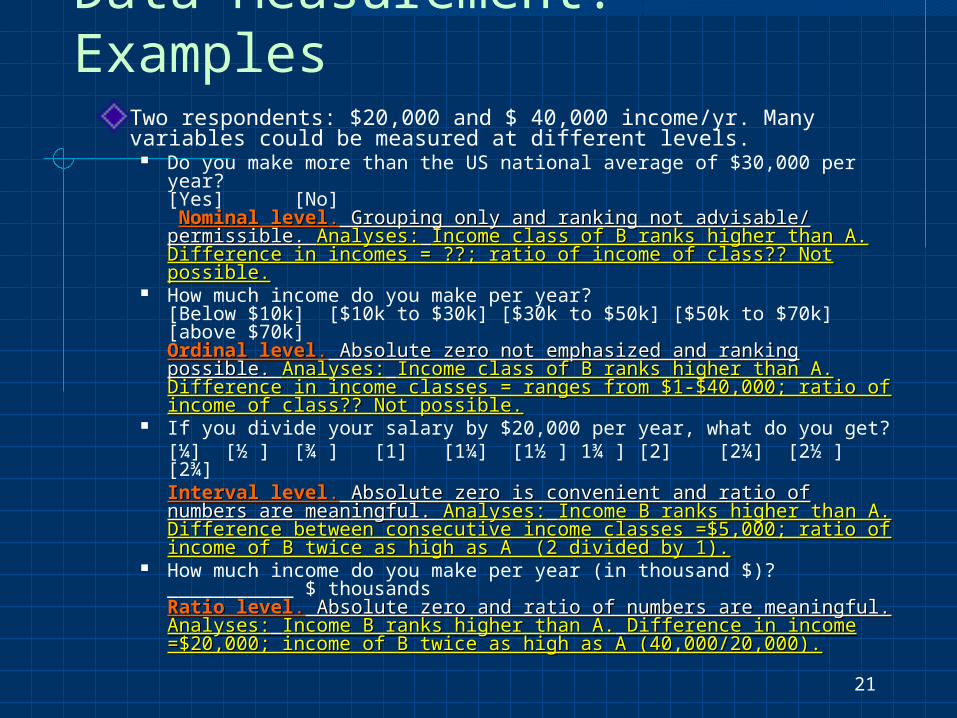
Two respondents: $20,000 and $ 40,000 income/yr. Many variables could be measured at different levels.
Do you make more than the US national average of $30,000 per year?[Yes] [No] Nominal levelNominal level.. Grouping only and ranking not advisable/ Grouping only and ranking not advisable/ permissible. permissible. Analyses:Analyses: Income class of B ranks higher than A.Income class of B ranks higher than A. Difference in incomes = ??; ratio of income of class?? Not possible.Difference in incomes = ??; ratio of income of class?? Not possible.
How much income do you make per year?[Below $10k] [$10k to $30k] [$30k to $50k] [$50k to $70k] [above $70k] Ordinal levelOrdinal level.. Absolute zero not emphasized and ranking Absolute zero not emphasized and ranking possible. possible. Analyses:Analyses: Income class of B ranks higher than A.Income class of B ranks higher than A. Difference in income classes = ranges from $1-$40,000; ratio of Difference in income classes = ranges from $1-$40,000; ratio of income of class?? Not possible.income of class?? Not possible.
If you divide your salary by $20,000 per year, what do you get?[¼] [½ ] [¾ ] [1] [1¼] [1½ ] 1¾ ] [2] [2¼] [2½ ] [2¾] Interval levelInterval level.. Absolute zero is convenient and ratio of numbers Absolute zero is convenient and ratio of numbers are meaningful. are meaningful. Analyses:Analyses: Income B ranks higher than A.Income B ranks higher than A. Difference between consecutive income classes =$5,000; ratio of Difference between consecutive income classes =$5,000; ratio of income of B twice as high as A (2 divided by 1).income of B twice as high as A (2 divided by 1).
How much income do you make per year (in thousand $)?___________ $ thousandsRatio levelRatio level.. Absolute zero and ratio of numbers are meaningful. Absolute zero and ratio of numbers are meaningful. Analyses:Analyses: Income B ranks higher than A.Income B ranks higher than A. Difference in income Difference in income =$20,000; income of B twice as high as A (40,000/20,000).=$20,000; income of B twice as high as A (40,000/20,000).