1. introductionshodhganga.inflibnet.ac.in/bitstream/10603/41686/1/chapter 1.pdf · and defined by...
TRANSCRIPT

Chapter 1 Introduction
School of Pharmaceutical Sciences, Shobhit University 1
1. Introduction
Analytical chemistry plays an important role in nearly all aspects of pharmaceutical sciences. It
seeks ever improved means of measuring the chemical composition of natural and artificial
materials. The techniques of this science are used to identify the substances which may be
present in a material and to determine the exact amounts of the identified substances1.
1.1. Introduction to Analytical Methods
The ability to provide timely, accurate, and reliable data is central to the discovery, development,
and manufacture of pharmaceuticals. Analytical data is used to screen potential drug candidates,
aid the development of drug synthesis, support formulation studies, monitor the stability of bulk
pharmaceuticals and formulated products, and test final products for release. The quality of
analytical data is a key factor in the success of a drug development program.
Problems increase as additional persons, laboratories and equipments are used to perform the
method. When the method is used in the developer’s laboratory, a small optimization can usually
be made to develop the method work. The flexibility to change it is lost once the method is
transferred to other laboratories or used for official product testing. Where methods are
submitted to regulatory agencies, changes may require formal approval before they can be
implemented for official testing. The best way to minimize method problems is to perform
adequate validation experiments during development2.
The need of sophisticated analytical instruments and determinations using them is almost a
routine process for the modern analytical laboratories. Analytical methods are generally
classified as physical and chemical. Physical analysis includes measurement of particle size,
dimension, thickness of a solid dosage forms etc. Basically chemical analysis can be divided into
three broad categories3;
Qualitative analysis: analysis, which identifies the component(s) in a sample.
Quantitative analysis: analysis, which finds out total amount of the particular species
present in a sample.
Structural analysis: analysis which helps in finding the spatial arrangement of atoms in
a molecule and the presence or position of certain organic functional group in a given
compound.

Chapter 1 Introduction
School of Pharmaceutical Sciences, Shobhit University 2
Chemical analysis has some basic steps like choice of method, sampling, preliminary sample
treatment, separations, final measurement and assessment of results. It is with the first step, viz.
choice of method, that care should be exercised to select the proper instrument to carry out
fruitful analysis. A wrong selection at this point will lead to a meaningless analysis. Analytical
methods are broadly classified as physical, chemical and instrumental analysis.
Physical observation includes description of the compound, measurements of its
dimension (shape, size), color, odor etc.
Chemical analysis includes titrimetric analysis of the compound such as potentiometry,
iodometry, argentometry etc.
Instrumental methods of chemical analysis have become the backbone of the
experimental chemistry. The choice of an instrumental method for the determination of a
specific element or compound involves:
1. the instrument to be used, and
2. the chemical system.
The growth of instrumental analysis is related to the developments in the field of electronics
because the generation, transduction, amplification and display of a signal can be done in a
convenient manner4.
Various instrumental methods along with their major applications in pharmaceutical field are
presented in Table 1.1.
Table 1.1: Various instrumental methods of analysis4
S.N. Instrumental Method Property Measured Applications
1.
UV- Visible
Spectrophotometry
Absorption of radiation Identification of the
functional groups
Quantitation of unsaturated
compounds
2. FTIR Spectroscopy Absorption of radiation Quantitative analysis of
organic compound at high
concentration level
3.
Atomic Absorption
Spectroscopy
Absorption of radiation Quantitation of metals or
metalloids
4. Flame Photometry Emission of radiation Quantitation of alkali
metals or alkaline earth
metals
Chapter 1 Introduction
School of Pharmaceutical Sciences, Shobhit University 3
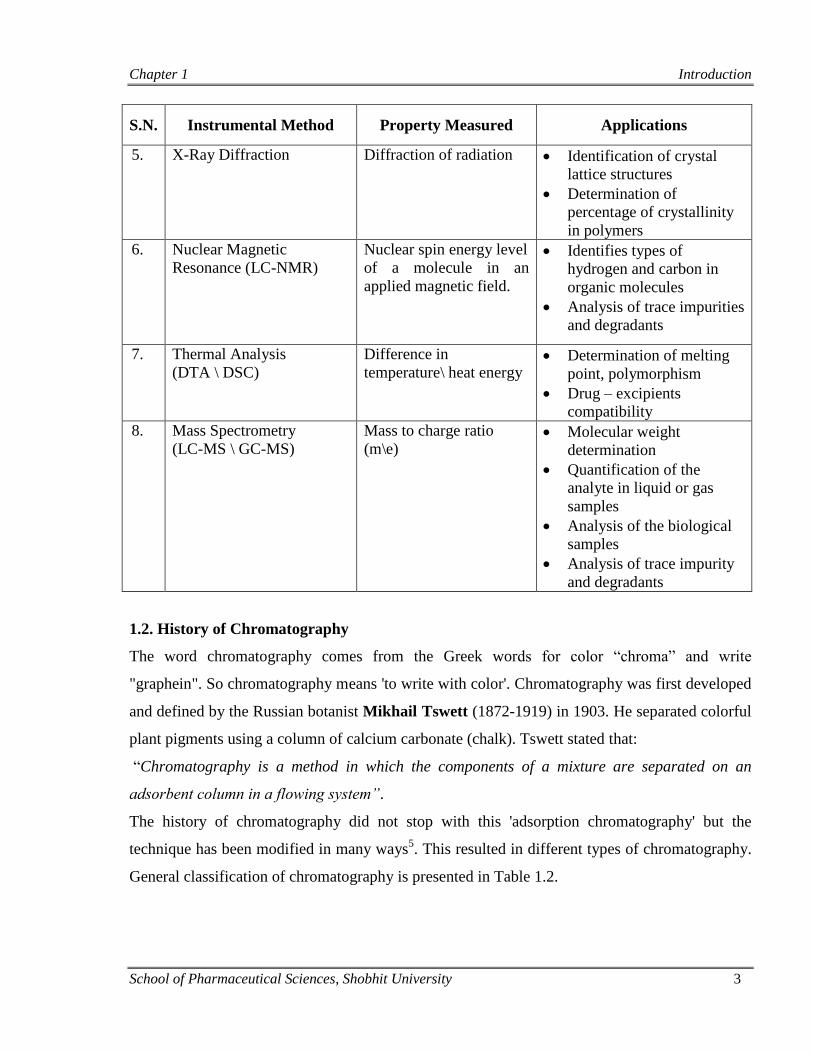
S.N. Instrumental Method Property Measured Applications
5.
X-Ray Diffraction Diffraction of radiation Identification of crystal
lattice structures
Determination of
percentage of crystallinity
in polymers
6. Nuclear Magnetic
Resonance (LC-NMR)
Nuclear spin energy level
of a molecule in an
applied magnetic field.
Identifies types of
hydrogen and carbon in
organic molecules
Analysis of trace impurities
and degradants
7.
Thermal Analysis
(DTA \ DSC)
Difference in
temperature\ heat energy Determination of melting
point, polymorphism
Drug – excipients
compatibility
8. Mass Spectrometry
(LC-MS \ GC-MS)
Mass to charge ratio
(m\e) Molecular weight
determination
Quantification of the
analyte in liquid or gas
samples
Analysis of the biological
samples
Analysis of trace impurity
and degradants
1.2. History of Chromatography
The word chromatography comes from the Greek words for color “chroma” and write
"graphein". So chromatography means 'to write with color'. Chromatography was first developed
and defined by the Russian botanist Mikhail Tswett (1872-1919) in 1903. He separated colorful
plant pigments using a column of calcium carbonate (chalk). Tswett stated that:
“Chromatography is a method in which the components of a mixture are separated on an
adsorbent column in a flowing system”.
The history of chromatography did not stop with this 'adsorption chromatography' but the
technique has been modified in many ways5. This resulted in different types of chromatography.
General classification of chromatography is presented in Table 1.2.

Chapter 1 Introduction
School of Pharmaceutical Sciences, Shobhit University 4
Table 1.2: General classification of chromatography5
General Classification Specific Method Stationary Phase Type of Equilibrium
Liquid chromatography
Liquid-liquid or partition
Liquid adsorbed on a
solid
Partition between
immiscible liquids
Liquid-solid or adsorption
Solid
Adsorption
Ion exchange
Ion exchange resin
Ion exchange
Size exclusion Liquid in interstices
of a polymeric solid
Partition/sieving
Gas chromatography
Gas –liquid
Liquid adsorbed in
solid
Partition between gas
and liquid
Gas –solid
Solid Adsorption
Supercritical –fluid
chromatography
Supercritical fluid – bonded
surface
Organic species
bonded to a solid
surface
Partition between
supercritical –fluid
and bonded surface
Chromatography is a physical method of separation in which the components to be separated are
distributed between two phases, one of which is stationary (stationary phase) while the other
(mobile phase) moves in a definite direction.
Chromatography involves a sample or sample extract dissolved in a mobile phase which may be
a gas, liquid or supercritical fluid. The mobile phase is then mode to flow through an immobile,
immiscible stationary phase, which is fixed in place in column or on solid surface. The two
phases are selected so that the components of the sample distribute themselves between the
mobile and stationary phases to varying degrees. Those components strongly retained by the
stationary phase move slowly with the flow of mobile phase. In contrast, components that are
weakly held by the stationary phase travel rapidly. As a consequence of these differences in
migration rates, sample components separate into discrete bands or zones that can be analyzed
qualitatively and quantitatively.
These techniques are useful in qualitative and quantitative analysis. Paper and thin layer
chromatography are useful for identification purposes, because of their convenience and
simplicity. Column chromatography offers wide choice of stationary phases and is useful for the
separation of various compounds. Both gas chromatography and high performance liquid

Chapter 1 Introduction
School of Pharmaceutical Sciences, Shobhit University 5
chromatography require more elaborate apparatus and usually provides high resolution that will
identify and quantitate very small amounts of materials (in micro range) 6
.
1.3. High Performance Liquid Chromatography
HPLC originated from the fact that high pressure was needed to generate the flow required for
liquid chromatography in packed columns. This is considered the most powerful approach; the
sample passes through a column or a device containing appropriate particles. These particles are
called the chromatographic packing material, stationary phase or “adsorbent”. Solvent flows
continuously through the column. At a point in time, an “injection” of the sample solution is
made into the solvent stream, which then carries the sample through the column. For improved
separation power, smaller particle sizes (<10 microns) are required. These cause greater
resistance to flow, resulting in higher pressures needed to maintain the required solvent flow.
The early 1970’s saw a tremendous leap in technology. The new “HPLC” instrument was
developed with up to 6,000psi (400 bar) of pressure, which included improved detectors and
columns. HPLC really began to take hold in the mid to late 1970s. With continued advances in
performance, the name was changed to High Performance Liquid Chromatography (HPLC)6.
High Performance Liquid Chromatography (HPLC) is now one of the most powerful tools in
analytical chemistry, with the ability to separate, identify and quantitate the compounds that are
present in any sample that can be dissolved in a liquid. HPLC can be applied to just about any
sample such as pharmaceuticals, food, cosmetics, environmental matrices, forensic samples, and
industrial chemicals7.
The techniques of HPLC can be divided into four categories depending on the nature of the
process that occur at the stationary phase as given below;
1.3.1. High Performance Adsorption Chromatography
Here the analyte is adsorbed onto the surface of polar packing. The nature of the adsorption
involves the interaction of polar molecules with a very polar solid stationary phase.
1.3.2. High Performance Partition Chromatography
It is the most widely used liquid chromatographic procedure to separate most kinds of organic
molecules. Here the components present in the analyte mixture distribute themselves between the
mobile phase and stationary phase as the mobile phase moves through the column. The
stationary phase actually consists of a thin liquid film either adsorbed or chemically bonded to
the surface of finely divided solid particles.

Chapter 1 Introduction
School of Pharmaceutical Sciences, Shobhit University 6
1.3.3. High Performance Ion-Exchange Chromatography
This method is used to separate mixture of ions and especially for protein separation. The
stationary phase consists of polymeric resin beds on which the ions get attracted or bonded
reversibly while passing through the column.
1.3.4. High Performance Size-Exclusion Chromatography
This technique is used for separating dissolved species on the basis of their size and is
particularly applicable to high molecular weight species like polymers and oligomers to
determine their relative size and molecular weight distribution8.
Different modes of separation in HPLC are presented in Table 1.3.
Table 1.3: Modes of separation in HPLC8
Mode Stationary Phase Mobile Phase Interaction Feature
Normal phase
chromatography
Silica gel Organic solvent
(n-Hexane/IPE)
Adsorption Separation of
lipid compounds
Reversed phase
chromatography
Silica-ODS Methanol/water Hydrophobic Separation of
polar compounds
Size exclusion
chromatography
i) Non- aqueous (GPC)
ii) Aqueous (GFC)
Porous polymer
Aqueous- porous
polymer
Organic solvent
Buffer solution
Gel
permeation
Gel filtration
Mol. Wt.
distribution
Protein
separation
Ion exchange
chromatography
Ion exchange gel
Buffer solution Ion exchange Separation of
ionic compounds
Affinity
chromatography
Packing with
ligands
Buffer solution Affinity Purification of
enzymes and
proteins
1.4. Instrumentation of High Performance Liquid Chromatography9-13
The liquid chromatography system consists of six basic units. The mobile phase supply system,
pump, programmer, sample valve, column, detector and finally a means of presenting and
processing the results. Schematic diagram of HPLC system is shown in Figure 1.1.

Chapter 1 Introduction
School of Pharmaceutical Sciences, Shobhit University 7
Figure 1.1: Schematic diagram of an HPLC system9
1.4.1. Mobile Phase Reservoir
The mobile phase supply system consists of number of reservoirs (200 ml to 1,000 ml in
capacity). At least two reservoirs would be necessary and are usually constructed of glass or
stainless steel and contain an exit port open to air. Stainless steel, however, is not considered
satisfactory for mobile phases buffered to a low pH and containing certain materials that can
cause corrosion. Each reservoir is usually fitted with a gas diffuser through which unwanted
gases can be bubbled.
1.4.2. Pumping System
There are a number of different types of pumps that can provide constant and optimum pressure
and flow rate required by the modern liquid chromatography. They are; reciprocating piston
pump, syringe type pump, and constant pressure pump.

Chapter 1 Introduction
School of Pharmaceutical Sciences, Shobhit University 8
Reciprocating Piston Pump
The basic principle of piston pump is to expel liquid through a one-way valve (check valve). The
pumping rate is usually adjusted by controlling the distance that piston retracts, thus limiting the
amount of liquid pushed out by each stroke.
Dual Piston Pump
A more efficient way to provide a constant and almost pulse free flow is the use of dual-headed
reciprocating pumps. Both pump chambers are driven by the same motor through a common
device; this common device allows one piston to pump while the other is refilling.
Syringe Type Pump
These are most suitable for small-bore columns because these pumps deliver only a finite volume
of mobile phase before it has to be refilled. These pumps have a volume between 250 to 500 ml.
The pump operates by a motorized lead screw that delivers mobile phase to the column at a
constant rate. The rate of solvent delivery is controlled by changing the voltage on the motor.
Constant Pressure Pump
In this type of pump system the mobile phase is driven through the column with the use of
pressure from a gas cylinder. A low-pressure gas source is needed to generate high liquid
pressures. The valve arrangement allows the rapid refill of the solvent chamber whose capacity is
about 70 ml. Constant pressure pump is responsible to deliver continuous flow rate of mobile
phase.
1.4.3. Sample Injection System
HPLC injector system divided into four types as discussed below:
Type 1 injectors utilize a completely filled sample loop to determine the injected volume. These
simple and reliable devices are six-port rotary valves. A syringe is used to push or suck an excess
of sample into a sample loop, filling it completely.
Type 2 injectors utilize a micro syringe to transfer sample into the loop. The sample size is
always smaller than the loop volume, so it is the syringe which determines the injected volume.
No sample is trapped or wasted, but the precision is not as high as type 1 injector.
Type 3 injectors utilize both complete and partial filling methods, but trap some sample. The
loop is loaded by inserting the syringe into the needle port and dispensing the contents. The
syringe is left inserted in the port until after the valve is switched. The switching action inserts
the loop into the stream without exposing the syringe to high pressure. In the injection position the

Chapter 1 Introduction
School of Pharmaceutical Sciences, Shobhit University 9
syringe is removed and some sample remains trapped in a connecting passage of the injector.
Type 4 injectors also utilize both methods, but do not trap sample. This type is similar to type 3
injector but it does not contain a connecting passage between syringe needle tip and sample loop.
It therefore not traps sample and there is no sample waste, no syringe reading error and no need
to flush between injections, except in trace analysis9.
1.4.4. Stationary Phase (Column)
In liquid chromatography stationary phase provides retention and influences the separation
mechanism of the analytes present in the sample. Characteristics of stationary phase such as
surface chemistry of column packing material, carbon chain length, end capping, base
deactivation, particle size, pore size and specific surface area play vital role in development of
efficient analytical method to control overall separation. Official monographs in pharmacopoeia
for drugs give restricted information about selection of stationary phase which draws confusion
amongst analysts to use efficient column to quantify the strength of drug.
Column is referred as heart of HPLC separation process. Stable high performance column is
essential requisite for rugged and reproducible method. For high efficiency of separation large
number of theoretical plates per unit length of the column is required. Prior to selection of
column it is necessary to understand the properties of column packing material. Silica is used
extensively for such purpose but having a draw back as it tends to dissolve above pH 8 and
cross-linking of polymeric particles takes place above this pH, for example, polystyrene or poly
methacrylates is used for separation of bases, which can withstand strongly basic mobile phase
but are somewhat less efficient. Silica particles have surface silanol groups, -SiOH which are
used for chemical bonding of stationary phases by silanization reactions with chlorosilanes.
About half the silanol groups are chemically bonded and the rest are end capped with trimethyl
silyl groups to render them inert. The most common non-polar bonded phases (for reversed
phase chromatography) are C18 and C8.
C18 columns are the most popular (known as ODS -octadecylsilane) and highly non polar in
nature. C8 (known as octylsilane) is intermediate in hydrophobicity. Increase in polarity of
column for RP-HPLC leads to decrease in retention of non polar sample. C18 (Octaldecylsilane –
ODS) bonded ligand is particularly useful for separation of non-polar analyte. C8 bonded ligand
provides similar selectivity and shorter run times. C4 and C3 bonded ligand are also available but
these are not as stable as longer chain C18 and C8 counterparts, but provide good separations for a

Chapter 1 Introduction
School of Pharmaceutical Sciences, Shobhit University 10
variety of protein and polypeptide analytes. CN (Cyano) bonded ligand interacts with polar
functional groups, and is used in both reversed-phase and normal phase chromatography. NH2
(amino) bonded ligand interacts with polar functional groups, commonly used for the separation
of sugars and polysaccharides. Phenyl bonded ligand exhibits a more polar nature than either the
C18 or C8, the π-electron clouds providing sites of interaction for a variety of aromatic (ring)
analytes. Several other factors that contribute to appropriate column selection are as follows:
Longer columns are used for increased resolution and shorter columns have application in
shorter analysis time, and fast chromatography. Wider diameter columns are used for greater
sample loading. Narrow columns are used for more sensitive and reduced mobile phase
consumption. Columns with spherical particles are used for lower backpressure, greater stability.
Columns with irregular particles are used for high surface area and high sample capacity; smaller
particle (3-4 µm) size of packing material are used for higher separation efficiencies and larger
particle (5-10 µm) size generate less system pressure. Columns of pore size of 150Ǻ or less are
used for sample with molecular weight less than 2000 and pore size of 300Ǻ or less are used for
sample with molecular weight greater than 2000. Columns with end-capped packing are used to
eliminate unpredictable secondary interaction with the base materials, while non-end capped
stationary phases are used for selectivity differences of polar compounds by controlling
secondary interaction. High carbon loads in column are used for greater sample capacities and
higher resolution on other end less carbon load in column provides faster analysis.
There are various columns that are secondary to the separating column or stationary phase
namely: guard column, derivatising column and capillary column.
Guard Column
It is placed anterior to the separating column. This serves as a protective factor that prolongs the
life and usefulness of the separation column. It is dependable columns designed to filter or
remove particles that clog the separation column, compounds and ions that could ultimately
cause “baseline drift”, decreased resolution, decreased sensibility and false peaks, compounds
that may cause precipitation upon contact with the stationary or mobile phase and compounds
that might co-elute and cause extraneous peaks.
Derivatising Column
Pre and/or post-primary column derrivatization can be an important aspect of the sample
analysis. Reducing or altering the parent compound to a chemically related daughter molecule or

Chapter 1 Introduction
School of Pharmaceutical Sciences, Shobhit University 11
fragment elicits potentially tangible data, which may complement other results or prior analysis.
Acetylation, silylation, or concentrated acid hydrolysis are few derivatization techniques
employed for sample analysis10
.
Capillary Column
Advances in HPLC led to smaller analytical columns. Such columns are also known as micro
columns. Capillary columns have a diameter less than a millimeter and are of three types; open
tubular, partially packed, tightly packed. The columns have advantages as they allow the user to
work with nano liter sample volumes, decreased flow rate and decreased solvent volume usage
which may ultimately results in less cost per analysis11
.
1.4.5. Detector
The detector for HPLC is the component that emits a response due to the eluting sample
compound and subsequently signals a peak on the chromatogram. It is positioned immediately
posterior to the stationary phase in order to detect the compounds as they elute from the column.
There are many types of detectors that can be used with HPLC. Most common detectors include:
Refractive Index (RI), Ultra- Violet (UV), Fluorescent, Radiochemical, Electrochemical, Near
Infra-Red (Near IR), Mass Spectroscopy (MS), Nuclear Magnetic Resonance (NMR) and Light
Scattering detectors12
.
Refractive Index Detector
Refractive index detectors measure the ability of sample molecules to bend or refract light. This
property for each molecule or compound is called its refractive index. For the most RI detectors,
light proceeds through bi-modular flow-cell to photo detector. One channel of the flow-cell
directs the mobile phase passing through the column while the other directs only the mobile
phase. Detection occurs when the light is bent due to samples eluting from the column, and this
is read as a disparity between the two channels.
Ultra-Violet Detector
Ultra-violet detectors measure the ability of a sample to absorb light. Fixed wavelength detector
works at one wavelength only. Most common wavelength employed for analysis is usually 254
nm. Variable wavelength detector works at one wavelength at a time, but can detect over wide
range of wavelength.
Diode Array Detector
Diode array detector measures a spectrum in varying wavelength simultaneously.

Chapter 1 Introduction
School of Pharmaceutical Sciences, Shobhit University 12
Fluorescence Detector
Fluorescence detectors measure the ability of a compound to absorb and then re-emit light at
given wavelengths. Each compound has characteristics fluorescence. The excitation source
passes through the flow cell to a photo detector while a monochromator measures the emission
wavelengths. It has sensitivity limit of 10-9
to 10-11
gm/ml.
Radiochemical Detector
Radiochemical detection involves the use of radio labeled material, usually tritinium (3H) or
carbon (14
C). It operates by detection of fluorescence associated with β particle ionization, and is
most popular in metabolite research. Radiochemical detectors are of two types:
Homogeneous Detector: Homogeneous detector is used when addition of scintillation fluid to
column effluent causes fluorescence.
Heterogeneous Detector: Heterogeneous detector is used when lithium silicate and fluorescence
caused by beta-particle emission interacts with the detector. It has sensitivity
between 10-9
to 10-10
gm/ml.
Electrochemical Detector
Electrochemical detector measures compounds that undergo oxidation or reduction reactions.
Usually detection of components is accomplished by measuring gain or loss of electrons from
migrating samples as they pass between electrodes at given difference in electrical potential. It
has sensitivity limit between 10-12
and 10-13
gm/ml.
Mass Spectroscopy Detector
Here the sample compound or molecule is ionized, then it is passed through a mass analyzer and
the ion current is detected. There are various methods for ionization:
Electron impact ionization: An electron current or beam created under high electric potential is
used to ionize the sample migrating off the column.
Chemical ionization: A less aggressive method which utilizes ionized gas to remove electrons
from the compounds eluting from the column.
Fast atom bombardment: Xenon atoms are propelled at high speed in order to ionize the eluents
from the column. It has the detection limit of 10-8
to 10-10
gm/ml.
Nuclear Magnetic Resonance Detector
Certain nuclei with odd numbered masses, including H and 13
C, spin about an axis in a random
fashion. However, when sample is placed between poles of a strong magnet, the spins are aligned

Chapter 1 Introduction
School of Pharmaceutical Sciences, Shobhit University 13
either parallel or anti-parallel to the magnetic field, with the parallel orientation favored since it
is slightly lower in energy. The nuclei are then irradiated with electromagnetic radiation which is
absorbed and places the parallel nuclei. Each H or C produce different spectra depending on their
location and adjacent molecules, or elements in the compound, because all nuclei in molecules
are surrounded by electron clouds which change the encompassing magnetic field and thereby
alter the absorption frequency, state, consequently, they are now in “resonance” with the
radiation.
Light Scattering Detector
When a source emits a parallel beam of light, which strikes particles in solution, some light is
reflected, absorbed, transmitted, or scattered. There are two forms of LS detection that may be
used to measure the absorbance or transmittance:
Nephelometric Detector: This is based on the measurement of light scattered by a particulate
solution. This method enables the detection of the portion of light scattered at a multitude of
angles.
Turbidimetric Detector: This is based on the measurement of the reduction of light transmitted
due to particles in solution. Therefore, it quantifies the residual light transmitted.
Near Infrared Detector: It operates by scanning compounds in a spectrum from 700 to 1100 nm.
Stretching and bending vibrations of particular chemical bonds in each molecule are detected at
certain wavelengths. This is a fast growing method which offers several advantages: speed of
analysis (sometimes less than 1 second), simplicity of preparation of sample, multiple analyses
from single spectrum, and non-consumption of the sample.
1.4.6. Data System
Since the detector signal is electronic, use of modern data acquisition techniques can aid in the
signal analysis. The main goal in using electronic data systems is to increase analysis accuracy
and precision, while reducing operator attention.
1.4.7. Backpressure Regulator
As a final system enhancement, a backpressure regulator is often installed immediately after the
detector. This device prevents solvent bubble formation until the solvent is completely through
the detector. This is important because bubbles in a flow cell can interfere with the detection of
sample components.

Chapter 1 Introduction
School of Pharmaceutical Sciences, Shobhit University 14
1.5. Applications of HPLC
High performance liquid chromatography (HPLC) is a very powerful and flexible tool that forms
the analytical backbone for the entire drug development process, from discovery to the final
release of commercial product. HPLC is widely used in pharmaceutical industry, food and
beverage industry, research and development, quality control, production process control,
environmental analyses and clinical tests. The reasons of popularity of the methods are
sensitivity, ready adaptability to accurate quantitative determination and its widespread
applicability. It exhibits high resolving power, speedy separation, continuous monitoring of
column effluent, accurate quantitative measurement, repetitive and reproducible analysis using
the same column, automation of analytical procedure and data handling, evaluating reaction
conditions, in process monitoring for reaction conversion and determining final purity14
.
1.6. General Considerations for HPLC Method Development
General considerations for HPLC method development are shown in the form of flow chart in
Figure 1.2 and preferred experimental conditions for the initial HPLC run are presented in Table
1.4.

Chapter 1 Introduction
School of Pharmaceutical Sciences, Shobhit University 15
Gather information from the literature and the other sources about the
physiochemical properties of the API (active pharmaceutical ingredients)
Determine solubility profile and select λmax
Select chromatography method
(Based on solubility study, retention of the compounds etc.)
Reverse phase chromatography Normal phase chromatography
[Water soluble API (ionic/ non-ionic), [API soluble in non-polar organic solvent,
organic soluble API (polar or non-polar) etc.] sample too hydrophilic or hydrophobic]
Perform initial run for HPLC conditions
Select gradient or isocratic mode
Perform trials to select the optimum conditions for separation
(By changing mobile phase composition, buffer, pH,
column, flow rate, temperature etc)
Perform degradation experiments to challenge the method
Define system suitability parameters
Summarize methodology
Prepare development report
Validate the method
Figure 1.2: General considerations for HPLC method development

Chapter 1 Introduction
School of Pharmaceutical Sciences, Shobhit University 16
Table 1.4: Preferred experimental conditions for the initial HPLC run
1.6.1. Various Steps for Method Development15-16
Solubility Studies
Solubility studies are performed for the establishment of solubility of API (Active
Pharmaceutical Ingredient) in a number of aqueous and organic solvents like water, buffers,
sodium hydroxide, methanol, acetonitrile, chloroform, hexane, tetrahydrofuran (THF) etc. during
the method development. The API should have good solubility in the selected diluents
(preferably 1mg/ml). UV scan is performed in the range of 200-400 nm in the selected solvent to
ascertain the spectrophotometric properties of the drug. The solvent is selected as such, which
covers the range of polarities that are commonly used in the method development.
Selection of the Sample Diluents
The selection of the sample diluents should be suitable for intended use of the method. Physical
properties of commonly used solvents are presented in Table 1.5. The ideal sample diluent
should following properties-
It should dissolve the major analyte.
It should not interfere with analyte response.
It should prevent analyte interaction with container surfaces.
Separation Variables
Initial Conditions
Column
Dimensions (length, diameter)
Particle size
Stationary phase
150x4.6mm
5µm (3.5µm alternatively)
C8 or C18
Mobile Phase
Solvent A and B
% of strong solvent
Buffer (compound, pH, and concentration)
pH range
Additives (eg. Ion pair reagent, amine modifier)
Buffer-Acetonitrile
80-100%
25mM Potassium phosphate
2.0 < 3.0
Do not use initially
Flow Rate 1.5-2.0 ml/min
Temperature 35- 450C
Sample Size
Volume
Weight
< 25µl
< 100µg

Chapter 1 Introduction
School of Pharmaceutical Sciences, Shobhit University 17
Table 1.5: Physical properties of commonly used solvents15
Selection of the Wavelength
The selection of the wavelength is a critical step in the method development. To select the
wavelength, the standard solution at the required concentration in the selected solvent is prepared
and scanned on UV- spectrophotometer. Based on the UV scan results, the test solution is
injected into HPLC system equipped with the photo diode array detector and the spectrum is
collected. The wavelength, which gives the optimum response for the drug component is
selected.
Normal Phase Chromatography
The first choice for developing the HPLC method should be reverse phase chromatography.
Normal phase chromatography is preferred if:
Sample is dissolved in non-polar solvents like hexane, chloroform, dichloromethane etc.
(will cause direct injection problem if reverse phase column is used).
The sample is too strongly retained by the reverse phase chromatography and no peak
could be obtained for 50-60 minutes, even with 100% organic phase.
The sample is not retained by the reverse phase chromatography.
Reverse phase chromatography separation is unable to achieve adequate band spacing.
Sample contains positional isomers, stereoisomers, and diastereomers.
Normal phase is useful for the compound that decomposes in the aqueous phase.
Solvent
Polar
Index
Viscosity
(Poise)
Density
(g/ml)
Refractive
Index (at 25°C)
UV Cutoff
(nm)
B. P.
(°C)
Acetic acid 6.2 1.1 1.049 1.37 230 118
Acetone 5.4 0.3 0.791 1.356 330 56
Acetonitrile 6.2 0.34 0.786 1.341 210 82
Benzene 3 0.6 0.879 1.498 280 80
Methanol 6.6 0.54 0.791 1.326 210 65
Carbon
tetrachloride
1.6 0.9 1.594 1.457 265 77
Chloroform 4.4 0.53 1.483 1.443 245 61
Cyclohexane 0 0.9 0.744 1.423 210 81
THF 4.2 0.46 0.881 1.405 220 66
Ethyl Acetate 4.3 0.43 0.9 1.37 260 77
Hexane 0.06 0.3 0.659 1.372 210 69

Chapter 1 Introduction
School of Pharmaceutical Sciences, Shobhit University 18
In normal phase chromatography, the stationary phase is more polar than the mobile phase and
hence sample retention increases as the polarity of the mobile phase decreases.
Normal phase chromatography in HPLC typically encompasses adsorption chromatography on
silica and partition chromatography on cyano and amino bonded phases. Unique separations are
provided for saccharides, isomers, steroids, and class separations of lipids and poly nuclear
aromatic hydrocarbons.
For normal phase HPLC, initial trials can be taken by using 100% strong solvent like
isopropyl alcohol (IPA) with cyano column (250 x 4.5 mm, 5µ), to ascertain that all components
elute at 0.5 < K< 20. Subsequently using hexane as the weak solvent and to decrease the % of the
IPA. A gradient of 100% IPA may alternatively be used to estimate if gradient is necessary.
To change selectivity based on the strong solvent, IPA may be replaced by the methyl chloride,
MTBE (methyl-1-butyl-ether), acetonitrile or ethyl acetate, etc. However, the selection of
solvents depends on the type of detection. Some stationary phases available for the normal phase
roughly in the order of decreasing utility for the separations are Cyano > Silica > Diol > Amino,
etc. Triethylamine and acetic acid can be added to the mobile phase for the basic and acidic
compounds respectively, to prevent tailing.
Reverse Phase Chromatography
Depending upon the nature of the API (acidic/basic/neutral), an initial exploratory run using the
gradient elution can be performed by selecting the conditions. After the initial exploratory run,
the chromatogram is evaluated before proceeding with the next injection and subsequent
adjustments should be made to the mobile phase compositions, pH of the buffer, column
packing, column temperature, flow rate etc. to get the optimum conditions for separations. Each
subsequent injection is thus based on the previous conditions, so that after a number of
injections, the proper separation conditions can be found. Separations in reversed phase
chromatography depend on the reversible adsorption/desorption of solute molecules with varying
degrees of hydrophobicity to a hydrophobic stationary phase.
Selection of Isocratic or Gradient Mode
Similar conditions govern the design of both isocratic and gradient mode. A blank gradient
should be carried out initially, to ensure that there are no problems with the baseline. The initial
run begins with a linear 5 to 100% acetonitrile-buffer gradient for 60 min at a flow rate 2.0

Chapter 1 Introduction
School of Pharmaceutical Sciences, Shobhit University 19
ml/min and then estimating the best initial and final % of strong solvent. The run is repeated to
confirm the reproducibility of the separation.
To deciding whether a gradient mode or isocratic mode would be adequate, an initial gradient
run can be performed and the ratio between total gradient time and the difference in the gradient
time between the first and last components is calculated, When the calculated ratio is less than
0.25, isocratic mode is adequate, and when the ratio is more than 0.25, gradient mode would be
beneficial15
.
Reverse Phase Chromatography with Ion Pair Reagents
The use of ion pair reagent is suggested only when the adequate separation could not be obtained
with the reverse phase chromatography. The reverse phase HPLC and the reverse phase HPLC
with ion pairing are similar, except that the latter contains an ion pair reagent in the mobile phase
to improve the selectivity of the ionic samples. However, reverse phase HPLC should be utilized
first before for the ion-pair reagent unless any reference is available in the literature.
The solubility of the ion-pair reagent may be affected depending upon the organic solvent used
in the mobile phase. Methanol is generally preferred over THF and acetonitrile. In reverse phase
HPLC with ion-pair, a suitable buffer is chosen at a concentration of about 25mM, the pH and
ion-pair concentration are varied to provide the optimum selectivity to the separation.
The pH of the mobile phase is closely associated with the ion pairing, whether the ion-pair is
positively charged or negatively charged and dependent on whether the analyte is an acid or
base. For the cationic samples or bases, use the pentane-hexane or higher hydrocarbon sulfonate
ion-pair reagent and for the anionic samples or acids, tetraethyl ammonium hydroxide can be
used as ion-pair reagent16
.
1.6.2. Optimization of the Method Development Parameters17-18
Selection of Buffer
Efficient separation of the acidic or basic components is achievable by controlling the pH of the
mobile phase. The buffer should be UV transparent at or below the wavelength of the organic
solvent. Other properties such as solubility and stability of the buffer and its reactivity to analyte
and hardware components of the chromatographic systems should be taken into consideration.
The buffer capacity is determined by pH, composition of the buffer and buffer concentration.
Optimum buffering capacity occurs at a pH equal to the pKa of the buffer. In general, most
buffers provide the adequate buffering capacity for controlling mobile phase pH only within ±1

Chapter 1 Introduction
School of Pharmaceutical Sciences, Shobhit University 20
unit of their pKa. Reverse phase chromatography generally is carried out with C8 or C18 bonded-
phase silica based columns that are less stable outside the pH range 2 to 8. Therefore, the buffer
should be able to control pH between of 2.0 to 8.0.
Selection of the Buffer pH
Depending on the pKa value of the drug molecules, pH of the mobile phase can change
retentions, e.g. acids shows an increase in the retention as the pH is reduced while bases show a
decrease. It is best to adjust the mobile phase to pH values at least +1.5 pH units above or below
the pKa to ensure practically 100% unionization for separation purposes. Generally, at the low
pH (1-4), peak tailing is minimum and method ruggedness is maximum. On the other hand,
operating in the intermediate range (pH 4-8) offers an advantage in increased analyte retention
and selectivity. Different buffers for HPLC separation are presented in Table 1.6.
.
Table 1.6: Buffers used in HPLC separation
Buffer pH range UV cutoff
Trifluoracetic acid 1.5 - 2.5 210 nm
Phosphoric acid
(mono or di phosphate)
6.2 - 8.2 <200 nm
Citric acid 11.3 - 13.3 <200 nm
Formic acid/K-formate 2.8 - 4.8 210 nm
Acetic acid/K-acetate 3.8 - 5.8 210 nm
Ammonium chloride 8.2 - 10.2 200 nm
Triethylamine-
HCl/triethylamine
10.0 -12.0 <200 nm
Pyrollidine 10.3 - 12.3 200 nm
Selection of the Mobile Phase
Most separations can be achieved by choosing the optimum mobile phase compositions. Most
widely used solvents for the reverse phase chromatography are methanol and acetonitrile.
Tetrahydrofuran is also used, but to a lesser extent. Mobile phase with tetrahydrofuran is known
to be susceptible for oxidation. Experiments are conducted with the mobile phase having buffers
of different pH and different organic phases to establish the best possible separation.
Chapter 1 Introduction
School of Pharmaceutical Sciences, Shobhit University 21
If the sample is eluted with the mobile phase of 100% organic content, and there is no separation,
the solvent strength should be decreased to get the retention. Generally the increase in organic
content will shorten the run time but lead to increased band overlap.
When the separations are complex, i.e. when many components are to be separated, and when
solvent strength is decreased and still there is no resolution between two closely eluting peaks,
another organic solvent of different polarity or even a mixture of the two organic solvents may
be tried to effect the separation.
Selection of Column
HPLC column is the heart of the method and critical in performing the separation. The
parameters that should be taken into consideration while choosing the column for the HPLC
method include;
column packing material,
size and shape of the particles,
column length and diameter,
percent carbon load,
pore volume and
end capping etc.
For reverse phase chromatography, a wide variety of the columns are available like C8, C18,
Cyano group –CN and amino group like –NH2 etc. are available. It is to be remembered that no
two columns are the same and vary from manufacturer to manufacture with respect to above
mentioned parameters. The surface area of the bonded phase support is a major factor as larger
the surface area, greater will be the retention. Sample retention normally increases for the bonded
phases of greater length, C18>C8>C3>C1. To select the type of column in the method, the
experiments using different columns with different mobile phases should be conducted to get
best possible separation. Based on the experimental data, the column which gives separation of
all the possible impurities and principal peak and which is rugged for the variation in mobile
phase should be selected.
Selection of the Column Temperature
Generally it is preferable to optimize the chromatographic conditions with the ambient column
temperature. However, if the peak symmetry is not achieved with any combination of the column
and mobile phase at the ambient condition, then the column temperature above ambient can be

Chapter 1 Introduction
School of Pharmaceutical Sciences, Shobhit University 22
adopted. If the column temperature is increased, it generally results in the reduction in the peak
symmetry and peak retention time. Change in temperature may be a more effective tool for the
separation in the ionization of the sample and this changes pH and pKa values.
Filter Compatibility
If the filter paper is used before injecting the sample, it should be checked for the adsorption of
the drug(s). For this, the standard solutions and the sample solutions are prepared and filtered
using two and three different types of the filter papers. The filtered standard solution results are
compared to the unfiltered standard solution and further to the centrifuged/unfiltered sample
solutions. For the filters to be acceptable for the use, the results of the filtered portions should be
within +2.0% of the unfiltered standard solution and the centrifuged/unfiltered sample solution.
Selection of Test Concentration and Injection Volume
The selection of test concentration depends upon the response of the API at the selected
wavelength. The test concentration should be finalized only after it is proved that the API is
completely extractable at the selected test concentration.
Generally, the injection volume of 10 µl to 20 µl is recommended but injection volume can be
increased upto 50 μl-100 µl. Before selecting high injection volume, it is to be ensured that with
the selected higher injection volume, column is not overloaded, resolution and peak symmetry
are not compromised.
1.7. HPLC Method Validation19-23
Quality of analytical data is key factor for success of drug development programme. In the
absence of a proven measurement system, there is no way of judging whether or not the process
has done what it purported to do. If method performance is not verified, all data become
doubtful. Therefore, validation of an analytical method is essential for establishing the
confidence that the method is “fit for the purpose”.
Validation of an analytical method is the process by which it is established, through laboratory
studies, that the performance characteristics of the method meet the requirements for the
intended analytical applications. The objective of validation of an analytical procedure is to
demonstrate that it is suitable for its intended purpose. (ICH Q2)
There are two important reasons for validating analytical procedure in pharmaceutical industries.
Validation of analytical method is an integral part of the quality control system.

Chapter 1 Introduction
School of Pharmaceutical Sciences, Shobhit University 23
Regulatory bodies of different countries require validation of both compendial and non-
compendial procedures.
As a part of this initiative, the International Conference of Harmonization (ICH)
provides a tripartite guideline on Validation of Analytical Procedures: Methodology (Q2) for the
registration of pharmaceuticals in USA, Japan, and European Union. USP also provides a general
information chapter (1225) on Validation of Compendial Procedures. Analytical procedures in
USP/NF are legally recognized under section 501(b) of the Federal Food, Drug and Cosmetic
Act as the regulatory analytical procedures for the compendial items and are not required to
validate accuracy and reliability of these methods, but merely verify their suitability under actual
conditions of use.
Types of Analytical Procedures to be Validated
According to ICH Harmonized Tripartite Guidelines, the discussion of the validation of
analytical procedures is directed to the four most common types of analytical procedures;
identification tests,
quantitative tests for impurities content,
limit tests for the control of impurities and
quantitative tests of the active moiety in the samples of drug substance or drug product or
other selected component(s) in the drug product.
Chapter 1 Introduction
School of Pharmaceutical Sciences, Shobhit University 24
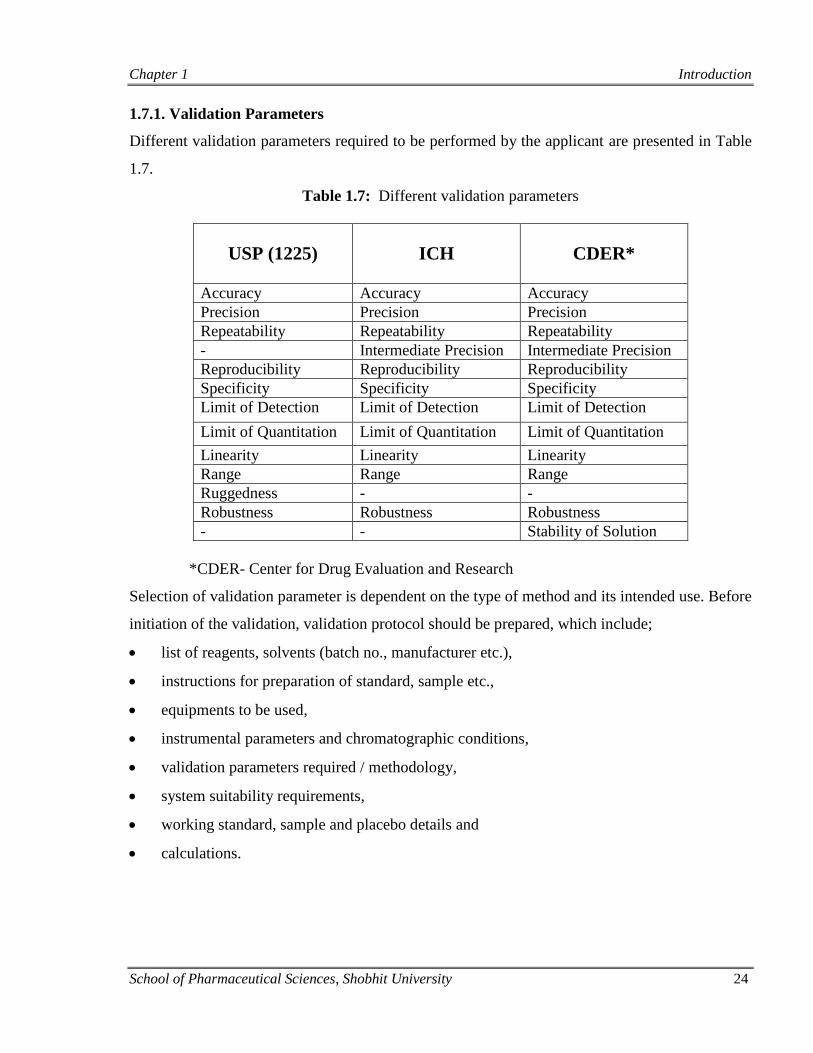
1.7.1. Validation Parameters
Different validation parameters required to be performed by the applicant are presented in Table
1.7.
Table 1.7: Different validation parameters
USP (1225)
ICH
CDER*
Accuracy Accuracy Accuracy
Precision Precision Precision
Repeatability Repeatability Repeatability
- Intermediate Precision Intermediate Precision
Reproducibility Reproducibility Reproducibility
Specificity Specificity Specificity
Limit of Detection Limit of Detection Limit of Detection
Limit of Quantitation Limit of Quantitation Limit of Quantitation
Linearity Linearity Linearity
Range Range Range
Ruggedness - -
Robustness Robustness Robustness
- - Stability of Solution
*CDER- Center for Drug Evaluation and Research
Selection of validation parameter is dependent on the type of method and its intended use. Before
initiation of the validation, validation protocol should be prepared, which include;
list of reagents, solvents (batch no., manufacturer etc.),
instructions for preparation of standard, sample etc.,
equipments to be used,
instrumental parameters and chromatographic conditions,
validation parameters required / methodology,
system suitability requirements,
working standard, sample and placebo details and
calculations.
Chapter 1 Introduction
School of Pharmaceutical Sciences, Shobhit University 25
1.7.1.1. Different Validation Parameters
Specificity
Specificity is the ability of the method to accurately measure the analyte response in the presence
of all potential components. The response of the analyte in the test mixtures containing the
analyte and all potential sample components (placebo formulation, synthesis intermediates,
excipients, degradation products and process impurities) is compared with the response of a
solution containing only the analyte.
Linearity
A linear relationship should be evaluated across the range of the analytical procedures. It may
either be demonstrated directly on the drug substance (by dilution of a standard stock solution)
by/or separate weighing of synthetic mixture of the drug product components, using the proposed
procedure. Linearity should be evaluated by visual inspection of a plot of signals as a function of
analytes concentration or content. If there is a linear relationship, test results should be evaluated
by appropriate statistical methods. Under most circumstances, correlation coefficient (r2) ≥
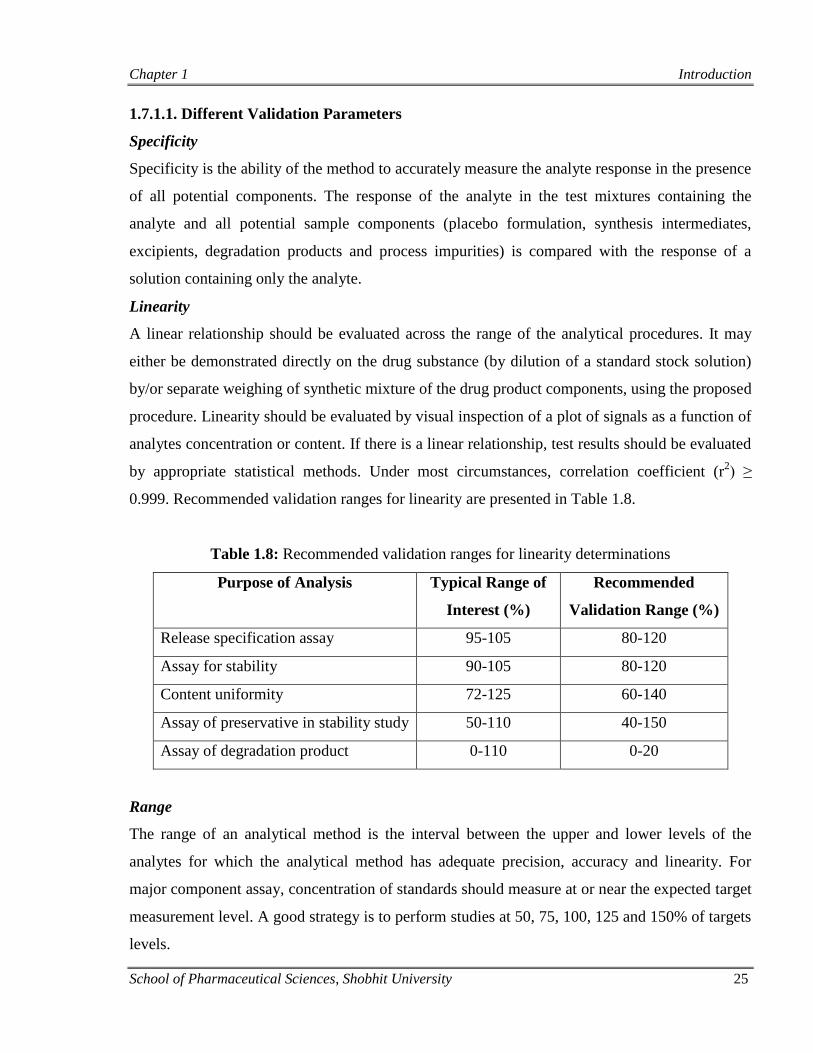
0.999. Recommended validation ranges for linearity are presented in Table 1.8.
Table 1.8: Recommended validation ranges for linearity determinations
Purpose of Analysis Typical Range of
Interest (%)
Recommended
Validation Range (%)
Release specification assay 95-105 80-120
Assay for stability 90-105 80-120
Content uniformity 72-125 60-140
Assay of preservative in stability study 50-110 40-150
Assay of degradation product 0-110 0-20
Range
The range of an analytical method is the interval between the upper and lower levels of the
analytes for which the analytical method has adequate precision, accuracy and linearity. For
major component assay, concentration of standards should measure at or near the expected target
measurement level. A good strategy is to perform studies at 50, 75, 100, 125 and 150% of targets
levels.

Chapter 1 Introduction
School of Pharmaceutical Sciences, Shobhit University 26
Precision
The precision of an analytical method describes the closeness of individual measures of an
analytes. Precision may be considered at three levels: repeatability, intermediate precision and
reproducibility.
Repeatability: It expresses the precision under the same operating conditions over a short interval
of time (within-assay variability, with-in day variability).
Intermediate precision: It was previously known as part of ruggedness. The attributes evaluate
the reliability of the method in a different environment other than that used during development
of the method. The objective is to ensure that the method would provide the same results when
similar samples are analyzed.
Reproducibility: Reproducibility expresses the precision between laboratories.
Accuracy
The accuracy of an analytical method describes the closeness of mean test results obtained by the
method to the true value (concentration) of the analyte. The deviation of the mean from the true
value serves as the measure of accuracy. Accuracy is often expressed as percentage recovery of
known, added amount of the analyte by the assay. Several methods are available for determining
accuracy of drug substance and drug product as given below.
For drug substance;
Application of an analytical procedure to an analyte of known purity (e.g. reference
material).
Comparison of the results of proposed analytical procedure with those of a second well-
characterized procedure, the accuracy of which is stated and/or defined.
Accuracy may be inferred once precision, linearity and specificity have been established.
For drug product:
Application of the analytical procedure to the drug product to which known quantities of
the drug substance have been added.
In case where it is impossible to obtain samples of all drug product components, it may
be acceptable either to add known quantities of the analytes to the drug product or to
compare the results obtained from a second, well characterized procedure, the accuracy
of which is stated and/or defined.

Chapter 1 Introduction
School of Pharmaceutical Sciences, Shobhit University 27
Accuracy may be inferred once precision, linearity and specificity have been established.
Recommended data: Accuracy should be assessed using a minimum of 9 determinations over a
minimum of 3 concentration levels covering the specified range (e.g. 3 concentrations/ 3
replicates each of the total analytical procedure). Accuracy should be reported as percent
recovery by the assay of known added amount of analytes in the sample or as the difference
between the mean and the accepted true value together with the confidence intervals.
Limit of Detection (LOD) and Limit of Quantitation (LOQ)
Limit of detection is the lowest amount of the analyte in a sample that can be detected but not
necessarily quantitated. The results obtained at the limit of detection are not necessarily accurate
and precise. Limit of quantitation is the lowest amount of analyte in the sample that can be
quantified with suitable accuracy and precision. LOD and LOQ can be estimated by different
methods.
Based on evaluation: Visual evaluation may be used for non- instrumental methods but may
also be used with instrumental methods. The detection limit is determined by the analysis of
samples with known concentration of analyte and by establishing the minimum level at which
the analyte can be readily detected.
Based on signal to noise ratio (S/N): Determination of signal to noise ratio is performed by
comparing measured signal from sample with known concentrations of analyte with those of
blank sample and establishing the minimum concentration at which the analyte can be reliably
detected.
S/N for LOD is 3:1
S/N for LOQ is 10:1
Based on standard deviation of the response and slope: Results of LOD and LOQ are
calculated by following formulae:
Where, S = Slope of calibration curve
σ = Standard deviation of the response
LOD = 3.3 (σ / S)
LOQ = 10 (σ / S)
Chapter 1 Introduction
School of Pharmaceutical Sciences, Shobhit University 28
Robustness
The robustness of an analytical procedure is measure of its capacity to remain unaffected by
small, but deliberate variation in method parameters and provides an indication of its reliability
during normal usage. It has been suggested that the robustness of a method can be checked by
determining the specificity on at least three different batches of a column from the same supplier.
The evaluation of the robustness should be considered during the development phase
and depends on the type of procedure under study. It shows the reliability of an analysis with
respect to deliberate variation in analytical conditions.
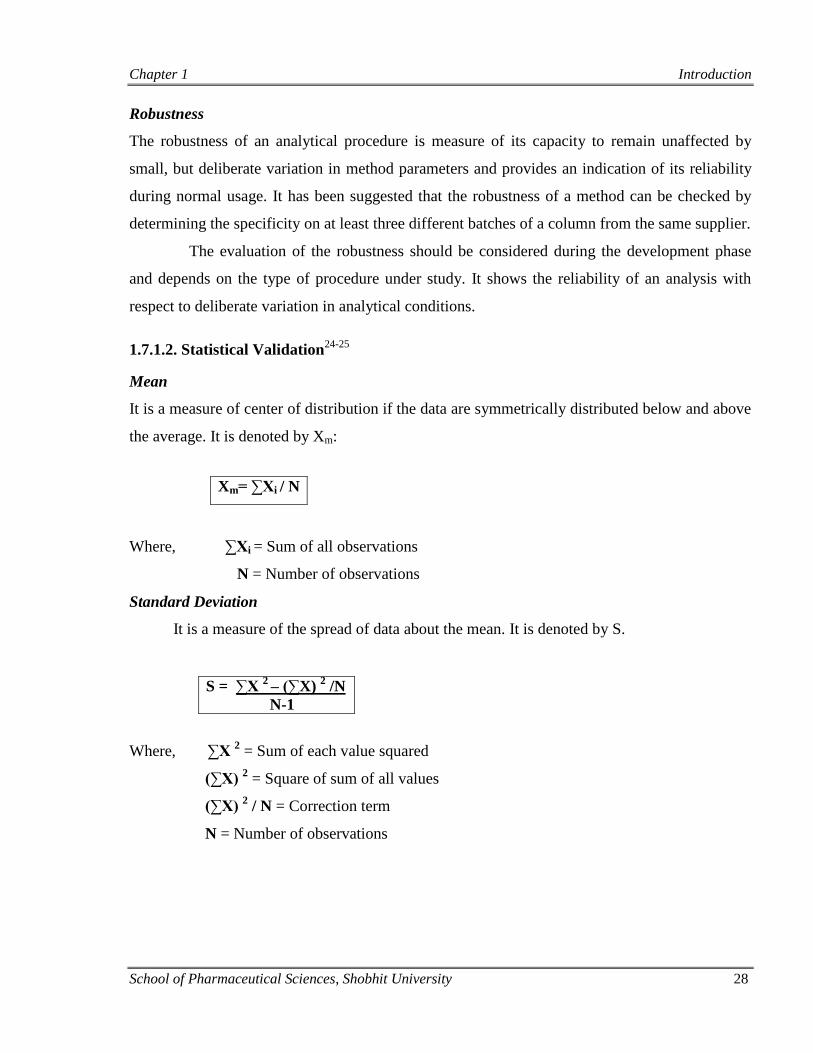
1.7.1.2. Statistical Validation24-25
Mean
It is a measure of center of distribution if the data are symmetrically distributed below and above
the average. It is denoted by Xm:
Where, ∑Xi = Sum of all observations
N = Number of observations
Standard Deviation
It is a measure of the spread of data about the mean. It is denoted by S.
Where, ∑X 2 = Sum of each value squared
(∑X) 2 = Square of sum of all values
(∑X) 2 / N = Correction term
N = Number of observations
Xm= ∑Xi / N
S = ∑X 2
– (∑X) 2 /N
N-1

Chapter 1 Introduction
School of Pharmaceutical Sciences, Shobhit University 29
Standard Deviation of Mean
It is a measure of variability of mean. It is denoted by Sxm.
Where, Sxm= Standard deviation of mean
S = Standard deviation
N = Number of observations
Linear Regression
A common application of linear regression in analytical chemistry is to determine best linear
equation for calibration data to generate a calibration curve. The concentration of analyte in a
sample can then be determined by comparing a measurement of the unknown to the calibration
curve.
For the linear equation: y = mx + b
Where, y= Estimated response / dependent variable
m = Slope of the regression line
b = Intercept (y value when x=0)
Correlation
Correlation is a measure of the relation between two or more variables. Correlation coefficients
can range from -1.00 to +1.00. The value of -1.00 represents a perfect negative correlation while
a value of +1.00 represents a perfect positive correlation. A value of 0.00 represents a lack of
correlation24
. The most widely used type of correlation coefficient is Pearson (r), also called
linear or product-moment correlation.
Coefficient of Variation
It is a measure of relative variability.
CV = S / Xm
CV of 0.1 or 10 % means that standard deviation is one tenth of the mean.
Sxm = S / (N) ½

Chapter 1 Introduction
School of Pharmaceutical Sciences, Shobhit University 30
1.8. System Suitability26-27
System suitability tests are integral part of gas and liquid chromatography methods. They are
used to verify that the resolution and reproducibility of the system are adequate for the analysis
to be done. The test is based on the concept that the equipment, electronics, analytical operations
and sample to be analyzed constitute an integral system that can be analyzed.
No sample analysis is acceptable unless the requirements for system suitability have been met.
System suitability tests are run every time a method is used either before or during the analysis.
The results of each and every test are compared with defined acceptance criteria and, if they
pass, the method is deemed satisfactory.
1.8.1. Retention Factor
Rt (retention time), is the time between the injection point and the maximum detector response
for correspondent compound. A more useful measurement is the capacity factor (k') which is
calculated from the retention time of a peak and the dead time of the column as shown below.
Calculation of retention factor is shown in Figure 1.3.
Where, tR = Retention time of analyte
t0 = Dead time of the column.
Figure 1.3: Calculation of capacity factor
1.8.2. Efficiency
Efficiency is measure of degree of peak dispersion in particular column. Calculation of
efficiency is shown in Figure 1.4.
N= 16(tR/w)2
k' = tR-t0 / t0

Chapter 1 Introduction
School of Pharmaceutical Sciences, Shobhit University 31
Where, tR = Retention time of the peak
. W = Peak width
Figure 1.4: Calculation of theoretical plate number
1.8.3. Selectivity
Selectivity is defined as ability of chromatographic system to discriminate two different analytes.
α= k’2/k’1
1.8.4. Resolution
The resolution (Rs) of a column provides a quantitative measure of its ability to separate two
analytes. Column resolution is expressed as;
Rs = 2[(tR) B - (tR) A]/WA +WB
Where, (tR)B, and (tR)A = retention time of compound B and A, respectively
WA, and WB = width at the base of the peak in time units of peak A and B,
respectively
1.8.5. Tailing Factor
The tailing factor is measured at 5% of the peak height and largely used in the pharmaceutical
industry. Calculation of tailing factor is shown in Figure 1.5.
Figure 1.5: Calculation of tailing factor

Chapter 1 Introduction
School of Pharmaceutical Sciences, Shobhit University 32
1.8.6. Asymmetry Factor
The asymmetry factor is measured at 10% of the peak height. In most cases, the asymmetry
factor and tailing factor will be roughly the same (although rarely exactly equal). Calculation of
asymmetry factor is shown in Figure 1.6.
Figure 1.6: Calculation of asymmetry factor
1.9. Stability Indicating Methods Development28-30
Stability indicating methods are capable of discriminating between major active pharmaceutical
ingredients (API) and their degradation product(s) formed under defined storage conditions
during the stability evaluation period. The discriminating nature of method makes the method
‘stability indicating’ as well as ‘stability specific’. Stability indicating methods (SIMs) are the
quantitative analytical methods based on characteristic structural, chemical or biological
properties of each API of a drug product that are aimed to distinguish the active ingredients from
their degradation products so that the active ingredients can be accurately measured. Stability
evaluation is stability detection system that identifies potential degradation products and includes
analytical method for their quantitation.
1.9.1. Objective of Stability Studies
Stability studies are performed to establish the storage conditions and shelf life for the API and
products. In recently adopted stability guidelines, the Committee for Proprietary Medicinal
Products (CPMP) indicates that the objective of stability testing is to provide evidence on how
the quality of an API varies with time under the influence of variety of environmental factors
such as temperature, humidity and light. The stability of API does not mean “fixed” or “not
likely change” but it means “controlled, documented and acceptable change”. Forced

Chapter 1 Introduction
School of Pharmaceutical Sciences, Shobhit University 33
degradation conditions, stress agent concentration and time of stress are to be established in such
a way that they effect degradation, preferably 10-20% of the parent constituent. Stability testing
is, performed for the welfare of the patient, to protect the reputation of producer, as a
requirement of regulatory agencies to provide data that may be of value in the formulation of
other products.
1.9.2. Stability Protocols31
Although the stability protocols contain a schedule for testing samples stored at one or more
controlled storage conditions as depicted in Tables 1.9 and 1.10, the protocol specification can
differ significantly from one product to another. Stability samples are stored in chamber in which
temperature and humidity conditions are carefully controlled. Stress conditions are applied to
drug product to approximate long –term stability in short period.
Table 1.9: Storage conditions
Test Conditions Minimum Period
Long term
25˚C ± 2˚C
60% ± 5%
12 months
Intermediate 30˚C ± 2˚C
60% ± 5%
6 months
Accelerated 40˚C ± 2˚C
75% ± 5%
6 months

Chapter 1 Introduction
School of Pharmaceutical Sciences, Shobhit University 34
Table 1.10: Proposed storage guidelines
Storage Condition Tolerance Testing Zone Guidelines
25˚C / 60% RH ± 2˚C / ± 5% RH Long term (II) ICH, WHO
30˚C / 60% RH ± 2˚C / ± 5% RH Intermediate ICH, WHO
40˚C / 75% RH ± 2˚C / ± 5% RH Accelerated ICH, WHO
30˚C / 35% RH ± 2˚C / ± 5% RH Long term (III) WHO
30˚C / 70% RH ± 2˚C / ± 5% RH Long term (IV) WHO
2 - 8˚C Not specified Refrigeration ICH, WHO
-5 to -20˚C Not specified Freezer WHO
Below -18˚C Not specified Deep freezer WHO
Light 1.2 millions lux
Hours/ 200 watt
Hours (UV)
Stress ICH
1.9.3. Degradation Pathways and their Role in SIM Development
Forced degradation studies typically involve the exposure of representative sample of drug
substance and drug product to relevant stress conditions of light, heat, humidity, acid/ base
hydrolysis and oxidation. These experiments play an important role in drug development
process. The results of forced degradation studies can facilitate SIM development, drug
formulation design, selection of storage conditions and packaging. It can also provide a better
understanding of drug molecule chemistry and solutions for stability related problems.
According to ICH guideline stress testing is likely to be carried on a single batch of material and
to include effect of temperature in 10˚C increments above the accelerated temperature test
condition (e.g. 50˚C, 60˚C etc.), humidity where appropriate (75% RH or greater), oxidation and
photolysis on the drug substance plus its susceptibility to hydrolysis across a wide range of pH
values when in solution and suspension. Both FDA and ICH recommended forced degradation or
stress testing of drug substance and drug product. Acid and base hydrolysis, temperature,
photolysis and oxidation are recommended for these studies. However, neither ICH nor FDA

Chapter 1 Introduction
School of Pharmaceutical Sciences, Shobhit University 35
guidelines specify how to perform these forced degradation studies. Experimental conditions and
design of these studies have been left to discretion of pharmaceutical companies. A generic
protocol for these studies is presented in Table 1.11 and 1.12.
Table 1.11: Recommended stress conditions for drug substances
Stress Type Conditions Time
Acid hydrolysis
1mg mL¯1 in 0.1M (upto1.0M) HCl,
RT or higher
1-7 days
Base hydrolysis 1mg mL¯1 in 0.1M (upto1.0M) NaOH,
RT or higher
1-7 days
Thermal hydrolysis Aqueous solution ; 70˚C 1-7 days
Oxidative solution O2 +initiator(AIBN)* in
acetonitrile/H2O 80/20; 40˚C
1-7 days
Oxidative solution 0.3% (upto 3%) H2O2; RT*; protected
from light
Few hours to 7 days
Thermal 70˚C Upto 2 weeks
Thermal humidity 70˚C/ 75% RH Upto 2 weeks
*AIBN- 2, 2-azobisisobutyronitrile
*RT- room temperature (25˚C)
Table 1.12: Recommended stress conditions for drug product
Stress Conditions Time
Thermal 70˚C Upto 3 weeks
Thermal / humidity 70˚C/ 75% RH Upto 3 weeks
Photo-degradation Fluorescent and UV light >2 × ICH

Chapter 1 Introduction
School of Pharmaceutical Sciences, Shobhit University 36
In stress testing minimum four samples should be generated for every stress condition
viz.
Blank solution stored under normal conditions.
Blank solution subjected to stress in the same manner as the drug solution.
Zero time sample containing the drug which is stored under normal conditions.
Drug solution subjected to stress treatment.
The comparison of the results of these provides real assessment of the changes. Furthermore, it is
advised to withdraw samples at different time periods for each reaction condition. By doing so,
one can get a clear idea on the number of products formed, their relative strengths and whether
they are stable or unstable, resulting in further degradation products. This information is
essential in establishment of SIMs. Potential degradation pathways include hydrolysis, oxidation,
photo degradation etc.
Hydrolysis
Hydrolysis is one of the most common reactions seen in the API having ester and amide
functional groups within their structure. Hydrolytic degradation is performed in hydrochloric
acid and sodium hydroxide in solution. If the compound is poorly water soluble, organic co-
solvents may be used in combination with acid or base. Stress is first initiated at room
temperature, if no degradation occurs, an elevated temperature is applied (50-70˚C). The
hydrolytic degradation of new drug in acidic and alkaline conditions can be studied by refluxing
the drug in the 0.1 M HCl / NaOH for 8 hours. If reasonable degradation occurs, testing can be
stopped, if no degradation is seen under these conditions, the drug should be refluxed in a
stronger acid / alkali and for longer duration.
Oxidation
Oxidation is a well established degradation pathway for APIs. Oxygen which is required in most
oxidation reactions and is abundant in environment to which pharmaceuticals are exposed,
during either processing or long term storage. Oxidation reactions may be performed under
several conditions. Hydrogen peroxide concentration may be adjusted as necessary to obtain 5-
20% degradation. The disadvantage of using hydrogen peroxide is that it is non- selective and
relatively non predictable in its results. Stress with hydrogen peroxide often leads to secondary
degradation of the primary degradants making result interpretation more difficult.

Chapter 1 Introduction
School of Pharmaceutical Sciences, Shobhit University 37
Photo Degradation
Photo degradation has been reported for large number of drug substances and mechanisms for
these reactions are generally complex. The photolytic studies should be carried out by exposure
to light, using a combination of cool white and UV fluorescent lamps.
The desired target extent of degradation is approximately 5-20%. This is achieved by varying the
stress conditions. Over stressing may destroy the compound or may lead to further degradation
of relevant primary degradants. Under such circumstances stressing may fail to generate an
important degradation product. The degradation studies should be terminated after the maximum
recommended time/ stress conditions, even if sufficient degradation has not been achieved.
1.9.4. Need of Stress Testing in SIMs
When large number of degradation products is formed during forced decomposition of drug even
in one stress condition, it may be truly difficult or impossible to develop a selective stability-
indicating assay method if degradation products formed under all conditions are simultaneously
taken into consideration. Moreover, it has been mentioned that some degradation products
formed during forced decomposition are never developed in the stability samples. So a tagged
question is ‘should only major degradation products are targeted while developing a SIAM,
instead of all degradation products formed under the ICH suggested test conditions?’
Interestingly, the dilemma is well answered in the ICH guideline itself where the clarification is
provided in the statement ‘However, it may not be necessary to examine specifically for certain
degradation products if it has been demonstrated that they are not formed under accelerated or
long term storage conditions.’ Therefore, it emerges that a SIAM separating all types of possible
degradation products should normally be developed through stress testing under different ICH
suggested conditions. In case, it is not possible to develop a ‘selective SIAM’ due to the complex
nature of degradation, one can target for a method that takes into account degradation products
formed only under accelerated and long-term storage conditions.

Chapter 1 Introduction
School of Pharmaceutical Sciences, Shobhit University 38
References
1. Christian, G.D. Analytical Chemistry, 6th
ed.; John Wiley & Sons, Inc., 2004; pp 1-4.
2. Anjaneyulu, Y.; Chandrashekhar, K. A textbook of Analytical Chemistry, 4th
ed.; Pharma
Book Syndicate, 2006; pp 1-5.
3. Garatt, D.C. The Quantitative Analysis of Drugs, 3rd
ed.; CBS Publishers and Distributors,
2005; pp 876.
4. Sethi, P.D. HPLC Quantitative Analysis of Pharmaceutical Formulation, 1st ed.; CBS
Publisher and Distributer, New Delhi, 2001; pp 94-95.
5. Skoog, D.A.; West, D.M.; Holler, F.J.; Crouch, S.R. Fundamental of Analytical
Chemistry, 8th
ed.; Thomson Publisher, 2005; pp 986-988.
6. Settle, F.A. Instrumental Techniques for Analytical Chemistry, 1st Indian Reprint,
Pearson Education, 2004; pp 147-152.
7. Krustulovic, A.M.; Browm, P.R. Reversed Phase High Performance Liquid
Chromatography, 8th
ed.; John Wiley and Sons, 1982; pp 345-350.
8. Skoog, D.A.; West, D.M.; Holler, F.J.; Crouch, S.R. Fundamentals of Analytical
Chemistry, 8th
ed.; Thomson Publishers, 2005; pp 986-991.
9. Schirmer, R.E. Modern Methods of Pharmaceutical Analysis, 2nd
ed.; CRC Press:
Florida, 2000; pp 156-159.
10. Khopkar, S.M. Basic Concepts of Analytical Chemistry, 3rd
ed.; New Age Inter. Pub.
2008; pp 198.
11. Green, M.J. A Practical Guide to Analytical Method Validation, 4th
ed.; Thomson
Publishers, 1996; pp 305-310.
12. Streeter, A.J.; Ohannesian, L. Handbook of Pharmaceutical Analysis, Vol. 117, Marcel
Dekker Inc., 2005; pp 92-98.
13. Singh, S.; Garg, S. Analytical Method Validation, 6th
ed.; Pharma Times, 1999; pp 15-20.
14. Willard, H.H.; Meritt, L.; Dean, J.A.; Settle, F.A. Instrumental Method of Analysis,
7th
ed.; CBS Publishers and Distributors, 1986;p 586-643.
15. Chan, C.; Lam, Y.C. Analytical Method Validation and Instrumental Performance
Verification, John Wiley & Sons, 2004; pp 75.
16. Billiet, H.H.; Rippel, G. Method Development and Selectivity Optimization in High
Performance liquid Chromatography, 9th
ed.; Marcel Dekker, 1998; pp 263.

Chapter 1 Introduction
School of Pharmaceutical Sciences, Shobhit University 39
17. Watson, D.G. Pharmaceutical Analysis, 2nd
ed.; Elsevier Churchill Livingstone, 2005; pp
276-280.
18. ICH Harmonized Tripartite Guidelines; Text on Validation on Analytical Procedure
(Q2A); 1994.
19. ICH Harmonized Tripartite Guidelines; Validation on Analytical Procedure. Text and
Methodology Q2 B (R1), Parent Guidelines; 1996.
20. CDER Reviewer Guidance; Validation of Chromatographic Methods; 1994.
21. Braun, R.D. Introduction to Instrumental Analysis, 3rd
ed.; Pharma Book Syndicate,
2006; pp 869-870.
22. Sharma, B.K. Instrumental Methods of Chemical Analysis, 23rd
ed.; Goel Publishing
House, 2004; pp 292-302.
23. Kar, A. Pharmaceutical Drug Analysis, 2nd
ed.; New Age International (P) Ltd.
Publishers, 2005; pp 455-463.
24. Beckett, A.H.; Stenlake, J.B. Practical Pharmaceutical Chemistry, 4th
ed.; Part-II, CBS
Publishers & Distributors, 2001; pp 284-285.
25. Dong, M.; Paul, R.; Gershnov, L. Today’s Chemist at Work, Vol. 10, 2001; pp 38-40.
26. FDA, Guidelines for Submitting Documentation for the Stability of Human Drugs and
Biologics, Center for Drugs and Biologics, Department of Health and Human Services;
1987.
27. Ahuja, S.; Scypinski, S. Handbook of Modern Pharmaceutical Analysis, 5th
ed.; Elsevier,
California, 2005; pp 393, 448.
28. Carstensen, J.T.; Rhodes, C.T. Drug Stability: Principles and Practices, 2nd
ed.; Marcel
Dekker, 2000; pp 167-170.
29. Yoshika, S.; Stella, V.J. Stability of Drugs and Dosage Forms, Springer Private Limited,
2006; pp 5-8.
30. Kim, H.B. Handbook of Stability Testing in Pharmaceutical development, Regulation
Methodology and Best Practices, Springer Sciences, 2009; pp 148.
31. Sehrawat, R.; Maithani, M.; Singh, R. Regulatory Aspects in Development of Stability-
Indicating Methods: A Review. Chromatogra. 2010, 1(2), 1-6.