1. global textile industry · 1. global textile industry 2. taiwan textile industry 3. a strategy...
TRANSCRIPT
1. Global Textile Industry
2. Taiwan Textile Industry
3. A Strategy for Product Differentiation
4. Ways to Enter Free Trade Markets
5. Relations between Taiwan and the U.S.A.
2
Contents
152 151 158 151 148 155 147
154
173
195 203
219
238 250
211
251
294
158 164
182 186 186 199 195
203 233
258
276
311
345 362
316
352
412
0
50
100
150
200
250
300
350
400
450
1995 1996 1997 1998 1999 2000 2001 2002 2003 2004 2005 2006 2007 2008 2009 2010 2011
Textile Clothing
(Bil
lion
US
D)
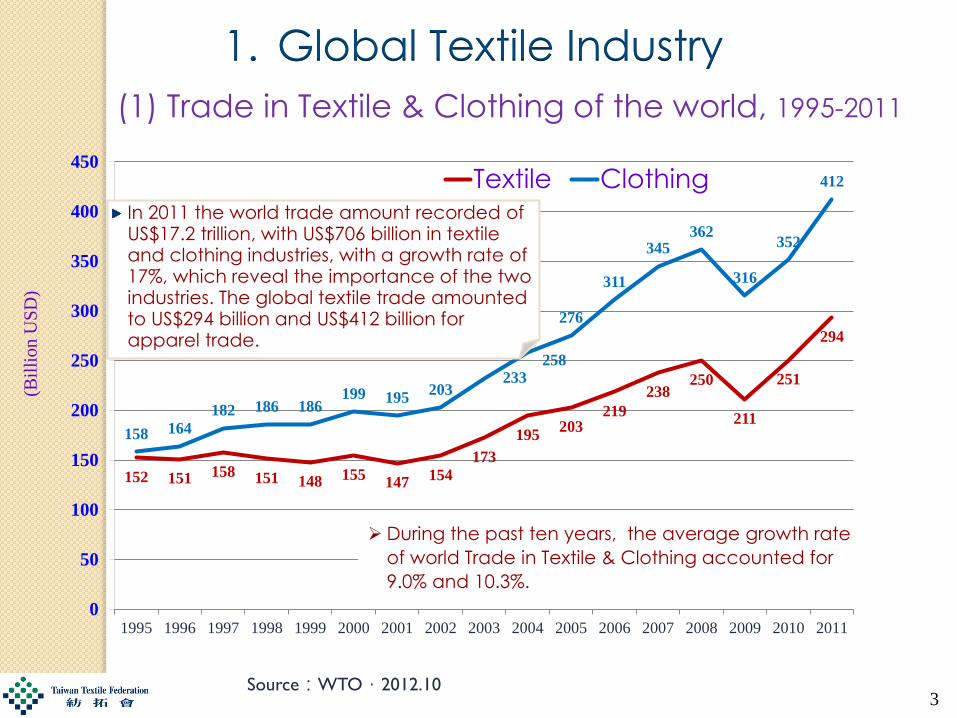
(1) Trade in Textile & Clothing of the world, 1995-2011
In 2011 the world trade amount recorded of US$17.2 trillion, with US$706 billion in textile and clothing industries, with a growth rate of 17%, which reveal the importance of the two industries. The global textile trade amounted to US$294 billion and US$412 billion for apparel trade.
Source:WTO,2012.10
1. Global Textile Industry
3
During the past ten years, the average growth rate
of world Trade in Textile & Clothing accounted for
9.0% and 10.3%.
94.4
23.7
15.0 13.8 12.4 11.3 11.0 10.8 9.1 8.0 4.8 4.1 3.8 2.1 2.0
0
10
20
30
40
50
60
70
80
90
100
Chin
a
Extra-E
U2
7
Ind
ia
US
A
Korea-S
ou
th
HK
Taiw
an
Turk
ey
Pak
istan
Japan
Ind
onesia
Thailan
d
Viet N
am
Mex
ico
Malay
sia
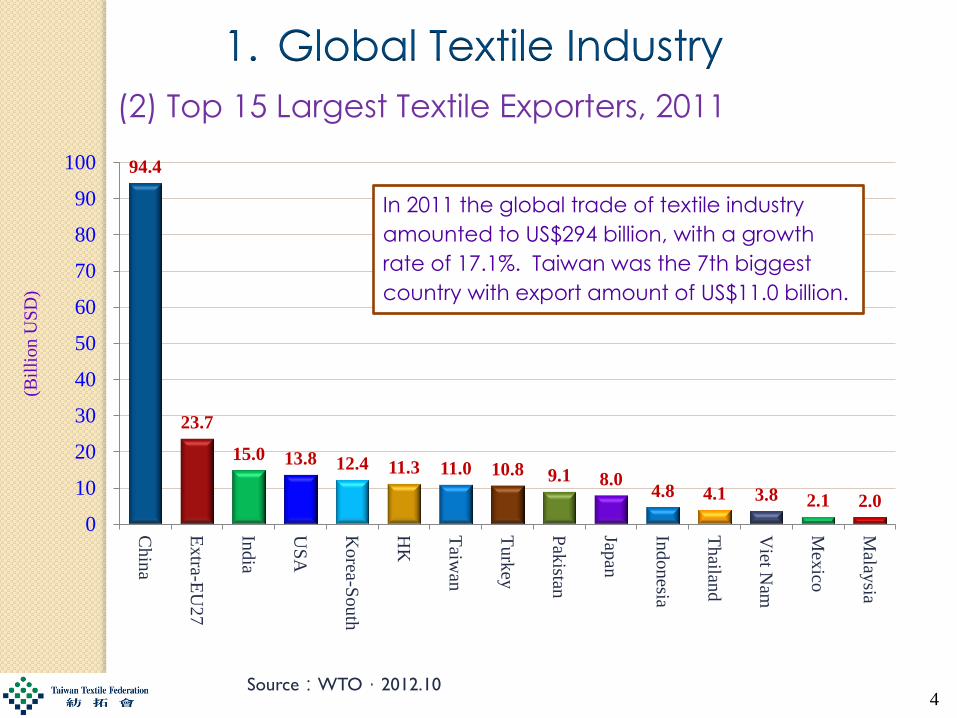
In 2011 the global trade of textile industry
amounted to US$294 billion, with a growth
rate of 17.1%. Taiwan was the 7th biggest
country with export amount of US$11.0 billion.
4
1. Global Textile Industry
(2) Top 15 Largest Textile Exporters, 2011
Source:WTO,2012.10
(Bil
lion
US
D)
31.2
25.4
18.9
11.0
9.2 8.7 7.6
5.9 5.7 5.7 5.6 4.5 4.3 3.8 3.4
1.4
0
5
10
15
20
25
30
35
Extra-E
U2
7
US
A
Ch
ina
HK
Japan
VietN
am
Turk
ey
Mex
ico
Korea-S
ou
th
Indo
nesia
Ban
glad
esh
Can
ada
Brazil
Russian
Ind
ia
Taiw
an2
9
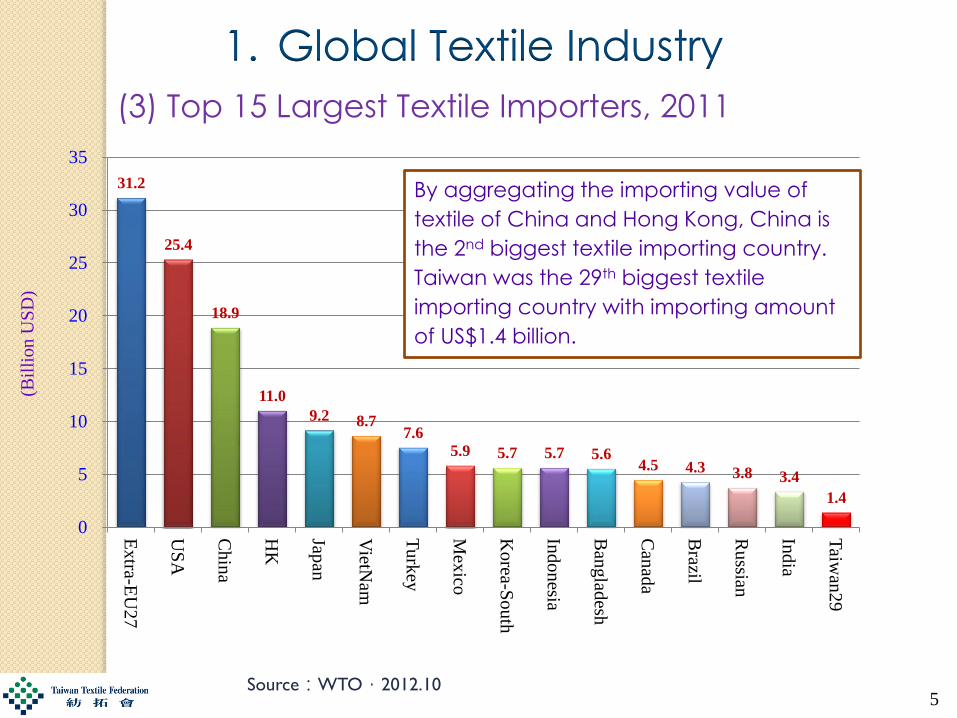
By aggregating the importing value of
textile of China and Hong Kong, China is
the 2nd biggest textile importing country.
Taiwan was the 29th biggest textile
importing country with importing amount
of US$1.4 billion.
5
1. Global Textile Industry
(3) Top 15 Largest Textile Importers, 2011
(Bil
lion
US
D)
Source:WTO,2012.10
153.8
28.0 24.5
19.9 14.4 13.9 13.2
8.0 5.2 4.6 4.6 4.6 4.5 4.2 4.1 1.0
0
20
40
60
80
100
120
140
160
Chin
a
Extra-E
U27
HK
Ban
glad
esh
Ind
ia
Turk
ey
VietN
am
Indo
nesia
US
A
Mex
ico
Malay
sia
Thailan
d
Pak
istan
SriL
anka
Cam
bo
dia
Taiw
an3
0
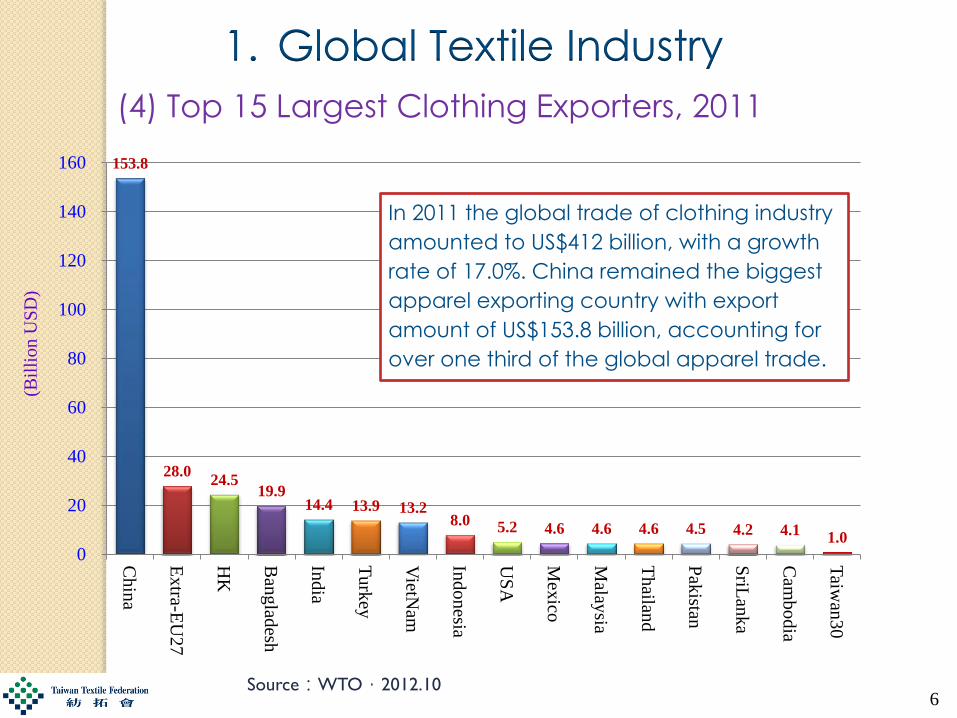
In 2011 the global trade of clothing industry
amounted to US$412 billion, with a growth
rate of 17.0%. China remained the biggest
apparel exporting country with export
amount of US$153.8 billion, accounting for
over one third of the global apparel trade.
6
1. Global Textile Industry (B
illi
on
US
D)
Source:WTO,2012.10
(4) Top 15 Largest Clothing Exporters, 2011
100.9
88.6
32.9
17.2
9.5 7.6 6.1 6.1 5.8 4.0 3.3 3.2 2.9 2.8 2.7 1.5
0
20
40
60
80
100
120
Ex
tra-EU
27
US
A
Japan
HK
Can
ada
Russian
Sw
itzerland
Korea-S
outh
Au
stralia
Chin
a
Turk
ey
United
-Arab
No
rway
Sau
di-A
rabia
Mex
ico
Taiw
an2
0
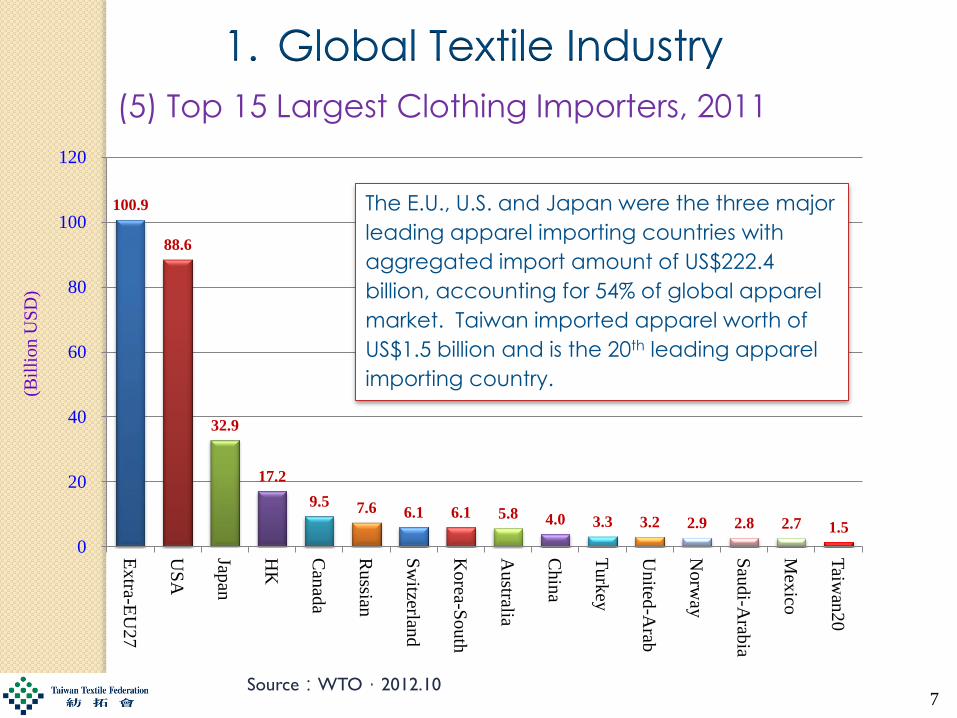
The E.U., U.S. and Japan were the three major
leading apparel importing countries with
aggregated import amount of US$222.4
billion, accounting for 54% of global apparel
market. Taiwan imported apparel worth of
US$1.5 billion and is the 20th leading apparel
importing country.
7
1. Global Textile Industry
Source:WTO,2012.10
(Bil
lion
US
D)
(5) Top 15 Largest Clothing Importers, 2011
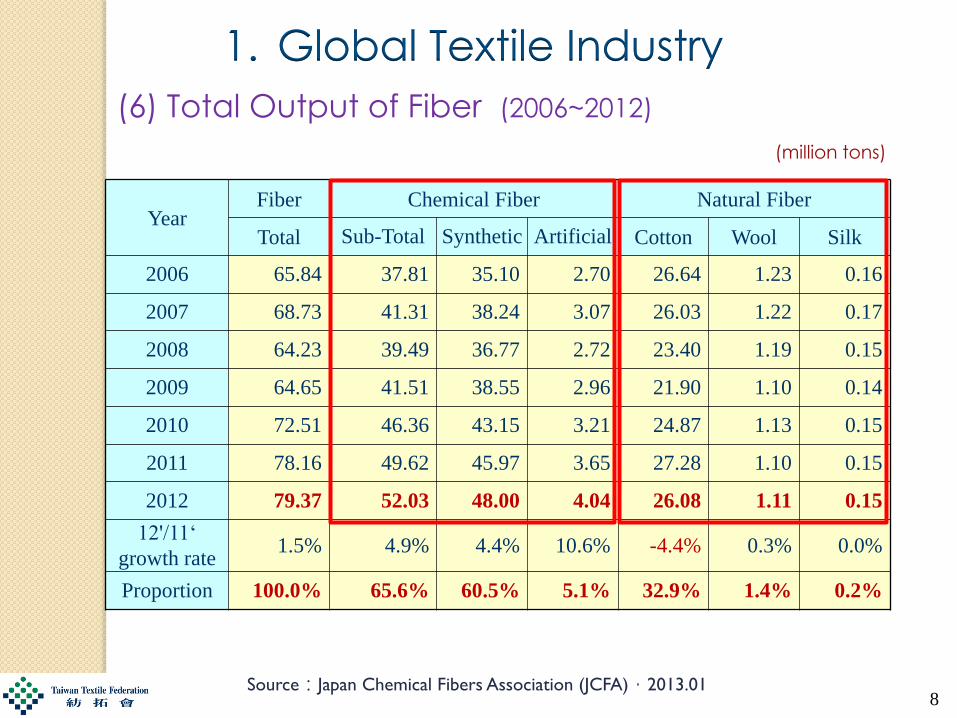
(million tons)
Year Fiber Chemical Fiber Natural Fiber
Total Sub-Total Synthetic Artificial Cotton Wool Silk
2006 65.84 37.81 35.10 2.70 26.64 1.23 0.16
2007 68.73 41.31 38.24 3.07 26.03 1.22 0.17
2008 64.23 39.49 36.77 2.72 23.40 1.19 0.15
2009 64.65 41.51 38.55 2.96 21.90 1.10 0.14
2010 72.51 46.36 43.15 3.21 24.87 1.13 0.15
2011 78.16 49.62 45.97 3.65 27.28 1.10 0.15
2012 79.37 52.03 48.00 4.04 26.08 1.11 0.15
12'/11‘
growth rate 1.5% 4.9% 4.4% 10.6% -4.4% 0.3% 0.0%
Proportion 100.0% 65.6% 60.5% 5.1% 32.9% 1.4% 0.2%
8 Source:Japan Chemical Fibers Association (JCFA),2013.01
(6) Total Output of Fiber (2006~2012)
1. Global Textile Industry
9
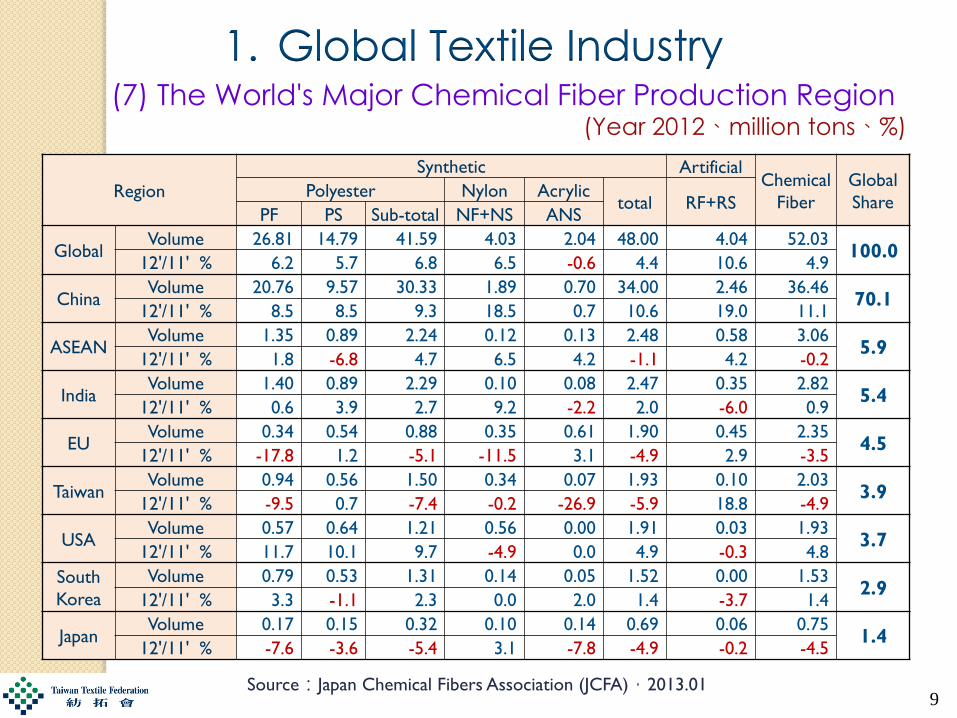
1. Global Textile Industry (7) The World's Major Chemical Fiber Production Region
(Year 2012、million tons、%)
Source:Japan Chemical Fibers Association (JCFA),2013.01
Region
Synthetic Artificial Chemical
Fiber
Global
Share Polyester Nylon Acrylic
total RF+RS PF PS Sub-total NF+NS ANS
Global Volume 26.81 14.79 41.59 4.03 2.04 48.00 4.04 52.03
100.0 12'/11' % 6.2 5.7 6.8 6.5 -0.6 4.4 10.6 4.9
China Volume 20.76 9.57 30.33 1.89 0.70 34.00 2.46 36.46
70.1 12'/11' % 8.5 8.5 9.3 18.5 0.7 10.6 19.0 11.1
ASEAN Volume 1.35 0.89 2.24 0.12 0.13 2.48 0.58 3.06
5.9 12'/11' % 1.8 -6.8 4.7 6.5 4.2 -1.1 4.2 -0.2
India Volume 1.40 0.89 2.29 0.10 0.08 2.47 0.35 2.82
5.4 12'/11' % 0.6 3.9 2.7 9.2 -2.2 2.0 -6.0 0.9
EU Volume 0.34 0.54 0.88 0.35 0.61 1.90 0.45 2.35
4.5 12'/11' % -17.8 1.2 -5.1 -11.5 3.1 -4.9 2.9 -3.5
Taiwan Volume 0.94 0.56 1.50 0.34 0.07 1.93 0.10 2.03
3.9 12'/11' % -9.5 0.7 -7.4 -0.2 -26.9 -5.9 18.8 -4.9
USA Volume 0.57 0.64 1.21 0.56 0.00 1.91 0.03 1.93
3.7 12'/11' % 11.7 10.1 9.7 -4.9 0.0 4.9 -0.3 4.8
South
Korea
Volume 0.79 0.53 1.31 0.14 0.05 1.52 0.00 1.53 2.9
12'/11' % 3.3 -1.1 2.3 0.0 2.0 1.4 -3.7 1.4
Japan Volume 0.17 0.15 0.32 0.10 0.14 0.69 0.06 0.75
1.4 12'/11' % -7.6 -3.6 -5.4 3.1 -7.8 -4.9 -0.2 -4.5
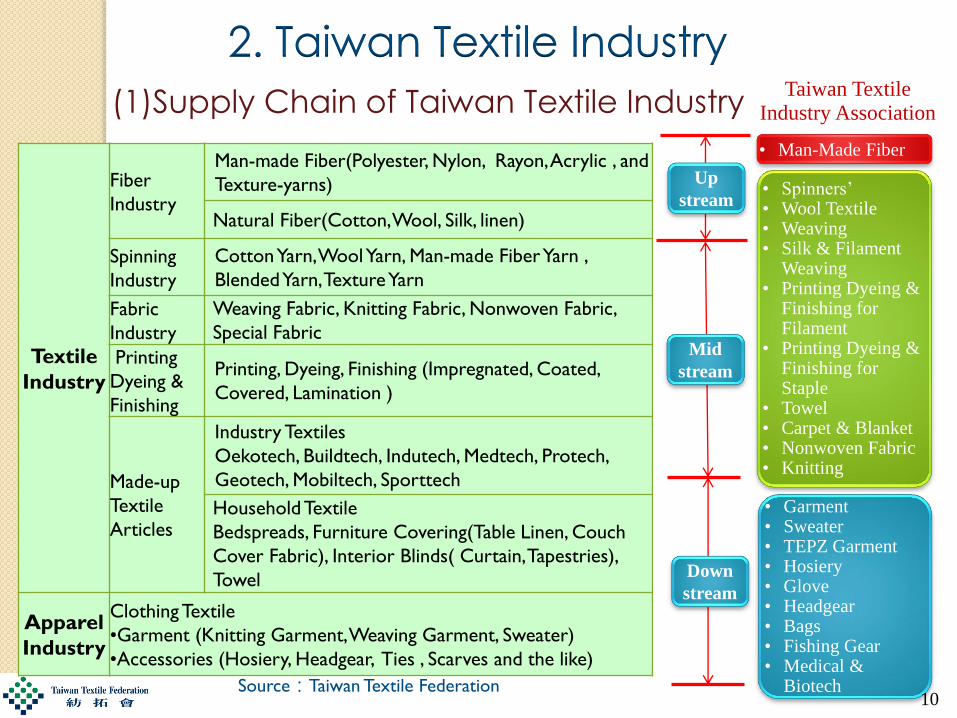
Textile
Industry
Fiber
Industry
Man-made Fiber(Polyester, Nylon, Rayon, Acrylic , and
Texture-yarns)
Natural Fiber(Cotton, Wool, Silk, linen)
Spinning
Industry
Cotton Yarn, Wool Yarn, Man-made Fiber Yarn ,
Blended Yarn, Texture Yarn
Fabric
Industry
Weaving Fabric, Knitting Fabric, Nonwoven Fabric,
Special Fabric
Printing
Dyeing &
Finishing
Printing, Dyeing, Finishing (Impregnated, Coated,
Covered, Lamination )
Made-up
Textile
Articles
Industry Textiles
Oekotech, Buildtech, Indutech, Medtech, Protech,
Geotech, Mobiltech, Sporttech
Household Textile
Bedspreads, Furniture Covering(Table Linen, Couch
Cover Fabric), Interior Blinds( Curtain, Tapestries),
Towel
Apparel
Industry
Clothing Textile
•Garment (Knitting Garment, Weaving Garment, Sweater)
•Accessories (Hosiery, Headgear, Ties , Scarves and the like)
Source:Taiwan Textile Federation
Up
stream
(1)Supply Chain of Taiwan Textile Industry Taiwan Textile
Industry Association
• Man-Made Fiber
• Spinners’ • Wool Textile • Weaving • Silk & Filament
Weaving • Printing Dyeing &
Finishing for Filament
• Printing Dyeing & Finishing for Staple
• Towel • Carpet & Blanket • Nonwoven Fabric • Knitting
• Garment • Sweater • TEPZ Garment • Hosiery • Glove • Headgear • Bags • Fishing Gear • Medical &
Biotech 10
2. Taiwan Textile Industry
Mid
stream
Down
stream
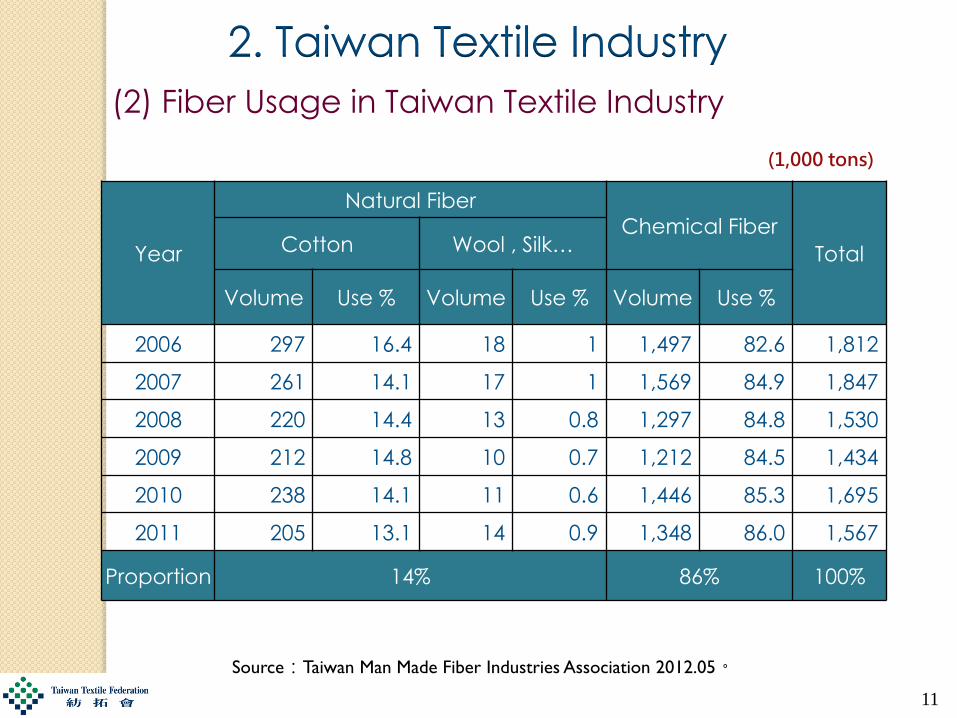
(1,000 tons)
Source:Taiwan Man Made Fiber Industries Association 2012.05。
11
Year
Natural Fiber
Chemical Fiber
Total Cotton Wool , Silk…
Volume Use % Volume Use % Volume Use %
2006 297 16.4 18 1 1,497 82.6 1,812
2007 261 14.1 17 1 1,569 84.9 1,847
2008 220 14.4 13 0.8 1,297 84.8 1,530
2009 212 14.8 10 0.7 1,212 84.5 1,434
2010 238 14.1 11 0.6 1,446 85.3 1,695
2011 205 13.1 14 0.9 1,348 86.0 1,567
Proportion 14% 86% 100%
2. Taiwan Textile Industry
(2) Fiber Usage in Taiwan Textile Industry
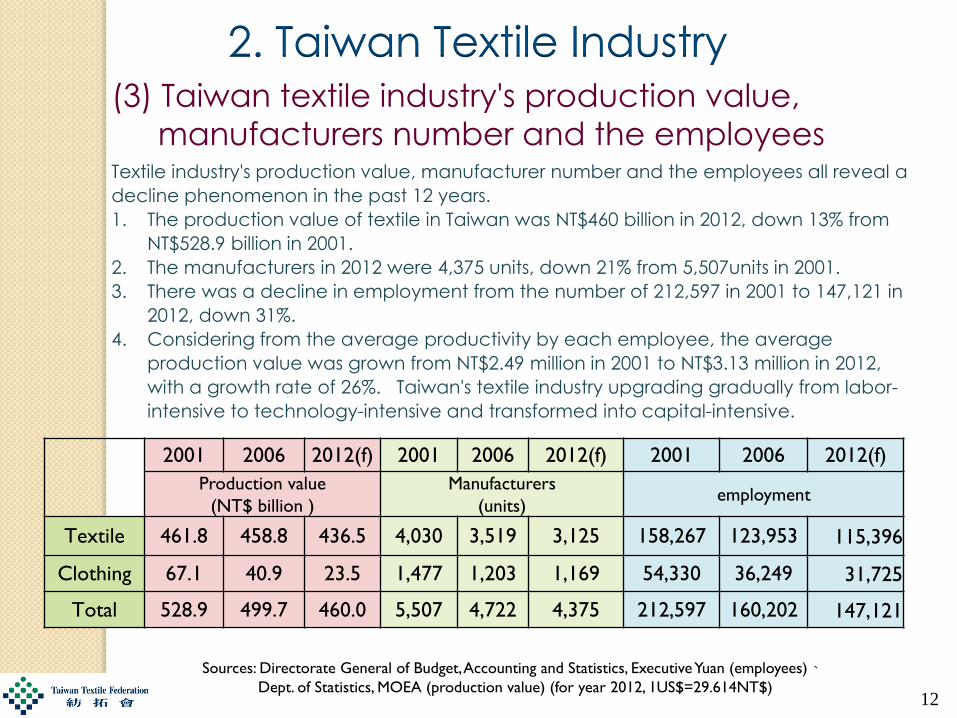
Textile industry's production value, manufacturer number and the employees all reveal a
decline phenomenon in the past 12 years.
1. The production value of textile in Taiwan was NT$460 billion in 2012, down 13% from
NT$528.9 billion in 2001.
2. The manufacturers in 2012 were 4,375 units, down 21% from 5,507units in 2001.
3. There was a decline in employment from the number of 212,597 in 2001 to 147,121 in
2012, down 31%.
4. Considering from the average productivity by each employee, the average
production value was grown from NT$2.49 million in 2001 to NT$3.13 million in 2012,
with a growth rate of 26%. Taiwan's textile industry upgrading gradually from labor-
intensive to technology-intensive and transformed into capital-intensive.
2001 2006 2012(f) 2001 2006 2012(f) 2001 2006 2012(f)
Production value
(NT$ billion )
Manufacturers
(units) employment
Textile 461.8 458.8 436.5 4,030 3,519 3,125 158,267 123,953 115,396
Clothing 67.1 40.9 23.5 1,477 1,203 1,169 54,330 36,249 31,725
Total 528.9 499.7 460.0 5,507 4,722 4,375 212,597 160,202 147,121
Sources: Directorate General of Budget, Accounting and Statistics, Executive Yuan (employees)、Dept. of Statistics, MOEA (production value) (for year 2012, 1US$=29.614NT$)
(3) Taiwan textile industry's production value,
manufacturers number and the employees
12
2. Taiwan Textile Industry
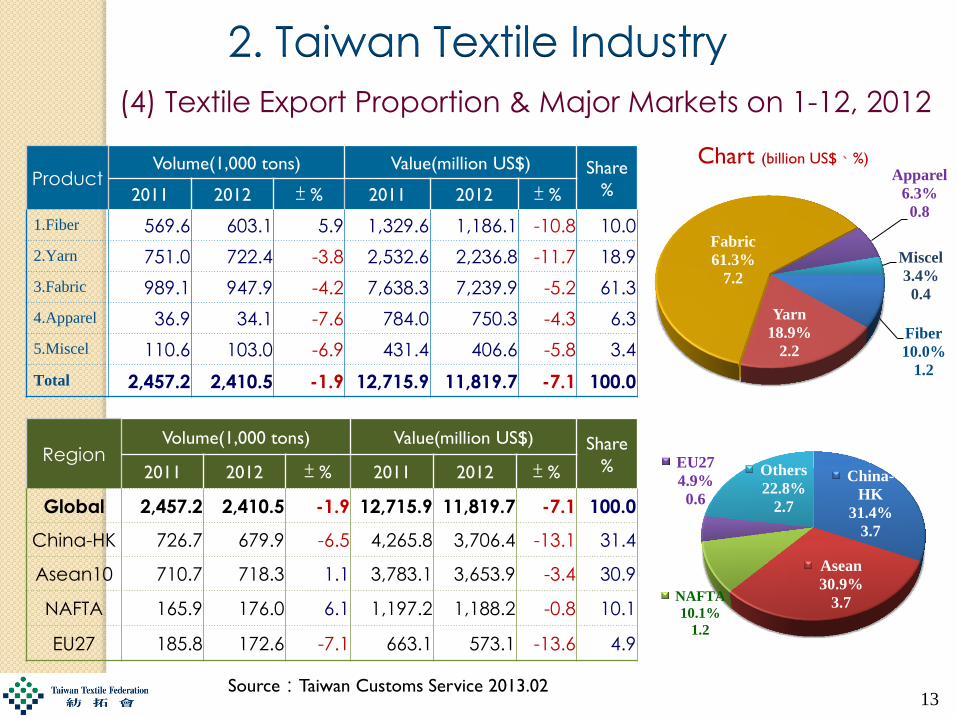
Source:Taiwan Customs Service 2013.02
(4) Textile Export Proportion & Major Markets on 1-12, 2012
13
Product Volume(1,000 tons) Value(million US$) Share
% 2011 2012 ± % 2011 2012 ± %
1.Fiber 569.6 603.1 5.9 1,329.6 1,186.1 -10.8 10.0
2.Yarn 751.0 722.4 -3.8 2,532.6 2,236.8 -11.7 18.9
3.Fabric 989.1 947.9 -4.2 7,638.3 7,239.9 -5.2 61.3
4.Apparel 36.9 34.1 -7.6 784.0 750.3 -4.3 6.3
5.Miscel 110.6 103.0 -6.9 431.4 406.6 -5.8 3.4
Total 2,457.2 2,410.5 -1.9 12,715.9 11,819.7 -7.1 100.0
Region Volume(1,000 tons) Value(million US$) Share
% 2011 2012 ± % 2011 2012 ± %
Global 2,457.2 2,410.5 -1.9 12,715.9 11,819.7 -7.1 100.0
China-HK 726.7 679.9 -6.5 4,265.8 3,706.4 -13.1 31.4
Asean10 710.7 718.3 1.1 3,783.1 3,653.9 -3.4 30.9
NAFTA 165.9 176.0 6.1 1,197.2 1,188.2 -0.8 10.1
EU27 185.8 172.6 -7.1 663.1 573.1 -13.6 4.9
2. Taiwan Textile Industry
Fiber
10.0%
1.2
Yarn
18.9%
2.2
Fabric
61.3%
7.2
Apparel
6.3%
0.8
Miscel
3.4%
0.4
China-
HK
31.4%
3.7
Asean
30.9%
3.7 NAFTA
10.1%
1.2
EU27
4.9%
0.6
Others
22.8%
2.7
Chart (billion US$、%)
0
50
100
150
200
250
300
1990 1991 1992 1993 1994 1995 1996 1997 1998 1999 2000 2001 2002 2003 2004 2005 2006 2007 2008 2009 2010 2011
French-Apparel Germany-Apparel Italy-ApparelFrench-Textile Germany-Textile Italy-Textile
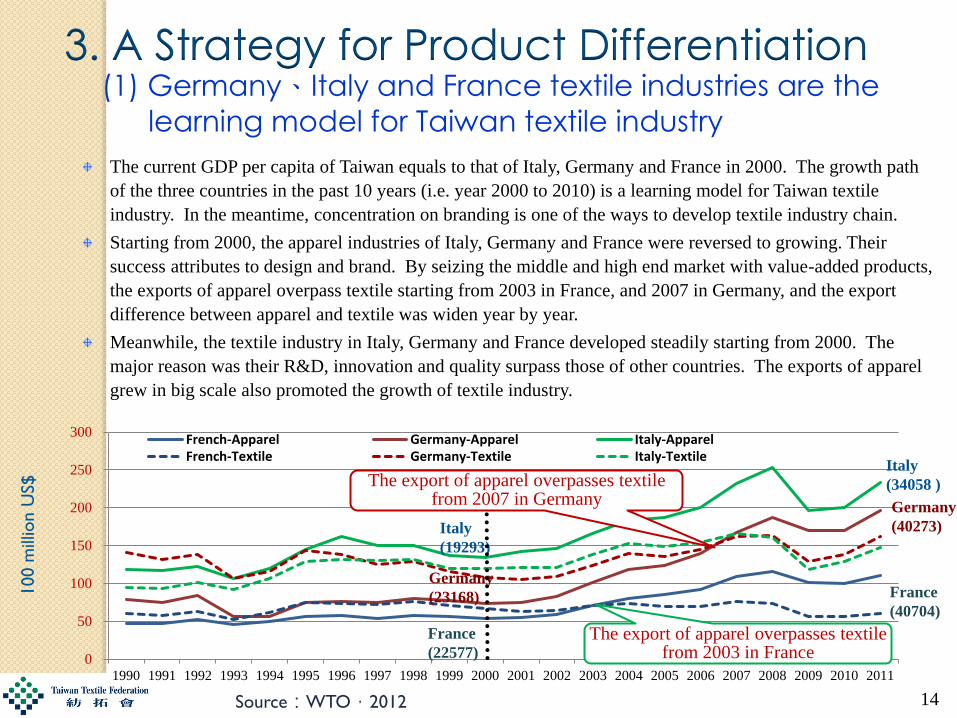
(1) Germany、Italy and France textile industries are the
learning model for Taiwan textile industry
The current GDP per capita of Taiwan equals to that of Italy, Germany and France in 2000. The growth path
of the three countries in the past 10 years (i.e. year 2000 to 2010) is a learning model for Taiwan textile
industry. In the meantime, concentration on branding is one of the ways to develop textile industry chain.
Starting from 2000, the apparel industries of Italy, Germany and France were reversed to growing. Their
success attributes to design and brand. By seizing the middle and high end market with value-added products,
the exports of apparel overpass textile starting from 2003 in France, and 2007 in Germany, and the export
difference between apparel and textile was widen year by year.
Meanwhile, the textile industry in Italy, Germany and France developed steadily starting from 2000. The
major reason was their R&D, innovation and quality surpass those of other countries. The exports of apparel
grew in big scale also promoted the growth of textile industry.
Italy
(19293)
France
(22577)
Germany
(23168)
Italy
(34058 )
Germany
(40273)
France
(40704)
The export of apparel overpasses textile from 2003 in France
The export of apparel overpasses textile from 2007 in Germany
3. A Strategy for Product Differentiation
14 Source:WTO,2012
100 m
illio
n U
S$
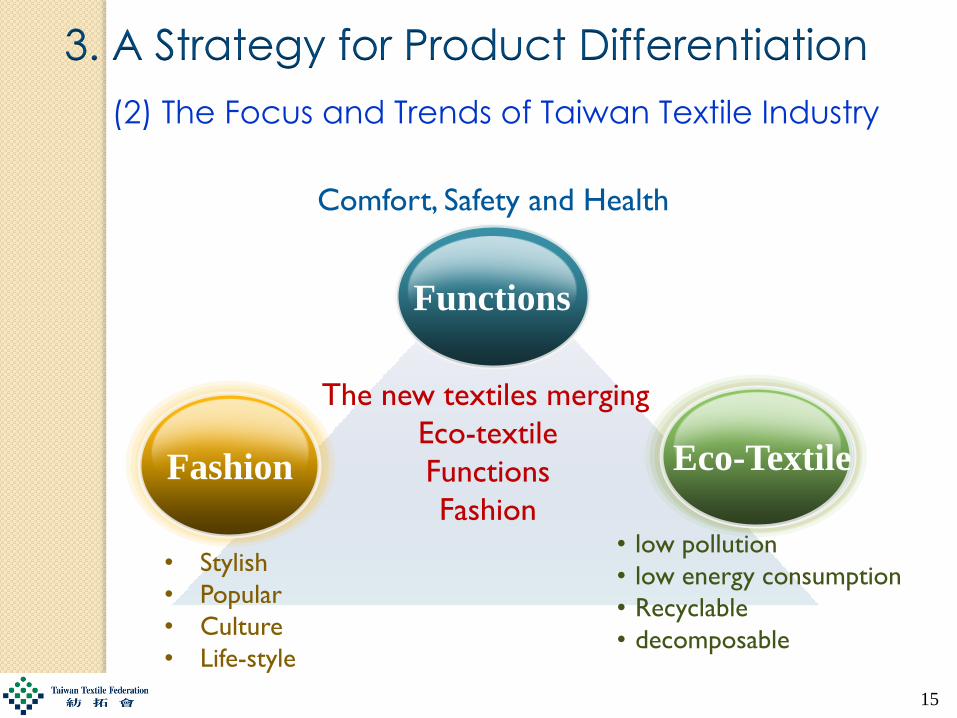
Comfort, Safety and Health
• Stylish
• Popular
• Culture
• Life-style
• low pollution
• low energy consumption
• Recyclable
• decomposable
Functions
Fashion Eco-Textile
(2) The Focus and Trends of Taiwan Textile Industry
The new textiles merging
Eco-textile
Functions
Fashion
3. A Strategy for Product Differentiation
15
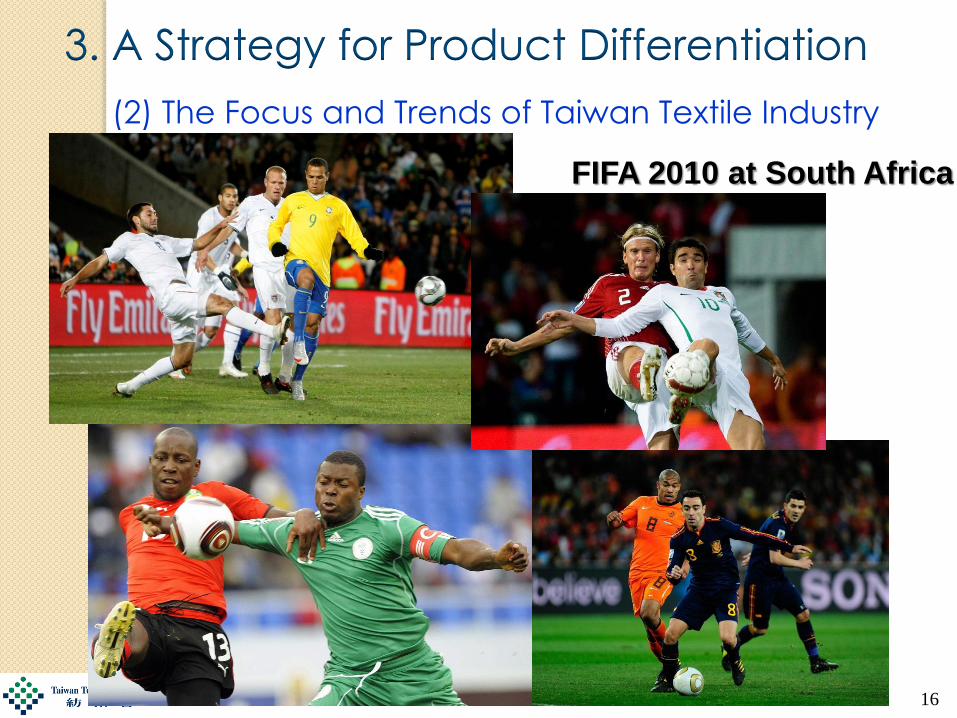
(2) The Focus and Trends of Taiwan Textile Industry
3. A Strategy for Product Differentiation
FIFA 2010 at South Africa
16
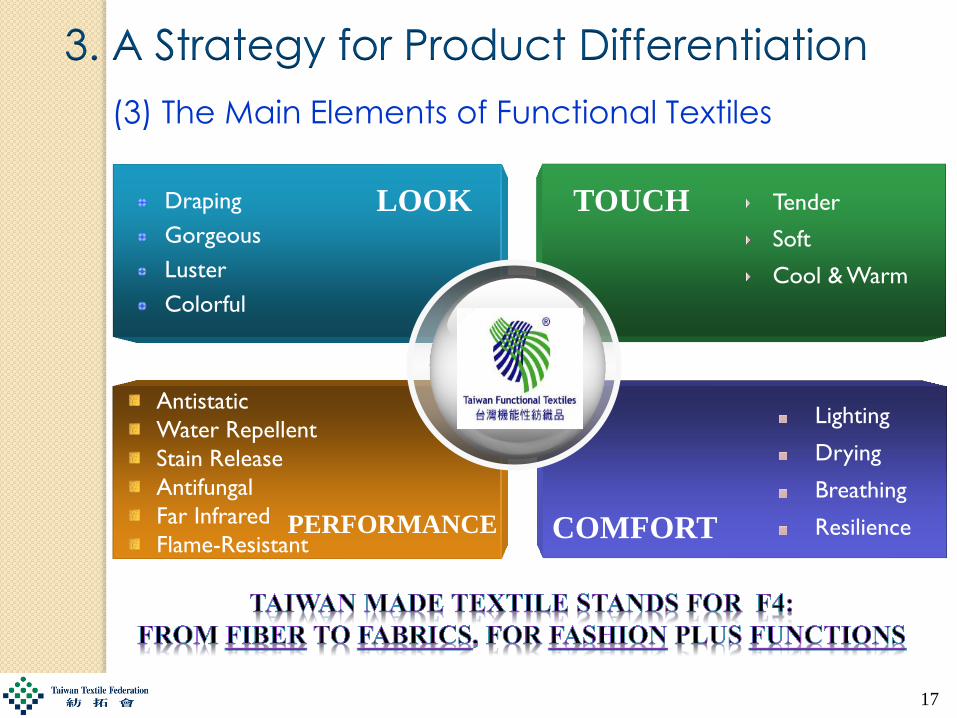
(3) The Main Elements of Functional Textiles
17
LOOK TOUCH
PERFORMANCE COMFORT
Antistatic
Water Repellent
Stain Release
Antifungal
Far Infrared
Flame-Resistant
Draping
Gorgeous
Luster
Colorful
Tender
Soft
Cool & Warm
Lighting
Drying
Breathing
Resilience
3. A Strategy for Product Differentiation
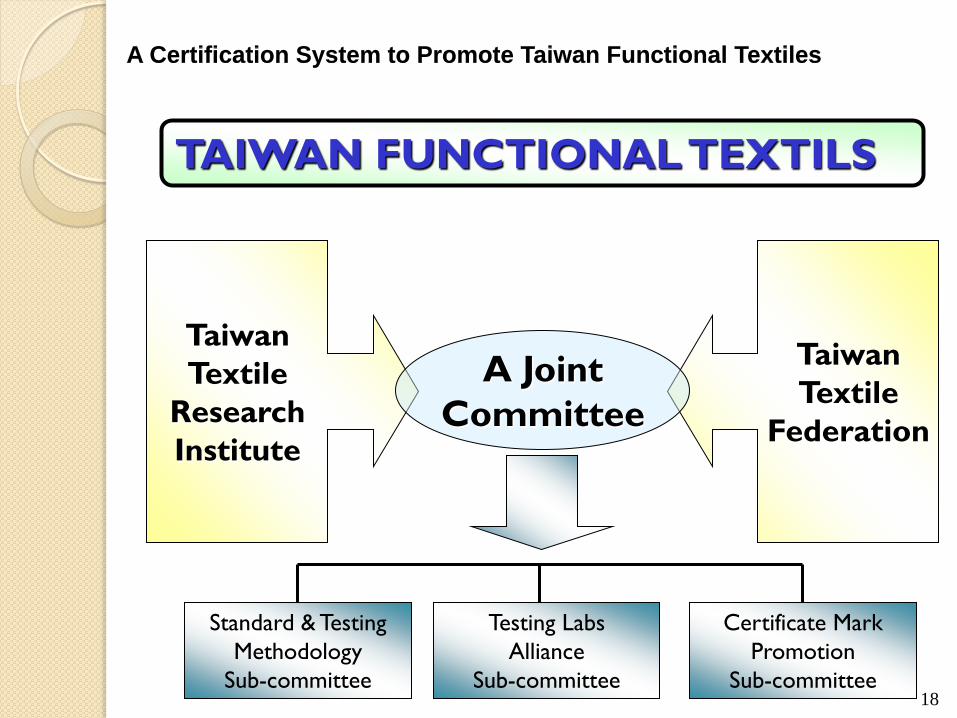
Taiwan
Textile
Research
Institute
Taiwan
Textile
Federation
A Joint
Committee
Standard & Testing
Methodology
Sub-committee
Testing Labs
Alliance
Sub-committee
Certificate Mark
Promotion
Sub-committee
TAIWAN FUNCTIONAL TEXTILS
A Certification System to Promote Taiwan Functional Textiles
18
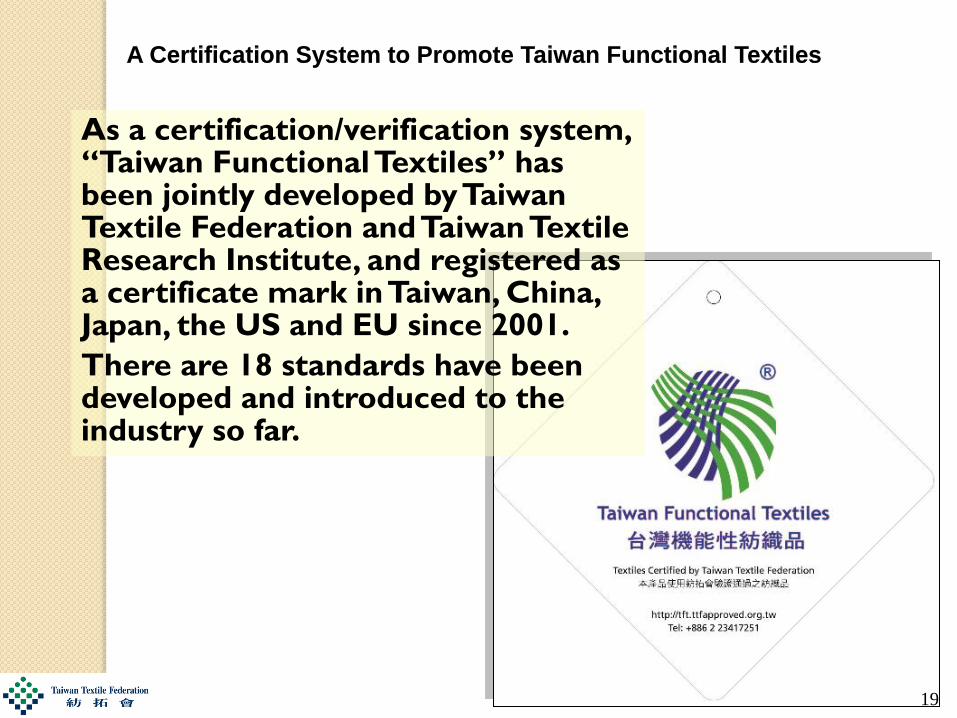
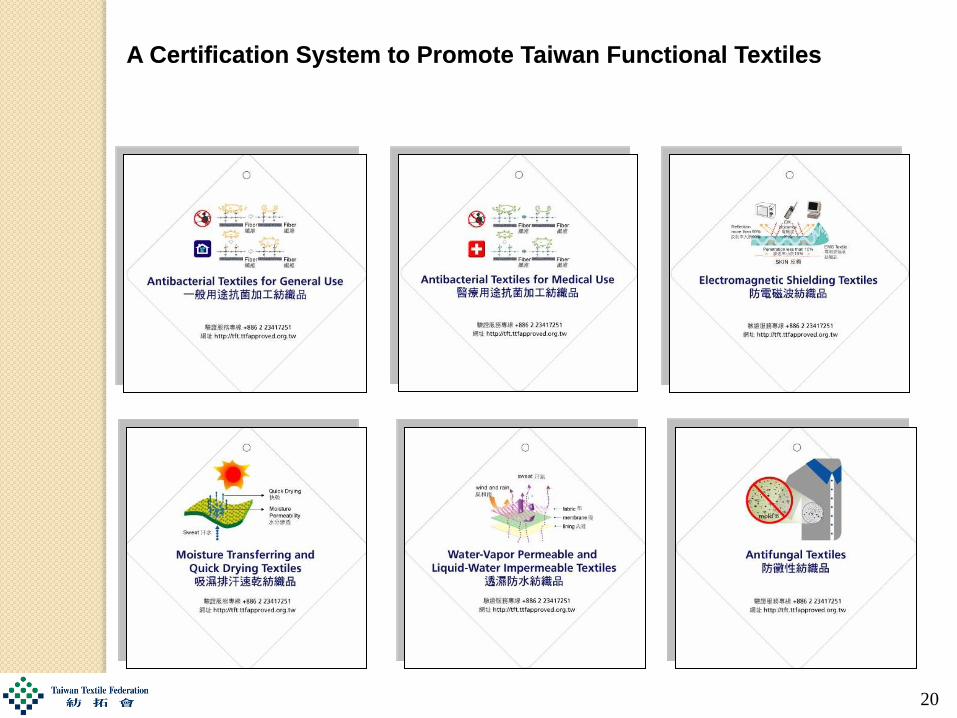
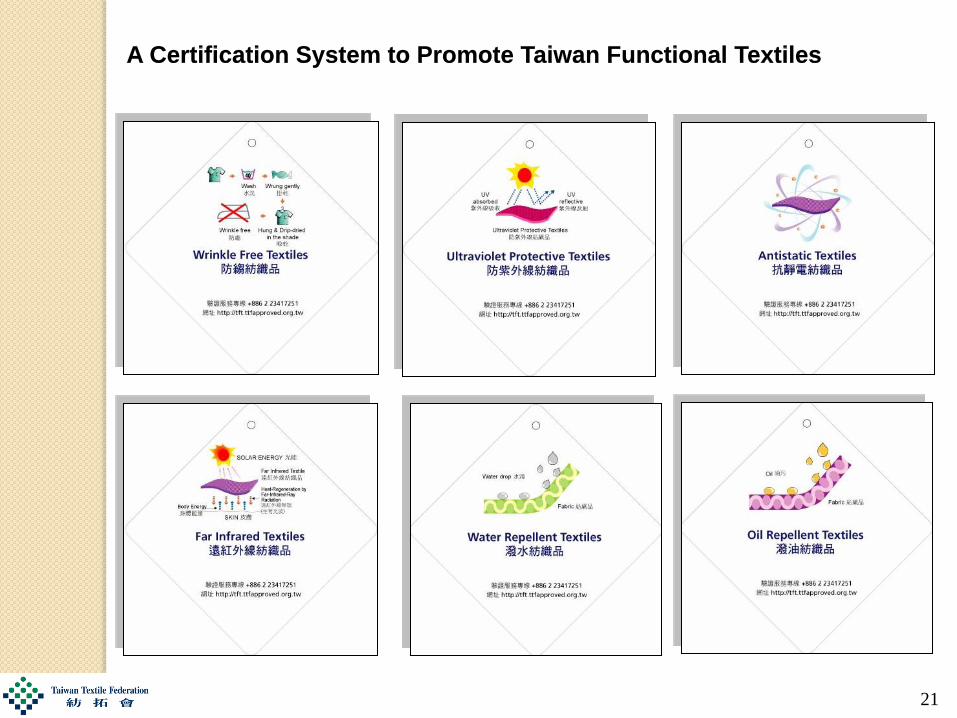
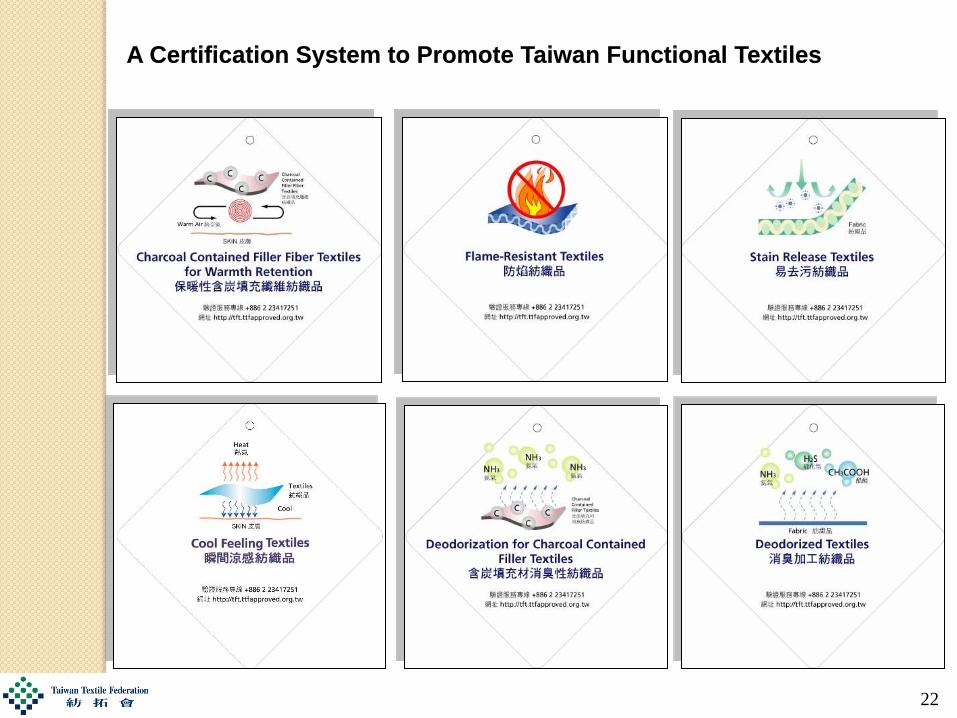
As a certification/verification system, “Taiwan Functional Textiles” has been jointly developed by Taiwan Textile Federation and Taiwan Textile Research Institute, and registered as a certificate mark in Taiwan, China, Japan, the US and EU since 2001.
There are 18 standards have been developed and introduced to the industry so far.
A Certification System to Promote Taiwan Functional Textiles
19
A Certification System to Promote Taiwan Functional Textiles
20
A Certification System to Promote Taiwan Functional Textiles
21
A Certification System to Promote Taiwan Functional Textiles
22
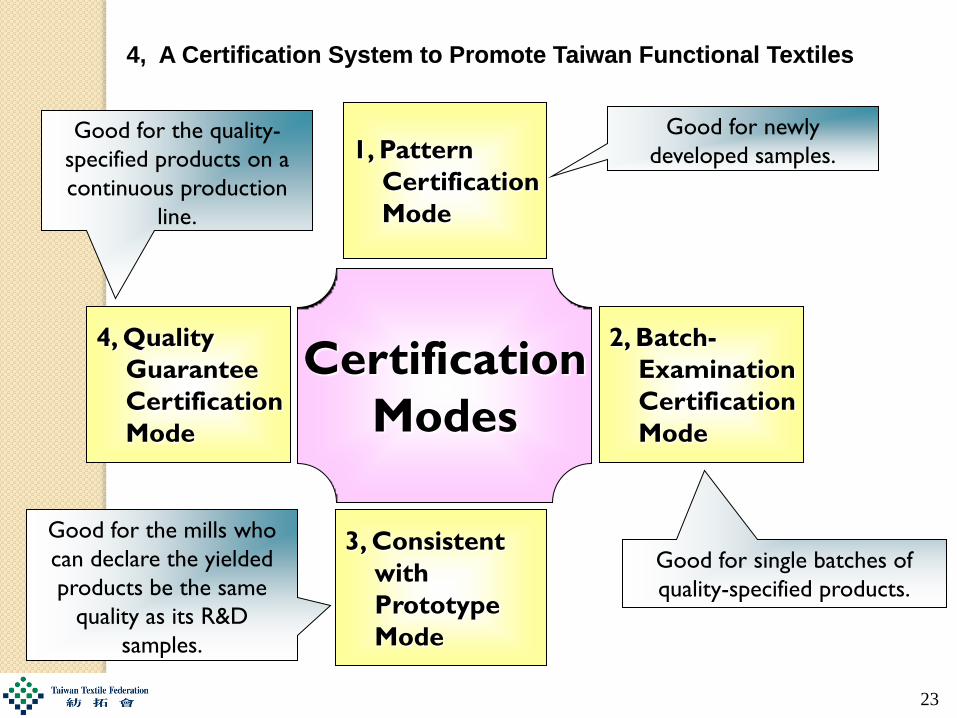
4, A Certification System to Promote Taiwan Functional Textiles
Certification
Modes
2, Batch-
Examination
Certification
Mode
3, Consistent
with
Prototype
Mode
4, Quality
Guarantee
Certification
Mode
1, Patter
Certification
Mode
4, Quality
Guarantee
Certification
Mode
1, Patter
Certification
Mode
2, Batch-
Examination
Certification
Mode
4, Quality
Guarantee
Certification
Mode
1, Patter
Certification
Mode
3, Consistent
with
Prototype
Mode
2, Batch-
Examination
Certification
Mode
4, Quality
Guarantee
Certification
Mode
1, Patter
Certification
Mode
2, Batch-
Examination
Certification
Mode
1, Patter
Certification
Mode
3, Consistent
with
Prototype
Mode
2, Batch-
Examination
Certification
Mode
1, Patter
Certification
Mode
4, Quality
Guarantee
Certification
Mode
3, Consistent
with
Prototype
Mode
2, Batch-
Examination
Certification
Mode
1, Pattern
Certification
Mode
Good for newly
developed samples.
Good for single batches of
quality-specified products.
Good for the mills who
can declare the yielded
products be the same
quality as its R&D
samples.
Good for the quality-
specified products on a
continuous production
line.
23
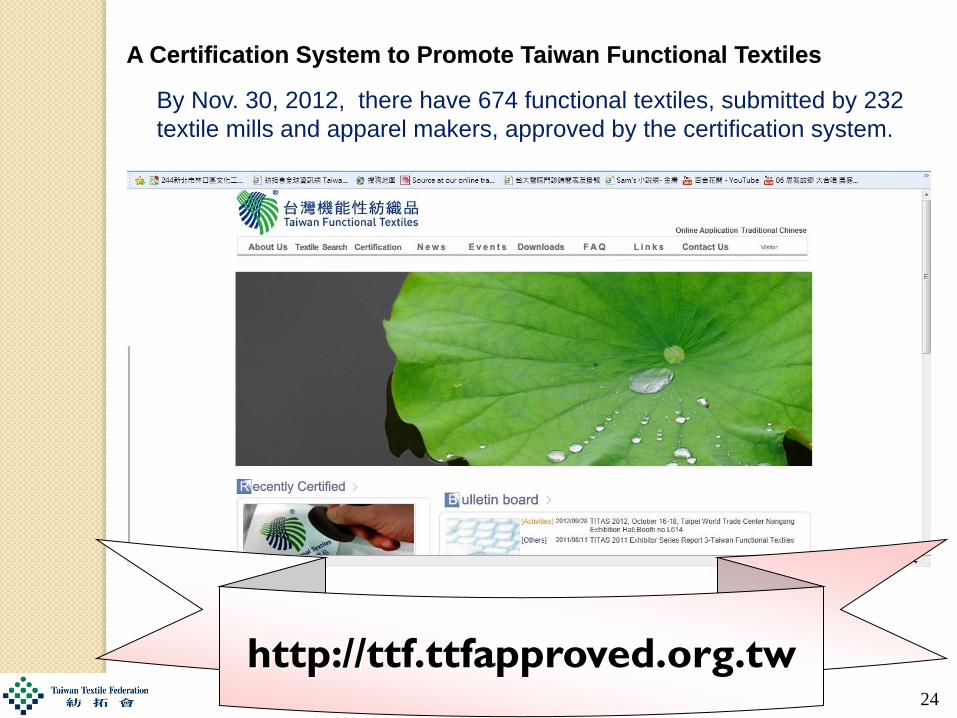
http://ttf.ttfapproved.org.tw
By Nov. 30, 2012, there have 674 functional textiles, submitted by 232
textile mills and apparel makers, approved by the certification system.
A Certification System to Promote Taiwan Functional Textiles
24
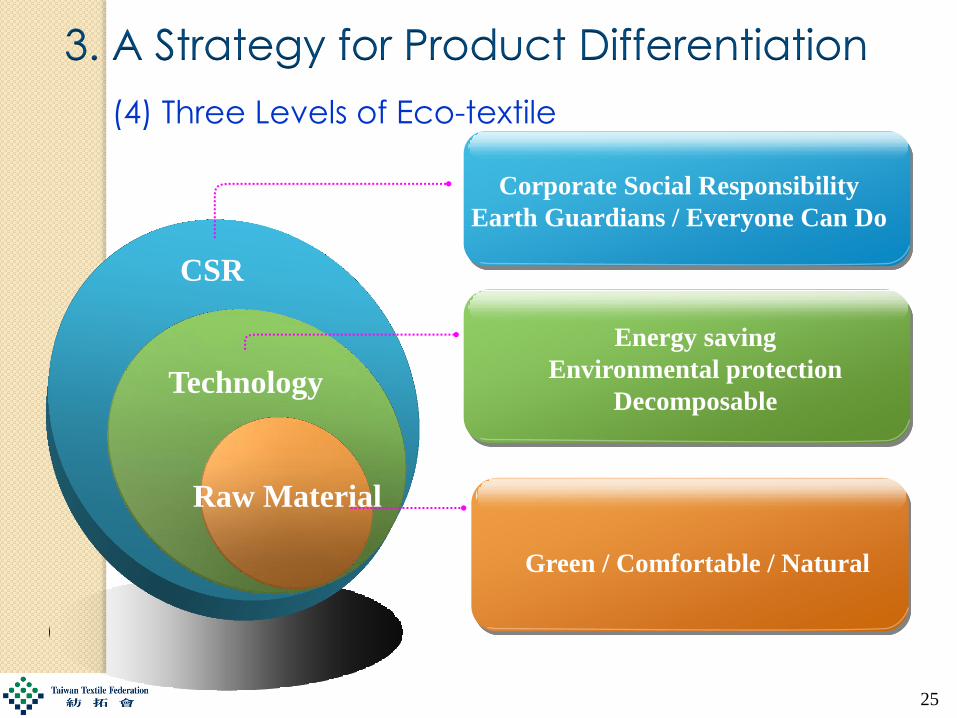
Corporate Social Responsibility
Earth Guardians / Everyone Can Do
Energy saving
Environmental protection
Decomposable
Green / Comfortable / Natural
CSR
Technology
Raw Material
(4) Three Levels of Eco-textile
25
3. A Strategy for Product Differentiation
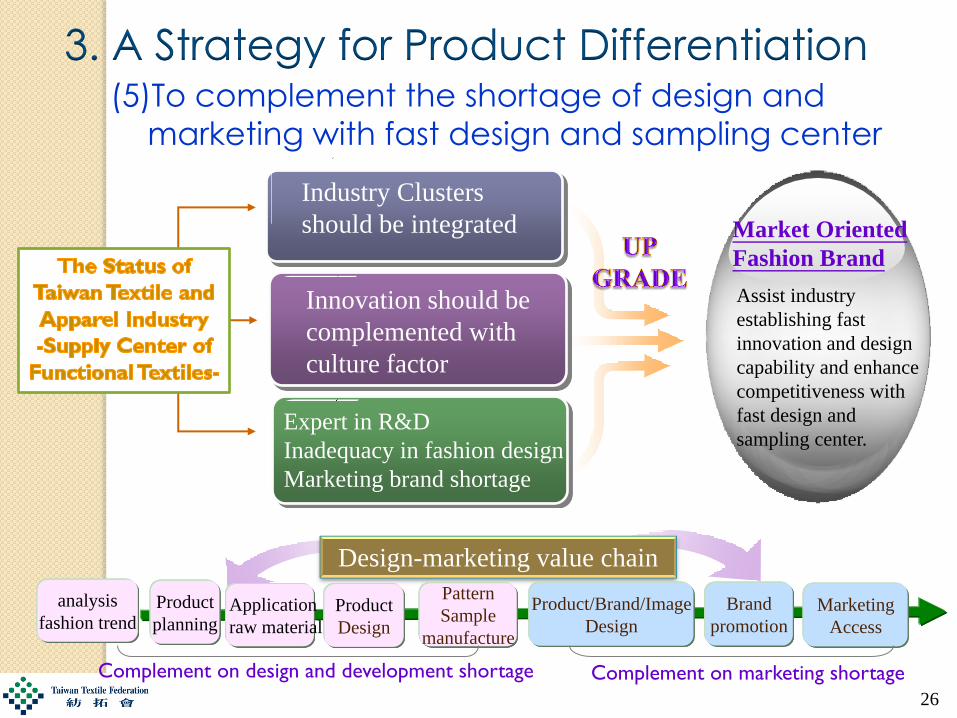
(5)To complement the shortage of design and
marketing with fast design and sampling center
Design-marketing value chain
analysis
fashion trend
Product
planning Application
raw material
Product
Design
Pattern
Sample
manufacture
Product/Brand/Image
Design
Brand
promotion
Marketing
Access
Complement on design and development shortage Complement on marketing shortage
26
Market Oriented
Fashion Brand
Industry Clusters
should be integrated
Innovation should be
complemented with
culture factor
3. A Strategy for Product Differentiation
Expert in R&D
Inadequacy in fashion design
Marketing brand shortage
Assist industry
establishing fast
innovation and design
capability and enhance
competitiveness with
fast design and
sampling center.
27
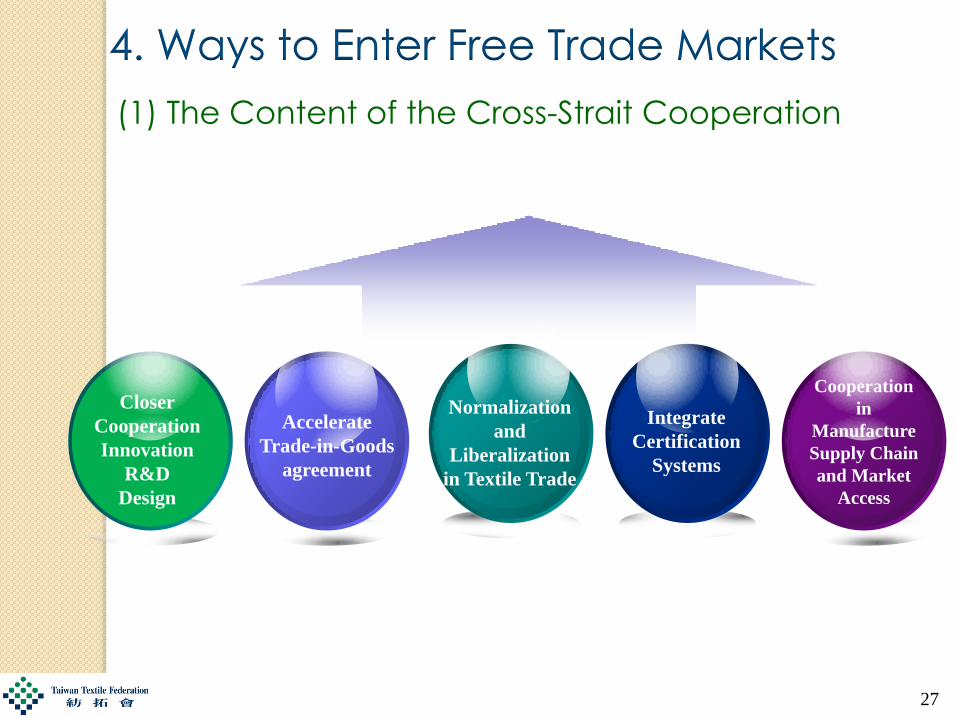
Accelerate
Trade-in-Goods
agreement
Normalization
and
Liberalization
in Textile Trade
Integrate
Certification
Systems
Cooperation
in
Manufacture
Supply Chain
and Market
Access
Closer
Cooperation
Innovation
R&D
Design
4. Ways to Enter Free Trade Markets
(1) The Content of the Cross-Strait Cooperation
27
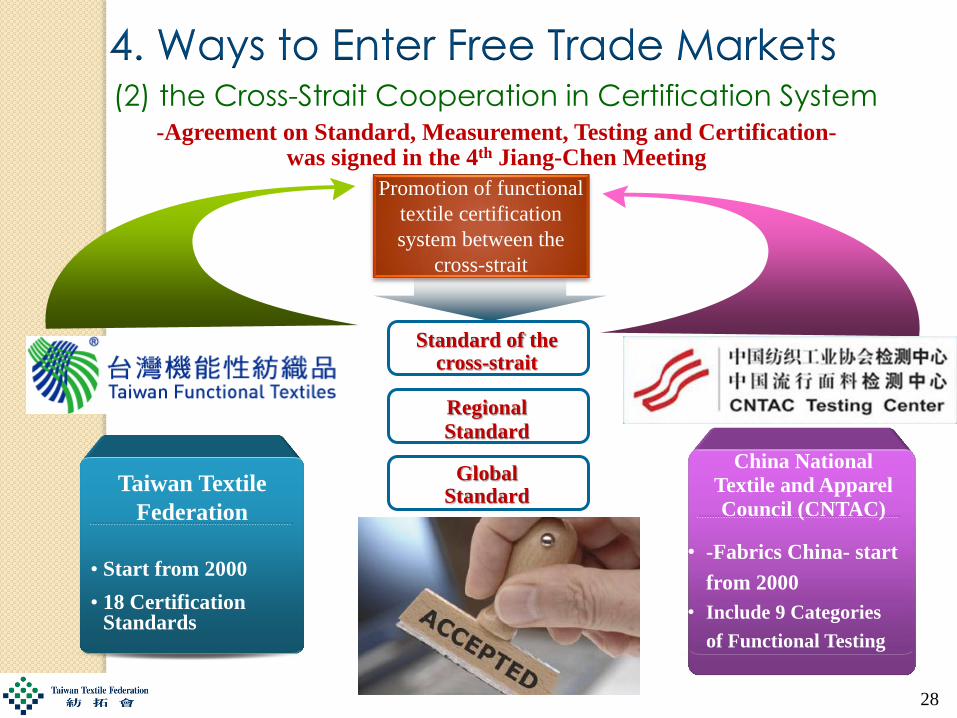
-Agreement on Standard, Measurement, Testing and Certification- was signed in the 4th Jiang-Chen Meeting
Promotion of functional
textile certification
system between the
cross-strait
• Start from 2000
• 18 Certification Standards
Taiwan Textile
Federation
China National
Textile and Apparel
Council (CNTAC)
• -Fabrics China- start
from 2000
• Include 9 Categories
of Functional Testing
Standard of the cross-strait
Regional
Standard
Global Standard
(2) the Cross-Strait Cooperation in Certification System
28
4. Ways to Enter Free Trade Markets
2,161.7
1,883.0
1,541.7 1,294.9
846.7 970.8 942.5
228.0
250.6 228.4 237.5
157.1
271.4 257.0
50
100
150
200
250
300
350
400
0
500
1,000
1,500
2,000
2,500
3,000
3,500
2001 2002 2003 2004 2005 2006 2007 2008 2009 2010 2011 2012
Taiwan export to USA USA export to Taiwan
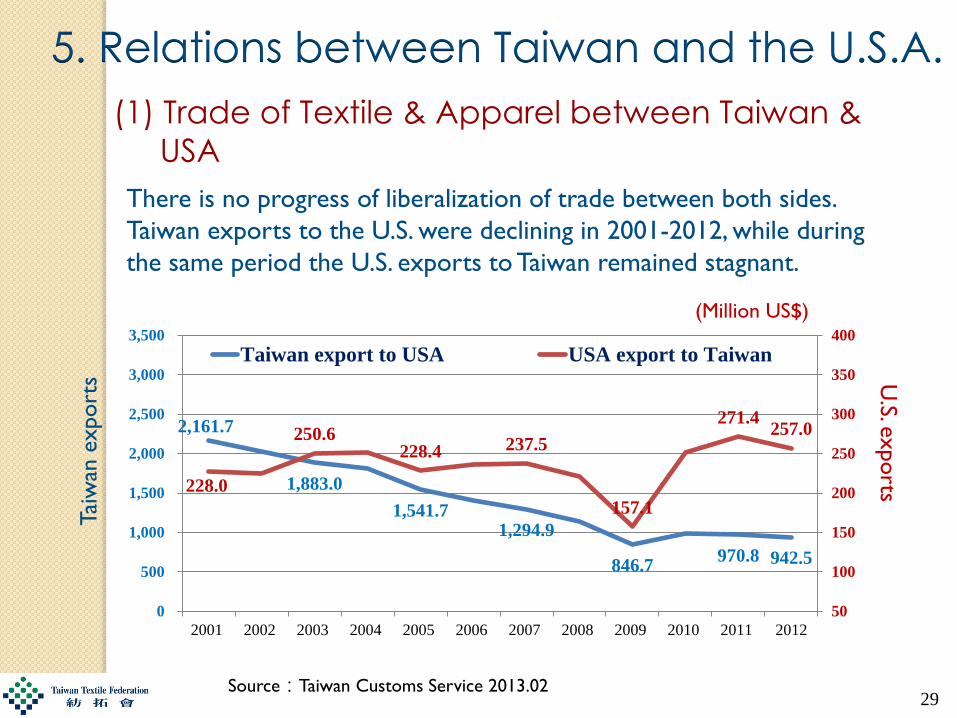
5. Relations between Taiwan and the U.S.A.
(1) Trade of Textile & Apparel between Taiwan &
USA
There is no progress of liberalization of trade between both sides.
Taiwan exports to the U.S. were declining in 2001-2012, while during
the same period the U.S. exports to Taiwan remained stagnant.
Source:Taiwan Customs Service 2013.02
(Million US$)
Tai
wan
export
s
U.S. e
xports
29
5. Relations between Taiwan and the U.S.A.
(2) TIFA (Trade and Investment Framework Agreement)
Effective date:September, 1994
Function: The official platform to promote trade, investment and business
cooperation for both sides. It’s also the consultative channel to resolve the
economic and trade issues.
Since 2008, however, TIFA meetings have been suspended due to U.S. beef
issues.
Ed Royce, Chairman of the Foreign Relations Committee of the U.S. House
of Representatives, Interviewed by the media in Taiwan on Jan. 27 2013
suggested that Taiwan-US should restart TIFA, to solve the problem
through negotiations; "The first step is TIFA, then a free trade agreement
(FTA), the ultimate is to allow Taiwan to join the Trans-Pacific Partnership
Agreement (TPP).”
30