1 gene ontology and semantic similarity measures
TRANSCRIPT
1
Gene Ontology and Semantic Similarity
Measures
2
Copyright notice
• Many of the images in this power point presentation are from Bioinformatics and Functional Genomics by Jonathan Pevsner (ISBN 0-471-21004-8). Copyright © 2003 by John Wiley & Sons, Inc.
• Many slides of this power point presentation Are from slides of Dr. Jonathon Pevsner and other people. The Copyright belong to the original authors. Thanks!
What is Ontology?
• Dictionary: A branch of metaphysics concerned with the nature and relations of being.
• Barry Smith: The science of what is, of the kinds and structures of objects, properties, events, processes and relations in every area of reality.
16061700s
Sriniga Srinivasan, Chief Ontologist, Yahoo!
The ontology. Dividing human knowledge into a clean set of categories is a lot like trying to figure out where to find that suspenseful black comedy at your corner video store. Questions inevitably come up, like are Movies part of Art or Entertainment? (Yahoo! lists them under the latter.) -Wired Magazine, May 1996
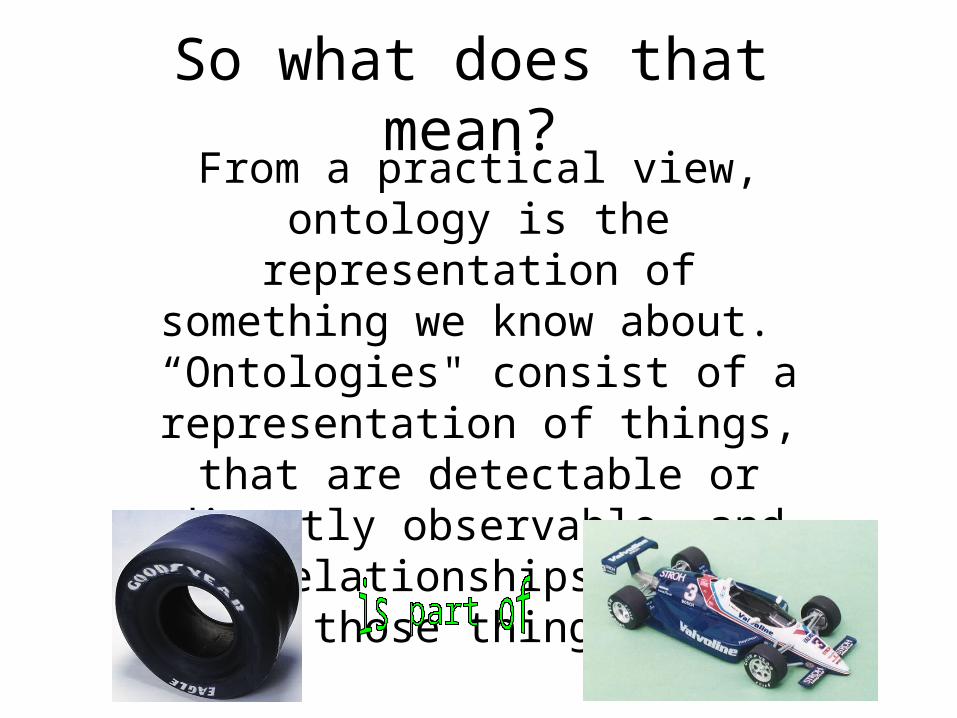
So what does that mean?From a practical view, ontology is the representation of something we know about. “Ontologies" consist of a representation of things, that are detectable or directly observable, and the relationships between those
things.
6
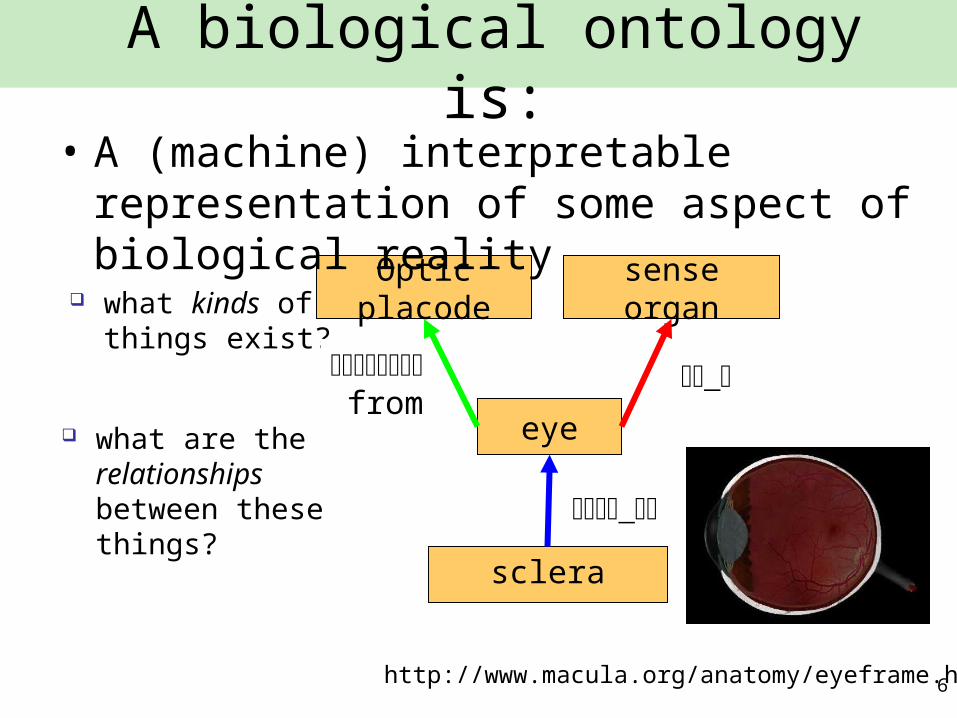
what kinds of things exist?
what are the relationships between these things?
eye
_part of
sclera
_is a
sense organ
developsfrom
Optic placode
A biological ontology is:
• A (machine) interpretable representation of some aspect of biological reality
http://www.macula.org/anatomy/eyeframe.html
7
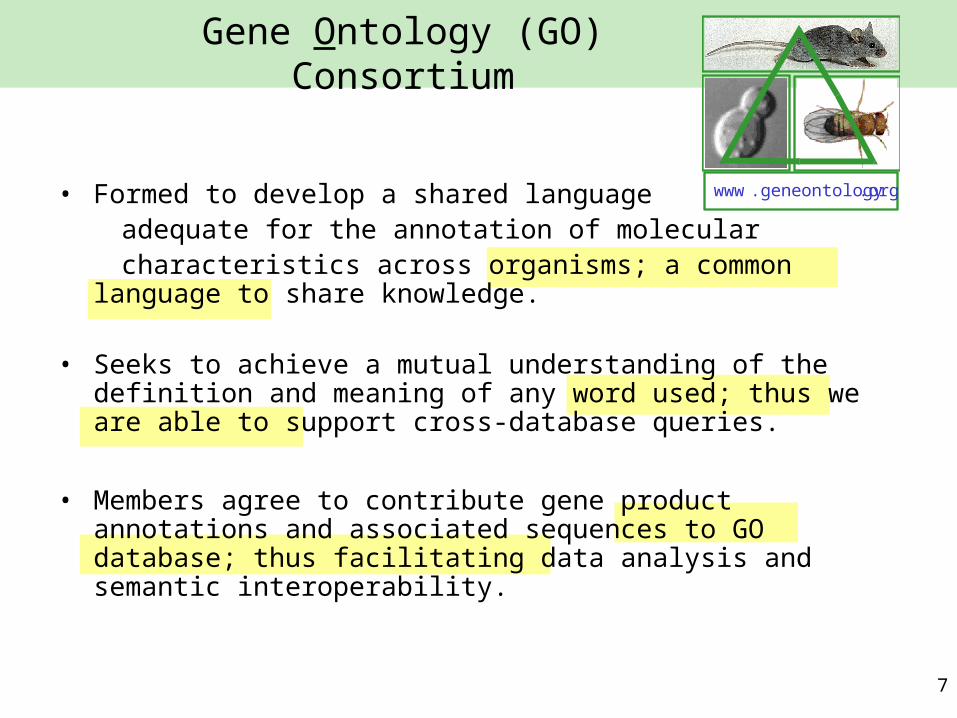
Gene Ontology (GO) Consortium
aa
www.geneontology.org• Formed to develop a shared language adequate for the annotation of molecular characteristics across organisms; a common language to share
knowledge.
• Seeks to achieve a mutual understanding of the definition and meaning of any word used; thus we are able to support cross-database queries.
• Members agree to contribute gene product annotations and associated sequences to GO database; thus facilitating data analysis and semantic interoperability.
8
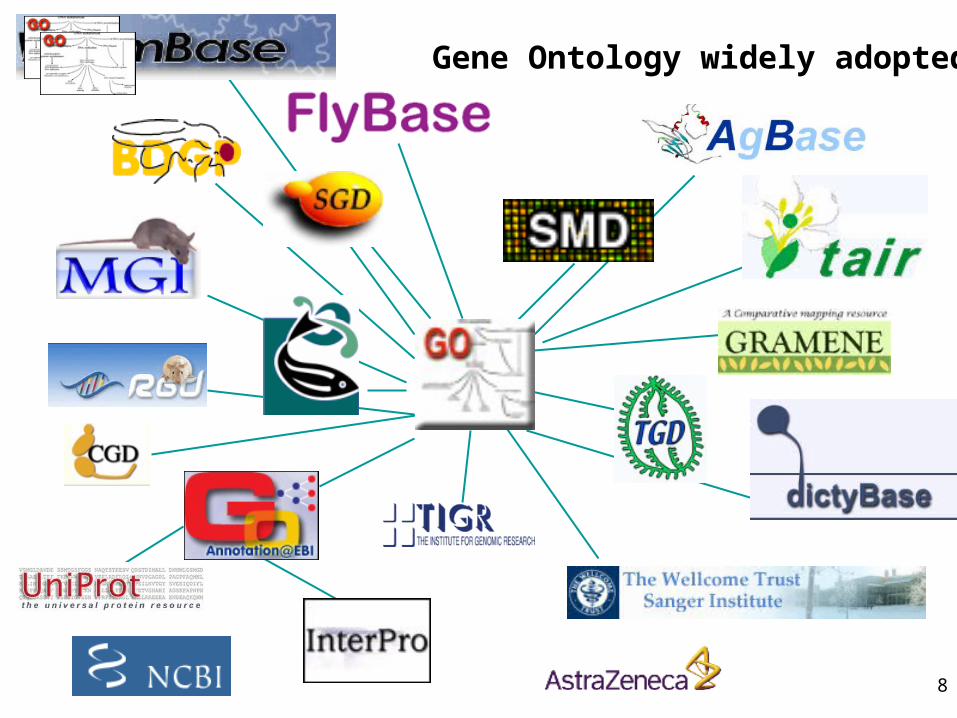
Gene Ontology widely adopted
AgBase
9
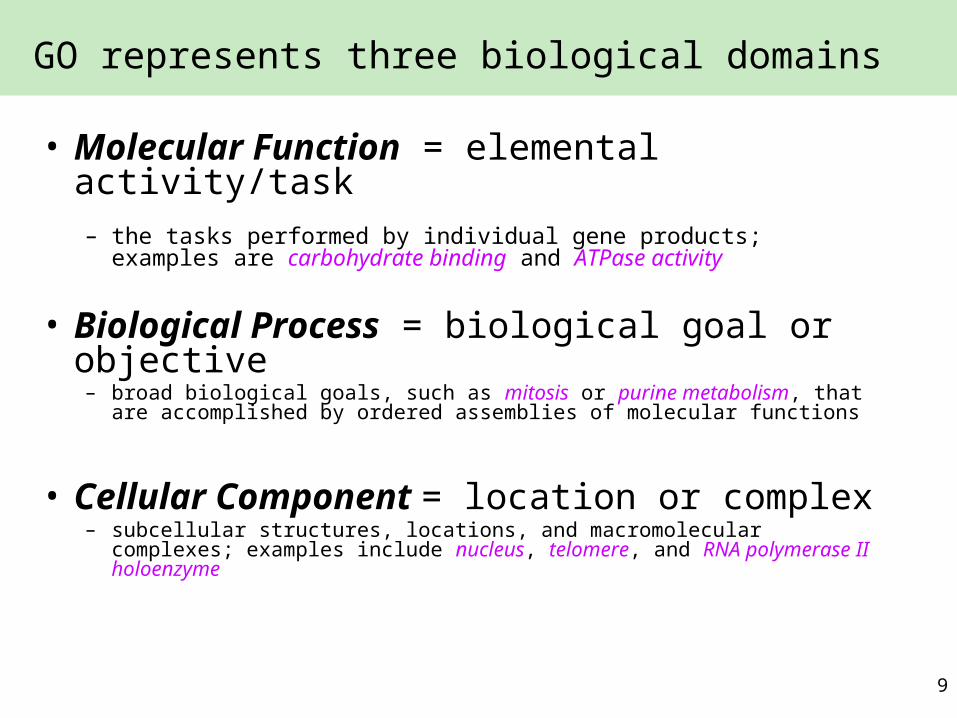
• Molecular Function = elemental activity/task– the tasks performed by individual gene products; examples are
carbohydrate binding and ATPase activity
• Biological Process = biological goal or objective– broad biological goals, such as mitosis or purine metabolism, that are
accomplished by ordered assemblies of molecular functions
• Cellular Component = location or complex– subcellular structures, locations, and macromolecular complexes;
examples include nucleus, telomere, and RNA polymerase II holoenzyme
GO represents three biological domains
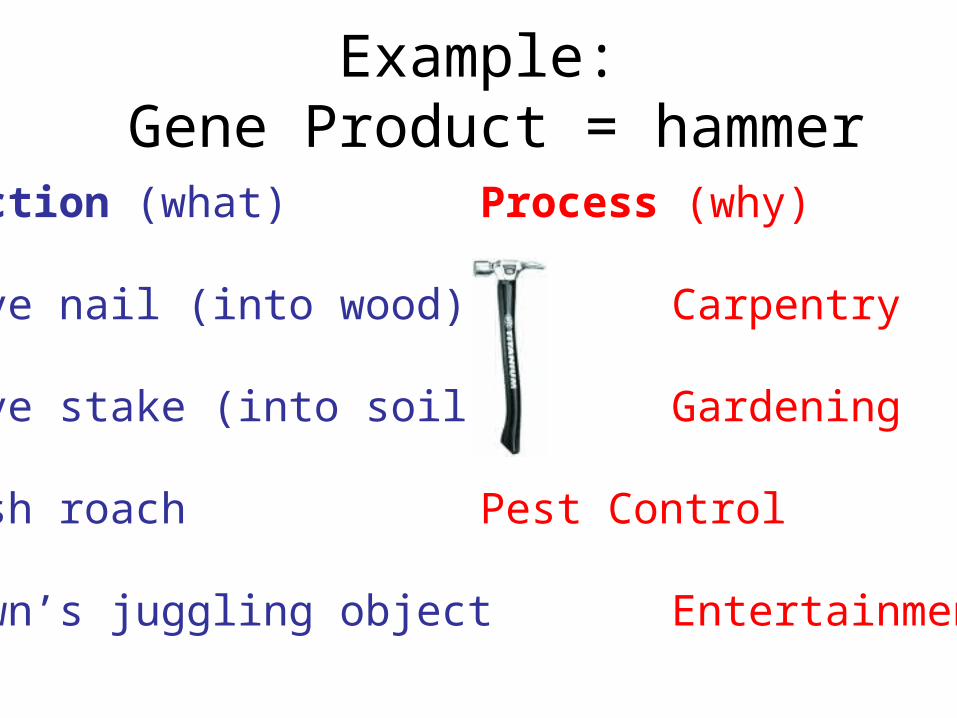
Function (what) Process (why)
Drive nail (into wood) Carpentry
Drive stake (into soil) Gardening
Smash roach Pest Control
Clown’s juggling object Entertainment
Example: Gene Product = hammer

Biological ExamplesMolecular FunctionMolecular FunctionBiological ProcessBiological Process Cellular ComponentCellular Component
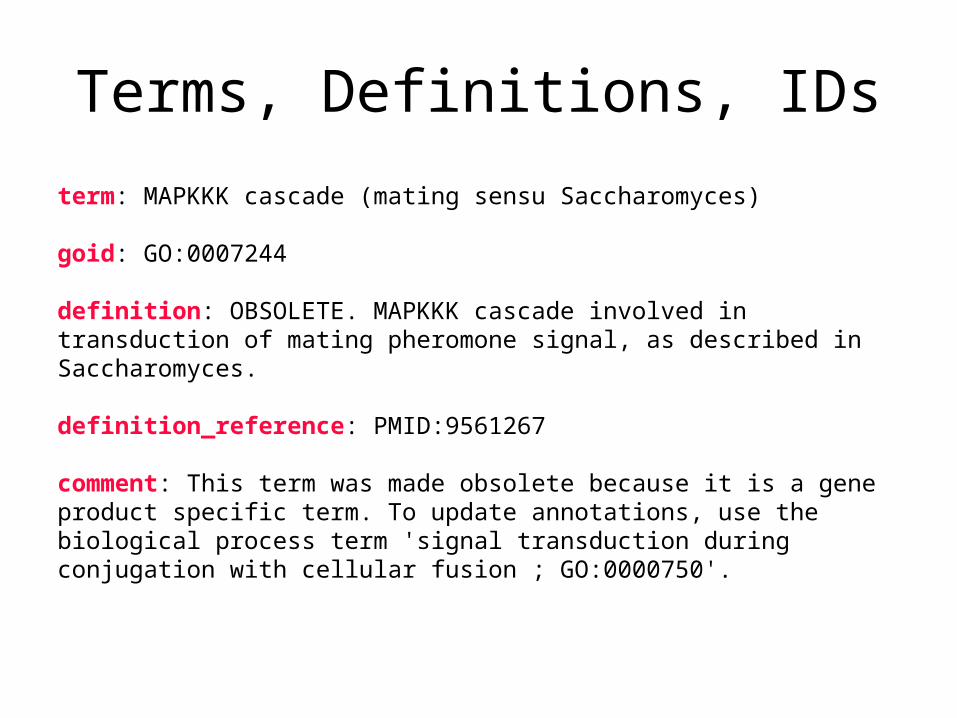
term: MAPKKK cascade (mating sensu Saccharomyces)
goid: GO:0007244
definition: OBSOLETE. MAPKKK cascade involved in transduction of mating pheromone signal, as described in Saccharomyces.
definition_reference: PMID:9561267
comment: This term was made obsolete because it is a gene product specific term. To update annotations, use the biological process term 'signal transduction during conjugation with cellular fusion ; GO:0000750'.
Terms, Definitions, IDs
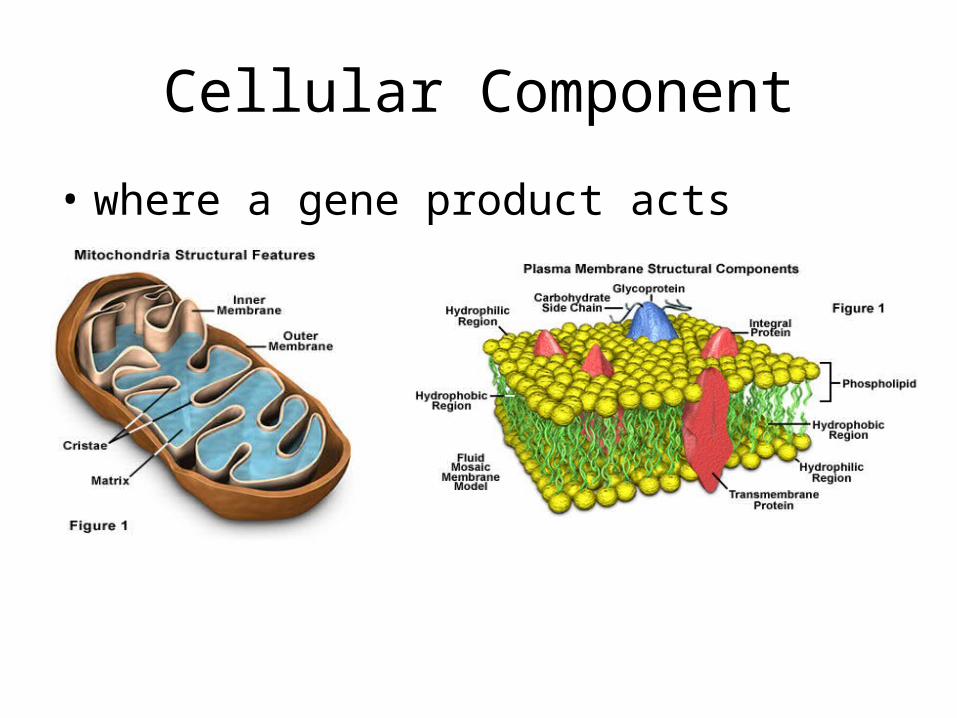
Cellular Component
• where a gene product acts
Molecular Function
• A gene product may have several functions; a function term refers to a reaction or activity, not a gene product
• Sets of functions make up a biological process
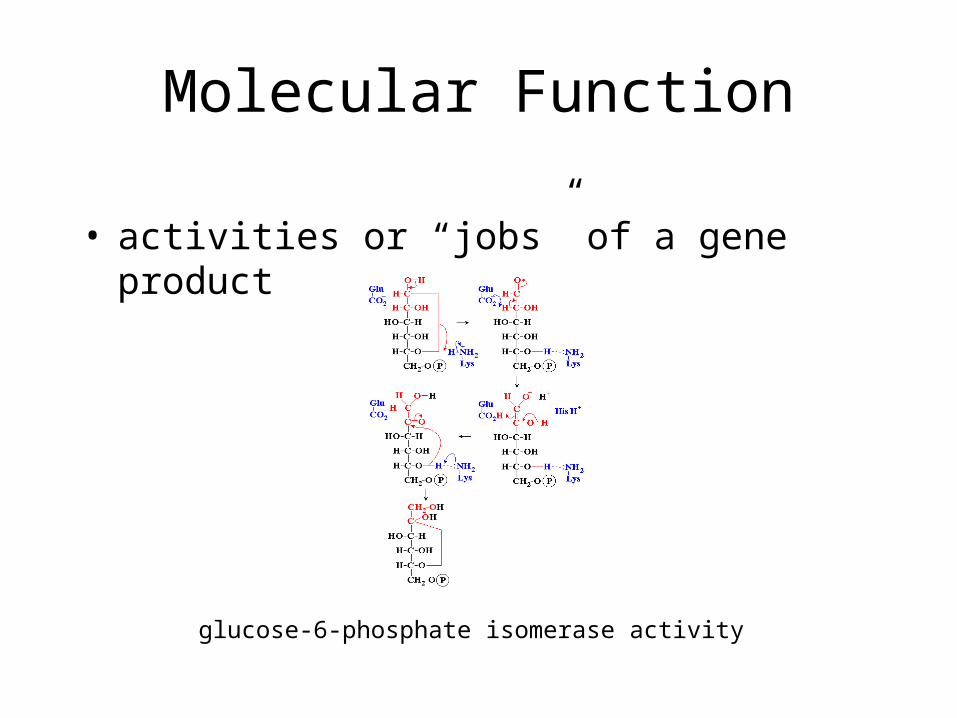
Molecular Function
• activities or “jobs” of a gene product
glucose-6-phosphate isomerase activity
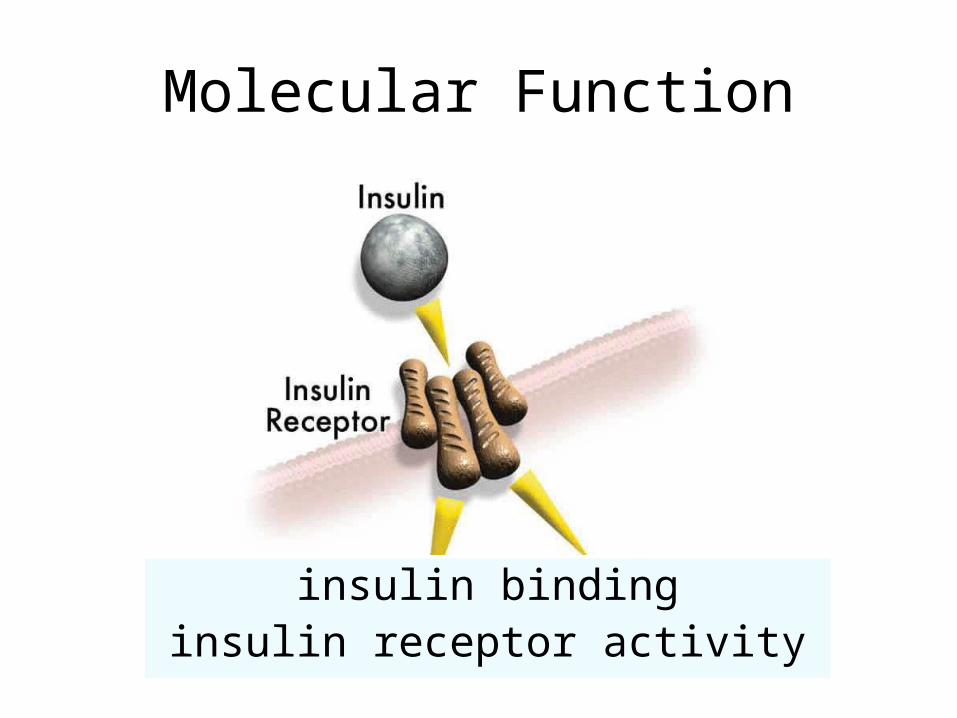
Molecular Function
insulin bindinginsulin receptor activity
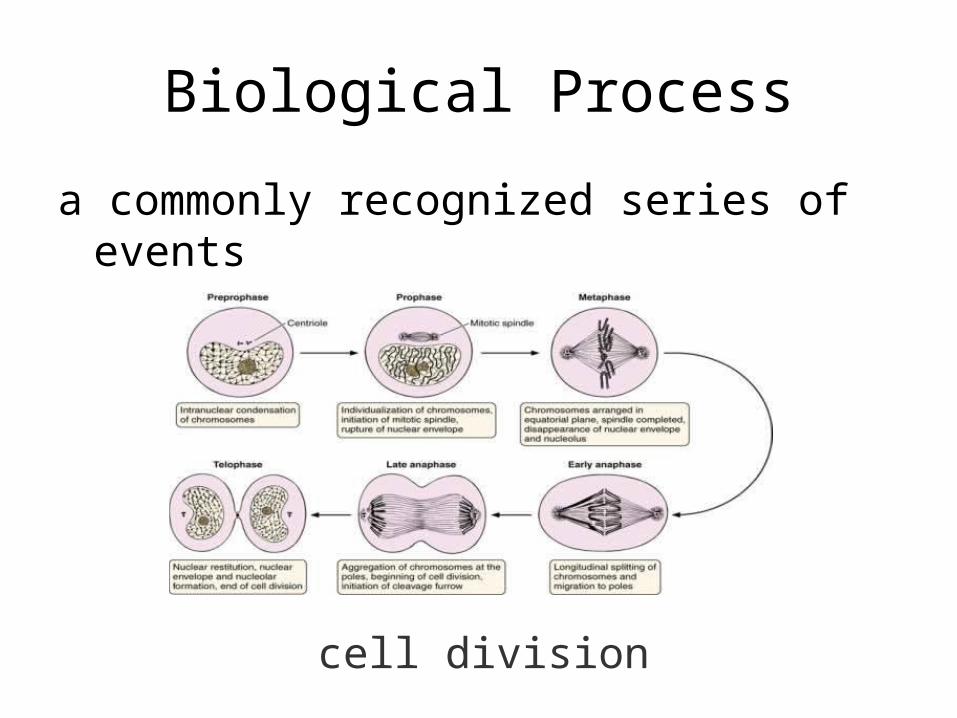
Biological Process
a commonly recognized series of events
cell division
Biological Process
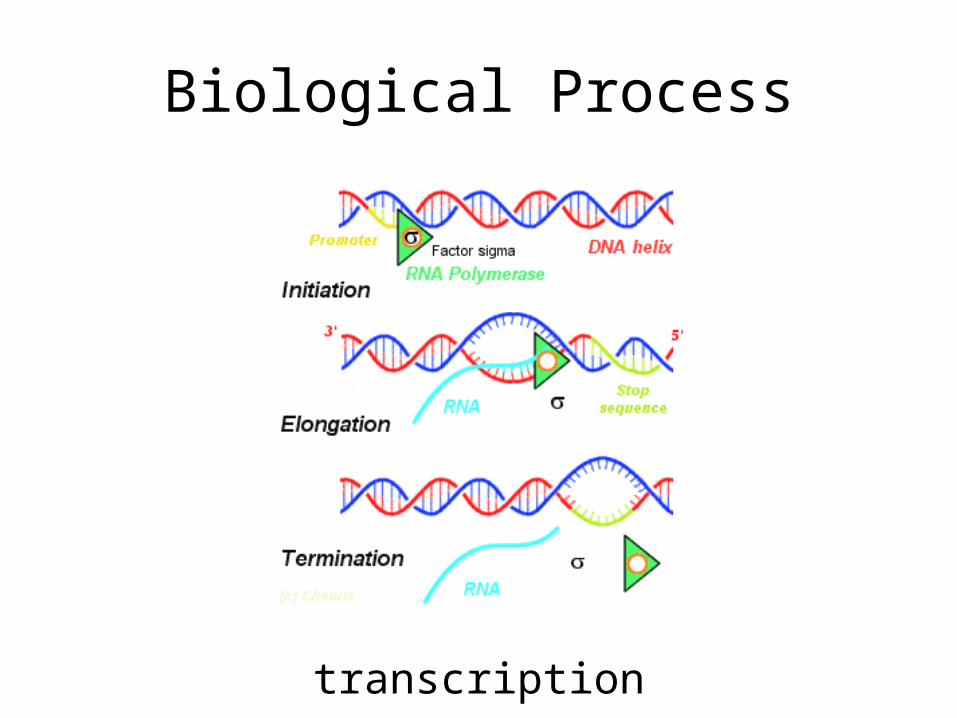
transcription
Biological Process
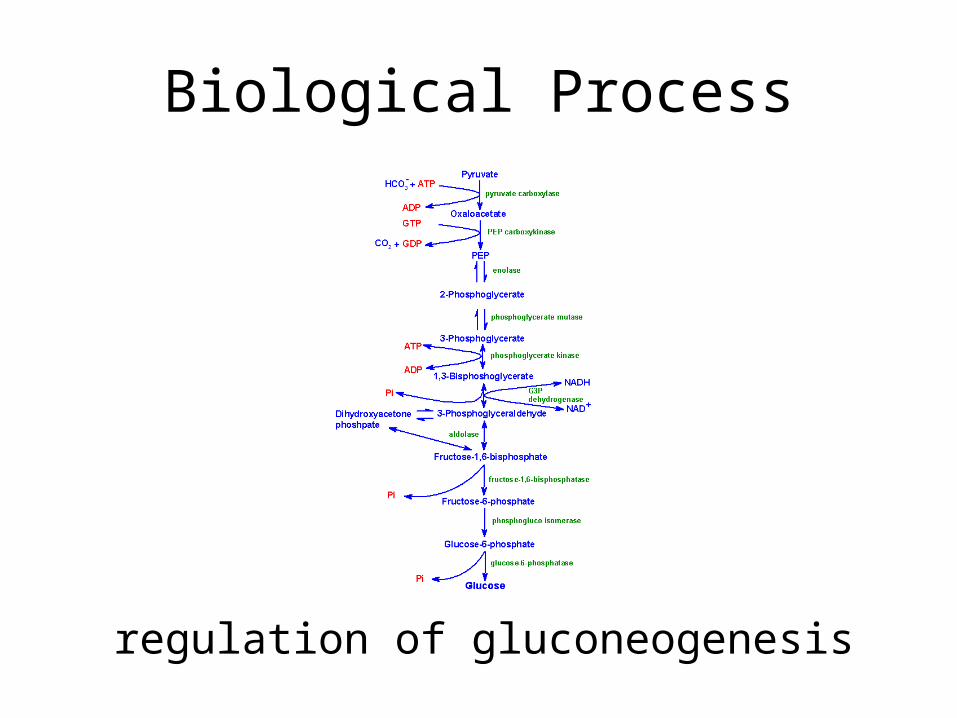
regulation of gluconeogenesis
Biological Process
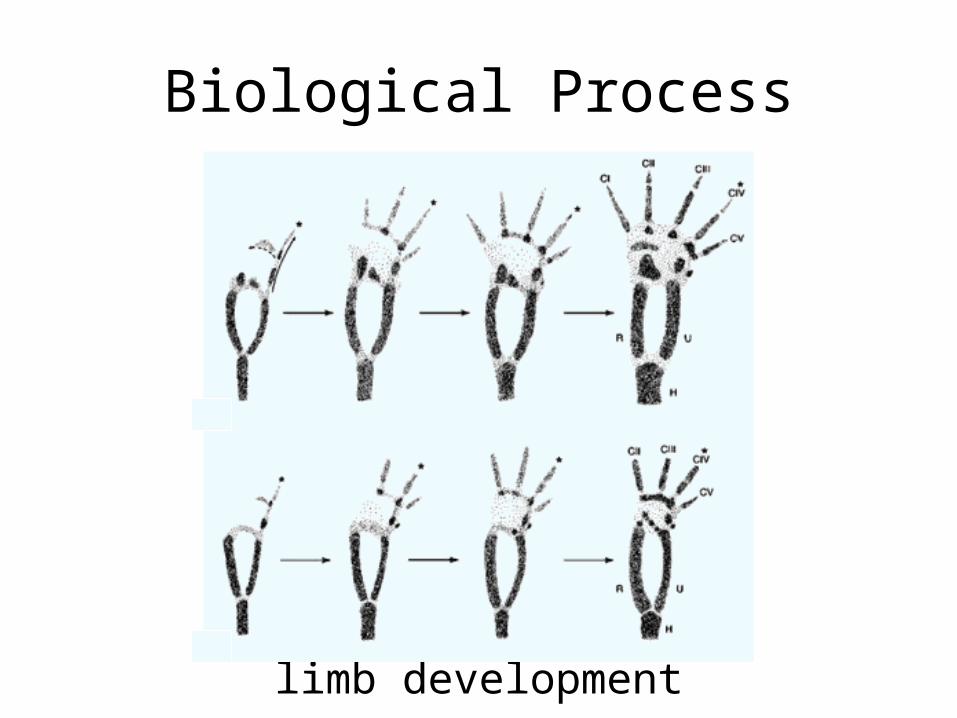
limb development
Ontology Structure
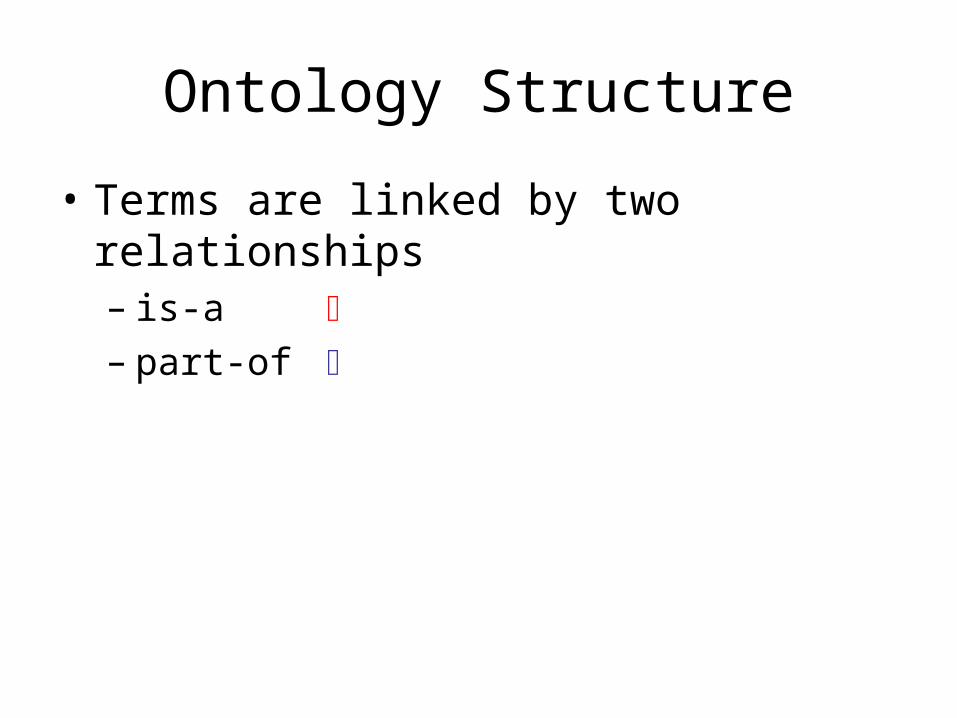
• Terms are linked by two relationships– is-a – part-of
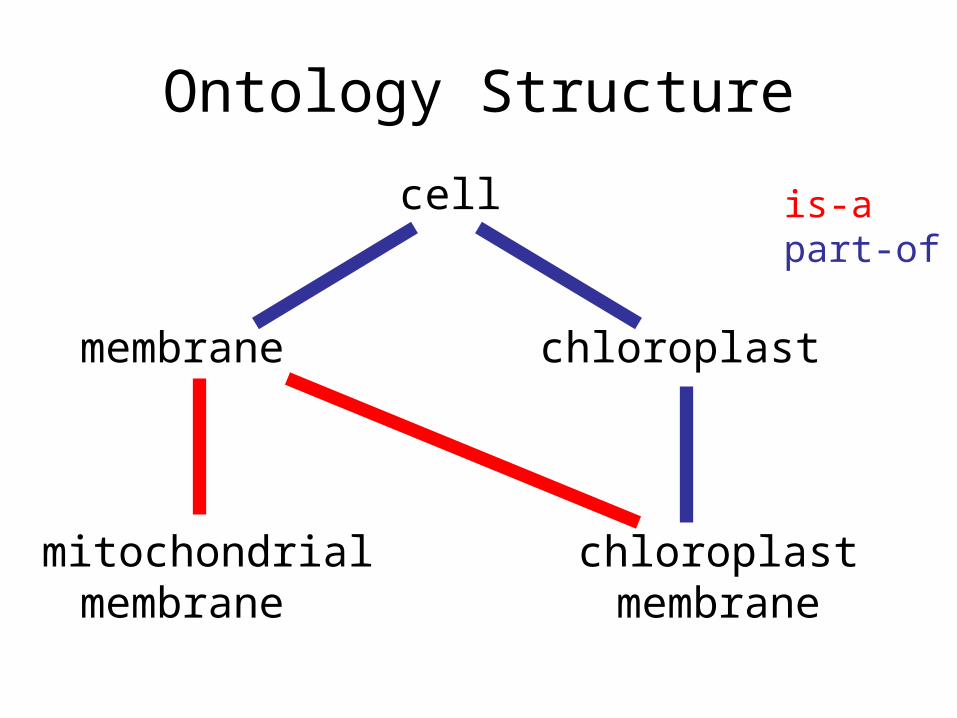
Ontology Structure
cell
membrane chloroplast
mitochondrial chloroplastmembrane membrane
is-apart-of
Ontology Structure
• Ontologies are structured as a hierarchical directed acyclic graph (DAG)
• Terms can have more than one parent and zero, one or more children
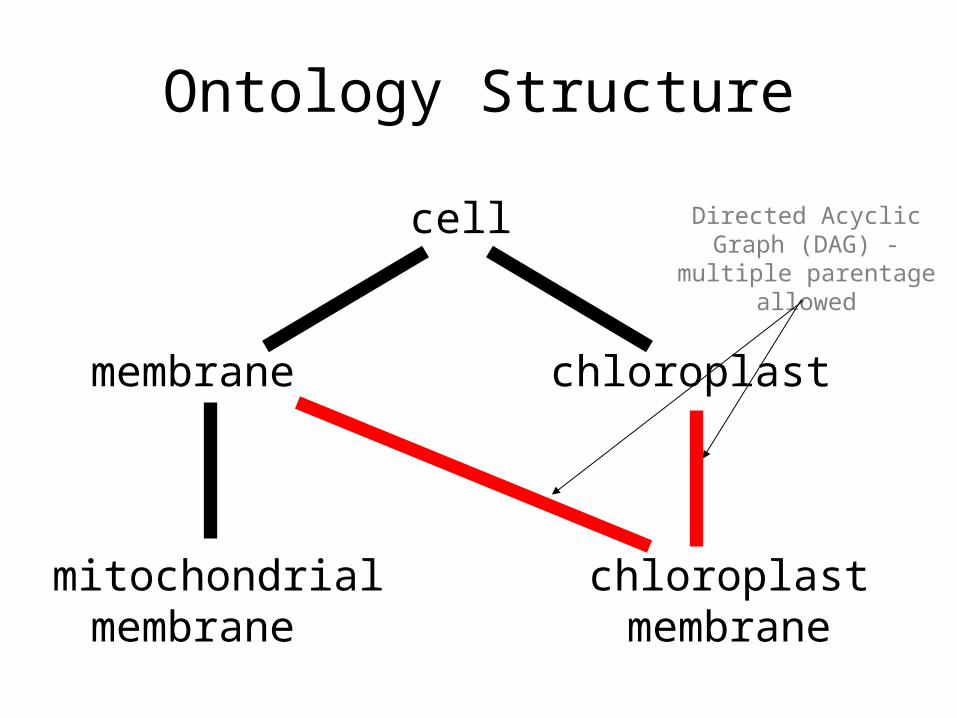
Ontology Structure
cell
membrane chloroplast
mitochondrial chloroplastmembrane membrane
Directed Acyclic Graph (DAG) - multiple
parentage allowed
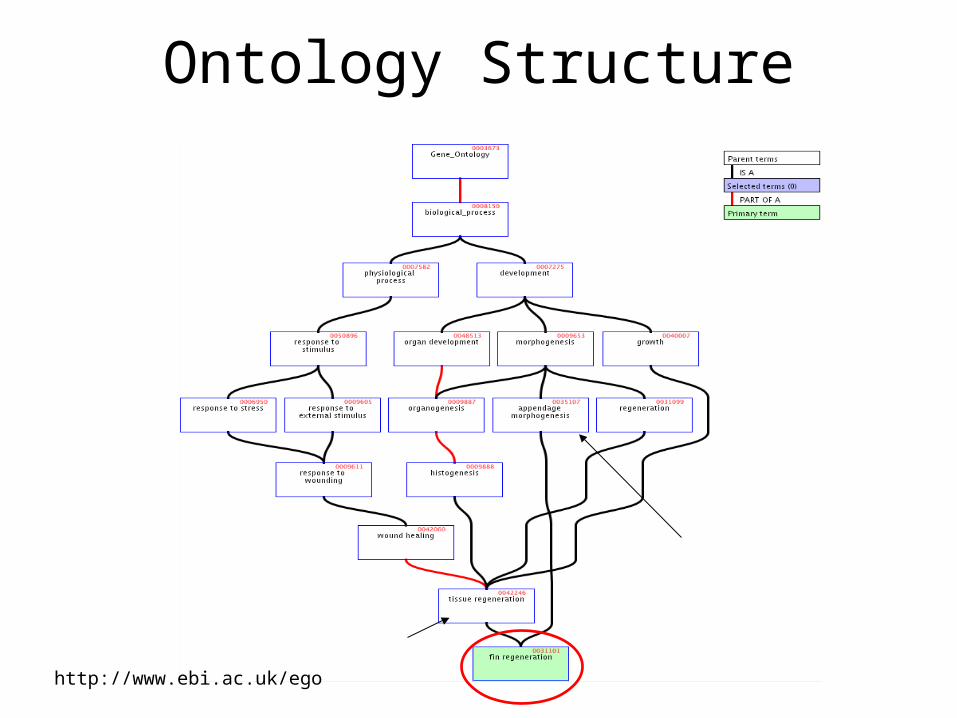
Ontology Structure
http://www.ebi.ac.uk/ego
Anatomy of a GO term
id: GO:0006094name: gluconeogenesisnamespace: processdef: The formation of glucose fromnoncarbohydrate precursors, such aspyruvate, amino acids and glycerol.[http://cancerweb.ncl.ac.uk/omd/index.html]exact_synonym: glucose biosynthesisxref_analog: MetaCyc:GLUCONEO-PWYis_a: GO:0006006is_a: GO:0006092
unique GO ID
term name
definition
synonym
database ref
parentage
ontology
Evidence Codes for GO Evidence Codes for GO AnnotationsAnnotations
http://www.geneontology.org/doc/GO.evidence.html
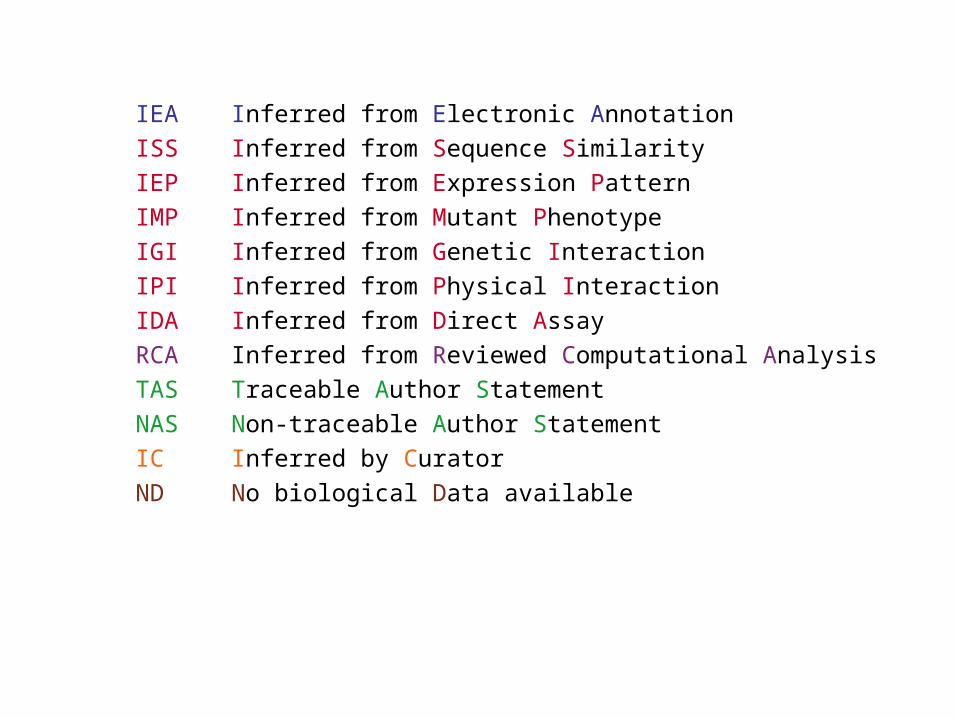
IEA Inferred from Electronic Annotation
ISS Inferred from Sequence Similarity
IEP Inferred from Expression Pattern
IMP Inferred from Mutant Phenotype
IGI Inferred from Genetic Interaction
IPI Inferred from Physical Interaction
IDA Inferred from Direct Assay
RCA Inferred from Reviewed Computational Analysis
TAS Traceable Author Statement
NAS Non-traceable Author Statement
IC Inferred by Curator
ND No biological Data available
29
Semantic Similarity Measures between GO terms and proteins
Two information in GO for semantic similarity
• information content (IC) of GO terms
• structural information of GO hierarchy
30
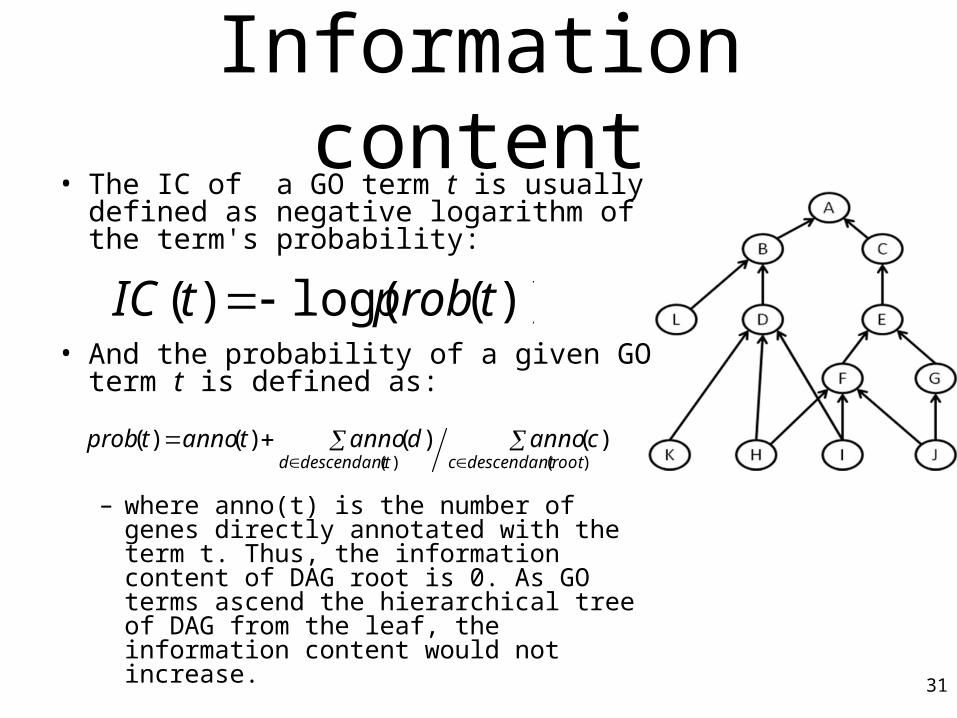
Information content• The IC of a GO term t is usually
defined as negative logarithm of the term's probability:
• And the probability of a given GO term t is defined as:
– where anno(t) is the number of genes directly annotated with the term t. Thus, the information content of DAG root is 0. As GO terms ascend the hierarchical tree of DAG from the leaf, the information content would not increase. 31
))(log()( tprobtIC
)()(
)()()()(rootdescendantctdescendantd
cannodannotannotprob
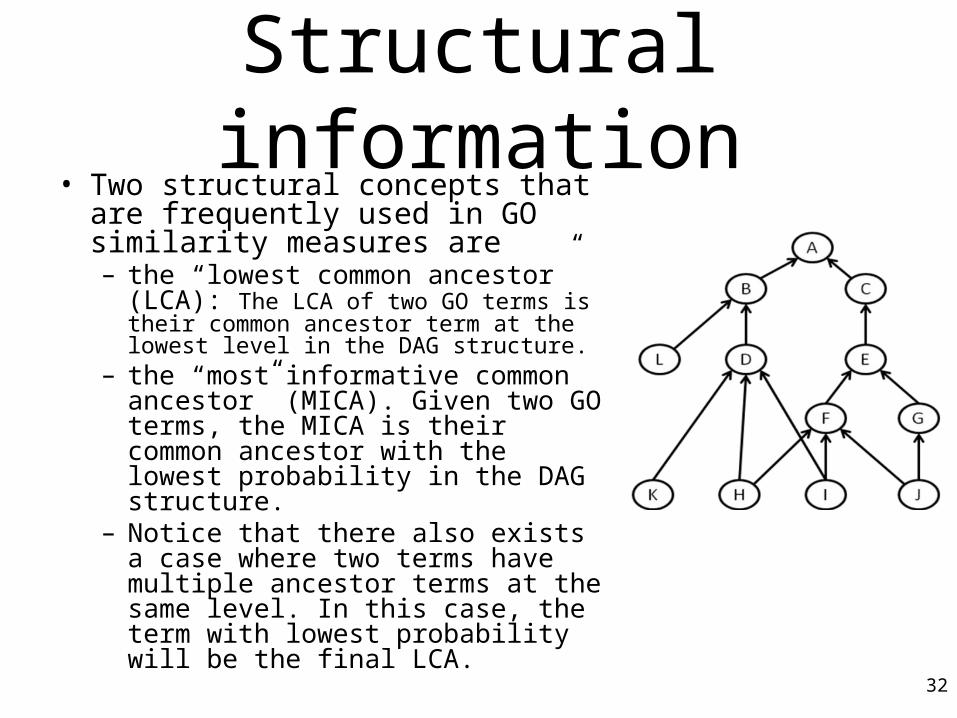
Structural information• Two structural concepts that are
frequently used in GO similarity measures are – the “lowest common ancestor”
(LCA): The LCA of two GO terms is their common ancestor term at the lowest level in the DAG structure.
– the “most informative common ancestor” (MICA). Given two GO terms, the MICA is their common ancestor with the lowest probability in the DAG structure.
– Notice that there also exists a case where two terms have multiple ancestor terms at the same level. In this case, the term with lowest probability will be the final LCA.
32
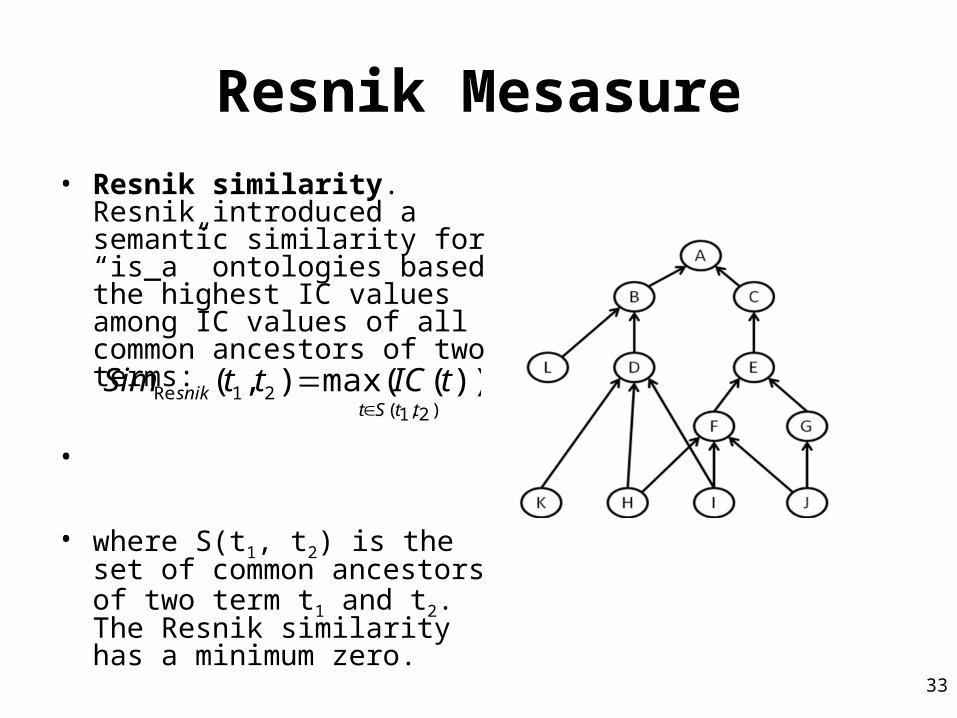
Resnik Mesasure• Resnik similarity. Resnik
introduced a semantic similarity for “is_a” ontologies based the highest IC values among IC values of all common ancestors of two terms:
•
• where S(t1, t2) is the set of common ancestors of two term t1 and t2. The Resnik similarity has a minimum zero.
33
)2,1(21Re ))(max(),(
ttStsnik tICttSim
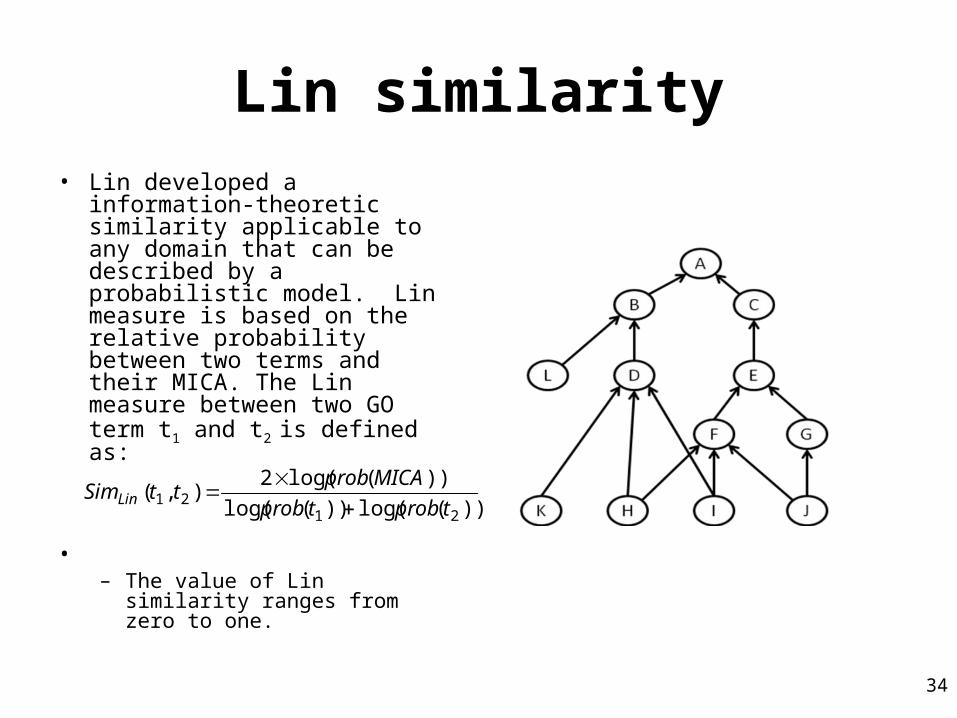
Lin similarity• Lin developed a information-
theoretic similarity applicable to any domain that can be described by a probabilistic model. Lin measure is based on the relative probability between two terms and their MICA. The Lin measure between two GO term t1 and t2 is defined as:
•
– The value of Lin similarity ranges from zero to one.
34
))(log())(log(
))(log(2),(
2121 tprobtprob
MICAprobttSimLin
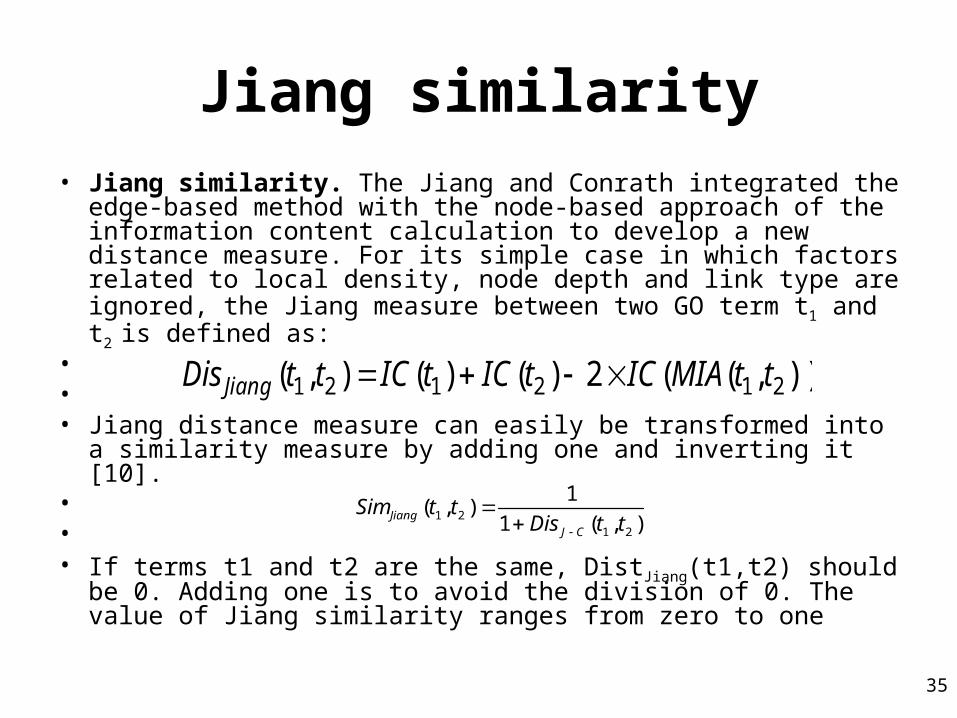
Jiang similarity• Jiang similarity. The Jiang and Conrath integrated the edge-
based method with the node-based approach of the information content calculation to develop a new distance measure. For its simple case in which factors related to local density, node depth and link type are ignored, the Jiang measure between two GO term t1 and t2 is defined as:
• • • Jiang distance measure can easily be transformed into a
similarity measure by adding one and inverting it [10].• • • If terms t1 and t2 are the same, DistJiang(t1,t2) should be 0.
Adding one is to avoid the division of 0. The value of Jiang similarity ranges from zero to one
35
)),((2)()(),( 212121 ttMIAICtICtICttDisJiang
),(1
1),(
21
21 ttDisttSim
CJ
Jiang
Wu & Palmer
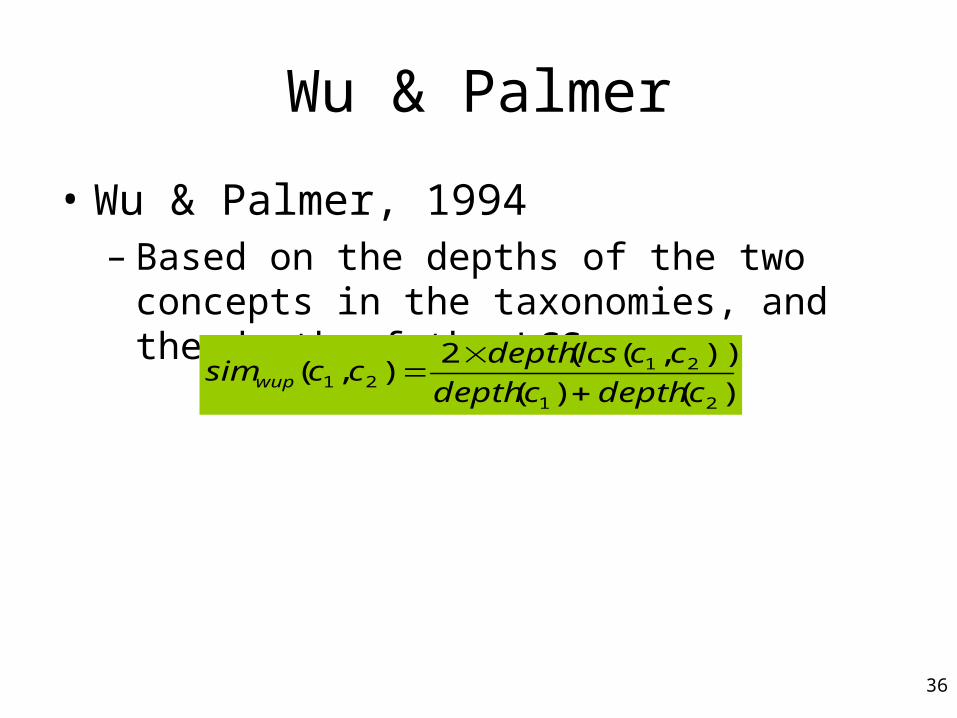
• Wu & Palmer, 1994– Based on the depths of the two concepts in
the taxonomies, and the depth of the LCS
36
)()(
)),((2),(
21
2121 cdepthcdepth
cclcsdepthccsimwup
Graph information content (GIC) similarity
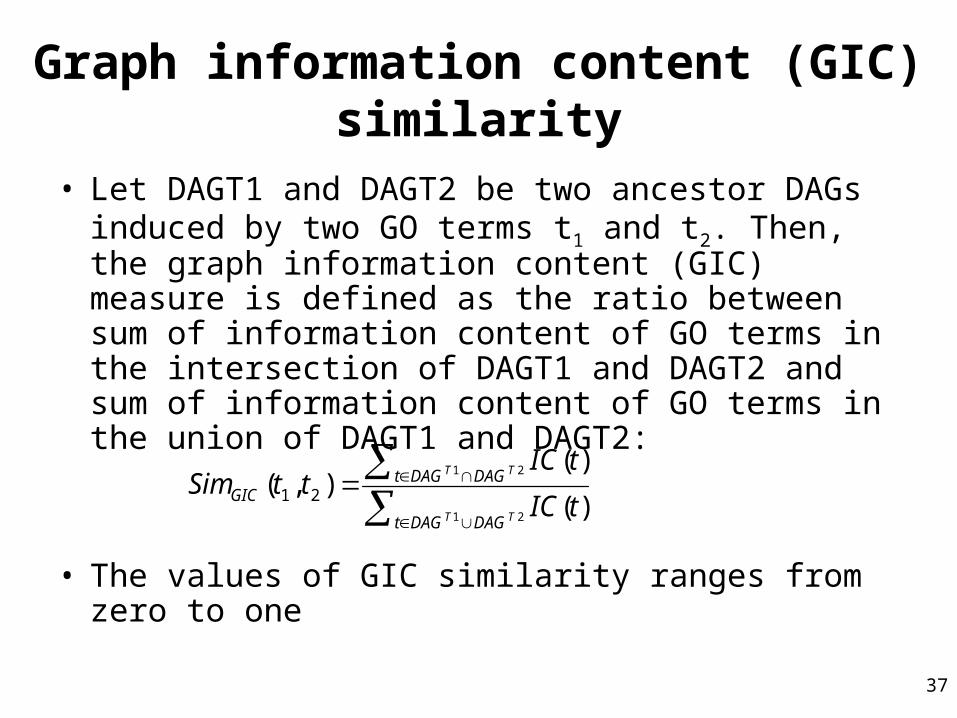
• Let DAGT1 and DAGT2 be two ancestor DAGs induced by two GO terms t1 and t2. Then, the graph information content (GIC) measure is defined as the ratio between sum of information content of GO terms in the intersection of DAGT1 and DAGT2 and sum of information content of GO terms in the union of DAGT1 and DAGT2:
• The values of GIC similarity ranges from zero to one
37
21
21
)(
)(),( 21
TT
TT
DAGDAGt
DAGDAGtGIC tIC
tICttSim
Schlicker’s relevance similarity
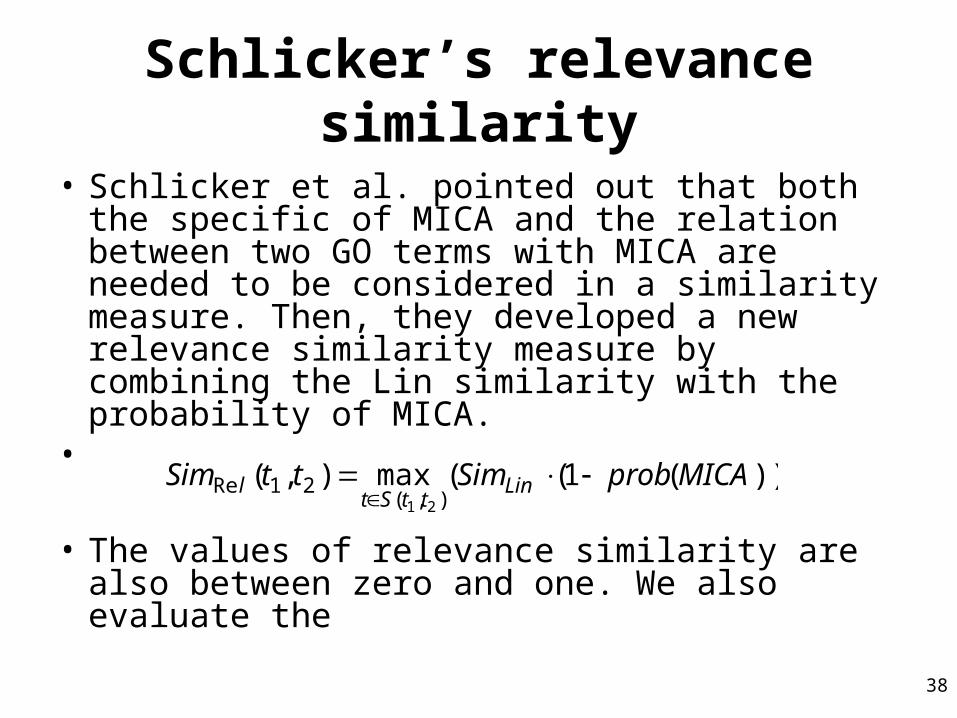
• Schlicker et al. pointed out that both the specific of MICA and the relation between two GO terms with MICA are needed to be considered in a similarity measure. Then, they developed a new relevance similarity measure by combining the Lin similarity with the probability of MICA.
•
• The values of relevance similarity are also between zero and one. We also evaluate the
38
))(1((max),(),(
21Re21
MICAprobSimttSim LinttSt
l
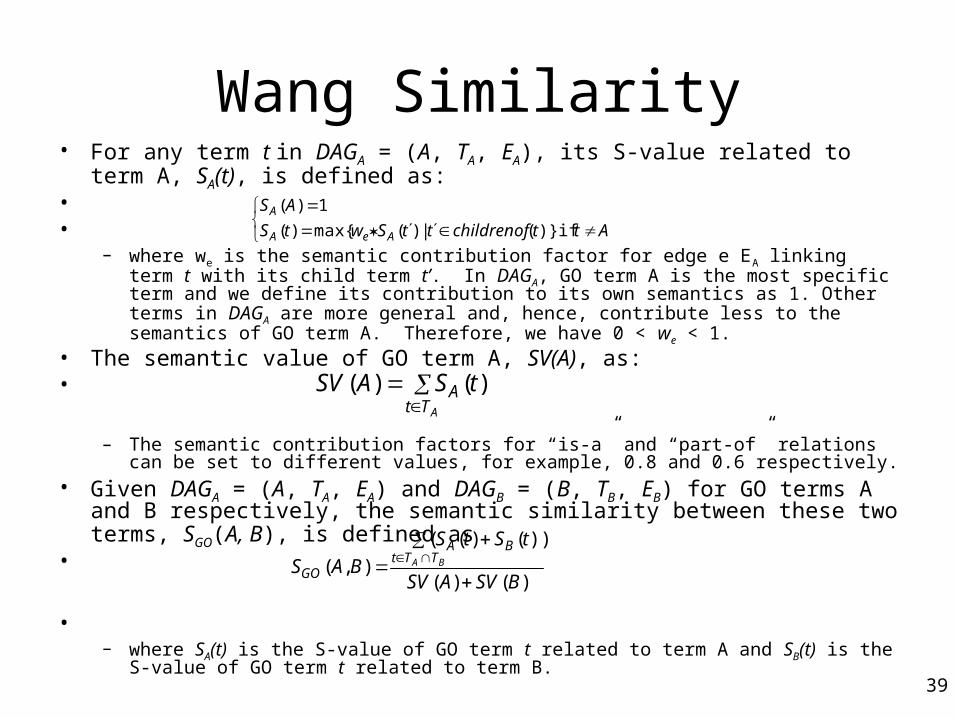
Wang Similarity• For any term t in DAGA = (A, TA, EA), its S-value related to term A, SA(t), is
defined as:••
– where we is the semantic contribution factor for edge e EA linking term t with its child term t’. In DAGA, GO term A is the most specific term and we define its contribution to its own semantics as 1. Other terms in DAGA are more general and, hence, contribute less to the semantics of GO term A. Therefore, we have 0 < we < 1.
• The semantic value of GO term A, SV(A), as: •
– The semantic contribution factors for “is-a” and “part-of” relations can be set to different values, for example, 0.8 and 0.6 respectively.
• Given DAGA = (A, TA, EA) and DAGB = (B, TB, EB) for GO terms A and B respectively, the semantic similarity between these two terms, SGO(A, B), is defined as
•
•– where SA(t) is the S-value of GO term t related to term A and SB(t) is the S-value of
GO term t related to term B. 39
AttchildrenofttSwtS
AS
AeA
A
if )}(|)(max{)(
1)(
)()( ATt
A tSASV
)()(
))()((
),(BSVASV
tStS
BAS BA TTtBA
GO
Semantic Similarity between Proteins
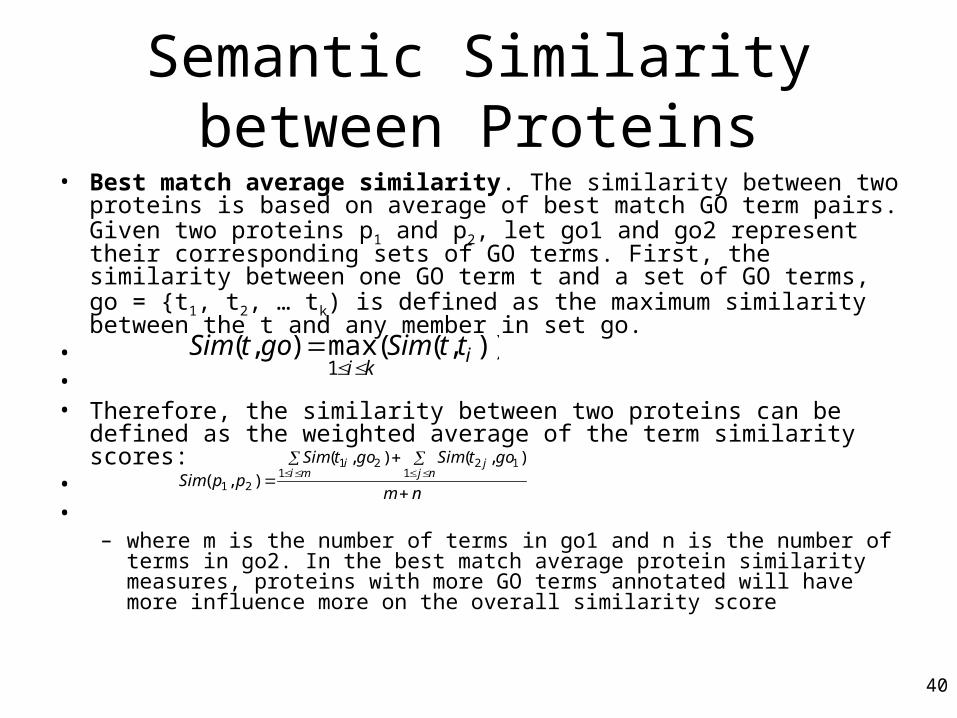
• Best match average similarity. The similarity between two proteins is based on average of best match GO term pairs. Given two proteins p1 and p2, let go1 and go2 represent their corresponding sets of GO terms. First, the similarity between one GO term t and a set of GO terms, go = {t1, t2, … tk) is defined as the maximum similarity between the t and any member in set go.
• • • Therefore, the similarity between two proteins can be defined as the
weighted average of the term similarity scores:• •
– where m is the number of terms in go1 and n is the number of terms in go2. In the best match average protein similarity measures, proteins with more GO terms annotated will have more influence more on the overall similarity score
40
)),((max),(1
iki
ttSimgotSim
nm
gotSimgotSim
ppSim njj
mii
1
121
21
21
),(),(
),(
Semantic Similarity between Proteins
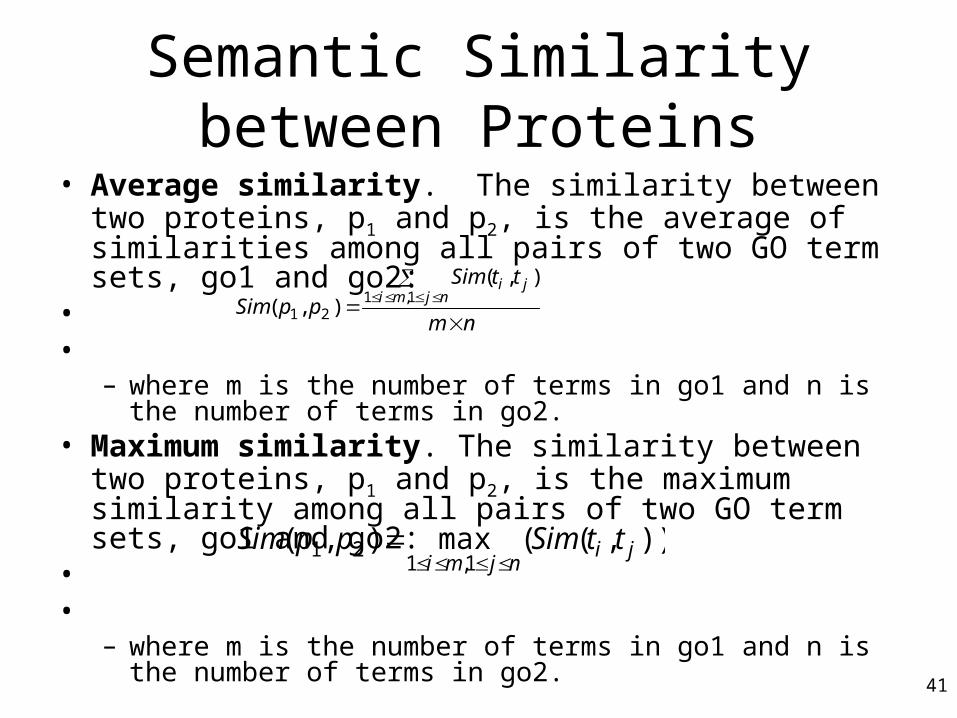
• Average similarity. The similarity between two proteins, p1 and p2, is the average of similarities among all pairs of two GO term sets, go1 and go2:
• •
– where m is the number of terms in go1 and n is the number of terms in go2.
• Maximum similarity. The similarity between two proteins, p1 and p2, is the maximum similarity among all pairs of two GO term sets, go1 and go2:
• •
– where m is the number of terms in go1 and n is the number of terms in go2.
41
nm
ttSim
ppSim njmiji
1,1
21
),(
),(
)),((max),(1,1
21 jinjmi
ttSimppSim