1 evolution and opportunities in the greek capital market may 2001 dr panayotis alexakis president...
TRANSCRIPT
1
Evolution and opportunities in the Greek capital market
May 2001
Dr Panayotis Alexakis
President of the Athens Stock Exchange (ASE) and the
Athens Derivatives Exchange (ADEX)
2
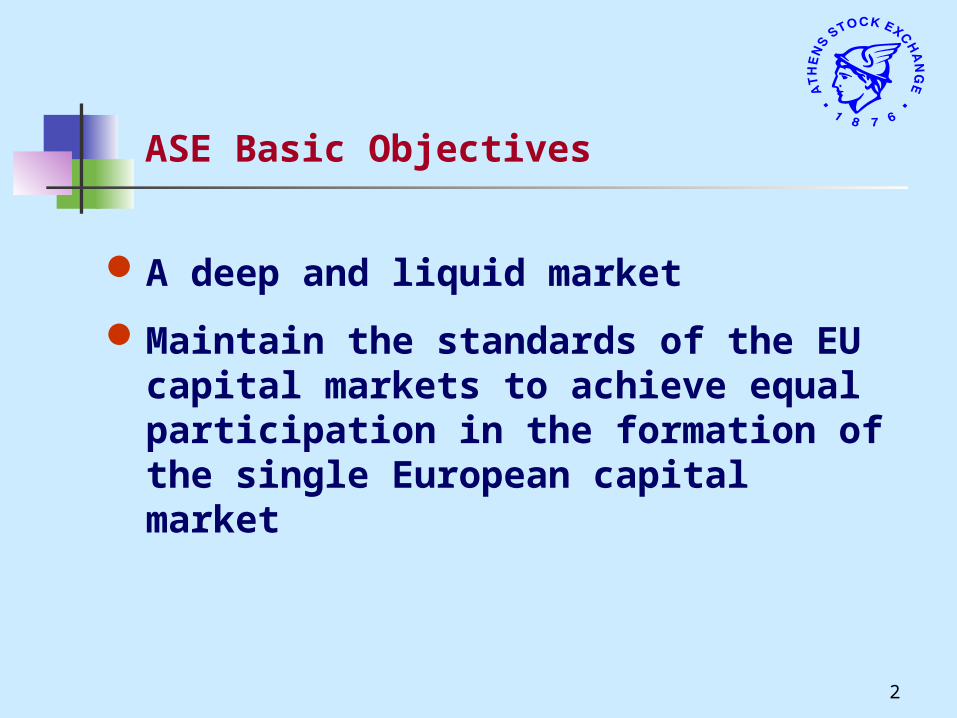
ASE Basic Objectives
A deep and liquid market
Maintain the standards of the EU capital markets to achieve equal participation in the formation of the single European capital market
3
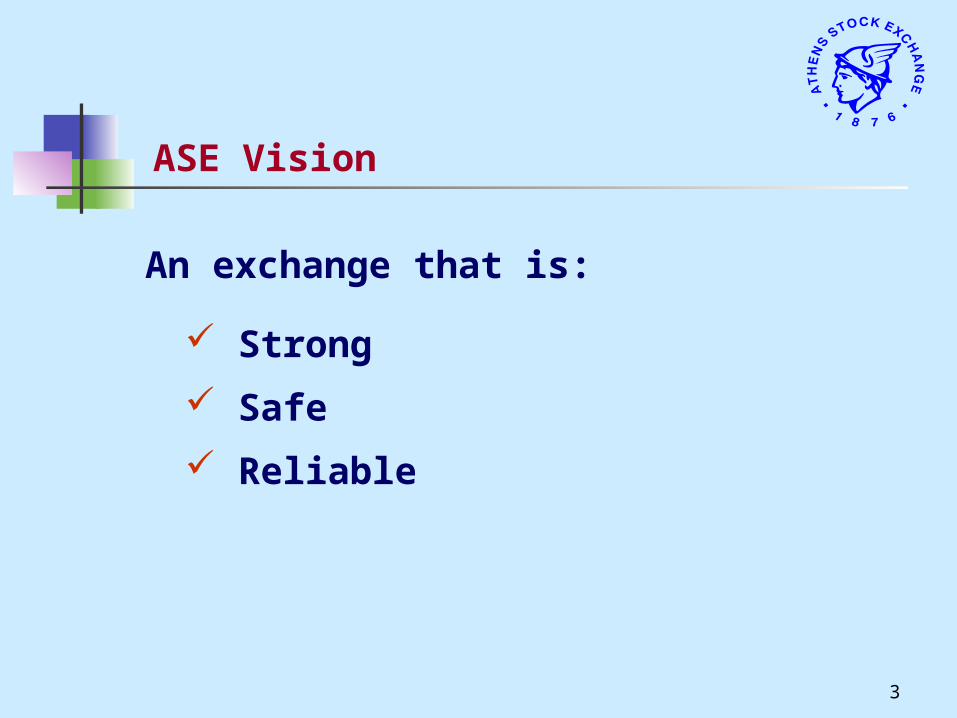
ASE Vision
Strong
Safe
Reliable
An exchange that is:
4
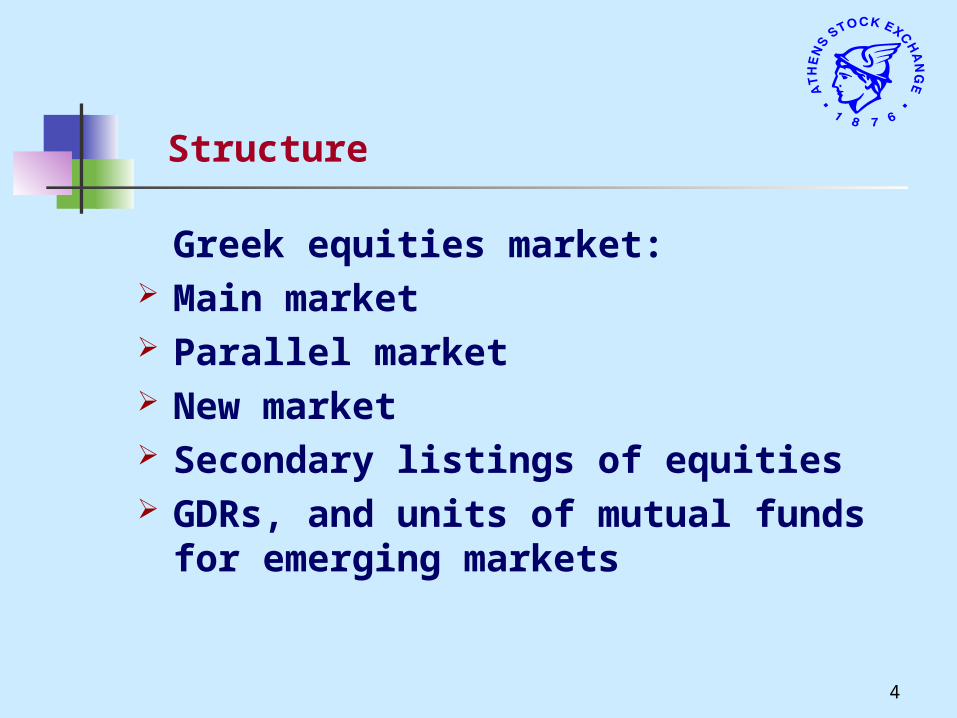
Structure
Greek equities market: Main market Parallel market New market Secondary listings of equities GDRs, and units of mutual funds for
emerging markets
5
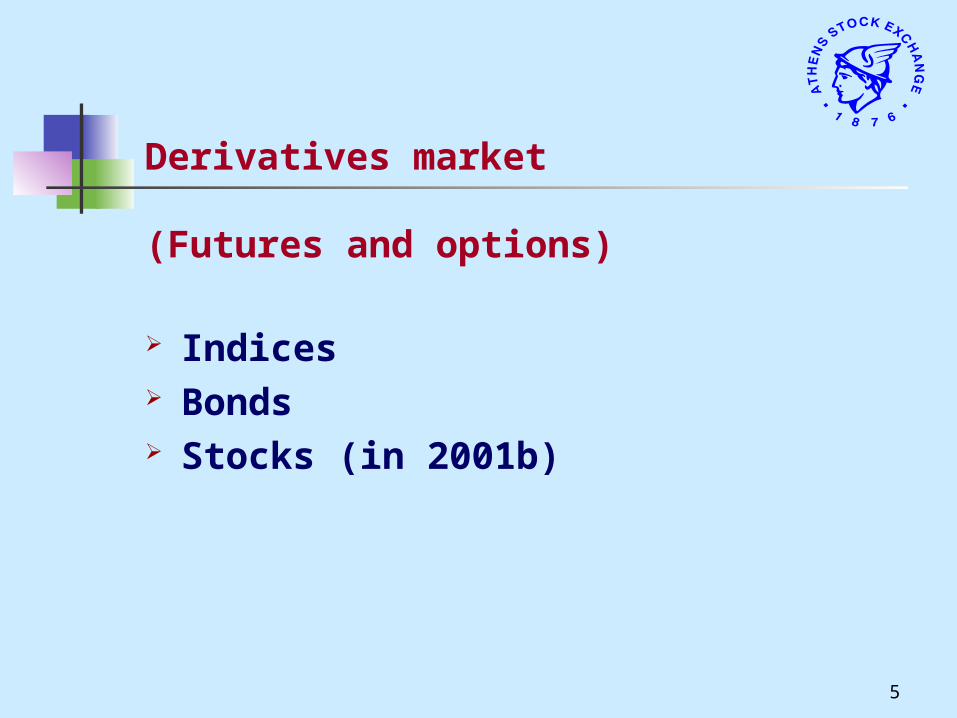
Derivatives market
Indices Bonds Stocks (in 2001b)
(Futures and options)
6
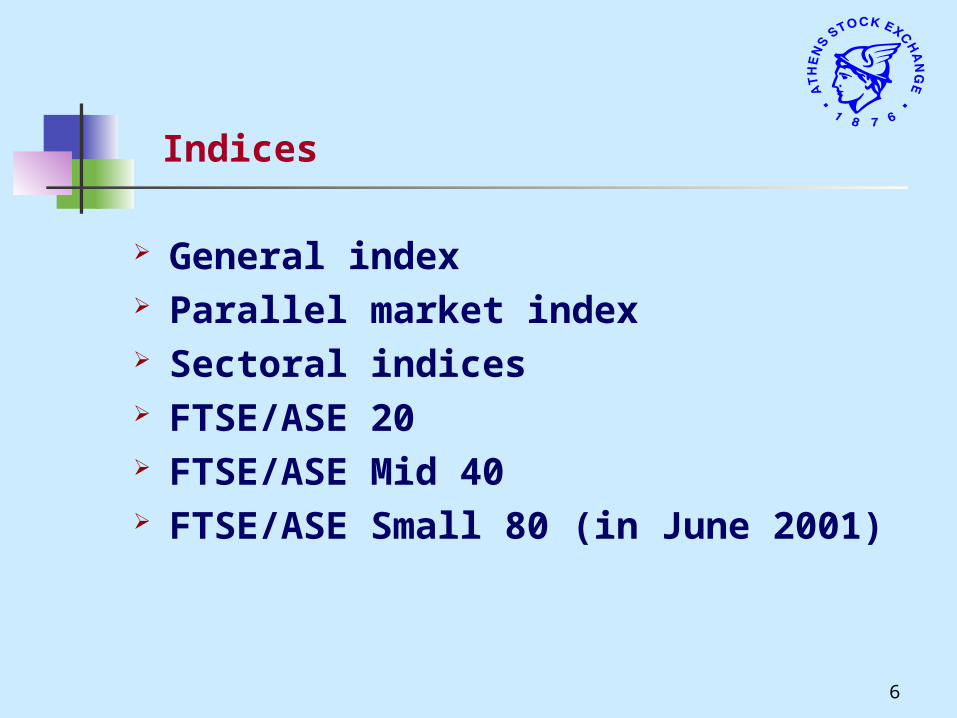
Indices
General index Parallel market index Sectoral indices FTSE/ASE 20 FTSE/ASE Mid 40 FTSE/ASE Small 80 (in June 2001)
7
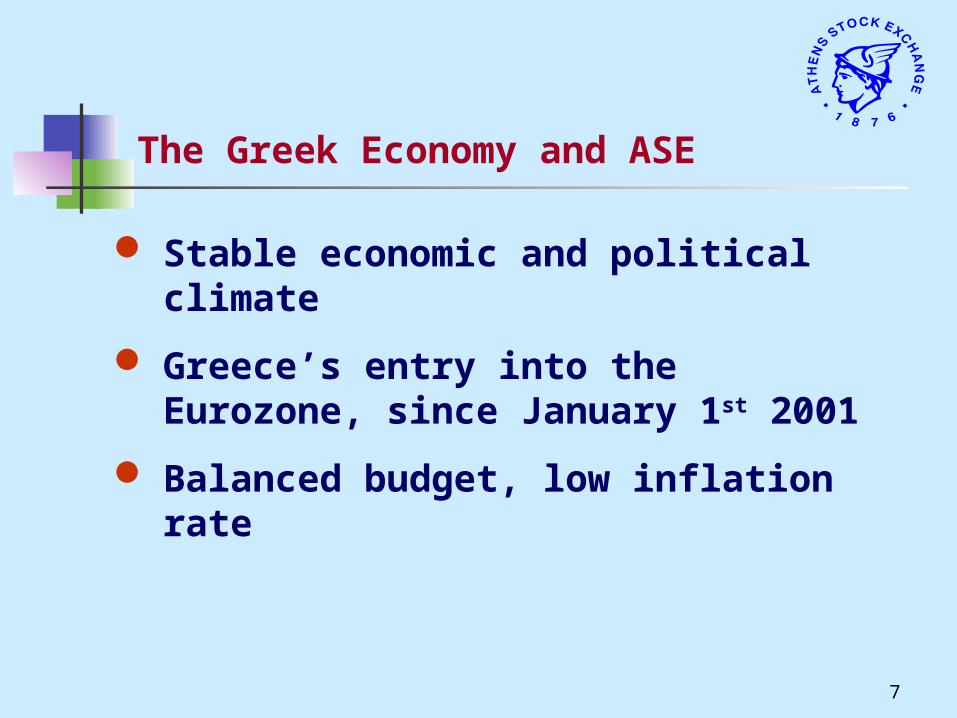
The Greek Economy and ASE
Stable economic and political climate
Greece’s entry into the Eurozone, since January 1st 2001
Balanced budget, low inflation rate
8
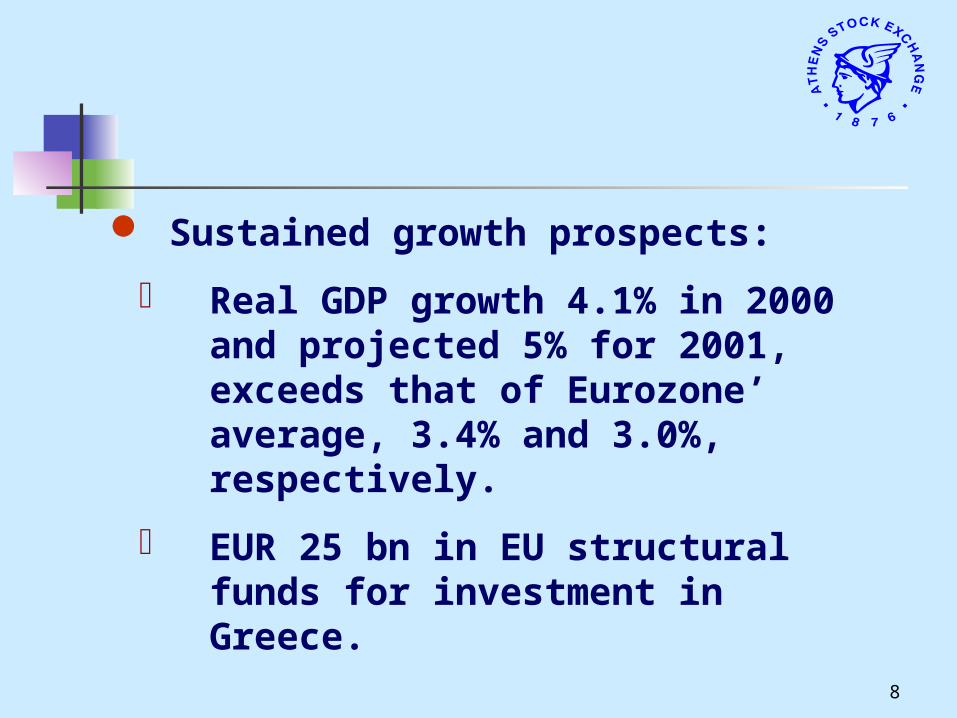
Sustained growth prospects:
Real GDP growth 4.1% in 2000 and projected 5% for 2001, exceeds that of Eurozone’ average, 3.4% and 3.0%, respectively.
EUR 25 bn in EU structural funds for investment in Greece.
9
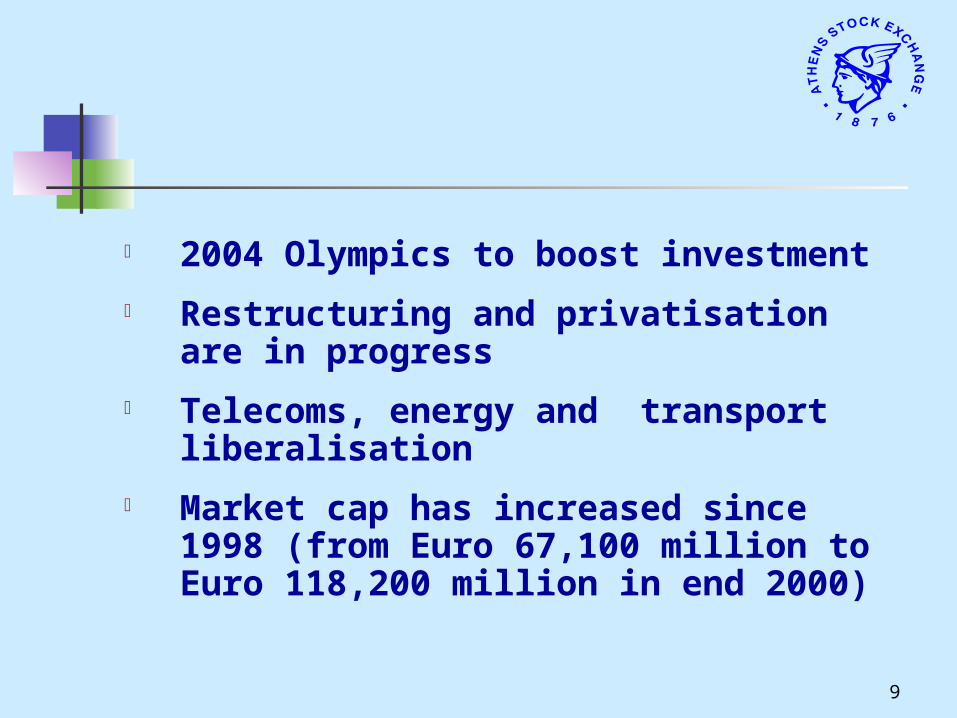
2004 Olympics to boost investment
Restructuring and privatisation are in progress
Telecoms, energy and transport liberalisation
Market cap has increased since 1998 (from Euro 67,100 million to Euro 118,200 million in end 2000)
10
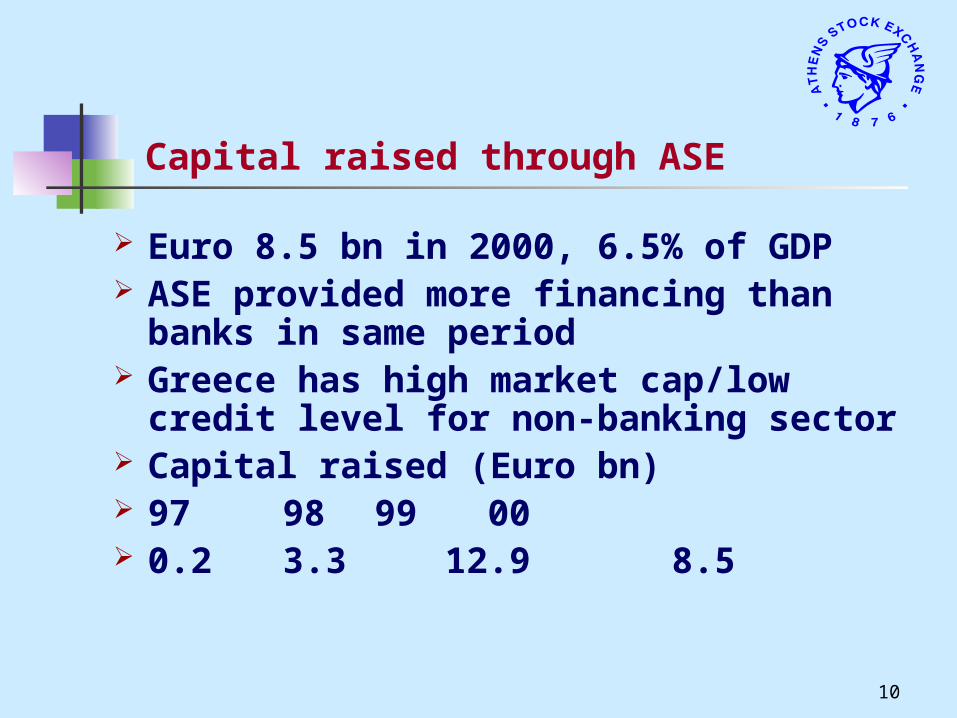
Capital raised through ASE
Euro 8.5 bn in 2000, 6.5% of GDP ASE provided more financing than banks in
same period Greece has high market cap/low credit level for
non-banking sector Capital raised (Euro bn) 97 98 99 00 0.2 3.3 12.9 8.5
11
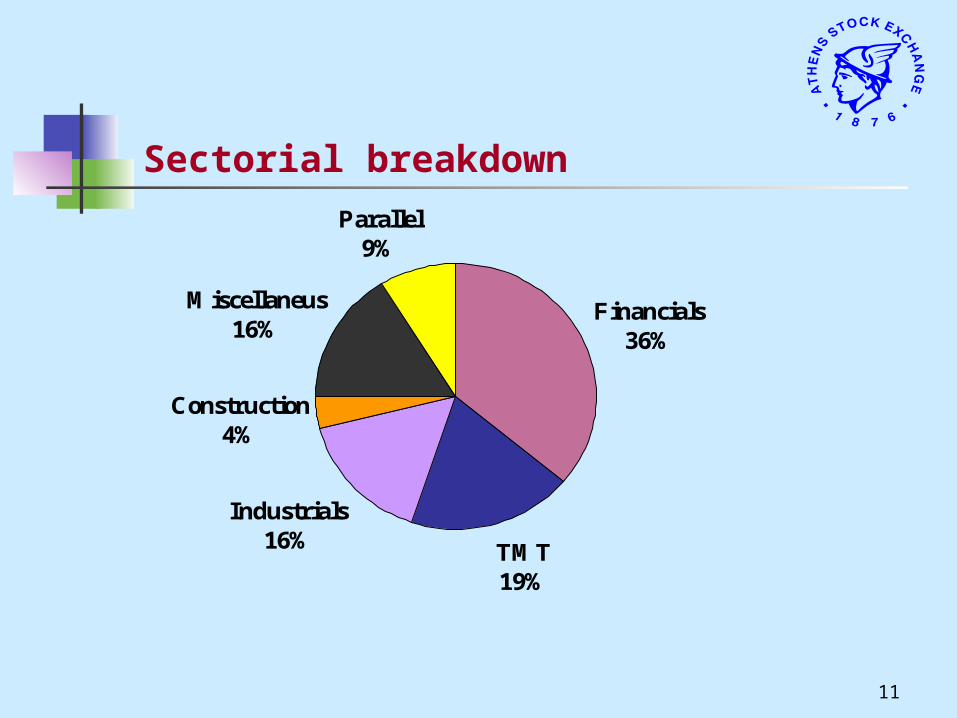
Sectorial breakdown
Financials36%
TMT19%
Industrials16%
Construction4%
Miscellaneus16%
Parallel9%
12
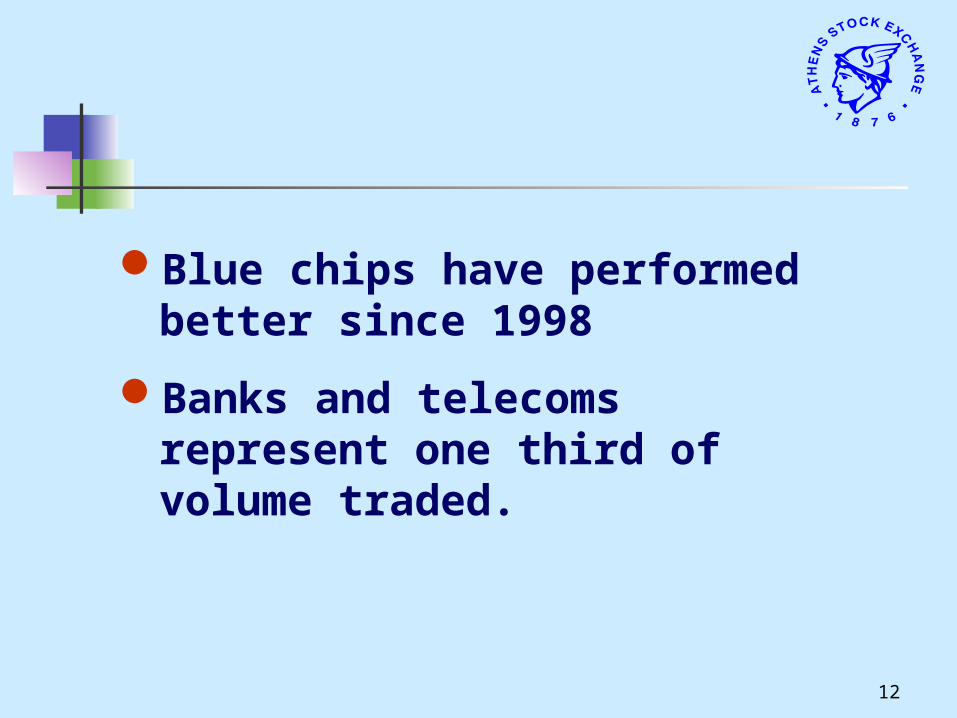
Blue chips have performed better since 1998
Banks and telecoms represent one third of volume traded.
13
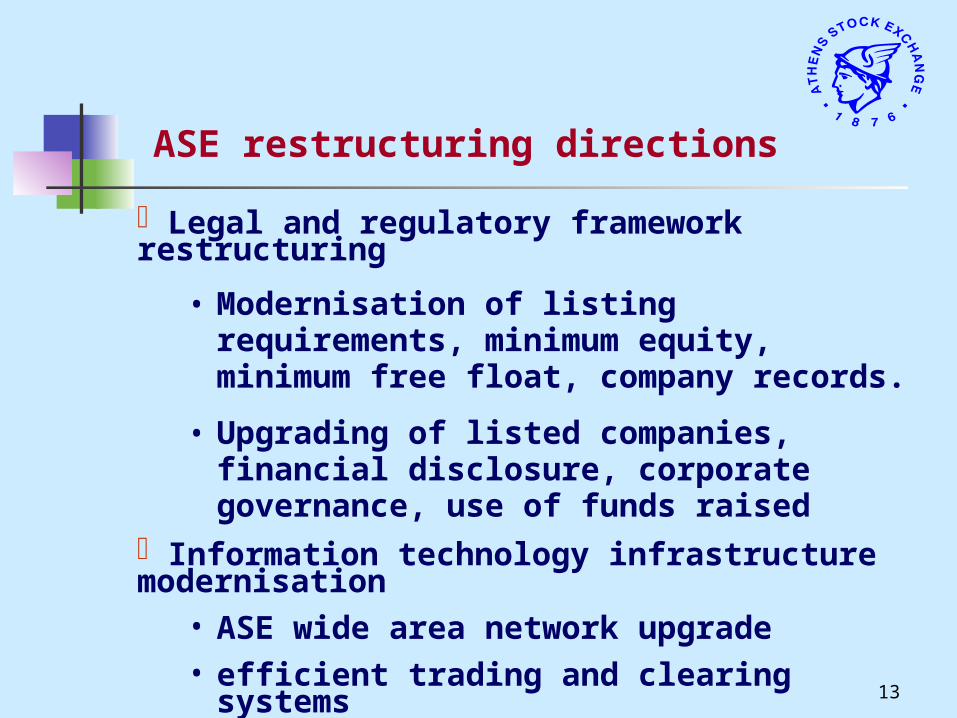
ASE restructuring directions
Legal and regulatory framework restructuring
• Modernisation of listing requirements, minimum equity, minimum free float, company records.
• Upgrading of listed companies, financial disclosure, corporate governance, use of funds raised
Information technology infrastructure modernisation• ASE wide area network upgrade• efficient trading and clearing systems• operation of a dematerialised shares system
14
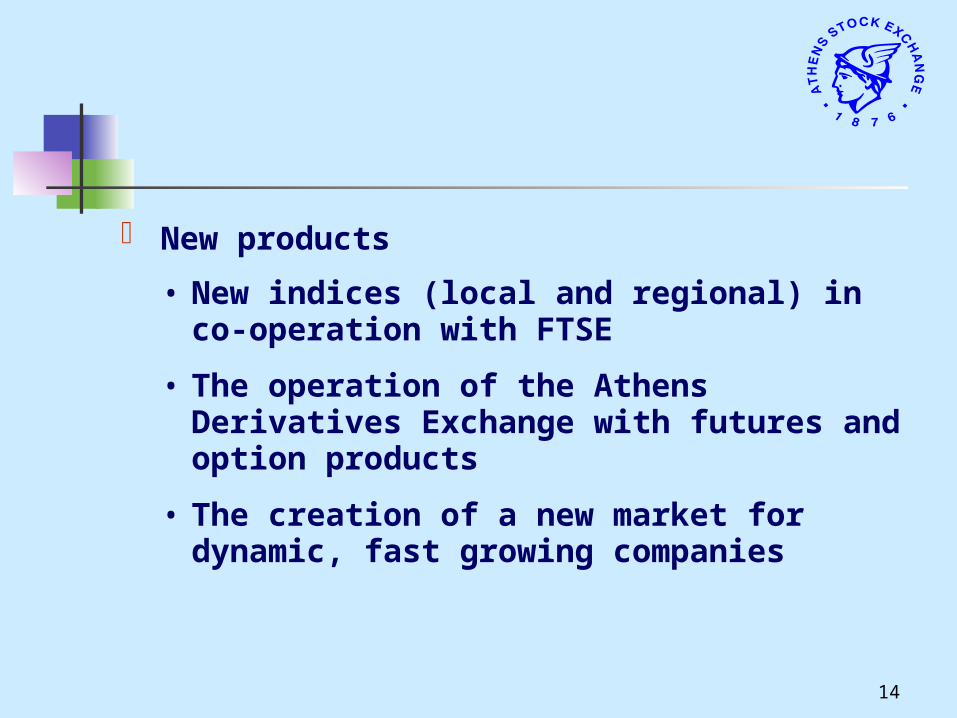
New products
• New indices (local and regional) in co-operation with FTSE
• The operation of the Athens Derivatives Exchange with futures and option products
• The creation of a new market for dynamic, fast growing companies
15
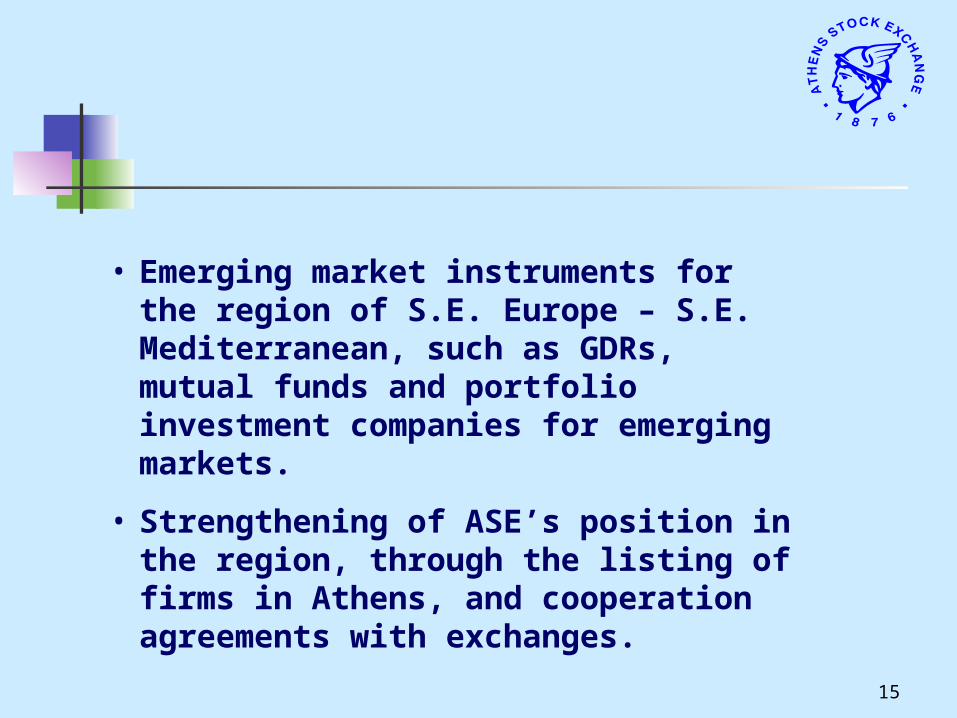
• Emerging market instruments for the region of S.E. Europe – S.E. Mediterranean, such as GDRs, mutual funds and portfolio investment companies for emerging markets.
• Strengthening of ASE’s position in the region, through the listing of firms in Athens, and cooperation agreements with exchanges.
16
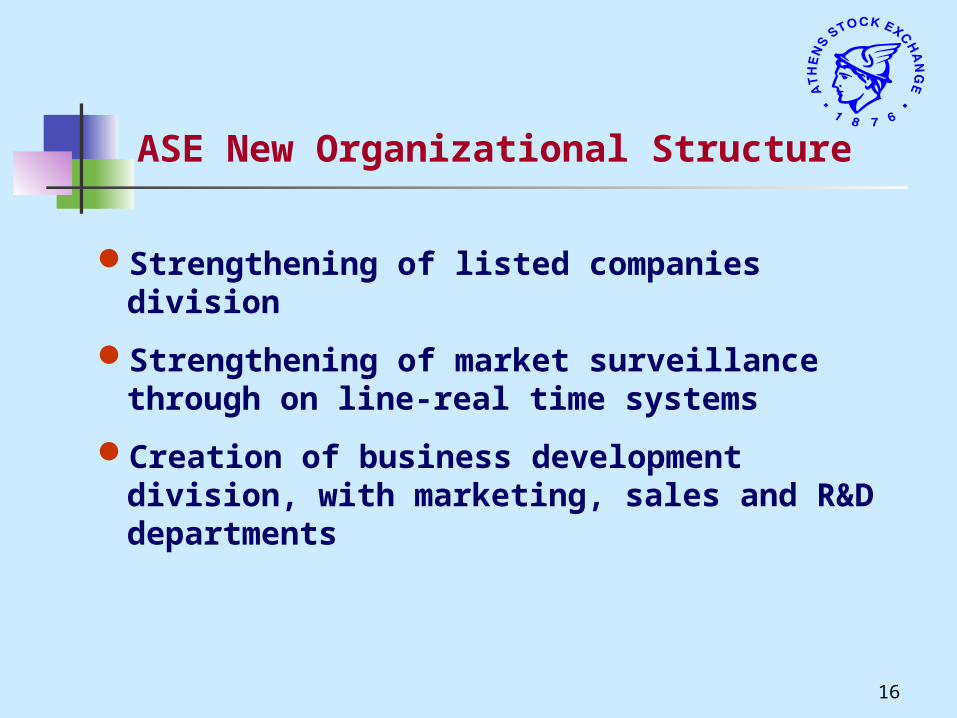
ASE New Organizational Structure
Strengthening of listed companies division
Strengthening of market surveillance through on line-real time systems
Creation of business development division, with marketing, sales and R&D departments
17
Rationalisation of the companies under the Hellenic Exchanges S.A. holding company.
• Merging of ADEX with ASE
• Enhancement of the role of the derivatives clearing house to act also for the stock market
18
• Enhancement of the role of the holding company Hellenic Exchanges SA, which is listed in ASE
• Improvement of institutional and operational framework, replacement of laws and ministerial decisions by an operational rulebook for ASE,members, listed companies and investors
• Timely preparation and the market functions in Euros, since the beginning of January 2001
19
0
1000
2000
3000
4000
5000
6000
7000
1/2
/98
3/2
/98
5/2
/98
7/2
/98
9/2
/98
11/2
/98
1/2
/99
3/2
/99
5/2
/99
7/2
/99
9/2
/99
11/2
/99
1/2
/00
3/2
/00
5/2
/00
7/2
/00
9/2
/00
11/2
/00
1/2
/01
3/2
/01
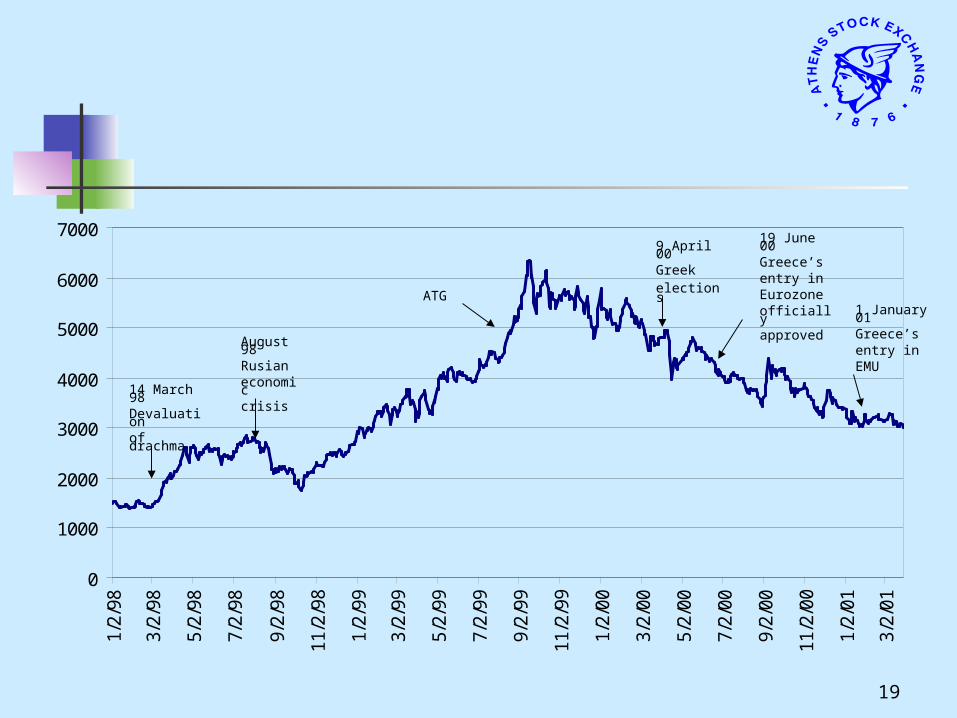
ATG
9 April 00Greek elections
19 June 00Greece’sentry in Eurozoneofficiallyapproved
August 98Rusian economiccrisis
14 March 98Devaluation of drachma
1 January 01Greece’s entry in EMU
20
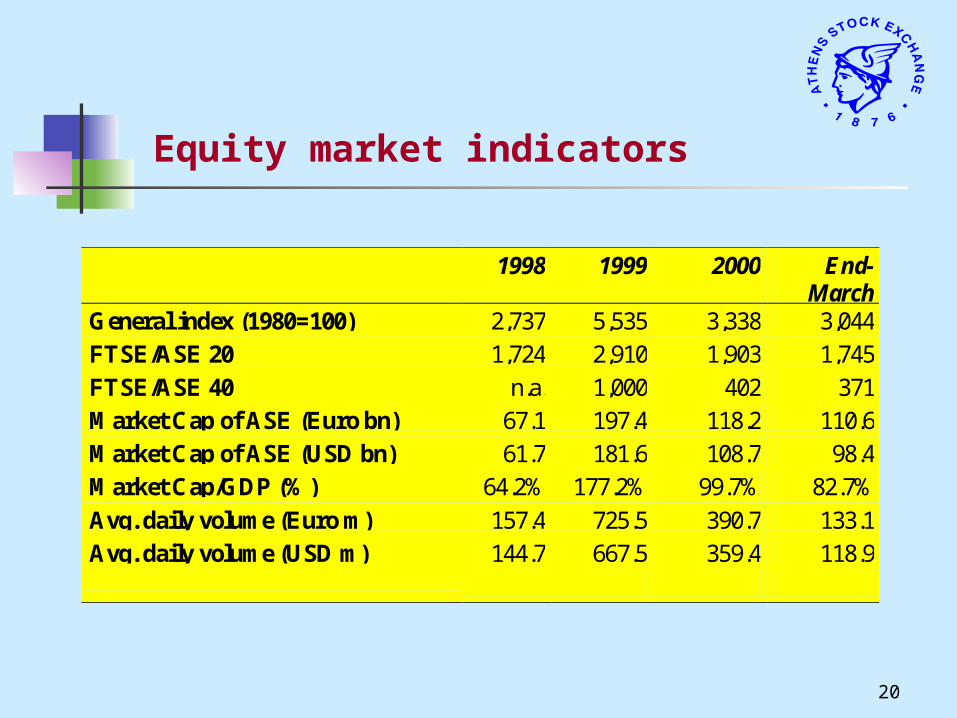
1998 1999 2000 End-March
General index (1980=100) 2,737 5,535 3,338 3,044
FTSE/ASE 20 1,724 2,910 1,903 1,745
FTSE/ASE 40 n.a. 1,000 402 371
Market Cap of ASE (Euro bn) 67.1 197.4 118.2 110.6
Market Cap of ASE (USD bn) 61.7 181.6 108.7 98.4
Market Cap/GDP (%) 64.2% 177.2% 99.7% 82.7%
Avg. daily volume (Euro m) 157.4 725.5 390.7 133.1
Avg. daily volume (USD m) 144.7 667.5 359.4 118.9
Equity market indicators
21
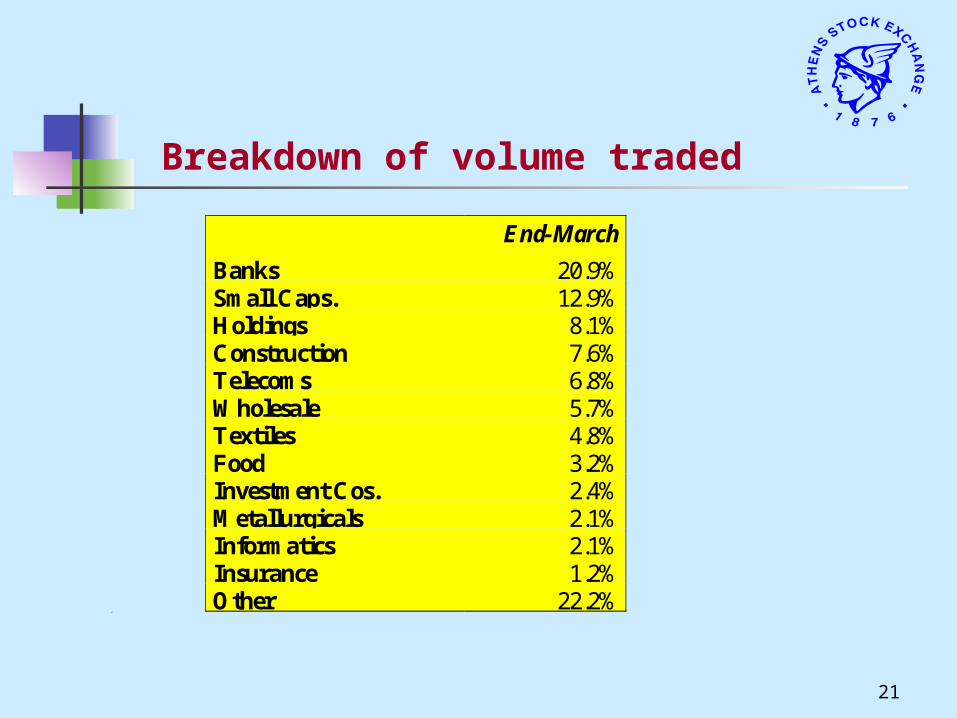
Breakdown of volume traded
End-March
Banks 20.9%Small Caps. 12.9%Holdings 8.1%Construction 7.6%Telecoms 6.8%Wholesale 5.7%Textiles 4.8%Food 3.2%Investment Cos. 2.4%Metallurgicals 2.1%Informatics 2.1%Insurance 1.2%Other 22.2%
0.7
22
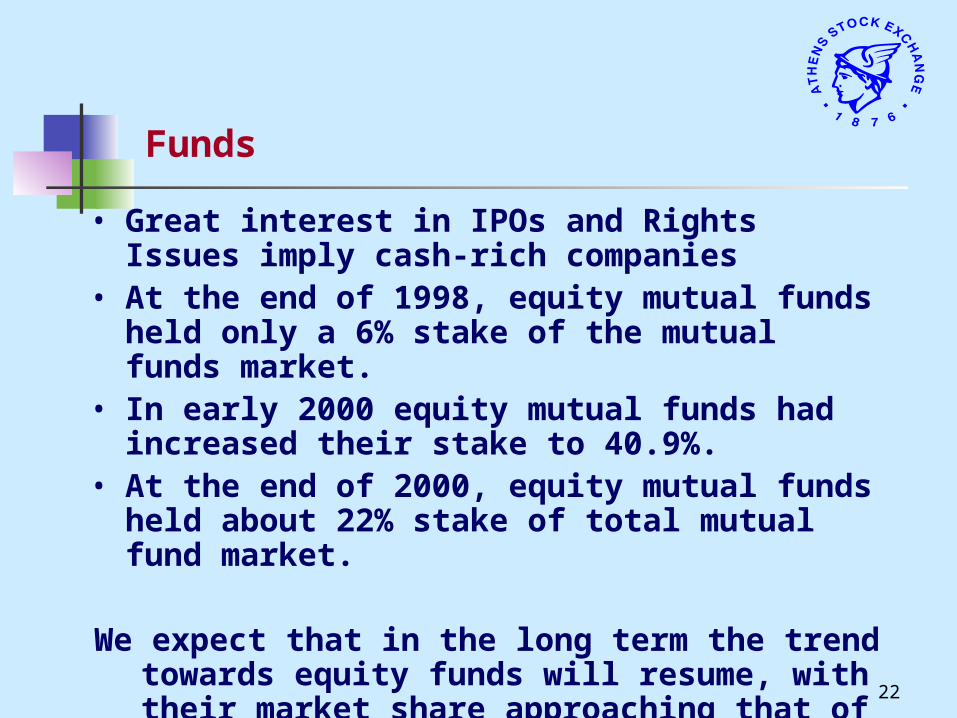
Funds
• Great interest in IPOs and Rights Issues imply cash-rich companies
• At the end of 1998, equity mutual funds held only a 6% stake of the mutual funds market.
• In early 2000 equity mutual funds had increased their stake to 40.9%.
• At the end of 2000, equity mutual funds held about 22% stake of total mutual fund market.
We expect that in the long term the trend towards equity funds will resume, with their market share
approaching that of the European average (48%).
23
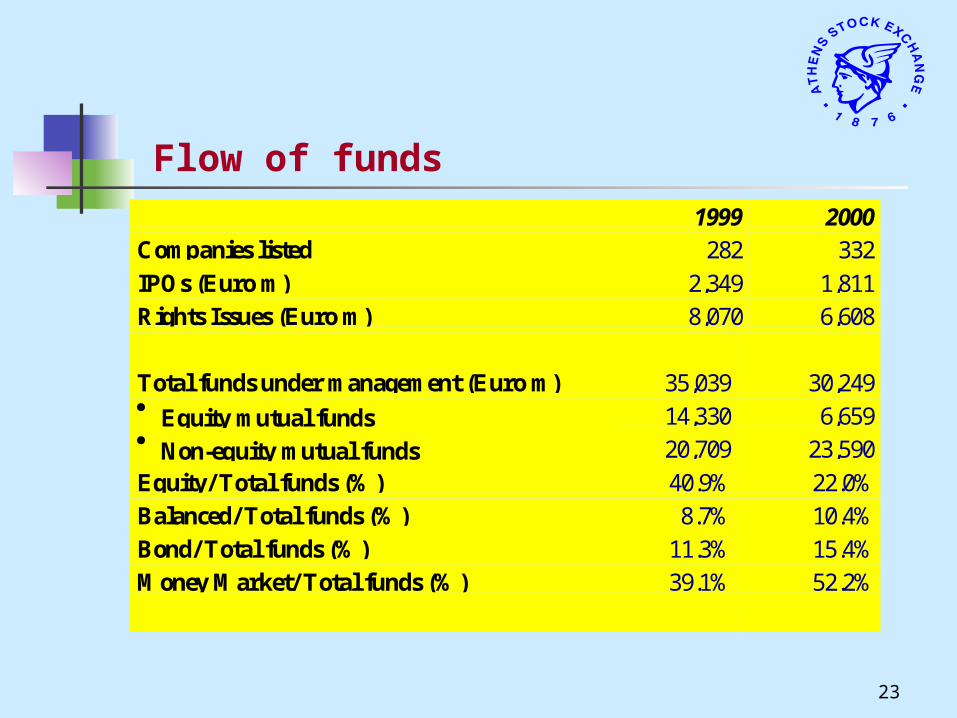
Flow of funds1999 2000
Companies listed 282 332
IPOs (Euro m) 2,349 1,811
Rights Issues (Euro m) 8,070 6,608
Total funds under management (Euro m) 35,039 30,249 Equity mutual funds 14,330 6,659 Non-equity mutual funds 20,709 23,590
Equity/ Total funds (%) 40.9% 22.0%
Balanced/ Total funds (%) 8.7% 10.4%
Bond/ Total funds (%) 11.3% 15.4%
Money Market/ Total funds (%) 39.1% 52.2%
24
Market Indices
• On July 31st Morgan Stanley Capital International decided to include Greece to its developed markets indices, effective from May 31st, 2001.
• The capitalization of MSCI Greece increased by 27.6% (from US$ 47 bn to US$ 60 bn).
25
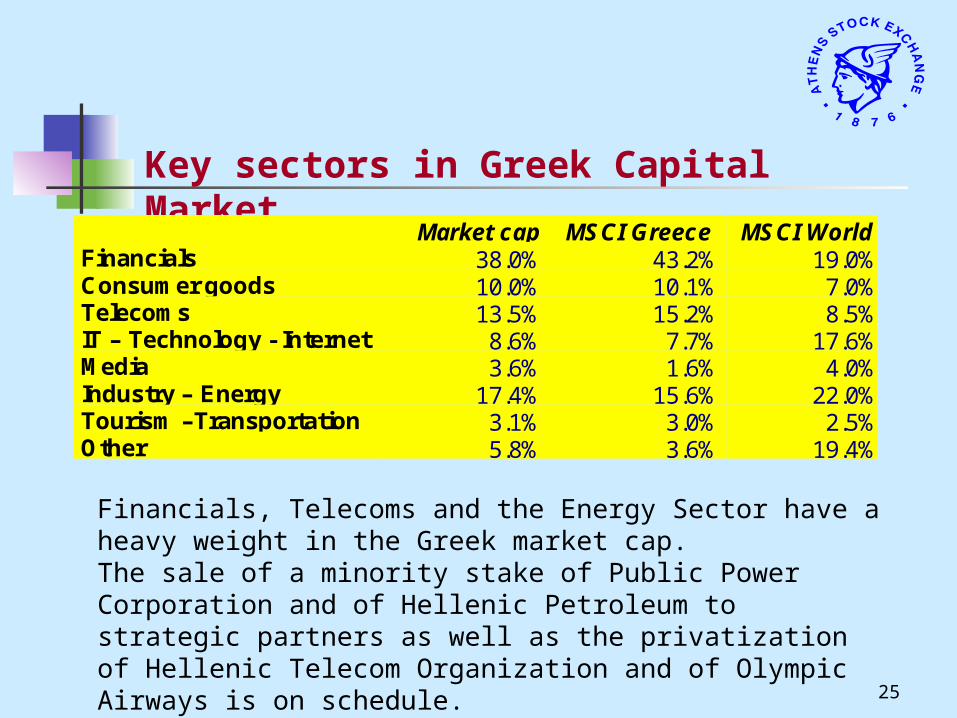
Key sectors in Greek Capital Market
Financials, Telecoms and the Energy Sector have a heavy weight in the Greek market cap.The sale of a minority stake of Public Power Corporation and of Hellenic Petroleum to strategic partners as well as the privatization of Hellenic Telecom Organization and of Olympic Airways is on schedule.
Market cap MSCI Greece MSCI WorldFinancials 38.0% 43.2% 19.0%Consumer goods 10.0% 10.1% 7.0%Telecoms 13.5% 15.2% 8.5%IT – Technology - Internet 8.6% 7.7% 17.6%Media 3.6% 1.6% 4.0%Industry – Energy 17.4% 15.6% 22.0%Tourism –Transportation 3.1% 3.0% 2.5%Other 5.8% 3.6% 19.4%
26
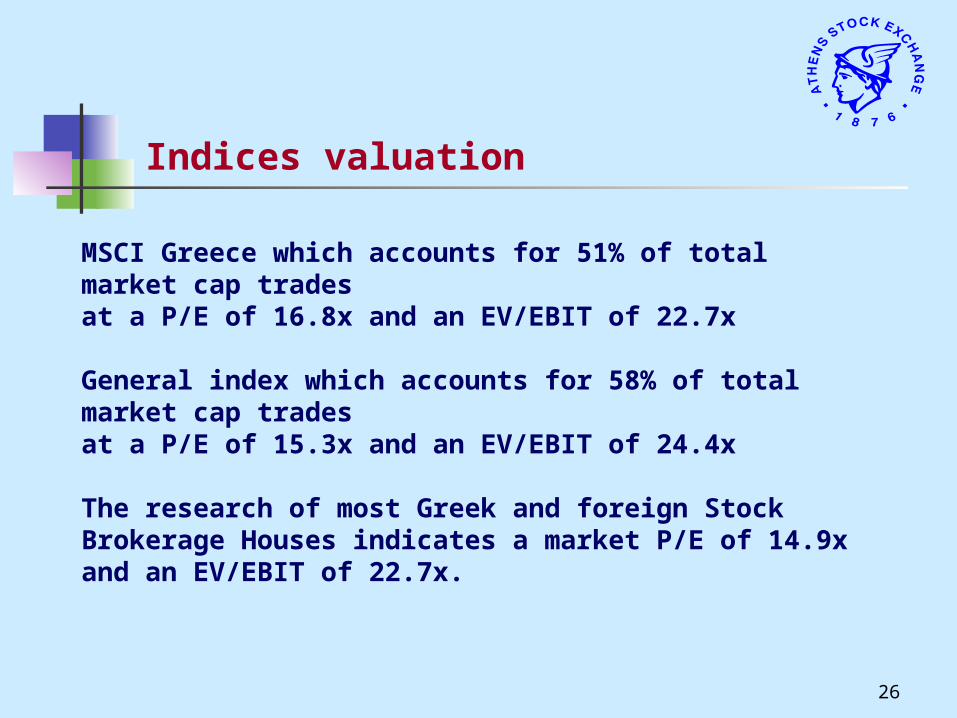
Indices valuation
MSCI Greece which accounts for 51% of total market cap tradesat a P/E of 16.8x and an EV/EBIT of 22.7x
General index which accounts for 58% of total market cap trades at a P/E of 15.3x and an EV/EBIT of 24.4x
The research of most Greek and foreign Stock Brokerage Houses indicates a market P/E of 14.9x and an EV/EBIT of 22.7x.
27
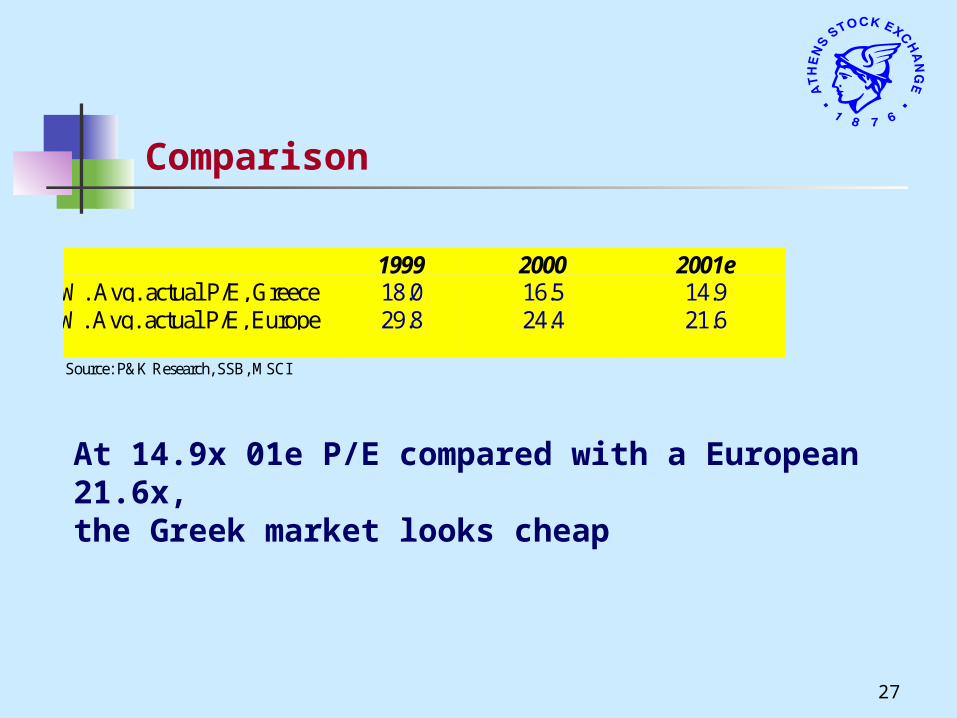
Comparison
1999 2000 2001eW. Avg. actual P/E, Greece 18.0 16.5 14.9W. Avg. actual P/E, Europe 29.8 24.4 21.6
Source: P&K Research, SSB, MSCI
At 14.9x 01e P/E compared with a European 21.6x, the Greek market looks cheap
28
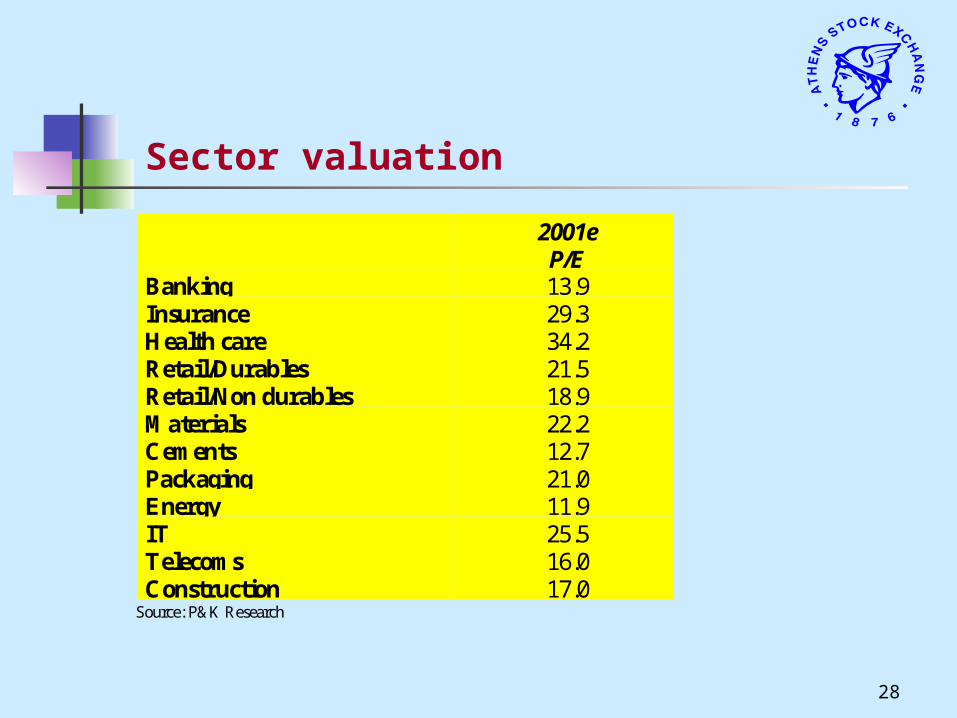
Sector valuation
2001eP/E
Banking 13.9Insurance 29.3Health care 34.2Retail/Durables 21.5Retail/Non durables 18.9Materials 22.2Cements 12.7Packaging 21.0Energy 11.9IT 25.5Telecoms 16.0Construction 17.0
Source: P&K Research
29
ASE Offers
Foreign investors can be assured that ASE is
committed to offer a
• Safe,
• Credible, and
• Transparent market
30
http://www.ase.gr
For more information
Thank you for your kind attention