1 dense ceramic membranes for hydrogen separation · 1 dense ceramic membranes for hydrogen...
TRANSCRIPT
1
1Dense Ceramic Membranes for Hydrogen SeparationTruls Norby and Reidar Haugsrud
1.1Introduction
In the 1980s and 1990s, the development of oxygen ion conductors for solid elec-trolytes, as well as mixed oxygen–electron conductors as electrodes for solid oxidefuel cells, brought scientists to envision a possibility of mixed-conducting oxygen-permeable ceramic membranes. Today this field is well established, and ceramicmembranes are close to implementation in processes for oxygen extraction fromair as well as for direct partial oxidation of natural gas. The technology seems tooffer superior routes for efficient power production from fossil fuels, combinedwith CO2 sequestration. Many materials with very high oxygen ion and electronicconductivities are available.
It was not equally obvious that dense ceramic hydrogen-permeable membraneswould be of similar interest. There are clearly needs for hydrogen purificationmembranes, but polymers and microporous materials as well as metals such aspalladium and its alloys appeared to fill these needs. In addition, possible candi-dates for dense ceramic hydrogen-permeable materials were not as appealing asthe oxygen-permeable ones in terms of performance and stability.
As plans for fossil-fuel-based power plants incorporating oxygen-permeablemembranes were developed, it became clear that hydrogen-permeable mem-branes might find use as well. In particular, this would be the case if the tempera-ture of operation was high enough that hydrogen-permeable ceramic membranescould be thermally integrated with other processes, such as reforming, oxygenseparation by membranes, gas turbines, or solid oxide fuel cells. Several researchgroups and industries have therefore focused on the possibility of developingmaterials and related technologies for ceramic hydrogen-permeable membranes.
At present, the known hydrogen-permeable dense ceramic materials are oxidesthat are mixed proton–electron conductors. We would claim that ceramic hydro-gen-separation membranes are in most aspects more challenging than their oxy-gen-permeable counterparts. Proton transport at high temperatures is fast, butthermodynamics speaks against a high concentration of protons in the materialsat high temperatures. Combinations of both high protonic and electronic conduc-
Nonporous Inorganic Membranes.Edited by Anthony F. Sammells and Michael V. MundschauCopyright © 2006 WILEY-VCH Verlag GmbH & Co. KGaA, WeinheimISBN: 3-527-31342-7
tivity appear to be remarkably rare. Doping strategies, which enhance the concen-tration of protons, mostly counteract the desired n-type electronic conductivity [1].The addition of hydrogen defects makes the defect chemistry more complex. Char-acterization of hydrogen permeation itself is more difficult as there are moresources of error and misinterpretation. It has been suggested that diffusion ofneutral hydrogen species can be a major contributor to hydrogen permeation –not only in metals, but also in ceramics, to a larger extent than formerly antici-pated [2]. Finally, framework materials with sub-nano-sized cages appear to pro-vide interesting borderline cases between microporous hydrogen permeation andmixed ionic–electronic conduction [3].
This chapter aims to keep these challenges in mind as we review the defectchemistry, transport theory and aspects of characterization of hydrogen permea-tion in dense ceramics. We will first look at some applications and simpleschemes of operation of hydrogen-permeable membranes and then, briefly, at theliterature and status of hydrogen-permeable dense ceramics.
1.2Applications and Principles of Operation
1.2.1Simple Cases
In the following, we examine some applications and the principles involved. Pro-cesses may have different conditions that establish the driving forces and fluxes ofhydrogen and other species in different ways. In addition to hydrogen, it is of par-ticular interest to look at driving forces for oxygen transport, because many denseceramic hydrogen membranes also conduct oxygen ions.
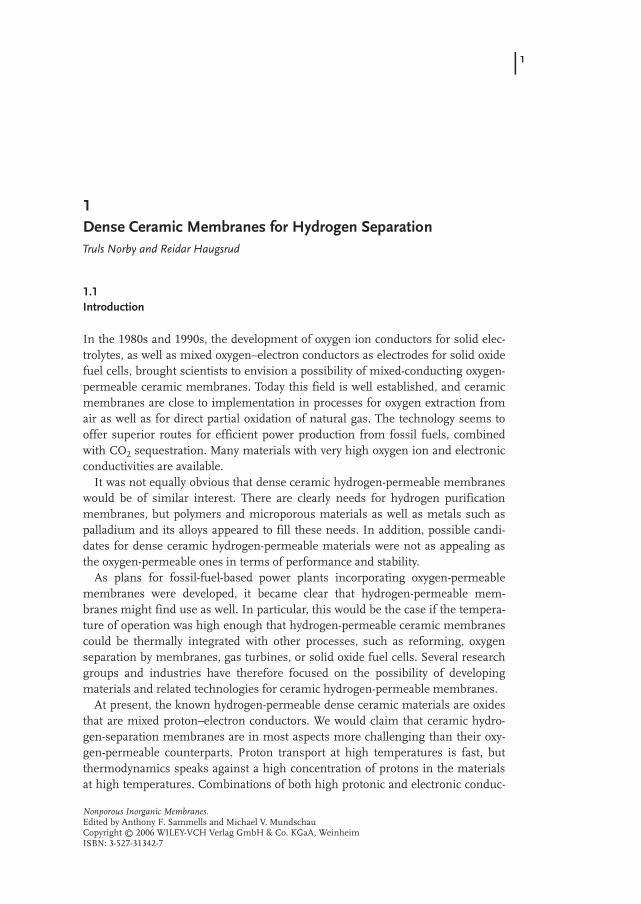
Hydrogen-separation membranes extract hydrogen from mixtures of gasesusing a hydrogen partial pressure gradient as the driving force. This can beachieved using high pressure on the feed side or low pressure on the permeateside. Figure 1.1 shows hydrogen separation from nitrogen as an example.
1 Dense Ceramic Membranes for Hydrogen Separation2
a) b)
Figure 1.1 Schematic representation ofhydrogen permeable membranes. Separationfrom a mixture with nitrogen is used as anexample. The driving force is provided by ahigh total pressure on the feed side or pump-
ing on the permeate side. Gradient in hydrogenchemical potential is illustrated qualitatively.(a) Permeation of molecules (as in porousmaterials) or neutral atoms (as in metals).(b) Mixed proton–electron conductor.
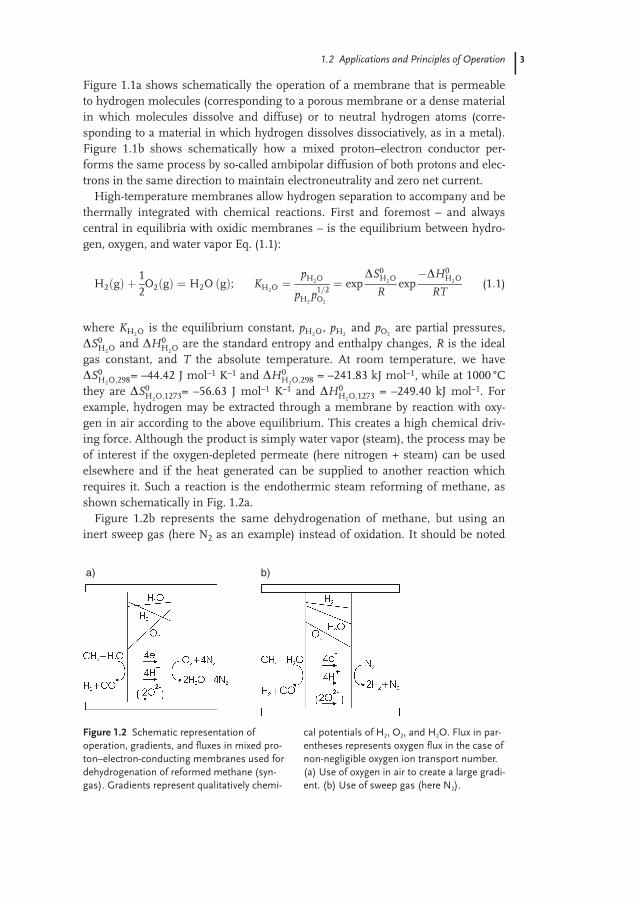
Figure 1.1a shows schematically the operation of a membrane that is permeableto hydrogen molecules (corresponding to a porous membrane or a dense materialin which molecules dissolve and diffuse) or to neutral hydrogen atoms (corre-sponding to a material in which hydrogen dissolves dissociatively, as in a metal).Figure 1.1b shows schematically how a mixed proton–electron conductor per-forms the same process by so-called ambipolar diffusion of both protons and elec-trons in the same direction to maintain electroneutrality and zero net current.
High-temperature membranes allow hydrogen separation to accompany and bethermally integrated with chemical reactions. First and foremost – and alwayscentral in equilibria with oxidic membranes – is the equilibrium between hydro-gen, oxygen, and water vapor Eq. (1.1):
H2�g� �12O2�g� � H2O �g�; KH2O �
pH2O
pH2p1�2
O2
� expDS0
H2O
Rexp�DH0
H2O
RT(1�1)
where KH2O is the equilibrium constant, pH2O, pH2and pO2
are partial pressures,DS0
H2O and DH0H2O are the standard entropy and enthalpy changes, R is the ideal
gas constant, and T the absolute temperature. At room temperature, we haveDS0
H2O�298= –44.42 J mol–1 K–1 and DH0H2O�298 = –241.83 kJ mol–1, while at 1000 °C
they are DS0H2O�1273= –56.63 J mol–1 K–1 and DH0
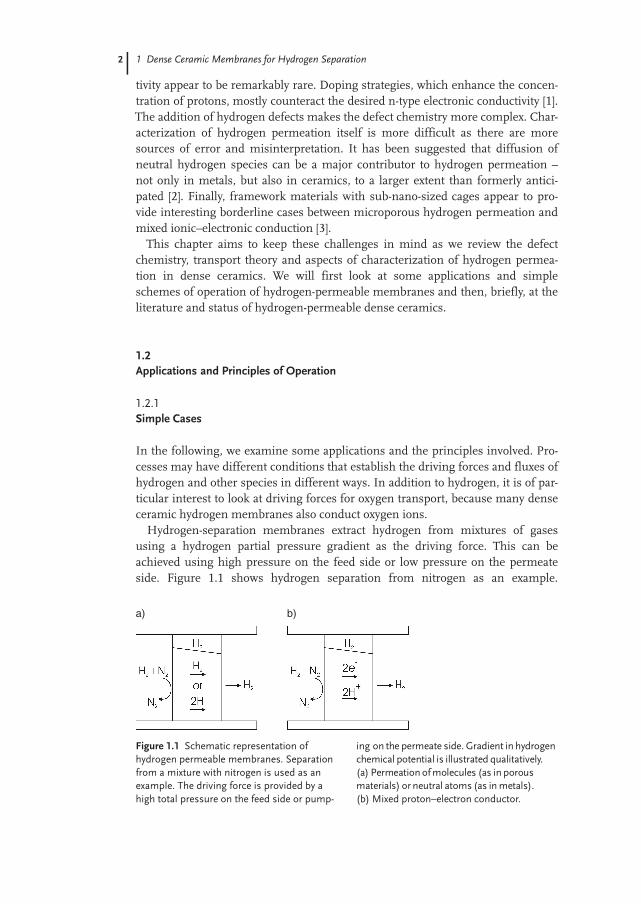
H2O�1273 = –249.40 kJ mol–1. Forexample, hydrogen may be extracted through a membrane by reaction with oxy-gen in air according to the above equilibrium. This creates a high chemical driv-ing force. Although the product is simply water vapor (steam), the process may beof interest if the oxygen-depleted permeate (here nitrogen + steam) can be usedelsewhere and if the heat generated can be supplied to another reaction whichrequires it. Such a reaction is the endothermic steam reforming of methane, asshown schematically in Fig. 1.2a.
Figure 1.2b represents the same dehydrogenation of methane, but using aninert sweep gas (here N2 as an example) instead of oxidation. It should be noted
31.2 Applications and Principles of Operation
a) b)
Figure 1.2 Schematic representation ofoperation, gradients, and fluxes in mixed pro-ton–electron-conducting membranes used fordehydrogenation of reformed methane (syn-gas). Gradients represent qualitatively chemi-
cal potentials of H2, O2, and H2O. Flux in par-entheses represents oxygen flux in the case ofnon-negligible oxygen ion transport number.(a) Use of oxygen in air to create a large gradi-ent. (b) Use of sweep gas (here N2).
1 Dense Ceramic Membranes for Hydrogen Separation
that the wet nitrogen output from the membrane in Fig. 1.2a could be used for astage operated like the membrane in Fig. 1.2b.
In Fig. 1.2, oxygen activity gradients are indicated. If the transport number ofoxygen ions is significant, the hydrogen flux can be accompanied by an oxygenflux. If hydrogen and oxygen ions flow in the same direction (as would be the casein Fig. 1.2b), water appears in the permeate along with the hydrogen. If they flowin opposite directions (as in Fig. 1.2a), the oxygen flux adds to the oxidation of thereformed methane and depletion of oxygen on the air side. The latter indicatesthat mixed proton, oxygen ion, and electron conduction can be useful.
1.2.2Examples of More Complex Applications
The utilization of hydrogen-separation membranes in large-scale chemical pro-cessing or in fossil-fueled power plants may be enhanced by combining morethan one stage and by integration with other types of devices, such as heat exchan-gers, catalytic reactors, gas turbines, or fuel cells. Figure 1.3 shows schematicallyan example of the combined use of oxygen- and hydrogen-permeable membranes.
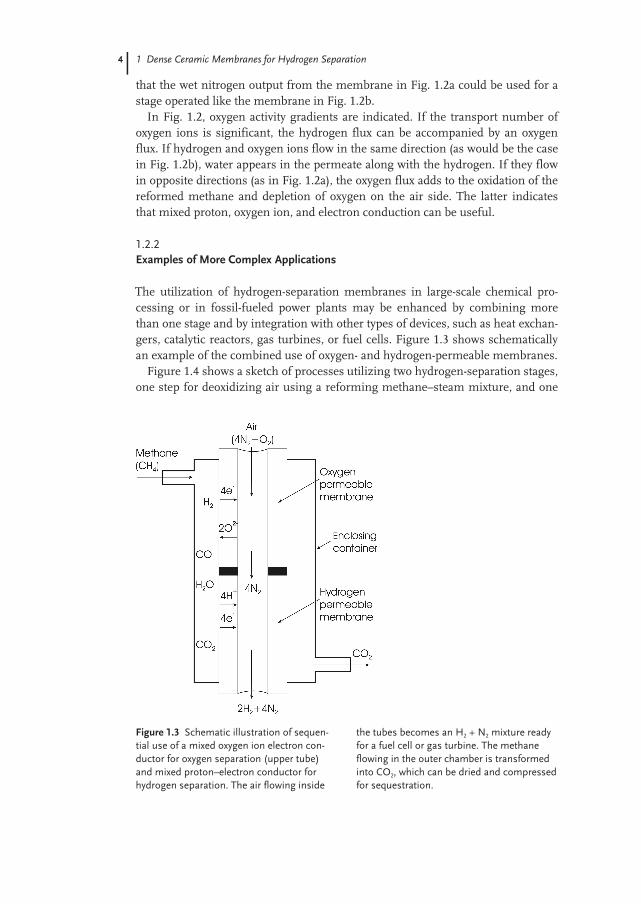
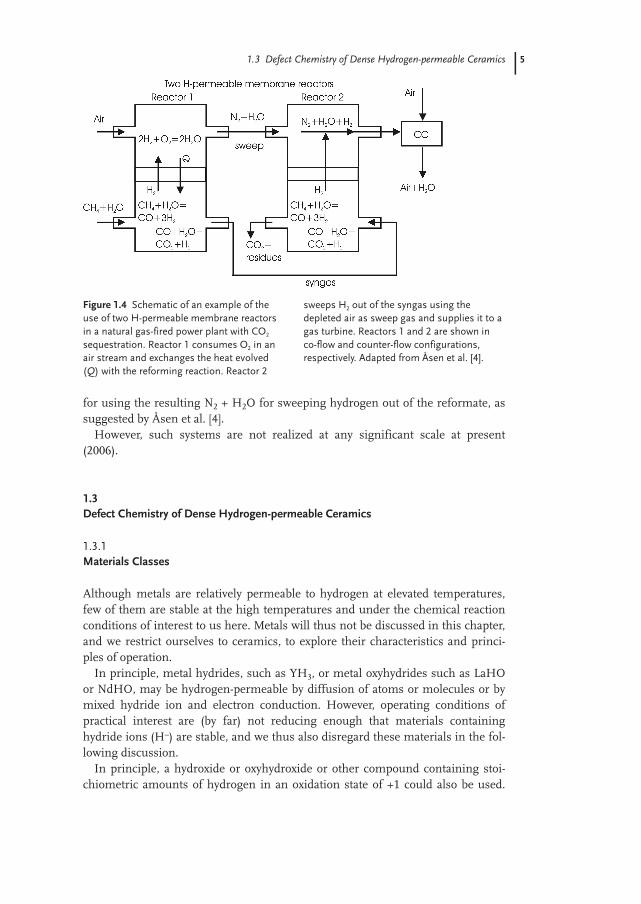
Figure 1.4 shows a sketch of processes utilizing two hydrogen-separation stages,one step for deoxidizing air using a reforming methane–steam mixture, and one
4
Figure 1.3 Schematic illustration of sequen-tial use of a mixed oxygen ion electron con-ductor for oxygen separation (upper tube)and mixed proton–electron conductor forhydrogen separation. The air flowing inside
the tubes becomes an H2 + N2 mixture readyfor a fuel cell or gas turbine. The methaneflowing in the outer chamber is transformedinto CO2, which can be dried and compressedfor sequestration.
1.3 Defect Chemistry of Dense Hydrogen-permeable Ceramics
for using the resulting N2 + H2O for sweeping hydrogen out of the reformate, assuggested by Åsen et al. [4].
However, such systems are not realized at any significant scale at present(2006).
1.3Defect Chemistry of Dense Hydrogen-permeable Ceramics
1.3.1Materials Classes
Although metals are relatively permeable to hydrogen at elevated temperatures,few of them are stable at the high temperatures and under the chemical reactionconditions of interest to us here. Metals will thus not be discussed in this chapter,and we restrict ourselves to ceramics, to explore their characteristics and princi-ples of operation.
In principle, metal hydrides, such as YH3, or metal oxyhydrides such as LaHOor NdHO, may be hydrogen-permeable by diffusion of atoms or molecules or bymixed hydride ion and electron conduction. However, operating conditions ofpractical interest are (by far) not reducing enough that materials containinghydride ions (H–) are stable, and we thus also disregard these materials in the fol-lowing discussion.
In principle, a hydroxide or oxyhydroxide or other compound containing stoi-chiometric amounts of hydrogen in an oxidation state of +1 could also be used.
5
Figure 1.4 Schematic of an example of theuse of two H-permeable membrane reactorsin a natural gas-fired power plant with CO2
sequestration. Reactor 1 consumes O2 in anair stream and exchanges the heat evolved(Q) with the reforming reaction. Reactor 2
sweeps H2 out of the syngas using thedepleted air as sweep gas and supplies it to agas turbine. Reactors 1 and 2 are shown inco-flow and counter-flow configurations,respectively. Adapted from Åsen et al. [4].
1 Dense Ceramic Membranes for Hydrogen Separation
However, no such material is known in which mixed proton–electron conductionis sufficiently high in the solid state at high temperatures. Therefore, in effect, thematerials that we will consider are all nominally hydrogen-free. They are com-pounds – hitherto exclusively oxides – that dissolve hydrogen defects in equilibri-um with the surrounding process gases. We now concentrate on the defects thatgive rise to hydrogen transport in these materials. Later we derive expressions forthe flux through membranes of the materials.
1.3.2Neutral and Ionized Hydrogen Species in Oxides
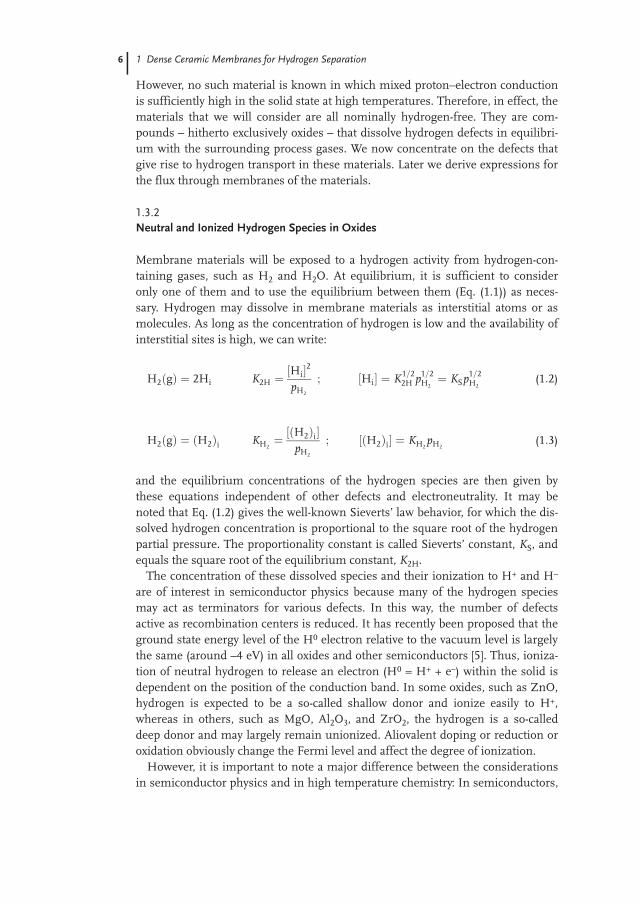
Membrane materials will be exposed to a hydrogen activity from hydrogen-con-taining gases, such as H2 and H2O. At equilibrium, it is sufficient to consideronly one of them and to use the equilibrium between them (Eq. (1.1)) as neces-sary. Hydrogen may dissolve in membrane materials as interstitial atoms or asmolecules. As long as the concentration of hydrogen is low and the availability ofinterstitial sites is high, we can write:
H2�g� � 2Hi K2H ��Hi�2pH2
� �Hi� � K1�22H p1�2
H2� KSp1�2
H2(1�2)
H2�g� � �H2�i KH2� ��H2�i�
pH2
� ��H2�i� � KH2pH2
(1�3)
and the equilibrium concentrations of the hydrogen species are then given bythese equations independent of other defects and electroneutrality. It may benoted that Eq. (1.2) gives the well-known Sieverts’ law behavior, for which the dis-solved hydrogen concentration is proportional to the square root of the hydrogenpartial pressure. The proportionality constant is called Sieverts’ constant, KS, andequals the square root of the equilibrium constant, K2H.
The concentration of these dissolved species and their ionization to H+ and H–
are of interest in semiconductor physics because many of the hydrogen speciesmay act as terminators for various defects. In this way, the number of defectsactive as recombination centers is reduced. It has recently been proposed that theground state energy level of the H0 electron relative to the vacuum level is largelythe same (around –4 eV) in all oxides and other semiconductors [5]. Thus, ioniza-tion of neutral hydrogen to release an electron (H0 = H+ + e–) within the solid isdependent on the position of the conduction band. In some oxides, such as ZnO,hydrogen is expected to be a so-called shallow donor and ionize easily to H+,whereas in others, such as MgO, Al2O3, and ZrO2, the hydrogen is a so-calleddeep donor and may largely remain unionized. Aliovalent doping or reduction oroxidation obviously change the Fermi level and affect the degree of ionization.
However, it is important to note a major difference between the considerationsin semiconductor physics and in high temperature chemistry: In semiconductors,
6
1.3 Defect Chemistry of Dense Hydrogen-permeable Ceramics
the hydrogen is present from the fabrication or is inserted, for example, by ionbombardment or by thermal in-diffusion. Thereafter, the hydrogen is largely con-sidered immobile and at constant total concentration distributed between H–, H0,and H+ states. In high-temperature electrochemistry, on the other hand, thehydrogen species in the solid are in equilibrium with the gas phase according tothe equations above. Thus, a particular material at a given temperature and partialpressure of molecular hydrogen, pH2
, will have a given concentration of neutralhydrogen species irrespective of doping or Fermi level of the oxide. The latter willsurely affect the concentration of ionized species, but the former equilibria willascertain that the concentrations of neutral species are at their equilibrium levels.
The equilibrium concentrations of hydrogen atoms and molecules in oxides areperhaps not widely different between different oxides. As a first estimate, theentropy of the reaction from one mole of H2 gas to (H2)i or 2Hi in the solid maybe expected to be –120 J mol–1 K–1, implying that at very high temperatures(entropy controlled) we would have occupied site fractions of the order of 1 ppmof the interstitial sites for (H2)i and 0.1% for Hi. The enthalpy of dissolution,which determines how the concentrations develop with decreasing temperature,contains the bonding of the H species in the lattice or to existing defects and – inthe case of atoms Hi – the breaking of the bond (435 kJ mol–1) of the H2 molecule.The total may come out positive or negative.
In addition to interstitial dissolution, one may envision hydrogen dissolved sub-stitutionally, that is, in vacancies of oxygen ions or of metal cations. The reasoningfor this is that once the site is vacant, there should be little energy cost – perhapseven a gain – in dissolving the neutral hydrogen species there. This hydrogenmay be mobile by motion of the vacancy. However, we will not discuss substitu-tional hydrogen defects further here.
All in all, the equilibrium concentration of neutral hydrogen species willdepend on pH2
and temperature, but not on Fermi level, doping or oxygen activity(at constant pH2
). The concentrations will probably not be very high, but also notvery low either. Their temperature dependences are probably not very strong.
The neutral hydrogen species may give rise to considerable hydrogen perme-ability, a possibility considered by some scientists, as we shall see towards the endof this chapter, but in general not in the gas separation membrane community.
1.3.4Protonic Defects and Their Transport
Next, we consider the protonic state of hydrogen. A proton is an elementary posi-tive particle with radius of only 10–15 m (105 times smaller than any other chemi-cal species). Protons cannot persist in the free state in a chemical environmentbut are attracted into nearby electron clouds. In oxides and other oxidic materials,attraction will be to oxygen anions to form the hydroxide ion, OH–. As such, theproton residing on a normal oxygen ion can be considered as an interstitial pro-ton, Hi
� (but with the interstitial site strongly displaced towards a particular oxy-gen ion) or as a substitutional hydroxide ion, OH�O.
7
1 Dense Ceramic Membranes for Hydrogen Separation
The predominating transport mechanism for such protons is by free protonjumps (Grotthus mechanism) between neighboring oxygen ions although, statisti-cally, a concentration of oxygen vacancies will enable some protons to move asOH– ions when the host oxygen ions jump to vacancies.
Transport of protons through an oxidic lattice is a complicated process. Theeffective activation energies range from 30 kJ mol–1 for the fastest proton-conduct-ing solid acids such as CsHSO4, and typically 50 kJ mol–1 for barium-based perov-skite oxides, to 100 kJ mol–1 and above for other oxides in which the latticebecomes more densely packed. The proton in most cases spends most of the timerotating around the oxygen ion, forming temporary hydrogen bonds to neighbor-ing oxygen ions. More rarely it jumps over the hydrogen bond to a neighboringoxygen ion. The activation energy for this in a static lattice is high – much higherthan the observed activation energies. Dynamic modeling shows that the vibra-tions (phonons) of the host sublattice are essential to facilitate proton jumps. Astwo neighboring oxygen ions temporarily move closer during a vibration, the acti-vation energy for proton transfer reduces, allowing the proton to jump over ortunnel through the barrier. For this reason, wide lattices with extensive oxygendynamics, as in BaMO3 perovskites, have high proton mobilities, while very close-packed, stiff lattices as in a-Al2O3 have the lowest proton mobilities – despite theshorter nominal O–O-distances in the latter.
According to the above, proton mobilities should be characterized by an activa-tion energy that is dominated by a fraction of the activation energy for oxygenvacancy mobility. This is because the oxygen ion host has only to partly penetratethe energy barrier of approach to a neighboring site, whereas the jump to avacancy would have required overcoming the full energy barrier. In addition, thereremains a small activation energy for the proton transfer. As a rule of thumb, theeffective activation energy for proton mobility is 2/3 that of oxygen vacancy mobil-ity. The pre-exponential factor for proton mobility should classically be an order ofmagnitude higher than for oxygen vacancy mobility because of the low reducedmass and high frequency of the O–H oscillator. However, several factors counter-act this [6], such as a relatively low “sticking probability” of an otherwise success-ful proton jump, and the fact that it is the oxygen ion attempt frequency that mat-ters rather than that of the proton.
1.3.5Defect Structures of Proton-conducting Oxides
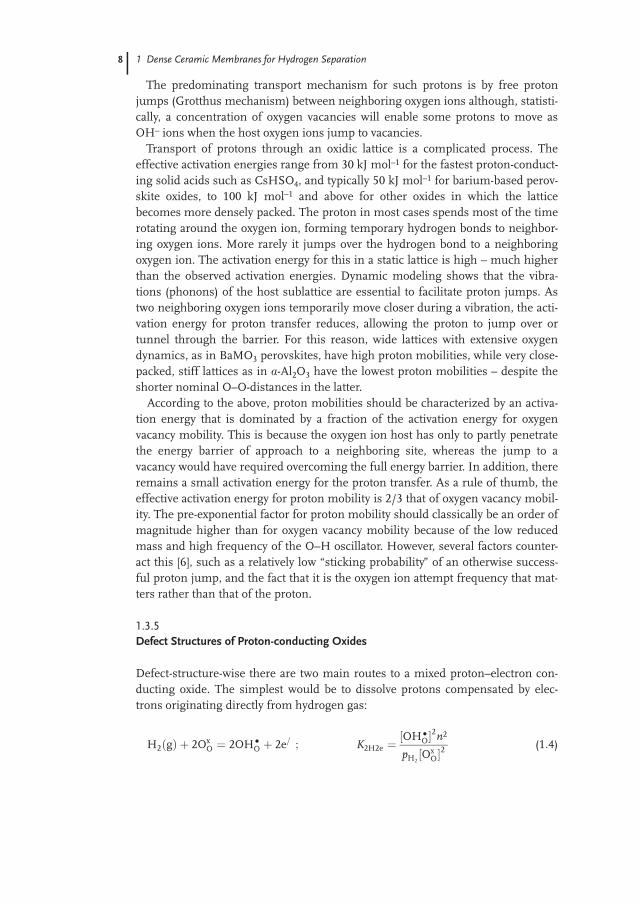
Defect-structure-wise there are two main routes to a mixed proton–electron con-ducting oxide. The simplest would be to dissolve protons compensated by elec-trons originating directly from hydrogen gas:
H2�g� � 2OxO � 2OH�O � 2e� � K2H2e �
�OH�O�2n2
pH2�Ox
O�2(1�4)
8
1.3 Defect Chemistry of Dense Hydrogen-permeable Ceramics
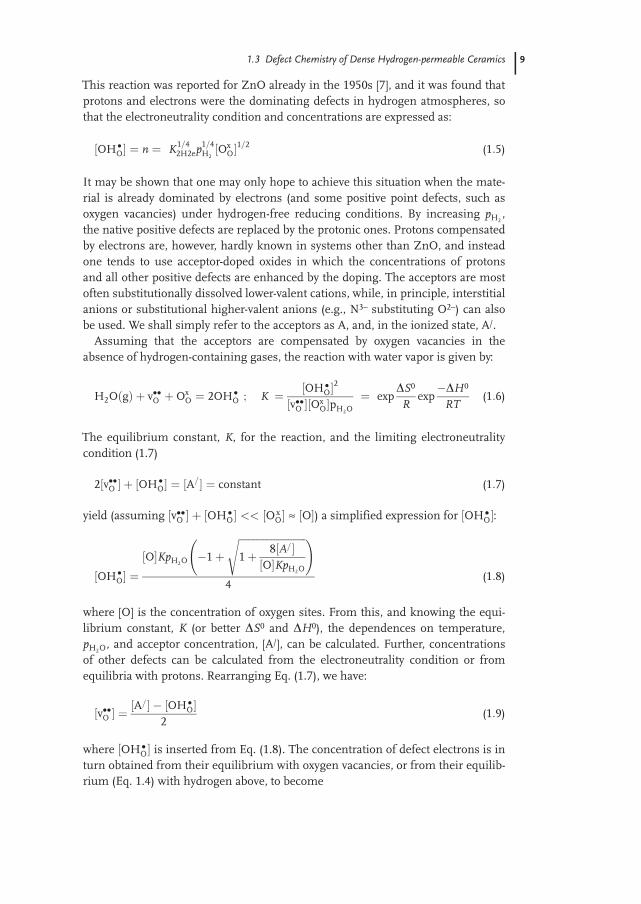
This reaction was reported for ZnO already in the 1950s [7], and it was found thatprotons and electrons were the dominating defects in hydrogen atmospheres, sothat the electroneutrality condition and concentrations are expressed as:
�OH�O� � n � K1�42H2ep1�4
H2�Ox
O�1�2 (1�5)
It may be shown that one may only hope to achieve this situation when the mate-rial is already dominated by electrons (and some positive point defects, such asoxygen vacancies) under hydrogen-free reducing conditions. By increasing pH2
,the native positive defects are replaced by the protonic ones. Protons compensatedby electrons are, however, hardly known in systems other than ZnO, and insteadone tends to use acceptor-doped oxides in which the concentrations of protonsand all other positive defects are enhanced by the doping. The acceptors are mostoften substitutionally dissolved lower-valent cations, while, in principle, interstitialanions or substitutional higher-valent anions (e.g., N3– substituting O2–) can alsobe used. We shall simply refer to the acceptors as A, and, in the ionized state, A/.
Assuming that the acceptors are compensated by oxygen vacancies in theabsence of hydrogen-containing gases, the reaction with water vapor is given by:
H2O�g� � v��O �OxO � 2OH�O � K � �OH�O�2
�v��O ��OxO�pH2O
� expDS0
Rexp�DH0
RT(1�6)
The equilibrium constant, K, for the reaction, and the limiting electroneutralitycondition (1.7)
2�v��O � � �OH�O� � �A�� � constant (1�7)
yield (assuming �v��O � � �OH�O� �� �OxO� ≈ �O�) a simplified expression for �OH�O�:
�OH�O� ��O�KpH2O �1�
���������������������������1� 8�A���O�KpH2O
�� �
4(1�8)
where [O] is the concentration of oxygen sites. From this, and knowing the equi-librium constant, K (or better DS0 and DH0), the dependences on temperature,pH2O, and acceptor concentration, [A/], can be calculated. Further, concentrationsof other defects can be calculated from the electroneutrality condition or fromequilibria with protons. Rearranging Eq. (1.7), we have:
�v��O � ��A�� � �OH�O�
2(1�9)
where �OH�O� is inserted from Eq. (1.8). The concentration of defect electrons is inturn obtained from their equilibrium with oxygen vacancies, or from their equilib-rium (Eq. 1.4) with hydrogen above, to become
9
1 Dense Ceramic Membranes for Hydrogen Separation
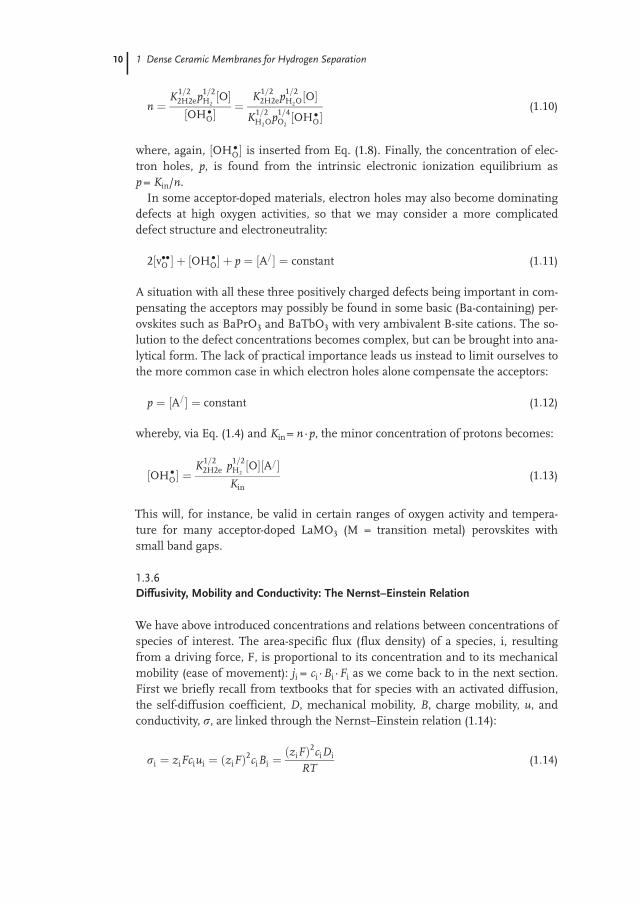
n � K1�22H2ep1�2
H2�O�
�OH�O�� K1�2
2H2ep1�2H2O�O�
K1�2H2Op1�4
O2�OH�O�
(1�10)
where, again, �OH�O� is inserted from Eq. (1.8). Finally, the concentration of elec-tron holes, p, is found from the intrinsic electronic ionization equilibrium asp = Kin/n.
In some acceptor-doped materials, electron holes may also become dominatingdefects at high oxygen activities, so that we may consider a more complicateddefect structure and electroneutrality:
2�v��O � � �OH�O� � p � �A�� � constant (1�11)
A situation with all these three positively charged defects being important in com-pensating the acceptors may possibly be found in some basic (Ba-containing) per-ovskites such as BaPrO3 and BaTbO3 with very ambivalent B-site cations. The so-lution to the defect concentrations becomes complex, but can be brought into ana-lytical form. The lack of practical importance leads us instead to limit ourselves tothe more common case in which electron holes alone compensate the acceptors:
p � �A�� � constant (1�12)
whereby, via Eq. (1.4) and Kin = n·p, the minor concentration of protons becomes:
�OH�O� �K1�2
2H2e p1�2H2�O��A��
Kin(1�13)
This will, for instance, be valid in certain ranges of oxygen activity and tempera-ture for many acceptor-doped LaMO3 (M = transition metal) perovskites withsmall band gaps.
1.3.6Diffusivity, Mobility and Conductivity: The Nernst–Einstein Relation
We have above introduced concentrations and relations between concentrations ofspecies of interest. The area-specific flux (flux density) of a species, i, resultingfrom a driving force, F, is proportional to its concentration and to its mechanicalmobility (ease of movement): ji = ci·Bi·Fi as we come back to in the next section.First we briefly recall from textbooks that for species with an activated diffusion,the self-diffusion coefficient, D, mechanical mobility, B, charge mobility, u, andconductivity, r, are linked through the Nernst–Einstein relation (1.14):
ri � ziFciui � �ziF�2ciBi ��ziF�2ciDi
RT(1�14)
10
1.4 Wagner Transport Theory for Dense Ceramic Hydrogen-Separation Membranes
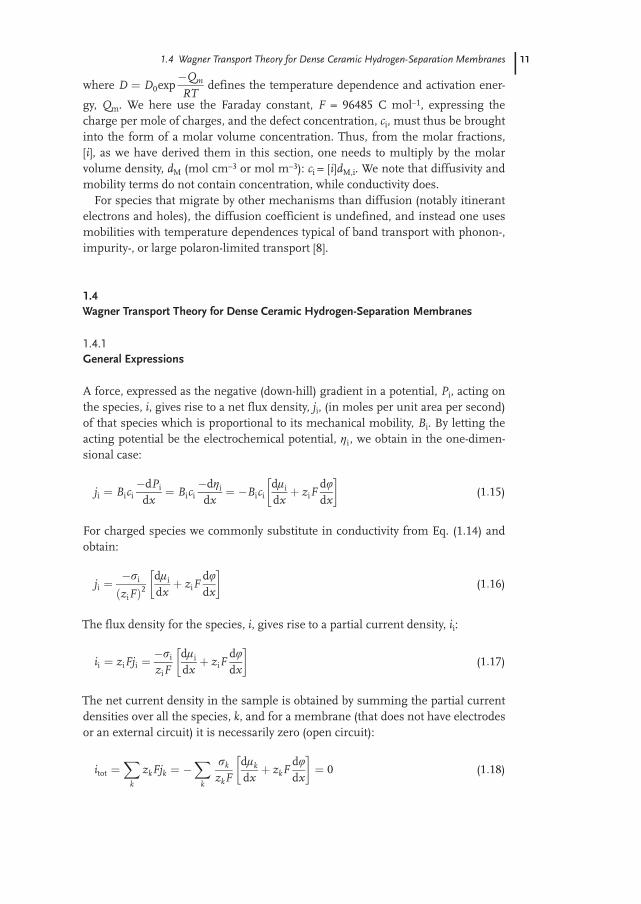
where D � D0exp�Qm
RTdefines the temperature dependence and activation ener-
gy, Qm. We here use the Faraday constant, F = 96485 C mol–1, expressing thecharge per mole of charges, and the defect concentration, ci, must thus be broughtinto the form of a molar volume concentration. Thus, from the molar fractions,[i], as we have derived them in this section, one needs to multiply by the molarvolume density, dM (mol cm–3 or mol m–3): ci = [i]dM,i. We note that diffusivity andmobility terms do not contain concentration, while conductivity does.
For species that migrate by other mechanisms than diffusion (notably itinerantelectrons and holes), the diffusion coefficient is undefined, and instead one usesmobilities with temperature dependences typical of band transport with phonon-,impurity-, or large polaron-limited transport [8].
1.4Wagner Transport Theory for Dense Ceramic Hydrogen-Separation Membranes
1.4.1General Expressions
A force, expressed as the negative (down-hill) gradient in a potential, Pi, acting onthe species, i, gives rise to a net flux density, ji, (in moles per unit area per second)of that species which is proportional to its mechanical mobility, Bi. By letting theacting potential be the electrochemical potential, gi, we obtain in the one-dimen-sional case:
ji � Bici�dPi
dx� Bici
�dgi
dx� �Bici
dli
dx� ziF
dudx
� �(1�15)
For charged species we commonly substitute in conductivity from Eq. (1.14) andobtain:
ji ��ri
�ziF�2dli
dx� ziF
dudx
� �(1�16)
The flux density for the species, i, gives rise to a partial current density, ii:
ii � ziFji ��ri
ziFdli
dx� ziF
dudx
� �(1�17)
The net current density in the sample is obtained by summing the partial currentdensities over all the species, k, and for a membrane (that does not have electrodesor an external circuit) it is necessarily zero (open circuit):
itot ��
k
zkFjk � ��
k
rk
zkFdlk
dx� zkF
dudx
� �� 0 (1�18)
11
1 Dense Ceramic Membranes for Hydrogen Separation
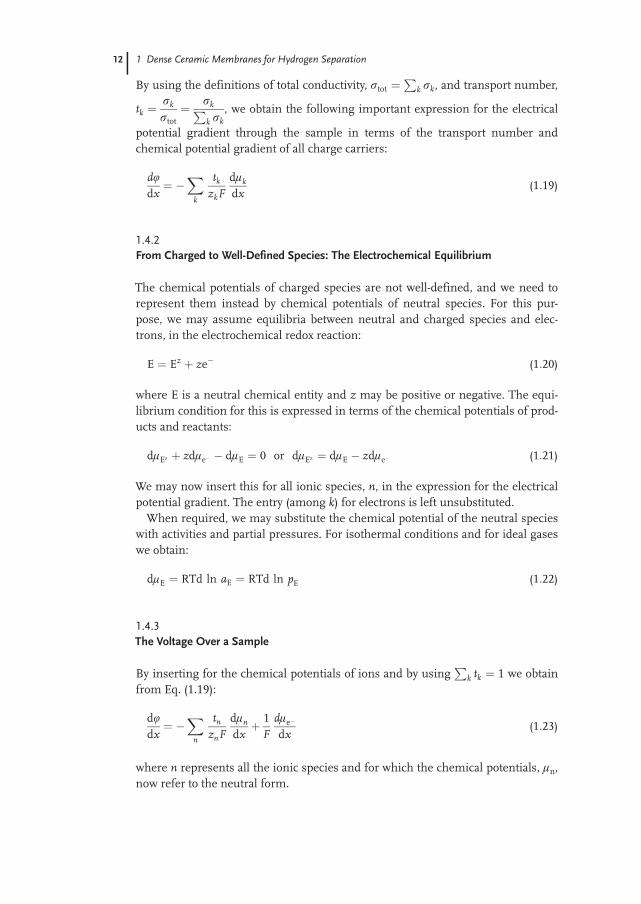
By using the definitions of total conductivity, rtot ��
k rk, and transport number,
tk �rk
rtot� rk�
k rk, we obtain the following important expression for the electrical
potential gradient through the sample in terms of the transport number andchemical potential gradient of all charge carriers:
dudx� �
�k
tk
zkFdlk
dx(1�19)
1.4.2From Charged to Well-Defined Species: The Electrochemical Equilibrium
The chemical potentials of charged species are not well-defined, and we need torepresent them instead by chemical potentials of neutral species. For this pur-pose, we may assume equilibria between neutral and charged species and elec-trons, in the electrochemical redox reaction:
E � Ez � ze� (1�20)
where E is a neutral chemical entity and z may be positive or negative. The equi-librium condition for this is expressed in terms of the chemical potentials of prod-ucts and reactants:
dlEz � zdle� � dlE � 0 or dlEz � dlE � zdle� (1�21)
We may now insert this for all ionic species, n, in the expression for the electricalpotential gradient. The entry (among k) for electrons is left unsubstituted.
When required, we may substitute the chemical potential of the neutral specieswith activities and partial pressures. For isothermal conditions and for ideal gaseswe obtain:
dlE � RTd ln aE � RTd ln pE (1�22)
1.4.3The Voltage Over a Sample
By inserting for the chemical potentials of ions and by using�
k tk � 1 we obtainfrom Eq. (1.19):
dudx� �
�n
tn
znFdln
dx� 1
Fdle�
dx(1�23)
where n represents all the ionic species and for which the chemical potentials, ln,now refer to the neutral form.
12
1.4 Wagner Transport Theory for Dense Ceramic Hydrogen-Separation Membranes
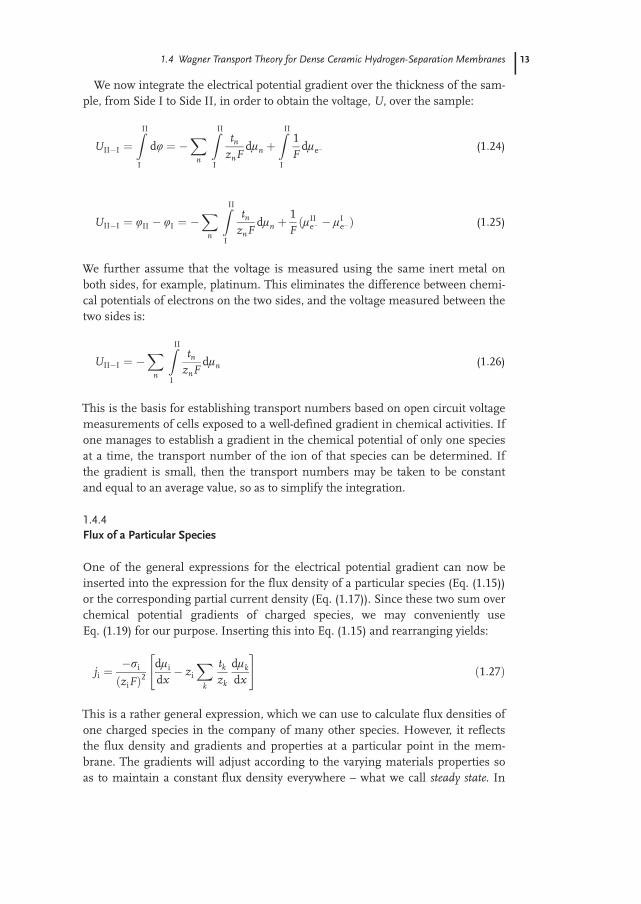
We now integrate the electrical potential gradient over the thickness of the sam-ple, from Side I to Side II, in order to obtain the voltage, U, over the sample:
UII�I �II
I
du � ��
n
II
I
tn
znFdln �
II
I
1F
dle� (1�24)
UII�I � uII � uI � ��
n
II
I
tn
znFdln �
1F�lII
e� � lIe� � (1�25)
We further assume that the voltage is measured using the same inert metal onboth sides, for example, platinum. This eliminates the difference between chemi-cal potentials of electrons on the two sides, and the voltage measured between thetwo sides is:
UII�I � ��
n
II
I
tn
znFdln (1�26)
This is the basis for establishing transport numbers based on open circuit voltagemeasurements of cells exposed to a well-defined gradient in chemical activities. Ifone manages to establish a gradient in the chemical potential of only one speciesat a time, the transport number of the ion of that species can be determined. Ifthe gradient is small, then the transport numbers may be taken to be constantand equal to an average value, so as to simplify the integration.
1.4.4Flux of a Particular Species
One of the general expressions for the electrical potential gradient can now beinserted into the expression for the flux density of a particular species (Eq. (1.15))or the corresponding partial current density (Eq. (1.17)). Since these two sum overchemical potential gradients of charged species, we may conveniently useEq. (1.19) for our purpose. Inserting this into Eq. (1.15) and rearranging yields:
ji ��ri
�ziF�2dli
dx� zi
�k
tk
zk
dlk
dx
��1�27�
This is a rather general expression, which we can use to calculate flux densities ofone charged species in the company of many other species. However, it reflectsthe flux density and gradients and properties at a particular point in the mem-brane. The gradients will adjust according to the varying materials properties soas to maintain a constant flux density everywhere – what we call steady state. In
13
1 Dense Ceramic Membranes for Hydrogen Separation
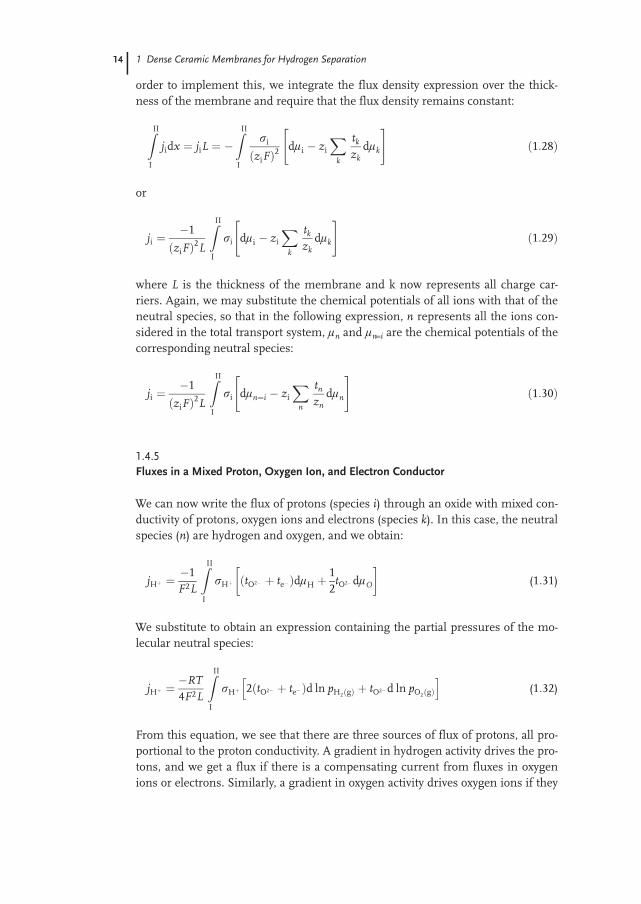
order to implement this, we integrate the flux density expression over the thick-ness of the membrane and require that the flux density remains constant:
II
I
jidx � jiL � �II
I
ri
�ziF�2dli � zi
�k
tk
zkdlk
��1�28�
or
ji ��1
�ziF�2L
II
I
ri dli � zi
�k
tk
zkdlk
��1�29�
where L is the thickness of the membrane and k now represents all charge car-riers. Again, we may substitute the chemical potentials of all ions with that of theneutral species, so that in the following expression, n represents all the ions con-sidered in the total transport system, ln and ln=i are the chemical potentials of thecorresponding neutral species:
ji ��1
�ziF�2L
II
I
ri dln�i � zi
�n
tn
zndln
��1�30�
1.4.5Fluxes in a Mixed Proton, Oxygen Ion, and Electron Conductor
We can now write the flux of protons (species i) through an oxide with mixed con-ductivity of protons, oxygen ions and electrons (species k). In this case, the neutralspecies (n) are hydrogen and oxygen, and we obtain:
jH� ��1F2L
II
I
rH� �tO2� � te� �dlH �12tO2�dlO
� �(1�31)
We substitute to obtain an expression containing the partial pressures of the mo-lecular neutral species:
jH� ��RT4F2L
II
I
rH� 2�tO2� � te� �d ln pH2�g� � tO2�d ln pO2�g��
(1�32)
From this equation, we see that there are three sources of flux of protons, all pro-portional to the proton conductivity. A gradient in hydrogen activity drives the pro-tons, and we get a flux if there is a compensating current from fluxes in oxygenions or electrons. Similarly, a gradient in oxygen activity drives oxygen ions if they
14
1.4 Wagner Transport Theory for Dense Ceramic Hydrogen-Separation Membranes
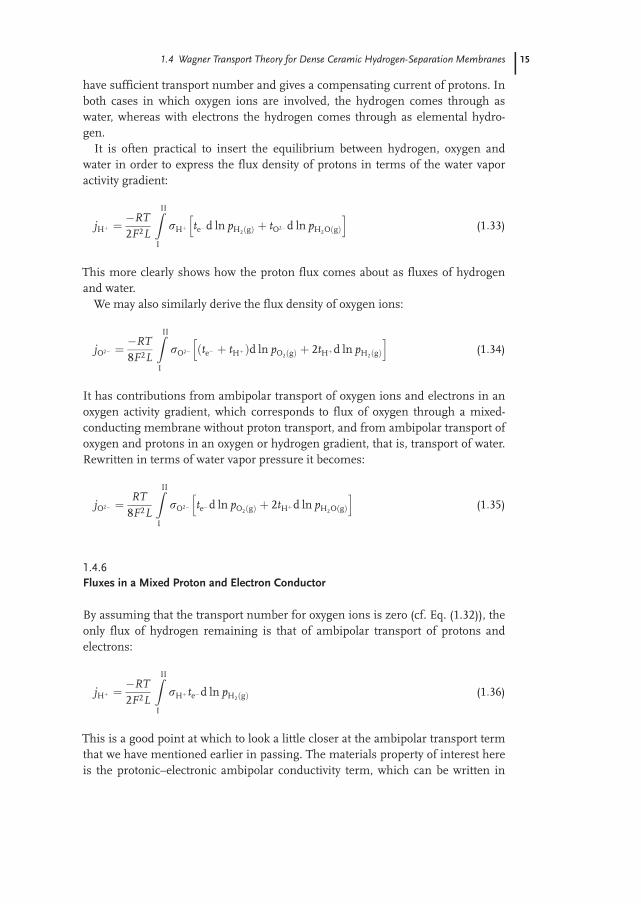
have sufficient transport number and gives a compensating current of protons. Inboth cases in which oxygen ions are involved, the hydrogen comes through aswater, whereas with electrons the hydrogen comes through as elemental hydro-gen.
It is often practical to insert the equilibrium between hydrogen, oxygen andwater in order to express the flux density of protons in terms of the water vaporactivity gradient:
jH� ��RT2F2L
II
I
rH� te�d ln pH2�g� � tO2�d ln pH2O�g��
(1�33)
This more clearly shows how the proton flux comes about as fluxes of hydrogenand water.
We may also similarly derive the flux density of oxygen ions:
jO2� � �RT8F2L
II
I
rO2� �te� � tH� �d ln pO2�g� � 2tH�d ln pH2�g��
(1�34)
It has contributions from ambipolar transport of oxygen ions and electrons in anoxygen activity gradient, which corresponds to flux of oxygen through a mixed-conducting membrane without proton transport, and from ambipolar transport ofoxygen and protons in an oxygen or hydrogen gradient, that is, transport of water.Rewritten in terms of water vapor pressure it becomes:
jO2� � RT8F2L
II
I
rO2� te�d ln pO2�g� � 2tH�d ln pH2O�g��
(1�35)
1.4.6Fluxes in a Mixed Proton and Electron Conductor
By assuming that the transport number for oxygen ions is zero (cf. Eq. (1.32)), theonly flux of hydrogen remaining is that of ambipolar transport of protons andelectrons:
jH� ��RT2F2L
II
I
rH� te�d ln pH2�g� (1�36)
This is a good point at which to look a little closer at the ambipolar transport termthat we have mentioned earlier in passing. The materials property of interest hereis the protonic–electronic ambipolar conductivity term, which can be written in
15
1 Dense Ceramic Membranes for Hydrogen Separation
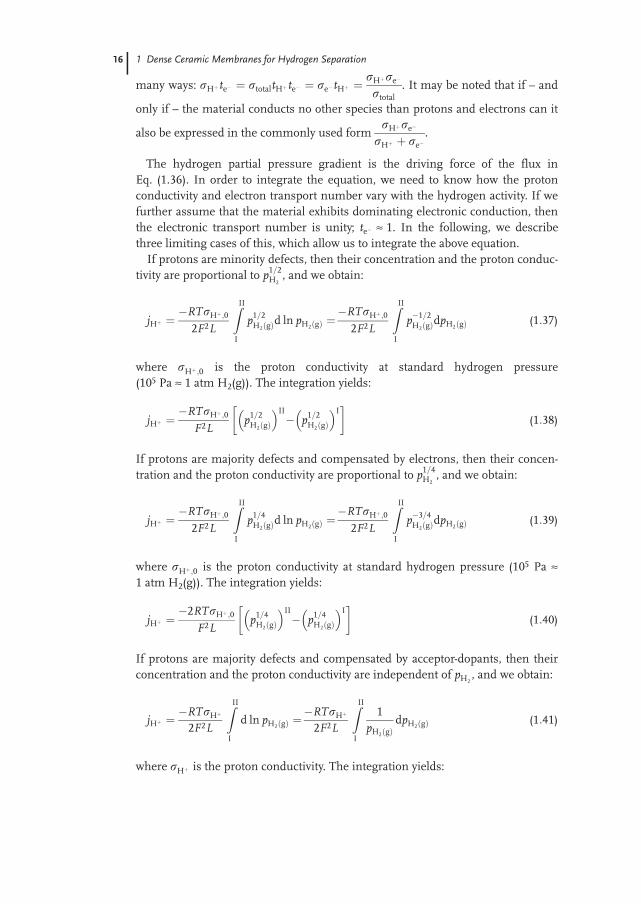
many ways: rH� te� � rtotaltH� te� � re� tH� �rH�re�
rtotal. It may be noted that if – and
only if – the material conducts no other species than protons and electrons can it
also be expressed in the commonly used formrH�re�
rH� � re�.
The hydrogen partial pressure gradient is the driving force of the flux inEq. (1.36). In order to integrate the equation, we need to know how the protonconductivity and electron transport number vary with the hydrogen activity. If wefurther assume that the material exhibits dominating electronic conduction, thenthe electronic transport number is unity; te� ≈ 1. In the following, we describethree limiting cases of this, which allow us to integrate the above equation.
If protons are minority defects, then their concentration and the proton conduc-tivity are proportional to p1�2
H2, and we obtain:
jH� ��RTrH� �0
2F2L
II
I
p1�2H2�g�d ln pH2�g� �
�RTrH� �0
2F2L
II
I
p�1�2H2�g�dpH2�g� (1�37)
where rH��0 is the proton conductivity at standard hydrogen pressure(105 Pa ≈ 1 atm H2(g)). The integration yields:
jH� ��RTrH� �0
F2Lp1�2
H2�g�� �II
� p1�2H2�g�
� �I� �
(1�38)
If protons are majority defects and compensated by electrons, then their concen-tration and the proton conductivity are proportional to p1�4
H2, and we obtain:
jH� ��RTrH� �0
2F2L
II
I
p1�4H2�g�d ln pH2�g� �
�RTrH� �0
2F2L
II
I
p�3�4H2�g�dpH2�g� (1�39)
where rH��0 is the proton conductivity at standard hydrogen pressure (105 Pa ≈1 atm H2(g)). The integration yields:
jH� ��2RTrH� �0
F2Lp1�4
H2�g�� �II
� p1�4H2�g�
� �I� �
(1�40)
If protons are majority defects and compensated by acceptor-dopants, then theirconcentration and the proton conductivity are independent of pH2
, and we obtain:
jH� ��RTrH�
2F2L
II
I
d ln pH2�g� ��RTrH�
2F2L
II
I
1pH2�g�
dpH2�g� (1�41)
where rH� is the proton conductivity. The integration yields:
16
1.4 Wagner Transport Theory for Dense Ceramic Hydrogen-Separation Membranes
jH� ��RTrH�
2F2Lln pII
H2�g� � ln pIH2�g�
�
� �2�303RTrH�
2F2Llog pII
H2�g� � log pIH2�g�
� (1�42)
In the first two cases (protons in minority or compensated by electrons), thehydrogen partial pressure on the high pressure side has a large effect on the flux,while how small the pressure is on the other side has less influence. In the last ofthe three cases, however, the differences in the logarithms (representing the loga-rithm of the ratio of the two hydrogen pressures) makes the small and the largepressure become equally important.
The minus sign in front of the flux equations arises from the flux going down-hill, that is, in the direction of negative gradient. The flux is here defined as goingin the direction from Side I towards Side II and thus becomes positive if the par-tial pressure of hydrogen is larger at Side I than at Side II.
In the above cases, we assumed that the transport number of electronic defectswas unity. Especially in the case for which protons dominate and compensateacceptors, the electronic defects may be sufficiently minor, in terms of concentra-tion, that they do not dominate the conductivity. If we consider as an alternativeapproximation that the transport number of protons is unity, then we may write:
jH� ��RT2F2L
II
I
rH� te�d ln pH2�g� ��RT2F2L
II
I
re� tH�d ln pH2�g�
� �RT2F2L
II
I
re�d ln pH2�g� (1�43)
If protons compensate acceptors, then the electronic conductivity is proportionalto p1�2
H2and p�1�2
H2, respectively, in the case of electrons (n-type) and holes (p-type) if
pO2is assumed constant. This gives:
jH� ��RTrn�0
2F2L
II
I
p1�2H2
d ln pH2�g� ��RTrn�0
2F2L
II
I
p�1�2H2
dpH2�g�
� �RTrn�0
F2Lp1�2
H2
� �II� p1�2
H2
� �I� �
(1�44)
for limiting n-type conductivity, and
17
1 Dense Ceramic Membranes for Hydrogen Separation
jH� ��RTrp�0
2F2L
II
I
p�1�2H2
d ln pH2�g� ��RTrp�0
2F2L
II
I
p�3�2H2
dpH2�g�
� RTrp�0
F2Lp�1�2
H2
� �II� p�1�2H2
� �I� �
(1�45)
for limiting p-type conductivity, where rn and rp are electron and hole conductiv-ities, and rn,0 and rp,0 are conductivities at standard hydrogen pressure (105 Pa ≈1 atm H2(g)).
There are, of course, other limiting situations that may be considered, for exam-ple if protons are compensated by negative point defects such as metal vacanciesor oxygen interstitials. These are, however, mainly dominant under oxidizing con-ditions, not commonly considered for hydrogen-separation processes.
Before we move on to more special cases, we take this opportunity to remindthe reader of the many different pressure dependences we get for fluxes of densemembranes, and mixed conducting ones in particular. This is why permeabilitiesin dense mixed conducting membranes most often cannot be given as simply andin the same units as permeability in other types of membranes. We will return tothe consequences of this when we quote example literature values in Section1.9.1.
1.4.7Fluxes in a Mixed Proton and Oxygen Ion Conductor
If the material is a mixed proton and oxygen ion conductor and has a negligibletransport number for electronic defects, then we have:
jH� ��RT2F2L
II
I
rH� tO2�d ln pH2O�g� (1�46)
that is, the water vapor pressure gradient is the driving force. Typically, the oxideis acceptor-doped, and protons and oxygen vacancies compete to be the compen-sating defect. If oxygen vacancies are dominant, then their concentration is inde-pendent of pH2O, while the proton concentration increases with p1�2
H2O. If on theother hand, the protons are dominant and therefore constant, then the concentra-tion of oxygen vacancies decreases with p�1
H2O. Depending on whether the materialhas a transport number of any of the two that can be set equal to unity, thesedependences can be inserted into the remaining limiting conductivity, and theequation easily integrated.
18
1.4 Wagner Transport Theory for Dense Ceramic Hydrogen-Separation Membranes
1.4.8Fluxes in a Mixed Proton, Oxygen Ion, and Electron Conductor Revisited
In ambipolar diffusion of protons and oxygen ions, the two types of ions move inthe same direction for charge compensation, and the net result is permeation ofwater. If we also have electronic transport, then the transport of hydrogen and oxy-gen ions may be de-coupled. They may move in the same direction or in oppositedirections and at different ratios.
Consider, for instance, a mixed-conducting membrane exposed to wet hydrogenon one side and wet argon on the other. The intention might be to measure thehydrogen permeability by measuring the amount of hydrogen in the argon sidepermeate gas. If the water vapor pressures are equal, there will be no ambipolartransport of water in any direction. Hydrogen will permeate from the high hydro-gen partial pressure side to the low. The flux will be proportional to the ambipolarproton–electron conductivity, and hydrogen will appear in the permeate. But atthe same time, oxygen ions will move in the opposite direction, from the higheroxygen activity in the wet argon to the lower in the wet hydrogen, and the oxygenis taken from the water vapor in the argon. This flux is limited by the ambipolaroxygen ion–electron conductivity. As a result of this flux, hydrogen is formed inthe argon, and it may be difficult experimentally to distinguish whether the hydro-gen arises from proton transport or oxygen ion transport. Only analysis of thewater vapor balance on one or both sides – usually difficult enough in itself – candistinguish one from the other or give a correct balance between proton and oxy-gen ion conductivity. The two opposite fluxes of protons and oxygen ions bothgive charge transport in the same direction, and they are compensated by a flux ofelectrons being the sum of the two.
In the case discussed here, where three or more species (e.g., A, B, C) providecharge transport, it may, as mentioned earlier, be important to keep the pairwiseambipolar conductivities in the correct form, and to be aware of the inequality:
rAtB � rtotaltAtB �rArB
rtotal≠
rArB
rA � rB�
1.4.9Permeation of Neutral Hydrogen Species
To express the diffusion of hydrogen as neutral species, we can use the same start-ing point as for charged species: From Eq. (1.15) and by substitution withEq. (1.14), flux densities of hydrogen atoms and hydrogen molecules expressed interms of diffusivities become:
jH ��DHcH
RTdlH
dx� �DHcH
2
d ln pH2�g�dx
(1�47)
19
1 Dense Ceramic Membranes for Hydrogen Separation
jH2� �DH2
cH2
RT
dlH2
dx� �DH2
cH2
d ln pH2�g�dx
(1�48)
Integration over the membrane thickness yields:
jH ��12L
II
I
DHcHd ln pH2�g� (1�49)
jH2� �1
L
II
I
DH2cH2
d ln pH2�g� (1�50)
Assuming that the diffusivities are independent of concentration, and that theconcentrations are given by the equilibria with hydrogen partial pressure treatedearlier, we obtain:
jH ��DHK1�2
2H
2L
II
I
p1�2H2�g�d ln pH2�g� �
�DHK1�22H
2L
II
I
p�1�2H2�g�dpH2�g�
� �DHK1�22H
L�p1�2
H2�g��II � �p1�2
H2�g��I
� (1�51)
jH2� �DH2
KH2
L
II
I
pH2�g�d ln pH2�g� ��DH2
KH2
L
II
I
dpH2�g�
� �DH2KH2
LpII
H2�g� � pIH2�g�
� (1�52)
in which K2H and KH2 are the equilibrium constants of the dissolution of twoatoms or one molecule, respectively, from one hydrogen molecule. It may benoted as before that K2H is equal to the square of the Sieverts’ law constant:K2H � K2
S.We note that the molecular flux is proportional to the difference in hydrogen
pressure (as in gas phase transport through a porous membrane), whereas atomictransport has a square root dependence, and as such would behave similarly toambipolar transport of protons and electrons limited by the conductivity of a mi-nority concentration of protons.
20
1.5 Surface Kinetics of Hydrogen Permeation in Mixed Proton-Electron Conductors
1.4.10What About Hydride Ions?
There have been some speculations about the existence and transport of hydrideions (H–) in oxides under reducing conditions, but according to thermodynamicdata of hydrides, the conditions for a hydrogen-separation membrane will bemuch too oxidizing for hydride ions to be stable [9]. Moreover, the apparent indica-tions of hydride ions in the literature have now been rationalised by other, morecredible phenomena, actually arising from transport of neutral hydrogen [2].Therefore, it seems, at present, that hydride ions play no role in hydrogen permea-tion in oxides.
1.5Surface Kinetics of Hydrogen Permeation in Mixed Proton-Electron Conductors
As the mixed proton and electron conductive oxide membrane becomes suffi-ciently thin, surface kinetics will become important, and diffusion of protonsacross the membrane will no longer be rate determining for the overall hydrogenflux. Bouwmeester et al. [10] defined a characteristic thickness, LC, for membraneswhere surface kinetics and bulk kinetics are equally important to the flux.Decreasing a membrane’s thickness below LC gives essentially no increase in theflux.
To the best of our knowledge, there is yet no literature example where surfacekinetics has been proven to limit the hydrogen permeation across a mixed pro-ton–electron conducting oxide, and seemingly membrane thicknesses below LC
have thus never been reached.Generally, one may divide the overall surface reaction into adsorption–dissocia-
tion of the reacting gas molecule, and incorporation of the dissociated species.Again these may consist of more elementary reaction sequences (adsorption, dis-sociation, surface diffusion, charge transfer, several incorporation steps). Hence,the overall series of reactions describing the process from a gas molecule to a pro-tonic defect in the oxide may be complex. However, one step is often much slowerthan the others and is defined as the rate-determining step (RDS). One may envi-sage different mechanisms involved in the surface reaction for different hydro-gen-containing species, for example, H2, H2O, NH3, H2S and different hydrocar-bons. However, in the treatment below we will focus on the reaction betweenhydrogen, H2, and the oxide surface.
Rates of hydrogen dissociation on mixed proton–electron conductors have, upto now, hardly been studied. Dissociation of H2/D2 on metallic surfaces has, onthe other hand, been extensively investigated as a measure for hydrogen activa-tion. In the simplest mechanism, hydrogen is dissociatively adsorbed on themetallic surface forming two independent hydrogen atoms. Recombination anddesorption accordingly result in exchange of partner atoms. It has also been sug-gested that exchange may occur via triatomic intermediates. These two mecha-
21
1 Dense Ceramic Membranes for Hydrogen Separation
nisms are usually referred to as the Bonhoeffer–Farkas and the Rideal–Eley mech-anisms [11, 12]. The former has been observed to be operative usually at highertemperatures whereas the latter, involving intermediates, is operative only at lowtemperatures.
In the case of oxides, the catalytic activity towards H2 dissociation has beeninvestigated for several binary oxides including Cr2O3, Co3O4, NiO, ZnO, Al2O3,and some of the rare earth sesquioxides [13–16]. Most of these studies have beenperformed below room temperature, and are, as such, not directly relevant for thehigh temperature mixed proton–electron conductors. One may conclude, how-ever, from these experimental results that for higher temperatures, hydrogen dis-sociation occurs through dissociative adsorption and desorption following Bon-hoeffer–Farkas type mechanisms. On this basis, hydrogen dissociation can betreated according to the Langmuir equation. The simplest route from hydrogengas to protons dissolved in the oxide may be written:
H2�g� � 2vads � 2Hads (1�53)
Hads �OXO � OH�O � e� � vads (1�54)
As an alternative to forming electrons, hydrogen may be oxidized by annihilationof electron holes.
These reactions may be divided again into different possible intermediate steps,for example, including charged adsorbed hydrogen species (e.g., H�2 ). One shouldrecognize the difference between the redox reaction in Eqs. (1.53) and (1.54) and reac-tions where water is the source of proton incorporation as an acid/base reaction.
Surface defects are likely to act as catalytically active centers at which hydrogendissociation takes place. The electronic states of these defects may be located with-in the bandgap of the semiconducting oxide and are likely to be involved in theelectron transfer between hydrogen and the membrane [17]. In the reaction inEq. (1.53), we have not given any indication as to which sites are active for adsorp-tion. However, many of these materials are acceptor doped, and one may expectthe dopants or their compensating defects to be involved. One might speculate,for instance, whether oxygen vacancies act as electron sinks as an intermediatestep, here shown with two-electron steps:
H2�g� � v��O � 2OxO � 2OH�O � vx
O (1�55)
vxO � v��O � 2e� (1�56)
The reaction stages and species involved may be expected to be similar on the feedand permeate sides of a hydrogen membrane. If the flux is driven by reactionwith oxygen on the permeate side, this side may naturally be quite different, bothin terms of ionic species and electronic (holes versus electrons). The formation orpresence of water vapor may also play a significant role in hydrogen exchangekinetics.
22
1.5 Surface Kinetics of Hydrogen Permeation in Mixed Proton-Electron Conductors
When surface reaction limitations are in control, there is a discontinuity or asteep gradient in the chemical potential of hydrogen between the gas phase andthe initial bulk layer at the surface. This may have the form of a gradient in thegas phase next to the surface or in the actual locus between the gas phase and thesurface. Depending on the degree of surface control, more or less of the overallchemical potential gradient in the system will be set in an interfacial layer be-tween the potential in the gas phase lH(g) and the surface lH(surf). The flux ofhydrogen across the surface interfacial region may now be expressed in terms ofthe concentrations of hydrogen at the start and end of the interface (cH(g) andcH(surf)) and the phenomenological rate constant, k, or in terms of the change inconcentration, dcH, at the very rate-determining step and the rate constant, 0:
jH � k cH�g� � cH�surf �� � � �0dcH (1�57)
By using lH � l0H � RT ln aH ≈ l0
H � RT ln cH and d ln cH � d cH�cH we mayrewrite the right hand part into:
jH2� jH
2� �0
dlintH2
RT(1�58)
where 0 � 14 cH � 0 where cH is now the average concentration of hydrogen at
the rate determining step. 0 is known as the balanced exchange rate and repre-sents the coefficient between driving force (chemical potential step) and flux. Thisis useful when one needs to relate the chemical potential change over the interface(i.e., over the rate-determining step) with the remaining changes over the bulk of themembrane in order to compare bulk and interface kinetics and find LC.
In order to illustrate the possible further analysis, let us assume that the surfacekinetics is rate determined by dissociative adsorption (Eq. (1.53)). The net ratethen corresponds to:
r � k�
vads� �2�pH2� k
�
Hads� �2 (1�59)
Since this treatment is restricted to situations close to equilibrium (linear approx-imation of the Taylor series [18]), the net rate, r, is close to zero and consequently:
k�
vads� �2�pH2� k
�
Hads� �2 (1�60)
On this basis the rate constant 0 may be represented by:
0 � k�
vads� �2�pH2� k
�
Hads� �2�����������������������������������������������k� � k� � pH2
vads� �2� Hads� �2�
� vads� � � Hads� �������������������k� � k� � pH2
�(1�61)
23
1 Dense Ceramic Membranes for Hydrogen Separation
where concentrations refer to conditions sufficiently close to equilibrium. In ourparticular example of assuming dissociative adsorption as rate limiting(Eq. (1.53)), we thus arrive at a p1�2
H2�vads��Hads� dependence for the rate constant
0. At low coverage of hydrogen, we may, from Eq. (1.53), assume that[vads] = const. and �Hads�∝ p1�2
H2so that the final dependence is 0 ∝ p1�4
H2. At high
coverage we see in the same manner that 0 becomes independent of pH2. 0 can
now be inserted in 0 and jH2as above.
1.6Issues Regarding Metal Cation Transport in Hydrogen-permeable MembraneMaterials
In oxygen-permeable membranes operating in oxygen activity gradients, the metalcations in the membrane feel an opposite gradient in their own chemical poten-tial; they are drawn towards the high oxygen (feed) side. This may eventually leadto demixing and in some cases decomposition of the membrane compound. Indense, ceramic hydrogen-separation membranes in which hydrogen is extractedby reaction with oxygen in air, the situation will be much the same.
However, if the process is driven by sweeping with an inert gas or by pumping,the oxygen activity difference may be relatively small, zero, or even reversed. Therequirements for small cation diffusivities may, therefore, be eased. One mayeven stop cation diffusion in such cases completely by adjusting the water vaporcontents until the oxygen activity gradient is zero. One may also deliberatelyemploy modest temperature gradients to counteract possible isothermal oxygenactivity gradients. Aside from driving forces for cations set up by gradients in theirchemical potentials, cations may, in principle, also experience drag from migrat-ing protons, but this is probably not very strong, and examples are not known tous.
1.7Modeling Approaches
The term modeling covers widely different calculational (computer-aided) meth-odologies and tools used to handle complex sets of equations and large numbersof iterative calculations. We have chosen to include three such modeling issues inthis section, although they may have little in common in aim, methodology, andcomputer intensiveness: Defect structures, flux systems, and atomic simulations.
We have seen above that two or three defect species may dominate the defectstructure simultaneously, and we have derived analytical expressions for their con-centrations, which may be used in modeling fluxes and membrane behavior. Dif-ferent approaches exist for the increased complexity of cases with more defects:Sequential analytical breakdown of the set of equations (equilibria and charge,mass, and site balances) can be carried out by a computer program or spreadsheet
24
1.7 Modeling Approaches
[19] (and has been applied to analysis of mixed conducting hydrogen permeablemembranes [20]). This approach calculates all the concentrations quickly, and issuitable for data fitting. It requires reprogramming for each new defect structuretype. In a semi-numerical approach, the electroneutrality condition is solvednumerically for one defect (e.g., electrons) after all other defect concentrations arereplaced manually by equilibria and mass and site balances relating them to thechosen defect. This approach also converges very fast once the expressions areentered. Finally, a truly numerical approach may read all equations, and thensolve them numerically. Because the equations are mixtures of linear and non-linear equations, and because some numbers are very small, algorithms must bemade robust, and are consequently slow. One needs not enter any mathematics –just the definitions of the individual equations. This approach may thus quicklysolve new systems, but is too slow to allow efficient data fitting.
Gradients and fluxes may vary both across and along membranes. When oneadds changing limiting defect and transport situations, the overall modeling of amembrane may become very complex. In the finite element modeling approach,the membrane is split up into small geometrical slices (elements). In three di-mensions one uses finite elements; in two dimensions finite areas; and in onedimension finite lengths. Within each element, the gradients and properties areconstant (e.g., set as an average within the element) so that transport equationsbecome simple. Concentrations and fluxes must connect at boundaries betweenelements. Steady state may be imposed by equaling the fluxes in all elements in aparticular direction, but transient behaviors may also be modeled.
Finite length modeling is suitable for analyzing transport through a membrane,including the gas phase and surfaces. For analyzing the situation for gases flow-ing along a membrane, one may use finite area modeling in which each finitearea is a piece of the membrane with linear behavior and predictable flux density.For an example of finite element modeling of fluxes in proton-containing materi-als, see Ref. [21].
Atomistic simulations can nowadays reproduce the structure and elastic anddielectric properties of a range of solids quite well, using various calculationalmethods, models, and approximations. On the one hand we have static latticesimulations of idealized ion spheres with predetermined radial charge densityfunctions, interatomic potentials, and polarizabilities – allowing large numbers ofions to be included in the cell to be calculated. On the other hand we have quan-tum mechanical dynamic simulations and ab initio methods, where the accuracyand credibility is higher, but where the number of atoms in the modeled volumemust be kept relatively small. Protons turn out to be difficult to handle in anysuch modeling, since they cannot be represented by classical spheres like otherions. Still, various methods yield qualitative predictions of protons’ thermody-namics in oxides [22]. Quantum mechanical treatment of the valence electronshas enabled modeling of migration of protons on a detailed level locally, and hasprovided our present understanding of proton rotation, and jumping, and theeffect of the host lattice dynamics [23].
25
1 Dense Ceramic Membranes for Hydrogen Separation
1.8Experimental Techniques and Challenges
1.8.1Investigation of Fundamental Materials Properties
1.8.1.1 ConcentrationIn investigations of proton conducting and mixed proton conducting oxides, oneis usually interested in finding the concentration of protons and their role in thedefect structure. Absolute measures of the proton content can be determined witha number of methods, most commonly and simply by thermogravimetry (TG).Various procedures are in use:
One may measure the weight of a sample in a certain atmosphere versus tem-perature (isobars). This can be done in an oxidizing atmosphere (O2 + H2O +inert; pO2
, pH2O = constant) or in a reducing atmosphere (H2 + H2O + inert; pH2,
pH2O = constant). One may alternatively measure the weight at fixed temperature(isotherm), for example, versus pH2
or pH2O. Parameters of the defect reaction and,in turn, proton concentration versus temperature and partial pressures areextracted by modeling the weight change using the appropriate defect structure,for example, using Eq. (1.5) for protons compensated by electrons (weight changereflects H2) or Eq. (1.8) for acceptor-doped oxides dominated by oxygen vacanciesand protons (weight change reflects H2O). See Refs. [24–26] for selected examplesof TG studies of protons in oxides.
In a different procedure, one replaces all H-containing gases with deuteratedequivalents, or vice versa (H/D isotope exchange). The weight change associatedwith this gives an absolute value of the H-content regardless of defect model. SeeRefs. [27, 28] for selected examples of TG on isotope exchange.
It should be mentioned that thermogravimetry versus T, pH2, or pH2O suffers
from many potential sources of error. This includes buoyancy effects (especially ofT and pH2
), dissolution of H in balance materials such as Pt wires, adsorption ofH2O on balance parts (especially cold counterweights) and slow changes and equi-libria because H2O and D2O adsorb on apparatus and tubing walls and arechanged/exchanged slowly.
A technique used occasionally – providing one has the facility at hand – is cold neu-tron prompt gamma analysis which gives a measure of hydrogen nuclei in the sample[26]. In secondary ion mass spectrometry (SIMS) we may measure the composition –both chemical and isotopic distributions – of a material by sputtering the surface byan ion beam and analyzing the secondary ionized species with a mass spectrometer.The method is thus, in principle, ideal for analyzing H and D contents of materialsafter equilibration and cooling/quenching. It suffers from some problems of calibra-tion and backgrounds in the case of the very lowest masses, and it is for this reasonmore reliable and sensitive for D than for H. SIMS yields depth profiles and hasmicroscopic lateral resolution, and thus allows analysis of diffusion experimentprofiles. See Refs. [29, 30] for examples of SIMS studies on protons in oxides.
26
1.8 Experimental Techniques and Challenges
A number of spectroscopic methods are, in principle, well suited and have beenapplied for analysis of protons in oxides, notably infrared (IR) and Raman [31, 32],and nuclear magnetic resonance (NMR) [33]. However, their application to hightemperature proton conductors – where protons are defects rather than structuralconstituents – is not widespread. The optical techniques suffer from problems ofcontributions from surfaces and internal interfaces, while small concentrationsare troublesome for NMR. Moreover, the strength of these methods is to yieldinformation about the state and position of the hydrogen species, and it wouldthen be particularly important to apply them at high temperatures (one can hardlyexpect to freeze a proton in place by quenching), which is not easy. It is probablethat we will see a development and standardization of these techniques for studiesof high temperature proton conductors at high temperatures in the future.
Muons are elementary particles that have the same charge as a proton and1/9th of its mass. When introduced in a chemical setting like an oxide, they thusbehave like a light hydrogen ion isotope. They can take up an electron and becomemuonium, a hydrogen-like atomic species. They have short lifetimes, but one maystudy their oxidation state and environment by muon spin resonance (lSR) spec-troscopy (an analog to NMR spectroscopy). This has been used to study hydrogenin semiconductors [34] and in some cases in relevant oxides [35].
1.8.1.2 DiffusionThe diffusivity of protons can be studied using so-called pulsed field gradient(PFG) NMR [36], which gives a measure of the local random diffusion. One mayalternatively record the diffusion during a transient after changing the chemicalactivity or the H/D isotope ratio around the sample. For this, one may use gravi-metry, electrical properties, or optical spectroscopy. Commonly used today is theanalysis by SIMS of the profile after isotope exchange (see above). One may notethat the various types of experiments give self-diffusion coefficients, isotope inter-diffusion (tracer) coefficients, or chemical diffusion coefficients. The latter oftenreflects chemical diffusion of water, dominated by the slowest defect – often oxy-gen vacancies.
1.8.1.3 ConductivityThe conductivity of a material is commonly measured at high temperatures in iso-therms or isobars. Alternating current (AC) two-electrode measurements on diskscan yield the sample conductivity if the frequency is high enough that the elec-trode polarisation is eliminated. Impedance spectroscopy can give more informa-tion, both to ensure that one is not victim of parasitics or artifacts, and – in somecases – to deconvolute the impedance of the sample into contributions from graininterior, grain boundaries, and electrodes. Impedance spectroscopy can reveal theresistance across grain boundaries, but it cannot give information about parallelconductivity along grain boundaries.
27
1 Dense Ceramic Membranes for Hydrogen Separation
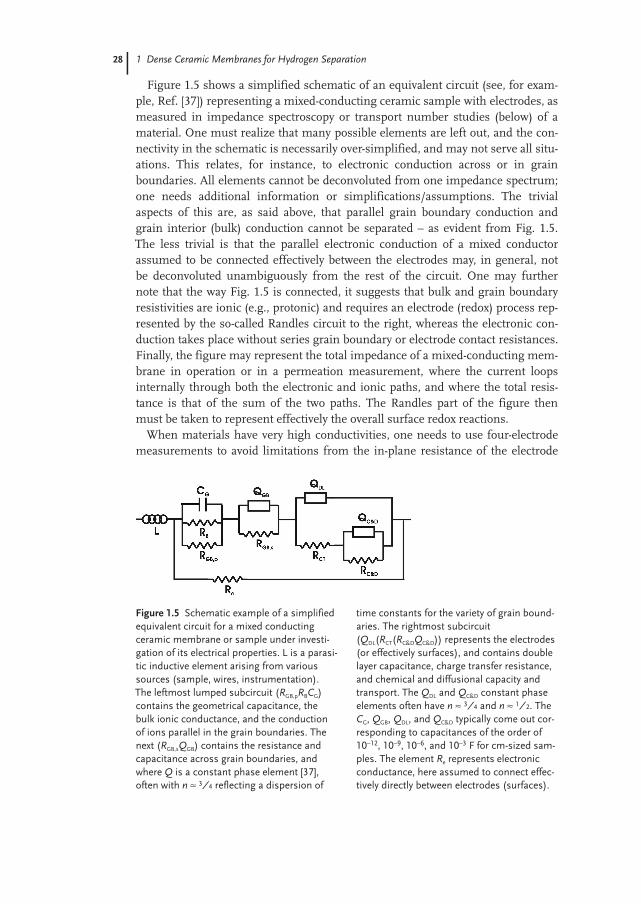
Figure 1.5 shows a simplified schematic of an equivalent circuit (see, for exam-ple, Ref. [37]) representing a mixed-conducting ceramic sample with electrodes, asmeasured in impedance spectroscopy or transport number studies (below) of amaterial. One must realize that many possible elements are left out, and the con-nectivity in the schematic is necessarily over-simplified, and may not serve all situ-ations. This relates, for instance, to electronic conduction across or in grainboundaries. All elements cannot be deconvoluted from one impedance spectrum;one needs additional information or simplifications/assumptions. The trivialaspects of this are, as said above, that parallel grain boundary conduction andgrain interior (bulk) conduction cannot be separated – as evident from Fig. 1.5.The less trivial is that the parallel electronic conduction of a mixed conductorassumed to be connected effectively between the electrodes may, in general, notbe deconvoluted unambiguously from the rest of the circuit. One may furthernote that the way Fig. 1.5 is connected, it suggests that bulk and grain boundaryresistivities are ionic (e.g., protonic) and requires an electrode (redox) process rep-resented by the so-called Randles circuit to the right, whereas the electronic con-duction takes place without series grain boundary or electrode contact resistances.Finally, the figure may represent the total impedance of a mixed-conducting mem-brane in operation or in a permeation measurement, where the current loopsinternally through both the electronic and ionic paths, and where the total resis-tance is that of the sum of the two paths. The Randles part of the figure thenmust be taken to represent effectively the overall surface redox reactions.
When materials have very high conductivities, one needs to use four-electrodemeasurements to avoid limitations from the in-plane resistance of the electrode
28
Figure 1.5 Schematic example of a simplifiedequivalent circuit for a mixed conductingceramic membrane or sample under investi-gation of its electrical properties. L is a parasi-tic inductive element arising from varioussources (sample, wires, instrumentation).The leftmost lumped subcircuit (RGB,pRBCG)contains the geometrical capacitance, thebulk ionic conductance, and the conductionof ions parallel in the grain boundaries. Thenext (RGB,sQGB) contains the resistance andcapacitance across grain boundaries, andwhere Q is a constant phase element [37],often with n ≈ 3⁄4 reflecting a dispersion of
time constants for the variety of grain bound-aries. The rightmost subcircuit(QDL(RCT(RC&DQC&D)) represents the electrodes(or effectively surfaces), and contains doublelayer capacitance, charge transfer resistance,and chemical and diffusional capacity andtransport. The QDL and QC&D constant phaseelements often have n ≈ 3⁄4 and n ≈ 1⁄2. TheCG, QGB, QDL, and QC&D typically come out cor-responding to capacitances of the order of10–12, 10–9, 10–6, and 10–3 F for cm-sized sam-ples. The element Re represents electronicconductance, here assumed to connect effec-tively directly between electrodes (surfaces).
1.8 Experimental Techniques and Challenges
material. This usually becomes important when the measured sample resistancedecreases to below around 10 ohm. Four-electrode geometries can be applied tobar samples and to disks (van der Pauw method). For mixed conductors, the cur-rent electrodes may partly obstruct ionic transport, and the resulting conductivityreflects less ionic contribution than it should. To overcome this, one may applyhigher DC voltages or use AC measurements. The van der Pauw method requires,in principle, DC measurements, but AC measurements can be applied if oneensures that a frequency is used where the response does not contain imaginarycomponents.
The total conductivity is:
r ��
i
ri ��
i
ziFciui (1�62)
where zi is the number of charges of the carrier i, ci is its concentration (inmol m–3) and ui is its charge mobility in m2 V–1 s–1. As mentioned before, the con-centration, ci, can be calculated from the mole fraction of the carrier and the molardensity of the material: ci = [i]dM,i. For diffusing species (ions or ionic defects,including protons, and small polaron electronic carriers) the charge mobility, ui, isgiven as:
ui � u0�iT�1exp��Qm�RT� �1�63�
Conductivity measured versus T and pH2O can give information about the mobilityas well as hydration thermodynamics if one can properly apply the defect modelat play and assign the total conductivity to contributions from the relevant chargecarriers. Conductivity versus pO2
is less informative in this respect, but can helpdeconvolute the total conductivity into electronic and ionic parts, as the ionic part(including the protonic) is usually pO2
-independent while the electronic ones havepO2
dependences. Refs. [38–40] exemplify typical studies of conductivity of mixedproton conductors.
Conductivity measurements are sometimes done on porous samples to speedup equilibration with the atmosphere. In this case, the measured conductivityshould be corrected for porosity, but unfortunately there is no way of doing thisaccurately for real-world pore distributions and shapes. A commonly used empiri-cal correction for modest porosities is:
r � rmeasured
d2(1�64)
where d is the relative density of the sample.
1.8.1.4 Transport NumbersThe transport numbers, ti = ri/rtotal, are essential in order to calculate individualpartial conductivities of different species from the total conductivity measure-
29
1 Dense Ceramic Membranes for Hydrogen Separation
ment. Traditionally, the transport number of ions in oxides is measured via theopen circuit voltage of oxygen concentration cells (“EMF method”) or by measur-ing conductivity with electron- or ion-blocking electrodes.
For proton-conducting materials, the EMF method can be used provided onecontrols the hydrogen and oxygen activity gradients independently. An EMF mea-surement with gradient in oxygen only (no gradient in hydrogen) yields the oxy-gen ion transport number, while a measurement with a gradient only in hydrogenactivity yields the proton transport number [41, 42].
In principle, EMF measurements reveal the sign of the hydrogen ion charge car-rier. Indications in the literature of negative charge on hydrogen ions under reduc-ing atmospheres – appearing to reflect hydride ion (H–) transport – are now attrib-uted to diffusion of neutral hydrogen in the materials, polarizing the electrodesand giving rise to false gradients [2].
A proper interpretation of EMF measurements of transport numbers shouldtake into account the polarization of electrodes in the case of ionic transport [43].This can be obtained from impedance spectra.
Transport numbers can also be obtained from chemical analyses of productsduring electrochemical pumping. Moreover, the isotope effect on proton conduc-tivity can be used to identify proton conductivity and also, to some extent, to calcu-late transport numbers quantitatively [44].
One may expect that many hydrogen-permeable oxides investigated will havehigh electronic conductivities and proton conductivities orders of magnitudelower – much the same as the oxygen ion conductivity is small in oxygen-perme-able oxides. In such cases, it is notoriously difficult to measure the transport num-ber of the ionic species by electrical methods, and instead one has to obtain theconductivity of ions indirectly through diffusion measurements, as above, orthrough permeation measurements as we shall discuss below.
1.8.1.5 Other PropertiesOf course, there are more bulk properties of interest than the above parametersrelated to transport of the fast ions and electrons. Metal cation transport is minor,but still a most crucial parameter, because it eventually leads to membrane walk-out, demixing, or decomposition in chemical gradients. Methods used for investi-gating metal cation diffusion comprise reactivity studies, interdiffusion couples,and tracer studies, using analytical SEM, EPMA, SIMS or radioactivity for the dif-fusion profile analyses.
Evaporation and chemical stability towards gases and contacting materials areother issues that need investigation. In principle, these can all be calculated fromthermodynamic data, but for most materials of interest such data are nonexistentor insufficient.
Mechanical properties are important for real applications. This is a field where,again, we need more data, in particular at high temperatures. In addition to ther-mal expansion and the problem of thermal cycling, membranes standing inchemical gradients may suffer from chemical expansion, so that one side expands
30
1.8 Experimental Techniques and Challenges
relative to the other as a result of a gradient in defect concentrations. This resultsin stresses and bending of the membrane, and is well known in oxygen separationmembranes, where the effects can be large. In proton-conducting oxides, therehave been fewer investigations: So far it seems that oxides expand when oxygenvacancies are filled and replaced by protons by hydration, but the effects are rathersmall [45]. One may investigate this with controlled atmosphere dilatometry orhigh-temperature X-ray diffraction.
1.8.2Investigation of Surface Kinetics
The surface kinetics is crucial for a membrane in operation. For oxygen separationmembranes, it has proven to be rate limiting in many cases, and has been studiedextensively. For proton-conducting materials and membranes, much less has beendone, partly because surface kinetics has been less of a problem up to now. Still,we believe membrane materials will be better and thinner, until the surfaces even-tually become rate limiting. We, therefore, mention a couple of techniques forstudying hydrogen exchange kinetics.
The use of isotopes in studies of surface kinetics is well known from heteroge-neous catalysis. By probing the distribution of different isotope-specific gas spe-cies as a function of time over different solid catalyst surfaces, the catalytic activitytowards specific reactions can be determined. For studies of surface kinetics rele-vant to hydrogen separation membranes, this would involve the use of gas speciescontaining hydrogen and deuterium and the possible combination of these, forexample, H2, D2, HD, H2O, D2O, HDO, etc.
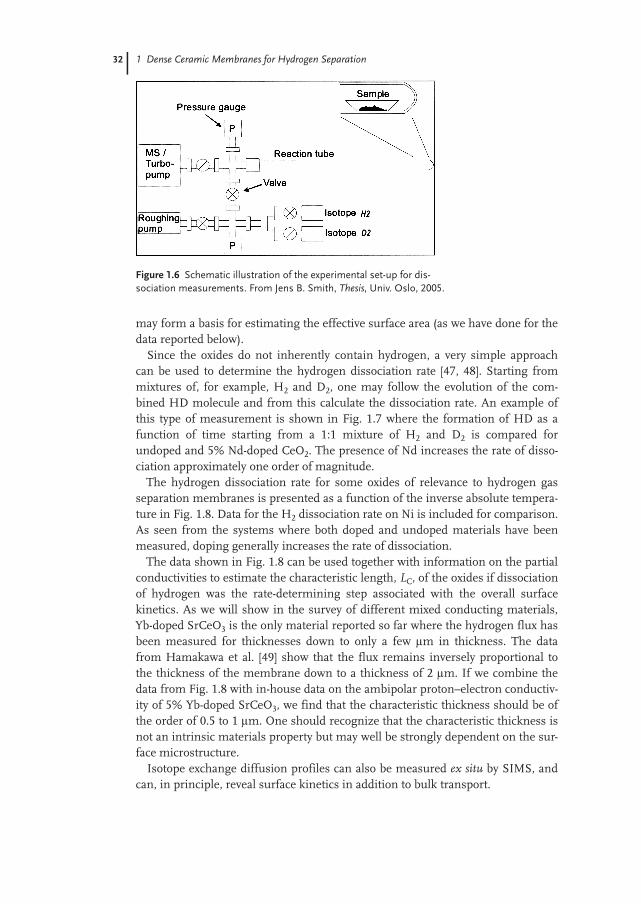
Mass spectrometry (MS) is a convenient experimental technique to determinethe time distribution of these species in a gas. Using an experimental assemblydesigned by Hultquist et al. [46], we have investigated the rate of surface dissocia-tion of H2 and D2 on different proton and mixed electron–proton conductors inthe temperature range 200 to 800 °C. A schematic of the experimental assembly isshown in Fig. 1.6. A quadrupole mass-spectrometer (in our case a Balzers, Prisma200) is connected to a small volume of 50 mL that is heated by a high-temperaturefurnace (temperatures up to 1100 °C). The reaction chamber is connected tovolumes where different gases may be pre-mixed before introduction into thereaction chamber. The total pressure in the different chambers is controlled byhigh precision pressure gauges (Balzers, CMR 60, 0.1–1000 mbar and Baratron,0.01–100/0.1–1000 mbar). The inlet of gas into the MS is controlled by a leak-valveenabling a very small flow into the MS and, consequently, keeping the total pres-sure in the reaction chamber virtually constant.
In order to obtain true surface area specific rate constants for the surfacekinetics, the real (microscopic) surface area must be taken into account. For pow-ders, the Brunauer, Emmett, Teller (BET) method may be used to determine thetrue surface area. For dense solid bodies, however, the BET method may be tooinsensitive, since the overall surface area is relatively low. In such cases, measure-ments of the surface roughness, for example by atomic force microscopy (AFM),
31
1 Dense Ceramic Membranes for Hydrogen Separation
may form a basis for estimating the effective surface area (as we have done for thedata reported below).
Since the oxides do not inherently contain hydrogen, a very simple approachcan be used to determine the hydrogen dissociation rate [47, 48]. Starting frommixtures of, for example, H2 and D2, one may follow the evolution of the com-bined HD molecule and from this calculate the dissociation rate. An example ofthis type of measurement is shown in Fig. 1.7 where the formation of HD as afunction of time starting from a 1:1 mixture of H2 and D2 is compared forundoped and 5% Nd-doped CeO2. The presence of Nd increases the rate of disso-ciation approximately one order of magnitude.
The hydrogen dissociation rate for some oxides of relevance to hydrogen gasseparation membranes is presented as a function of the inverse absolute tempera-ture in Fig. 1.8. Data for the H2 dissociation rate on Ni is included for comparison.As seen from the systems where both doped and undoped materials have beenmeasured, doping generally increases the rate of dissociation.
The data shown in Fig. 1.8 can be used together with information on the partialconductivities to estimate the characteristic length, LC, of the oxides if dissociationof hydrogen was the rate-determining step associated with the overall surfacekinetics. As we will show in the survey of different mixed conducting materials,Yb-doped SrCeO3 is the only material reported so far where the hydrogen flux hasbeen measured for thicknesses down to only a few lm in thickness. The datafrom Hamakawa et al. [49] show that the flux remains inversely proportional tothe thickness of the membrane down to a thickness of 2 lm. If we combine thedata from Fig. 1.8 with in-house data on the ambipolar proton–electron conductiv-ity of 5% Yb-doped SrCeO3, we find that the characteristic thickness should be ofthe order of 0.5 to 1 lm. One should recognize that the characteristic thickness isnot an intrinsic materials property but may well be strongly dependent on the sur-face microstructure.
Isotope exchange diffusion profiles can also be measured ex situ by SIMS, andcan, in principle, reveal surface kinetics in addition to bulk transport.
32
Figure 1.6 Schematic illustration of the experimental set-up for dis-sociation measurements. From Jens B. Smith, Thesis, Univ. Oslo, 2005.
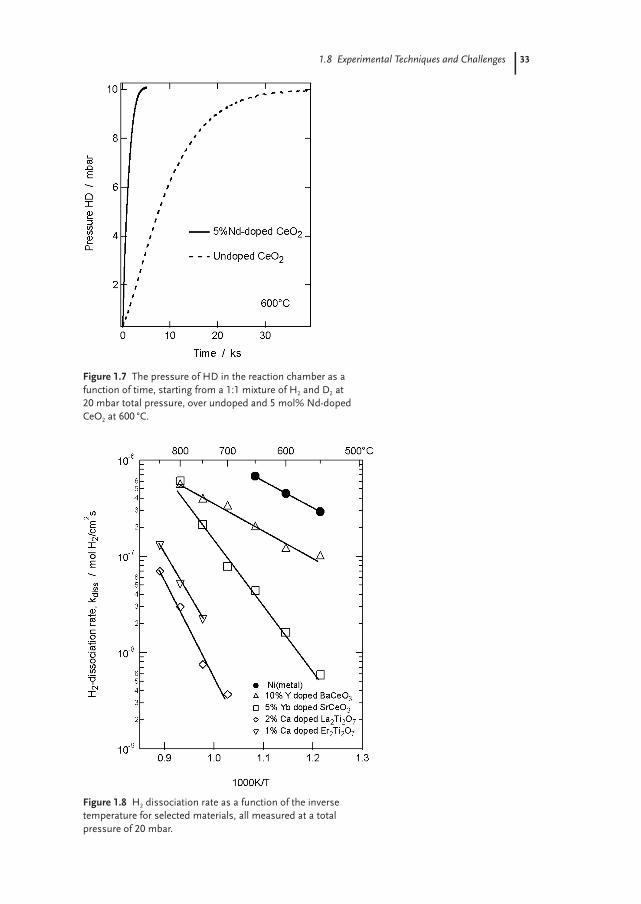
1.8 Experimental Techniques and Challenges 33
Figure 1.7 The pressure of HD in the reaction chamber as afunction of time, starting from a 1:1 mixture of H2 and D2 at20 mbar total pressure, over undoped and 5 mol% Nd-dopedCeO2 at 600 °C.
Figure 1.8 H2 dissociation rate as a function of the inversetemperature for selected materials, all measured at a totalpressure of 20 mbar.
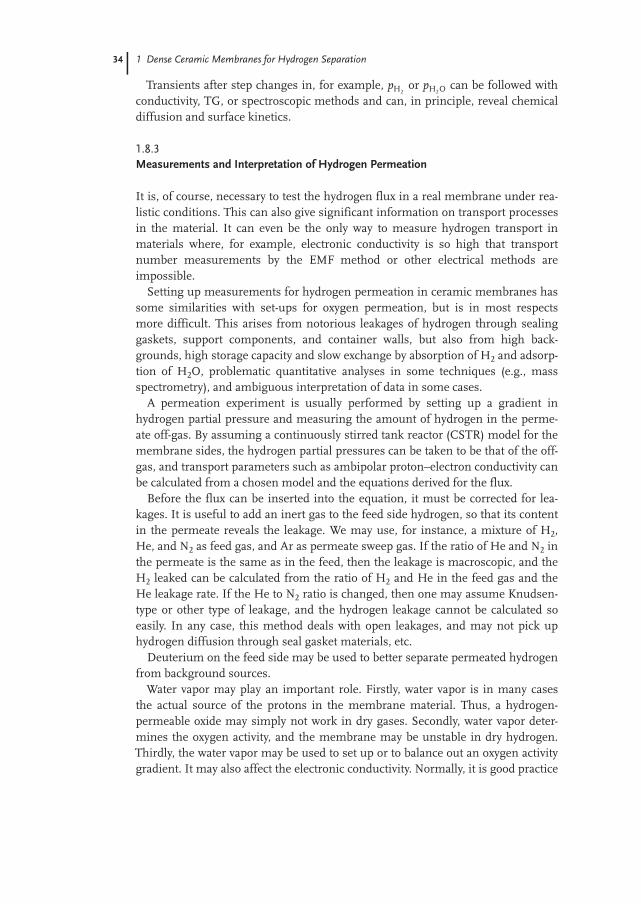
1 Dense Ceramic Membranes for Hydrogen Separation
Transients after step changes in, for example, pH2or pH2O can be followed with
conductivity, TG, or spectroscopic methods and can, in principle, reveal chemicaldiffusion and surface kinetics.
1.8.3Measurements and Interpretation of Hydrogen Permeation
It is, of course, necessary to test the hydrogen flux in a real membrane under rea-listic conditions. This can also give significant information on transport processesin the material. It can even be the only way to measure hydrogen transport inmaterials where, for example, electronic conductivity is so high that transportnumber measurements by the EMF method or other electrical methods areimpossible.
Setting up measurements for hydrogen permeation in ceramic membranes hassome similarities with set-ups for oxygen permeation, but is in most respectsmore difficult. This arises from notorious leakages of hydrogen through sealinggaskets, support components, and container walls, but also from high back-grounds, high storage capacity and slow exchange by absorption of H2 and adsorp-tion of H2O, problematic quantitative analyses in some techniques (e.g., massspectrometry), and ambiguous interpretation of data in some cases.
A permeation experiment is usually performed by setting up a gradient inhydrogen partial pressure and measuring the amount of hydrogen in the perme-ate off-gas. By assuming a continuously stirred tank reactor (CSTR) model for themembrane sides, the hydrogen partial pressures can be taken to be that of the off-gas, and transport parameters such as ambipolar proton–electron conductivity canbe calculated from a chosen model and the equations derived for the flux.
Before the flux can be inserted into the equation, it must be corrected for lea-kages. It is useful to add an inert gas to the feed side hydrogen, so that its contentin the permeate reveals the leakage. We may use, for instance, a mixture of H2,He, and N2 as feed gas, and Ar as permeate sweep gas. If the ratio of He and N2 inthe permeate is the same as in the feed, then the leakage is macroscopic, and theH2 leaked can be calculated from the ratio of H2 and He in the feed gas and theHe leakage rate. If the He to N2 ratio is changed, then one may assume Knudsen-type or other type of leakage, and the hydrogen leakage cannot be calculated soeasily. In any case, this method deals with open leakages, and may not pick uphydrogen diffusion through seal gasket materials, etc.
Deuterium on the feed side may be used to better separate permeated hydrogenfrom background sources.
Water vapor may play an important role. Firstly, water vapor is in many casesthe actual source of the protons in the membrane material. Thus, a hydrogen-permeable oxide may simply not work in dry gases. Secondly, water vapor deter-mines the oxygen activity, and the membrane may be unstable in dry hydrogen.Thirdly, the water vapor may be used to set up or to balance out an oxygen activitygradient. It may also affect the electronic conductivity. Normally, it is good practice
34
1.9 Hydrogen Permeation in Selected Systems
to operate with wet gases on both sides of the membrane so that conditions arewell-defined.
Once a leakage-corrected flux is obtained, one should ascertain that it arisesfrom hydrogen permeation and not other transport processes. For instance, a pos-sible mistake is to analyze and find hydrogen in the permeate and ascribe it tohydrogen permeation, while the real source is oxygen transport in the oppositedirection: This splits water vapor on the permeate side and leaves hydrogen. Onlycareful analysis of water levels can differentiate the two cases. One may try to cir-cumvent the problem by using a dry permeate side sweep gas, but even impuritiesor leakages of water may be more than enough to form hydrogen by oxygen trans-port.
For experimental studies we refer to the references in the literature sectionbelow.
1.9Hydrogen Permeation in Selected Systems
1.9.1A Few Words on Flux and Permeability
Before we move on to review results of hydrogen permeation in various systems,we dwell on some terms of flux and permeability.
The process of permeation through a membrane gives rise to a flux, or permea-tion. Commonly used units are mol s–1 and mLn min–1 = mL min–1(STP). In orderto obtain (area specific) flux densities we divide by area and get, for example, unitsof mol s–1 cm–2 or mLn min–1 cm–2.
In traditional membrane science, the permeability is the specific materialsproperty coefficient that relates the pressure or concentration difference over themembrane to the flux density. The permeance is similarly the area-specific coeffi-cient obtained after division by the membrane thickness. Typical units would bemol s–1 cm–1 Pa–1 for permeability and mol s–1 cm–2 Pa–1 for permeance.
For dense membranes it is more complicated, since the materials property itselfcan be pressure dependent, and the flux gets various pressure dependencesdepending on defect structure. It is therefore common to use the terms per-meance and permeability for the flux including the actual pressures involved. Per-meance is then the same as flux, typically given in area specific values like fluxdensity, with units like mol s–1 cm–2. Permeability is used for the materials specif-ic – thickness independent – flux density obtained by multiplying by the mem-brane thickness, and with units of typically mol s–1 cm–1 or mLn min–1 cm–1.
Alternatively, the permeance and permeability of a dense membrane can beexpressed as a coefficient of flux density per unit pressure to a power dependingon defect model (for instance, from the examples we have seen in Section 1.4, 1⁄2,1⁄4, 0, –1⁄2, and –1⁄4). We will see examples of several ways of using these units
35
1 Dense Ceramic Membranes for Hydrogen Separation
later – the intention here is to prepare the reader to be careful when reading andquoting fluxes and permeabilities.
1.9.2Classes of Membranes
Inorganic gas-separation membranes may, in gross terms, be divided into twomajor categories, dense membranes as we have dealt with above, and porousmembranes. The selectivity of a porous membrane is simply based on the poresize in the barrier layer. Membranes may, as such, based on the size of the gas-eous molecules, be designed to separate specific gases or mixtures of gases.Depending on the porosity and the dimension of the pores, different transportmechanisms may apply: Knudsen diffusion, surface diffusion, molecular sieving,viscous flow, activated diffusion and capillary condensation. The driving force forseparation of the desired gas species is normally a large (often orders of magni-tude) difference in total pressure between the feed and the permeate side.
State-of-the-art micro-porous membranes are based on silica, with sufficientlysmall pores, 2–10 Å, to be selective towards hydrogen separation. One of themajor problems with silica membranes under hydrothermal conditions is physicalstability. Evaporation of silica-containing species is detrimental to long-term perm-selectivity and restricts the operation of these membranes to temperatures below600 °C. Hydrogen permeances of >1 × 10⁻⁶ mol m–2 s–1 Pa–1 with H2/CO2 permse-lectivity in the range 80–100 have, for instance, been measured with single dead-end tubular micro-porous silica membranes for temperatures higher than 300 °Cand with 4 bar pressure difference. These membranes were reported to be ther-mally stable for at least 2000 h at temperatures between 200 and 400 °C [50].
Dense inorganic membranes for hydrogen separation may consist either of ametal or an alloy, a ceramic (oxide), or a mixture of both, a so-called cermet. Onemay also envisage a mixture of two ceramics (“cercer”). In the following, we dis-cuss literature on hydrogen permeability in some of these classes of dense mem-branes.
1.9.3Mixed Proton–Electron Conducting Oxides
We have seen that the hydrogen flux across a ceramic mixed proton–electron con-ductor is proportional to the ambipolar protonic–electronic conductivity (Eq.(1.36)), that is, it is determined mainly by the protonic or electronic conductivity,whichever is smaller. Therefore, a prerequisite for a good candidate membranematerial is a combination of both high electronic and high protonic conductivity.To date, not many materials are known to meet both these criteria. In addition,other material aspects must also be taken into account in evaluation of possiblemembrane candidates: The different cations of the oxide must be stable undersufficiently reducing conditions (high H2 pressures and high temperature).Because the materials must withstand relatively large chemical potential gradi-
36
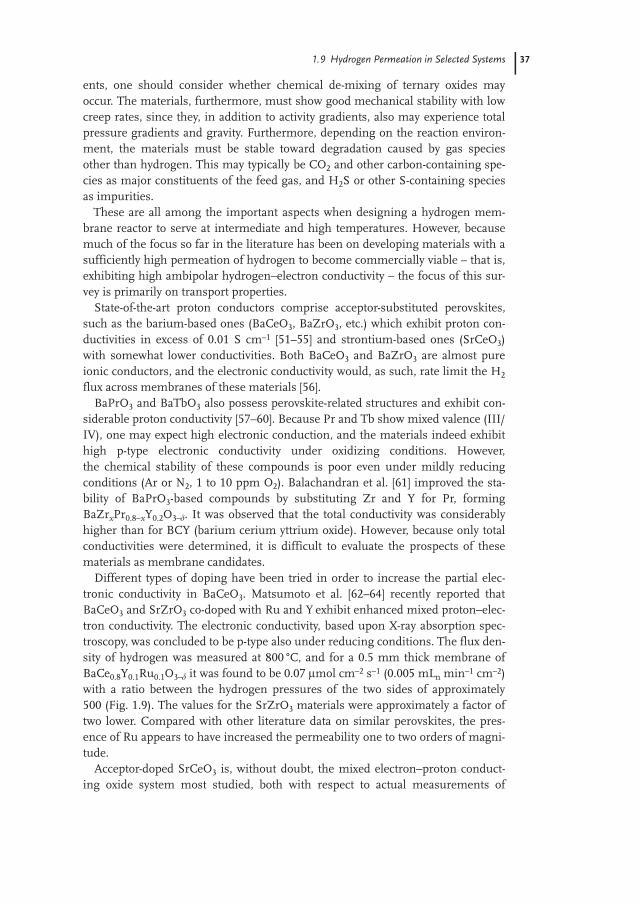
1.9 Hydrogen Permeation in Selected Systems
ents, one should consider whether chemical de-mixing of ternary oxides mayoccur. The materials, furthermore, must show good mechanical stability with lowcreep rates, since they, in addition to activity gradients, also may experience totalpressure gradients and gravity. Furthermore, depending on the reaction environ-ment, the materials must be stable toward degradation caused by gas speciesother than hydrogen. This may typically be CO2 and other carbon-containing spe-cies as major constituents of the feed gas, and H2S or other S-containing speciesas impurities.
These are all among the important aspects when designing a hydrogen mem-brane reactor to serve at intermediate and high temperatures. However, becausemuch of the focus so far in the literature has been on developing materials with asufficiently high permeation of hydrogen to become commercially viable – that is,exhibiting high ambipolar hydrogen–electron conductivity – the focus of this sur-vey is primarily on transport properties.
State-of-the-art proton conductors comprise acceptor-substituted perovskites,such as the barium-based ones (BaCeO3, BaZrO3, etc.) which exhibit proton con-ductivities in excess of 0.01 S cm–1 [51–55] and strontium-based ones (SrCeO3)with somewhat lower conductivities. Both BaCeO3 and BaZrO3 are almost pureionic conductors, and the electronic conductivity would, as such, rate limit the H2
flux across membranes of these materials [56].BaPrO3 and BaTbO3 also possess perovskite-related structures and exhibit con-
siderable proton conductivity [57–60]. Because Pr and Tb show mixed valence (III/IV), one may expect high electronic conduction, and the materials indeed exhibithigh p-type electronic conductivity under oxidizing conditions. However,the chemical stability of these compounds is poor even under mildly reducingconditions (Ar or N2, 1 to 10 ppm O2). Balachandran et al. [61] improved the sta-bility of BaPrO3-based compounds by substituting Zr and Y for Pr, formingBaZrxPr0.8–xY0.2O3–d. It was observed that the total conductivity was considerablyhigher than for BCY (barium cerium yttrium oxide). However, because only totalconductivities were determined, it is difficult to evaluate the prospects of thesematerials as membrane candidates.
Different types of doping have been tried in order to increase the partial elec-tronic conductivity in BaCeO3. Matsumoto et al. [62–64] recently reported thatBaCeO3 and SrZrO3 co-doped with Ru and Y exhibit enhanced mixed proton–elec-tron conductivity. The electronic conductivity, based upon X-ray absorption spec-troscopy, was concluded to be p-type also under reducing conditions. The flux den-sity of hydrogen was measured at 800 °C, and for a 0.5 mm thick membrane ofBaCe0.8Y0.1Ru0.1O3–d it was found to be 0.07 lmol cm–2 s–1 (0.005 mLn min–1 cm–2)with a ratio between the hydrogen pressures of the two sides of approximately500 (Fig. 1.9). The values for the SrZrO3 materials were approximately a factor oftwo lower. Compared with other literature data on similar perovskites, the pres-ence of Ru appears to have increased the permeability one to two orders of magni-tude.
Acceptor-doped SrCeO3 is, without doubt, the mixed electron–proton conduct-ing oxide system most studied, both with respect to actual measurements of
37
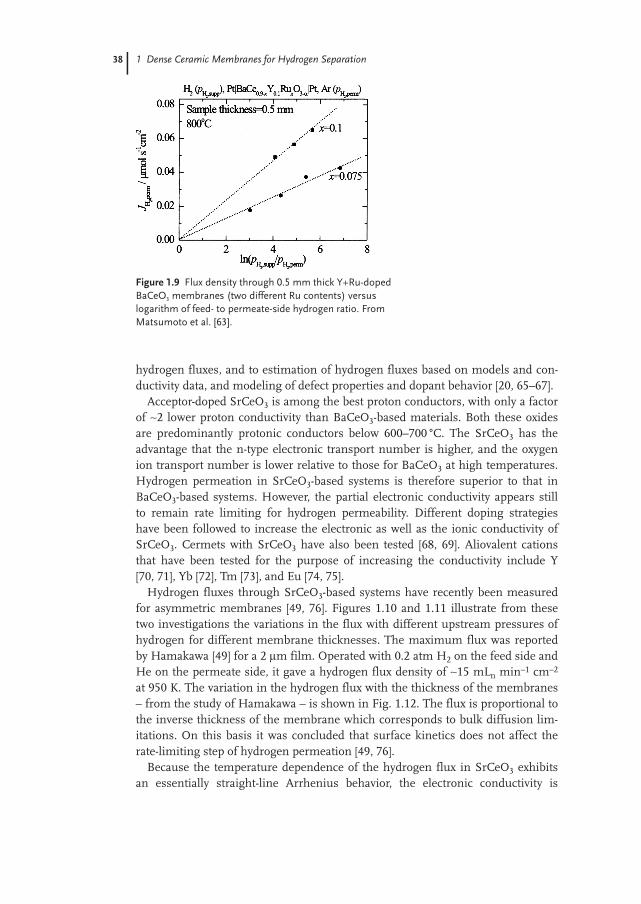
1 Dense Ceramic Membranes for Hydrogen Separation
hydrogen fluxes, and to estimation of hydrogen fluxes based on models and con-ductivity data, and modeling of defect properties and dopant behavior [20, 65–67].
Acceptor-doped SrCeO3 is among the best proton conductors, with only a factorof ∼2 lower proton conductivity than BaCeO3-based materials. Both these oxidesare predominantly protonic conductors below 600–700 °C. The SrCeO3 has theadvantage that the n-type electronic transport number is higher, and the oxygenion transport number is lower relative to those for BaCeO3 at high temperatures.Hydrogen permeation in SrCeO3-based systems is therefore superior to that inBaCeO3-based systems. However, the partial electronic conductivity appears stillto remain rate limiting for hydrogen permeability. Different doping strategieshave been followed to increase the electronic as well as the ionic conductivity ofSrCeO3. Cermets with SrCeO3 have also been tested [68, 69]. Aliovalent cationsthat have been tested for the purpose of increasing the conductivity include Y[70, 71], Yb [72], Tm [73], and Eu [74, 75].
Hydrogen fluxes through SrCeO3-based systems have recently been measuredfor asymmetric membranes [49, 76]. Figures 1.10 and 1.11 illustrate from thesetwo investigations the variations in the flux with different upstream pressures ofhydrogen for different membrane thicknesses. The maximum flux was reportedby Hamakawa [49] for a 2 lm film. Operated with 0.2 atm H2 on the feed side andHe on the permeate side, it gave a hydrogen flux density of ∼15 mLn min–1 cm–2
at 950 K. The variation in the hydrogen flux with the thickness of the membranes– from the study of Hamakawa – is shown in Fig. 1.12. The flux is proportional tothe inverse thickness of the membrane which corresponds to bulk diffusion lim-itations. On this basis it was concluded that surface kinetics does not affect therate-limiting step of hydrogen permeation [49, 76].
Because the temperature dependence of the hydrogen flux in SrCeO3 exhibitsan essentially straight-line Arrhenius behavior, the electronic conductivity is
38
Figure 1.9 Flux density through 0.5 mm thick Y+Ru-dopedBaCeO3 membranes (two different Ru contents) versuslogarithm of feed- to permeate-side hydrogen ratio. FromMatsumoto et al. [63].
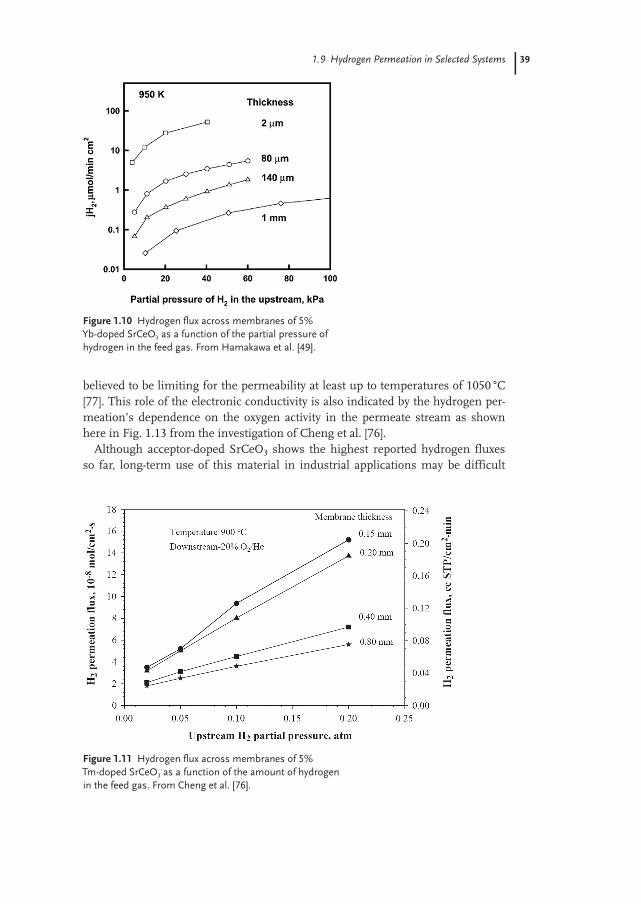
1.9 Hydrogen Permeation in Selected Systems
believed to be limiting for the permeability at least up to temperatures of 1050 °C[77]. This role of the electronic conductivity is also indicated by the hydrogen per-meation’s dependence on the oxygen activity in the permeate stream as shownhere in Fig. 1.13 from the investigation of Cheng et al. [76].
Although acceptor-doped SrCeO3 shows the highest reported hydrogen fluxesso far, long-term use of this material in industrial applications may be difficult
39
Figure 1.10 Hydrogen flux across membranes of 5%Yb-doped SrCeO3 as a function of the partial pressure ofhydrogen in the feed gas. From Hamakawa et al. [49].
Figure 1.11 Hydrogen flux across membranes of 5%Tm-doped SrCeO3 as a function of the amount of hydrogenin the feed gas. From Cheng et al. [76].
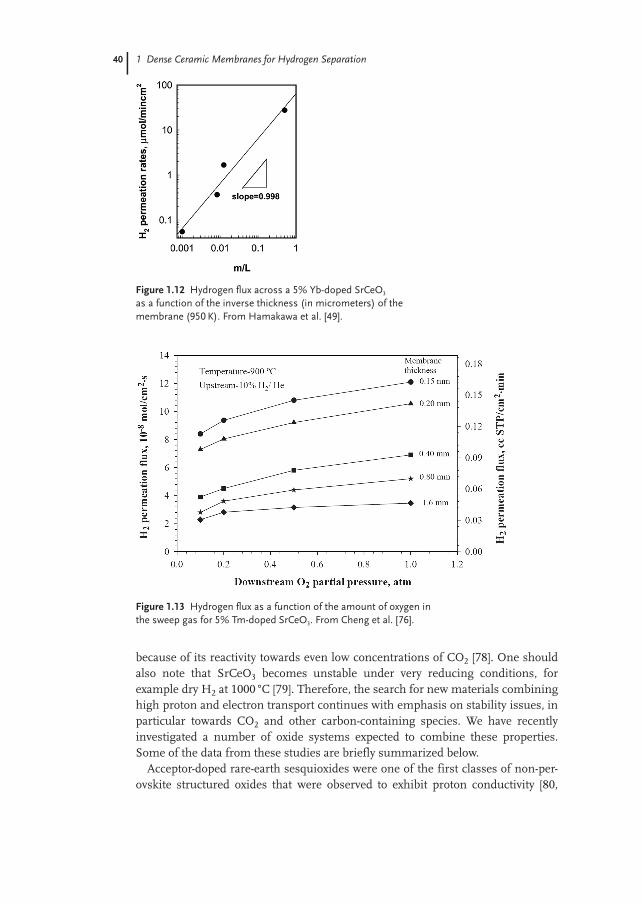
1 Dense Ceramic Membranes for Hydrogen Separation
because of its reactivity towards even low concentrations of CO2 [78]. One shouldalso note that SrCeO3 becomes unstable under very reducing conditions, forexample dry H2 at 1000 °C [79]. Therefore, the search for new materials combininghigh proton and electron transport continues with emphasis on stability issues, inparticular towards CO2 and other carbon-containing species. We have recentlyinvestigated a number of oxide systems expected to combine these properties.Some of the data from these studies are briefly summarized below.
Acceptor-doped rare-earth sesquioxides were one of the first classes of non-per-ovskite structured oxides that were observed to exhibit proton conductivity [80,
40
Figure 1.12 Hydrogen flux across a 5% Yb-doped SrCeO3
as a function of the inverse thickness (in micrometers) of themembrane (950 K). From Hamakawa et al. [49].
Figure 1.13 Hydrogen flux as a function of the amount of oxygen inthe sweep gas for 5% Tm-doped SrCeO3. From Cheng et al. [76].
1.9 Hydrogen Permeation in Selected Systems
81]. The conductivity behavior of these oxides was characterized over large rangesof temperature and oxygen activities. Terbium sesquioxide, Tb2O3, is the onlycompound examined so far that exhibits both electronic (p-type) and protonic con-ductivity in hydrogen atmospheres at high temperatures [82]. Hydrogen permea-tion would be governed by the proton conductivity, which at 900 °C is approxi-mately 5 × 10⁻⁵ S cm–1 (5% of the total conductivity) and would yield a permeabil-ity of 3 × 10⁻⁵ mLn min–1 cm–1.
With the requirement of electronic conductivity, oxides containing cations withmixed valence and, in particular, reducible cations are preferable. Oxides contain-ing transition metals are therefore appropriate alternatives. There are indicationsbased on conductivity measurements that TiO2 could be a possible candidate [83],but no direct measurements of hydrogen permeability have been reported. Tita-nates, in general, however, are interesting because there are a number of materi-als classes that accommodate oxygen vacancies and may dissolve protons.
Among these, the pyrochlore-structured rare-earth titanates (Ln2Ti2O7) dopedwith Ca have been studied recently [40, 84]. The electronic conductivity predomi-nated under reducing conditions, but with a significant contribution fromprotons. The highest flux was observed for 1% Ca-doped Er2Ti2O7 [85]; at900 °C with 0.5 atm H2 in the feed and He as sweep gas, the permeability was2 × 10–4 mLn min–1 cm–1. This is a factor of two lower than for 5% Yb-dopedSrCeO3 measured under corresponding reaction conditions [86]. One should notehere that these measurements were performed using wet sweep gas and that thevalue for Er2Ti2O7 may be too high, due to splitting of water at the permeate side.Acceptor-doped La2Zr2O7 is another pyrochlore-structured oxide that has beenfound to exhibit proton conduction [87, 88]. Although the proton conductivity inthis material is slightly higher than for the titanates, the conductivity of the zirco-nate is essentially ionic, even in wet hydrogen. Thus, the ambipolar hydrogenelectron conductivity becomes correspondingly low.
Increasing the valence of the B-site cation by going to the Group 5 elements,oxides of vanadium are probably too difficult to handle because some of thesecompounds are rather volatile and have a very complex chemistry. Niobates andtantalates, on the other hand, are of more interest. On the basis of empirical rela-tions between material properties and proton dissolution, double oxides with rareearths as the A-site cations are, again, possible alternatives. Here there are severalpossible stoichiometries with different crystal structures. The compoundsLa3NbO7 [89] and LnNbO4 and LnTaO4 (Ln = rare earth) [90], have been found toexhibit considerable proton conductivity. The maximum value, 1 × 10⁻³ S cm–1,was reported for 1% Ca-doped LaNbO4 and represents the highest proton conduc-tivity measured so far for materials stable under CO2. However, because theseclasses of materials are almost pure ionic conductors, the ambipolar conductivitywould be more than two orders of magnitude lower. Permeabilities would be cor-respondingly low, <1 × 10⁻⁵ mLn min–1 cm–1. Possibilities to increase the electron-ic conductivity here would be to substitute a more easily reducible cation on theB-site, for example, Ti.
41
1 Dense Ceramic Membranes for Hydrogen Separation
La6WO12 was shown by Shimura et al. [91] to exhibit high proton conductivity.We have recently characterized the electrical conductivity across the Ln6WO12 se-ries and found a corresponding behavior. In addition, these oxides also exhibitconsiderable n-type electronic conductivity [92]. Also, 1% Ca-doped La6WO12
has in preliminary tests shown relatively high H2 permeabilities,∼0.001 mLn min–1 cm–1, that is, values approximately one order of magnitudehigher than for the pyrochlore titanates and more than a factor of two higher thanfor 5% Yb-doped SrCeO3. Because WO3 is known to be volatile and becauseW forms carbides rather easily, the stability of this class of oxides in membraneapplications must be considered critically.
1.9.4Cermets
Cermets for hydrogen separation consist of a ceramic and a metallic phase contig-uous in a dense matrix. In a cermet, one may combine one state-of-the-art pureproton conductor with a highly electron-conducting metallic phase, and therebycircumvent the problem of having both electronic and ionic conduction in oneand the same oxide.
Because both metals and oxides alone may transport hydrogen, different combi-nations with respect to functional properties of both phases have been tried, forexample, (i) a metal with low hydrogen conductivity in combination with a highlyproton-conductive oxide, (ii) a metal or an alloy with high hydrogen permeability(e.g., Pt, Pd, Pd/Ag, Pd/Cu, Ni, Nb, Ta, Nb, V) together with a ceramic of lowhydrogen permeability, and, finally, (iii) a combination where both the metallicand the ceramic phases conduct hydrogen (as protons for the ceramic and hydro-gen for the metallic part). Balachandran et al. [93] have investigated the propertiesof these three combinations with respect to selectivity, permeability and mechani-cal stability. When a pure proton-conducting oxide constitutes the oxide phase, itis required that the content of metal be high enough to ensure sufficient electron-ic transport in the metallic phase to maintain the hydrogen flux at its maximum(as defined by the maximum in proton conductivity). Generally, this is satisfied ifthe metallic phase is percolating through the membrane. This type of membrane(i) has been tested with BCY as the ceramic matrix. It was observed that the hydro-gen flux across the composite increases significantly as compared to a fully ceram-ic BCY membrane. For the combination in which both matrices exhibit H2 perme-ability (iii), the flux increases even more. It was observed that most of the hydro-gen was transported through the metallic phase [94]. Unfortunately, these types ofmembranes exhibited poor mechanical stability.
From the above evaluation, it seems that a good alternative may be a matrix of ametallic phase with high hydrogen permeability strengthened by a dispersion ofceramic particles (alternative ii). For this class of materials, flux densities havebeen measured to be of the order of 10–30 mLn min–1 cm–2 using 1 atm total pres-sure with H2 as feed gas and He as sweep gas. In general, the flux in these materi-als increases with p1�2
H2in the feed gas and is inversely proportional to the thick-
42
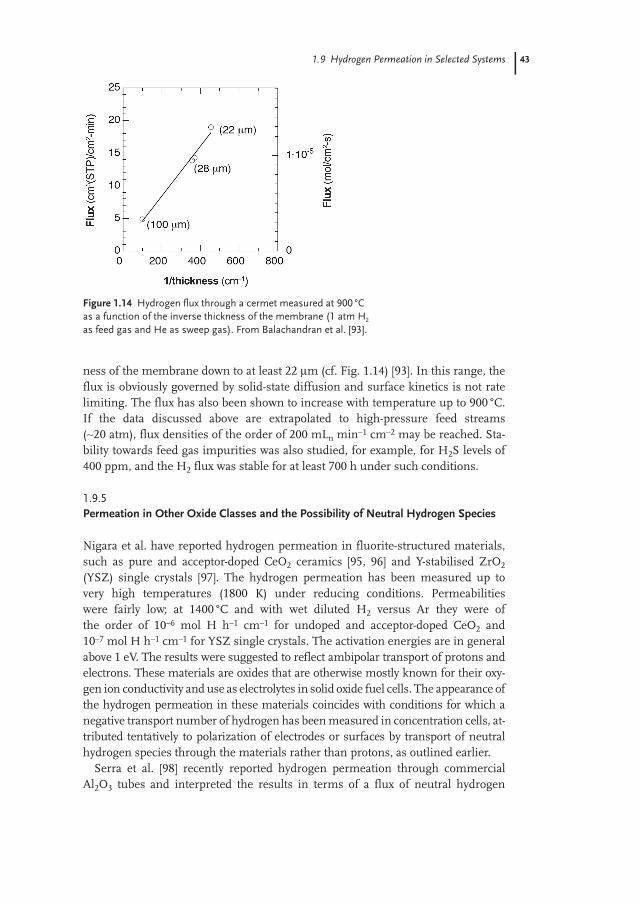
1.9 Hydrogen Permeation in Selected Systems
ness of the membrane down to at least 22 lm (cf. Fig. 1.14) [93]. In this range, theflux is obviously governed by solid-state diffusion and surface kinetics is not ratelimiting. The flux has also been shown to increase with temperature up to 900 °C.If the data discussed above are extrapolated to high-pressure feed streams(∼20 atm), flux densities of the order of 200 mLn min–1 cm–2 may be reached. Sta-bility towards feed gas impurities was also studied, for example, for H2S levels of400 ppm, and the H2 flux was stable for at least 700 h under such conditions.
1.9.5Permeation in Other Oxide Classes and the Possibility of Neutral Hydrogen Species
Nigara et al. have reported hydrogen permeation in fluorite-structured materials,such as pure and acceptor-doped CeO2 ceramics [95, 96] and Y-stabilised ZrO2
(YSZ) single crystals [97]. The hydrogen permeation has been measured up tovery high temperatures (1800 K) under reducing conditions. Permeabilitieswere fairly low; at 1400 °C and with wet diluted H2 versus Ar they were ofthe order of 10–6 mol H h–1 cm–1 for undoped and acceptor-doped CeO2 and10–7 mol H h–1 cm–1 for YSZ single crystals. The activation energies are in generalabove 1 eV. The results were suggested to reflect ambipolar transport of protons andelectrons. These materials are oxides that are otherwise mostly known for their oxy-gen ion conductivity and use as electrolytes in solid oxide fuel cells. The appearance ofthe hydrogen permeation in these materials coincides with conditions for which anegative transport number of hydrogen has been measured in concentration cells, at-tributed tentatively to polarization of electrodes or surfaces by transport of neutralhydrogen species through the materials rather than protons, as outlined earlier.
Serra et al. [98] recently reported hydrogen permeation through commercialAl2O3 tubes and interpreted the results in terms of a flux of neutral hydrogen
43
Figure 1.14 Hydrogen flux through a cermet measured at 900 °Cas a function of the inverse thickness of the membrane (1 atm H2
as feed gas and He as sweep gas). From Balachandran et al. [93].
1 Dense Ceramic Membranes for Hydrogen Separation
atoms. A typical flux density for a 2.75 mm thick wall and 1 atm H2 versus vacu-um at 1400 °C was 4 × 10⁻⁸ mol H2 s–1 m–2. Others have reported mixed protontransport in the same material [99], providing an illustration of the uncertainty ofthe relative roles of various oxidation states of hydrogen. If we move on to evenmore covalent oxides (still with large band gaps) such as SiO2, it appears that neu-tral species take over even more in permeation; both H and H2O are believed todiffuse in SiO2 much as neutral entities [100, 101].
There has also been interest in Ca12Al14O33 recently, in which hydrogen isreported to dissolve in the sub-nanometer cages in the structure in H2 atmo-spheres at, for example, 1300 °C and to disproportionate into hydride ions andprotons [3]. The hydrogen gives rise to electronic conduction at room temperatureafter UV irradiation. The cages can host a variety of species, and the material ex-hibits both oxygen ion conduction [102] and large water uptake [103] at high tem-peratures, in addition to the said hydrogen uptake. Hydrogen permeation maythus take place by various mechanisms and is one of the many properties of thisfascinating material presently under investigation.
1.9.6Comparison with Metals
Several metals and alloys have been shown to exhibit high permeabilities ofhydrogen. The noble metals, in particular, Pd and alloys of Pd–PdAg and –PdCuhave attracted much attention. Compared to pure Pd, some Pd alloys show a high-er permeance in addition to better resistance to hydrogen embrittlement, bettertolerance to gaseous impurities, and lower materials costs.
The most pronounced problem of these materials is, nevertheless, the poison-ing by impurities in the feedstream, and this often limits their applicability. Alloysof Pd–Ag are particularly prone to poisoning by sulfur. Other gases such as COand H2O can also be detrimental to long-term membrane performance. Thehighest measured permeabilities of these materials are of the order of 10–9 to10–8 mol H2 m–1 s–1 Pa–n, where typically n= 0.5 [104–106].
Membranes based on the noble metals have the disadvantage of very high mate-rials costs. Therefore, other less noble metals and their alloys provide interestingalternatives. Here, the Group 4 and 5 elements including Nb, Ta, V, and Zr exhibitthe best performance. In comparison to Pd, Ta is approximately one order of mag-nitude cheaper and is reported to exhibit hydrogen permeabilities approximatelyone order of magnitude higher [107]. Membranes based on the Group 4 and 5metals have shown permeabilities of over 400 mLn min–1 cm–1 at 440 °C with apressure difference of 33 bar [108].
44
1.10 Summary
1.10Summary
Dense inorganic membranes with mixed protonic–electronic conduction – typical-ly oxides – find prospective use in high-temperature hydrogen separation mem-branes, especially where process integration is possible. Uses in fossil-fueledpower plants with CO2 sequestration have been exemplified. The state-of-the-artmaterials in this class are too basic and suffer from stability problems, while themore stable materials have ambipolar conductivities on the low side. We thusneed to identify new stable materials with high combined electronic and protonicconduction. On the way, a better understanding of the protonation thermody-namics, general defect structures, and transport of protons in the candidate mate-rials is in demand. As bulk properties are improved, similar advancement inunderstanding and characterization of surface kinetics will become mandatory.Research in this field is thus needed, but involves rather complex defect modelsand transport equations. We have in this chapter indicated simple defect modelsand derived some transport equations as an incentive and help in this direction.We need good measurement procedures, especially for permeation studies, andwe have indicated some of these, and their pitfalls. Finally, we use the opportunityto emphasize the importance of the materials’ chemical and thermal stability, me-chanical strength, and the ceramic engineering to make dense, thin membraneson porous supporting substrates – all needed to arrive at long-lived high-perfor-mance membranes for hydrogen separation at high temperatures.
Acknowledgements
The Research Council of Norway (RCN), Norwegian industries Norsk Hydro ASAand Statoil ASA, and the EU/GROWTH programme have funded and supportedseveral projects in the authors’ group within the general theme of this contribu-tion. The authors are grateful for the insight gained through these projects andthe collaboration with all the project partners.
45
1 Dense Ceramic Membranes for Hydrogen Separation46
References
1 T. Norby, Y. Larring, Solid State Ionics2000, 136–137, 139–148.
2 T. Norby, M. Widerøe, R. Gløckner,Y. Larring, Dalton Trans. 2004, 19, 3012–3018.
3 K. Hayashi, S. Matsuishi, T. Hosono,T. Kamiya, M. Hirano, H. Hosono,Nature 2002, 419, 462–465.
4 K. Åsen, B. Vigeland, T. Norby, Y. Lar-ring, T. Mejdell, in Proceedings of the 7thInternational Conference on GreenhouseGas Control Technologies (GHGT-7), Van-couver, Canada, Sept. 5–9, 2004, Vol. 1:Peer-Reviewed Papers and PlenaryPresentations, IEA Greenhouse GasProgramme, E. S. Rubin, D. W. Keith,C. F.Gilboy (Eds.), Cheltenham, UK,pp. 83–91, 2005.
5 C. G. Van de Walle, J. Neugebauer,Nature 2003, 423, 626–628.
6 A. S. Nowick, A. V. Vaysleyb, Solid StateIonics 1997, 97, 17–26.
7 D. G. Thomas, J. J. Lander, J. Chem.Phys. 1956, 25, 1136–1142.
8 P. Kofstad, Non-Stoichiometry, Diffusion,and Electrical Conductivity in BinaryMetal Oxides, Wiley, New York, 1972.
9 M. Widerøe, W. Münch, Y. Larring,T. Norby, Solid State Ionics 2002, 154–155, 669–677.
10 H. J. M. Bouwmeester, H. Kruidhof,A. J. Burggraaf, Solid State Ionics 1994,72, 185.
11 K. F. Bonhoffer, F. Farkas, Trans. Fara-day Soc. 1932, 28, 242.
12 A. Couper, D.D. Eley, Discuss. FaradaySoc. 1950, 8, 152.
13 A. Ozaki, F. Nozaki, K.-I. Maruya,S. Ogasawara, J. Catal. 1967, 7, 234.
14 Y. Amenomiya, J. Catal. 1971, 22, 109.15 D. A. Dowden, N. Mackenzie,
B. W. Trapnell, Proc. R. Soc. London,Ser.A 1956, 237, 245.
16 D. R. Ashmead, D. D. Eley, R. Rudham,J. Catal. 1964, 3, 280.
17 R. van de Krol, personal communica-tion.
18 J. Maier, in Physical Chemistry of IonicMaterials: Ions and Electrons in Solids,Wiley, New York, 2004, pp. 338–362.
19 F.W. Poulsen, J. Solid State Chem. 1999,143, 115–121.
20 S.-J. Song, E. D. Wachsman, J. Rhodes,S. E. Dorris, U. Balachandran, SolidState Ionics 2003, 164, 107–116.
21 J. B. Condon, T. Schober, Solid StateIonics 1997, 97, 51–58.
22 M. Saiful Islam, J. Mater. Chem. 2000,10, 1027–1038.
23 W. Munch, K.-D. Kreuer, G. Seifert,J. Maier, Solid State Ionics 2000, 136–137, 183–189.
24 T. Schober, J. Friedrich, Solid State Ionics1999, 125, 319–323.
25 K.-D. Kreuer, E. Schoenherr, J. Maier,Solid State Ionics 1994, 70–71, 278–84.
26 F. Krug, T. Schober, R. Paul, T. Springer,Solid State Ionics 1995, 77, 185–188.
27 S. Marion, H.-W. Meyer, M. Carpenter,T. Norby, H2O-D2O Exchange in Lawso-nite, Am. Mineral. 2001, 86, 1166–1169.
28 K.-D. Kreuer, A. Fuchs, J. Maier, SolidState Ionics 1995, 77, 157–162.
29 N. Sakai, K. Yamaji, T. Horita, H. Yoko-kawa, Y. Hirata, S. Sameshima,Y. Nigara, J. Mizusaki, Solid State Ionics1999, 125, 325–331.
30 E. Ruiz-Trejo, J. A. Kilner, Solid StateIonics 2000, 130, 313–324.
31 A. Groene, S. Kapphan, J. Phys. Chem.Solids 1996, 57, 325–331.
32 M. Glerup, F. W. Poulsen, R. W. Berg,Solid State Ionics 2002, 148, 83–92.
33 K. Amezawa, H. Maekawa, Y. Tomii,N. Yamamoto, Solid State Ionics 2001,145, 233–240.
34 S. F. J. Cox, J. Phys.; Condens. Matter2003, 15, R1727–1780.
35 R. Hempelmann, M. Soetratmo,O. Hartmann, R. Wappling, Solid StateIonics 1998, 107, 269–280.
36 K.-D. Kreuer, Th. Dippel, Yu.M. Baikov,J. Maier, Solid State Ionics 1996, 86–88,613–620.
37 B. A. Boukamp, Solid State Ionics 1986,18–19, 136–140.
38 Y. Larring, T. Norby, Solid State Ionics1997, 97, 523–528.
39 R. Haugsrud, Y. Larring, T. Norby, SolidState Ionics 2005, 176, 2957–2961.
References 47
40 R. Haugsrud, T. Norby, in Proc. 26th RisøInternational Symposium on MaterialScience, S. Linderoth, A. Smith,N. Bonanos, A. Hagen, L. Mikkelsen,K. Kammer, D. Lybye, P. V. Hendriksen,F. W. Poulsen, M. Mogensen,W. G. Wang (Eds.), Risø NationalLaboratory, Roskilde, Denmark, pp. 209–214, 2005.
41 T. Norby, Solid State Ionics 1988, 28–30,1586–1591.
42 D. Sutija, T. Norby, P. Björnbom, SolidState Ionics 1995, 77, 167–174.
43 V.V. Kharton, F. M. B. Marques, SolidState Ionics 2001, 140, 381–394.
44 N. Bonanos, Solid State Ionics 2001, 145,265–274.
45 T. Schober, J. Friedrich, D. Triefenbach,F. Tietz, Solid State Ionics 1997, 100,173–181.
46 G. Hultquist, L. Gråsjö, Q. Lu, T. Åker-mark, Corros. Sci. 1994, 36, 1459.
47 A. Ozaki, in Isotopic Studies of Heteroge-nous Catalysis, Kodansha Ltd., pp. 1–38,1977.
48 E. Hörnlund, Appl. Surf. Sci. 2002, 199,195.
49 S. Hamakawa, L. Li, A. Li, E. Iglesias,Solid State Ionics 2002, 48, 71.
50 H. Kruidhof, M. W. J. Luiten, N. E.Benes, H. J. M. Bouwmeester, in CarbonDioxide Capture for Storage in Deep Geo-logic Formations–Results from the CO2Capture Project, D. C. Thomas, S. M.Benson (Eds.), Elsevier, Vol. 1, pp. 365–375, 2005.
51 H. Iwahara, T. Esaka, H. Uchida,N. Maeda, Solid State Ionics 1981, 3–4,359.
52 H. Iwahara, H. Uchida, K. Ono,K. Ogaki, J. Electrochem. Soc. 1988, 135,529–533.
53 H. Iwahara, T. Esaka, H. Uchida,T. Yamauchi, K. Ogaki, Solid State Ionics1986, 18–19, 1003.
54 H. Iwahara, T. Yajima, T. Hibino,K. Ozaki, H. Suzuki, Solid State Ionics1993, 61, 65.
55 A. Mitsui, M. Miyayama, H. Yanagida,Solid State Ionics 1987, 22, 213.
56 J. Guan, S.E. Dorris, U. Balachandran,M. Meilin, Ceram. Trans. 1999, 92, 265.
57 T. Fukui, S. Ohara, S. Kawatsu, J. PowerSources 1998, 71, 164.
58 T. Fukui, S. Ohara, S. Kawatsu, SolidState Ionics 1999, 116, 331.
59 L. Li, J. R. Wu, M. Knight, S. M. Haile,in Proc.-Electrochem. Soc., PV 2001-28(Ionic and Mixed Conducting Ceram-ics), pp. 58–66, 2002.
60 K. A. Furøy, T. Norby, to be published.61 U. Balachandran, T. H. Lee, G. Zhang,
S. E. Dorris, K. S. Rothenberger, B. H.Howard, B. Morreale, A. V. Cugini, R. V.Siriwardane, J. A. Poston Jr., and E. P.Fisher, in Proceedings of the 26th Interna-tional Technical Conference on Coal Utili-zation and Fuel Systems, Clearwater, FL,Mar. 5–8, 2001, Coal Technical Associa-tion, Gaithersburg, MD, pp. 751–761,2001.
62 H. Matsumoto, T. Shimura, T. Hiuchi,T. Otake, Y. Sasaki, K. Yashioro, A. Kai-mai, T. Kawada, J. Mizuzaki, Electro-chemistry 2004, 72, 861.
63 H. Matsumoto, T. Shimura, T. Hiuchi,H. Tanaka, K. Katahira, T. Otake,T. Kudo, K. Yashioro, A. Kaimai,T. Kawada, J. Mizuzaki, J. Electrochem.Soc. 2005, 152, A488.
64 H. Matsumoto, T. Shimura, T. Hiuchi,T. Otake, Y. Sasaki, K. Yashioro,T. Kawada, J. Mizuzaki, S. Hashimoto,T. Ishihara, in Proceedings of the 26th RisøInternational Symposium on MaterialScience, S. Linderoth, A. Smith,N. Bonanos, A. Hagen, L. Mikkelsen,K. Kammer, D. Lybye, P.V. Hendriksen,F.W. Poulsen, M. Mogensen, W.G.Wang (Eds.), Risø National Laboratory,Roskilde, Denmark, p. 285, 2005.
65 X. Qi, Y.S. Lin, Solid State Ionics 2000,130, 149–156.
66 L. Li, E. Iglesia, Solid State Ionics 2003,58, 1977.
67 G. C. Mather, M. Saiful Islam, Chem.Mater. 2005, 17, 1736.
68 E. D. Wachsman, J. Naixiong, U.S. Pat.6 235 417, May 22, 2001.
69 S. E. Dorris, T. H. Lee, U. Balachandran,U.S. Pat. 6 569 226, May 27, 2003.
70 U. F. Reichel, Berichte des Forschungszen-trums Jülich 1996, Jül-3318, pp. 1–142.
71 N. Sammes, R. Phillips, A. Smirnova,J. Power Sources 2004, 134, 153.
72 H. Uchida, H. Yoshikawa, T. Esaka,S. Ohtsu, H. Iwahara, Solid State Ionics1989, 36, 89.
1 Dense Ceramic Membranes for Hydrogen Separation48
73 W. Lian, Yi Ting, Z. X. Zhihong,J. Mater. Sci. Lett. 1994, 13, 1032.
74 T. Tsuji, T. Nagano, Solid State Ionics2000, 136–137, 179.
75 S.-J. Song, E. D. Wachsman, J. Rhodes,S. E. Doris, U. Balachandran,J. Electrochem. Soc. 2003, 150, A1484.
76 S. Cheng, V. K. Gupta, Y. S. Lin, SolidState Ionics 2005, 176, 2653.
77 Y. Larring, personal communication.78 A. N. Shirsat, K. N. G. Kaimal, S. R.
Bharadwaj, D. Das, J. Solid State Chem.2004, 177, 2007.
79 S. Okada, A. Mineshige, A. Takasaki,M. Kobunea, T. Yazawaa, H. Matsu-moto, T. Shimura, H. Iwahara,Z. Ogumi, Solid State Ionics 2004, 175,593.
80 Y. Larring, T. Norby, Solid State Ionics1994, 70–71, 305.
81 Y. Larring, PhD Dissertation; Protonsand Oxygen Vacancies in Acceptor-Sub-stituted Rare Earth Oxides, Universityof Oslo, 1998.
82 R. Haugsrud, Y. Larring, T. Norby, SolidState Ionics 2005, 176 (39–40), 2957–2961.
83 O. W. Johnson, S.-H. Paek, J. W.DeFord, J. Appl. Phys. 1975, 46, 1026.
84 R. Haugsrud, T. Norby, to be published.85 R. Haugsrud, Y. Larring, to be pub-
lished.86 Y. Larring, R. Haugsrud, T. Norby,
R. Bredesen, to be published.87 T. Shimura, M. Komori and H. Iwahara,
Solid State Ionics 1996, 86–88, 685–689.88 J.A. Labrincha, J.R. Frade and F.M.B.
Marques, Solid State Ionics 1997, 99, 33.89 T. Shimura, Y. Tokiwa, H. Iwahara, Solid
State Ionics 2002, 154–155, 653.90 R. Haugsrud, T. Norby, Nature Materials
2006, 5, 193–196.91 T. Shimura, S. Fujimoto, H. Iwahara,
Solid State Ionics 2001, 143, 117.92 R. Haugsrud, C. Kjølseth, T. Norby, to
be published.93 U. Balachandran, T. H. Lee, S. Wang,
C. Zuo. S.E. Dorris, K.S. Rothenbergerin Proceedings of the 20th InternationalPittsburgh Coal Conference, Pittsburgh,Sept. 15–19, 2003, S46, 187, PittsburghCoal Conference, University of Pitts-burgh.
94 U. Balachandran, T. H. Lee, G. Zhang,S. E. Dorris, K. S. Rothenberger, B. H.Howard, B. Morreale, A. V. Cugini, R. V.Siriwardane, J. A. Poston Jr., E. P.Fisher, in Proceedings of the 26th Interna-tional Technical Conference on Coal Utili-zation and Fuel Systems, Clearwater, FL,Mar. 5–8, 2001, Coal Technical Associa-tion, Gaithersburg, MD, pp. 751–761,2001.
95 Y. Nigara, K. Kawamura, T. Kawada,J. Mizusaki, Solid State Ionics 2001, 145,365–370.
96 Y. Nigara, K. Yashiro, T. Kawada,J. Mizusaki, Solid State Ionics 2003, 159,135–141.
97 Y. Nigara, K. Yashiro, J.-O Hong,T. Kawada, J. Mizusaki, Solid State Ionics2004, 171, 61–67.
98 E. Serra, A. Calza Bini, G. Cosoli, L. Pil-loni, J. Am. Ceram. Soc. 2005, 88, 15–18.
99 T. Norby, P. Kofstad, High Temp.-HighPress. 1988, 20, 345–360.
100 A. Bongiorno, L. Colombo, F. Cargnoni,Chem. Phys. Lett. 1997, 264, 435–440.
101 M.I. Heggie, R. Jones, C.D. Latham,S.C.P. Maynard, P. Tole, Philos. Mag. B,Phys. Condens. Matter 1992, 65, 463–471.
102 M. Lacerda, A. R. West, J. T. S. Irvine,Solid State Ionics 1993, 59, 257–262.
103 K. Hayashi, M. Hirano, H. Hosono,J. Phys. Chem. B 2005, 109, 11900–11906.
104 D. L. McKinley, U.S. Pat. 3 439 474, Apr.22, 1969.
105 D. J. Edlund, J. McCarthy, J. Membr. Sci.1995, 107, 147.
106 F. Roa, J. D. Way, R. L. McCormick,S. N. Paglieri, J. Chem. Eng. 2003, 93, 11.
107 K. S. Rotheberger, B. H. Howard, R. P.Killmeyer, A. V. Cugini, R. M. Enick,F. Bustamante, M. V. Ciocco, B. D. Mor-reale, R. E. Buxbaum, J. Membr. Sci.2003, 218, 19.
108 M. V. Mundschau, X. Xie, A. F. Sam-mells, in Carbon Dioxide Capture forStorage in Deep Geologic Formations –Results from the CO2 Capture Project,D. C. Thomas, S. M. Benson (Eds.),Elsevier, Vol. 1, Ch. 16, pp. 291–306,2005.