0master - farnell element14 · changing the information language ... changing the auto set options...
TRANSCRIPT

4822 872 30482October 2001© 2001 Fluke Corporation. All rights reserved. Printed in the Netherlands.All product names are trademarks of their respective companies.
Fluke 196C/199CScopeMeter
Users Manual


LIMITED WARRANTY & LIMITATION OF LIABILITYEach Fluke product is warranted to be free from defects in material and workmanship under normal use and service. The warranty period is three yearsand begins on the date of shipment. Parts, product repairs and services are warranted for 90 days. This warranty extends only to the original buyer or end-usercustomer of a Fluke authorized reseller, and does not apply to fuses, disposable batteries or to any product which, in Fluke's opinion, has been misused, altered,neglected or damaged by accident or abnormal conditions of operation or handling. Fluke warrants that software will operate substantially in accordance with itsfunctional specifications for 90 days and that it has been properly recorded on non-defective media. Fluke does not warrant that software will be error free oroperate without interruption.
Fluke authorized resellers shall extend this warranty on new and unused products to end-user customers only but have no authority to extend a greater or differentwarranty on behalf of Fluke. Warranty support is available if product is purchased through a Fluke authorized sales outlet or Buyer has paid the applicable internationalprice. Fluke reserves the right to invoice Buyer for importation costs of repair/replacement parts when product purchased in one country is submitted for repair in anothercountry.
Fluke's warranty obligation is limited, at Fluke's option, to refund of the purchase price, free of charge repair, or replacement of a defective product which is returned to aFluke authorized service center within the warranty period.
To obtain warranty service, contact your nearest Fluke authorized service center or send the product, with a description of the difficulty, postage and insurance prepaid(FOB Destination), to the nearest Fluke authorized service center. Fluke assumes no risk for damage in transit. Following warranty repair, the product will be returned toBuyer, transportation prepaid (FOB Destination). If Fluke determines that the failure was caused by misuse, alteration, accident or abnormal condition of operation orhandling, Fluke will provide an estimate of repair costs and obtain authorization before commencing the work. Following repair, the product will be returned to the Buyertransportation prepaid and the Buyer will be billed for the repair and return transportation charges (FOB Shipping Point).
THIS WARRANTY IS BUYER'S SOLE AND EXCLUSIVE REMEDY AND IS IN LIEU OF ALL OTHER WARRANTIES, EXPRESS OR IMPLIED, INCLUDING BUTNOT LIMITED TO ANY IMPLIED WARRANTY OF MERCHANTABILITY OR FITNESS FOR A PARTICULAR PURPOSE. FLUKE SHALL NOT BE LIABLE FOR ANYSPECIAL, INDIRECT, INCIDENTAL OR CONSEQUENTIAL DAMAGES OR LOSSES, INCLUDING LOSS OF DATA, WHETHER ARISING FROM BREACH OFWARRANTY OR BASED ON CONTRACT, TORT, RELIANCE OR ANY OTHER THEORY.
Since some countries or states do not allow limitation of the term of an implied warranty, or exclusion or limitation of incidental or consequential damages, the limitationsand exclusions of this warranty may not apply to every buyer. If any provision of this Warranty is held invalid or unenforceable by a court of competent jurisdiction, suchholding will not affect the validity or enforceability of any other provision.
Fluke Corporation, P.O. Box 9090, Everett, WA 98206-9090 USA, or
Fluke Industrial B.V., P.O. Box 90, 7600 AB, Almelo, The Netherlands

SERVICE CENTERSTo locate an authorized service center, visit us on the World Wide Web:
http://www.fluke.com
or call Fluke using any of the phone numbers listed below:
+1-888-993-5853 in U.S.A. and Canada
+31-40-2675200 in Europe
+1-425-446-5500 from other countries

i
Table of Contents
Chapter Title Page
Unpacking the Test Tool Kit........................................................................................ 2
Safety Information: Read First ....................................................................................... 41 Using The Scope .......................................................................................................... 7
Powering the Test Tool .................................................................................................. 7Resetting the Test Tool .................................................................................................. 8Navigating a Menu ......................................................................................................... 9Hiding Key Labels and Menus ....................................................................................... 10Input Connections .......................................................................................................... 10Making Scope Connections ........................................................................................... 11Displaying an Unknown Signal with Connect-and-View™ ............................................. 12Making Automatic Scope Measurements....................................................................... 13Freezing the Screen....................................................................................................... 14Using Average, Persistence and Glitch Capture............................................................ 15Acquiring Waveforms..................................................................................................... 18

Fluke 196C/199CUsers Manual
ii
Analyzing Waveforms .................................................................................................... 222 Using The Multimeter .................................................................................................. 23
Making Meter Connections ............................................................................................ 23Making Multimeter Measurements ................................................................................. 24Freezing the Readings................................................................................................... 27Selecting Auto/Manual Ranges...................................................................................... 27Making Relative Measurements..................................................................................... 28
3 Using The Recorder Functions................................................................................... 29
Opening the Recorder Main Menu................................................................................. 29Plotting Measurements Over Time (TrendPlot™) .......................................................... 30Recording Scope Waveforms In Deep Memory (Scope Record) .................................. 33Analyzing a TrendPlot or Scope Record........................................................................ 36
4 Using Replay, Zoom and Cursors............................................................................... 37
Replaying the 100 Most Recent Scope Screens ........................................................... 37Zooming in on a Waveform............................................................................................ 40Making Cursor Measurements ....................................................................................... 42
5 Triggering on Waveforms............................................................................................ 45
Setting Trigger Level and Slope..................................................................................... 46Using Trigger Delay or Pre-trigger ................................................................................. 47Automatic Trigger Options ............................................................................................. 48Triggering on Edges....................................................................................................... 49Triggering on External Waveforms ................................................................................ 52

Contents (continued)
iii
Triggering on Video Signals ........................................................................................... 53Triggering on Pulses ...................................................................................................... 55
6 Using Memory, PC and Printer.................................................................................... 59
Saving and Recalling ..................................................................................................... 59Documenting Screens.................................................................................................... 63
7 Tips................................................................................................................................ 67
Using the Standard Accessories .................................................................................... 67Using the Independently Floating Isolated Inputs .......................................................... 70Using the Tilt Stand........................................................................................................ 72Resetting the Test Tool .................................................................................................. 72Suppressing Key Labels and Menu’s............................................................................. 72Changing the Information Language.............................................................................. 73Adjusting the Contrast and Brightness........................................................................... 73Changing the Display Color ........................................................................................... 74To set the display to color or Black and White, do the following:................................... 74Changing Date and Time ............................................................................................... 74Saving Battery Life ......................................................................................................... 75Changing the Auto Set Options...................................................................................... 76
8 Maintaining the Test Tool............................................................................................ 77
Cleaning the Test Tool ................................................................................................... 77Storing the Test Tool...................................................................................................... 77Charging the Batteries ................................................................................................... 78Extending Battery Operation Time ................................................................................. 79Replacing the NiMH Battery Pack BP190 ...................................................................... 80Calibrating the Voltage Probes ...................................................................................... 80

Fluke 196C/199CUsers Manual
iv
Displaying Calibration Information ................................................................................. 82Parts and Accessories ................................................................................................... 82Troubleshooting ............................................................................................................. 87
9 Specifications............................................................................................................... 89
Introduction .................................................................................................................... 89Dual Input Oscilloscope ................................................................................................. 90Automatic Scope Measurements ................................................................................... 92Meter.............................................................................................................................. 96DMM Measurements on Meter Inputs ............................................................................ 96Recorder ........................................................................................................................ 98Zoom, Replay and Cursors ............................................................................................ 99Miscellaneous ................................................................................................................ 99Environmental ................................................................................................................ 101
Safety ..................................................................................................................... 10210:1 Probe ..................................................................................................................... 103Electromagnetic Immunity.............................................................................................. 105

Unpacking the Test Tool Kit
1
Declaration of Conformityfor
Fluke 196C/199C
ScopeMeter® test tools
ManufacturerFluke Industrial B.V.
Lelyweg 17602 EA AlmeloThe Netherlands
Statement of ConformityBased on test results using appropriate standards,
the product is in conformity withElectromagnetic Compatibility Directive 89/336/EEC
Low Voltage Directive 73/23/EEC
Sample testsStandards used:
EN 61010.1 (1993)Safety Requirements for Electrical Equipment for
Measurement, Control, and Laboratory Use
EN-IEC61326-1 (1997)Electrical equipment for
measurements and laboratoryuse -EMC requirements-
The tests have been performed in atypical configuration.
This Conformity is indicated by the symbol ,i.e. “Conformité Européenne”.

Fluke 196C/199CUsers Manual
2
Unpacking the Test Tool KitThe following items are included in your test tool kit:
Note
When new, the rechargeable NiMH battery is notfully charged. See Chapter 8.
Figure 1. ScopeMeter Test Tool Kit

Unpacking the Test Tool Kit
3
# Description1 ScopeMeter Test Tool2 Battery Charger (country dependent)3 10:1 Voltage Probe Set (red)
a) 10:1 Voltage Probe (red)b) Hook Clip for Probe Tip (red)c) Ground Lead with Hook Clip (red)d) Ground Lead with Mini Alligator Clip (black)e) 4-mm Test Probe for Probe Tip (red)f) Ground Spring for Probe Tip (black)
4 10:1 Voltage Probe Set (gray)a) 10:1 Voltage Probe (gray)b) Hook Clip for Probe Tip (gray)c) Ground Lead with Hook Clip (gray)d) Ground Lead with Mini Alligator Clip (black)e) 4-mm Test Probe for Probe Tip (gray)
5 Test Leads (red and black)6 Accessory Set
a) 2-mm Test Probe for Probe Tip (red)b) Industrial Alligator for Probe Tip (red)c) 2-mm Test Probe for Banana Jack (red)d) Industrial Alligator for Banana Jack (red)e) Ground Lead with 4-mm Banana Jack (black)
# Description7 Accessory Set
a) 2-mm Test Probe for Probe Tip (gray)b) Industrial Alligator for Probe Tip (gray)c) 2-mm Test Probe for Banana Jack (gray)d) Industrial Alligator for Banana Jack (gray)e) Ground Lead with 4-mm Banana Jack (black)
8 Getting Started Manual9 CD ROM with Users Manual (multi-language)
10 Shipment box (basic version only)
Fluke 196C-S and 199C-S versions include also thefollowing items:
# Description11 Optically Isolated RS-232 Adapter/Cable12 FlukeView® ScopeMeter® Software for
Windows®
13 Hard Case

Fluke 196C/199CUsers Manual
4
Safety Information: Read FirstCarefully read the following safety information beforeusing the test tool.
Specific warning and caution statements, where theyapply, appear throughout the manual.
A “Warning” identifies conditions and actionsthat pose hazard(s) to the user.
A “Caution” identifies conditions and actionsthat may damage the test tool.
The following international symbols are used on the testtool and in this manual:
See explanation inmanual
Double Insulation(Protection Class)
Disposal information Earth
Recyclinginformation
ConformitéEuropéenne
Safety Approval Safety Approval
Direct Current Alternating Current
WarningTo avoid electrical shock or fire:• Use only the Fluke power supply, Model
BC190 (Battery Charger / Power Adapter).• Before use check that the selected/indicated
range on the BC190 matches the local linepower voltage and frequency.
• For the BC190/808 universal Battery Charger /Power Adapter) only use line cords thatcomply with the local safety regulations.
Note:
To accomodate connection to various line powersockets, the BC190/808 universal BatteryCharger / Power Adapter is equipped with a maleplug that must be connected to a line cordappropriate for local use. Since the adapter isisolated, the line cord does not need to beequipped with a terminal for connection toprotective ground. Since line cords with aprotective grounding terminal are morecommonly available you might consider usingthese anyhow.

Safety Information: Read First
5
WarningTo avoid electrical shock or fire if a test toolinput is connected to more than 42 V peak (30Vrms) or on circuits of more than 4800 VA:• Use only insulated voltage probes, test leads
and adapters supplied with the test tool, orindicated by Fluke as suitable for the Fluke190ScopeMeter series.
• Before use, inspect voltage probes, test leadsand accessories for mechanical damage andreplace when damaged.
• Remove all probes, test leads and accessoriesthat are not in use.
• Always connect the battery charger first to theac outlet before connecting it to the test tool.
• Do not connect the ground spring (figure 1,item f) to voltages higher than 42 V peak (30Vrms) from earth ground.
• Do not apply voltages that differ more than 600V from earth ground to any input whenmeasuring in a CAT III environment.Do not apply voltages that differ more than1000 V from earth ground to any input whenmeasuring in a CAT II environment.
• Do not apply voltages that differ more than 600V from each other to the isolated inputs whenmeasuring in a CAT III environment.Do not apply voltages that differ more than1000 V from each other to the isolated inputswhen measuring in a CAT II environment.
• Do not apply input voltages above the rating ofthe instrument. Use caution when using 1:1test leads because the probe tip voltage will bedirectly transmitted to the test tool.
• Do not use exposed metal BNC or banana plugconnectors.
• Do not insert metal objects into connectors.• Always use the test tool only in the manner
specified.Voltage ratings that are mentioned in the warnings, aregiven as limits for “working voltage”. They representV ac rms (50-60 Hz) for ac sinewave applications and asV dc for dc applications.
Overvoltage Category III refers to distribution level andfixed installation circuits inside a building.Overvoltage Category II refers to local level, which isapplicable for appliances and portable equipment.

Fluke 196C/199CUsers Manual
6
The terms ‘Isolated’ or ‘Electrically floating’ are used inthis manual to indicate a measurement in which the testtool input BNC or banana jack is connected to a voltagedifferent from earth ground.
The isolated input connectors have no exposed metal andare fully insulated to protect against electrical shock.
The red and gray BNC jacks, and the red and black4-mm banana jacks can independently be connected to avoltage above earth ground for isolated (electricallyfloating) measurements and are rated up to 1000 VrmsCAT II and 600 Vrms CAT III above earth ground.
If Safety Features are Impaired
Use of the test tool in a manner not specified mayimpair the protection provided by the equipment.Before use, inspect the test leads for mechanical damageand replace damaged test leads!
Whenever it is likely that safety has been impaired, thetest tool must be turned off and disconnected from the linepower. The matter should then be referred to qualifiedpersonnel. Safety is likely to be impaired if, for example,the test tool fails to perform the intended measurementsor shows visible damage.

7
Chapter 1Using The Scope
About this ChapterThis chapter provides a step-by-step introduction to thescope functions of the test tool. The introduction does notcover all of the capabilities of the scope functions butgives basic examples to show how to use the menus andperform basic operations.
Powering the Test ToolFollow the procedure (steps 1 through 3) in Figure 2 topower the test tool from a standard ac outlet.See Chapter 8 for instructions on using battery power.
Turn the test tool on with the on/off key.
The test tool powers up in its last setup configuration. Figure 2. Powering the Test Tool

Fluke 196C/199CUsers Manual
8
Resetting the Test ToolIf you want to reset the test tool to the factory settings, dothe following:
1 Turn the test tool off.
2 Press and hold the USER key.
3 Press and release.
The test tool turns on, and you should hear a doublebeep, indicating the reset was successful.
4 Release the USER key.
Now look at the display; you will see a screen that lookslike Figure 3.
Figure 3. The Screen After Reset

Using The ScopeNavigating a Menu 1
9
Navigating a MenuThe following example shows how to use the test tool'smenus to select a function. Subsequently follow steps1 through 4 to open the scope menu and to choose anitem.
1 Press the SCOPE key to displaythe labels that define the presentuse for the four blue functionkeys at the bottom of the screen.
NoteTo hide the labels for full screen view, press theSCOPE key again. This toggling enables you tocheck the labels without affecting your settings.
2 Open the Waveform Optionsmenu. This menu is displayed atthe bottom of the screen.
Figure 4. Basic Navigation
3a
3b
Use the blue arrow keys tohighlight the item.Press the blue ENTER key toaccept the selection.
4 Press the ENTER key until you exitthe menu.
Note
Repeatedly pressing lets you to stepthrough a menu without changing the settings.

Fluke 196C/199CUsers Manual
10
Hiding Key Labels and MenusYou can hide a menu or key label at any time:
Press the CLEAR MENU key to hide anykey label or menu.
To display menus or key labels, press one of the yellowmenu keys, e.g. the SCOPE key.
Input ConnectionsLook at the top of the test tool. The test tool has foursignal inputs: two safety BNC jack inputs (red input A andgray input B) and two safety 4-mm banana jack inputs(red and black). Use the two BNC jack inputs for scopemeasurements, and the two banana jack inputs for metermeasurements.
Isolated input architecture allows independent floatingmeasurements with each input.
Figure 5. Measurement Connections

Using The ScopeMaking Scope Connections 1
11
Making Scope ConnectionsTo make dual input scope measurements, connect thered voltage probe to input A, and the gray voltage probeto input B. Connect the short ground leads of eachvoltage probe to its own reference potential. (See Figure6.)
Note
To maximally benefit from having independentlyisolated floating inputs and to avoid problemscaused by improper use, read Chapter 7: “Tips”.
Figure 6. Scope Connections

Fluke 196C/199CUsers Manual
12
Displaying an Unknown Signal withConnect-and-View™The Connect-and-View feature lets the test tool displaycomplex, unknown signals automatically. This functionoptimizes the position, range, time base, and triggeringand assures a stable display of virtually any waveform. Ifthe signal changes, the setup is automatically adjusted tomaintain the best display result. This feature is especiallyuseful for quickly checking several signals.
To enable the Connect-and-View feature, do the following:
1 Perform an Auto Set. AUTO appears atthe top right of the screen.
The bottom line shows the range, the time base, and thetrigger information.
The waveform identifier (A) is visible on the bottom rightside of the screen, as shown in Figure 7. The input A zeroicon (-) at the left side of the screen identifies the groundlevel of the waveform.
2 Press a second time to select themanual range again. MANUAL appearsat the top right of the screen.
Figure 7. The Screen After an Auto Set
Use the light-gray RANGE, TIME and MOVE keys at thebottom of the keypad to change the view of the waveformmanually.
Using The ScopeMaking Automatic Scope Measurements 1
13
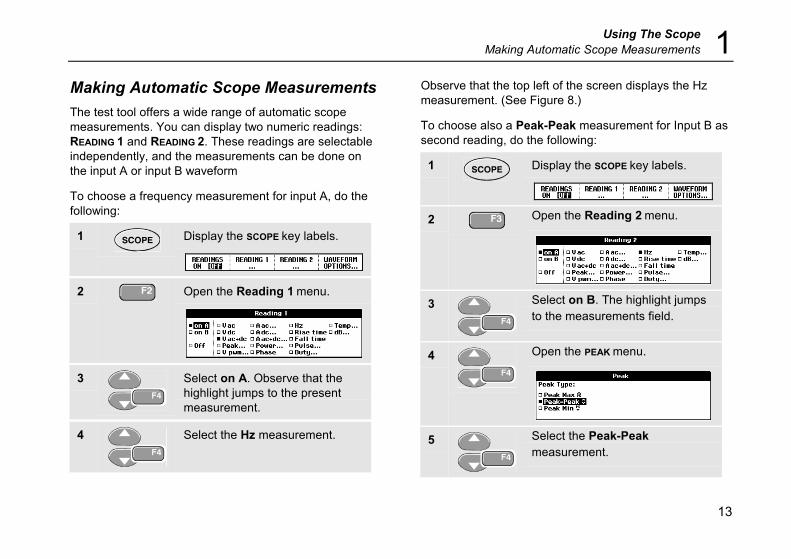
Making Automatic Scope MeasurementsThe test tool offers a wide range of automatic scopemeasurements. You can display two numeric readings:READING 1 and READING 2. These readings are selectableindependently, and the measurements can be done onthe input A or input B waveform
To choose a frequency measurement for input A, do thefollowing:
1 Display the SCOPE key labels.
2 Open the Reading 1 menu.
3 Select on A. Observe that thehighlight jumps to the presentmeasurement.
4 Select the Hz measurement.
Observe that the top left of the screen displays the Hzmeasurement. (See Figure 8.)
To choose also a Peak-Peak measurement for Input B assecond reading, do the following:
1 Display the SCOPE key labels.
2 Open the Reading 2 menu.
3 Select on B. The highlight jumpsto the measurements field.
4 Open the PEAK menu.
5 Select the Peak-Peakmeasurement.

Fluke 196C/199CUsers Manual
14
Figure 8 shows an example of the screen. Note that thePeak-Peak reading for input B appears next to the input Afrequency reading at the top of the screen.
Figure 8. Hz and V peak-peak as Scope Readings
Freezing the ScreenYou can freeze the screen (all readings and waveforms)at any time.
1 Freeze the screen. HOLD appearsat the right of the reading area.
2 Resume your measurement.

Using The ScopeUsing Average, Persistence and Glitch Capture 1
15
Using Average, Persistence and GlitchCaptureUsing Average for Smoothing WaveformsTo smooth the waveform, do the following:
1 Display the SCOPE key labels.
2 Open the Waveform Optionsmenu.
3 Jump to Average:
4 Select On... to open the AverageFactors menu
5 Select Average 64.This averagesthe outcomes of 64 acquisitions.
6 Exit the menu.
You can use the average functions to suppress random oruncorrelated noise in the waveform without loss ofbandwidth. Waveform samples with and withoutsmoothing are shown in Figure 9.
Figure 9. Smoothing a Waveform

Fluke 196C/199CUsers Manual
16
Using Persistence to Display WaveformsYou can use Persistence to observe dynamic signals.
1 Display the SCOPE key labels.
2 Open the Waveform Optionsmenu.
3 Jump to Waveform: and open thePersistence... menu.
4 SelectDigital Persistence: Infinite,Envelope: Off.Start monitoring the waveform.
Figure 10. Using Persistence to Observe DynamicSignals
When you select Envelope: On, the test tool displays theupper and lower boundaries of dynamic waveforms.

Using The ScopeUsing Average, Persistence and Glitch Capture 1
17
Displaying GlitchesTo capture glitches on a waveform, do the following:
1 Display the SCOPE key labels.
2 Open the Waveform Optionsmenu.
3 Select Glitch Detect: On
4 Exit the menu.
You can use this function to display events (glitches orother asynchronous waveforms) of 50 ns (nanoseconds)or wider, or you can display HF modulated waveforms.
Suppressing High Frequency NoiseSwitching Glitch Detect to Off will suppress the highfrequency noise on a waveform. Averaging will suppressthe noise even more.
1 Display the SCOPE key labels.
2 Open the Waveform Optionsmenu.
3 Select Glitch Detect: Off, thenselect Average: On to open theAverage menu
4 Select Factor : 8x
TipGlitch capture and average do not affectbandwidth. Further noise suppression is possiblewith bandwidth limiting filters. See Chapter 1:“Working with Noisy Waveforms”.

Fluke 196C/199CUsers Manual
18
Acquiring WaveformsSelecting AC-CouplingAfter a reset, the test tool is dc-coupled so that ac and dcvoltages appear on the screen.
Use ac-coupling when you wish to observe a small acsignal that rides on a dc signal. To select ac-coupling, dothe following:
1 Display the INPUT A key labels.
2 Highlight AC.
Observe that the bottom left of the screen displays theac-coupling icon: .
Reversing the Polarity of the DisplayedWaveformTo invert the input A waveform, do the following:
1 Display the INPUT A key labels.
2 Open the Input A menu.
3 Select Inverted and acceptinverted waveform display.
4 Exit the menu.
For example, a negative-going waveform is displayed aspositive-going waveform which may provide a moremeaningful view. An inverted display is identified by aninversed trace identifier ( ) at the right of the waveform.

Using The ScopeAcquiring Waveforms 1
19
Variable Input SensitivityThe variable input sensitivity allows you to adjust thesensitivity continuously, for example to set the amplitudeof a reference signal to exactly 6 divisions.
The input sensitivity of a range can be increased up to 2.5times, for example between 10 mV/div and 4 mV/div in the10 mV/div range.
To use the variable input sensitivity, do the following:
1 Apply the input signal
2 Perform an Auto Set (AUTO mustappear at the top of the screen)
An Auto Set will turn off the variable input sensitivity. Youcan now select the required input range. Keep in mindthat the sensitivity will increase when you start adjustingthe variable sensitivity (the displayed trace amplitude willincrease).
3 Display the INPUT A key labels.
4 Open the Input A Options...menu.
5 Select and accept Variable.
6 Exit the menu.
At the bottom left of the screen the text A Var isdisplayed.
Selecting Variable will turn off cursors and automatic inputranging.
7 Press mV to increase thesensitivity, press V to decreasethe sensitivity.

Fluke 196C/199CUsers Manual
20
Working with Noisy WaveformsTo suppress high frequency noise on waveforms, you canlimit the working bandwidth to 10 kHz or 20 MHz. Thisfunction smoothes the displayed waveform. For the samereason, it improves triggering on the waveform.
To choose HF reject, do the following:
1 Display the INPUT A key labels.
2 Open the Input A menu.
3 Jump to Bandwidth.
4 Select 10kHz (HF reject) toaccept the bandwidth limitation.
TipTo suppress noise without loss of bandwidth,use the average function or turn off DisplayGlitches.
Using Waveform Mathematics FunctionsWhen adding (A+B), subtracting (A-B), or multiplying(A*B) the input A and input B waveform, the test tool willdisplay the mathematical result waveform and the input Aand input B waveforms.
A versus B provides a plot with input A on the vertical axisand input B on the horizontal axis.
The Mathematics functions perform a point-to-pointoperation on waveforms A and B.
To use a Mathematics function, do the following:
1 Display the SCOPE key labels.
2 Open the Waveform Optionsmenu.

Using The ScopeAcquiring Waveforms 1
21
3 Jump to Waveform: and SelectMathematics... to open theMathematics menu.
4 Select Function: A+B, A-B, A*B orA vs B.
5 Select a scale factor to fit themathematical result waveform ontothe display, and return.
The sensitivity range of the mathematical result is equal tothe sensitivity range of the least sensitive input divided bythe scale factor.
Comparing WaveformsYou can display a fixed reference waveform with theactual waveform for comparison.
To create a reference waveform and to display it with theactual waveform, do the following:
1 Display the SCOPE key labels.
2 Open the Waveform Optionsmenu.
3 Jump to Reference: and acceptNew. The momentary waveform isstored and permanently displayed.The display also shows the actualwaveform.
To recall a saved waveform from memory and use it as areference waveform refer to Chapter 6 Recalling Screenswith Associated Setups.

Fluke 196C/199CUsers Manual
22
Analyzing WaveformsYou can use the analysis functions CURSOR, ZOOM andREPLAY to perform detailed waveform analysis. Thesefunctions are described in Chapter 4: “Using Cursors,Zoom and Replay”.

23
Chapter 2Using The Multimeter
About this ChapterThis chapter provides a step-by-step introduction to themultimeter functions of the test tool (hereafter called“meter”). The introduction gives basic examples to showhow to use the menus and perform basic operations.
Making Meter ConnectionsUse the two 4-mm safety red ( ) and black (COM)banana jack inputs for the Meter functions.(See Figure 11.)
Note
Typical use of the Meter test leads andaccessories is shown in Chapter 7.
Figure 11. Meter Connections

Fluke 196C/199CUsers Manual
24
Making Multimeter MeasurementsThe screen displays the numeric readings of themeasurements on the meter input.
Measuring Resistance ValuesTo measure a resistance, do the following:
1 Connect the red and black test leads from the4-mm banana jack inputs to the resistor.
2
Display the METER key labels.
3 Open the Measurement menu.
4
Highlight Ohms.
5 Select Ohms measurement.
The resistor value is displayed in ohms. Observe also thatthe bargraph is displayed. (See Figure 12.)
Figure 12. Resistor Value Readings

Using The MultimeterMaking Multimeter Measurements 2
25
Making a Current Measurement You can measure current in both Scope mode and Metermode. Scope mode has the advantage of two waveformsbeing displayed while you perform measurements.Meter mode has the advantage of high measurementresolution.
The next example explains a typical current measurementin Meter mode.
WarningCarefully read the instructions about thecurrent probe you are using.
To set up the test tool, do the following:
1 Connect a current probe (e.g. i400, optional)from the 4-mm banana jack outputs to theconductor to be measured.
Ensure that the red and black probe connectorscorrespond to the red and black banana jackinputs. (See Figure 13.)
2 Display the METER key labels.
Figure 13. Measurement Setup
3 Open the Measurement menu.
4 Highlight A ac....
5 Open the Current Probesubmenu.

Fluke 196C/199CUsers Manual
26
6 Observe the sensitivity of thecurrent probe. Highlight thecorresponding sensitivity in themenu, e.g. 10 mV/A.
7 Accept the current measurement.
Now, you will see a screen like in Figure 14.
Figure 14. Ampere Measurement Readings
Using The MultimeterFreezing the Readings 2
27
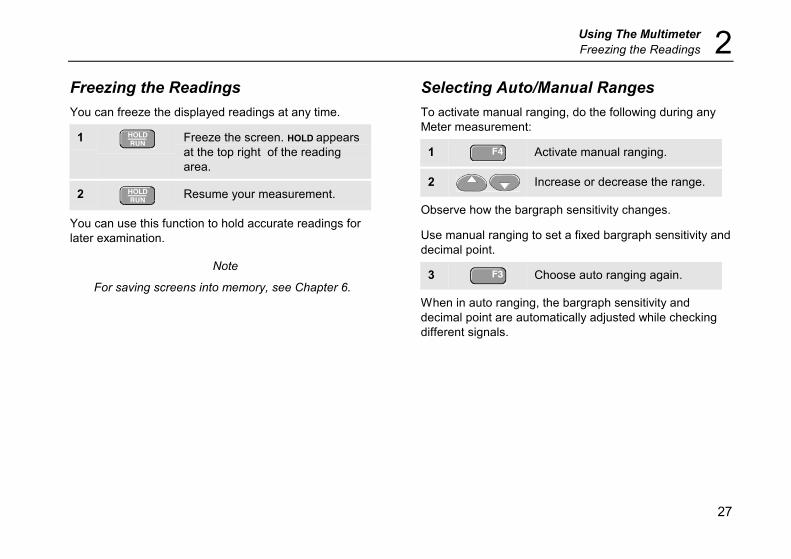
Freezing the ReadingsYou can freeze the displayed readings at any time.
1 Freeze the screen. HOLD appearsat the top right of the readingarea.
2 Resume your measurement.
You can use this function to hold accurate readings forlater examination.
Note
For saving screens into memory, see Chapter 6.
Selecting Auto/Manual RangesTo activate manual ranging, do the following during anyMeter measurement:
1 Activate manual ranging.
2 Increase or decrease the range.
Observe how the bargraph sensitivity changes.
Use manual ranging to set a fixed bargraph sensitivity anddecimal point.
3 Choose auto ranging again.
When in auto ranging, the bargraph sensitivity anddecimal point are automatically adjusted while checkingdifferent signals.

Fluke 196C/199CUsers Manual
28
Making Relative MeasurementsA relative measurement displays the presentmeasurement result relative to a defined reference value.
The following example shows how to perform a relativevoltage measurement. First obtain a reference value:
1 Display the METER key labels.
2 Measure a voltage to be used asreference value.
3 Set RELATIVE to ON. (ON ishighlighted.)
This stores the reference value as reference forsubsequent measurements. The stored reference value isdisplayed in small digits at the bottom right side of thescreen after the word REFERENCE.
4 Measure the voltage to becompared to the reference.
Observe that the main reading is displayed as variationsfrom the reference value. The actual reading with itsbargraph is displayed beneath these readings. (SeeFigure 15.)
Figure 15. Making a Relative Measurement
You can use this feature when, for example, you need tomonitor input activity (voltage, resistance, temperature) inrelation to a known good value.

29
Chapter 3Using The Recorder Functions
About this ChapterThis chapter provides a step-by-step introduction to therecorder functions of the test tool. The introduction givesexamples to show how to use the menus and performbasic operations.
Opening the Recorder Main MenuFirst choose a measurement in scope or meter mode.Now you can choose the recorder functions from therecorder main menu. To open the main menu, do thefollowing:
1 Open the RECORDER main menu.(See Figure 16.)
Figure 16. Recorder Main Menu

Fluke 196C/199CUsers Manual
30
Plotting Measurements Over Time(TrendPlot™)Use the TrendPlot function to plot a graph of Scope orMeter measurements as function of time.
Note
Because the navigations for the dual inputTrendPlot (Scope) and the single input TrendPlot(Meter) are identical, only TrendPlot (Scope) isexplained in the next sections.
Starting a TrendPlot FunctionTo start plotting a graph of the reading over time, do thefollowing:
1 Apply a signal to the red BNC input A and turnon Reading 1 in scope mode
2 Open the RECORDER main menu.
3 Highlight Trend Plot (Scope).
4 Start the TrendPlot recording.
The test tool continuously records the digital readings ofthe input A measurements and displays these as a graph.The TrendPlot graph rolls from right to left like a paperchart recorder.
Observe that the recorded time from start appears at thebottom of the screen. The present reading appears on topof the screen. (See Figure 17.)
Note
When simultaneously TrendPlotting tworeadings, the screen area is split into twosections of four divisions each.

Using The Recorder FunctionsPlotting Measurements Over Time (TrendPlot™) 3
31
Figure 17. TrendPlot Reading
When the Scope is in automatic mode, automatic verticalscaling is used to fit the TrendPlot graph on the screen.
5 Set RECORDER to STOP to freezethe recorder function.
6 Set RECORDER to RUN to continue.
Displaying Recorded DataWhen in normal view (NORMAL), only the nine mostrecently recorded divisions are displayed on screen. Allprevious recordings are stored in memory.
VIEW ALL shows all data in memory:
7 Display an overview of the fullwaveform.
Press repeatedly to toggle between normal view(NORMAL) and overview (VIEW ALL)
When the recorder memory is full, an automaticcompression algorithm is used to compress all samplesinto half of the memory without loss of transients. Theother half of the recorder memory is free again to continuerecording.

Fluke 196C/199CUsers Manual
32
Changing the Recorder OptionsAt the right bottom of the display you can choose todisplay the time elapsed from start and the actual time ofthe day.
To change the time reference, proceed from step 6 asfollows:
7 Open the Recorder Optionsmenu.
8 Select Time of Day and jump tothe next field.
Now the recorded time and the current time appear at thebottom of the screen.
The options Reading 1 and Reading 2 allow you to selectthe scope readings to be recorded. (Or one metermeasurement when in TrendPlot meter mode.)
To continue without making further changes:
9 Close.
Turning Off the TrendPlot Display10 Exit the recorder function.

Using The Recorder FunctionsRecording Scope Waveforms In Deep Memory (Scope Record) 3
33
Recording Scope Waveforms In DeepMemory (Scope Record)The SCOPE RECORD function is a roll mode that logs one ortwo long waveforms. This function can be used to monitorwaveforms like motion control signals or the power-onevent of an Uninterruptable Power Supply (UPS). Duringrecording, fast transients are captured. Because of thedeep memory, recording can be done for more than oneday. This function is similar to the roll mode in manyDSO’s but has deeper memory and better functionality.
Starting a Scope Record Function1 Apply a signal to the red BNC input A.
2 From the Recorder main menu,highlight Scope Record.
3 Start the recording.
The waveform moves across the screen from right to leftlike a normal chart recorder. (See Figure 18.)
Figure 18. Recording Waveforms
Observe that the top of the screen displays the following:
• Time from start at the top of the screen.
• The status at the bottom of the screen which includesthe time/div setting as well as the total timespan thatfits the memory.
Note
For accurate recordings it is advised to let theinstrument first warm up for five minutes.

Fluke 196C/199CUsers Manual
34
Displaying Recorded DataIn Normal view, the samples that roll off the screen arestored in deep memory. When the memory is full,recording continues by shifting the data in memory anddeleting the first samples out of memory.
In View All mode, the complete memory contents aredisplayed on the screen.
4 Press to toggle between VIEW ALL(overview of all recordedsamples) and NORMAL view.
You can analyze the recorded waveforms using theCursors and Zoom functions. See Chapter 4: “UsingReplay, Zoom and Cursors”.
Using ScopeRecord in Single Sweep ModeUse the recorder Single Sweep function to automaticallystop recording when the deep memory is full.
Continue from step 3 of the previous section:
4 Open the Recorder optionsmenu.
5 (2x) Jump to the Mode field.
6 Select Single Sweep and acceptthe recorder options.
Using The Recorder FunctionsRecording Scope Waveforms In Deep Memory (Scope Record) 3
35
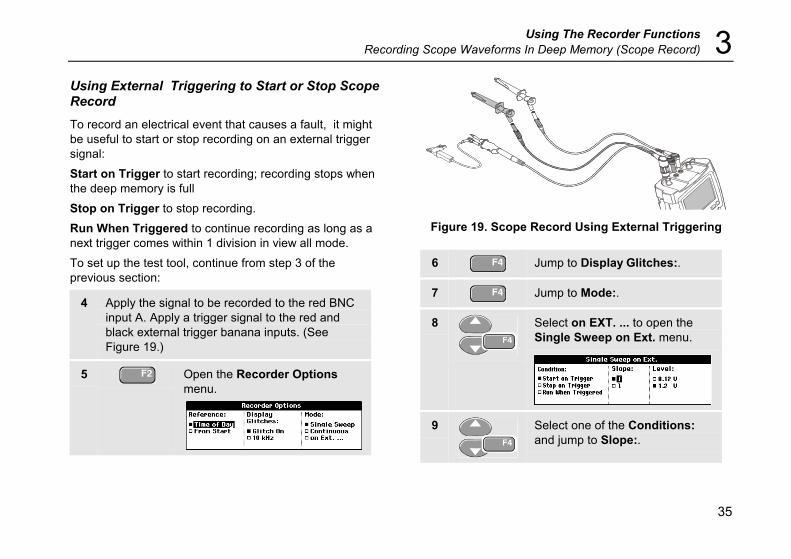
Using External Triggering to Start or Stop ScopeRecordTo record an electrical event that causes a fault, it mightbe useful to start or stop recording on an external triggersignal:Start on Trigger to start recording; recording stops whenthe deep memory is fullStop on Trigger to stop recording.Run When Triggered to continue recording as long as anext trigger comes within 1 division in view all mode.To set up the test tool, continue from step 3 of theprevious section:
4 Apply the signal to be recorded to the red BNCinput A. Apply a trigger signal to the red andblack external trigger banana inputs. (SeeFigure 19.)
5 Open the Recorder Optionsmenu.
Figure 19. Scope Record Using External Triggering
6 Jump to Display Glitches:.
7 Jump to Mode:.
8 Select on EXT. ... to open theSingle Sweep on Ext. menu.
9 Select one of the Conditions:and jump to Slope:.

Fluke 196C/199CUsers Manual
36
10 Select the desired trigger slope,and jump to Level:
11 Select the 0.12V or 1.2 V triggerlevel and accept all recorderoptions.
During recording samples are continuously saved in deepmemory. The last nine recorded divisions are displayedon the screen. Use View All to display the full memorycontents.
Note
To learn more about the Single Shot triggerfunction, see Chapter 5 “Triggering onWaveforms”.
Figure 20. Triggered Single Sweep Recording
Analyzing a TrendPlot or Scope RecordFrom a Scope TrendPlot or Scope Record you can usethe analysis functions CURSORS and ZOOM to performdetailed waveform analysis. These functions aredescribed in Chapter 4: “Using Replay, Zoom andCursors”.

37
Chapter 4Using Replay, Zoom and Cursors
About this ChapterThis chapter covers the capabilities of the analysisfunctions Cursor, Zoom, and Replay. These functionscan be used with one or more of the primary functionsScope, TrendPlot or Scope Record.
It is possible to combine two or three analysis functions.A typical application using these functions follows:
• First replay the last screens to find the screen ofspecial interest.
• Then zoom in on the signal event.
• Finally, make measurements using the cursors.
Replaying the 100 Most Recent ScopeScreensWhen you are in scope mode, the test tool automaticallystores the 100 most recent screens. When you press theHOLD key or the REPLAY key, the memory contents arefrozen. Use the functions in the REPLAY menu to “go backin time” by stepping through the stored screens to find thescreen of your interest. This feature lets you capture andview signals even if you did not press HOLD.

Fluke 196C/199CUsers Manual
38
Replaying Step-by-StepTo step through the last scope screens, do the following:
1 From scope mode, open theREPLAY menu.
Observe that the trace is frozenand that REPLAY appears at thetop of the screen (see Figure 21).
2 Step through the previousscreens.
3 Step through the next screens.
Observe that the bottom of the waveform area displaysthe replay bar with a screen number and related timestamp:
Figure 21. Replaying a Waveform
The replay bar represents all 100 stored screens inmemory. The icon represents the picture beingdisplayed on the screen (in this example: SCREEN -84). Ifthe bar is partly white, the memory is not completely filledwith 100 screens.
From this point you can use the zoom and cursorfunctions to study the signal in more detail.
Using Replay, Zoom and CursorsReplaying the 100 Most Recent Scope Screens 4
39
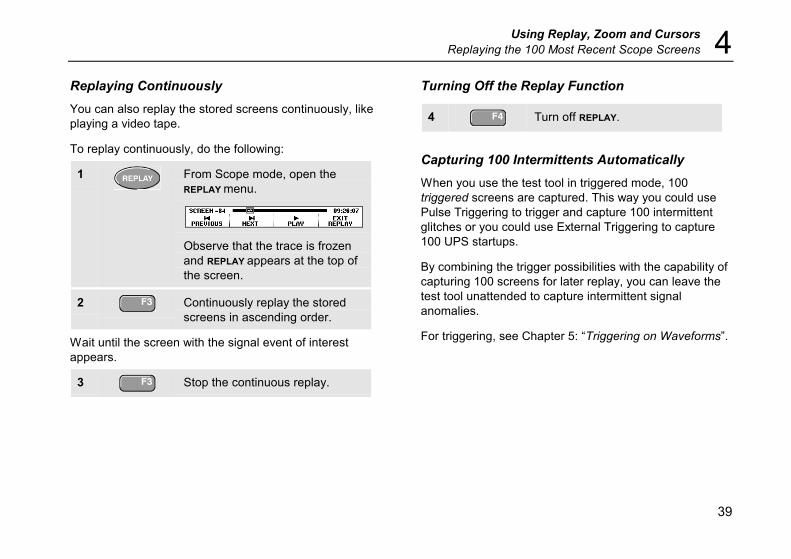
Replaying ContinuouslyYou can also replay the stored screens continuously, likeplaying a video tape.
To replay continuously, do the following:
1 From Scope mode, open theREPLAY menu.
Observe that the trace is frozenand REPLAY appears at the top ofthe screen.
2 Continuously replay the storedscreens in ascending order.
Wait until the screen with the signal event of interestappears.
3 Stop the continuous replay.
Turning Off the Replay Function
4 Turn off REPLAY.
Capturing 100 Intermittents AutomaticallyWhen you use the test tool in triggered mode, 100triggered screens are captured. This way you could usePulse Triggering to trigger and capture 100 intermittentglitches or you could use External Triggering to capture100 UPS startups.
By combining the trigger possibilities with the capability ofcapturing 100 screens for later replay, you can leave thetest tool unattended to capture intermittent signalanomalies.
For triggering, see Chapter 5: “Triggering on Waveforms”.

Fluke 196C/199CUsers Manual
40
Zooming in on a WaveformTo obtain a more detailed view of a waveform, you canzoom in on a waveform using the ZOOM function.
To zoom in on a waveform, do the following:
1 Display the ZOOM key labels.
Observe that the trace is frozen,HOLD appears at the top of thescreen, and the waveform ismagnified.
2 Enlarge (decrease the time/div)or shrink (increase the time/div)the waveform.
3 Scroll. A position bar displays theposition of the zoomed part inrelation to the total waveform.
TipEven when the key labels are not displayed atthe bottom of the screen, you can still use thearrow keys to zoom in and out.
Figure 22. Zooming in a Waveform
Observe that the bottom of the waveform area displaysthe zoom ratio, position bar, and time/div (see Figure 22).The zoom range depends on the amount of data samplesstored in memory.
From this point you can use the cursor function for furthermeasurements on the waveform.

Using Replay, Zoom and CursorsZooming in on a Waveform 4
41
Displaying the Zoomed WaveformThe VIEW ALL feature is useful when you quickly need tosee the complete waveform and then return to thezoomed part.
4 Display the complete waveform.
Press repeatedly to toggle between the zoomed partof the waveform and the complete waveform.
Turning Off the Zoom Function
5 Turn off the ZOOM function.

Fluke 196C/199CUsers Manual
42
Making Cursor MeasurementsCursors allow you to make precise digital measurementson waveforms. This can be done on live waveforms,recorded waveforms, and on saved waveforms.
Using Horizontal Cursors on a WaveformTo use the cursors for a voltage measurement, do thefollowing:
1 From scope mode, display thecursor key labels.
2 Press to highlight . Observethat two horizontal cursors aredisplayed.
3 Highlight the upper cursor.
4 Move the upper cursor to thedesired position on the screen.
5 Highlight the lower cursor.
6 Move the lower cursor to thedesired position on the screen.
NoteEven when the key labels are not displayed atthe bottom of the screen, you still can use thearrow keys. This allows full control of bothcursors while having full screen view.
Figure 23. Voltage Measurement with Cursors
The screen shows the voltage difference between the twocursors and the voltage at the cursors. (See Figure 23.)
Use horizontal cursors to measure the amplitude, high orlow value, or overshoot of a waveform.

Using Replay, Zoom and CursorsMaking Cursor Measurements 4
43
Using Vertical Cursors on a WaveformTo use the cursors for a time measurement, do thefollowing:
1 From scope mode, display thecursor key labels.
2 Press to highlight . Observethat two vertical cursors aredisplayed. Markers (—) identifythe point where the cursors crossthe waveform.
3 If necessary, choose the trace:TRACE A ,B, or M (Mathematics).
4 Highlight the left cursor.
5 Move the left cursor to thedesired position on the waveform.
6 Highlight the right cursor.
Figure 24. Time Measurement with Cursors
7 Move the right cursor to thedesired position on the waveform.
The screen shows the time difference between thecursors and the voltage difference between the twomarkers. (See Figure 24.)
8 Turn off the cursors.

Fluke 196C/199CUsers Manual
44
Using Cursors on a A+B, A-B or A*B WaveformCursor measurements on a A*B waveform give a readingin Watts if input A measures (milli)Volts and input Bmeasures (milli)Amperes.
For other cursor measurements on a A+B, A-B or A*Bwaveform no reading will be available if the input A andinput B measurement unit are different.
Making Rise Time MeasurementsTo measure rise time, do the following:
1 From scope mode, display thecursor key labels.
2 Press to highlight (rise time).Observe that two horizontalcursors are displayed.
3 If only one trace is displayed,select MANUAL or AUTO (thisautomatically does steps 4 to 6).For multiple traces select therequired trace A, B, or M (if amath function is active).
4 Move the upper cursor to 100%of the trace height. A marker isshown at 90%.
5 Highlight the other cursor.
6 Move the lower cursor to 0% ofthe trace height. A marker isshown at 10%.
The reading shows the risetime from 10%-90% of thetrace amplitude.
Figure 25. Risetime Measurement

45
Chapter 5Triggering on Waveforms
About this ChapterThis chapter provides an introduction to the triggerfunctions of the test tool. Triggering tells the test tool whento begin displaying the waveform. You can use fullyautomatic triggering, take control of one or more maintrigger functions (semi-automatic triggering), or you canuse dedicated trigger functions to capture specialwaveforms.Following are some typical trigger applications:
• Use the Connect-and-View™ function to have fullautomatic triggering and instant display of virtuallyany waveform.
• If the signal is unstable or has a very low frequency,you can control the trigger level, slope, and triggerdelay for a better view of the signal. (See nextsection.)
• For dedicated applications, use one of the fourmanual trigger functions:• Edge triggering• External triggering• Video triggering• Pulse Width triggering

Fluke 196C/199CUsers Manual
46
Setting Trigger Level and SlopeThe Connect-and-View™ function enables hands-offtriggering to display complex unknown signals.
When your test tool is in manual range, do the following:
Perform an auto set. AUTO appearsat the top right of the screen.
Automatic triggering assures a stable display of virtuallyany signal.
From this point, you can take over the basic triggercontrols such as level, slope and delay. To optimizetrigger level and slope manually, do the following:
1 Display the TRIGGER key labels.
2 Trigger on either positive slope ornegative slope of the chosenwaveform.
3 Enable the arrow keys for manualtrigger level adjustment.
Figure 26. Screen with all Trigger Information
4 Adjust the trigger level.
Observe the trigger icon that indicates the triggerposition, trigger level, and slope.
At the bottom of the screen the trigger parameters aredisplayed. (See Figure 26.) For example, means that input A is used as the trigger source with apositive slope.
When no trigger is found, the trigger parameters appear ingray.

Triggering on WaveformsUsing Trigger Delay or Pre-trigger 5
47
Using Trigger Delay or Pre-triggerYou can begin to display the waveform some time beforeor after the trigger point has been detected. Initially, youhave 2 divisions of pre-trigger view (negative delay).
To set the trigger delay, do the following:
5 Hold down to adjust the triggerdelay.
Observe that the trigger icon on the screen moves toshow the new trigger position. When the trigger positionmoves left off of the screen, the trigger icon changes into
to indicate that you have selected a trigger delay.Moving the trigger icon to the right on the display givesyou a pre-trigger view.
In case of a trigger delay, the status at the bottom of thescreen will change. For example:
This means that input A is used as the trigger source witha positive slope. The 500.0 ms indicates the (positive)delay between trigger point and waveform display.
When no trigger is found, the trigger parameters appear ingray.
Figure 27. Trigger Delay or Pre-trigger View
Figure 27 shows an example of a trigger delay of 500 ms(top) and an example of pre-trigger view of 8 divisions(bottom).

Fluke 196C/199CUsers Manual
48
Automatic Trigger OptionsIn the trigger menu, settings for automatic triggering canbe changed as follows. (See also Chapter 1: “Displayingan Unknown Signal with Connect-and-View”)
1 Display the TRIGGER key labels.
Note
The TRIGGER key labels can differ depending onthe latest trigger function used.
2 Open the Trigger Options menu.
3 Open the Automatic Triggermenu.
If the frequency range of the automatic triggering is set to> 15 Hz, the Connect-and-View™ function responds morequickly. The response is quicker because the test tool isinstructed not to analyze low frequency signalcomponents. However, when you measure frequencieslower than 15 Hz, the test tool must be instructed toanalyze low frequency components for automatictriggering:
4 Select > 1 HZ and return to themeasurement screen.

Triggering on WaveformsTriggering on Edges 5
49
Triggering on EdgesIf the signal is instable or has a very low frequency, useedge triggering to obtain full manual trigger control.
To trigger on rising edges of the input A waveform, do thefollowing:
1 Display the TRIGGER key labels.
2 Open the Trigger Options menu.
3 Open the Trigger on Edge menu.
When Free Run is selected, the test tool updates thescreen even if there are no triggers. A trace alwaysappears on the screen.
When On Trigger is selected, the test tool needs a triggerto display a waveform. Use this mode if you want toupdate the screen only when valid triggers occur.
When Single Shot is selected, the test tool waits for atrigger. After receiving a trigger, the waveform is displayedand the instruments is set to HOLD.
In most cases it is advised to use the Free Run mode:
4 Select Free Run, jump to Noisereject Filter.
5 Set Noise reject Filter to Off.
Observe that the key labels at the bottom of the screenhave adapted to allow further selection of specific edgetrigger settings:

Fluke 196C/199CUsers Manual
50
Triggering on Noisy WaveformsTo reduce jitter on the screen when triggering on noisywaveforms, you can use a noise rejection filter. Continuefrom step 3 of the previous example as follows:
4 Select On Trigger, jump to Noisereject Filter.
5 Set Noise reject Filter to On.
Observe that the trigger gap has increased. This isindicated by a taller trigger icon .
Making a Single AcquisitionTo catch single events, you can perform a single shotacquisition (one-time screen update). To set up the testtool for a single shot of the input A waveform, continuefrom step 3 again:
4 Select Single Shot.
5 Accept the settings.
The word WAITING appears at the top of the screenindicating that the test tool is waiting for a trigger. As soonas the test tool receives a trigger, the waveform isdisplayed and the instrument is set to hold. This isindicated by the word HOLD at top of the screen.

Triggering on WaveformsTriggering on Edges 5
51
The test tool will now have a screen like Figure 28.
6 Arm the test tool for a new singleshot.
TipThe test tool stores all single shots in the replaymemory. Use the Replay function to look at allthe stored single shots.
Figure 28. Making a Single Shot Measurement

Fluke 196C/199CUsers Manual
52
Triggering on External WaveformsUse external triggering when you want to displaywaveforms on inputs A and B while triggering on a thirdsignal. You can choose external triggering with automatictriggering or with edge triggering.
1 Supply a signal to the red and black 4-mmbanana jack inputs. See Figure 29.
In this example you continue from the Trigger on Edgesexample. To choose the external signal as trigger source,continue as follows:
2 Display the TRIGGER (On Edges)key labels.
3 Select Ext (external) edge trigger.
Observe that the key labels at the bottom of the screenhave been adapted to allow selection of two differentexternal trigger levels: 0.12 V and 1.2 V:
Figure 29. External Triggering
4 Select 1.2V under the Ext LEVELlabel.
From this point the trigger level is fixed and is compatiblewith logic signals.

Triggering on WaveformsTriggering on Video Signals 5
53
Triggering on Video Signals
To trigger on a video signal, first select the standard of thevideo signal you are going to measure:
1 Apply a video signal to the red input A.
2 Display the TRIGGER key labels.
3 Open the Trigger Options menu.
4 Select Video on A to open theTrigger on Video menu.
5 Select positive signal polarity forvideo signals with negative goingsync pulses.
Figure 30. Measuring Interlaced Video Signals
6 Select the video standard andreturn.
Trigger level and slope are now fixed.Observe that the key labels at the bottom of the screenhave been changed to allow further selection of specificvideo trigger settings:

Fluke 196C/199CUsers Manual
54
Triggering on Video FramesUse FIELD 1 or FIELD 2 to trigger either on the first halfof the frame (odd) or on the second half of the frame(even).
To trigger on the second half of the frame, do thefollowing:
7 Choose FIELD 2.
The signal part of the even field is displayed on thescreen.
Triggering on Video LinesUse ALL LINES to trigger on all line synchronization pulses(horizontal synchronization).
7 Choose ALL LINES.
The signal of one line is displayed on the screen. Thescreen is updated with the signal of the next lineimmediately after the test tool triggers on the horizontalsynchronization pulse.
To view a specific video line in more detail, you can selectthe line number. For example, to measure on video line123, continue from step 6 as follows:
7 Enable video line selection.
8 Select number 123.
The signal of line 123 is displayed on the screen. Observethat the status line now also shows the selected linenumber. The screen is continuously updated with thesignal of line 123.

Triggering on WaveformsTriggering on Pulses 5
55
Triggering on PulsesUse pulse width triggering to isolate and display specificpulses that you can qualify by time, such as glitches,missing pulses, bursts or signal dropouts.
Detecting Narrow PulsesTo set the test tool to trigger on narrow positive pulsesshorter than 5 ms, do the following:
1 Apply a video signal to the red input A.
2 Display the TRIGGER key labels.
3 Open the Trigger Options menu.
4 Select Pulse Width on A... toopen the Trigger on Pulse Widthmenu.
5 Select the positive pulse icon,then jump to Condition.
6 Select <t, then jump to Update.
7 Select On Trigger.
The test tool is now prepared to trigger on narrow pulsesonly. Observe that the trigger key labels at the bottom ofthe screen have been adapted to set the pulse conditions:

Fluke 196C/199CUsers Manual
56
To set the pulse width to 5 ms, do the following:
7 Enable the arrow keys to adjustthe pulse width.
8 Select 5 ms.
All narrow positive pulses shorter than 5 ms are nowdisplayed on the screen. (See Figure 31.)
TipThe test tool stores all triggered screens in thereplay memory. For example, if you setup yourtriggering for glitches, you can capture 100glitches with time stamps. Use the REPLAY key tolook at all the stored glitches.
Figure 31. Triggering on Narrow Glitches

Triggering on WaveformsTriggering on Pulses 5
57
Finding Missing PulsesThe next example covers finding missing pulses in a trainof positive pulses. In this example it is assumed that thepulses have a 100 ms distance between the rising edges.If the time accidently increases to 200 ms, a pulse ismissing. To set the test tool to trigger on such missingpulses, let it trigger on gaps bigger than about 150 ms.Do the following:
1 Display the TRIGGER key labels.
2 Open the Trigger Options menu.
3 Select Pulse Width on A... toopen the Trigger on Pulse Widthmenu.
4 Select the positive pulse icon totrigger on the gap between thepositive pulses, then jump toCondition.
5 Select >t, then jump to Update.
6 Select On Trigger.
The test tool is now prepared to trigger on pulse gaps.Observe that the trigger menu at the bottom of the screenhas been adapted to set the pulse condition:

Fluke 196C/199CUsers Manual
58
To set the pulse width to 150 ms, continue as follows:
7 Enable the arrow keys to adjustthe pulse width.
8 Select 150 ms.
Figure 32. Triggering on Missing Pulses

59
Chapter 6Using Memory, PC and Printer
About this ChapterThis chapter provides a step-by-step introduction to thegeneral functions of the test tool that can be used in thethree main modes: Scope, Meter, or Recorder. You willfind information on printer and computer communicationat the end of this chapter.
Saving and RecallingYou can:• Save screens and setups to memory, and recall them
again from memory. The test tool has 10 screen andsetup memories and 2 record and setup memories.
• Recall screens and recordings to analyze or print thescreen image at a later date.
• Recall a setup to continue a measurement with therecalled operating configuration.

Fluke 196C/199CUsers Manual
60
Saving Screens with Associated SetupsTo save a screen in memory location 10, do the following:
1 Display the SAVE/PRINT key labels.
From this point the screen is frozen until you hide theSAVE/PRINT key labels again.
2 Open the Save menu.
Observe that free memorylocations are indicated by an opensquare (). Filled memorylocations are indicated by a solidsquare ().
3 Highlight SCREEN+SETUP location 10.
4 Save the actual screen.
Note
The two record+setup memory locations storemore than what is just visible on the screen.In TrendPlot or scope record mode the fullrecording is saved. In scope mode you can saveall 100 replay screens in a single record+setupmemory location.

Using Memory, PC and PrinterSaving and Recalling 6
61
Deleting Screens with Associated SetupsTo delete all screens and associated setups, continuefrom step 2 of the previous example as follows:
3 Delete all saved screens andsetups.
To delete only one screen and setup, continue from step 2of the previous example as follows:
3 Highlight SCREEN+SETUP location 5.
4 Delete the saved screen+setup ofmemory location 5.
Recalling Screens with Associated SetupsTo recall screen+setup 1, do the following:
1 Display the SAVE/PRINT key labels.
2 Open the Recall menu.
3 Highlight SCREEN+SETUP location 1.
4 Use RECALL to recall the savedscreen.
Observe that the recalled waveform is displayed and thatHOLD appears on the screen. From this point you can usecursors and zoom for analysis or you can print therecalled screen.
To recall a sceen as a reference waveform to compare itwith an actually measured waveform, continue from step 3as follows:

Fluke 196C/199CUsers Manual
62
4 Use RECALL FOR REFERENCE torecall the saved screen.
5 Resume the measurement. Both,the reference screen and themeasurement screen will bedisplayed.
Recalling a Setup ConfigurationTo recall the setup configuration from memory 1, do thefollowing:
1 Display the SAVE/PRINT key labels.
2 Open the Recall menu.
3 Highlight SCREEN+SETUP location 1.
4 Use RECALL SETUP to recall thesaved setup.
Observe that RUN appears at the top right of the screen.From this point you continue in the new operatingconfiguration.

Using Memory, PC and PrinterDocumenting Screens 6
63
Viewing Stored ScreensTo scroll through the memories while looking at the storedscreens, do the following:
1 Display the SAVE/PRINT key labels.
2 Open the View... menu.
3 Highlight a screen location, andview the screen properties.
4 View the screen, and open theviewer.
5 Scroll through all stored screens.
Documenting ScreensWith the FlukeView® software you can upload waveformdata and screen bitmaps to your PC or notebookcomputer for further processing. Printing can also be doneby connecting the test tool directly to a printer.
Connecting to a ComputerTo connect the test tool to a PC or notebook computerand use the FlukeView software for Windows® (SW90W),do the following:
Use the Optically Isolated RS-232 Adapter/Cable(PM9080) to connect a computer to the OPTICALPORT of the test tool. (See Figure 33.)
Figure 33. Connecting a Computer

Fluke 196C/199CUsers Manual
64
Note
For information about installing and using theFlukeView ScopeMeter software, see theSW90W Users Manual.
A Software & Cable Carrying Case Kit is optionallyavailable as model number SCC190.
Connecting to a PrinterTo print a screen directly to a printer, use one of thefollowing adapters:
The Optically Isolated RS-232 Adapter/Cable(PM9080) to connect a serial printer to the OPTICALPORT of the test tool. (See Figure 34.)
The Print Adapter Cable (PAC91, optional) to connecta parallel printer to the OPTICAL PORT of the testtool. (See Figure 35.)
Before printing, you must setup the test tool for a specificprinter.
Figure 34. Connecting a Serial Printer
Figure 35. Connecting a Parallel Printer

Using Memory, PC and PrinterDocumenting Screens 6
65
Setting up the Printing ConfigurationThis example demonstrates how to set up the test tool forprinting on a postscript printer with a 9600 baud rate:
1 Display the USER OPTIONS keylabels.
2 Open the User Options menu.
3 Open the Printer Setup submenu.
4 Select Postscript and jump toBaud Rate.
5 Select a baud rate of 9600 andreturn to normal mode.
Whenever possible, choose the option Postscript whenprinting screens. This option gives the best printingresults. Consult the manual that came with your printer tofind out whether it has Postscript printing possibilities.
Printing a ScreenTo print the currently displayed screen, do the following:
1 Clear the menu if you do not wantto print it.
2 Display the SAVE/PRINT key labels.
3 Start printing.
A message appears at the bottom of the screen indicatingthat the test tool is busy printing.
Screens will be printed in black and white.

Fluke 196C/199CUsers Manual
66

67
Chapter 7Tips
About this ChapterThis chapter gives you information and tips on how youcan make the best use of the test tool.
Using the Standard AccessoriesThe following illustrations show the use of the standardaccessories such as voltage probes, test leads, and thevarious clips.

Fluke 196C/199CUsers Manual
68
Figure 36. Probing Using 2-mm Heavy DutyTest Probes
WarningTo avoid electrical shock or fire, do notconnect the ground spring to voltages higherthan 30 Vrms from earth ground.
Figure 37. HF Voltage Probe Connection UsingGround Spring
Figure 38. Heavy Duty Fixed Connections for ScopeMeasurements Using Industrial Alligator Clips
Figure 39. Electronic Connections for ScopeMeasurements Using Hook Clips and Hook Clip
Grounding

TipsUsing the Standard Accessories 7
69
Figure 40. Electronic Connections for ScopeMeasurements Using Hook Clips and Alligator Clip
Grounding
Figure 41. Fixed Electronic Connections for ScopeMeasurements with Fixed External Triggering
Figure 42. Manual Probing for Meter Measurementsusing 2-mm Test Probes
Figure 43. Heavy Duty Fixed Connections for MeterMeasurements Using Industrial Alligator Clips
Fluke 196C/199CUsers Manual
70
Using the Independently FloatingIsolated InputsYou can use the independently floating isolated inputs tomeasure signals that are independently floating from eachother.
Independently floating isolated inputs offer additionalsafety and measurement capabilities compared to inputswith common references or grounds.
Measuring Using Independently Floating IsolatedInputsThe test tool has independently floating isolated inputs.Each input section (A, B, External Trigger / DMM) has itsown signal input and its own reference input. Thereference input of each input section is electricallyisolated from the reference inputs of the other inputsections. The isolated input architecture makes the testtool about as versatile as having three independentinstruments. The advantages of having independentlyfloating isolated inputs are:
• It allows simultaneous measurement of independentlyfloating signals.
• Additional safety. Since the commons are not directlyconnected, the chance of causing short circuit whenmeasuring multiple signals is greatly reduced.
• Additional safety. When measuring in systems withmultiple grounds, the ground currents induced arekept to a minimum.
Because the references are not connected together insidethe test tool, each reference of the used inputs must beconnected to a reference voltage.
Independently floating isolated inputs are still coupled byparasitic capacitance. This can occur between the inputreferences and the environment, and between the inputreferences mutually (see Figure 44). For this reason, youshould connect the references to a system ground oranother stable voltage. If the reference of an input isconnected to a high speed and / or high voltage signal,you should be aware of parasitic capacitance.(See Figures 44, 45, 46 and 47.)

TipsUsing the Independently Floating Isolated Inputs 7
71
Figure 44. Parasitic capacitance between probes,instrument and environment
M
MOTION/MOTOR CONTROLLERDC BUS
DC BUS
DIGITALGROUND
+
-
Figure 45. Parasitic capacitance between analog anddigital reference
ANALOG INPUT DIGITAL CONTROLLER
ANALOGGROUND
DIGITALGROUND
Figure 46. Correct connection of reference leadsANALOG INPUT DIGITAL CONTROLLER
ANALOGGROUND
DIGITALGROUND
Figure 47. Wrong connection of reference leads
Noise that is picked up by reference lead B can betransmitted by parasitic capacitance to the analog inputamplifier.

Fluke 196C/199CUsers Manual
72
Using the Tilt StandThe test tool is equipped with a tilt stand, allowing viewingfrom an angle while placed on a table. From this positionyou can access the OPTICAL PORT at the side of the testtool. The typical position is shown in Figure 48.
Figure 48. Using the Tilt Stand
Resetting the Test ToolIf you want to reset the test tool to the factory settings, dothe following:
1 Turn the test tool off.
2 Press and hold.
3 Press and release.
The test tool turns on, and you should hear a doublebeep, indicating the reset was successful.
4 Release.
Suppressing Key Labels and Menu’sYou can hide a menu or key label at any time:
Hide any key label or menu.
To display menus or key labels, press one of the yellowmenu keys, e.g. the SCOPE key.

TipsChanging the Information Language 7
73
Changing the Information LanguageDuring operation of the test tool, messages may appear atthe bottom of the screen. You can select the language inwhich these messages are displayed. The combination ofselectable languages (one or more) depends on theversion ordered.
In this example you can select English or French . Tochange the language from English to French, do thefollowing:
1 Display the USER key labels.
2 Open the Language Selectmenu.
3 Highlight FRENCH.
4 Accept French as the language.
Adjusting the Contrast and BrightnessTo adjust the contrast and backlight brightness, do thefollowing:
1 Display the USER key labels.
2 Enable the arrow keys for manualcontrast and backlight adjustment.
3 Adjust the contrast of the screen.
4 Change the backlight.
NoteThe new contrast and brightness are stored untila new adjustment is made.
To save battery power, the test tool is in economicbrightness mode when operated on the battery. The highbrightness intensity increases when you connect thepower adapter.
NoteUsing dimmed light lengthens maximum batterypower operation by about one hour.

Fluke 196C/199CUsers Manual
74
Changing the Display ColorTo set the display to color or Black and White, do thefollowing:
1 Display the USER key labels.
2 Open the User Options menu.
3 Open Display Options menu.
4 Choose display mode Color orBlack and White, and accept it.
Changing Date and TimeThe test tool has a date and time clock. For example, tochange the date to 19 April, 2002, do the following:
1 Display the USER key labels.
2 Open the User Options menu.
3 Open Date Adjust menu.
4 Choose 2002, jump to Month.
5 Choose 04, jump to Day.
TipsSaving Battery Life 7
75
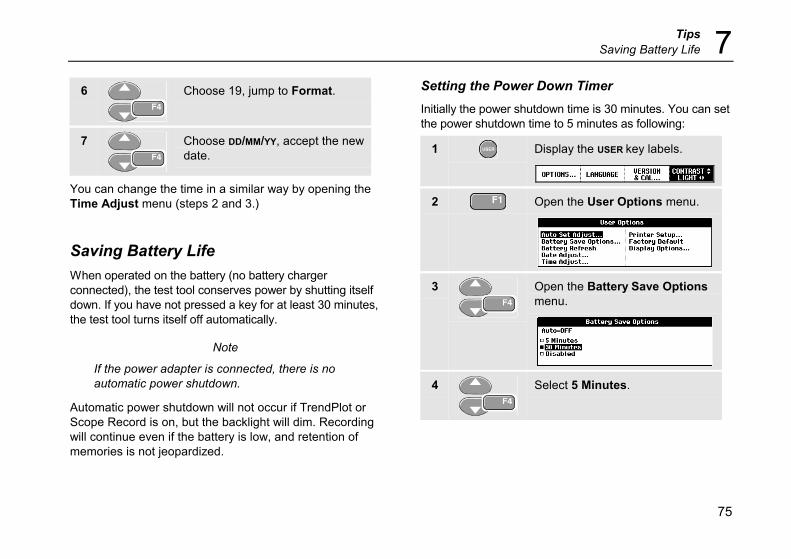
6 Choose 19, jump to Format.
7 Choose DD/MM/YY, accept the newdate.
You can change the time in a similar way by opening theTime Adjust menu (steps 2 and 3.)
Saving Battery LifeWhen operated on the battery (no battery chargerconnected), the test tool conserves power by shutting itselfdown. If you have not pressed a key for at least 30 minutes,the test tool turns itself off automatically.
Note
If the power adapter is connected, there is noautomatic power shutdown.
Automatic power shutdown will not occur if TrendPlot orScope Record is on, but the backlight will dim. Recordingwill continue even if the battery is low, and retention ofmemories is not jeopardized.
Setting the Power Down TimerInitially the power shutdown time is 30 minutes. You can setthe power shutdown time to 5 minutes as following:
1 Display the USER key labels.
2 Open the User Options menu.
3 Open the Battery Save Optionsmenu.
4 Select 5 Minutes.
Fluke 196C/199CUsers Manual
76
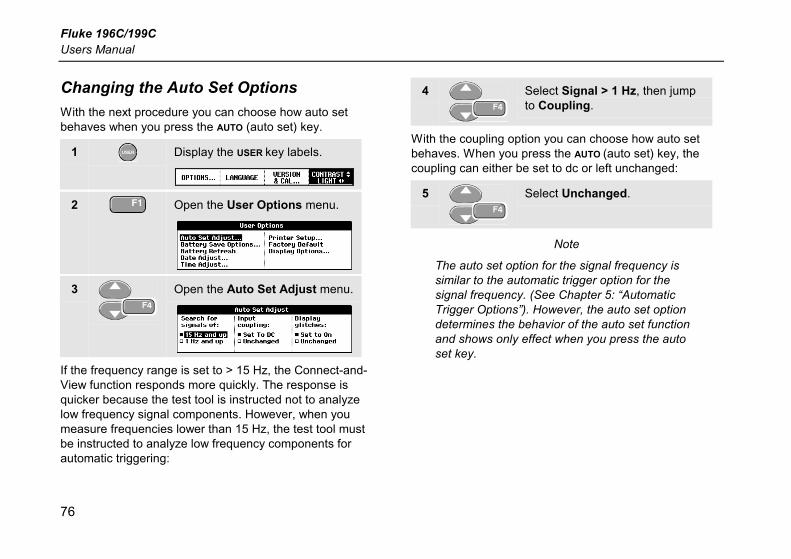
Changing the Auto Set OptionsWith the next procedure you can choose how auto setbehaves when you press the AUTO (auto set) key.
1 Display the USER key labels.
2 Open the User Options menu.
3 Open the Auto Set Adjust menu.
If the frequency range is set to > 15 Hz, the Connect-and-View function responds more quickly. The response isquicker because the test tool is instructed not to analyzelow frequency signal components. However, when youmeasure frequencies lower than 15 Hz, the test tool mustbe instructed to analyze low frequency components forautomatic triggering:
4 Select Signal > 1 Hz, then jumpto Coupling.
With the coupling option you can choose how auto setbehaves. When you press the AUTO (auto set) key, thecoupling can either be set to dc or left unchanged:
5 Select Unchanged.
Note
The auto set option for the signal frequency issimilar to the automatic trigger option for thesignal frequency. (See Chapter 5: “AutomaticTrigger Options”). However, the auto set optiondetermines the behavior of the auto set functionand shows only effect when you press the autoset key.

77
Chapter 8Maintaining the Test Tool
About this ChapterThis chapter covers basic maintenance procedures thatcan be performed by the user. For complete service,disassembly, repair, and calibration information, see theService Manual. You will find the part number of theService Manual in the section “Parts and Accessories” inthis chapter.
Cleaning the Test ToolClean the test tool with a damp cloth and a mild soap. Donot use abrasives, solvents, or alcohol. These maydamage the text on the test tool.
Storing the Test ToolIf you are storing the test tool for an extended period oftime, charge the NiMH (Nickel-Metal Hydride) batteriesbefore storing.

Fluke 196C/199CUsers Manual
78
Charging the BatteriesAt delivery, the NiMH batteries may be empty and must becharged for 4 hours (with the test tool turned off) to reachfull charge. When fully charged, the batteries provide4 hours of use.
When battery power is used, the battery indicator at thetop of the screen informs you about the condition of thebatteries. The battery symbols are: . Thesymbol indicates that there are typically five minutesof operating time left.
To charge the batteries and power the instrument, connectthe battery charger as shown in Figure 49. To charge thebatteries more quickly, turn off the test tool.
Caution
To avoid overheating of the batteries duringcharging, do not exceed the allowableambient temperature given in thespecifications.
Note
No damage will occur if the charger is connectedfor long periods, e.g., during the weekend. Theinstrument then automatically switches to tricklecharging.
Figure 49. Charging the Batteries

Maintaining the Test ToolExtending Battery Operation Time 8
79
Extending Battery Operation TimeTypically, NiMH batteries always meet the specifiedoperating time. However, if the batteries have beenextremely discharged (for example, when empty batterieswere stored for a long period) it is possible that the batterycondition has deteriorated.
To keep the batteries in optimal condition, observe thefollowing guidelines:
• Operate the test tool on batteries until the symbolappears at the bottom of the screen. This indicatesthat the battery level is low and that the NiMHbatteries need to be recharged.
• To obtain optimal battery condition again, you canrefresh the batteries. During a battery refresh, thebatteries will be fully discharged and charged again.A complete refresh cycle takes about 12 hours andshould be done about four times a year. You can checkthe latest battery refresh date. See section “DisplayingCalibration Information”.
To refresh the battery, make sure that the test tool is linepowered and proceed as follows:
1 Display the USER key labels.
2 Open the User Options menu.
A message appears asking whether you want to start therefresh cycle now.
3 Start the refresh cycle.
Do not disconnect the battery charger during therefresh cycle. This will interrupt the refresh cycle.
Note
After starting the refresh cycle, the screen will beblack.

Fluke 196C/199CUsers Manual
80
Replacing the NiMH Battery Pack BP190Usually it should not be necessary to replace the batterypack. However, if replacement is needed, this should bedone by qualified personnel only. Contact your nearestFluke center for more information.
Calibrating the Voltage ProbesTo meet full user specifications, you need to adjust thered and gray voltage probes for optimal response. Thecalibration consists of a high frequency adjustment and adc calibration for 10:1 probes. The dc calibration is notpossible for 100:1 probes.
This example shows how to calibrate the 10:1 voltageprobes:
1 Display the input A key labels.
2 Open the Probe on A menu.
3 Select Voltage, then jump toAttenuation.
Figure 50. Adjusting Voltage Probes
If the 10:1 option is already selected, proceed with step 5.
4 Select 10:1, then return.

Maintaining the Test ToolCalibrating the Voltage Probes 8
81
Repeat steps 2 and 3 and proceed as follows:
5 Select Probe Cal with the arrowkeys, then accept.
A message appears asking you whether to start the 10:1probe calibration.
6 Start the probe calibration.
A message appears telling you how to connect the probe.Connect the red 10:1 voltage probe from the red input Ajack to the red banana jack. Connect the reference lead tothe black banana jack. (See Figure 50.)
7 Adjust the trimmer screw in theprobe housing until a pure squarewave is displayed.
8 Continue with DC calibration.Automatic DC calibration is onlypossible for 10:1 voltage probes.
The test tool automatically calibrates itself to the probe.During calibration you should not touch the probe. Amessage indicates when the DC calibration hascompleted successfully.
9 Return.
Repeat the procedure for the gray 10:1 voltage probe.Connect the grey 10:1 voltage probe from the grey input Bjack to the red banana jack. Connect the reference lead tothe black banana jack.
Note
When using 100:1 voltage probes, choose 100:1attenuation to perform a HF adjustment.Automatic dc calibration is not possible with thisprobe type.

Fluke 196C/199CUsers Manual
82
Displaying Calibration InformationYou can display version number and calibration date:
1 Display the USER key labels.
2 Open the Version & Calibrationmenu.
The screen gives you information about the modelnumber with software version, the calibration number withlatest calibration date, and the latest battery refresh date.
3 Return.
Recalibration must be carried out by qualified personnel.Contact your local Fluke representative for recalibration.
Parts and AccessoriesStandard AccessoriesThe following tables list the user-replaceable parts for thevarious test tool models. For additional optionalaccessories, see the ScopeMeter Accessories booklet.
To order replacement parts or additional accessories,contact your nearest service center.

Maintaining the Test ToolParts and Accessories 8
83
Table 1. Standard Accessories
Item Ordering CodeBattery Charger, available models:
Universal Europe 230 V, 50 and 60 HzNorth America 120 V, 50 and 60 HzUnited Kingdom 240 V, 50 and 60 HzJapan 100 V, 50 and 60 HzAustralia 240 V, 50 and 60 HzUniversal 115 V/230 V, 50 and 60 Hz ** The 230V rating of the BC190/808 is not for use in North America.
A line plug adapter complying with the applicable NationalRequirements may be provided to alter the blade configurations fora specific country. The universal adapter is standard equipped witha North American line cord.
BC190/801BC190/803BC190/804BC190/806BC190/807BC190/808
Voltage Probe Set (Red), designed for use with the Fluke ScopeMeter190 series test tool.
The set includes the following items (not available separately):• 10:1 Voltage Probe (red)• 4-mm Test Probe for Probe Tip (red)• Hook Clip for Probe Tip (red)• Ground Lead with Hook Clip (red)• Ground Lead with Mini Alligator Clip (black)• Ground Spring for Probe Tip (black)
VPS200-R

Fluke 196C/199CUsers Manual
84
Item Ordering CodeVoltage Probe Set (Gray), designed for use with the Fluke ScopeMeter190 series test tool.
The set includes the following items (not available separately):• 10:1 Voltage Probe (gray)• 4-mm Test Probe for Probe Tip (gray)• Hook Clip for Probe Tip (gray)• Ground Lead with Hook Clip (gray)• Ground Lead with Mini Alligator Clip (black)
VPS200-G
Flexible Test Leads (red and black) TL24 (General Purpose Leads)
Accessory Set (Red)The set includes the following items (not available separately):• Industrial Alligator for Probe Tip (red)• 2-mm Test Probe for Probe Tip (red)• Industrial Alligator for Banana Jack (red)• 2-mm Test Probe for Banana Jack (red)• Ground Lead with 4-mm Banana Jack (black)
AS200-R
Accessory Set (Gray)The set includes the following items (not available separately):• Industrial Alligator for Probe Tip (gray)• 2-mm Test Probe for Probe Tip (gray)• Industrial Alligator for Banana Jack (gray)• 2-mm Test Probe for Banana Jack (gray)• Ground Lead with 4-mm Banana Jack (black)
AS200-G

Maintaining the Test ToolParts and Accessories 8
85
Item Ordering CodeReplacement Set for Voltage Probe
The set includes the following items (not available separately):• 2x 4-mm Test Probe for Probe Tip (red and gray)• 3x Hook Clip for Probe Tip (2 red, 1 gray)• 2x Ground Lead with Hook Clip (red and gray)• 2x Ground Lead with Mini Alligator Clip (black)• 5x Ground Spring for Probe Tip (black)
RS200
Table 2. Users Manuals
Item Ordering CodeGetting Started Manual (English)Getting Started Manual (German)Getting Started Manual (French)Getting Started Manual (Spanish)Getting Started Manual (Portuguese)Getting Started Manual (Italian)Getting Started Manual (Chinese)Getting Started Manual (Japanese)Getting Started Manual (Korean)CD ROM with User Manual (all languages)
4822 872 304714822 872 304724822 872 304734822 872 304744822 872 304754822 872 304764822 872 304774822 872 304784822 872 304794022 240 12371

Fluke 196C/199CUsers Manual
86
Optional Accessories
Item Ordering CodeSoftware & Cable Carrying Case Kit
Set contains the following parts:Optically Isolated RS-232 Adapter/CableHard Carrying CaseFlukeView® ScopeMeter® Software for Windows 95® , 98® , Me® , 2000® and NT4®
SCC190
PM9080C190
SW90W
Optically Isolated RS-232 Adapter/Cable PM9080Hard Case C190Soft Case C195Current Shunt 4-20 mA CS20MAPrint Adapter Cable for Parallel Printers PAC91
Optional Service ManualItem Ordering CodeService Manual (English) 4822 872 05384

Maintaining the Test ToolTroubleshooting 8
87
TroubleshootingThe Test Tool Does Not Start Up• The batteries may be completely empty. In this case
the test tool will not start up, even if it is powered bythe battery charger. Charge the batteries first: powerthe test tool with the battery charger without turning iton. Wait about 15 minutes and try turning on the testtool again.
The Test Tool Shuts Down After A Few Seconds• The batteries may be empty. Check the battery
symbol at the top right of the screen. A symbolindicates that the batteries are empty and must becharged.
The Screen Remains Black• Make sure that the test tool is on.
• You might have a problem with the screen contrast.
Press , then press . Now you can usethe arrow keys to adjust the contrast.
The Operation Time Of Fully Charged Batteries IsToo Short• The batteries may be in poor condition. Refresh the
batteries to optimize the condition of the batteriesagain. It is advised to refresh the batteries about fourtimes a year.
The Printer Does Not Print• Make sure that the interface cable is properly
connected between the test tool and the printer.
• Make sure that you have selected the correct printertype. (See Chapter 6.)
• Make sure that the baud rate matches with theprinter. If not, select another baud rate.(See Chapter 6.)
• If you are using the PAC91 (Print Adapter Cable),make sure that it is turned on.

Fluke 196C/199CUsers Manual
88
FlukeView Does Not Recognize The Test Tool• Make sure that the test tool is turned on.
• Make sure that the interface cable is properlyconnected between the test tool and the PC.
• Make sure that the correct COM port has beenselected in FlukeView. If not, change the COM portsetting or connect the interface cable to another COMport.
Battery Operated Fluke Accessories Do NotFunction• When using battery operated Fluke accessories,
always first check the battery condition of theaccessory with a Fluke multimeter.

89
Chapter 9Specifications
IntroductionPerformance CharacteristicsFLUKE guarantees the properties expressed in numericalvalues with the stated tolerance. Specified non-tolerancenumerical values indicate those that could be nominallyexpected from the mean of a range of identicalScopeMeter test tools.
Environmental DataThe environmental data mentioned in this manual arebased on the results of the manufacturer’s verificationprocedures.
Safety CharacteristicsThe test tool has been designed and tested in accordancewith Standards ANSI/ISA S82.01-1994, EN 61010.1(1993) (IEC 1010-1), CAN/CSA-C22.2 No.1010.1-92(including approval), UL3111-1 (including approval) SafetyRequirements for Electrical Equipment for Measurement,Control, and Laboratory Use.This manual contains information and warnings that mustbe followed by the user to ensure safe operation and tokeep the instrument in a safe condition. Use of thisequipment in a manner not specified by the manufacturermay impair protection provided by the equipment.

Fluke 196C/199CUsers Manual
90
Dual Input OscilloscopeIsolated Inputs A and B (Vertical)Bandwidth, DC Coupled
FLUKE 199C....................................... 200 MHz (-3 dB)FLUKE 196C....................................... 100 MHz (-3 dB)
Lower Frequency Limit, AC Coupledwith 10:1 probe......................................... <2 Hz (-3 dB)direct (1:1) ................................................ <5 Hz (-3 dB)
Rise TimeFLUKE 199C........................................................1.7 nsFLUKE 196C........................................................3.5 ns
Analog Bandwidth Limiters ............... 20 MHz and 10 kHzInput Coupling.......................................................AC, DCPolarity ................................................... Normal, InvertedSensitivity Ranges
with 10:1 probe.............................. 50 mV to 1000 V/divdirect (1:1) ......................................... 5 mV to 100 V/div
Trace Positioning Range................................±4 divisionsInput Impedance on BNC
DC Coupled........................1 MΩ (±1 %)//15 pF (±2 pF)
Max. Input Voltagewith 10:1 probe.........................................600 V CAT III
1000 V CAT IIdirect (1:1) ................................................300 V CAT III(For detailed specifications, see “Safety”)
Vertical Accuracy .....................±(1.5 % + 0.04 range/div)Digitizer Resolution .................... 8 bits, separate digitizer
for each input
HorizontalMaximum Time Base Speed:
FLUKE 199C .....................................................5 ns/divFLUKE 196C .....................................................5 ns/div
Minimum Time Base Speed (Scope Record) .....2 min/divReal Time Sampling Rate (for both inputs simultaneously)
FLUKE199C:5 ns to 2 µs /div ................................... up to 2.5 GS/s5 µs to 120 s/div ............................................ 20 MS/s
FLUKE 196C:5 ns to 2 µs /div ...................................... up to 1 GS/s5 µs to 120 s/div ............................................ 20 MS/s

SpecificationsDual Input Oscilloscope 9
91
Record LengthScope Record Mode........... 27500 points on each inputScope Normal Mode............. 1000 points on each inputScope Glitch Capture Mode ... 500 points on each input
Glitch Detection5 µs to 120 s/div ........ displays glitches as fast as 50 ns
Waveform Display................ A, B, A+B, A-B, A*B, A vs BNormal, Average (2,4,8,64 x), Persistence
Time Base Accuracy .........................................±100 ppm
Trigger and DelayTrigger Modes ....................................... Automatic, Edge,
External, Video, Pulse WidthTrigger Delay.................................. up to +1000 divisionsPre Trigger View ............................ one full screen lengthMax. Delay ..................................................... 10 seconds
Automatic Connect-and-View TriggerSource...............................................................A, B, EXTSlope....................................................Positive, Negative
Edge TriggerScreen Update ........... Free Run, On Trigger, Single ShotSource...............................................................A, B, EXTSlope....................................................Positive, Negative
Trigger Level Control Range ......................... ±4 divisionsTrigger Sensitivity A and B
DC to 5 MHz at >5 mV/div ......................... 0.5 divisionsDC to 5 MHz at 5 mV/div ................................ 1 division200 MHz (FLUKE 199C)................................. 1 division250 MHz (FLUKE 199C)............................... 2 divisions100 MHz (FLUKE 196C)................................. 1 division150 MHz (FLUKE 196C)............................... 2 divisions
Isolated External TriggerBandwidth.............................................................. 10 kHzModes.....................................................Automatic, EdgeTrigger Levels (DC to 10 kHz) ................... 120 mV, 1.2 V
Video TriggerStandards ............................. PAL, PAL+, NTSC, SECAMModes......................Lines, Line Select, Field 1 or Field 2Source ............................................................................APolarity ................................................ Positive, NegativeSensitivity ...................................... 0.7 division sync level

Fluke 196C/199CUsers Manual
92
Pulse Width TriggerScreen Update ............................ On Trigger, Single ShotTrigger Conditions............<T, >T, =T (±10 %), ≠T(±10 %)Source............................................................................ APolarity .....................................Positive or negative pulsePulse Time Adjustment Range ......... 0.01 div. to 250 div.
with a minimum of 300 ns (<T, >T) or 500 ns (=T, ≠T),a maximum of 10 s,
and a resolution of 0.01 div. with a minimum of 50 ns
Continuous Auto SetAutoranging attenuators and time base, automaticConnect-and-View™ triggering with automatic sourceselection.Modes
Normal.................................... 15 Hz to max. bandwidthLow Frequency......................... 1 Hz to max. bandwidth
Minimum Amplitude A and BDC to 1 MHz........................................................ 10 mV1 MHz to max. bandwidth.................................... 20 mV
Automatic Capturing Scope ScreensCapacity ............................ 100 dual input scope ScreensFor viewing screens, see Replay function.
Automatic Scope MeasurementsThe accuracy of all readings is within ± (% of reading +number of counts) from 18 °C to 28 °C. Add 0.1x (specificaccuracy) for each °C below 18 °C or above 28 °C. Forvoltage measurements with 10:1 probe, add probeaccuracy unless the probe has been calibrated on the testtool. At least 1.5 waveform period must be visible on thescreen.
GeneralInputs .....................................................................A and BDC Common Mode Rejection (CMRR).................. >100 dBAC Common Mode Rejection at 50, 60, or 400 Hz....... >60 dB
DC Voltage (VDC)Maximum Voltage
with 10:1 probe..................................................... 1000 Vdirect (1:1) .............................................................. 300 V
Maximum Resolutionwith 10:1 probe........................................................ 1 mVdirect (1:1) ............................................................ 100 µV
Full Scale Reading .......................................... 1100 countsAccuracy at 5 s to 5 µs/div ................... ±(1.5 % +5 counts)Normal Mode AC Rejection at 50 or 60 Hz ............ >60 dB

SpecificationsAutomatic Scope Measurements 9
93
AC Voltage (VAC)Maximum Voltage
with 10:1 probe...................................................1000 Vdirect (1:1) ............................................................300 V
Maximum Resolutionwith 10:1 probe......................................................1 mVdirect (1:1) ..........................................................100 µV
Full Scale Reading....................................... 1100 countsAccuracy
DC coupled:DC to 60 Hz................................±(1.5 % +10 counts)
AC coupled, low frequencies:50 Hz direct (1:1) .......................±(2.1 % + 10 counts)60 Hz direct (1:1) .......................±(1.9 % + 10 counts)With the 10:1 probe the low frequency roll off point willbe lowered to 2 Hz, which improves the AC accuracyfor low frequencies. When possible use DC couplingfor maximum accuracy.
AC or DC coupled, high frequencies:60 Hz to 20 kHz.........................±(2.5 % + 15 counts)20 kHz to 1 MHz ...........................±(5 % + 20 counts)1 MHz to 25 MHz........................±(10 % + 20 counts)For higher frequencies the instrument’s frequency rolloff starts affecting accuracy.Normal Mode DC Rejection.............................>50 dB
All accuracies are valid if:• The waveform amplitude is larger than one division• At least 1.5 waveform period is on the screen
AC+DC Voltage (True RMS)Maximum Voltage
with 10:1 probe .................................................. 1000 Vdirect (1:1) ........................................................... 300 V
Maximum Resolutionwith 10:1 probe ..................................................... 1 mVdirect (1:1) ......................................................... 100 µV
Full Scale Reading ....................................... 1100 countsAccuracy
DC to 60 Hz ................................. ±(1.5 % + 10 counts)60 Hz to 20 kHz ........................... ±(2.5 % + 15 counts)20 kHz to 1 MHz ............................. ±(5 % + 20 counts)1 MHz to 25 MHz .......................... ±(10 % + 20 counts)For higher frequencies the instrument’s frequency rolloff starts affecting accuracy.

Fluke 196C/199CUsers Manual
94
Amperes (AMP)With Optional Current Probe or Current ShuntRanges............................. same as VDC, VAC, VAC+DCProbe Sensitivity .................100 µV/A, 1 mV/A, 10 mV/A,
100 mV/A, 1 V/A, 10 V/A, and 100 V/AAccuracy .......................... same as VDC, VAC, VAC+DC
(add current probe or current shunt accuracy)
PeakModes ...........................Max peak, Min peak, or pk-to-pkMaximum Voltage
with 10:1 probe...................................................1000 Vdirect (1:1) ............................................................300 V
Maximum Resolutionwith 10:1 probe....................................................10 mVdirect (1:1) .............................................................1 mV
Full Scale Reading..........................................800 countsAccuracy
Max peak or Min peak ............................... ±0.2 divisionPeak-to-peak............................................. ±0.4 division
Frequency (Hz)Range......................................1.000 Hz to full bandwidthFull Scale Reading ...................................... 9 999 counts
with at least 10 waveform periods on screen.Accuracy
1 Hz to full bandwidth ......................±(0.5 % +2 counts)
Duty Cycle (DUTY)Range..................................................... 4.0 % to 98.0 %
Pulse Width (PULSE)Resolution (with GLITCH off).........................1/100 divisionFull Scale Reading ......................................... 999 countsAccuracy
1 Hz to full bandwidth ......................±(0.5 % +2 counts)

SpecificationsAutomatic Scope Measurements 9
95
PowerPower Factor....................... ratio between Watts and VA
Range......................................................... 0.00 to 1.00Watt .................................. RMS reading of multiplication
corresponding samples of input A (volts)and Input B (amperes)
Full Scale Reading ...................................... 999 countsVA ................................................................Vrms x Arms
Full Scale Reading ...................................... 999 countsVA Reactive ..................................................√((VA)2-W2)
Full Scale Reading ...................................... 999 counts
PhaseRange ............................................-180 to +180 degreesResolution ..........................................................1 degreeAccuracy
0.1 Hz to 1 MHz........................................... ±2 degrees1 MHz to 10 MHz......................................... ±3 degrees
Temperature (TEMP)With Optional Temperature ProbeRanges (°C or °F).................................. -40.0 to +100.0 °
-100 to +250 °-100 to +500 °
-100 to +1000 °-100 to + 2500 °
Probe Sensitivity............................ 1 mV/°C and 1 mV/°F
Decibel (dB)dBV................................................ dB relative to one voltdBm ...................dB relative to one mW in 50 Ω or 600 ΩdB on .......................................... VDC, VAC, or VAC+DCAccuracy...........................same as VDC, VAC, VAC+DC

Fluke 196C/199CUsers Manual
96
MeterMeter InputInput Coupling............................................................. DCFrequency Response...................... DC to 10 kHz (-3 dB)Input Impedance ................1 MΩ (±1 %)//10 pF (±1.5 pF)
Max. Input Voltage .............................. 1000 V CAT II600 V CAT III
(For detailed specifications, see “Safety”)
Meter Functions
Ranging........................................................Auto, Manual
Modes .................................................... Normal, Relative
DMM Measurements on Meter InputsThe accuracy of all measurements is within ± (% ofreading + number of counts) from 18 °C to 28 °C.Add 0.1x (specific accuracy) for each °C below 18 °C orabove 28 °C.
GeneralDC Common Mode Rejection (CMRR).................. >100 dBAC Common Mode Rejection at 50, 60, or 400 Hz....... >60 dB
Ohms (ΩΩΩΩ)Ranges.................................500.0 Ω, 5.000 kΩ, 50.00 kΩ,
500.0 kΩ, 5.000 MΩ, 30.00 MΩ
Full Scale Reading500 Ω to 5 MΩ .............................................. 5000 counts30 MΩ........................................................... 3000 counts
Accuracy .............................................. ±(0.6 % +5 counts)Measurement Current ...................0.5 mA to 50 nA, ±20 %
decreases with increasing rangesOpen Circuit Voltage ................................................... <4 V
Continuity (CONT)Beep..........................................................<50 Ω (±30 Ω)Measurement Current .............................. 0.5 mA, ±20 %Detection of shorts of ............................................. ≥1 ms

SpecificationsDMM Measurements on Meter Inputs 9
97
DiodeMaximum Voltage Reading ......................................2.8 VOpen Circuit Voltage.................................................<4 VAccuracy ...............................................±(2 % +5 counts)Measurement Current .............................. 0.5 mA, ±20 %
Temperature (TEMP)With Optional Temperature ProbeRanges (°C or °F) ................................. -40.0 to +100.0 °
-100.0 to +250.0 °-100.0 to +500.0 °
-100 to +1000 °-100 to + 2500 °
Probe Sensitivity ............................1 mV/°C and 1 mV/°F
DC Voltage (VDC)Ranges..... 500.0 mV, 5.000 V, 50.00 V, 500.0 V, 1100 VFull Scale Reading....................................... 5000 countsAccuracy ............................................±(0.5 % +5 counts)Normal Mode AC Rejection at 50 or 60 Hz ±1 % ....>60 dB
AC Voltage (VAC)Ranges .....500.0 mV, 5.000 V, 50.00 V, 500.0 V, 1100 VFull Scale Reading ....................................... 5000 countsAccuracy
15 Hz to 60 Hz................................. ±(1 % +10 counts)60 Hz to 1 kHz .............................. ±(2.5 % +15 counts)For higher frequencies the frequency roll off of theMeter input starts affecting accuracy.
Normal Mode DC Rejection.................................. >50 dB
AC+DC Voltage (True RMS)Ranges .....500.0 mV, 5.000 V, 50.00 V, 500.0 V, 1100 VFull Scale Reading ....................................... 5000 countsAccuracy
DC to 60 Hz ..................................... ±(1 % +10 counts)60 Hz to 1 kHz .............................. ±(2.5 % +15 counts)For higher frequencies the frequency roll off of the Meterinput starts affecting accuracy.All accuracies are valid if the waveform amplitude islarger than 5 % of full scale.

Fluke 196C/199CUsers Manual
98
Amperes (AMP)With Optional Current Probe or Current ShuntRanges............................. same as VDC, VAC, VAC+DCProbe Sensitivity .................100 µV/A, 1 mV/A, 10 mV/A,
100 mV/A, 1 V/A, 10 V/A, and 100 V/AAccuracy .......................... same as VDC, VAC, VAC+DC
(add current probe or current shunt accuracy)
RecorderTrendPlot (Meter or Scope)Chart recorder that plots a graph of min and max valuesof Meter or Scope measurements over time.Measurement Speed.................... > 2.5 measurements/sTime/Div......................................... 10 s/div to 20 min/divRecord Size ..................................13500 points per inputRecorded Time Span .............................90 min to 8 daysTime Reference .....................time from start, time of day
Scope RecordRecords scope waveforms in deep memory whiledisplaying the waveform in Roll mode.
Source......................................................Input A, Input BMax. Sample Speed (10 ms/div to 1 min/div) ...... 20 MS/sGlitch capture (10 ms/div to 1 min/div) .................... 50 nsTime/Div in normal mode ...............10 ms/div to 2 min/divRecord Size...................................27500 points per inputRecorded Time Span ............................. 11 s to 30 hoursAcquisition Modes ...................................... Single Sweep
Continuous RollExternal Triggering
Time Reference..................... time from start, time of day

SpecificationsZoom, Replay and Cursors 9
99
Zoom, Replay and CursorsZoomHorizontal Magnification
Scope Record ............................................. up to 100xTrendPlot........................................................ up to 50xScope ............................................................... up to 8x
ReplayDisplays a maximum of 100 captured dual input Scopescreens.
Replay modes ...........Step by Step, Replay as Animation
Cursor MeasurementsCursor Modes.................................. single vertical cursor
dual vertical cursorsdual horizontal cursors (Scope mode)
Markers ...................... automatic markers at cross pointsMeasurements .......................................value at cursor 1
value at cursor 2difference between values at cursor 1 and 2
time between cursorsTime of Day (Recorder modes)
Time from Start (Recorder modes)Rise Time
MiscellaneousDisplayView Area ...................................... 144 mm (5.65 inches)Backlight.....................Cold Cathode Fluorescent (CCFL)
Temperature compensatedBrightness .............................. Power Adapter: 60 cd / m2
Batteries: 35 cd / m2
PowerRechargeable NiMH Batteries:
Operating Time.................................................. 4 hoursCharging Time ................................................... 4 hoursAllowable ambienttemperature during charging: .... 0 to 40 °C (32 to 104 °F)Auto power downtime (battery saving): .............5 min, 30 min or disabled
Battery Charger / Power Adapter BC190:• BC190/801 European line plug 230 V ±10 %• BC190/803 North American line plug 120 V ±10 %• BC190/804 United Kingdom line plug 230 V ±10 %• BC190/806 Japanese line plug 100 V ±10 %• BC190/807 Australian line plug 230 V ±10 %• BC190/808 Universal switchable adapter 115 V ±10 %
or 230 V ±10 %, with plug EN60320-2.2GLine Frequency........................................... 50 and 60 Hz

Fluke 196C/199CUsers Manual
100
Probe CalibrationManual pulse adjustment and automatic DC adjustmentwith probe check.
Generator Output ......................................3 Vpp / 500 Hzsquare wave
MemoryNumber of Scope Memories .........................................10
Each memory can contain two waveforms pluscorresponding setups
Number of Recorder Memories.......................................2Each memory can contain:• a dual input TrendPlot
(2 x 13500 points per input)• a dual input Scope Record
(2 x 27500 points per input)• 100 dual input Scope screens
MechanicalSize ........................64 x 169 x 254 mm (2.5 x 6.6 x 10 in)Weight.....................................................1.95 kg (4.3 lbs)
including battery
Optical InterfacePortType .........................................RS-232, optically isolatedTo Printer............................. supports Epson FX, LQ, and
HP Deskjet®, Laserjet®, and Postscript• Serial via PM9080 (optically isolated RS-232 Adapter/
Cable, optional).• Parallel via PAC91 (optically isolated Print Adapter
Cable, optional).To PC/Notebook• Serial via PM9080 (optically isolated RS-232 Adapter/
Cable, optional), using SW90W (FlukeView® softwarefor Windows 95®, 98®, Me®, 2000® and NT4®).

SpecificationsEnvironmental 9
101
EnvironmentalEnvironmental .........................MIL-PRF-28800F, Class 2Temperature
Operating:battery only.......................... 0 to 50 °C (32 to 122 °F)power adapter...................... 0 to 40 °C (32 to 104 °F)
Storage............................. -20 to +60 °C (-4 to +140 °F)Humidity
Operating:0 to 10 °C (32 to 50 °F) ...................... noncondensing10 to 30 °C (50 to 86 °F) ................................... 95 %30 to 40 °C (86 to 104 °F) .................................. 75 %40 to 50 °C (104 to 122 °F) ................................ 45 %
Storage:-20 to +60 °C (-4 to +140 °F).............. noncondensing
AltitudeOperating ......................................... 3 km (10 000 feet)Storage........................................... 12 km (40 000 feet)
Vibration (Sinusoidal)..........................................max. 3 gShock ................................................................max. 30 g
Electromagnetic Compatibility (EMC)Emission and immunitiy............ EN-IEC61326-1 (1997)
Enclosure Protection .............................IP51, ref: IEC529

Fluke 196C/199CUsers Manual
102
SafetyDesigned for measurements on 1000 V Category IIInstallations, 600 V Category III Installations, PollutionDegree 2, per:• ANSI/ISA S82.01-1994• EN61010-1 (1993) (IEC1010-1)• CAN/CSA-C22.2 No.1010.1-92• UL3111-1
Max. Input VoltagesInput A and B directly ............................... 300 V CAT III
Input A and B via 10:1 probe................... 1000 V CAT II600 V CAT III
METER/EXT TRIG inputs........................ 1000 V CAT II600 V CAT III
Max. Floating VoltageFrom any terminal to ground ................... 1000 V CAT II
600 V CAT IIIBetween any terminal.............................. 1000 V CAT II
600 V CAT III
Voltage ratings are given as “working voltage”. Theyshould be read as Vac-rms (50-60 Hz) for AC sinewaveapplications and as Vdc for DC applications.
Figure 51. Max. Input Voltage v.s. Frequency
Note
Overvoltage Category III refers to distributionlevel and fixed installation circuits inside abuilding. Overvoltage Category II refers to locallevel, which is applicable for appliances andportable equipment.

Specifications10:1 Probe 9
103
Figure 52. Safe Handling: Max. Input Voltage BetweenScope References, and Between
Scope References and Meter Reference
10:1 ProbeSafety
Max. Input Voltage ............................1000 V CAT II600 V CAT III
Max. Floating Voltagefrom any terminal to ground.....................1000 V CAT II
600 V CAT IIIup to 400 Hz
Electrical specificationsInput Impedance at probe tip 10 MΩ (±2 %)//14 pF (±2 pF)Capacity Adjustment Range...........................10 to 22 pFAttenuation at DC (1 MΩ input).......................10 x (±2 %)Bandwidth (with FLUKE 199C).....DC to 200 MHz (-3 dB)Environmental
TemperatureOperating ............................. 0 to 50 °C (32 to 122 °F)Storage ..........................-20 to +60 °C (-4 to +140 °F)
AltitudeOperating .......................................3 km (10 000 feet)Storage ........................................12 km (40 000 feet)
HumidityOperating at 10 to 30 °C (50 to 86 °F) ............... 95 %

Fluke 196C/199CUsers Manual
104
0.011
2
5
10
20
50
100
200
500
1000
0.02 0.05 0.1 0.2 0.5 1 2 5 10 20 50 100 200
FREQUENCY (MHz)
MAX. INPUTVOLTAGE (Vrms)
CAT III
CAT II
Figure 53. Max. Voltage From Probe Tip to Groundand From Probe Tip to Probe Reference
0.011
2
5
10
20
50
100
200
500
1000
0.02 0.05 0.1 0.2 0.5 1 2 5 10 20 50 100 200
FREQUENCY (MHz)
MAX. VOLTAGEFROM PROBE REFERENCETO GROUND
CAT III
CAT II
Figure 54. Safe Handling: Max. Voltage From ProbeReference to Ground

SpecificationsElectromagnetic Immunity 9
105
Electromagnetic ImmunityThe Fluke 190 series, including standard accessories, conforms with the EEC directive 89/336 for EMC immunity, asdefined by EN-61326-1, with the addition of the following tables.
Scope Mode (10 ms/div): Trace disturbance with VPS200 voltage probe shortedTable 1
No visible disturbance E = 3V/mFrequency range 10 kHz to 20 MHz 5 mV/div to 100 V/divFrequency range 20 MHz to 100 MHz 200 mV/div to 100 V/divFrequency range 100 MHz to 1 GHz 500 mV/div to 100 V/div *)
(*) With the 20 MHz Bandwidth Filter switched on: no visible disturbance.With the 20 MHz Bandwidth Filter switched off: disturbance is max 2 div.
Table 2Disturbance less than 10% of full scale E = 3V/mFrequency range 20 MHz to 100 MHz 10 mV/div to 100 mV/div
Test Tool ranges not specified in tables 1 and 2 may have a disturbance of more than 10% of full scale.
Meter Mode (Vdc, Vac, Vac+dc, Ohm and Continuity): Reading disturbance with test leads shortedTable 3
Disturbance less than 1% of full scale E = 3V/mFrequency range 10 kHz to 1 GHz 500mV to 1000V , 500Ohm to 30 MOhm ranges

Fluke 196C/199CUsers Manual
106

107
Index
—1—10-1 Voltage Probe, 83
—2—2-mm Test Probes, 3, 84
—4—4-mm Test Probes, 3, 83
—A—A versus B, 20A*B, 20A+B, 20A-B, 20Accessories, 67, 82AC-Coupling, 18
Acquiring the Waveform, 18Altitude, 101, 103Ampere Measurement, 25Amperes, 94, 98Analysis Functions, 37, 99AS200 Accessory Set, 3, 84Auto Ranges, 27Auto Set, 92Automatic Connect-and-View
Trigger, 91Automatic Power Shutdown, 75Automatic Scope Measurements,
13Automatic Triggering, 48Average, 15
—B—Banana Jack Inputs, 10, 23, 30
Bandwidth, 90, 96Bargraph, 24Battery
Charger, 3, 83Charging, 2, 78Indicator, 78Life, 75Refresh, 79Refresh Date, 82Replacing, 80
BC190 Battery Charger, 3, 83
—C—C190 Hard Case, 3, 86C195 Soft Case, 86Calibrating the Test Tool, 82Calibrating Voltage Probes, 80,
100

Fluke 196C/199CUsers Manual
108
Calibration, 100Capturing 100 Screens, 39, 92Case, 86Charge Time, 99Charger, 83Charging, 78Cleaning, 77Clear Menu, 10, 72Common Leads, 3Connect-and-View, 45, 92Connecting a Computer, 63Connecting A Printer, 64Connections, 10, 23Continuity, 96Contrast, 73CS20MA Current Shunt, 86Current Measurement, 25Current Probe, 25Current Shunt, 86Cursors Measurements, 42
—D—Date, 74DC Voltage (VDC), 92, 97Decibel (dB), 95Delay, Trigger, 91Deleting Screens, 61Diode, 97
Display, 99Displaying Recorded Data, 31, 34DMM Measurements, 24Documenting Screens, 63Duty Cycle, 94
—E—Earth Ground, 6Edge Trigger, 49, 91Electrical Shock, 5Electrically Floating, 6Electromagnetic Compatibility, 101Electronic Scope Connections, 68Emission, 101Environmental, 101Environmental Data, 89External Trigger, 91External Triggering, 52
—F—FlukeView, 63, 86Freezing the Readings, 27Freezing the Screen, 14Frequency (Hz), 94Frequency Response, 90, 96
—G—Glitch Capture, 17, 34, 35
Ground Leads, 3, 83Ground Spring, 3, 83
—H—Hard Case, 3, 86HF Voltage Probe Connection, 68Hook Clips, 3, 83Horizontal Cursors, 42Humidity, 101Hz, 94
—I—Immunity, 101Information Language, 73Input A Measurement, 13Input B Measurement, 13Input Coupling, 96Input Impedance, 90, 96, 103Input Sensitivity
Variable, 19Interface, 100Inverted Display, 18Isolated, 6
—L—Language, 73
Index (continued)
109
—M—Maintenance, 77Manual, 85Manual Ranges, 27Mathematics Functions, 20Max. Floating Voltage, 102, 103Max. Input Voltage, 102Measurement Connections, 10, 23Measurements, 13, 24Measurements on Meter Inputs, 96Mechanical, 100Memory, 100Meter Connections, 69Meter Measurements, 24Multi Meter Measurements, 24
—N—Navigating a Menu, 9NiMH Battery, 78NiMH Battery, 77Noisy Waveforms, 20, 50
—O—Ohm (Ω), 96Operating Time, 99Optical Interface, 63, 64, 100Oscilloscope, 90
OVERVIEW, 41
—P—PAC91, 64, 86Parallel Print Cable, 86Parallel Printer, 64Parts, 82Peak, 94Performance Characteristics, 89Persistence, 16Phase, 95PM9080, 63, 64, 86Polarity, 18Power, 99Power Adapter, 75, 83Power Down Timer, 75Powering the Test Tool, 7Pre Trigger, 47Print Cable, 86Probe, 80Probe Calibration, 80, 100Pulse Trigger, 55Pulse Width, 94Pulse Width Trigger, 92
—R—Readings, 13Recalibrating, 82
Recalling Screens, 61Recalling Setups, 62Record Length, 91Record+Setup Memory, 60Recorder, 98Recorder Options, 32Recording Waveforms, 33Refreshing Batteries, 82Relative Measurements, 28Replaceable Parts, 82Replacement Set, 85Replacing Batteries, 80Replay, 37, 60, 99Resetting the Test Tool, 8, 72Resistance Measurement, 24Reversing the Polarity, 18Rise Time, 44, 90RMS Voltage, 93Roll Mode Function, 98RS200 Replacement Set, 85RS-232 Adapter/Cable, 3, 63, 64,
86
—S—Safety, 102Safety Characteristics, 89Safety Requirements, 1Sampling Rate, 90

Fluke 196C/199CUsers Manual
110
Saving, 60SCC 190, 64, 86Scope, 90Scope Connections, 11, 68Scope Cursor Measurements, 99Scope Measurements, 13Scope Record, 98Scope Record, 33Screen Contrast, 73Screen Without Menus, 10, 72Serial Printer, 64Service Manual, 86Shock, 101Single Shot, 50Single Sweep Mode, 34Slope, 46, 91Slow Variations, 30Smooth, 15Soft Case, 86Software, 3, 86Software Version, 82Specifications, 89Spike Capture, 17Stand, 72
Storing, 77SW90W Software, 3, 64, 86
—T—Temperature, 95, 97, 101, 103Test Leads, 3Test Probes, 3, 83Tilt Stand, 72Time, 74Time Base Accuracy, 91TL24 Test Leads, 84TrendPlot (Meter), 98TrendPlot™ Function, 30Trigger
Delay, 47, 91Level, 46Modes, 91Pre-trigger, 47
Trigger Sensitivity, 91Triggering
Automatic, 48, 91External, 52On Edges, 49On Pulses, 55
On Video, 53On Waveforms, 45
Troubleshooting, 87TV Triggering, 53
—U—Unpacking, 2Users Manual, 3, 85
—V—Vertical Accuracy, 90Vertical Cursors, 43Vibration, 101Video Frames, 54Video Lines, 54Video Trigger, 53, 91Viewing Stored Screens, 63Voltage Probes, 3, 80, 83VP200 Voltage Probe, 83VP200 Voltage Probe Set, 3
—Z—Zoom, 40, 99