05/31/2007teppei katori, indiana university, nuint '07 1 charged current interaction...
TRANSCRIPT

05/31/2007 Teppei Katori, Indiana University, NuInt '07
1
Charged Current Interaction measurements in MiniBooNE
hep-ex/XXX
Teppei Katori for the MiniBooNE collaboration Indiana University
NuInt 07, Fermilab, May., 31, 07

05/31/2007 Teppei Katori, Indiana University, NuInt '07
2
outline1. CCQE events in MiniBooNE2. Prediction for CCQE events3. CCQE data-MC comparison4. Fit results5. Anti-neutrino CCQE events6. Conclusion
Charged Current Interaction measurements in MiniBooNE
hep-ex/XXX

05/31/2007 Teppei Katori, Indiana University, NuInt '07
3
1. CCQE events in MiniBooNE

05/31/2007 Teppei Katori, Indiana University, NuInt '07
4
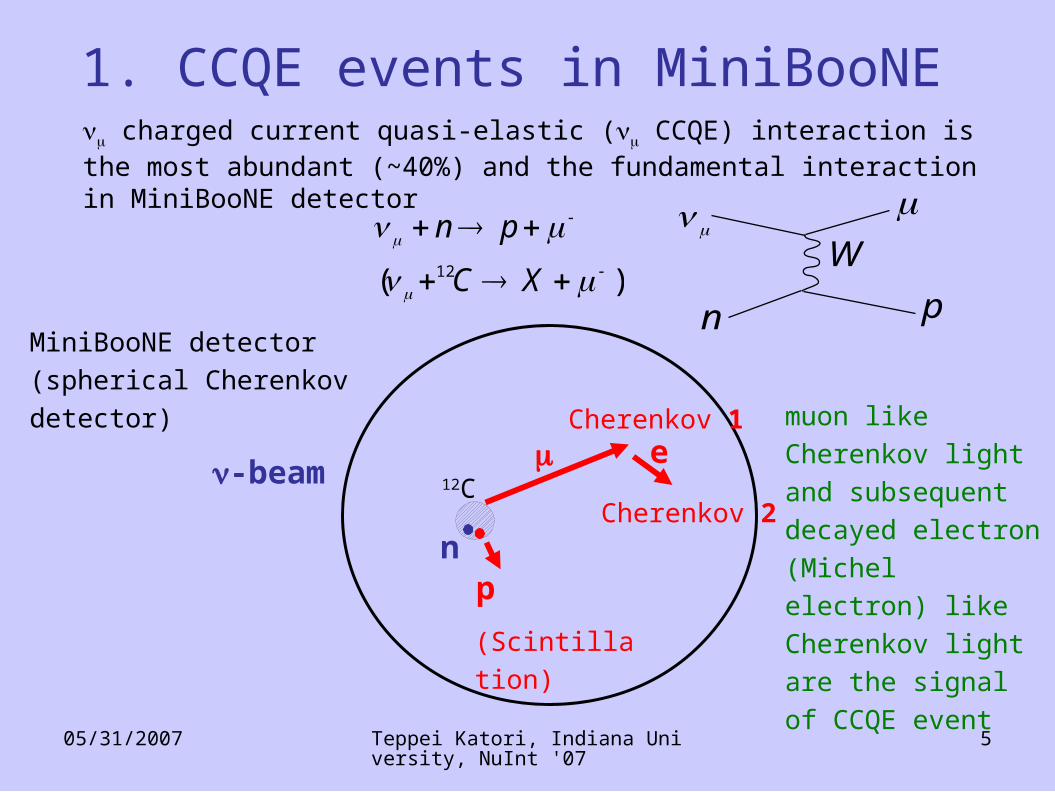
1. CCQE events in MiniBooNE charged current quasi-elastic ( CCQE) interaction is the most abundant (~40%) and the fundamental interaction in MiniBooNE detector
n
12C
W
p
n)( 12
XC
pn
MiniBooNE detector
(spherical Cherenkov detector)
05/31/2007 Teppei Katori, Indiana University, NuInt '07
5
1. CCQE events in MiniBooNE charged current quasi-elastic ( CCQE) interaction is the most abundant (~40%) and the fundamental interaction in MiniBooNE detector
p
n
-beam
(Scintillation)
Cherenkov 1
12C
MiniBooNE detector
(spherical Cherenkov detector)
)( 12
XC
pnW
p
n
muon like Cherenkov
light and subsequent
decayed electron
(Michel electron) like
Cherenkov light are
the signal of CCQE
event
Cherenkov 2
e

05/31/2007 Teppei Katori, Indiana University, NuInt '07
6
CCQE interactions (+n +p) has characteristic two “subevent” structure from muon decay
+ n + p +e + e
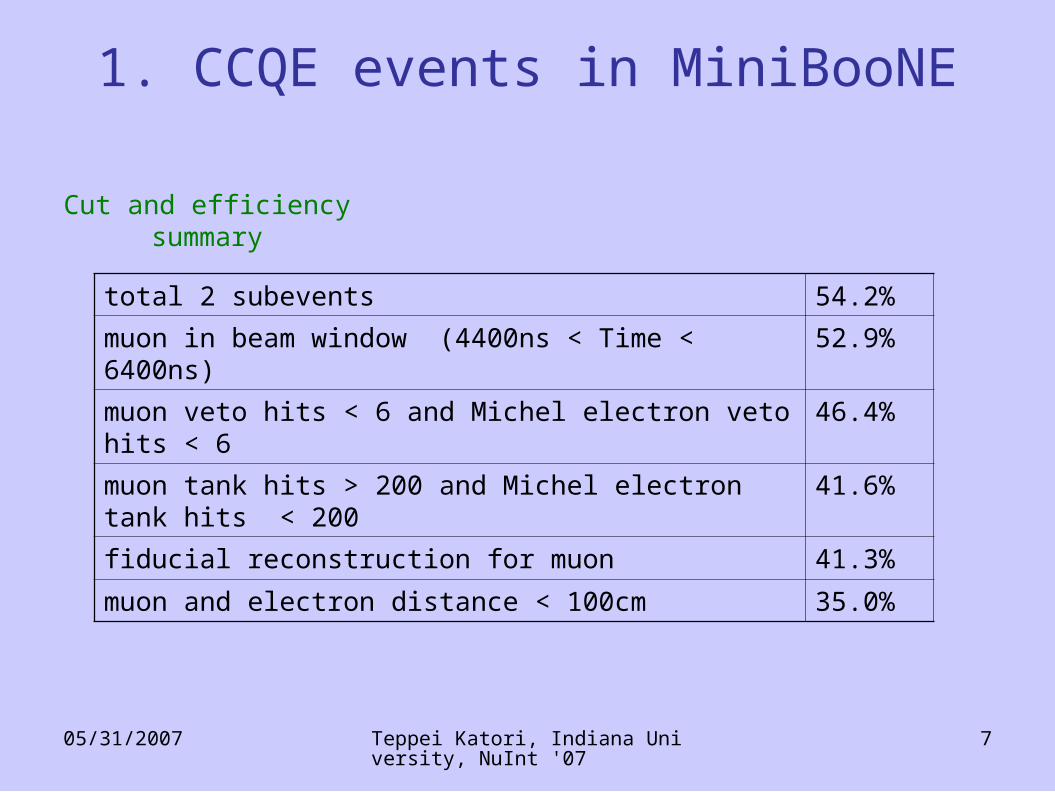
35.0% cut efficiency
197,308 events with 5.58E20POT
1. CCQE events in MiniBooNE
muon>200 hits
Michel electron<200 hits
05/31/2007 Teppei Katori, Indiana University, NuInt '07
7
total 2 subevents 54.2%
muon in beam window (4400ns < Time < 6400ns) 52.9%
muon veto hits < 6 and Michel electron veto hits < 6 46.4%
muon tank hits > 200 and Michel electron tank hits < 200 41.6%
fiducial reconstruction for muon 41.3%
muon and electron distance < 100cm 35.0%
Cut and efficiency summary
1. CCQE events in MiniBooNE

05/31/2007 Teppei Katori, Indiana University, NuInt '07
8
All kinematics are specified from 2 observables, muon energy E and muon scattering angle
Energy of the neutrino E and 4-momentum transfer Q2 can be reconstructed by these 2 observables
1. CCQE events in MiniBooNE
12C-beam cosE
)cosθp(E2EmQ
]cosθpE)E2[(M
)ΔMm2ME(E)EE2(ME
μμμν
2
μ
2
μμμB
22
μB
2
BμB
ν

05/31/2007 Teppei Katori, Indiana University, NuInt '07
9
2. Prediction for CCQE events

05/31/2007 Teppei Katori, Indiana University, NuInt '07
10
Predicted event rates(NUANCE Monte Carlo)
Casper, Nucl.Phys.Proc.Suppl. 112 (2002) 161
2. Prediction for CCQE events

05/31/2007 Teppei Katori, Indiana University, NuInt '07
11
Relativistic Fermi Gas (RFG) ModelCarbon is described by the collection of incoherent Fermi gas particles. All details come from hadronic tensor.
2. Prediction for CCQE eventsSmith and Moniz, Nucl.,Phys.,B43(1972)605
B
22
F
22
F
22
A
2
A
2
A
PA21μν
μν
Ehi
Eloabμν
Ew)M(p : Elo
)M(p : Ehi
:)/MQ/(1g)(Q
: )F,F,F,(FTT
: w),q,kf(
:dEw)T,q,k(f)(W
F
nucleon of stateenergy lowest the
nucleon of stateenergy highest the
factor form Axial
tensor nucleon
functiondensity space phase nucleon
tensorhadronic

05/31/2007 Teppei Katori, Indiana University, NuInt '07
12
Relativistic Fermi Gas (RFG) ModelCarbon is described by the collection of incoherent Fermi gas particles. All details come from hadronic tensor.
2. Prediction for CCQE eventsSmith and Moniz, Nucl.,Phys.,B43(1972)605
B
22
F
22
F
22
A
2
A
2
A
PA21μν
μν
Ehi
Eloabμν
Ew)M(p : Elo
)M(p : Ehi
:)/MQ/(1g)(Q
: )F,F,F,(FTT
: w),q,kf(
:dEw)T,q,k(f)(W
F
nucleon of stateenergy lowest the
nucleon of stateenergy highest the
factor form Axial
tensor nucleon
functiondensity space phase nucleon
tensorhadronic
3 parameters are especially important to control nuclear effect of Carbon;MA = 1.03GeV : axial massPF = 220MeV : Fermi momentumEB = 34MeV : binding energy

05/31/2007 Teppei Katori, Indiana University, NuInt '07
13
3. CCQE data-MC comparison

05/31/2007 Teppei Katori, Indiana University, NuInt '07
14
3. CCQE data-MC comparison
Since data-MC disagreements align on the Q2 lines, not E lines, the source of data-MC disagreement is not the neutrino beam prediction, but the neutrino cross section prediction.
data-MC ratio from RFG model
CCQE kinematics phase spaceThe data-MC agreement is not great

05/31/2007 Teppei Katori, Indiana University, NuInt '07
15
3. CCQE data-MC comparison
The data-MC disagreement is characterized by 2 features;
(1) data deficit at low Q2 region
(2) data excess at high Q2 region
data-MC ratio from RFG model
CCQE kinematics phase spaceThe data-MC agreement is not great

05/31/2007 Teppei Katori, Indiana University, NuInt '07
16
3. CCQE data-MC comparison
Nuclear model parameters are tuned from electron scattering data, thus the best explanations of observed data-MC disagreements are something one cannot measure from the electron scattering data
(1) data deficit at low Q2 region Pauli blocking
(2) data excess at high Q2 region Axial mass MA
We tune the nuclear parameters in RFG model using Q2 distribution;MA = tunedPF = fixedEB = fixed

05/31/2007 Teppei Katori, Indiana University, NuInt '07
17
3. CCQE data-MC comparison
Pauli blocking parameter "kappa" : To enhance the Pauli blocking at low Q2, we introduced a new parameter , which is the scale factor of lower bound of nucleon sea and controls the size of nucleon phase space
We tune the nuclear parameters in RFG model using Q2 distribution;MA = tunedPF = fixedEB = fixed = tuned
Ew)M(p Elo B
22
F
Ehi(fixed)
Elo(tuned)px
py
pz
px
py
pzThis modification gives significant effect only at low Q2 region

05/31/2007 Teppei Katori, Indiana University, NuInt '07
18
3. CCQE data-MC comparison
Q2 distribution with MA variation
Q2 distribution with variation
MA and are simultaneously fit to the data
2% change of is sufficient to take account the data deficit at low Q2 region

05/31/2007 Teppei Katori, Indiana University, NuInt '07
19
4. Fit results
05/31/2007 Teppei Katori, Indiana University, NuInt '07
20
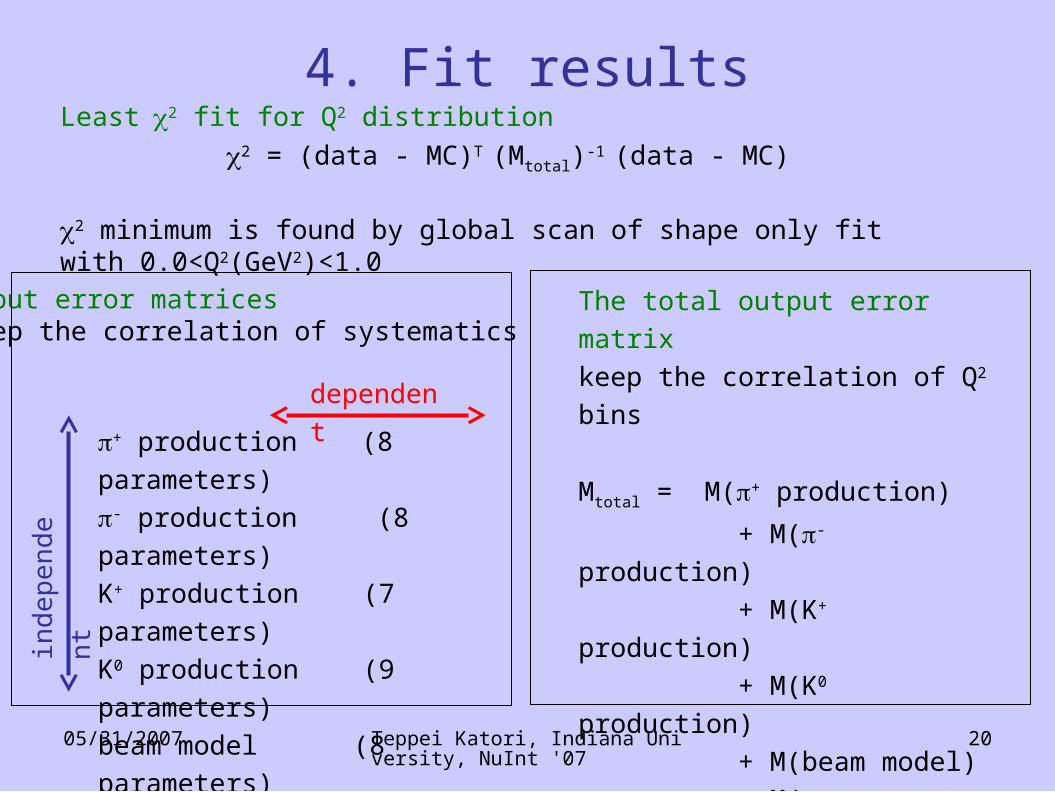
4. Fit resultsLeast2 fit for Q2 distribution
2 = (data - MC)T (Mtotal)-1 (data - MC)
2 minimum is found by global scan of shape only fit with 0.0<Q2(GeV2)<1.0
The total output error matrix
keep the correlation of Q2 bins
Mtotal = M(+ production)
+ M(- production)
+ M(K+ production)
+ M(K0 production)
+ M(beam model)
+ M(cross section model)
+ M(detector model)
+ M(data statistics)
+ production (8 parameters)
- production (8 parameters)
K+ production (7 parameters)
K0 production (9 parameters)
beam model (8 parameters)
cross section (20 parameters)
detector model (39 parameters)
dependent
ind
epe
nd
ent
Input error matriceskeep the correlation of systematics

05/31/2007 Teppei Katori, Indiana University, NuInt '07
21
dots : data with error bardashed line : before fitsolid line : after fitdotted line : backgrounddash-dotted :non-CCQElike bkgd
4. Fit resultsMA - fit result
MA = 1.23 ± 0.20(stat+sys) = 1.019 ± 0.011(stat+sys)
circle: before fitstar: after fit with 1-sigma contourtriangle: bkgd shape uncertainty

05/31/2007 Teppei Katori, Indiana University, NuInt '07
22
4. Fit results
MA(GeV)
data statistics 0.03 0.003
neutrino flux 0.04 0.003
neutrino cross section 0.06 0.004
detector model 0.10 0.003
CC+ background shape 0.02 0.007
total error 0.20 0.011
Errors
The detector model uncertainty dominates the error in MA
The error on is dominated by Q2 shape uncertainty of background events

05/31/2007 Teppei Katori, Indiana University, NuInt '07
23
4. Fit results
Although fit is done in Q2 distribution, entire CCQE kinematics is improved
before2/dof = 79.5/53, P(2) = 1%
after2/dof = 45.1/53, P(2) = 77%
data-MC ratio after the fit
MA - fit resultMA = 1.23 ± 0.20(stat+sys) = 1.019 ± 0.011(stat+sys)

05/31/2007 Teppei Katori, Indiana University, NuInt '07
24
data-MC ratio before
the fit
4. Fit resultsMA - fit result
MA = 1.23 ± 0.20(stat+sys) = 1.019 ± 0.011(stat+sys)
data-MC ratio after
the fit
Although fit is done in Q2 distribution, entire CCQE kinematics is improved
before2/dof = 79.5/53, P(2) = 1%
after2/dof = 45.1/53, P(2) = 77%

05/31/2007 Teppei Katori, Indiana University, NuInt '07
25
4. Fit results
E distribution cos distribution
Other kinematics distribution also show very good data-MC agreement(This is critical for MiniBooNE neutrino oscillation search experiment)
MiniBooNE collaboration, arXiv:0704.1500 [hep-ex] (2007)

05/31/2007 Teppei Katori, Indiana University, NuInt '07
26
fit with fixing for 0.25<Q2(GeV2)<1.0
good agreement above 0.25GeV2 but gross disagreement at low Q2 region
This fit cannot improve entire CCQE phase space
4. Fit resultsMA only fit resultMA = 1.25 ± 0.12(stat+sys)
Q2 distribution

05/31/2007 Teppei Katori, Indiana University, NuInt '07
27
4. Fit resultsMA only fit resultMA = 1.25 ± 0.12(stat+sys)
data-MC ratio after the fitfit with fixing for 0.25<Q2(GeV2)<1.0
good agreement above 0.25GeV2 but gross disagreement at low Q2 region
This fit cannot improve entire CCQE phase space

05/31/2007 Teppei Katori, Indiana University, NuInt '07
28
5. Anti-neutrino CCQE events

05/31/2007 Teppei Katori, Indiana University, NuInt '07
29
5. Anti-neutrino CCQE eventsAnti-neutrino Q2 distribution
MiniBooNE anti-neutrino CCQE8772 events
(1651 total for pre-MiniBooNE data)
We use same cut with neutrino mode
The values of MA and extracted from neutrino mode are employed to anti-neutrino MC, and they describe data Q2 distribution well.
Anti-neutrino Q2 distribution
data with stat error
Preliminary

05/31/2007 Teppei Katori, Indiana University, NuInt '07
30
5. Anti-neutrino CCQE eventsAnti-neutrino Q2 distribution
MiniBooNE anti-neutrino CCQE8772 events
(1651 total for pre-MiniBooNE data)
We use same cut with neutrino mode
The values of MA and extracted from neutrino mode are employed to anti-neutrino MC, and they describe data Q2 distribution well.
Anti-neutrino Q2 distribution data-MC ratio
Preliminary

05/31/2007 Teppei Katori, Indiana University, NuInt '07
31
5. Anti-neutrino CCQE eventsAnti-neutrino CCQE kinematics
MiniBooNE anti-neutrino CCQE8772 events
(1651 total for pre-MiniBooNE data)
We use same cut with neutrino mode
The values of MA and extracted from neutrino mode are employed to anti-neutrino MC, and they describe data Q2 distribution well.
Anti-neutrino CCQE kinematics variables are described by the MC well, too.
MA = 1.23GeV, k=1.019data with stat error
kinematics
Preliminary

05/31/2007 Teppei Katori, Indiana University, NuInt '07
32
6. Conclusion
MiniBooNE has large CCQE data set around 1GeV region
MiniBooNE successfully employee RFG model with appropriate parameter choices for MA and
This new model can describe entire CCQE phase space well
The best fit parameters for MiniBooNE CCQE data are;
MA = 1.23 ± 0.20(stat+sys)= 1.019 ± 0.011(stat+sys)
Our new model also works well in anti-neutrino data
MiniBooNE is currently taking the data with anti-muon neutrino beam

05/31/2007 Teppei Katori, Indiana University, NuInt '07
33
MiniBooNE collaboration University of Alabama Los Alamos National LaboratoryBucknell University Louisiana State UniversityUniversity of Cincinnati University of MichiganUniversity of Colorado Princeton UniversityColumbia University Saint Mary’s University of MinnesotaEmbry Riddle University Virginia Polytechnic InstituteFermi National Accelerator Laboratory Western Illinois UniversityIndiana University Yale University
Thank you for your attention!

05/31/2007 Teppei Katori, Indiana University, NuInt '07
34
10. Back up

05/31/2007 Teppei Katori, Indiana University, NuInt '07
35
Fit quality (2 probability) is good even Q2min =0.0GeV2
MA is stable in wide range of Q2min
Since is only important for low Q2 region, it has no power for fit for high Q2
4. Fit resultsFit result with varying Q2min, Q2min < Q2 < 1.0GeV2
Fit is repeated with changing the Q2min
0.0 0.1 0.2 0.3 0.4 0.5(GeV2)
0.6
0.4
0.2
0.0
2 p
roba
bili
ty2
pro
bab
ility
1.050
1.025
1.000
1.50
1.25
1.00M
A(G
eV
2)
0.0 0.1 0.2 0.3 0.4 0.5(GeV2)
0.0 0.1 0.2 0.3 0.4 0.5(GeV2)

05/31/2007 Teppei Katori, Indiana University, NuInt '07
36
Fit quality (2 probability) is low for Q2min < 0.2GeV2
MA is stable in wide range of Q2min for Q2min > 0.2GeV2
4. Fit resultsMA only fit with varying Q2min, Q2min < Q2 < 1.0GeV2
Fit is repeated with changing the Q2min
0.6
0.4
0.2
0.0
2 p
roba
bili
ty
1.50
1.25
1.00M
A(G
eV
2)
0.0 0.1 0.2 0.3 0.4 0.5(GeV2)
0.0 0.1 0.2 0.3 0.4 0.5(GeV2)

05/31/2007 Teppei Katori, Indiana University, NuInt '07
37
Modeling Production of Secondary Pions
- 5% Beryllium target
- 8.9 GeV proton beam momentum
HARP collaboration,hep-ex/0702024
Data are fit to a Sanford-Wangparameterization.
3. Neutrino beam
HARP experiment (CERN)

05/31/2007 Teppei Katori, Indiana University, NuInt '07
38
Modeling Production of Secondary Kaons
K+ Data from 10 - 24 GeV.Uses a Feynman ScalingParameterization.
K0 data are also parameterized.
In situ measurementof K+ from LMCagrees within errorswith parameterization
3. Neutrino beam

05/31/2007 Teppei Katori, Indiana University, NuInt '07
39
N
N
25%
Events producing pions
CC+
Easy to tag due to 3 subevents.Not a substantial background to the oscillation analysis.
NC0
The 0 decays to 2 photons,which can look “electron-like” mimicking the signal...
<1% of 0 contribute to background.
N 0
N
8%
(also decays to a single photon with 0.56% probability)
5. Cross section model

05/31/2007 Teppei Katori, Indiana University, NuInt '07
40
K
“Intrinsic” e + e sources:
e+ e (52%)
K+ e+ e (29%) K0 e e (14%)
Other ( 5%)
e/ = 0.5%Antineutrino content: 6%
6. Blind analysis
Since MiniBooNE is blind analysis experiment, we need to constraint intrinsic e background without measuring directly
(1) decay e background(2) K decay e background
e e
K e e

05/31/2007 Teppei Katori, Indiana University, NuInt '07
41
6. Blind analysis(1) measure flux from CCQE event to constraint e background from decay
CCQE is one of the open boxes.Kinematics allows connection to flux, hence intrinsic e background from decay is constraint.
hit tim
e
ener
gy
veto hits
CCQE
NC
high energy
e e
E
(GeV
)
E(GeV)
E = 0.43 E
E-E space

05/31/2007 Teppei Katori, Indiana University, NuInt '07
42
6. Blind analysis(2) measure high energy events to constraint e background from K decay
At high energies, above “signal range” and “e -like” events are largely due to kaon decay
ener
gy
veto hits
CCQE
NC
high energy
K e e
K
signal range
eventsDominated by Kaon decay
example of open boxes;-CCQE - high energy event - CC+
- NC elastics - NC - NC electron scattering - Michel electronetc....
hit tim
e

05/31/2007 Teppei Katori, Indiana University, NuInt '07
43
Handling uncertainties in the analyses:
For a given source of uncertainty,
Errors on a wide rangeof parameters
in the underlying model
For a given source of uncertainty,
Errors in bins of EQE
and information on the correlationsbetween bins
What we begin with... ... what we need
7. Error analysis
Input error matrixkeep the all correlation
of systematics
Output error matrixkeep the all correlation
of EQE bins
"multisim"nonlinear error propagation

05/31/2007 Teppei Katori, Indiana University, NuInt '07
44
Multi-simulation (Multisim) method
many fake experiments with different
parameter set give the variation of
correlated systematic errors for each
independent error matrix
total error matrix is the sum of all
independent error matrix
7. Multisim
+ production (8 parameters)
- production (8 parameters)
K+ production (7 parameters)
K0 production (9 parameters)
beam model (8 parameters)
cross section (20 parameters)
detector model (39 parameters)
dependent
ind
epe
nd
ent
Input error matrices
B.P.Roe, Nucl.,Instrum.,Meth,A570(2007)157

05/31/2007 Teppei Katori, Indiana University, NuInt '07
45
MAQE 6%
Elosf 2%
QE norm 10%
ex) cross section uncertainties
7. Multisim
correlated
uncorrelated
cross section error for EQE
repeat this exercise many times to
create smooth error matrix for EQE
1st cross section model2nd cross section model3rd cross section model ...
n1 n2 n3 n4 n5 n6 n7 n8 EQE (GeV)
QE
n
orm
E lo
MA
cross section parameter space
Input cross section error matrix
)var(00
0)var(),cov(
0),cov()var(
)(
norm
EEM
EMM
xsM loloA
loAA
input

05/31/2007 Teppei Katori, Indiana University, NuInt '07
46
MAQE 6%
Elosf 2%
QE norm 10%
ex) cross section uncertainties
7. Multisim
correlated
uncorrelated
Input cross section error matrix
cross section error for EQE
repeat this exercise many times to
create smooth error matrix for EQE
1st cross section model2nd cross section model3rd cross section model ...
n1 n2 n3 n4 n5 n6 n7 n8 EQE (GeV)
QE
n
orm
E lo
MA
cross section parameter space
)var(00
0)var(),cov(
0),cov()var(
)(
norm
EEM
EMM
xsM loloA
loAA
input

05/31/2007 Teppei Katori, Indiana University, NuInt '07
47
7. MultisimOutput cross section error matrix for EQE
)var(),cov(),cov(
),cov()var(),cov(
),cov(),cov()var(
)(33231
32221
31211
nnnnn
nnnnn
nnnnn
xsM output
cross section error for EQE
Oscillation analysis use output error
matrix for 2 fit;
2 = (data - MC)T (Moutput)-1 (data - MC)
1st cross section model2nd cross section model3rd cross section model ...
n1 n2 n3 n4 n5 n6 n7 n8 EQE (GeV)
MC
j
k
j
S
k
MC
i
k
iijoutput NxsNNxsNS
xsM )()(1
)(

05/31/2007 Teppei Katori, Indiana University, NuInt '07
48
MAQE 6%
Elosf 2%
QE norm 10% QE shape function of Ee/ QE function of E
NC 0 rate function of 0 mom MA
coh, coh ±25% Nrate function of mom + 7% BF
EB, pF 9 MeV, 30 MeVs 10% MA
1 25% MA
N 40% DIS 25%
etc...
determined fromMiniBooNE QE data
determined fromMiniBooNE NC 0 data
ex) cross section uncertainties
determined from other
experiments
7. Multisim