04 - liquefaction rev1
TRANSCRIPT

8/12/2019 04 - Liquefaction Rev1
http://slidepdf.com/reader/full/04-liquefaction-rev1 1/39
4-1
4. LIQUEFACTION AND LATERAL SPREADING
A distinctive feature of the Mw7.1, 4 September 2010 and the Mw6.2, 22 February 2011
earthquakes was the severity and spatial extent of induced liquefaction in native soils (e.g.,
Cubrinovski et al., 2011a,b; Green et al, 2012). Figure 4-1 shows the areas that liquefied in both
events and the associated fault ruptures. While both earthquakes induced extensive liquefaction,the February event was more devastating to central and eastern Christchurch due to the close
proximity of the fault rupture. Immediately after the 22 February 2011 earthquake (i.e., from 23
February to 1 March) an extensive drive-through reconnaissance was conducted to better map
the severity of liquefaction in a consistent and systematic manner. The resulting liquefaction
documentation map is shown in Figure 4-2. Three areas of different liquefaction severity are
indicated: (a) moderate to severe liquefaction (red zones), (b) low to moderate liquefaction
(yellow zones), and (c) liquefaction predominantly on roads with some on properties (pink
zones). Traces of liquefaction were also observed in other areas. The suburbs to the east of the
CBD along the Avon River (Avonside, Dallington, Avondale, Burwood and Bexley) were most
severely affected by liquefaction.
Figure 4-1. Areas of induced liquefaction by the 4 September 2010 (red bordered areas) and 22
February 2011 (white shaded areas) earthquakes and associated fault ruptures (red – fault rupture
with surface trace; blue – fault rupture with no surface trace).

8/12/2019 04 - Liquefaction Rev1
http://slidepdf.com/reader/full/04-liquefaction-rev1 2/39
4-2
Figure 4-2. Liquefaction documentation map of eastern Christchurch from drive-through
reconnaissance.
Brown and Weeber (1992) describe the original site conditions and development of Christchurchas follows: “Originally the site of Chri stchurch was mainly swamp lying behind beach dune
sand; estuaries and lagoons, and gravel, sand and silt of river channel and flood deposits of the
coastal Waimakariri River flood plain. The Waimakariri River regularly flooded Christchurch
prior to stopbank construction and river realignment. Since European settlement in the 1850s,
extensive drainage and infilling of swamps has been undertaken.” Brown and Weeber also state
that surface deposits are actively accumulating and that the present day river channel deposits are
excluded from the above-mentioned Christchurch and Springston formations. As a result, the
near-surface soils are highly variable. Despite this variability, gross features of the near-surface
soil characteristics can be used to explain the performance of observed ground response,
particularly in suburban areas. Figure 4-3 provides a schematic illustration of an east-west cross-
section of the near surface geology of Christchurch taken along Bealey Avenue (i.e. the center of
the city in the East-West direction). As shown it this figure, the water table is only 1 m below the
surface in almost the entire eastern side of the city (with the exception of those colluvium areas
at the base of the Port Hills to the south). Also, the Riccarton gravel horizon, the upmost aquifer
beneath the city, increases with depth going from west to east. Although not shown in Figure 4-
Christchurch CBD
Avon River
Heathcote River
Christchurch Cathedral

8/12/2019 04 - Liquefaction Rev1
http://slidepdf.com/reader/full/04-liquefaction-rev1 3/39
4-3
3, it is also noteworthy that the Springston formation (alluvial gravels, sands and silts) is the
dominant surface layer in the west of Christchurch, and the Christchurch formation (estuarine,
lagoon, beach, dune, and coastal swamp deposits of sand, silt, clay and peat) dominates in the
east. Hence, it can be argued that the significant liquefaction observed in the eastern suburbs of
the city and the absence in the west of the city can be attributed to several contributing factors:
(i) a reduction in the amplitude of ground shaking moving from east to west (Chapter 2); (ii) a
gradual change in surficial soil characteristics; and (iii) an increase in water table depth.
Figure 4-3. East-west cross-section of surface elevation, water table and Riccarton gravel horizon
at Bealey Avenue (Cubrinovski and McCahon, 2011).
This chapter is organized into four main sections: Impact of Liquefaction and Lateral Spreading
on Residential Areas; Impact of Liquefaction and Lateral Spreading on the Central Business
District; Lateral Spreading – Avon River; and In-Situ Test Evaluation of Liquefaction:
Observations vs. Predictions.
Impact of Liquefaction and Lateral Spreading on Residential Areas
In both 4 September 2010 and 22 February 2011 earthquakes widespread liquefaction occurred
in Christchurch and Kaiapoi causing extensive damage to residential properties. The liquefaction
manifested as massive sand boils and large amount of sand/silt ejecta and water littering streets
(e.g., Figure 4-4), residential properties, and recreation grounds. Nearly 15,000 residential houses
and properties were severely damaged due to liquefaction and lateral spreading, more than half
of those beyond an economical repair.

8/12/2019 04 - Liquefaction Rev1
http://slidepdf.com/reader/full/04-liquefaction-rev1 4/39
4-4
Figure 4-4. Example of severe liquefaction near the intersection of Shortland St and Rowses Rd
in the eastern suburb of Aranui. Note the high water marks on the car door window.
(-43.521919°, 172.701885°, photo courtesy of Mark Lincoln, nzraw.co.nz)
The distribution of liquefied areas shown in Figures 4-1 and 4-2 reflects the combined effects of
the low resistance of the soil to liquefaction (loose cohesionless soil with high water table) and
the intensity of the ground motions. The suburbs most severely affected by liquefaction in
Christchurch were along the Avon River to the east and northeast of CBD (Avonside, Dallington,Avondale, Burwood, and Bexley). The soils in these suburbs are predominantly loose fluvial
deposits of liquefiable clean fine sands and sands with non-plastic silt. The top 5-6 m are in a
very loose state, with CPT tip resistances, qc, of about 2-4 MPa. The resistance typically
increases to 7-12 MPa at depths between 6 and 10 m, however lower resistances are often
encountered in areas close to wetlands. The more extensive liquefaction observed in these areas
during the February 2011 earthquake is consistent with the fact that the seismic loading was
about 1.5 to 2.0 times higher during the February event than the September 2010 earthquake. On
the contrary however, at the southwest end of the city in Hoon Hay and Halswell, more extensive
liquefaction occurred during the 2010 Darfield earthquake due to the more intense shaking
experienced in this region during that event.
Examples of damage as a result of liquefaction in the residential areas are presented in Figure 4-
5, with the volume of ejected material in residential properties indicated by the piles of sand in
Figure 4-5a, a typical view in many streets following the Christchurch earthquake. Figure 4-5b
provides a good indication of the flooding and ejected material in the streets themselves
immediately following the earthquake. The large sand boils in Figure 4-5c, about 20-30 m long

8/12/2019 04 - Liquefaction Rev1
http://slidepdf.com/reader/full/04-liquefaction-rev1 5/39

8/12/2019 04 - Liquefaction Rev1
http://slidepdf.com/reader/full/04-liquefaction-rev1 6/39
4-6
(a) (b)
Figure 4-6. Illustration of a house in North Kaiapoi which sustained liquefaction in both the (a) 4
September 2010 Darfield; and (b) 22 February 2011 Christchurch earthquakes. (-43.38535°,
172.6701°)
Due to the continued threat of the recurrence of liquefaction, the Canterbury Earthquake
Recovery Authority (CERA) has divided Christchuch and its environs into four zones: Red,
Orange, Green, and White. The zoning was based on observed performance during the
earthquake sequence and in-situ geotechnical tests. Detailed information about each of the zones
is copied and pasted from the CERA website below. However, in brief, Red Zone =
uneconomical to rebuild at this time; Orange Zone = further assessment is required prior to
rebuilding; Green Zone = rebuild at will; and White Zone = area not yet assessed. Maps of the
zones for Christchurch and Kaiapoi are presented in Figure 4-7. As may be observed fromcomparing Figures 4-1 and 4-7, there is a close coincidence in the Red Zones marked in Figure
4-7 and areas that are identified in Figure 4-1 as having liquefied during both the Darfield and
Christchurch earthquakes. In Christchurch, these areas largely lay along the Avon River and its
abandoned channels (i.e., the neighborhoods of Avonside, Dallington, Burwood, Avondale, and
Bexley). Additionally, the subdivision of Bexley also is designated as a Red Zone. This
subdivision was built on fill and experienced up to 1 m of subsidence during the February
earthquake, significantly increasing the flood hazard for the neighbourhood. In Kaiapoi, these
areas lay along the Kaiapoi River and Courtenay Stream and their abandoned channels
(Wotherspoon et al., 2011).

8/12/2019 04 - Liquefaction Rev1
http://slidepdf.com/reader/full/04-liquefaction-rev1 7/39
4-7
(a)
(b)
Figure 4-7. Rebuilding zonation maps: (a) Kaiapoi, and (b) Christchurch.
(http://cera.govt.nz/static/land-zone-map/)

8/12/2019 04 - Liquefaction Rev1
http://slidepdf.com/reader/full/04-liquefaction-rev1 8/39
4-8
Detailed description of the zone classifications copied and pasted from
(http://cera.govt.nz/static/land-zone-map/) are given below.
Red Zones: The criteria for defining areas as residential red zone are:
There is significant and extensive area wide land damage;
The success of engineering solutions may be uncertain in terms of design, it’s success
and possible commencement, given the ongoing seismic activity; and
Any repair would be disruptive and protracted for landowners.
If your property is categorised as red, key points to note are:
It is not feasible to rebuild on this land at the present time;
Wide scale land remediation would take a considerable period of time, the social
dislocation of such massive works would see homeowners out of their homes for at least
three years, and in some cases more than five years;
In some areas remediation would require up to three metres of compacted fill to bring theland up to compliant height, along with many kilometres of perimeter treatment;
In addition, a complete replacement of essential infrastructure like sewer, water,
electricity and roading would be required;
Full land repair in these areas may mean that every house would need to be removed,
regardless of its degree of present building damage; and
Even if full land repair was viable, the resulting ongoing social dislocation would have
major impacts on schooling, transport and employment for whole communities.
Orange Zones: Land classified as orange means engineers need to undertake furtherinvestigation. If your property is classified as orange, key points to note are:
The orange mapped areas are where engineers need to undertake further investigation;
Some of the damage in these areas is a direct result of the magnitude 5.6 and 6.3
earthquakes which struck on 13 June, and has not yet been adequately assessed to provide
residents with certainty;
Orange zones will progressively be classified following the outcomes of further
investigations.
Green Zones: Land classified as green means that homes are suitable for repair and rebuild. If
your property is categorised as green, key points to note are:
Land generally suitable for houses to be repaired or rebuilt;
Property owners should talk directly with their insurer or EQC about repairs;
Property owners no longer have to wait for the results of any area-wide land assessment
reports by EQC or their engineering consultants Tonkin & Taylor;

8/12/2019 04 - Liquefaction Rev1
http://slidepdf.com/reader/full/04-liquefaction-rev1 9/39
4-9
There will be some isolated exceptions where geotechnical assessments will be required
due to major land damage;
Repair and rebuilding work should take into consideration the risk of ongoing
aftershocks, so some finishing tasks such as brick and driveway concrete laying should be
delayed until that risk decreases.
White Zone: If your property is classified as white, key points to note are:
These areas are still being mapped or are not residential;
In the Port Hills, an extensive geotechnical investigation is underway;
Land issues – rockfalls – are of a different nature than to those on the plains;
No timeframes have been set for these areas.
Impact of Liquefaction and Lateral Spreading on the Central Business District
The 22 February 2011 earthquake produced strong ground motions within the central business
district (CBD) of Christchurch, which is the central heart of the city just east of Hagley Park and
encompasses approximately 200 ha. Some of the recorded ground motions had 5% damped
spectral accelerations that surpassed the 475-year return period design motions by a factor of
two. Ground shaking caused substantial damage to a large number of buildings. It caused
widespread liquefaction and lateral spreading in areas within the CBD, particularly along the
stretch of the Avon River that runs through the city. The liquefaction and lateral spreading
adversely affected the performance of many multi-storey buildings resulting in global and
differential settlements, lateral movement of foundations, tilt of buildings, and bearing failures.
The February earthquake was more devastating to the CBD from a geotechnical perspective than
the September 2010 earthquake because the latter event did not cause significant liquefaction-
within the CBD.
Ten days after the 22 February earthquake, after the urban search and rescue efforts had largely
finished, the team initiated a comprehensive ground survey within the CBD to document
liquefaction effects in this area. This section of the chapter summarizes the key field
observations made by the team.
Chr istchurch Centr al Business Di str ict
The CBD is the area encompassed by the four avenues, Rolleston to the west, Bealey to the
north, Fitzgerald to the east, and Moorhouse to the south. The CBD is relatively denselydeveloped, including multi-storey buildings in its central area, a relatively large number of
historic masonry buildings dating from the late 19th
and early 20th
century, residential buildings
(typically two- to five-storey structures located north of Kilmore Street), and some industrial
buildings in the south and southeastern part of the CBD. In total, about 3,000 buildings of
various heights, age, and structural systems were within the CBD boundaries before the 2010-
2011 earthquakes. Latest estimates indicate that about 1,000 of these buildings will have to be
8/12/2019 04 - Liquefaction Rev1
http://slidepdf.com/reader/full/04-liquefaction-rev1 10/39
4-10
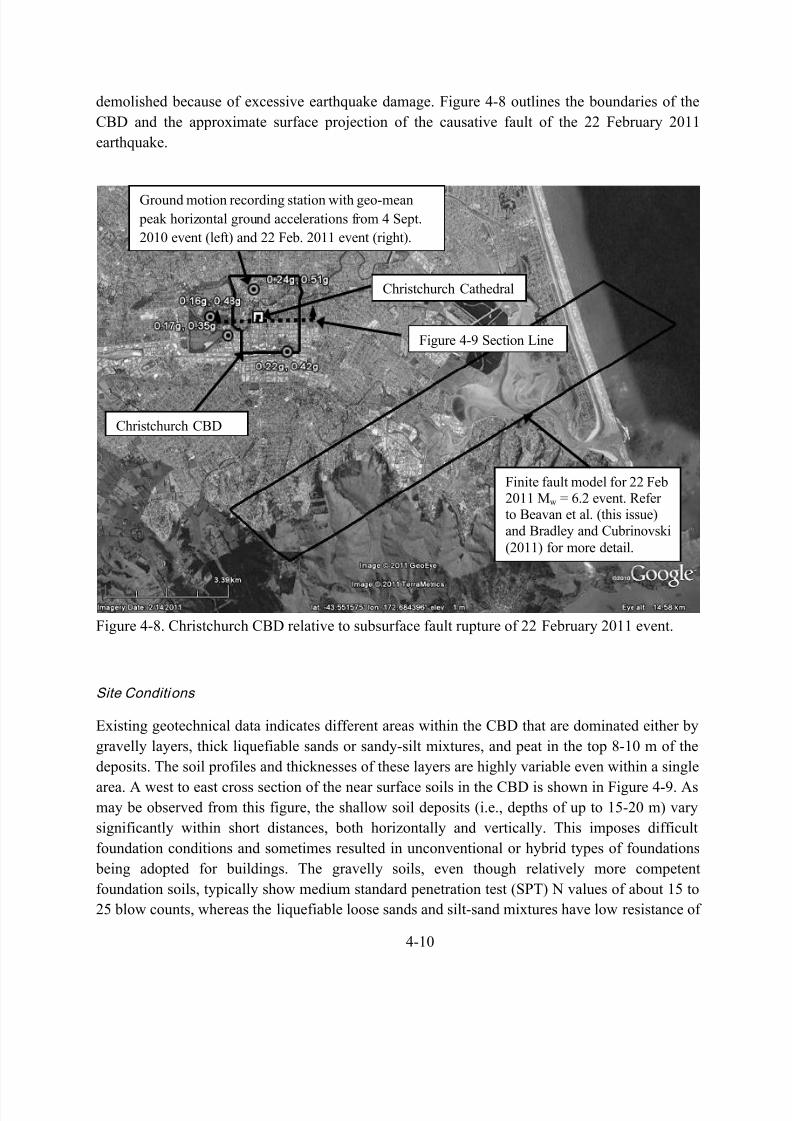
demolished because of excessive earthquake damage. Figure 4-8 outlines the boundaries of the
CBD and the approximate surface projection of the causative fault of the 22 February 2011
earthquake.
Figure 4-8. Christchurch CBD relative to subsurface fault rupture of 22 February 2011 event.
Site Conditions
Existing geotechnical data indicates different areas within the CBD that are dominated either by
gravelly layers, thick liquefiable sands or sandy-silt mixtures, and peat in the top 8-10 m of the
deposits. The soil profiles and thicknesses of these layers are highly variable even within a single
area. A west to east cross section of the near surface soils in the CBD is shown in Figure 4-9. Asmay be observed from this figure, the shallow soil deposits (i.e., depths of up to 15-20 m) vary
significantly within short distances, both horizontally and vertically. This imposes difficult
foundation conditions and sometimes resulted in unconventional or hybrid types of foundations
being adopted for buildings. The gravelly soils, even though relatively more competent
foundation soils, typically show medium standard penetration test (SPT) N values of about 15 to
25 blow counts, whereas the liquefiable loose sands and silt-sand mixtures have low resistance of
Christchurch Cathedral
Finite fault model for 22 Feb2011 Mw = 6.2 event. Referto Beavan et al. (this issue)
and Bradley and Cubrinovski
(2011) for more detail.
Christchurch CBD
Ground motion recording station with geo-mean
peak horizontal ground accelerations from 4 Sept.
2010 event (left) and 22 Feb. 2011 event (right).
Figure 4-9 Section Line

8/12/2019 04 - Liquefaction Rev1
http://slidepdf.com/reader/full/04-liquefaction-rev1 11/39
4-11
less than N=12 or cone penetration test (CPT) qc values less than 3-6 MPa. The water table is
generally within 1.5 to 2.0 m of the ground surface within the CBD. However, as mentioned
above and shown in Figure 4-3, the Riccarton gravel horizon is the upmost aquifer beneath the
city, with artesian water pressures, and is at a depth of approximately 22 m below the CBD. This
imposed additional restrictions on the use of deep foundations and their associated cost.
Additionally, the upward gradient potentially adversely affected the liquefaction resistance of the
overlying soils by increasing the pore water pressures in these soils during the 2010-2011
earthquakes.
Figure 4-9. Representative subsurface cross section of Christchurch CBD along Hereford Street
(reproduced and modified from I. McCahon, personal communication, 19 July, 2011).

8/12/2019 04 - Liquefaction Rev1
http://slidepdf.com/reader/full/04-liquefaction-rev1 12/39
4-12
Ground Motions and Observed Liquefaction
The Mw7.1, 4 September 2010 Darfield earthquake was caused by a complex rupture of several
fault segments, the largest and nearest to Christchurch being on the Greendale fault about 20 km
west of the CBD. The maximum horizontal peak ground acceleration (PGA) recorded in the
CBD was 0.24 g, with the PGA decreasing generally with distance downstream along the AvonRiver. The Mw6.2, 22 February 2011 Christchurch earthquake was less than 10 km from the
CBD along the southeastern perimeter of the city in the Port Hills (Figures 4-1 and 4-8). The
close proximity of this event caused higher intensity shaking in the CBD than the Darfield
earthquake. Several of the recordings exhibited significant forward-directivity velocity pulses. In
the CBD, horizontal PGAs of between 0.37 g and 0.52 g were recorded. There are four strong
motion stations located within or very close to the CBD (Figure 4-8). The recorded PGAs at
these four stations are summarized in Table 4-1 for the five earthquakes producing highest
accelerations (Bradley and Cubrinovski, 2011).
Table 4-1. Geometric mean PGAs and adjusted cyclic stress ratios to M w7.5 earthquake (CSR 7.5)
for four strong motion stations within/close to CBD, for five earthquakes in the period
September 2010 – June 2011
Event
Geometric Mean PGA (g) Cyclic Stress Ratio CSR 7.5a) Magnitude
Scaling Factor
MSF b)CBGS CCCC CHHC REHS CBGS CCCC CHHC REHS
4 SEP 10
Mw7.1 0.158 0.224 0.173 0.252 0.089 0.127 0.098 0.142 1.15
26 DEC 10
Mw4.8 0.270 0.227 0.162 0.245 0.097 0.082 0.058 0.088 1.80
22 FEB 11
Mw6.3 0.501 0.429 0.366 0.522 0.199 0.170 0.145 0.208 1.63
13 JUN 11
Mw5.3 0.183 - 0.199 0.188 0.066 - 0.072 0.068 1.80
13 JUN 11
Mw6.0 0.163 - 0.215 0.264 0.060 - 0.079 0.097 1.77
a) CSR 7.5 = 0.65 (PGA/g)/MSF at depth of groundwater b) MSF = 102.24/Mw
2.56 ≤ 1.8 (corresponding to the lower bound range recommended in Youd et al. (2001), with a
cap of 1.8)
At shallow depths in the deposits, the variation in the recorded PGA values corresponds closely
with variations in the cyclic stress ratio (CSR) for each of these events. Magnitude scaling
factors can then be applied to adjust each calculated CSR value to an equivalent value for a
Mw7.5 event (CSR M7.5) as summarized in Table 4-1 for the geometric mean horizontal values of
the PGA (Bradley and Cubrinovski, 2011). The data show that in addition to the high PGAs

8/12/2019 04 - Liquefaction Rev1
http://slidepdf.com/reader/full/04-liquefaction-rev1 13/39
4-13
during the February earthquake (PGA = 0.37-0.52 g), the CBD buildings were subjected to
significant PGAs in the range of 0.16-0.27 g in four additional events. The highest adjusted
CSR 7.5 values of 0.14-0.20 were obtained for the Mw6.2, 22 February 2011 earthquake, which
were about 1.6 times the corresponding CSR-values from the Mw7.1, 4 September 2010 Darfield
earthquake. Widespread liquefaction occurred only during the 22 February 2011 earthquake in
the CBD. Figure 4-10 shows a preliminary liquefaction map for the CBD for the February
earthquake (Cubrinovski et al., 2011b).
Figure 4-10. Preliminary liquefaction map indicating zones of weakness and locations of
buildings discussed in the paper. (Cubrinovski et al., 2011b)
Even though the map shown in Figure 4-10 distinguishes the zone most significantly affected by
liquefaction, the severity of liquefaction within this zone was not uniform. The manifestation of
liquefaction was primarily of moderate intensity (Figure 4-11a). However, there were also areas
of low manifestation or only traces of liquefaction, and also pockets of severe liquefaction with
very pronounced ground distortion, fissures, large settlements, and substantial lateral ground
movements (Figure 4-11b). This non-uniformity in liquefaction manifestation reflects the
complex and highly variable soil conditions even within the CBD principal liquefaction zone.
Survey maps of Christchurch dating back to the time of early European settlement (1850’s) show
a network of streams and swamps scattered across this area (Archives New Zealand, 2011).
Christchurch Cathedral
Moderate to severe
liquefaction zone indicated
with red shading.
Geomorphic feature
Avon River

8/12/2019 04 - Liquefaction Rev1
http://slidepdf.com/reader/full/04-liquefaction-rev1 14/39
4-14
(a) (b)
Figure 4-11. Representative areas of: (a) moderate liquefaction (7 Mar 2011; -43.52791°,
172.63653°), and (b) severe liquefaction within the CBD principal liquefaction zone (4 Mar
2011; -43.52604°, 172.63839°).
The northern extent of the liquefaction zone, which is shown by the black solid line in Figure 4-
10, is a clearly defined geomorphic boundary running east-west that was delineated by a slight
change in elevation of about 1 m to 1.5 m over an approximately 2 m to 10 m wide zone before
the earthquakes. After the February event, it was further characterized by ground fissuring or
distortion associated with localized spreading, as well as gentle slumping of the ground surface
on the down-slope side. Ground cracks, fissures, and a distorted pavement surface marked this
feature, which runs continuously through properties and affected a number of buildings causing
cracks in both the foundations and superstructures. Liquefaction and associated ground
deformation were pronounced and extensive on the down-slope side between the identified
geomorphic feature and the Avon River, but noticeably absent on the slightly higher elevation to
the north (upslope side away from the river). This feature is thought to delineate the extent of a
geologically recent river meander loop characterized by deposition of loose sand deposits under
low velocity conditions. A similar geomorphic feature was observed delineating the boundary
between liquefaction damage and unaffected ground within a current meander loop of the river to
the east of this area (Oxford Terrace between Barbadoes Street and Fitzgerald Avenue).
Impact of Liquefaction and/or L ateral Spreading on Structur es
Described below are select cases where structures were impacted by liquefaction and/or lateralspreading.
1. Ground Failure Effects on Nearly Identical Structures – East Salisbury Area
A mini-complex of three nearly identical buildings (with one small but important difference) is
shown in Figure 4-12. The buildings are three-storey structures with a garage at the ground floor,
constructed on shallow foundations. This case clearly illustrates the impact of liquefaction, as the

8/12/2019 04 - Liquefaction Rev1
http://slidepdf.com/reader/full/04-liquefaction-rev1 15/39
4-15
nearly identical structures have been built across the east-west trending geomorphic feature
identified previously in Figure 4-10, with one building located on the higher level to the north
suffering no damage, and the buildings located below the crest suffering progressively higher
amounts of damage. This geomorphic feature, which is expressed here by a significant change in
grade of the pavement between the northern and middle buildings, is shown in Figure 4-13. The
northern building that sits on the higher ground showed no evidence of cracking and distortion of
the pavement surface. Conversely, large sediment ejecta were found along the perimeter of the
southern building indicating severe liquefaction in its foundation soils (Figure 4-12b).
Liquefaction features were also observed near the middle building, but the resulting distress of
this building was significantly less than that of the southern building. The southern building had
a shortened end wall with a column at its southwest corner, which appeared to have experienced
additional settlement at the location of the column’s concentrated load. The building suffered
differential settlement of about 40 cm and more than 3 degrees of tilt towards the west-
southwest, which is visible in Figure 4-12a.
(a) (b)
Figure 4-12. Apartment complex: (a) looking south from northern building showing tilt of
southern building, and (b) looking north at liquefaction feature at edge of southern building (7
Mar 2011; -43.52434°, 172.64432°).
Liquefaction induced
sediment ejecta.

8/12/2019 04 - Liquefaction Rev1
http://slidepdf.com/reader/full/04-liquefaction-rev1 16/39

8/12/2019 04 - Liquefaction Rev1
http://slidepdf.com/reader/full/04-liquefaction-rev1 17/39
4-17
(a) (b)
Figure 4-14. Duplex housing complex: (a) looking north at center building, and (b) close-up of
ground settlement next to center building (16 Mar 2011; -43.52399°, 172.64417°).
2. Punching Settlement - Madras-Salisbury-Peterborough Area
Several buildings with shallow foundations located within the liquefied zone underwent
punching settlements with some undergoing significant differential settlements and bearing
capacity failures. An example of such performance is shown in Figure 4-15 for a two-storey
industrial building located 200 m south-west of the buildings discussed previously. There are
clear marks of the mud-water ejecta on the walls of the building indicating about 25-cm-thick
layer of water and ejected soils due to the severe liquefaction. Note the continuous sand ejecta
around the perimeter of the footing and signs of punching shear failure mechanism in Figure 4-
15. At the front entrance of the building large ground distortion and sinkholes were created due
to excessive pore water pressure and upward flow of water. Settlement of the building around its
perimeter was evident and appeared substantially larger than that of the surrounding soil that was
unaffected by the building. The building settled approximately 25 cm relative to a fence at its
southeast corner and settled 10-20 cm relative to the ground at its northwest corner. The ground
floor at the entrance was uplifted and blistered which is consistent with the pronounced
settlement beneath the walls along the perimeter of the building.
Focus area of Fig. 4-14b Exposed
foundation
Pavement level
prior to 22 Feb
2011 event

8/12/2019 04 - Liquefaction Rev1
http://slidepdf.com/reader/full/04-liquefaction-rev1 18/39
4-18
Figure 4-15. Two-story building that underwent liquefaction-induced punching movements
(7 Mar 2011; -43.52506°, 172.64176°).
3. Differential Settlement and Sliding - Armagh-Madras Area
Farther to the south, at the intersection of Madras and Armagh Streets, several buildings were
affected by severe liquefaction that induced significant differential settlements or lateral
movements. At this location, the liquefaction was manifested by a well-defined, narrow zone of
surface cracks, fissures, and depression of the ground surface about 50 m wide, as well as water
and sand ejecta (Figure 4-16). This zone stretches from the Avon River to the north toward the
buildings affected by this liquefaction feature, shown in the background of Figure 4-16, to thesouth. Traces of liquefaction were evident further to the south of these buildings.
The building shown in Figure 4-17 is a three-storey structure on shallow foundations that settled
substantially at its front, resulting in large differential settlements that tilted the building about 2
degrees. The building was also uniformly displaced laterally approximately 15 cm toward the
area of significant liquefaction near the front of the building (i.e., to the north). There was a large
volume of sand ejecta at the front part of the building with ground tension cracks propagating
east of the building and in the rear car-park that are consistent with the lateral movement of the
building toward the north.
Observed liquefaction features

8/12/2019 04 - Liquefaction Rev1
http://slidepdf.com/reader/full/04-liquefaction-rev1 19/39
4-19
Figure 4-16. Relatively narrow liquefaction-induced feature that traverses parking lot northeast
of the intersection of Madras and Armagh streets (24 Mar 2011; -43.52842°, 172.64308°).
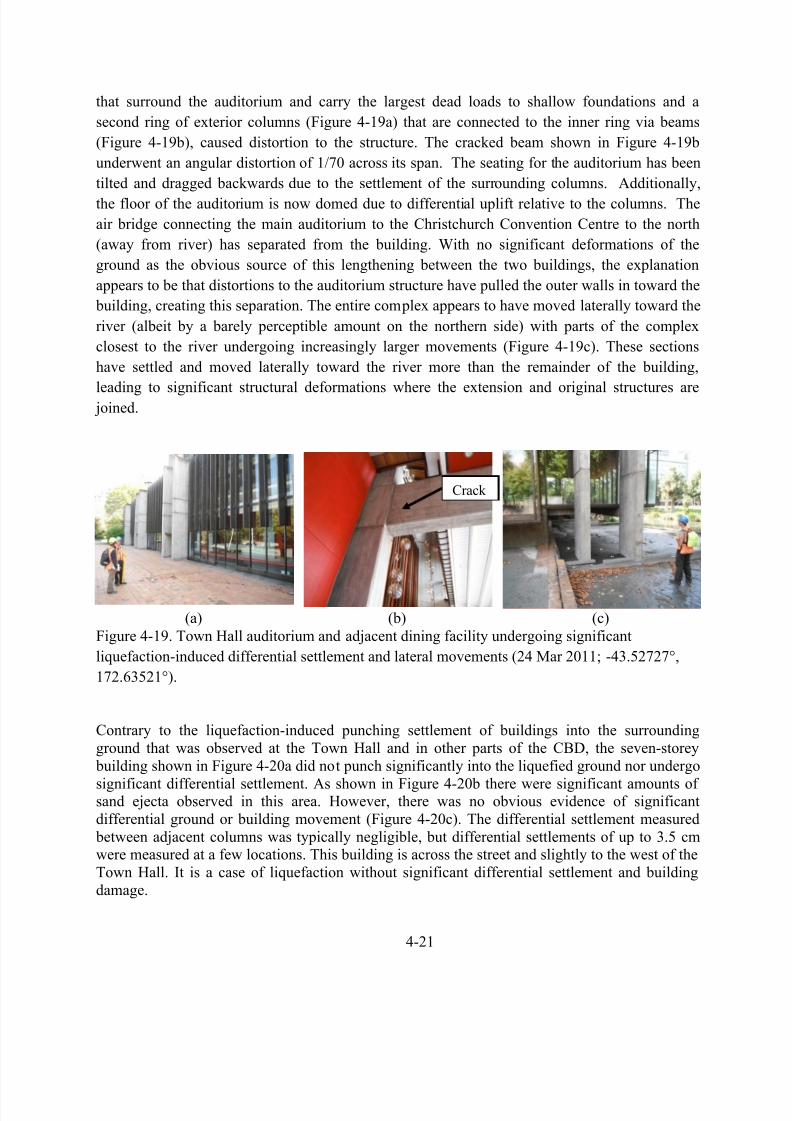
(a) (b)
Figure 4-17. Liquefaction-induced differential settlement and sliding of building in the CBD (24
Mar 2011; -43.52878°, 172.64252°).
The building shown in Figure 4-18 is immediately across the street to the north. It is a six-storey
building on isolated footings with tie beams and perimeter grade beam. The isolated footings are
2.4 m x 2.4 m and 0.6 m deep. Figure 4-18 shows the view of the building looking toward the
west and indicates total settlements measured relative to the building to its north, which did not
appear to settle. Starting from its northern edge and proceeding south, the differential settlement
is 1 cm for the first span, 1 cm for the second span, then 3 cm, 9 cm, and 11 cm, respectively, for
Structure shown
in Fig. 4-17
Structure shown
in Fig. 4-18
1.8 deg
15 cmGround cracking due to lateral displacements

8/12/2019 04 - Liquefaction Rev1
http://slidepdf.com/reader/full/04-liquefaction-rev1 20/39
8/12/2019 04 - Liquefaction Rev1
http://slidepdf.com/reader/full/04-liquefaction-rev1 21/39

8/12/2019 04 - Liquefaction Rev1
http://slidepdf.com/reader/full/04-liquefaction-rev1 22/39
4-22
(a) (b) (c)
Figure 4-20. Building in area of significant liquefaction that displays negligible to minor
differential settlement or punching settlement (24 Mar 2011; -43.526508°, 172.634646°).
5. Contrasting Performance of a Pile-Supported Structure - Kilmore Area
Several pile-supported structures were identified in areas of severe liquefaction. Although
significant ground failure occurred and the ground surrounding the structures settled, the
buildings supported on piles typically suffered less damage. However, there are cases where pile-
supported structures were damaged in areas that underwent lateral spreading near the Avon
River. In other cases, such as the building shown in Figure 4-21, which is located approximately
200 m to the east from the Town Hall, the ground-floor garage pavement was heavily damaged
in combination with surrounding ground deformation and disruption of buried utilities. The
settlement of the surrounding soils was substantial, with about 30 cm of ground settlement on the
north side of the building and up to 17 cm on its south side. The first-storey structural frame of
the building that was supported by the pile foundation with strong tie-beams did not showsignificant damage from these liquefaction-induced ground settlements.
Across from this building to the north is a seven-storey reinforced concrete building on shallow
spread footing foundations that suffered damage to the columns at the ground level. This
building tilted toward the southeast as a result of approximately 10 cm differential settlement
caused by the more severe and extensive liquefaction at the south-southeast part of the site. It is
interesting to note that in the vicinity of this building, the site contained areas that liquefied
during the 4 September 2010 earthquake. Following the extensive liquefaction in the 22 February
2011 event, there was also significant liquefaction in some areas during the 13 June 2011
earthquakes.

8/12/2019 04 - Liquefaction Rev1
http://slidepdf.com/reader/full/04-liquefaction-rev1 23/39
4-23
(a) (b)
Figure 4-21. Building on pile foundations in area of severe liquefaction showing large settlement
of the surrounding soils relative to the foundation beams (4-6 Mar 2011; -43.526575°,
172.638668°).
6. Presence of Shallow Gravelly Soils - Victoria Square
Near Victoria Square, the liquefied zone was composed predominantly of relatively deep loose
sand deposits that transitioned relatively sharply into a zone where gravelly soil layers reach
close to the ground surface. Shallow foundations (spread footings and rafts) for many of the
high-rise buildings in this latter area are supported on these competent gravelly soils. However,
the ground conditions are quite complex in the transition zone, which resulted in permanent
lateral movements, settlements, and tilt of buildings either on shallow foundations or hybridfoundation systems, as illustrated in Figure 4-22. Immediately to the north of these buildings, the
liquefaction was severe with massive sand ejecta; however, approximately 100 m and further to
the south where the gravels predominate, there was neither evidence of liquefaction on the
ground surface nor visible distress of the pavement surface. Again, it appears that the ground and
foundation conditions have played a key role in the performance of these buildings, which
therefore have been selected for in-depth field investigations.
Foundation beam30 cm
30 cm 17 cm

8/12/2019 04 - Liquefaction Rev1
http://slidepdf.com/reader/full/04-liquefaction-rev1 24/39
4-24
Figure 4-22. Buildings on shallow and hybrid foundations in transition area from moderate
liquefaction to low/no liquefaction; arrows indicate direction of tilt of the buildings (7 Mar 2011;
-43.52878°, 172.63528°).
Lateral Spreading – Avon River
Along the Avon River, particularly to the east of CBD, lateral spreading occurred, causing
horizontal displacements at the river bank on the order of several tens of centimeters to morethan two meters. At ten locations along the Avon River, where lateral spreading measurements
were conducted after the September 2010 earthquake, measurements of lateral spreading
displacements were carried out again after the February earthquake. It was found that the
permanent lateral displacements were two to three times the displacement measured after the
September earthquake, indicating increased spreading movement which is in agreement with the
more severe liquefaction observed in these areas during the February event. Ground surveying
indicated that ground cracks associated with lateral spreading extended as far as 100-200 meters
from the river, while other aerial observation methods suggest that the effects of spreading might
have been even beyond these distances. An example of lateral spreading along the Avon River is
shown in Figure 4-23.

8/12/2019 04 - Liquefaction Rev1
http://slidepdf.com/reader/full/04-liquefaction-rev1 25/39

8/12/2019 04 - Liquefaction Rev1
http://slidepdf.com/reader/full/04-liquefaction-rev1 26/39
4-26
modified version of the one proposed by Sowers and Hedges (1966). The modifications to
Sowers and Hedges (1966) relationship are specific to the soils in the Canterbury region and are
based on comparing the NDCPT values to SPT N-values, Cone Penetration Test (CPT) tip
resistance, and shear wave velocity measurements made near the DCP test sites.
Figure 4-24. DCP test being performed adjacent to a house in Bexley after the Mw7.1, 4
September 2010 Darfield earthquake. Brady Cox is working the hammer. (13 Sept 2010,-43.51837°, 172.72205°)
Following the procedure outlined in Olson et al. (2011), the SPT equivalent N-values (NSPTequiv)
values were normalized for effective overburden stress and hammer energy using the following
relationship:
%60'
5.0
60,1
ER P N N N
vo
a DCPT equivSPT equivSPT
(1)
where NSPT equiv(NDCPT) is the functional relationship between NSPT and NDCPT shown in Figure 4-
25a, Pa is atmospheric pressure (i.e., 101.3 kPa), 'vo is initial vertical effective stress (in the
same units as Pa), and ER is energy ratio. This relationship uses the effective stress and hammer
energy normalization schemes outlined in Youd et al. (2001).

8/12/2019 04 - Liquefaction Rev1
http://slidepdf.com/reader/full/04-liquefaction-rev1 27/39
4-27
Although the energy ratio for the system was not measured, the DCP hammer is similar to the
donut hammer used for the SPT. Skempton (1986) and Seed et al. (1984) suggested that the
energy ratio for an SPT donut hammer system ranges from about 30 to 60%. However, because
the DCP system does not have pulleys, a cathead, etc., we anticipate that the energy ratio for the
DCP is likely to be near the upper end of this range. Therefore, we assumed an ER = 60% for our
calculations. In addition to the effective stress and hammer energy corrections, the NSPT equiv
values were also corrected for fines content following the procedure proposed in Youd et al.
(2001). Figure 4-25b shows a plot of NDCPT and N1,60cs-SPTequiv for a test site in the eastern
Christchurch neighborhood of Bexley, which experienced severe liquefaction during both the
Darfield and Christchurch earthquakes.
(a) (b)
Figure 4-25. (a) Relationship between DCP test and SPT N-values; and (b) comparison of NDCPT and the equivalent N1,60cs (N1,60cs-SPTequiv) for a test site in Bexley.
In total, 30 DCP tests were performed across Christchurch and its environs after the Darfield and
Christchurch earthquakes. Figure 4-26 shows the locations of these test sites. In addition to the
Darfield and Christchurch earthquakes, the DCP has been used on several other recent post-
earthquake investigations to evaluate deposits that liquefied (e.g., the Mw6.3, 2008 Olfus, Iceland
earthquake, the Mw7.0, 2010 Haiti earthquake, the Mw8.8, 2010 Maule, Chile earthquake, and the
Mw5.8, 2011 Central Virginia, USA earthquake).

8/12/2019 04 - Liquefaction Rev1
http://slidepdf.com/reader/full/04-liquefaction-rev1 28/39
4-28
Figure 4-26. Locations of DCP test sites performed after either the Darfield or Christchurch
earthquakes.
Spectral Analysis of Surf ace Waves (SASW)
The Spectral Analysis of Surface Waves (SASW) method is used to determine the shear wave
velocity (VS) profile at sites tested. The SASW method is widely accepted and has been used to
characterize the subsurface shear stiffness of soil and rock sites for the past 20-plus years (e.g.,
Nazarian and Stokoe, 1984; Stokoe et al., 1994; 2003; 2004; Cox and Wood, 2010; Cox andWood, 2011; Wong et al., 2011). In particular, the SASW method has often been applied in
geotechnical earthquake engineering to characterize materials for near-surface site response
analyses (e.g., Rosenblad et al., 2001; Wong and Silva, 2006) and soil liquefaction analyses (e.g.,
Andrus and Stokoe 2001). The SASW test is a non-intrusive, active source seismic method that
utilizes the dispersive nature of Rayleigh-type surface waves propagating through a layered
material to infer the subsurface VS profile of a site.
The SASW field measurements in this study were made using three 4.5 Hz geophones, a
‘pocket- portable’ dynamic signal analyzer, and a sledge hammer. Figure 4-27 shows the test
setup at a site in South Kaiapoi. The geophones were model GSC-11D’s manufactured by GeoSpace Technologies, while the analyzer was a Quattro system manufactured by Data Physics
Corporation. The Quattro is a USB-powered, 4-input channel, 2-output channel dynamic signal
analyzer with 205 kHz simultaneous sampling rate, 24 bit ADC, 110 dB dynamic range, and 100
dB anti-alias filters. It is controlled with a flexible, windows-based software package (Data
Physics Signal Calc) that has measurement capabilities in both the time and frequency domains.
The compact, highly portable nature of this setup is ideal for earthquake reconnaissance efforts

8/12/2019 04 - Liquefaction Rev1
http://slidepdf.com/reader/full/04-liquefaction-rev1 29/39
4-29
where shallow VS profiles are desired. At most locations, receiver spacings of approximately
0.61, 1.22, 2.44, 4.88, 6.10, and 12.20 m were used to collect surface wave data. These tests took
less than 45 minutes per location and typically enabled VS profiles to be generated down to 6.1-
9.1 m below the surface. In total, 36 SASW tests were performed across Christchurch and its
environs after the Darfield and Christchurch earthquakes. Figure 4-28 shows the locations of the
SASW test sites.
Figure 4-27. SASW setup at a site in South Kaiapoi. Liam Wotherspoon working the hammer.
(12 Sept 2010; -43.39001°; 172.66264°)
Spectral analysis was used to separate the measured surface waves by frequency and wavelength
to determine the experimental (“field”) dispersion curve for the sites via phase unwrapping. An
effective/superposed-mode inversion that takes into account ground motions induced by
fundamental and higher-mode surface waves as well as body waves (i.e., a full wavefield

8/12/2019 04 - Liquefaction Rev1
http://slidepdf.com/reader/full/04-liquefaction-rev1 30/39
4-30
solution) was then used to match theoretically the field dispersion curve with a one-dimensional
(1D) layered system of varying layer stiffnesses and thicknesses (Roesset et al., 1991; Joh,
1996). The 1D VS profile that generated a dispersion curve that best matched the field dispersion
curve was selected as the site profile. Per Youd et al. (2001), the VS profiles were then
normalized for effective overburden stress using the following relationship:
25.0
1'
vo
aS s
P V V
(2)
where VS1 is the shear wave velocity normalized to 1 atm effective stress, P a is atmospheric
pressure (i.e., 101.3 kPa), and 'vo is initial vertical effective stress (in the same units as P a).
Figure 4-29 shows a plot of VS and VS1 for a test site in the eastern Christchurch neighborhood
of Bexley, which experienced severe liquefaction during both the Darfield and Christchurch
earthquakes. Also plotted in this figure is the empirically determined upper-bound VS1 for
liquefiable soils (i.e., soils having VS1 > V
*
S1 will not liquefy regardless of the intensity ofshaking imposed on them).
Figure 4-28. Locations of SASW test sites performed after either the Darfield or Christchurch
earthquakes.
Estimation of PGAs at DCP and SASW Test Sites
As discussed in the next section, the in-situ test data described above correlates to the ability of
the soil to resist liquefaction (i.e., capacity). However, to evaluate liquefaction potential, both the
soil’s ability to resist liquefaction and the demand imposed on the soil by the earthquake needs to

8/12/2019 04 - Liquefaction Rev1
http://slidepdf.com/reader/full/04-liquefaction-rev1 31/39
4-31
be known. For the approach used herein to evaluate liquefaction potential (i.e., stress-based
simplified procedure), the amplitude of cyclic loading correlates to the PGA at the ground
surface and the duration correlates to earthquake magnitude. Accordingly, the PGAs at the sites
where DCP and SASW tests were performed needed to be estimated for both the Darfield and
the Christchurch earthquakes. As outlined below, the PGAs recorded at the strong motion
stations (refer to Chapter 2) were used to compute the conditional PGA distribution at the test
sites.
Figure 4-29. Measured VS and corrected VS1 profiles for a test site in Bexley. Also shown is the
theoretical limiting upper-bound value of VS1 for liquefaction triggering (V*S1) for soil having
FC = 9%.
The ground motion at a strong motion station i can be expressed as:
iii RupSite PGA PGA ),(ln)ln( (3)
where ln(PGAi) is the natural logarithm of the observed PGA at station i; ),(ln RupSite PGAi is
the predicted median natural logarithm of PGA at the same station by an empirical ground
motion prediction equation (GMPE), which is a function of the site and earthquake rupture; is
the inter-event residual; and i is the intra-event residual. Based on Equation (3), empirical
GMPE’s provide the distribution (unconditional) of ground motion shaking as:
22,ln~)ln(
ii PGA N PGA (4)
where X ~ N( X , X 2 ) is short-hand notation for X having a normal distribution with mean X and
variance X 2.

8/12/2019 04 - Liquefaction Rev1
http://slidepdf.com/reader/full/04-liquefaction-rev1 32/39
4-32
By definition, all recorded PGAs from a single earthquake have the same inter-event residual, .
On the other hand, the intra-event residual, i, varies from site-to-site, but is correlated spatially
due to similarities of path and site effects among various locations. Accordingly, use can be
made of recorded PGAs at strong motion stations (e.g., Chapter 2) to compute a conditional
distribution of PGAs at the DCP and SASW test sites.
Firstly, the empirical GMPE proposed by Bradley (2010) was used to compute the unconditional
distribution of PGAs at the strong motion stations. A mixed-effects regression was then used to
determine the inter-event residual, , and the intra-event residuals, i’s, for each strong motion
station (Abrahamson and Youngs, 1992; Pinheiro et al., 2008).
Secondly, the covariance matrix of intra-event residuals was computed by accounting for the
spatial correlation between all of the strong motion stations and a test site of interest. The joint
distribution of intra-event residuals at a test site of interest and the strong motion stations is given
as:
(5)
where X ~ N ( X ,) is short-hand notation for X having a multivariate normal distribution with
mean X and covariance matrix (i.e., as before, but in vector form); and 2 -site is the variances
in the intra-event residual at the site of interest. In Equation (5), the covariance matrix has been
expressed in a partitioned fashion to elucidate the subsequent computation of the conditional
distribution of site
. The individual elements of the covariance matrix were computed from:
(6)
where i,j is the spatial correlation of intra-event residuals between the two locations i and j; and
i and j are the standard deviations of the intra-event residual at locations i and j. Based on the
joint distribution of intra-event residuals given by Equation (5), the conditional distribution of
site
was computed from (Johnson et al., 2007):
[] ( ) (7)
Using the conditional distribution of the intra-event residual at a test site of interest given by
Equation (7) and substituting into Equation (4), the conditional distribution of the PGAi was
computed from:
| ̅ (8)

8/12/2019 04 - Liquefaction Rev1
http://slidepdf.com/reader/full/04-liquefaction-rev1 33/39
8/12/2019 04 - Liquefaction Rev1
http://slidepdf.com/reader/full/04-liquefaction-rev1 34/39
4-34
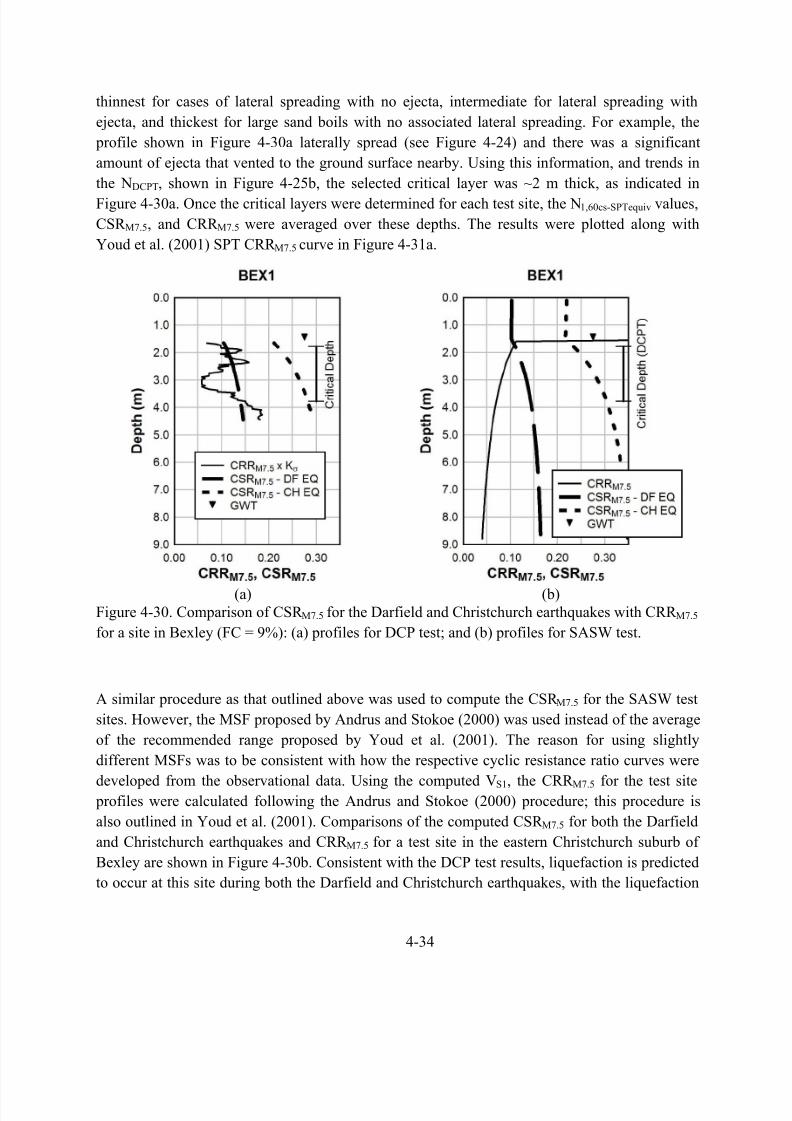
thinnest for cases of lateral spreading with no ejecta, intermediate for lateral spreading with
ejecta, and thickest for large sand boils with no associated lateral spreading. For example, the
profile shown in Figure 4-30a laterally spread (see Figure 4-24) and there was a significant
amount of ejecta that vented to the ground surface nearby. Using this information, and trends in
the NDCPT, shown in Figure 4-25b, the selected critical layer was ~2 m thick, as indicated in
Figure 4-30a. Once the critical layers were determined for each test site, the N1,60cs-SPTequiv values,
CSR M7.5, and CRR M7.5 were averaged over these depths. The results were plotted along with
Youd et al. (2001) SPT CRR M7.5 curve in Figure 4-31a.
(a) (b)Figure 4-30. Comparison of CSR M7.5 for the Darfield and Christchurch earthquakes with CRR M7.5
for a site in Bexley (FC = 9%): (a) profiles for DCP test; and (b) profiles for SASW test.
A similar procedure as that outlined above was used to compute the CSR M7.5 for the SASW test
sites. However, the MSF proposed by Andrus and Stokoe (2000) was used instead of the average
of the recommended range proposed by Youd et al. (2001). The reason for using slightly
different MSFs was to be consistent with how the respective cyclic resistance ratio curves were
developed from the observational data. Using the computed VS1, the CRR M7.5 for the test site profiles were calculated following the Andrus and Stokoe (2000) procedure; this procedure is
also outlined in Youd et al. (2001). Comparisons of the computed CSR M7.5 for both the Darfield
and Christchurch earthquakes and CRR M7.5 for a test site in the eastern Christchurch suburb of
Bexley are shown in Figure 4-30b. Consistent with the DCP test results, liquefaction is predicted
to occur at this site during both the Darfield and Christchurch earthquakes, with the liquefaction
8/12/2019 04 - Liquefaction Rev1
http://slidepdf.com/reader/full/04-liquefaction-rev1 35/39
4-35
predicted to be more severe during the Christchurch earthquake. Again, these predictions are in
line with the post-earthquake observations.
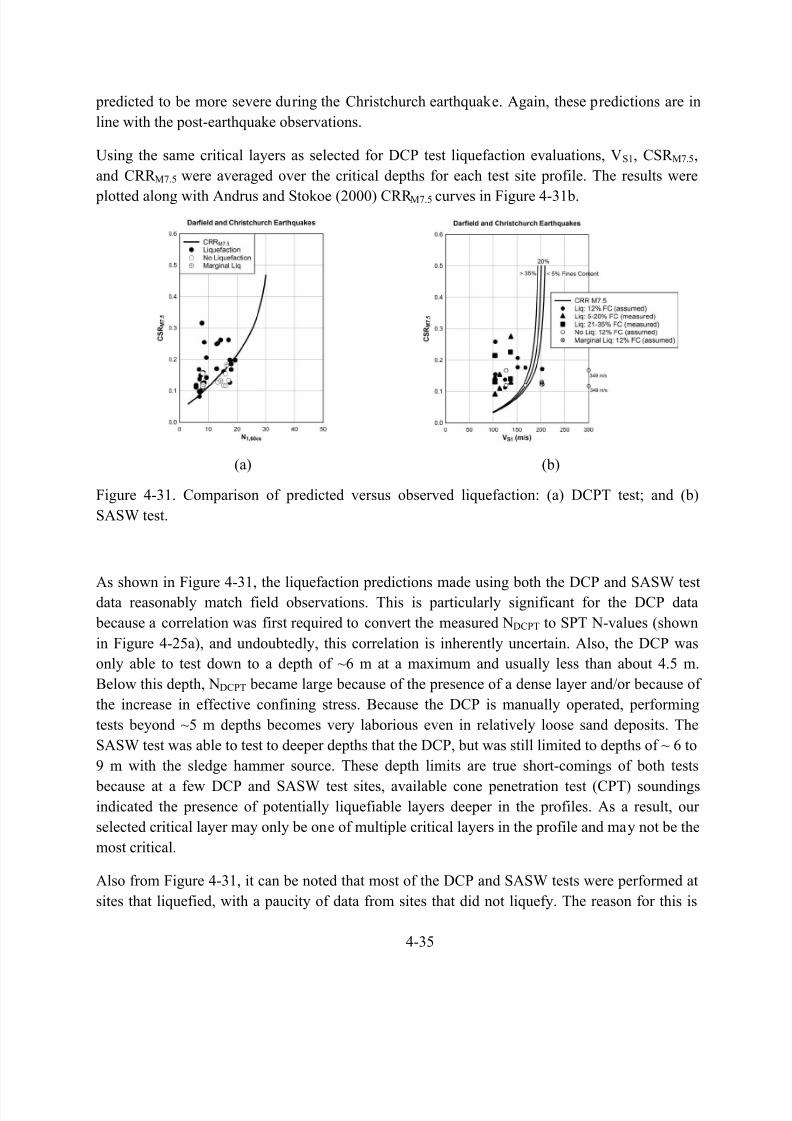
Using the same critical layers as selected for DCP test liquefaction evaluations, V S1, CSR M7.5,
and CRR M7.5 were averaged over the critical depths for each test site profile. The results were
plotted along with Andrus and Stokoe (2000) CRR M7.5 curves in Figure 4-31b.
(a) (b)
Figure 4-31. Comparison of predicted versus observed liquefaction: (a) DCPT test; and (b)
SASW test.
As shown in Figure 4-31, the liquefaction predictions made using both the DCP and SASW testdata reasonably match field observations. This is particularly significant for the DCP data
because a correlation was first required to convert the measured NDCPT to SPT N-values (shown
in Figure 4-25a), and undoubtedly, this correlation is inherently uncertain. Also, the DCP was
only able to test down to a depth of ~6 m at a maximum and usually less than about 4.5 m.
Below this depth, NDCPT became large because of the presence of a dense layer and/or because of
the increase in effective confining stress. Because the DCP is manually operated, performing
tests beyond ~5 m depths becomes very laborious even in relatively loose sand deposits. The
SASW test was able to test to deeper depths that the DCP, but was still limited to depths of ~ 6 to
9 m with the sledge hammer source. These depth limits are true short-comings of both tests
because at a few DCP and SASW test sites, available cone penetration test (CPT) soundingsindicated the presence of potentially liquefiable layers deeper in the profiles. As a result, our
selected critical layer may only be one of multiple critical layers in the profile and may not be the
most critical.
Also from Figure 4-31, it can be noted that most of the DCP and SASW tests were performed at
sites that liquefied, with a paucity of data from sites that did not liquefy. The reason for this is
8/12/2019 04 - Liquefaction Rev1
http://slidepdf.com/reader/full/04-liquefaction-rev1 36/39
4-36
the manifestation of liquefaction at the ground surface is a definite indication that liquefiable
soils are present. Several no-liquefaction sites were investigated, especially ones adjacent to sites
that liquefied. However, in the majority of these cases we were not able to find a sandy stratum
below the ground water table in the upper ~5 m of these sites using the hand-auger. As a result,
DCP tests were not performed at these sites, and the sites were not included in the DCP database.
References
Abrahamson, N.A. and R.R. Youngs (1992). A Stable Algorithm for Regression Analyses Using
the Random Effects Model, Bulletin of the Seismological Society of America, 82(1), 505-510.
Andrus, R.D., and K.H. Stokoe II (2000). Liquefaction resistance of soils from shear wave
velocity, ASCE Journal of Geotechnical and Geoenvironmental Engineering , 126(11), 1015-
1025.
Archives New Zealand (2011). Black Map of Christchurch, March 1850.
http://archives.govt.nz/gallery/v/Online+Regional+Exhibitions/Chregionalofficegallery/sss/Blac
k+Map+of+Christchurch/. Last accessed July 18, 2011.
Bradley, B.A. (2010). NZ-Specific Pseudo-Spectral Acceleration Ground Motion Prediction
Equations Based on Foreign Models, Department of Civil and Natural Resources Engineering,
University of Canterbury, Christchurch, New Zealand, 324pp.
Bradley, B.A. and Cubrinovski, M. (2011). Near-source strong ground motions observed in the
22 February 2011 Christchurch earthquake, Seismological Research Letters, 82(6), 853-865.
Brown, L.J. and J.H. Weeber (1992). Geology of the Christchurch Urban Area. Institute of
Geological and Nuclear Sciences. Lower Hutt, New Zealand: GNS Geoscience
Cox, B.R. and C.M. Wood (2010). A Comparison of Linear-Array Surface Wave Methods at a
Soft Soil Site in the Mississippi Embayment, GeoFlorida 2010: Advances in Analysis, Modeling
and Design (Fratta et al., eds.), ASCE GSP 199.
Cox, B.R. and C.M. Wood (2011). Surface Wave Benchmarking Exercise: Methodologies,
Results and Uncertainties, GeoRisk 2011: Geotechnical Risk Assessment and Management (C.H.
Juang et al., eds), ASCE GSP 224.
Cubrinovski, M., J.D. Bray, M. Taylor, S. Giorgini, B. Bradley, L. Wotherspoon, and J. Zupan
(2011a). Soil Liquefaction Effects in the Central Business District during the February 2011
Christchurch Earthquake, Seismological Research Letters, 82(6), 893-904.
Cubrinovski, M., Bradley, B. Wotherspoon, L., Green, R.A., Bray, J., Wood, C., Pender, M.,
Allen, J., Bradshaw, A., Rix, G., Taylor, M., Robinson, K., Henderson, D., Giorgini, S., Ma, K.,

8/12/2019 04 - Liquefaction Rev1
http://slidepdf.com/reader/full/04-liquefaction-rev1 37/39
4-37
Winkley, A., and Zupan, J. (2011b). Geotechnical Aspects of the 22 February 2011 Christchurch
Earthquake, Bulletin of the New Zealand Society for Earthquake Engineering , (in press).
Cubrinovski, M. and McCahon, I. (2011). Foundations on Deep Alluvial Soils, University of
Canterbury, Christchurch, 40pp.
Cubrinovski, M., R. Green, J. Allen, S. Ashford, E. Bowman, B. Bradley, B. Cox, T. Hutchinson,
E. Kavazanjian, R. Orense, M. Pender, M. Quigley, and L. Wotherspoon (2010). Geotechnical
Reconnaissance of the 2010 Darfield (Canterbury) Earthquake. Bulletin of the New Zealand
Society for Earthquake Engineering , 43(4), 243-320.
Goda, K. and H.P. Hong (2008). Spatial Correlation of Peak Ground Motions and Response
Spectra, Bulletin of the Seismological Society of America, 98(1), 354-465.
Green, R.A., Cubrinovski, M., Wotherspoon, L., Allen, J., Bradley, B., Bradshaw, A., Bray, J.,
DePascale, G., Orense, R., O’Rourke, T., Pender, M., Rix, G., Wells, D., Wood, C., Henderson,
D., Hogan, L., Kailey, P., Robinson, K., Taylor, M., and Winkley, A. (2012). “Geotechnical
Effects of the MW6.1 2011 Christchurch, New Zealand Earthquake”, Proc. GeoCongress 2012:
State of the Art and Practice in Geotechnical Engineering , Oakland Marriott City Center,
Oakland, CA, 25-29 March. (in press)
Green, R.A., S.M. Olson, B.R. Cox, G.J. Rix, E. Rathje, J. Bachhuber, J. French, S. Lasley, and
N. Martin (2011a). Geotechnical Aspects of Failures at Port-au-Prince Seaport During the 12
January 2010 Haiti Earthquake, Earthquake Spectra, 27(S1), S43-S65.
Green, R.A., Wood, C., Cox, B., Cubrinovski, M., Wotherspoon, L., Bradley, B., Algie, T.,
Allen, J., Bradshaw, A., and Rix, G. (2011b). “Use of DCP and SASW Tests to EvaluateLiquefaction Potential: Predictions vs. Observations During the Recent New Zealand
Earthquakes”, Seismological Research Letters, 82(6), 861-872.
Joh, S.H. (1996). Advances in interpretation and analysis techniques for spectral-analysis-of-
surface-waves (SASW) measurements. Ph.D. Dissertation, Dept. of Civil, Architectural, and
Environmental Engineering, University of Texas, Austin, TX, 240 p.
Johnson, R.A. and D.W. Wichern (2007). Applied Multivariate Statistical Analysis, Prentice-
Hall, Upper Saddle River, NJ.
Nazarian, S. and K.H. Stokoe II. (1984). In situ shear wave velocities from spectral analysis ofsurface wave tests. Proc. Eighth World Conference on Earthquake Engineering , San Francisco,
California, 31-38.
New Zealand Government (2011). http://www.beehive.govt.nz/release/govt-outlines-next-steps-
people-canterbury. Last accessed July 18, 2011.

8/12/2019 04 - Liquefaction Rev1
http://slidepdf.com/reader/full/04-liquefaction-rev1 38/39
4-38
Olson, S.M., R.A. Green, S. Lasley, N. Martin, B.R. Cox, E, Rathje, J. Bachhuber, and J. French
(2011). Documenting Liquefaction and Lateral Spreading Triggered by the 12 January 2010
Haiti Earthquake, Earthquake Spectra, 27(S1), S93-S116.
Pinheiro, J., D.M. Bates, S. DebRoy, D. Sarkar, and the R Core Team (2008). nlme: linear and
nonlinear mixed effects models, R package version 3.1, 89pp.
Roesset J.M., D.W. Chang, and K.H. Stokoe II (1991). Comparison of 2-D and 3-D models for
analysis of surface wave tests, Proc. 5th
Int. Conf. on Soil Dynamic and Earthquake Engineering ,
Vol. 1, 111-126.
Rosenblad, B.L., K.H. Stokoe II, E.M. Rathje, and M.B. Darendeli (2001). Characterization of
strong motion stations shaken by the Kocaeli and Duzce earthquake in Turkey: Geotechnical
Engineering Report GR01-1, Geotechnical Engineering Center, University of Texas at Austin.
Seed, H.B., K. Tokimatsu, L.F. Harder, and R. Chung (1984). The Influence of SPT Procedures
on Soil Liquefaction Resistance Evaluations, Report No. UCB\EERC-84/15, Earthquake
Engineering Research Center, Univ. California, Berkeley, CA.
Skempton, A.W. (1986). Standard Penetration Test Procedures and the Effects in Sands of
Overburden Pressure, Relative Density, Particle Size, Aging and Overconsolidation,
Geotechnique, 36(3), 425-447.
Sowers, G.F. and C.S. Hedges (1966) Dynamic cone for shallow in-situ penetration testing, vane
shear and cone penetration resistance testing of in-situ soils. ASTM STP 399, American Society of
Testing Materials, Philadelphia, PA, 29-37.
Stokoe II, K.H., S.G. Wright, J.A. Bay, and J.M. Roesset (1994). Characterization of
geotechnical sites by SASW method, Proc. 13th International Conference on Soil Mechanics
and Foundation Engineering , 22 (9-12), 923-930.
Stokoe II, K.H., S.H. Joh, and R.D. Woods (2004). Some contributions of in situ geophysical
measurements to solving geotechnical engineering problems, Proc. International Site
Characterization ISC’2 Porto, Portugal.
Stokoe II, K.H., B.L. Rosenblad, J.A. Bay, B. Redpath, J.G. Diehl., R. Steller, I.G. Wong, P.A.
Thomas, and M. Luebbers (2003). Comparison of VS profiles from three seismic methods at
Yucca Mountain, Proc. Soil and Rock America 2003 (P.J. Culligan et al., eds), Verlag GlückaufGMBH, 1, 299-306.
Wong, I. and W. Silva (2006). The importance of in-situ shear-wave velocity measurements in
developing urban and regional earthquake hazard maps, Proc. 19th Annual Symposium on the
Application of Geophysics to Engineering and Environmental Problems, 1304-1315.

8/12/2019 04 - Liquefaction Rev1
http://slidepdf.com/reader/full/04-liquefaction-rev1 39/39
Wong, I., K.H. Stokoe II, B.R. Cox, Y.-C. Lin, and F.-Y. Menq (2011). Shear-Wave Velocity
Profiling of Strong Motion Sites that Recorded the 2001 Nisqually, Washington Earthquake,
Earthquake Spectra, 27(1), 183-212.
Wotherspoon, L.M., M.J. Pender, and R.P. Orense (2011). Relationship between observed
liquefaction at Kaiapoi following the 2010 Darfield earthquake and former channels of theWaimakariri River, Engineering Geology, (in press).
Youd, T.L., I.M. Idriss, R.D. Andrus, I. Arango, G. Castro, J.T Christian,. R. Dobry, W.D.L.
Finn, L.F. Harder, M.E. Hynes, K. Ishihara, J.P. Koester, S.S.C. Liao, W.F. Marcuson III, G.R.
Martin, J.K. Mitchell, Y. Moriwaki, M.S. Power, P.K. Robertson, R.B. Seed, and K.H. Stokoe II
(2001). Liquefaction resistance of soils: summary report from the 1996 NCEER and 1998
NCEER/NSF workshops on evaluation of liquefaction resistance of soils. Journal of
Geotechnical and Geoenvironmental Engineering, ASCE , 127(10), 817-833.