0(12)34& #56& 7)851(& '( ) · pdf file7 j0 7qc,mj0, :0@ 7:xi:', # m.6-...
TRANSCRIPT
Graph Theory, Social Networks and Counter Terrorism
Adelaide HopkinsAdvisor: Professor Dana FineDepartment of Mathematics
Cniversity of Massachusetts DartmouthApril 11, 200G
GRAPH THEORY BASICS What is a graph? A graph is a visual
representation of a network consisting of points (nodes or vertices) indicating people or groups and connecting lines (edges) which represent an association or relationship between the vertices.
Cndirected graphs can show interpersonal relationships between actors in a social network and can be represented by a symmetric adjacency matrix with elements
Weighted graphs can be directed or undirected and be represented by an adjacency matrix in which the nonzero values indicate connections of varying strengths.
Directed graphs can show flow of money, ideas and can be represented by an asymmetric adjacency matrix.
CHALLENGES How may a social network (such as a terrorist cell) be represented by a
graph? The nodes in the network represent people or groups while the links show relationships or flows between the nodes.
Challenges in mapping covert or “dark” networks Incompleteness – the inevitability of missing nodes and links that the
investigators will not uncover. Data may be subject to selfreported bias, and useful information is not readily
available to the public, or at least not easily found. Fuzzy boundaries – the difficulty in deciding who to include and who not to
include. Data may be biased toward leaders and members captured or identified in an
attack. Dynamics – these networks are not static and are always changing.
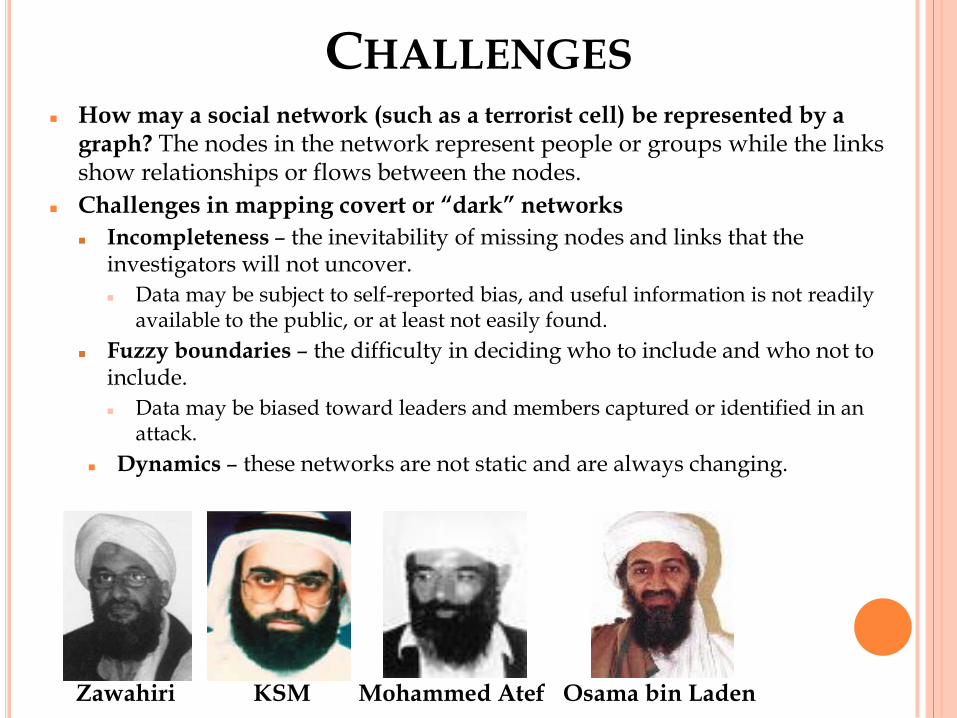
Vawahiri KSM Mohammed Atef Osama bin Laden
SOCIAL NETWORK ANALYSISFour Necessary Elements of Social Network Analysis
1. Motivated by a structural intuition based on ties linking social actors.2. Grounded in systematic empirical data.3. Draws heavily on graphic imagery.4. Relies on the use of mathematical and/or computational models.
Method of Social Network Analysis1. Conduct empirical studies which investigate network structure using a
variety of techniques such as interviews, direct observation, archival records, or methods like “snowball sampling” or “egocentered” studies.
2. Use mathematical or statistical methods to answer questions about the community.
3. Create mathematical or computer models to replicate the processes taking place in networked systems.
These methods can provide important information on the unique characteristics of terrorist organizations, such as network recruitment, network evolution and the diffusion of radical ideas, through topological analysis focusing on the statistical characteristics of the network structure.
PROPERTIES OF GRAPHS ANDSAMPLE APPLICATION
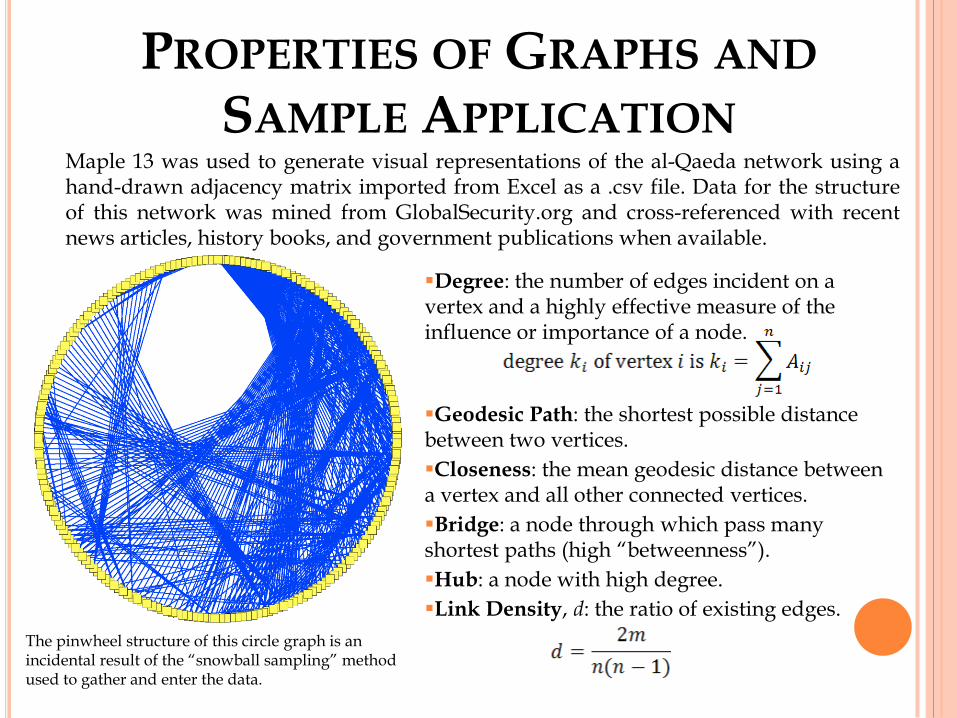
Maple 13 was used to generate visual representations of the alQaeda network using ahanddrawn adjacency matrix imported from Excel as a .csv file. Data for the structureof this network was mined from GlobalSecurity.org and crossreferenced with recentnews articles, history books, and government publications when available.
The pinwheel structure of this circle graph is an incidental result of the “snowball sampling” method used to gather and enter the data.
Degree: the number of edges incident on a vertex and a highly effective measure of the influence or importance of a node.
Geodesic Path: the shortest possible distance between two vertices.Closeness: the mean geodesic distance between a vertex and all other connected vertices.Bridge: a node through which pass many shortest paths (high “betweenness”).Hub: a node with high degree.Link Density, d: the ratio of existing edges.
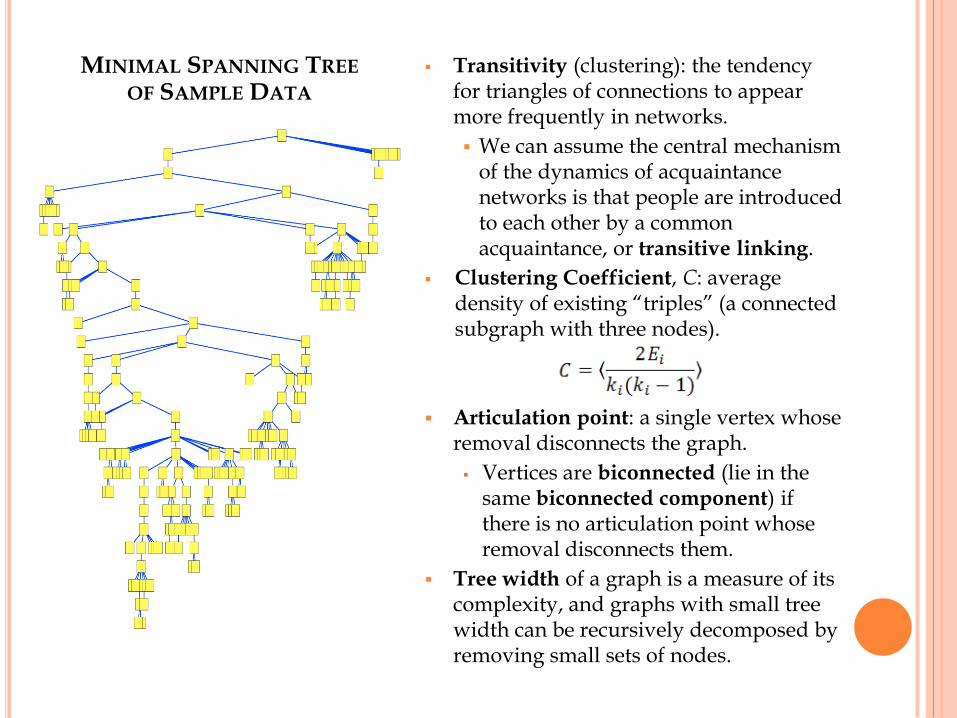
Transitivity (clustering): the tendency for triangles of connections to appear more frequently in networks. We can assume the central mechanism
of the dynamics of acquaintance networks is that people are introduced to each other by a common acquaintance, or transitive linking.
Clustering Coefficient, C: average density of existing “triples” (a connected subgraph with three nodes).
Articulation point: a single vertex whose removal disconnects the graph. Vertices are biconnected (lie in the
same biconnected component) if there is no articulation point whose removal disconnects them.
Tree width of a graph is a measure of its complexity, and graphs with small tree width can be recursively decomposed by removing small sets of nodes.
MINIMAL SPANNING TREEOF SAMPLE DATA

BEHAVIORS AND PROPERTIES OFTERRORIST NETWORKS
Terrorist networks are more sensitive to attacks targeting bridges than to those targeting hubs
Networks are sparse, with very low link density
Short path length and link sparseness help lower the risk of detection and enhance efficiency of communication.
High clustering coefficient contributes to the local efficiency.
T OPO L O G I C A L A N A LYSIS
Number of Nodes, n 209Number of Links, m 662Average Degree, <k> 42.05126345Maximum Degree 59Link Density, d 0.03045638572Assortativity, r .3250012Power-Law Distribution Exponent, γ 1.02308154
Goodness of Fit, R2 0.9142475Clustering Coefficient, C 0.7186465
TYPES OF NETWORKS Random
Small average path length, l Small clustering coefficient, C Bellshaped Poisson degree distribution
Small-World Relatively small average path length Comparatively larger clustering
coefficient Vulnerable to bridge attacks
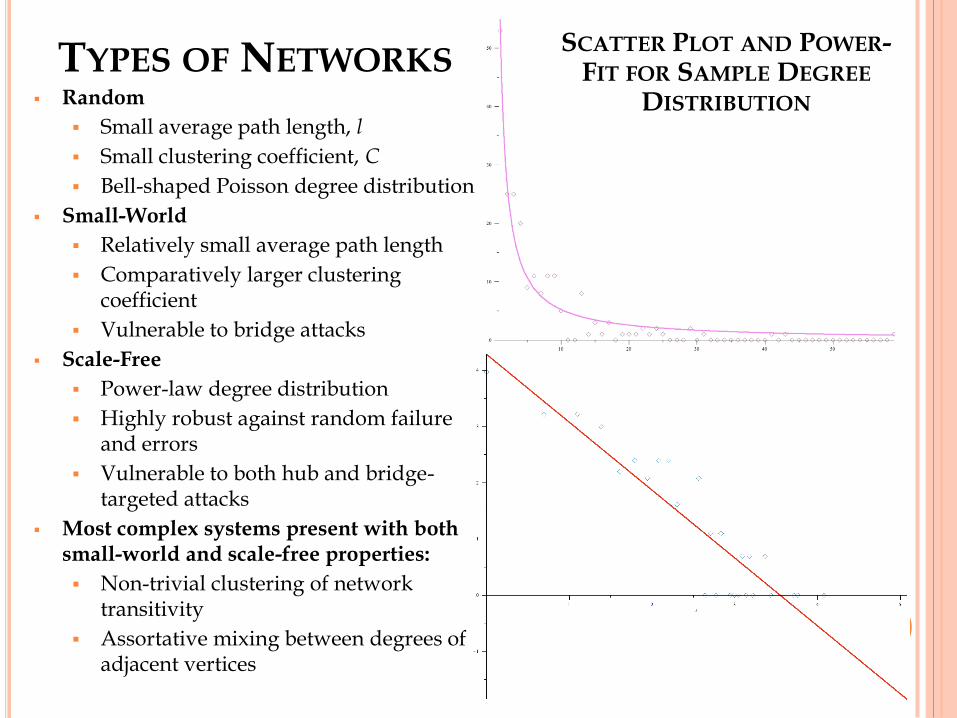
Scale-Free Powerlaw degree distribution Highly robust against random failure
and errors Vulnerable to both hub and bridge
targeted attacks Most complex systems present with both
small-world and scale-free properties: Nontrivial clustering of network
transitivity Assortative mixing between degrees of
adjacent vertices
SCATTER PLOT AND POWER-FIT FOR SAMPLE DEGREE
DISTRIBCTION
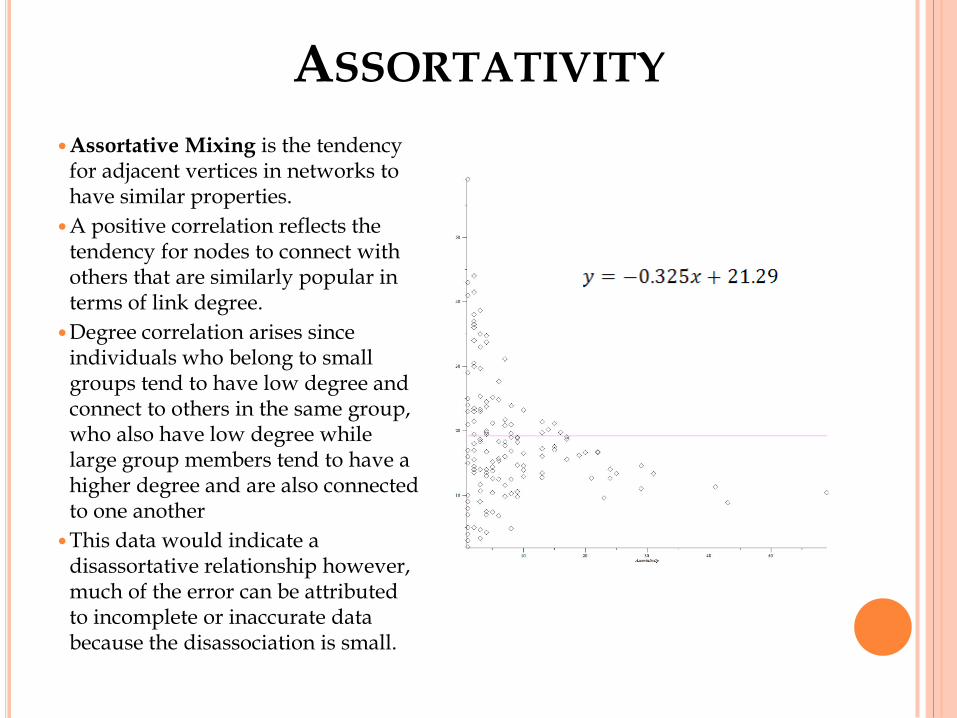
ASSORTATIVITY!Assortative Mixing is the tendency
for adjacent vertices in networks to have similar properties.
!A positive correlation reflects the tendency for nodes to connect with others that are similarly popular in terms of link degree.
!Degree correlation arises since individuals who belong to small groups tend to have low degree and connect to others in the same group, who also have low degree while large group members tend to have a higher degree and are also connected to one another
!This data would indicate a disassortative relationship however, much of the error can be attributed to incomplete or inaccurate data because the disassociation is small.
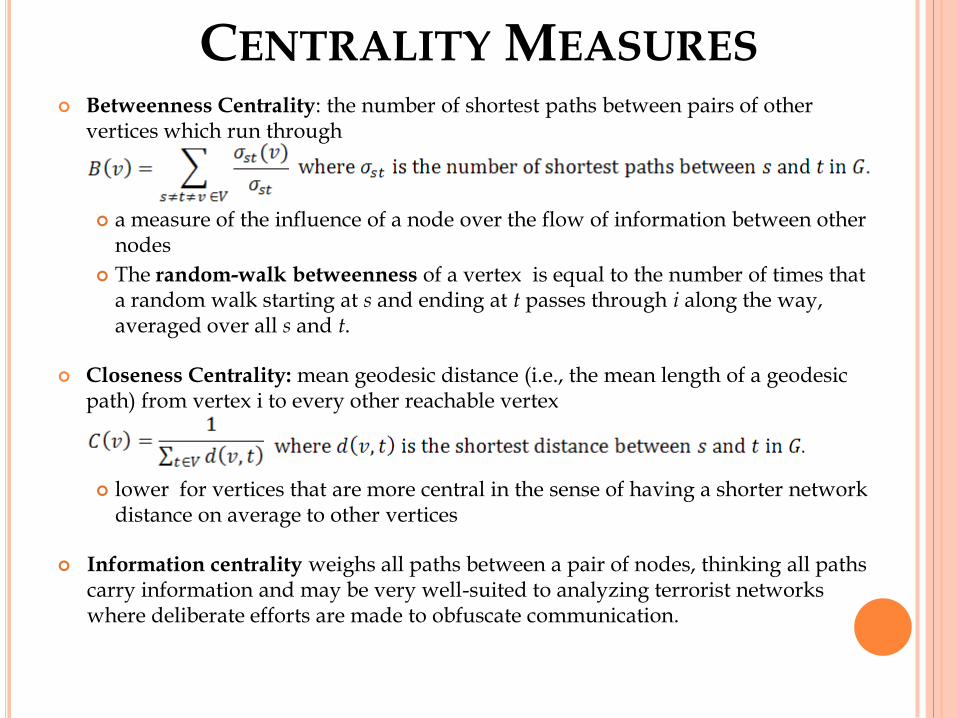
CENTRALITY MEASCRES Betweenness Centrality: the number of shortest paths between pairs of other
vertices which run through
a measure of the influence of a node over the flow of information between other nodes
The random-walk betweenness of a vertex is equal to the number of times that a random walk starting at s and ending at t passes through i along the way, averaged over all s and t.
Closeness Centrality: mean geodesic distance (i.e., the mean length of a geodesic path) from vertex i to every other reachable vertex
lower for vertices that are more central in the sense of having a shorter network distance on average to other vertices
Information centrality weighs all paths between a pair of nodes, thinking all paths carry information and may be very wellsuited to analyzing terrorist networks where deliberate efforts are made to obfuscate communication.
DETECTING COMMCNITYSTRCCTCRE IN NETWORKS
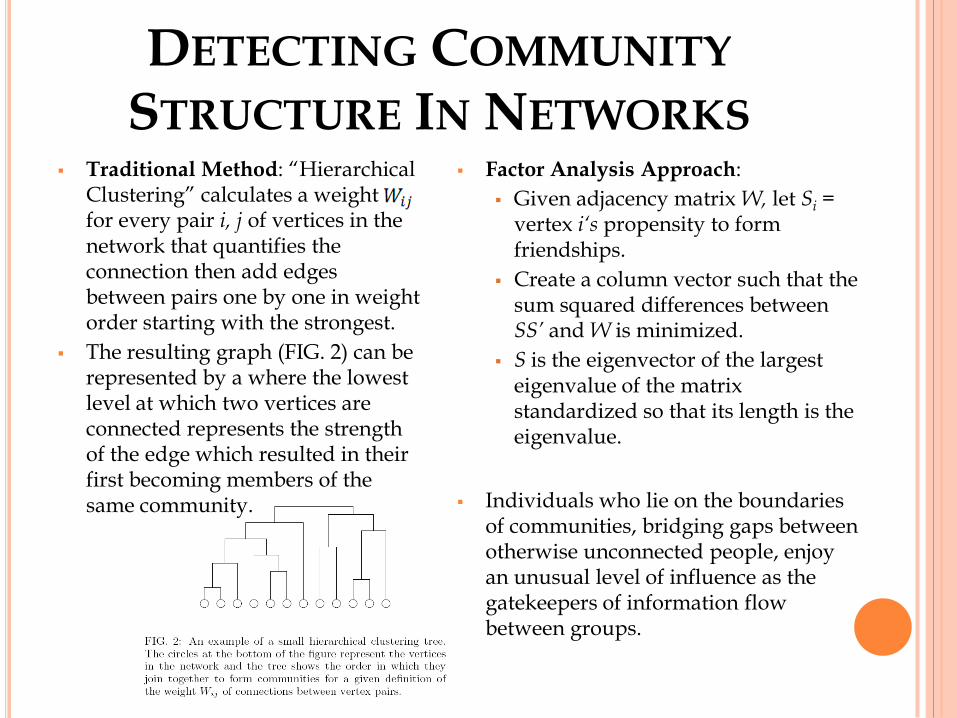
Traditional Method: “Hierarchical Clustering” calculates a weight for every pair i, j of vertices in the network that quantifies the connection then add edges between pairs one by one in weight order starting with the strongest.
The resulting graph (FIG. 2) can be represented by a where the lowest level at which two vertices are connected represents the strength of the edge which resulted in their first becoming members of the same community.
Factor Analysis Approach: Given adjacency matrix W, let Si =
vertex i‘s propensity to form friendships.
Create a column vector such that the sum squared differences between SS’ and W is minimized.
S is the eigenvector of the largest eigenvalue of the matrix standardized so that its length is the eigenvalue.
Individuals who lie on the boundaries of communities, bridging gaps between otherwise unconnected people, enjoy an unusual level of influence as the gatekeepers of information flow between groups.
CONCLCSIONS AND CAVEATS
Understanding topology yields greater insight into the nature of clandestine organizations and could help develop effective disruptive strategies.
Their efficiency in terms of communication and information flow and commands can be tied to tier smallworld structures, which are characterized by short average path length and a high clustering coefficient.
Any attempts to graph a covert network may have missing links that can cause the networks to appear to be less efficient, and there may actually be hidden “shortcuts” connecting distant parts of the networks.
The presence of coincidental “fake” links might cause the elicited networks to be more efficient than they would otherwise be since these links are not communication channels
For some centrality measures such a betweenness, uncertainty in the data will be reflected in inaccuracies in shortest path computations.