00 the future of drug innovation
TRANSCRIPT

The future of drug innovationSupplement to Nature Publishing Group Journals October 2011
reprint collectionS P O N S O R E D C O N T E N T
www.nature.com/reprintcollections/lilly/drug-innovation Sponsored by

For the past 135 years, science has been at the foundation of all we do here at Eli Lilly and Company. We adapt and evolve in order to research and develop breakthrough medicines that deliver improved outcomes for individual patients. From collaborating to produce the world’s fi rst insulin, to the discovery and development of medicines that have helped revolutionize the treatment of depression and schizophrenia, Lilly has spent decades delivering innovative medicines that address unmet medical needs in neuroscience, diabetes, cancer, osteoporosis and more. We are currently standing at the threshold of potential new breakthroughs in science and we plan to deliver to the patients who are waiting.
INSIDE Left Cover
www.nature.com/reprintcollections/lilly/drug-innovation NATURE REPRINT COLLECTION | THE FUTURE OF DRUG INNOVATION | OCTOBER 2011 | 1
Nature Reprint CollectionThe future of drug innovation
publisher: MELANIE BRAZILsponsorship: DAVID BAGSHAW, YVETTE SMITH, GERARD PRESTON
web production: ANITHA SONIA, MANPREET MANKOOmanufacturing production: SUSAN GRAY, STEPHEN RUSSELL
cover artist: SUSIE LANNIsponsor: ELI LILLY AND COMPANY
CITING THE COLLECTIONAll papers have been previously published in Nature Publishing Group journals. Please use the original citation, which can be found on the table of contents below.
For the past 135 years, science has been at the foundation of all we do here at Eli Lilly and Company. We adapt and evolve in order to research and develop breakthrough medicines that deliver improved outcomes for individual patients. From collaborating to produce the world’s fi rst insulin, to the discovery and development of medicines that have helped revolutionize the treatment of depression and schizophrenia, Lilly has spent decades delivering innovative medicines that address unmet medical needs in neuroscience, diabetes, cancer, osteoporosis and more. We are currently standing at the threshold of potential new breakthroughs in science and we plan to deliver to the patients who are waiting.
INSIDE Left Cover
The future of drug innovationSupplement to Nature Publishing Group Journals October 2011
reprint collectionS P O N S O R E D C O N T E N T
www.nature.com/reprintcollections/lilly/drug-innovation Sponsored by
Sponsor’s ForewordT he biopharmaceutical industry faces intense pressures including scientific, regulatory
and payer-related concerns that affect R&D productivity. Just as significant are the opportunities to serve unmet patient needs. The world’s population is also aging and,
as a result, the number of patients with Alzheimer’s disease, diabetes and cancer, and other chronic diseases associated with aging is increasing. There is an urgent need for medicines that cure, prevent, or slow the progression of disease.
To provide innovative treatments that address diseases caused by interplay between genetics, lifestyle, and environmental factors, Lilly, and the rest of the biopharmaceutical industry, will need to continue to discover and develop new medicines — often collaborating with academia, biotechnology companies, and regulatory agencies to do so. In fact, the current diabetes mellitus type 2 global epidemic is one key example of a complex disease involving factors such as lack of exercise and inappropriate nutrition, coupled with genetic susceptibility.
The articles included in this supplement demonstrate some of the problems facing the biopharmaceutical industry today, but solutions are also included which focus on answers to critical questions like: How can we intervene to treat diseases earlier or prevent disease progression? How can genome mining be done more effectively in order to find more human validated disease targets and increase our understanding of multiple cell signaling pathways?
Other aspects of the solution the industry is pursuing include the development of multi-specific therapeutics to boost efficacy by combining more than one unique mechanism of action into one molecule. Industry is increasingly tailoring medicines to suit specific patient populations, including the use of companion diagnostics. Therefore, at Lilly, we are developing a deeper understanding of genetic differences between ethnic patient groups, a prerequisite for global registrations. We are also increasingly better at understanding the ‘real life’ patient experience with our medicines, including the importance of patient convenience for delivery and administration.
Through these efforts to improve success rates and other strategies, Lilly will improve R&D productivity and shift away from the current inefficient paradigm of “multiple shots on goal” to try to get medicines to market. Rather, we like the idea of “timely shots in goal,” which means delivering a timely flow of innovative medicines with a greater likelihood of reaching patients with a differentiated value proposition for clinically meaningful outcomes including data with relevant comparators. This evolution in our R&D strategy will benefit patients, prescribers, payers, and other stakeholders and fuel our industry in the years ahead.
The future advances of treatments for human disease will continue to be determined, to a large extent, by the innovation generated by the biopharmaceutical industry and in close collaboration with others. Vast knowledge and experience with disease mechanisms and therapeutic molecule research and development are held within biopharma companies. Successful treatment advances will also depend on a healthcare innovation ecosystem that encourages continuous enhancements of scientific, technical and medical capabilities. This is supported by advanced analytic information technology, as well as productive external partnerships to access unique capabilities and to create flexible capacity, reduce costs and share risks to solve complex R&D problems together. Intellectual property protection and data package exclusivity are necessary to support investments in pharmaceutical R&D. It’s also important that we provide our cutting-edge drug hunters and developers with the right scientific capabilities, supported by organizational empowerment to encourage transparent risk-taking and the willingness to “play to win” even in a difficult and uncertain environment rather than “playing safe not to lose.” Science has been, and will continue to be, a foundation upon which innovation driven pharmaceutical companies succeed or fail. We believe that pharma mega mergers risk sequestering innovation, create distraction and may destroy unique capabilities that have been built up for years. Instead, we believe that optimal critical mass capability, continuous adoption of new science and technology with a long-term approach is the way forward to truly supporting innovation.
In this reprint collection, we provide a compilation of some of the papers which describe issues and solutions for innovation and create a dialogue around which effective strategies can be built. Unmet medical need has an eternal horizon and the ultimate reward for our scientists is to invent meaningful medicines that help humans live longer, active and healthier lives. That is the ultimate reward for all of us who do this important work and contribute positively to solving society’s healthcare and economic challenges.
Jan M. Lundberg, Ph.D.Executive Vice President, Science and Technology
President, Lilly Research Laboratories
This supplement is published by Nature Publishing Group on behalf of Eli Lilly and Company. All content has been chosen by Eli Lilly and Company.
2 How to improve R&D productivity: the pharmaceutical industry’s grand challenge. Paul, S.M. et al. Nature Reviews Drug Discovery 9, 203-214 (2010); doi: 10.1038/nrd3078
14 Network pharmacology: the next paradigm in drug discovery. Hopkins, A.L. Nature Chemical Biology 4, 682-690 (2008); doi: 10.1038/nchembio.118
23 How were new medicines discovered? Swinney, D.C. et al. Nature Reviews Drug Discovery 10, 507-519 (2010); doi: 10.1038/nrd3480
37 Development trends for human monoclonal antibody therapeutics. Nelson, A.L. et al. Nature Reviews Drug Discovery 9, 767-774 (2010); doi: 10.1038/nrd3229
45 Bridging the efficacy–effectiveness gap: a regulator’s perspective on addressing variability of drug response. Eichler, HG. et al. Nature Reviews Drug Discovery 10, 495-506 (2011); doi: 10.1038/nrd3501
57 Innovative drug R&D in China. Qi, J. et al. Nature Reviews Drug Discovery 10, 333-334 (2011); doi: 10.1038/nrd3435
59 The impact of mergers on pharmaceutical R&D. LaMattina, J.L. Nature Reviews Drug Discovery 10, 559-560 (2011); doi: 10.1038/nrd3514
61 Crowd sourcing in drug discovery. Lessl, M. et al. Nature Reviews Drug Discovery 10, 241-242 (2011); doi: 10.1038/nrd3412
63 The future of drug development: advancing clinical trial design. Orloff, J. et al. Nature Reviews Drug Discovery 8, 949-957 (2009); doi: 10.1038/nrd3025
73 The case for entrepreneurship in R&D in the pharmaceutical industry. Douglas, F.L. Nature Reviews Drug Discovery 9, 683-689 (2010); doi: 10.1038/nrd3230
2 | OCTOBER 2011 | THE FUTURE OF DRUG INNOVATION | NATURE REPRINT COLLECTION www.nature.com/reprintcollections/lilly/drug-innovation
innovative’ and first-in-class NMEs have remained stable at about 5–6 per year. however, the number of potential revenue-generating drugs (innovative or other wise) as a percentage of R&D expenditures has undeniably fallen sharply.
with an estimated $50 billion in collective annual R&D spending by the large pharmaceutical companies, and appropriate allocation over time to the successful discovery and development of NMEs, the average cost for these companies to bring an NME to market is now estimated to be approximately $1.8 billion (see below for details underlying this estimate), and is rising rapidly. Moreover, there is little evidence that the average costs of successfully launching an NME vary significantly between large pharmaceutical or small biotechnology companies10,11.
Although R&D productivity has been declining for a number of years2, the unprecedented combina-tion of reduced R&D output in the form of success-fully launched truly innovative NMEs, coupled with diminishing market exclusivity for recently launched new medicines and the huge loss of revenues owing to generic competition over the next decade, suggest that we may be moving closer to a pharmaceutical ‘ice age’ and the potential extinction of the industry, at least as it exists today12,13. Although this might be welcomed by the industry’s critics, the impact on the health and well-being of patients owing to delayed or even lost opportunities to introduce the next generation of innovative medicines could be devastating. In this regard, we underscore the findings of lichtenberg14 on the effects of medical inno-vation (including controls for the impact of obesity and income), which indicate that ~40% of the 2-year increase in life expectancy measured from 1986–2000 can be attributed to the introduction and use of new drugs. It took approximately 3 years for NME launches to have their maximal impact on longevity — this effect was not observed for non-NME (older) drugs. One can only speculate as to the impact on longevity and quality of life that new drugs now in clinical development for cancer and Alzheimer’s disease might have. without these new medicines, and given the rise in diseases such as diabetes and childhood obesity, it is possible that life expectancy may actually decrease over time15.
Among all the challenges faced by the pharmaceutical industry, we argue that improving R&D productivity remains the most important. The environmental factors that are reducing the industry’s profitability can only be mitigated by substantially and sustainably increas-ing the number and quality of innovative, as well as cost-effective, new medicines; but only if accomplished at reasonable R&D costs. So, the key questions are where, how and by how much can R&D productivity be improved? here, we present a detailed analysis of R&D productivity by first defining and modelling the essential elements of contemporary drug discovery and development that account for the current cost of a new medicine, and discuss the rate-limiting steps of the R&D process that are contributing to reduced R&D productivity. we then propose, and illustrate, ways to improve these factors.
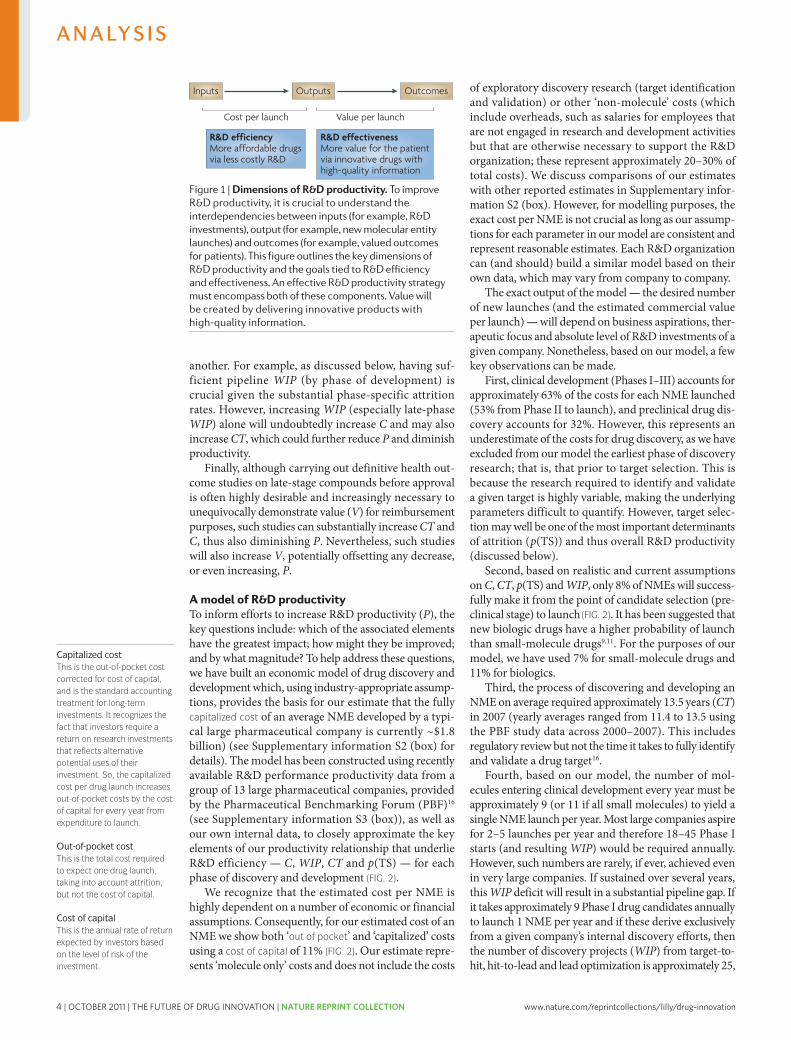
How do we define R&D productivity?R&D productivity can be simply defined as the relation-ship between the value (medical and commercial) created by a new medicine (considered here to be an NME) and the investments required to generate that medicine. however, R&D productivity can in our view best be elaborated in two important dimensions: inputs leading to outputs, or R&D efficiency; and outputs leading to outcomes, or R&D effectiveness (FIG. 1).
R&D efficiency represents the ability of an R&D system to translate inputs (for example, ideas, invest-ments, effort) into defined outputs (for example, inter-nal milestones that represent resolved uncertainty for a given project or product launches), generally over a defined period of time. If launching (gaining regulatory approval and commercializing) an NME is the desired output, how can this be achieved with greater efficiency (that is, at a lower cost)?
R&D effectiveness can be defined as the ability of the R&D system to produce outputs with certain intended and desired qualities (for example, medical value to patients, physicians and payers, and substantial com-mercial value). Thus, R&D productivity can be viewed as an aggregate representation of both the efficiency and effectiveness of the drug discovery and development process; the goal of a highly productive R&D system is to efficiently translate inputs into the most desired and valuable outputs. For a more detailed description of these definitions, see Supplementary information S1 (box). with this definition of R&D productivity in mind, we have further adapted a productivity relationship or ‘pharmaceutical value equation’, which includes the key elements that determine both the efficiency and effec-tiveness of the drug discovery and development process for any given pipeline (see equation 1).
Nature Reviews | Drug Discovery
P α (1)WIP × p(TS) × V
CT × C
R&D productivity (P) can be viewed as a function of the elements comprising the numerator — the amount of scientific and clinical research being conducted simul-taneously, designated here as the work in process (WIP), the probability of technical success (p(TS)) and the value (V) — divided by the elements in the denominator, the cycle time (CT) and cost (C). Each of these parameters can be conceptualized and analyzed on a per project basis (for example, a single drug candidate or WIP = 1) or collectively as a larger portfolio or pipeline of projects or drug candidates. In general, increasing the numerator relative to the denominator will increase productivity and vice versa. Thus, if one could increase the p(TS) (that is, reduce attrition) for any given drug candidate or ideally for a portfolio of drug candidates at a given phase of development, P would increase accordingly. Similarly, for any given level of R&D investment, sub-stantially reducing CT or lowering C (such as unit costs) would increase P.
however, most of the elements comprising equa-tion 1 are inextricably linked to one another and changing one element can often adversely or beneficially affect
204 | MARch 2010 | vOlUME 9 www.nature.com/reviews/drugdisc
nrd_3078_mar10.indd 204 15/2/10 11:08:15
A n A ly s i s
The pharmaceutical industry is facing unprecedented challenges to its business model. Experienced observers and industry analysts have even predicted its imminent demise1–3. Over the past decade, serious concerns about the industry’s integrity and transparency — for example, around drug safety and efficacy — have been raised, compromising the industry’s image, and resulting in increased regulatory scrutiny4,5. This erosion in confi-dence in the industry and its products has resonated poorly with patients, health-care professionals, payers and shareholders. Indeed, the industry’s price/earnings ratio, a measure of the current valuation of the industry, has decreased below that of the S&P 500 index and has remained more or less flat, as have share prices for the past 7 years.
The industry’s profitability and growth prospects are also under pressure as healthcare budgets become increasingly strained. Generic drugs, although clearly helping to keep drug prices in check, are currently approaching 70% of all prescriptions written in the United States6. Moreover, key patent expirations between 2010–2014 have been estimated to put more than US$209 billion in annual drug sales at risk, resulting in $113 billion of sales being lost to generic substitution7. Indeed, for every dollar lost in declining product revenues due
to patent expirations by 2012, it has been estimated that large-cap pharmaceutical companies will only be able to replace on average 26 cents with new product revenues8.
Simply stated, without a dramatic increase in R&D productivity, today’s pharmaceutical industry cannot sustain sufficient innovation to replace the loss of rev-enues due to patent expirations for successful products. A key aspect of this problem is the decreasing number of truly innovative new medicines approved by the US Food and Drug Administration (FDA) and other major regulatory bodies around the world over the past 5 years (in which 50% fewer new molecular entities (NMEs) were approved compared with the previous 5 years)9. In 2007, for example, only 19 NMEs (including biologics) were approved by the FDA, the fewest number of NMEs approved since 1983, and the number rose only slightly to 21 in 2008. Of the 21 new drugs approved by the FDA in 2008, only 6 were developed by the 15 largest pharmaceutical companies and only 29% would be considered ‘first-in-class’ medicines. In 2009, 24 new drugs were approved, 10 of which were devel-oped by large pharmaceutical companies and only 17% of which could be considered first-in-class. Some have argued that the number of approved ‘mechanistically
Lilly Research Laboratories, Eli Lilly and Company, Lilly Corporate Center, Indianapolis, Indiana 46285, USA. Correspondence to: S.M.P. e-mail: [email protected]:10.1038/nrd3078 Published online 19 February 2010
New molecular entity(NME). A medication containing an active ingredient that has not been previously approved for marketing in any form in the United States. NME is conventionally used to refer only to small-molecule drugs, but in this article we use the term as a shorthand to refer to both new chemical entities and new biologic entities.
How to improve R&D productivity: the pharmaceutical industry’s grand challengeSteven M. Paul, Daniel S. Mytelka, Christopher T. Dunwiddie, Charles C. Persinger, Bernard H. Munos, Stacy R. Lindborg and Aaron L. Schacht
Abstract | The pharmaceutical industry is under growing pressure from a range of environmental issues, including major losses of revenue owing to patent expirations, increasingly cost-constrained healthcare systems and more demanding regulatory requirements. In our view, the key to tackling the challenges such issues pose to both the future viability of the pharmaceutical industry and advances in healthcare is to substantially increase the number and quality of innovative, cost-effective new medicines, without incurring unsustainable R&D costs. However, it is widely acknowledged that trends in industry R&D productivity have been moving in the opposite direction for a number of years. Here, we present a detailed analysis based on comprehensive, recent, industry-wide data to identify the relative contributions of each of the steps in the drug discovery and development process to overall R&D productivity. We then propose specific strategies that could have the most substantial impact in improving R&D productivity.
AnAlysIs
NATURE REvIEwS | Drug Discovery vOlUME 9 | MARch 2010 | 203
nrd_3078_mar10.indd 203 15/2/10 11:08:13
First published in Nature Reviews Drug Discovery 9, 203-214 (March 2010) | doi:10.1038/nrd3078
www.nature.com/reprintcollections/lilly/drug-innovation NATURE REPRINT COLLECTION | THE FUTURE OF DRUG INNOVATION | OCTOBER 2011 | 3
innovative’ and first-in-class NMEs have remained stable at about 5–6 per year. however, the number of potential revenue-generating drugs (innovative or other wise) as a percentage of R&D expenditures has undeniably fallen sharply.
with an estimated $50 billion in collective annual R&D spending by the large pharmaceutical companies, and appropriate allocation over time to the successful discovery and development of NMEs, the average cost for these companies to bring an NME to market is now estimated to be approximately $1.8 billion (see below for details underlying this estimate), and is rising rapidly. Moreover, there is little evidence that the average costs of successfully launching an NME vary significantly between large pharmaceutical or small biotechnology companies10,11.
Although R&D productivity has been declining for a number of years2, the unprecedented combina-tion of reduced R&D output in the form of success-fully launched truly innovative NMEs, coupled with diminishing market exclusivity for recently launched new medicines and the huge loss of revenues owing to generic competition over the next decade, suggest that we may be moving closer to a pharmaceutical ‘ice age’ and the potential extinction of the industry, at least as it exists today12,13. Although this might be welcomed by the industry’s critics, the impact on the health and well-being of patients owing to delayed or even lost opportunities to introduce the next generation of innovative medicines could be devastating. In this regard, we underscore the findings of lichtenberg14 on the effects of medical inno-vation (including controls for the impact of obesity and income), which indicate that ~40% of the 2-year increase in life expectancy measured from 1986–2000 can be attributed to the introduction and use of new drugs. It took approximately 3 years for NME launches to have their maximal impact on longevity — this effect was not observed for non-NME (older) drugs. One can only speculate as to the impact on longevity and quality of life that new drugs now in clinical development for cancer and Alzheimer’s disease might have. without these new medicines, and given the rise in diseases such as diabetes and childhood obesity, it is possible that life expectancy may actually decrease over time15.
Among all the challenges faced by the pharmaceutical industry, we argue that improving R&D productivity remains the most important. The environmental factors that are reducing the industry’s profitability can only be mitigated by substantially and sustainably increas-ing the number and quality of innovative, as well as cost-effective, new medicines; but only if accomplished at reasonable R&D costs. So, the key questions are where, how and by how much can R&D productivity be improved? here, we present a detailed analysis of R&D productivity by first defining and modelling the essential elements of contemporary drug discovery and development that account for the current cost of a new medicine, and discuss the rate-limiting steps of the R&D process that are contributing to reduced R&D productivity. we then propose, and illustrate, ways to improve these factors.
How do we define R&D productivity?R&D productivity can be simply defined as the relation-ship between the value (medical and commercial) created by a new medicine (considered here to be an NME) and the investments required to generate that medicine. however, R&D productivity can in our view best be elaborated in two important dimensions: inputs leading to outputs, or R&D efficiency; and outputs leading to outcomes, or R&D effectiveness (FIG. 1).
R&D efficiency represents the ability of an R&D system to translate inputs (for example, ideas, invest-ments, effort) into defined outputs (for example, inter-nal milestones that represent resolved uncertainty for a given project or product launches), generally over a defined period of time. If launching (gaining regulatory approval and commercializing) an NME is the desired output, how can this be achieved with greater efficiency (that is, at a lower cost)?
R&D effectiveness can be defined as the ability of the R&D system to produce outputs with certain intended and desired qualities (for example, medical value to patients, physicians and payers, and substantial com-mercial value). Thus, R&D productivity can be viewed as an aggregate representation of both the efficiency and effectiveness of the drug discovery and development process; the goal of a highly productive R&D system is to efficiently translate inputs into the most desired and valuable outputs. For a more detailed description of these definitions, see Supplementary information S1 (box). with this definition of R&D productivity in mind, we have further adapted a productivity relationship or ‘pharmaceutical value equation’, which includes the key elements that determine both the efficiency and effec-tiveness of the drug discovery and development process for any given pipeline (see equation 1).
Nature Reviews | Drug Discovery
P α (1)WIP × p(TS) × V
CT × C
R&D productivity (P) can be viewed as a function of the elements comprising the numerator — the amount of scientific and clinical research being conducted simul-taneously, designated here as the work in process (WIP), the probability of technical success (p(TS)) and the value (V) — divided by the elements in the denominator, the cycle time (CT) and cost (C). Each of these parameters can be conceptualized and analyzed on a per project basis (for example, a single drug candidate or WIP = 1) or collectively as a larger portfolio or pipeline of projects or drug candidates. In general, increasing the numerator relative to the denominator will increase productivity and vice versa. Thus, if one could increase the p(TS) (that is, reduce attrition) for any given drug candidate or ideally for a portfolio of drug candidates at a given phase of development, P would increase accordingly. Similarly, for any given level of R&D investment, sub-stantially reducing CT or lowering C (such as unit costs) would increase P.
however, most of the elements comprising equa-tion 1 are inextricably linked to one another and changing one element can often adversely or beneficially affect
204 | MARch 2010 | vOlUME 9 www.nature.com/reviews/drugdisc
nrd_3078_mar10.indd 204 15/2/10 11:08:15
A n A ly s i s
The pharmaceutical industry is facing unprecedented challenges to its business model. Experienced observers and industry analysts have even predicted its imminent demise1–3. Over the past decade, serious concerns about the industry’s integrity and transparency — for example, around drug safety and efficacy — have been raised, compromising the industry’s image, and resulting in increased regulatory scrutiny4,5. This erosion in confi-dence in the industry and its products has resonated poorly with patients, health-care professionals, payers and shareholders. Indeed, the industry’s price/earnings ratio, a measure of the current valuation of the industry, has decreased below that of the S&P 500 index and has remained more or less flat, as have share prices for the past 7 years.
The industry’s profitability and growth prospects are also under pressure as healthcare budgets become increasingly strained. Generic drugs, although clearly helping to keep drug prices in check, are currently approaching 70% of all prescriptions written in the United States6. Moreover, key patent expirations between 2010–2014 have been estimated to put more than US$209 billion in annual drug sales at risk, resulting in $113 billion of sales being lost to generic substitution7. Indeed, for every dollar lost in declining product revenues due
to patent expirations by 2012, it has been estimated that large-cap pharmaceutical companies will only be able to replace on average 26 cents with new product revenues8.
Simply stated, without a dramatic increase in R&D productivity, today’s pharmaceutical industry cannot sustain sufficient innovation to replace the loss of rev-enues due to patent expirations for successful products. A key aspect of this problem is the decreasing number of truly innovative new medicines approved by the US Food and Drug Administration (FDA) and other major regulatory bodies around the world over the past 5 years (in which 50% fewer new molecular entities (NMEs) were approved compared with the previous 5 years)9. In 2007, for example, only 19 NMEs (including biologics) were approved by the FDA, the fewest number of NMEs approved since 1983, and the number rose only slightly to 21 in 2008. Of the 21 new drugs approved by the FDA in 2008, only 6 were developed by the 15 largest pharmaceutical companies and only 29% would be considered ‘first-in-class’ medicines. In 2009, 24 new drugs were approved, 10 of which were devel-oped by large pharmaceutical companies and only 17% of which could be considered first-in-class. Some have argued that the number of approved ‘mechanistically
Lilly Research Laboratories, Eli Lilly and Company, Lilly Corporate Center, Indianapolis, Indiana 46285, USA. Correspondence to: S.M.P. e-mail: [email protected]:10.1038/nrd3078 Published online 19 February 2010
New molecular entity(NME). A medication containing an active ingredient that has not been previously approved for marketing in any form in the United States. NME is conventionally used to refer only to small-molecule drugs, but in this article we use the term as a shorthand to refer to both new chemical entities and new biologic entities.
How to improve R&D productivity: the pharmaceutical industry’s grand challengeSteven M. Paul, Daniel S. Mytelka, Christopher T. Dunwiddie, Charles C. Persinger, Bernard H. Munos, Stacy R. Lindborg and Aaron L. Schacht
Abstract | The pharmaceutical industry is under growing pressure from a range of environmental issues, including major losses of revenue owing to patent expirations, increasingly cost-constrained healthcare systems and more demanding regulatory requirements. In our view, the key to tackling the challenges such issues pose to both the future viability of the pharmaceutical industry and advances in healthcare is to substantially increase the number and quality of innovative, cost-effective new medicines, without incurring unsustainable R&D costs. However, it is widely acknowledged that trends in industry R&D productivity have been moving in the opposite direction for a number of years. Here, we present a detailed analysis based on comprehensive, recent, industry-wide data to identify the relative contributions of each of the steps in the drug discovery and development process to overall R&D productivity. We then propose specific strategies that could have the most substantial impact in improving R&D productivity.
AnAlysIs
NATURE REvIEwS | Drug Discovery vOlUME 9 | MARch 2010 | 203
nrd_3078_mar10.indd 203 15/2/10 11:08:13
4 | OCTOBER 2011 | THE FUTURE OF DRUG INNOVATION | NATURE REPRINT COLLECTION www.nature.com/reprintcollections/lilly/drug-innovation
Nature Reviews | Drug Discovery
Launch
p(TS)
WIP needed for 1 launch
Cost per WIP per Phase
Cycle time (years)
Cost per launch (out of pocket)
% Total cost per NME
Cost of capital
Cost per launch (capitalized)
Target-to-hit
80%
24.3
$1
1.0
$24
3%
11%
$94
Hit-to-lead
75%
19.4
$2.5
1.5
$49
6%
$166
Leadoptimization
85%
14.6
$10
2.0
$146
17%
$414
Phase I
54%
8.6
$15
1.5
$128
15%
$273
Phase II
34%
4.6
$40
2.5
$185
21%
$319
Phase III
70%
1.6
$150
2.5
$235
27%
$314
Submissionto launch
91%
1.1
$40
1.5
$44
5%
$48
1
$873
$1,778
Preclinical
69%
12.4
$5
1.0
$62
7%
$150
Discovery Development
20 and 15 respectively (FIG. 2). we will discuss the need for sufficient discovery investments and output (WIP) to achieve the level of drug candidates necessary below. In this model, in the absence of sufficient acquisition of drug candidates, especially late-phase compounds, achieved as one-off in-license deals or through mergers and acquisitions (M&A), most companies are simply unable to achieve (or afford) the numbers of compounds distributed across the phases of discovery and develop-ment they require to achieve their goals for new NMEs launched without a substantial increase in productivity.
Encouragingly, recent benchmark data on Phase I WIP across the industry indicate that most companies have begun to substantially increase investments in the earlier stages of drug discovery; this is reflected by the number of candidates entering Phase I trials, which has increased significantly9,17,18. however, based on the benchmark data, for most companies, the number of NMEs entering clinical development and progressing to Phase II and III are still insufficient to achieve 2–5 launches per year9; this reflects many years of operating at WIP levels below what would be required in the ear-lier stages of drug discovery and development. Thus, inevitable pipeline gaps will arise (as they have) and given the CT of the process (FIG. 2), such gaps cannot be filled quickly through traditional means.
Finally, we suggest that based on this model, many companies would find that their R&D operating expenses are not appropriately distributed across the various phases of drug discovery and development. Too many resources are often applied to late-stage develop-ment of drug candidates with relatively low p(TS) and/or post-launch support of marketed products. This may be the root cause of the current drought of new medi-cines and the business challenges most companies are experiencing.
Key areas for improving R&D productivityUsing our model (FIG. 2, Supplementary information S2 (box)) and starting from a baseline value for the estimated capitalized cost of a single NME of ~$1.78 billion, we can investigate which parameters contributing to this cost are the most important. To achieve this, we have varied the parameters p(TS), CT and C for different phases of the overall process across a realistic range of possibilities (reasonable estimates of industry highs and lows for each parameter) to identify parameters for which changes would have the greatest impact on R&D efficiency, and the extent of the impact in each case (FIG. 3).
As is evident from FIG. 3, attrition — defined as 1– p(TS) — in the clinical phases of development (espe-cially Phase II and III) remains the most important
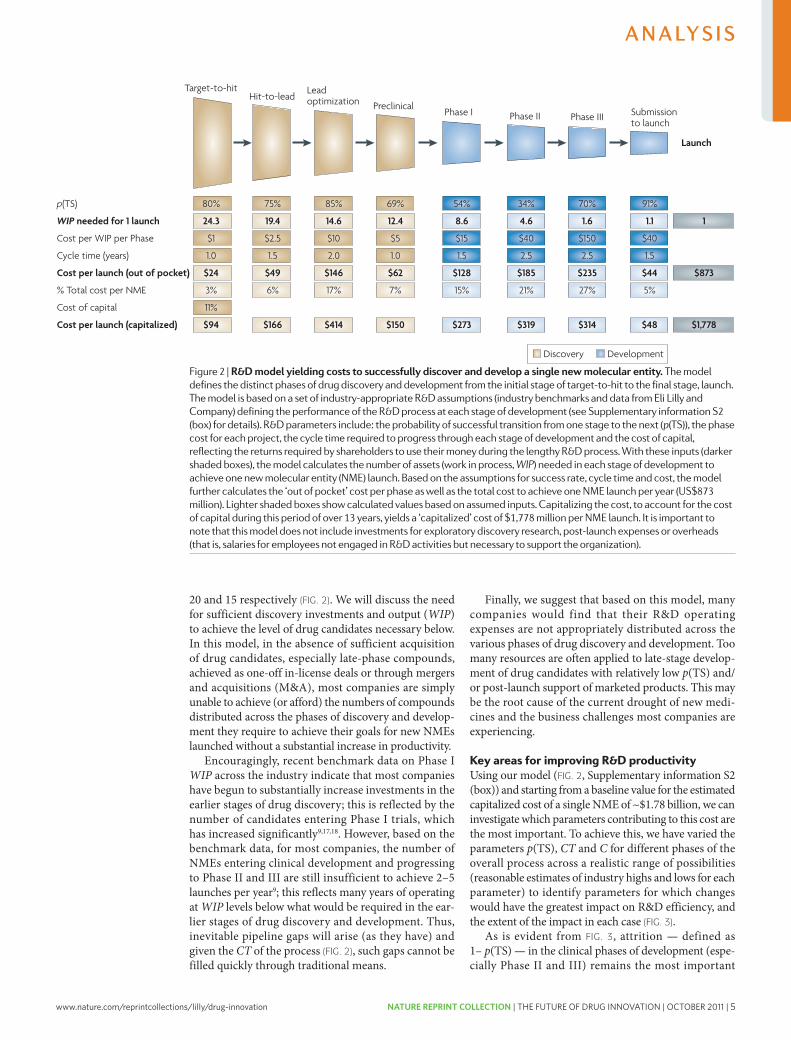
Figure 2 | r&D model yielding costs to successfully discover and develop a single new molecular entity. The model defines the distinct phases of drug discovery and development from the initial stage of target-to-hit to the final stage, launch. The model is based on a set of industry-appropriate R&D assumptions (industry benchmarks and data from Eli lilly and Company) defining the performance of the R&D process at each stage of development (see supplementary information s2 (box) for details). R&D parameters include: the probability of successful transition from one stage to the next (p(Ts)), the phase cost for each project, the cycle time required to progress through each stage of development and the cost of capital, reflecting the returns required by shareholders to use their money during the lengthy R&D process. With these inputs (darker shaded boxes), the model calculates the number of assets (work in process, WIP) needed in each stage of development to achieve one new molecular entity (nME) launch. Based on the assumptions for success rate, cycle time and cost, the model further calculates the ‘out of pocket’ cost per phase as well as the total cost to achieve one nME launch per year (Us$873 million). lighter shaded boxes show calculated values based on assumed inputs. Capitalizing the cost, to account for the cost of capital during this period of over 13 years, yields a ‘capitalized’ cost of $1,778 million per nME launch. It is important to note that this model does not include investments for exploratory discovery research, post-launch expenses or overheads (that is, salaries for employees not engaged in R&D activities but necessary to support the organization).
206 | MARch 2010 | vOlUME 9 www.nature.com/reviews/drugdisc
nrd_3078_mar10.indd 206 15/2/10 11:08:16
A n A ly s i s
Nature Reviews | Drug Discovery
Inputs
R&D efficiencyMore affordable drugsvia less costly R&D
R&D effectivenessMore value for the patientvia innovative drugs withhigh-quality information
Outputs Outcomes
Cost per launch Value per launch
Capitalized costThis is the out-of-pocket cost corrected for cost of capital, and is the standard accounting treatment for long-term investments. It recognizes the fact that investors require a return on research investments that reflects alternative potential uses of their investment. So, the capitalized cost per drug launch increases out-of-pocket costs by the cost of capital for every year from expenditure to launch.
Out-of-pocket costThis is the total cost required to expect one drug launch, taking into account attrition, but not the cost of capital.
Cost of capitalThis is the annual rate of return expected by investors based on the level of risk of the investment.
another. For example, as discussed below, having suf-ficient pipeline WIP (by phase of development) is crucial given the substantial phase-specific attrition rates. however, increasing WIP (especially late-phase WIP) alone will undoubtedly increase C and may also increase CT, which could further reduce P and diminish productivity.
Finally, although carrying out definitive health out-come studies on late-stage compounds before approval is often highly desirable and increasingly necessary to unequivocally demonstrate value (V) for reimbursement purposes, such studies can substantially increase CT and C, thus also diminishing P. Nevertheless, such studies will also increase V, potentially offsetting any decrease, or even increasing, P.
A model of R&D productivityTo inform efforts to increase R&D productivity (P), the key questions include: which of the associated elements have the greatest impact; how might they be improved; and by what magnitude? To help address these questions, we have built an economic model of drug discovery and development which, using industry-appropriate assump-tions, provides the basis for our estimate that the fully capitalized cost of an average NME developed by a typi-cal large pharmaceutical company is currently ~$1.8 billion) (see Supplementary information S2 (box) for details). The model has been constructed using recently available R&D performance productivity data from a group of 13 large pharmaceutical companies, provided by the Pharmaceutical Benchmarking Forum (PBF)16 (see Supplementary information S3 (box)), as well as our own internal data, to closely approximate the key elements of our productivity relationship that underlie R&D efficiency — C, WIP, CT and p(TS) — for each phase of discovery and development (FIG. 2).
we recognize that the estimated cost per NME is highly dependent on a number of economic or financial assumptions. consequently, for our estimated cost of an NME we show both ‘out of pocket’ and ‘capitalized’ costs using a cost of capital of 11% (FIG. 2). Our estimate repre-sents ‘molecule only’ costs and does not include the costs
of exploratory discovery research (target identification and validation) or other ‘non-molecule’ costs (which include overheads, such as salaries for employees that are not engaged in research and development activities but that are otherwise necessary to support the R&D organization; these represent approximately 20–30% of total costs). we discuss comparisons of our estimates with other reported estimates in Supplementary infor-mation S2 (box). however, for modelling purposes, the exact cost per NME is not crucial as long as our assump-tions for each parameter in our model are consistent and represent reasonable estimates. Each R&D organization can (and should) build a similar model based on their own data, which may vary from company to company.
The exact output of the model — the desired number of new launches (and the estimated commercial value per launch) — will depend on business aspirations, ther-apeutic focus and absolute level of R&D investments of a given company. Nonetheless, based on our model, a few key observations can be made.
First, clinical development (Phases I–III) accounts for approximately 63% of the costs for each NME launched (53% from Phase II to launch), and preclinical drug dis-covery accounts for 32%. however, this represents an underestimate of the costs for drug discovery, as we have excluded from our model the earliest phase of discovery research; that is, that prior to target selection. This is because the research required to identify and validate a given target is highly variable, making the underlying parameters difficult to quantify. however, target selec-tion may well be one of the most important determinants of attrition (p(TS)) and thus overall R&D productivity (discussed below).
Second, based on realistic and current assumptions on C, CT, p(TS) and WIP, only 8% of NMEs will success-fully make it from the point of candidate selection (pre-clinical stage) to launch (FIG. 2). It has been suggested that new biologic drugs have a higher probability of launch than small-molecule drugs9,11. For the purposes of our model, we have used 7% for small-molecule drugs and 11% for biologics.
Third, the process of discovering and developing an NME on average required approximately 13.5 years (CT) in 2007 (yearly averages ranged from 11.4 to 13.5 using the PBF study data across 2000–2007). This includes regulatory review but not the time it takes to fully identify and validate a drug target16.
Fourth, based on our model, the number of mol-ecules entering clinical development every year must be approximately 9 (or 11 if all small molecules) to yield a single NME launch per year. Most large companies aspire for 2–5 launches per year and therefore 18–45 Phase I starts (and resulting WIP) would be required annually. however, such numbers are rarely, if ever, achieved even in very large companies. If sustained over several years, this WIP deficit will result in a substantial pipeline gap. If it takes approximately 9 Phase I drug candidates annually to launch 1 NME per year and if these derive exclusively from a given company’s internal discovery efforts, then the number of discovery projects (WIP) from target-to-hit, hit-to-lead and lead optimization is approximately 25,
Figure 1 | Dimensions of r&D productivity. To improve R&D productivity, it is crucial to understand the interdependencies between inputs (for example, R&D investments), output (for example, new molecular entity launches) and outcomes (for example, valued outcomes for patients). This figure outlines the key dimensions of R&D productivity and the goals tied to R&D efficiency and effectiveness. An effective R&D productivity strategy must encompass both of these components. Value will be created by delivering innovative products with high-quality information.
NATURE REvIEwS | Drug Discovery vOlUME 9 | MARch 2010 | 205
nrd_3078_mar10.indd 205 15/2/10 11:08:16
A n A ly s i s
www.nature.com/reprintcollections/lilly/drug-innovation NATURE REPRINT COLLECTION | THE FUTURE OF DRUG INNOVATION | OCTOBER 2011 | 5
Nature Reviews | Drug Discovery
Launch
p(TS)
WIP needed for 1 launch
Cost per WIP per Phase
Cycle time (years)
Cost per launch (out of pocket)
% Total cost per NME
Cost of capital
Cost per launch (capitalized)
Target-to-hit
80%
24.3
$1
1.0
$24
3%
11%
$94
Hit-to-lead
75%
19.4
$2.5
1.5
$49
6%
$166
Leadoptimization
85%
14.6
$10
2.0
$146
17%
$414
Phase I
54%
8.6
$15
1.5
$128
15%
$273
Phase II
34%
4.6
$40
2.5
$185
21%
$319
Phase III
70%
1.6
$150
2.5
$235
27%
$314
Submissionto launch
91%
1.1
$40
1.5
$44
5%
$48
1
$873
$1,778
Preclinical
69%
12.4
$5
1.0
$62
7%
$150
Discovery Development
20 and 15 respectively (FIG. 2). we will discuss the need for sufficient discovery investments and output (WIP) to achieve the level of drug candidates necessary below. In this model, in the absence of sufficient acquisition of drug candidates, especially late-phase compounds, achieved as one-off in-license deals or through mergers and acquisitions (M&A), most companies are simply unable to achieve (or afford) the numbers of compounds distributed across the phases of discovery and develop-ment they require to achieve their goals for new NMEs launched without a substantial increase in productivity.
Encouragingly, recent benchmark data on Phase I WIP across the industry indicate that most companies have begun to substantially increase investments in the earlier stages of drug discovery; this is reflected by the number of candidates entering Phase I trials, which has increased significantly9,17,18. however, based on the benchmark data, for most companies, the number of NMEs entering clinical development and progressing to Phase II and III are still insufficient to achieve 2–5 launches per year9; this reflects many years of operating at WIP levels below what would be required in the ear-lier stages of drug discovery and development. Thus, inevitable pipeline gaps will arise (as they have) and given the CT of the process (FIG. 2), such gaps cannot be filled quickly through traditional means.
Finally, we suggest that based on this model, many companies would find that their R&D operating expenses are not appropriately distributed across the various phases of drug discovery and development. Too many resources are often applied to late-stage develop-ment of drug candidates with relatively low p(TS) and/or post-launch support of marketed products. This may be the root cause of the current drought of new medi-cines and the business challenges most companies are experiencing.
Key areas for improving R&D productivityUsing our model (FIG. 2, Supplementary information S2 (box)) and starting from a baseline value for the estimated capitalized cost of a single NME of ~$1.78 billion, we can investigate which parameters contributing to this cost are the most important. To achieve this, we have varied the parameters p(TS), CT and C for different phases of the overall process across a realistic range of possibilities (reasonable estimates of industry highs and lows for each parameter) to identify parameters for which changes would have the greatest impact on R&D efficiency, and the extent of the impact in each case (FIG. 3).
As is evident from FIG. 3, attrition — defined as 1– p(TS) — in the clinical phases of development (espe-cially Phase II and III) remains the most important
Figure 2 | r&D model yielding costs to successfully discover and develop a single new molecular entity. The model defines the distinct phases of drug discovery and development from the initial stage of target-to-hit to the final stage, launch. The model is based on a set of industry-appropriate R&D assumptions (industry benchmarks and data from Eli lilly and Company) defining the performance of the R&D process at each stage of development (see supplementary information s2 (box) for details). R&D parameters include: the probability of successful transition from one stage to the next (p(Ts)), the phase cost for each project, the cycle time required to progress through each stage of development and the cost of capital, reflecting the returns required by shareholders to use their money during the lengthy R&D process. With these inputs (darker shaded boxes), the model calculates the number of assets (work in process, WIP) needed in each stage of development to achieve one new molecular entity (nME) launch. Based on the assumptions for success rate, cycle time and cost, the model further calculates the ‘out of pocket’ cost per phase as well as the total cost to achieve one nME launch per year (Us$873 million). lighter shaded boxes show calculated values based on assumed inputs. Capitalizing the cost, to account for the cost of capital during this period of over 13 years, yields a ‘capitalized’ cost of $1,778 million per nME launch. It is important to note that this model does not include investments for exploratory discovery research, post-launch expenses or overheads (that is, salaries for employees not engaged in R&D activities but necessary to support the organization).
206 | MARch 2010 | vOlUME 9 www.nature.com/reviews/drugdisc
nrd_3078_mar10.indd 206 15/2/10 11:08:16
A n A ly s i s
Nature Reviews | Drug Discovery
Inputs
R&D efficiencyMore affordable drugsvia less costly R&D
R&D effectivenessMore value for the patientvia innovative drugs withhigh-quality information
Outputs Outcomes
Cost per launch Value per launch
Capitalized costThis is the out-of-pocket cost corrected for cost of capital, and is the standard accounting treatment for long-term investments. It recognizes the fact that investors require a return on research investments that reflects alternative potential uses of their investment. So, the capitalized cost per drug launch increases out-of-pocket costs by the cost of capital for every year from expenditure to launch.
Out-of-pocket costThis is the total cost required to expect one drug launch, taking into account attrition, but not the cost of capital.
Cost of capitalThis is the annual rate of return expected by investors based on the level of risk of the investment.
another. For example, as discussed below, having suf-ficient pipeline WIP (by phase of development) is crucial given the substantial phase-specific attrition rates. however, increasing WIP (especially late-phase WIP) alone will undoubtedly increase C and may also increase CT, which could further reduce P and diminish productivity.
Finally, although carrying out definitive health out-come studies on late-stage compounds before approval is often highly desirable and increasingly necessary to unequivocally demonstrate value (V) for reimbursement purposes, such studies can substantially increase CT and C, thus also diminishing P. Nevertheless, such studies will also increase V, potentially offsetting any decrease, or even increasing, P.
A model of R&D productivityTo inform efforts to increase R&D productivity (P), the key questions include: which of the associated elements have the greatest impact; how might they be improved; and by what magnitude? To help address these questions, we have built an economic model of drug discovery and development which, using industry-appropriate assump-tions, provides the basis for our estimate that the fully capitalized cost of an average NME developed by a typi-cal large pharmaceutical company is currently ~$1.8 billion) (see Supplementary information S2 (box) for details). The model has been constructed using recently available R&D performance productivity data from a group of 13 large pharmaceutical companies, provided by the Pharmaceutical Benchmarking Forum (PBF)16 (see Supplementary information S3 (box)), as well as our own internal data, to closely approximate the key elements of our productivity relationship that underlie R&D efficiency — C, WIP, CT and p(TS) — for each phase of discovery and development (FIG. 2).
we recognize that the estimated cost per NME is highly dependent on a number of economic or financial assumptions. consequently, for our estimated cost of an NME we show both ‘out of pocket’ and ‘capitalized’ costs using a cost of capital of 11% (FIG. 2). Our estimate repre-sents ‘molecule only’ costs and does not include the costs
of exploratory discovery research (target identification and validation) or other ‘non-molecule’ costs (which include overheads, such as salaries for employees that are not engaged in research and development activities but that are otherwise necessary to support the R&D organization; these represent approximately 20–30% of total costs). we discuss comparisons of our estimates with other reported estimates in Supplementary infor-mation S2 (box). however, for modelling purposes, the exact cost per NME is not crucial as long as our assump-tions for each parameter in our model are consistent and represent reasonable estimates. Each R&D organization can (and should) build a similar model based on their own data, which may vary from company to company.
The exact output of the model — the desired number of new launches (and the estimated commercial value per launch) — will depend on business aspirations, ther-apeutic focus and absolute level of R&D investments of a given company. Nonetheless, based on our model, a few key observations can be made.
First, clinical development (Phases I–III) accounts for approximately 63% of the costs for each NME launched (53% from Phase II to launch), and preclinical drug dis-covery accounts for 32%. however, this represents an underestimate of the costs for drug discovery, as we have excluded from our model the earliest phase of discovery research; that is, that prior to target selection. This is because the research required to identify and validate a given target is highly variable, making the underlying parameters difficult to quantify. however, target selec-tion may well be one of the most important determinants of attrition (p(TS)) and thus overall R&D productivity (discussed below).
Second, based on realistic and current assumptions on C, CT, p(TS) and WIP, only 8% of NMEs will success-fully make it from the point of candidate selection (pre-clinical stage) to launch (FIG. 2). It has been suggested that new biologic drugs have a higher probability of launch than small-molecule drugs9,11. For the purposes of our model, we have used 7% for small-molecule drugs and 11% for biologics.
Third, the process of discovering and developing an NME on average required approximately 13.5 years (CT) in 2007 (yearly averages ranged from 11.4 to 13.5 using the PBF study data across 2000–2007). This includes regulatory review but not the time it takes to fully identify and validate a drug target16.
Fourth, based on our model, the number of mol-ecules entering clinical development every year must be approximately 9 (or 11 if all small molecules) to yield a single NME launch per year. Most large companies aspire for 2–5 launches per year and therefore 18–45 Phase I starts (and resulting WIP) would be required annually. however, such numbers are rarely, if ever, achieved even in very large companies. If sustained over several years, this WIP deficit will result in a substantial pipeline gap. If it takes approximately 9 Phase I drug candidates annually to launch 1 NME per year and if these derive exclusively from a given company’s internal discovery efforts, then the number of discovery projects (WIP) from target-to-hit, hit-to-lead and lead optimization is approximately 25,
Figure 1 | Dimensions of r&D productivity. To improve R&D productivity, it is crucial to understand the interdependencies between inputs (for example, R&D investments), output (for example, new molecular entity launches) and outcomes (for example, valued outcomes for patients). This figure outlines the key dimensions of R&D productivity and the goals tied to R&D efficiency and effectiveness. An effective R&D productivity strategy must encompass both of these components. Value will be created by delivering innovative products with high-quality information.
NATURE REvIEwS | Drug Discovery vOlUME 9 | MARch 2010 | 205
nrd_3078_mar10.indd 205 15/2/10 11:08:16
A n A ly s i s
6 | OCTOBER 2011 | THE FUTURE OF DRUG INNOVATION | NATURE REPRINT COLLECTION www.nature.com/reprintcollections/lilly/drug-innovation
Nature Reviews | Drug Discovery
Phas
e I e
ntrie
s (F
HD
s)
20
18
16
14
12
10
8
2
4
6
015 20 25 30 35 40 45 50 55 60 65
Phase II p(TS) (%)
25%
50%
Phase III p(TS) (%)
50%60%70%80%90%Estimate used
in the model
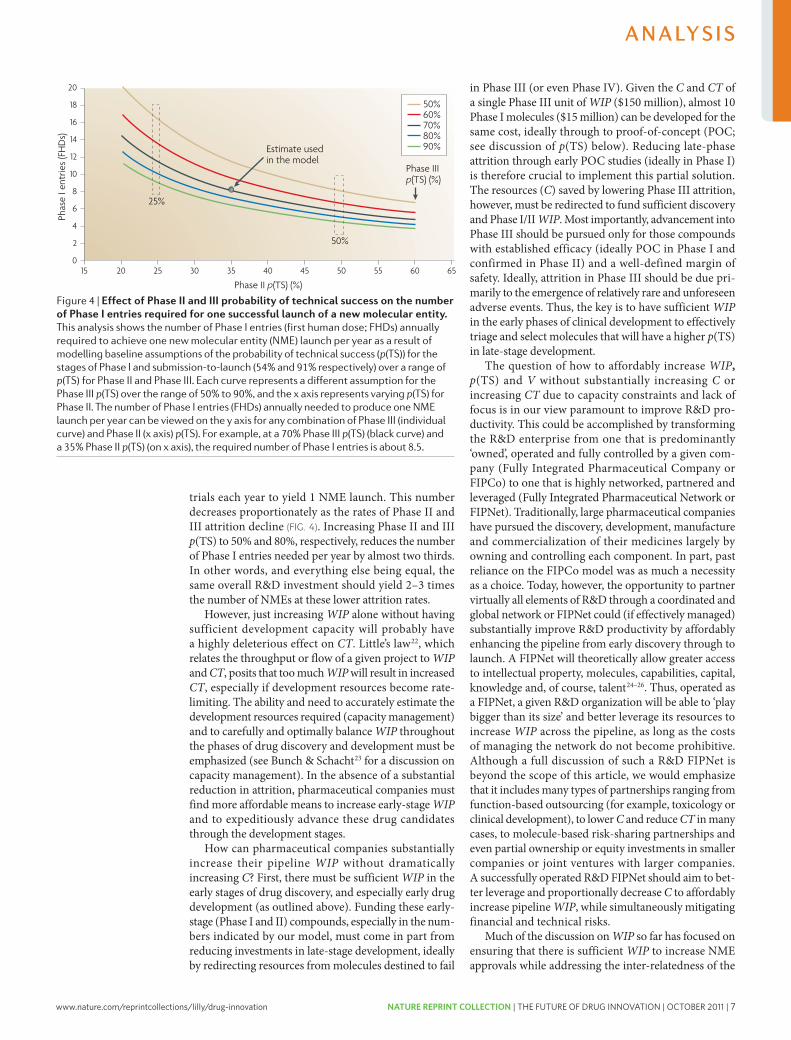
trials each year to yield 1 NME launch. This number decreases proportionately as the rates of Phase II and III attrition decline (FIG. 4). Increasing Phase II and III p(TS) to 50% and 80%, respectively, reduces the number of Phase I entries needed per year by almost two thirds. In other words, and everything else being equal, the same overall R&D investment should yield 2–3 times the number of NMEs at these lower attrition rates.
however, just increasing WIP alone without having sufficient development capacity will probably have a highly deleterious effect on CT. little’s law22, which relates the throughput or flow of a given project to WIP and CT, posits that too much WIP will result in increased CT, especially if development resources become rate-limiting. The ability and need to accurately estimate the development resources required (capacity management) and to carefully and optimally balance WIP throughout the phases of drug discovery and development must be emphasized (see Bunch & Schacht23 for a discussion on capacity management). In the absence of a substantial reduction in attrition, pharmaceutical companies must find more affordable means to increase early-stage WIP and to expeditiously advance these drug candidates through the development stages.
how can pharmaceutical companies substantially increase their pipeline WIP without dramatically increasing C? First, there must be sufficient WIP in the early stages of drug discovery, and especially early drug development (as outlined above). Funding these early-stage (Phase I and II) compounds, especially in the num-bers indicated by our model, must come in part from reducing investments in late-stage development, ideally by redirecting resources from molecules destined to fail
in Phase III (or even Phase Iv). Given the C and CT of a single Phase III unit of WIP ($150 million), almost 10 Phase I molecules ($15 million) can be developed for the same cost, ideally through to proof-of-concept (POc; see discussion of p(TS) below). Reducing late-phase attrition through early POc studies (ideally in Phase I) is therefore crucial to implement this partial solution. The resources (C) saved by lowering Phase III attrition, however, must be redirected to fund sufficient discovery and Phase I/II WIP. Most importantly, advancement into Phase III should be pursued only for those compounds with established efficacy (ideally POc in Phase I and confirmed in Phase II) and a well-defined margin of safety. Ideally, attrition in Phase III should be due pri-marily to the emergence of relatively rare and unforeseen adverse events. Thus, the key is to have sufficient WIP in the early phases of clinical development to effectively triage and select molecules that will have a higher p(TS) in late-stage development.
The question of how to affordably increase WIP, p(TS) and V without substantially increasing C or increasing CT due to capacity constraints and lack of focus is in our view paramount to improve R&D pro-ductivity. This could be accomplished by transforming the R&D enterprise from one that is predominantly ‘owned’, operated and fully controlled by a given com-pany (Fully Integrated Pharmaceutical company or FIPco) to one that is highly networked, partnered and leveraged (Fully Integrated Pharmaceutical Network or FIPNet). Traditionally, large pharmaceutical companies have pursued the discovery, development, manufacture and commercialization of their medicines largely by owning and controlling each component. In part, past reliance on the FIPco model was as much a necessity as a choice. Today, however, the opportunity to partner virtually all elements of R&D through a coordinated and global network or FIPNet could (if effectively managed) substantially improve R&D productivity by affordably enhancing the pipeline from early discovery through to launch. A FIPNet will theoretically allow greater access to intellectual property, molecules, capabilities, capital, knowledge and, of course, talent24–26. Thus, operated as a FIPNet, a given R&D organization will be able to ‘play bigger than its size’ and better leverage its resources to increase WIP across the pipeline, as long as the costs of managing the network do not become prohibitive. Although a full discussion of such a R&D FIPNet is beyond the scope of this article, we would emphasize that it includes many types of partnerships ranging from function-based outsourcing (for example, toxicology or clinical development), to lower C and reduce CT in many cases, to molecule-based risk-sharing partnerships and even partial ownership or equity investments in smaller companies or joint ventures with larger companies. A successfully operated R&D FIPNet should aim to bet-ter leverage and proportionally decrease C to affordably increase pipeline WIP, while simultaneously mitigating financial and technical risks.
Much of the discussion on WIP so far has focused on ensuring that there is sufficient WIP to increase NME approvals while addressing the inter-relatedness of the
Figure 4 | effect of Phase ii and iii probability of technical success on the number of Phase i entries required for one successful launch of a new molecular entity. This analysis shows the number of Phase I entries (first human dose; FHDs) annually required to achieve one new molecular entity (nME) launch per year as a result of modelling baseline assumptions of the probability of technical success (p(Ts)) for the stages of Phase I and submission-to-launch (54% and 91% respectively) over a range of p(Ts) for Phase II and Phase III. Each curve represents a different assumption for the Phase III p(Ts) over the range of 50% to 90%, and the x axis represents varying p(Ts) for Phase II. The number of Phase I entries (FHDs) annually needed to produce one nME launch per year can be viewed on the y axis for any combination of Phase III (individual curve) and Phase II (x axis) p(Ts). For example, at a 70% Phase III p(Ts) (black curve) and a 35% Phase II p(Ts) (on x axis), the required number of Phase I entries is about 8.5.
208 | MARch 2010 | vOlUME 9 www.nature.com/reviews/drugdisc
nrd_3078_mar10.indd 208 15/2/10 11:08:18
A n A ly s i s
Nature Reviews | Drug Discovery
p(TS): Phase IIp(TS): Phase III
Cost: lead optimizationCycle time: Phase III
p(TS): Phase Ip(TS): submission to launch
Cycle time: Phase IICost: Phase IICost: Phase III
Cycle time: submission to launchCost: Phase I
p(TS): preclinicalCost: hit-to-lead
p(TS): lead optimizationCycle time: Phase I
Cost: preclinicalCycle time: lead optimization
Cost: target-to-hitCycle time: preclinical
p(TS): hit-to-leadCost: submission to launch
Cycle time: hit-to-leadp(TS): target-to-hit
Cycle time: target-to-hit
34%70%$10 million2.5 years54%91%2.5 years$40 million$150 million1.5 years$15 million69%$2.5 million85%1.5 years$5 million2 years$1 million1 year75%$40 million1.5 years80%1 year
Capitalized cost per launch (US$ millions)
$1,200 $1,400 $1,600 $1,800 $2,000 $2,200 $2,400
Parameter Baseline value
25%60%
$153.7545%
80%3.75
$60$225
2.25$22.5
60%$3.7575%
2.25$7.5
3.0$1.51.565%
$602.2570%
1.5
50%80%
$51.2565%100%
1.25$20$750.75$7.580%
$1.2595%0.75$2.5
1.0$0.5
0.585%$200.7590%
0.5
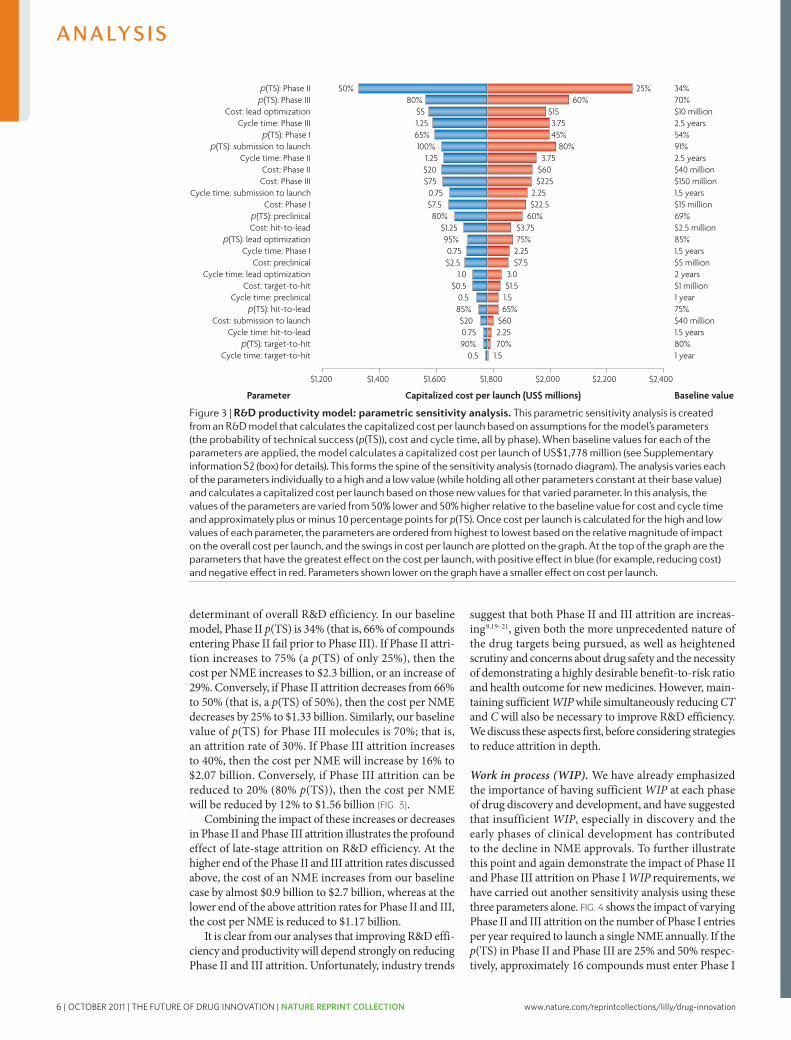
determinant of overall R&D efficiency. In our baseline model, Phase II p(TS) is 34% (that is, 66% of compounds entering Phase II fail prior to Phase III). If Phase II attri-tion increases to 75% (a p(TS) of only 25%), then the cost per NME increases to $2.3 billion, or an increase of 29%. conversely, if Phase II attrition decreases from 66% to 50% (that is, a p(TS) of 50%), then the cost per NME decreases by 25% to $1.33 billion. Similarly, our baseline value of p(TS) for Phase III molecules is 70%; that is, an attrition rate of 30%. If Phase III attrition increases to 40%, then the cost per NME will increase by 16% to $2.07 billion. conversely, if Phase III attrition can be reduced to 20% (80% p(TS)), then the cost per NME will be reduced by 12% to $1.56 billion (FIG. 3).
combining the impact of these increases or decreases in Phase II and Phase III attrition illustrates the profound effect of late-stage attrition on R&D efficiency. At the higher end of the Phase II and III attrition rates discussed above, the cost of an NME increases from our baseline case by almost $0.9 billion to $2.7 billion, whereas at the lower end of the above attrition rates for Phase II and III, the cost per NME is reduced to $1.17 billion.
It is clear from our analyses that improving R&D effi-ciency and productivity will depend strongly on reducing Phase II and III attrition. Unfortunately, industry trends
suggest that both Phase II and III attrition are increas-ing9,19–21, given both the more unprecedented nature of the drug targets being pursued, as well as heightened scrutiny and concerns about drug safety and the necessity of demonstrating a highly desirable benefit-to-risk ratio and health outcome for new medicines. however, main-taining sufficient WIP while simultaneously reducing CT and C will also be necessary to improve R&D efficiency. we discuss these aspects first, before considering strategies to reduce attrition in depth.
Work in process (WIP). we have already emphasized the importance of having sufficient WIP at each phase of drug discovery and development, and have suggested that insufficient WIP, especially in discovery and the early phases of clinical development has contributed to the decline in NME approvals. To further illustrate this point and again demonstrate the impact of Phase II and Phase III attrition on Phase I WIP requirements, we have carried out another sensitivity analysis using these three parameters alone. FIG. 4 shows the impact of varying Phase II and III attrition on the number of Phase I entries per year required to launch a single NME annually. If the p(TS) in Phase II and Phase III are 25% and 50% respec-tively, approximately 16 compounds must enter Phase I
Figure 3 | r&D productivity model: parametric sensitivity analysis. This parametric sensitivity analysis is created from an R&D model that calculates the capitalized cost per launch based on assumptions for the model’s parameters (the probability of technical success (p(Ts)), cost and cycle time, all by phase). When baseline values for each of the parameters are applied, the model calculates a capitalized cost per launch of Us$1,778 million (see supplementary information s2 (box) for details). This forms the spine of the sensitivity analysis (tornado diagram). The analysis varies each of the parameters individually to a high and a low value (while holding all other parameters constant at their base value) and calculates a capitalized cost per launch based on those new values for that varied parameter. In this analysis, the values of the parameters are varied from 50% lower and 50% higher relative to the baseline value for cost and cycle time and approximately plus or minus 10 percentage points for p(Ts). Once cost per launch is calculated for the high and low values of each parameter, the parameters are ordered from highest to lowest based on the relative magnitude of impact on the overall cost per launch, and the swings in cost per launch are plotted on the graph. At the top of the graph are the parameters that have the greatest effect on the cost per launch, with positive effect in blue (for example, reducing cost) and negative effect in red. Parameters shown lower on the graph have a smaller effect on cost per launch.
NATURE REvIEwS | Drug Discovery vOlUME 9 | MARch 2010 | 207
nrd_3078_mar10.indd 207 15/2/10 11:08:17
A n A ly s i s
www.nature.com/reprintcollections/lilly/drug-innovation NATURE REPRINT COLLECTION | THE FUTURE OF DRUG INNOVATION | OCTOBER 2011 | 7
Nature Reviews | Drug Discovery
Phas
e I e
ntrie
s (F
HD
s)
20
18
16
14
12
10
8
2
4
6
015 20 25 30 35 40 45 50 55 60 65
Phase II p(TS) (%)
25%
50%
Phase III p(TS) (%)
50%60%70%80%90%Estimate used
in the model
trials each year to yield 1 NME launch. This number decreases proportionately as the rates of Phase II and III attrition decline (FIG. 4). Increasing Phase II and III p(TS) to 50% and 80%, respectively, reduces the number of Phase I entries needed per year by almost two thirds. In other words, and everything else being equal, the same overall R&D investment should yield 2–3 times the number of NMEs at these lower attrition rates.
however, just increasing WIP alone without having sufficient development capacity will probably have a highly deleterious effect on CT. little’s law22, which relates the throughput or flow of a given project to WIP and CT, posits that too much WIP will result in increased CT, especially if development resources become rate-limiting. The ability and need to accurately estimate the development resources required (capacity management) and to carefully and optimally balance WIP throughout the phases of drug discovery and development must be emphasized (see Bunch & Schacht23 for a discussion on capacity management). In the absence of a substantial reduction in attrition, pharmaceutical companies must find more affordable means to increase early-stage WIP and to expeditiously advance these drug candidates through the development stages.
how can pharmaceutical companies substantially increase their pipeline WIP without dramatically increasing C? First, there must be sufficient WIP in the early stages of drug discovery, and especially early drug development (as outlined above). Funding these early-stage (Phase I and II) compounds, especially in the num-bers indicated by our model, must come in part from reducing investments in late-stage development, ideally by redirecting resources from molecules destined to fail
in Phase III (or even Phase Iv). Given the C and CT of a single Phase III unit of WIP ($150 million), almost 10 Phase I molecules ($15 million) can be developed for the same cost, ideally through to proof-of-concept (POc; see discussion of p(TS) below). Reducing late-phase attrition through early POc studies (ideally in Phase I) is therefore crucial to implement this partial solution. The resources (C) saved by lowering Phase III attrition, however, must be redirected to fund sufficient discovery and Phase I/II WIP. Most importantly, advancement into Phase III should be pursued only for those compounds with established efficacy (ideally POc in Phase I and confirmed in Phase II) and a well-defined margin of safety. Ideally, attrition in Phase III should be due pri-marily to the emergence of relatively rare and unforeseen adverse events. Thus, the key is to have sufficient WIP in the early phases of clinical development to effectively triage and select molecules that will have a higher p(TS) in late-stage development.
The question of how to affordably increase WIP, p(TS) and V without substantially increasing C or increasing CT due to capacity constraints and lack of focus is in our view paramount to improve R&D pro-ductivity. This could be accomplished by transforming the R&D enterprise from one that is predominantly ‘owned’, operated and fully controlled by a given com-pany (Fully Integrated Pharmaceutical company or FIPco) to one that is highly networked, partnered and leveraged (Fully Integrated Pharmaceutical Network or FIPNet). Traditionally, large pharmaceutical companies have pursued the discovery, development, manufacture and commercialization of their medicines largely by owning and controlling each component. In part, past reliance on the FIPco model was as much a necessity as a choice. Today, however, the opportunity to partner virtually all elements of R&D through a coordinated and global network or FIPNet could (if effectively managed) substantially improve R&D productivity by affordably enhancing the pipeline from early discovery through to launch. A FIPNet will theoretically allow greater access to intellectual property, molecules, capabilities, capital, knowledge and, of course, talent24–26. Thus, operated as a FIPNet, a given R&D organization will be able to ‘play bigger than its size’ and better leverage its resources to increase WIP across the pipeline, as long as the costs of managing the network do not become prohibitive. Although a full discussion of such a R&D FIPNet is beyond the scope of this article, we would emphasize that it includes many types of partnerships ranging from function-based outsourcing (for example, toxicology or clinical development), to lower C and reduce CT in many cases, to molecule-based risk-sharing partnerships and even partial ownership or equity investments in smaller companies or joint ventures with larger companies. A successfully operated R&D FIPNet should aim to bet-ter leverage and proportionally decrease C to affordably increase pipeline WIP, while simultaneously mitigating financial and technical risks.
Much of the discussion on WIP so far has focused on ensuring that there is sufficient WIP to increase NME approvals while addressing the inter-relatedness of the
Figure 4 | effect of Phase ii and iii probability of technical success on the number of Phase i entries required for one successful launch of a new molecular entity. This analysis shows the number of Phase I entries (first human dose; FHDs) annually required to achieve one new molecular entity (nME) launch per year as a result of modelling baseline assumptions of the probability of technical success (p(Ts)) for the stages of Phase I and submission-to-launch (54% and 91% respectively) over a range of p(Ts) for Phase II and Phase III. Each curve represents a different assumption for the Phase III p(Ts) over the range of 50% to 90%, and the x axis represents varying p(Ts) for Phase II. The number of Phase I entries (FHDs) annually needed to produce one nME launch per year can be viewed on the y axis for any combination of Phase III (individual curve) and Phase II (x axis) p(Ts). For example, at a 70% Phase III p(Ts) (black curve) and a 35% Phase II p(Ts) (on x axis), the required number of Phase I entries is about 8.5.
208 | MARch 2010 | vOlUME 9 www.nature.com/reviews/drugdisc
nrd_3078_mar10.indd 208 15/2/10 11:08:18
A n A ly s i s
Nature Reviews | Drug Discovery
p(TS): Phase IIp(TS): Phase III
Cost: lead optimizationCycle time: Phase III
p(TS): Phase Ip(TS): submission to launch
Cycle time: Phase IICost: Phase IICost: Phase III
Cycle time: submission to launchCost: Phase I
p(TS): preclinicalCost: hit-to-lead
p(TS): lead optimizationCycle time: Phase I
Cost: preclinicalCycle time: lead optimization
Cost: target-to-hitCycle time: preclinical
p(TS): hit-to-leadCost: submission to launch
Cycle time: hit-to-leadp(TS): target-to-hit
Cycle time: target-to-hit
34%70%$10 million2.5 years54%91%2.5 years$40 million$150 million1.5 years$15 million69%$2.5 million85%1.5 years$5 million2 years$1 million1 year75%$40 million1.5 years80%1 year
Capitalized cost per launch (US$ millions)
$1,200 $1,400 $1,600 $1,800 $2,000 $2,200 $2,400
Parameter Baseline value
25%60%
$153.7545%
80%3.75
$60$225
2.25$22.5
60%$3.7575%
2.25$7.5
3.0$1.51.565%
$602.2570%
1.5
50%80%
$51.2565%100%
1.25$20$750.75$7.580%
$1.2595%0.75$2.5
1.0$0.5
0.585%$200.7590%
0.5
determinant of overall R&D efficiency. In our baseline model, Phase II p(TS) is 34% (that is, 66% of compounds entering Phase II fail prior to Phase III). If Phase II attri-tion increases to 75% (a p(TS) of only 25%), then the cost per NME increases to $2.3 billion, or an increase of 29%. conversely, if Phase II attrition decreases from 66% to 50% (that is, a p(TS) of 50%), then the cost per NME decreases by 25% to $1.33 billion. Similarly, our baseline value of p(TS) for Phase III molecules is 70%; that is, an attrition rate of 30%. If Phase III attrition increases to 40%, then the cost per NME will increase by 16% to $2.07 billion. conversely, if Phase III attrition can be reduced to 20% (80% p(TS)), then the cost per NME will be reduced by 12% to $1.56 billion (FIG. 3).
combining the impact of these increases or decreases in Phase II and Phase III attrition illustrates the profound effect of late-stage attrition on R&D efficiency. At the higher end of the Phase II and III attrition rates discussed above, the cost of an NME increases from our baseline case by almost $0.9 billion to $2.7 billion, whereas at the lower end of the above attrition rates for Phase II and III, the cost per NME is reduced to $1.17 billion.
It is clear from our analyses that improving R&D effi-ciency and productivity will depend strongly on reducing Phase II and III attrition. Unfortunately, industry trends
suggest that both Phase II and III attrition are increas-ing9,19–21, given both the more unprecedented nature of the drug targets being pursued, as well as heightened scrutiny and concerns about drug safety and the necessity of demonstrating a highly desirable benefit-to-risk ratio and health outcome for new medicines. however, main-taining sufficient WIP while simultaneously reducing CT and C will also be necessary to improve R&D efficiency. we discuss these aspects first, before considering strategies to reduce attrition in depth.
Work in process (WIP). we have already emphasized the importance of having sufficient WIP at each phase of drug discovery and development, and have suggested that insufficient WIP, especially in discovery and the early phases of clinical development has contributed to the decline in NME approvals. To further illustrate this point and again demonstrate the impact of Phase II and Phase III attrition on Phase I WIP requirements, we have carried out another sensitivity analysis using these three parameters alone. FIG. 4 shows the impact of varying Phase II and III attrition on the number of Phase I entries per year required to launch a single NME annually. If the p(TS) in Phase II and Phase III are 25% and 50% respec-tively, approximately 16 compounds must enter Phase I
Figure 3 | r&D productivity model: parametric sensitivity analysis. This parametric sensitivity analysis is created from an R&D model that calculates the capitalized cost per launch based on assumptions for the model’s parameters (the probability of technical success (p(Ts)), cost and cycle time, all by phase). When baseline values for each of the parameters are applied, the model calculates a capitalized cost per launch of Us$1,778 million (see supplementary information s2 (box) for details). This forms the spine of the sensitivity analysis (tornado diagram). The analysis varies each of the parameters individually to a high and a low value (while holding all other parameters constant at their base value) and calculates a capitalized cost per launch based on those new values for that varied parameter. In this analysis, the values of the parameters are varied from 50% lower and 50% higher relative to the baseline value for cost and cycle time and approximately plus or minus 10 percentage points for p(Ts). Once cost per launch is calculated for the high and low values of each parameter, the parameters are ordered from highest to lowest based on the relative magnitude of impact on the overall cost per launch, and the swings in cost per launch are plotted on the graph. At the top of the graph are the parameters that have the greatest effect on the cost per launch, with positive effect in blue (for example, reducing cost) and negative effect in red. Parameters shown lower on the graph have a smaller effect on cost per launch.
NATURE REvIEwS | Drug Discovery vOlUME 9 | MARch 2010 | 207
nrd_3078_mar10.indd 207 15/2/10 11:08:17
A n A ly s i s
8 | OCTOBER 2011 | THE FUTURE OF DRUG INNOVATION | NATURE REPRINT COLLECTION www.nature.com/reprintcollections/lilly/drug-innovation
new drug may require many months or years of continued treatment. Moreover, even for drugs for which efficacy can be established relatively quickly (for example, in diabetes), establishing safety, especially cardiovascular safety, may require many months or years of treatment. Thus, con-sidering disease-specific CTs when selecting molecules or projects for clinical development is crucial for determin-ing the overall movement or flow of a given pipeline.
The second approach to reducing CT is the iden-tification and optimization of the ‘critical chain’ of project tasks. This approach is based on the concepts put forth in the “Theory of constraints” by Goldratt31, wherein the critical chain of tasks is identified and then the sequence, priority and extent of parallel execution is determined prior to project or clinical trial execu-tion. This approach to project management carefully monitors the critical chain and as delays are encoun-tered and incurred, the chain can be reconfigured (in real time) with the aim of recovering any overall project delay. In our experience, when this approach is lever-aged against an entire R&D portfolio, it can result in markedly improved CTs. Thus, CT reduction for the unit work processes that allow for the completion of critical chain tasks is essential.
Once a critical chain of tasks is established, there is the opportunity to improve the business and research processes used to deliver the tasks within the project plan. Each task relies on a process, which is often repeat-able and therefore suitable for optimization. Process improvement techniques such as Six Sigma can often be applied to achieve process CT reduction. Examples of this include the introduction of automation for the rapid processing of samples, the use of information tech-nology to support real-time data capture or optimiza-tion of clinical trial enrolment. however, elimination of non-value-added activities from the critical chain of tasks is also essential. Examination of the R&D pro cess can result in the identification of activities and tasks that add little or minimal value to desired outputs or out-comes. Often, these tasks are left over from historical approaches to R&D that have become obsolete, or are inefficient bureaucratic procedures associated with the management of R&D that have become institutional-ized in an organization, such as multiple serial project reviews by the leadership of each R&D function. when such non-value added tasks reside on the critical chain of the project, they will delay the project from achieving its milestones.
Finally, the use of adaptive and seamless Phase II and III study designs have proven extremely useful in reduc-ing clinical development CT, generally by reducing or even eliminating non-value-added wait times between phases of development32. Selecting those molecules and disease indications for which adaptive and seamless late-stage clinical development is possible can markedly decrease CT and improve P.
As can be seen from our analysis (FIG. 3), not all CT reductions are equal in their ability to reduce overall cost per NME. when applying the approaches above, effort should be prioritized according to both the impact and their feasibility of achieving the proposed CT reduction.
In addition to reducing the overall cost per NME, CT reductions have a positive effect on V associated with a molecule by allowing greater time on the market under a protected patent.
Cost (C). like CT, an understanding of the C of R&D activities can lead to interventions that can reduce the overall operating expenses required to deliver a success-ful molecule to the market. The C of an R&D programme can be split into three categories: direct spend on value-added tasks, direct spend on non-value-added tasks and overheads. Focusing on the cost of individual activities that achieve the objectives of an R&D project can yield important opportunities to reduce R&D expense. As R&D involves both the production of knowledge and materials, one must consider how the expense associated with an individual task achieves both production of the requisite information and of the materials that are crucial for downstream activities. leveraging new technology (such as software tools or laboratory automation) can lead to reduced costs, but care must be taken to eliminate the more tedious and costly methods while introducing new approaches, otherwise costs can become cumula-tive. As in the case of CT reduction, process improve-ment methods such as Six Sigma can yield cost savings as well. Finally, accessing lower-cost sources of labour (through outsourcing for example) can yield savings, assuming no compromise of CT or quality.
Identifying and eliminating non-value-added tasks, especially non-molecule C, from R&D programmes can also yield cost-saving opportunities just as it can improve CT. Furthermore, any sufficiently large R&D organiza-tion will carry the costs associated with employing and coordinating its employee base. As these overhead costs are spread over the entire portfolio of R&D projects, they have an incremental but often consequential effect on the C of R&D. Because many of the activities that are clas-sified as overheads are indeed essential to the success-ful operation of a business, they cannot be eliminated entirely. however, in our experience, these activities can be rationalized and reduced to carry the least amount of C considered necessary. Such overhead costs are typically more prevalent in larger, more mature organizations. Unit cost reductions, like CT reductions, can be lever-aged to improve productivity (FIG. 3). however, when cut-ting costs, it is important to be aware not to cut corners that might reduce the V or p(TS) of the portfolio.
Probability of technical success (p(TS)). There is little doubt that reducing the attrition rate of drug candidates in clinical development represents the greatest challenge and opportunity for pharmaceutical R&D, and arguably for sustaining the viability of the entire industry. As our sensitivity analyses show (FIG. 3), reducing Phase II and III attrition are the strongest levers for improving R&D efficiency and reducing the costs per NME.
Any given molecule fails because of either technical or non-technical reasons. Non-technical attrition occurs for various reasons, such as a change of strategy or termina-tion of research in a therapeutic area for scientific or com-mercial reasons, and will not be discussed further, except
210 | MARch 2010 | vOlUME 9 www.nature.com/reviews/drugdisc
nrd_3078_mar10.indd 210 15/2/10 11:08:18
A n A ly s i s
Imatinib and trastuzumabImatinib blocks the activity of BCR–ABL, a deregulated tyrosine kinase that results from a chromosomal translocation in patients with chronic myelogenous leukaemia, and trastuzumab blocks the activity of HER2/neu, a receptor tyrosine kinase that is often overexpressed in patients with breast cancer. Patients that are most likely to benefit from each drug can be readily identified before initiating treatment on the basis of the associated biomarkers, which has been invaluable in the development of both drugs and in guiding their use.
Six SigmaA quality management tool that is used to improve the quality of manufacturing and business processes by first identifying and removing the causes of errors or defects, as well as by minimizing variability.
key productivity parameters. however, all R&D WIP represents expense, albeit an expense that is necessary to generate innovative medicines. Publicly traded com-panies have a limit to how much they can invest in R&D as a percent of sales and thus the volume of WIP that is affordable. A common mistake is to focus on increasing WIP without regarding V and p(TS). This can easily happen when metrics and reward systems focus solely on the amount of WIP. Ultimately, more WIP without increases in the V or p(TS) associated with the WIP will ensure more output, but increases in R&D expenses will grow proportionately so the strategy will not result in greater productivity. If V and/or p(TS) could be increased, more output or value would actually be derived from less WIP (and expense). At Eli lilly, we have chosen to focus our view of WIP by adjusting our models to include dimensions of V and p(TS), ensuring we are measuring the value of WIP, not just the amount.
Value (V). The effectiveness of drug discovery and development must be increasingly quantified by estab-lishing at the time of product approval a highly desirable health outcome or economic benefit that can be objec-tively measured in various ways (for example, decreased mortality, morbidity and reduced hospitalizations). Thus, to increase R&D effectiveness it is important to fully understand the ultimate value of a project very early in development and know how this information can be leveraged in individual clinical plans and trade-offs in portfolio decision making.
The determinants of overall value are likely to be different depending on the perspective represented. Patients, caregivers, treating physicians and payers may apply different criteria to determine the value of new drug therapies. For instance, payers are increasingly interested in data from clinical trials with active compa-rators to establish the benefit of a new medicine versus other therapies (especially generic drugs), whereas regu-lators primarily depend on placebo-controlled studies to establish efficacy and safety. To optimize the value of a portfolio, it is important that optimal development plans and strategies for each project are formulated early and well before pivotal registration trials are initiated.
we assume that if a given drug treatment provides a higher benefit-to-risk ratio, the potential value of that treatment will be higher27. Maximizing patient benefit-to-risk ratio and thus potential value can be challenging in many diseases due to substantial clinical and biological heterogeneity. To increase the benefit (and reduce risks) of a drug treatment, it is often important to aim to per-sonalize or tailor the use of the therapy28. An important aid in the pursuit of tailored therapeutics is the identifi-cation of biomarkers that can be used to diagnose the dis-ease and/or identify treatment responders, ideally before or at least after the drug has been given. Biomarkers can also be used to select the right patients, right dose and right duration of treatment, or to avoid exposing patients at risk of a serious adverse event. The use of biomarkers to appropriately select patient subpopula-tions will also have a positive effect on p(TS) in the later stages of clinical development.
To optimize biomarker development and capture value, it is imperative to ensure biomarkers are devel-oped early and ideally are commercially available at the time of launch. Tailoring therapies to specific patient populations that are predicted to respond on the basis of the presence of a biomarker can be used to reduce development costs C, as illustrated by the development of imatinib (Gleevec; Novartis) or in stratifying patient populations for both clinical development and commer-cialization, as for trastuzumab (herceptin; Genentech/Roche). Although many industry pundits have opined that such market segmentation will reduce commercial returns for a given medicine (by reducing market share), so far, the increase in benefit-to-risk (and thus V) has more than offset the reduced market share for many new targeted medicines, especially in oncology.
Cycle time (CT). As is evident from our sensitivity analysis (FIG. 3), reducing both Phase III and Phase II CT are also important levers for improving R&D effi-ciency. Reducing either Phase III or Phase II CT by 50% from our baseline value of 2.5 years to 1.25 years would reduce the C per NME by about $200 million. Similar results were reported by DiMasi29. Although we think such reductions in Phase II and III CT are unrealistic, even more modest reductions in CT will nonetheless have a significant impact on R&D efficiency. Finally, some aspects of R&D CT, such as the time required for regulatory review (submission to launch in FIG. 3) are less amenable to intervention.
Reductions in R&D CT can be achieved in several ways and have long been a goal in the management of any production system. In predictable production systems, such as product manufacturing, CT reduction principles have been mastered and are routinely applied through techniques such as Six Sigma30. In less predictable sys-tems, such as pharmaceutical R&D, such approaches to CT reduction cannot be as broadly adapted, but many of the same principles can be readily applied30.
considerations for reducing the CT of each phase of discovery and development are often project- and phase-specific. Each phase of development consists of a collection of ‘unit processes’, or individual tasks that consume time and resources. The arrangement of these tasks in time and sequence can often be unique to the individual research project owing to the signifi-cant variability introduced by the state of the science associated with the R&D project in question. Because of this inherent variability, CT reduction at a macro level is best achieved through task- and project-specific interventions aimed at reducing non-value added tasks and ‘wait times’ associated with completing the value-added tasks.
we have identified four key approaches for reducing project-specific CTs. The first is portfolio selection. when selecting a portfolio of R&D projects, the inclu-sion of overall project CT as an element of an integrated strategy of portfolio selection should aid in reducing over-all CTs. For example, the CT of pivotal clinical trials are often a function of the disease state or indication being pursued. In some cases, demonstrating the efficacy of a
NATURE REvIEwS | Drug Discovery vOlUME 9 | MARch 2010 | 209
nrd_3078_mar10.indd 209 15/2/10 11:08:18
A n A ly s i s
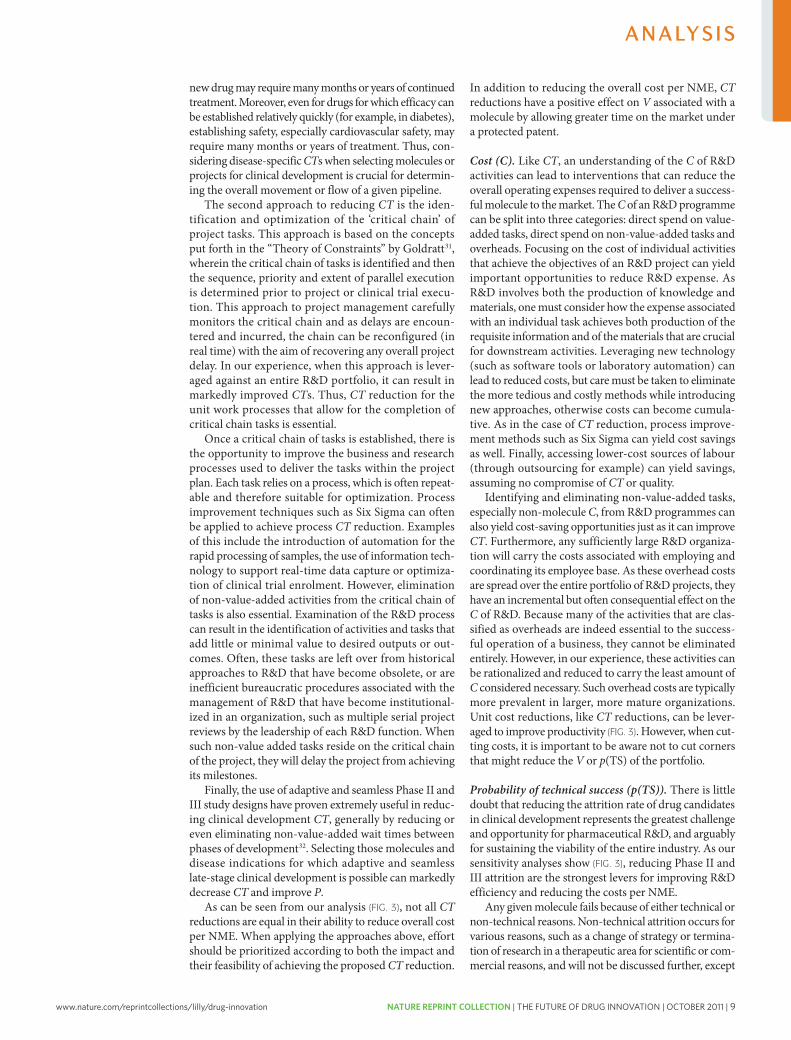
www.nature.com/reprintcollections/lilly/drug-innovation NATURE REPRINT COLLECTION | THE FUTURE OF DRUG INNOVATION | OCTOBER 2011 | 9
new drug may require many months or years of continued treatment. Moreover, even for drugs for which efficacy can be established relatively quickly (for example, in diabetes), establishing safety, especially cardiovascular safety, may require many months or years of treatment. Thus, con-sidering disease-specific CTs when selecting molecules or projects for clinical development is crucial for determin-ing the overall movement or flow of a given pipeline.
The second approach to reducing CT is the iden-tification and optimization of the ‘critical chain’ of project tasks. This approach is based on the concepts put forth in the “Theory of constraints” by Goldratt31, wherein the critical chain of tasks is identified and then the sequence, priority and extent of parallel execution is determined prior to project or clinical trial execu-tion. This approach to project management carefully monitors the critical chain and as delays are encoun-tered and incurred, the chain can be reconfigured (in real time) with the aim of recovering any overall project delay. In our experience, when this approach is lever-aged against an entire R&D portfolio, it can result in markedly improved CTs. Thus, CT reduction for the unit work processes that allow for the completion of critical chain tasks is essential.
Once a critical chain of tasks is established, there is the opportunity to improve the business and research processes used to deliver the tasks within the project plan. Each task relies on a process, which is often repeat-able and therefore suitable for optimization. Process improvement techniques such as Six Sigma can often be applied to achieve process CT reduction. Examples of this include the introduction of automation for the rapid processing of samples, the use of information tech-nology to support real-time data capture or optimiza-tion of clinical trial enrolment. however, elimination of non-value-added activities from the critical chain of tasks is also essential. Examination of the R&D pro cess can result in the identification of activities and tasks that add little or minimal value to desired outputs or out-comes. Often, these tasks are left over from historical approaches to R&D that have become obsolete, or are inefficient bureaucratic procedures associated with the management of R&D that have become institutional-ized in an organization, such as multiple serial project reviews by the leadership of each R&D function. when such non-value added tasks reside on the critical chain of the project, they will delay the project from achieving its milestones.
Finally, the use of adaptive and seamless Phase II and III study designs have proven extremely useful in reduc-ing clinical development CT, generally by reducing or even eliminating non-value-added wait times between phases of development32. Selecting those molecules and disease indications for which adaptive and seamless late-stage clinical development is possible can markedly decrease CT and improve P.
As can be seen from our analysis (FIG. 3), not all CT reductions are equal in their ability to reduce overall cost per NME. when applying the approaches above, effort should be prioritized according to both the impact and their feasibility of achieving the proposed CT reduction.
In addition to reducing the overall cost per NME, CT reductions have a positive effect on V associated with a molecule by allowing greater time on the market under a protected patent.
Cost (C). like CT, an understanding of the C of R&D activities can lead to interventions that can reduce the overall operating expenses required to deliver a success-ful molecule to the market. The C of an R&D programme can be split into three categories: direct spend on value-added tasks, direct spend on non-value-added tasks and overheads. Focusing on the cost of individual activities that achieve the objectives of an R&D project can yield important opportunities to reduce R&D expense. As R&D involves both the production of knowledge and materials, one must consider how the expense associated with an individual task achieves both production of the requisite information and of the materials that are crucial for downstream activities. leveraging new technology (such as software tools or laboratory automation) can lead to reduced costs, but care must be taken to eliminate the more tedious and costly methods while introducing new approaches, otherwise costs can become cumula-tive. As in the case of CT reduction, process improve-ment methods such as Six Sigma can yield cost savings as well. Finally, accessing lower-cost sources of labour (through outsourcing for example) can yield savings, assuming no compromise of CT or quality.
Identifying and eliminating non-value-added tasks, especially non-molecule C, from R&D programmes can also yield cost-saving opportunities just as it can improve CT. Furthermore, any sufficiently large R&D organiza-tion will carry the costs associated with employing and coordinating its employee base. As these overhead costs are spread over the entire portfolio of R&D projects, they have an incremental but often consequential effect on the C of R&D. Because many of the activities that are clas-sified as overheads are indeed essential to the success-ful operation of a business, they cannot be eliminated entirely. however, in our experience, these activities can be rationalized and reduced to carry the least amount of C considered necessary. Such overhead costs are typically more prevalent in larger, more mature organizations. Unit cost reductions, like CT reductions, can be lever-aged to improve productivity (FIG. 3). however, when cut-ting costs, it is important to be aware not to cut corners that might reduce the V or p(TS) of the portfolio.
Probability of technical success (p(TS)). There is little doubt that reducing the attrition rate of drug candidates in clinical development represents the greatest challenge and opportunity for pharmaceutical R&D, and arguably for sustaining the viability of the entire industry. As our sensitivity analyses show (FIG. 3), reducing Phase II and III attrition are the strongest levers for improving R&D efficiency and reducing the costs per NME.
Any given molecule fails because of either technical or non-technical reasons. Non-technical attrition occurs for various reasons, such as a change of strategy or termina-tion of research in a therapeutic area for scientific or com-mercial reasons, and will not be discussed further, except
210 | MARch 2010 | vOlUME 9 www.nature.com/reviews/drugdisc
nrd_3078_mar10.indd 210 15/2/10 11:08:18
A n A ly s i s
Imatinib and trastuzumabImatinib blocks the activity of BCR–ABL, a deregulated tyrosine kinase that results from a chromosomal translocation in patients with chronic myelogenous leukaemia, and trastuzumab blocks the activity of HER2/neu, a receptor tyrosine kinase that is often overexpressed in patients with breast cancer. Patients that are most likely to benefit from each drug can be readily identified before initiating treatment on the basis of the associated biomarkers, which has been invaluable in the development of both drugs and in guiding their use.
Six SigmaA quality management tool that is used to improve the quality of manufacturing and business processes by first identifying and removing the causes of errors or defects, as well as by minimizing variability.
key productivity parameters. however, all R&D WIP represents expense, albeit an expense that is necessary to generate innovative medicines. Publicly traded com-panies have a limit to how much they can invest in R&D as a percent of sales and thus the volume of WIP that is affordable. A common mistake is to focus on increasing WIP without regarding V and p(TS). This can easily happen when metrics and reward systems focus solely on the amount of WIP. Ultimately, more WIP without increases in the V or p(TS) associated with the WIP will ensure more output, but increases in R&D expenses will grow proportionately so the strategy will not result in greater productivity. If V and/or p(TS) could be increased, more output or value would actually be derived from less WIP (and expense). At Eli lilly, we have chosen to focus our view of WIP by adjusting our models to include dimensions of V and p(TS), ensuring we are measuring the value of WIP, not just the amount.
Value (V). The effectiveness of drug discovery and development must be increasingly quantified by estab-lishing at the time of product approval a highly desirable health outcome or economic benefit that can be objec-tively measured in various ways (for example, decreased mortality, morbidity and reduced hospitalizations). Thus, to increase R&D effectiveness it is important to fully understand the ultimate value of a project very early in development and know how this information can be leveraged in individual clinical plans and trade-offs in portfolio decision making.
The determinants of overall value are likely to be different depending on the perspective represented. Patients, caregivers, treating physicians and payers may apply different criteria to determine the value of new drug therapies. For instance, payers are increasingly interested in data from clinical trials with active compa-rators to establish the benefit of a new medicine versus other therapies (especially generic drugs), whereas regu-lators primarily depend on placebo-controlled studies to establish efficacy and safety. To optimize the value of a portfolio, it is important that optimal development plans and strategies for each project are formulated early and well before pivotal registration trials are initiated.
we assume that if a given drug treatment provides a higher benefit-to-risk ratio, the potential value of that treatment will be higher27. Maximizing patient benefit-to-risk ratio and thus potential value can be challenging in many diseases due to substantial clinical and biological heterogeneity. To increase the benefit (and reduce risks) of a drug treatment, it is often important to aim to per-sonalize or tailor the use of the therapy28. An important aid in the pursuit of tailored therapeutics is the identifi-cation of biomarkers that can be used to diagnose the dis-ease and/or identify treatment responders, ideally before or at least after the drug has been given. Biomarkers can also be used to select the right patients, right dose and right duration of treatment, or to avoid exposing patients at risk of a serious adverse event. The use of biomarkers to appropriately select patient subpopula-tions will also have a positive effect on p(TS) in the later stages of clinical development.
To optimize biomarker development and capture value, it is imperative to ensure biomarkers are devel-oped early and ideally are commercially available at the time of launch. Tailoring therapies to specific patient populations that are predicted to respond on the basis of the presence of a biomarker can be used to reduce development costs C, as illustrated by the development of imatinib (Gleevec; Novartis) or in stratifying patient populations for both clinical development and commer-cialization, as for trastuzumab (herceptin; Genentech/Roche). Although many industry pundits have opined that such market segmentation will reduce commercial returns for a given medicine (by reducing market share), so far, the increase in benefit-to-risk (and thus V) has more than offset the reduced market share for many new targeted medicines, especially in oncology.
Cycle time (CT). As is evident from our sensitivity analysis (FIG. 3), reducing both Phase III and Phase II CT are also important levers for improving R&D effi-ciency. Reducing either Phase III or Phase II CT by 50% from our baseline value of 2.5 years to 1.25 years would reduce the C per NME by about $200 million. Similar results were reported by DiMasi29. Although we think such reductions in Phase II and III CT are unrealistic, even more modest reductions in CT will nonetheless have a significant impact on R&D efficiency. Finally, some aspects of R&D CT, such as the time required for regulatory review (submission to launch in FIG. 3) are less amenable to intervention.
Reductions in R&D CT can be achieved in several ways and have long been a goal in the management of any production system. In predictable production systems, such as product manufacturing, CT reduction principles have been mastered and are routinely applied through techniques such as Six Sigma30. In less predictable sys-tems, such as pharmaceutical R&D, such approaches to CT reduction cannot be as broadly adapted, but many of the same principles can be readily applied30.
considerations for reducing the CT of each phase of discovery and development are often project- and phase-specific. Each phase of development consists of a collection of ‘unit processes’, or individual tasks that consume time and resources. The arrangement of these tasks in time and sequence can often be unique to the individual research project owing to the signifi-cant variability introduced by the state of the science associated with the R&D project in question. Because of this inherent variability, CT reduction at a macro level is best achieved through task- and project-specific interventions aimed at reducing non-value added tasks and ‘wait times’ associated with completing the value-added tasks.
we have identified four key approaches for reducing project-specific CTs. The first is portfolio selection. when selecting a portfolio of R&D projects, the inclu-sion of overall project CT as an element of an integrated strategy of portfolio selection should aid in reducing over-all CTs. For example, the CT of pivotal clinical trials are often a function of the disease state or indication being pursued. In some cases, demonstrating the efficacy of a
NATURE REvIEwS | Drug Discovery vOlUME 9 | MARch 2010 | 209
nrd_3078_mar10.indd 209 15/2/10 11:08:18
A n A ly s i s
10 | OCTOBER 2011 | THE FUTURE OF DRUG INNOVATION | NATURE REPRINT COLLECTION www.nature.com/reprintcollections/lilly/drug-innovation
Nature Reviews | Drug Discovery
Preclinicaldevelopment
Launch
$
Phase I
$
Phase II
$ $
Phase III
R&D ‘sweet spot’
$ $$ $
CSFHD FED
PD
Test each scarce molecule thoroughly
Scarcity of drugdiscovery
a Traditional
Preclinicaldevelopment
Launch
POC Confirmation,dose finding Commercialization
Higher p(TS)
CSFHD
PD
• Increase critical information content early to shift attrition to cheaper phase• Use savings from shifted attrition to re-invest in the R&D ‘sweet spot’
Abundanceof drugdiscovery
b Quick win, fast fail
ChorusA virtual approach to drug development that is primarily focused on establishing early proof-of-concept in humans (ideally in Phase I) to reduce attrition at later stages. Chorus’ cost estimate quoted in the text was calculated including the direct and indirect costs for 21 molecules in the Chorus portfolio from 2005–2008 and one from 2004.
increase PcSK9 levels, reducing their potential efficacy in further lowering lDl–cholesterol39. Thus, inhibiting PcSK9 function could dramatically (and safely) reduce lDl–cholesterol as well as augment the beneficial effects of statins. PcSK9 inhibition can conceivably be accom-plished in several ways, but perhaps the most direct is with a neutralizing monoclonal antibody, which as noted earlier, could be developed relatively rapidly and with limited off-target toxicity. Such an antibody has recently been reported by chan and colleagues40 to dramatically lower lDl–cholesterol in both mice and non-human pri-mates. It should now be relatively straightforward to create a humanized (or fully human) neutralizing monoclonal antibody against PcSK9 for human testing. Importantly, POc with this antibody can be achieved rapidly in Phase I studies by simply measuring lDl–cholesterol, perhaps as soon as following administration of a single dose. Recent clinical and epidemiological studies strongly suggest that lowering lDl–cholesterol below currently accepted tar-gets (with or without a statin) may further reduce the incidence of chD41. It is quite possible that a PcSK9 anti-body or some other PcSK9 antagonist could dramatically (and safely) lower lDl–cholesterol and the risk of chD. however, the key point here is that the validation of this target by human genetics and preclinical studies using a potential therapeutic agent in animals, coupled with the ability to establish POc very early in the clinic, will undoubtedly increase the p(TS) of this molecule before it advances into Phase II and III trials.
The second example is the voltage-gated sodium channel type IX alpha subunit (also known as Nav 1.7 or ScN9A). like PcSK9, both gain-of-function and loss-of-function mutations in Nav 1.7 have been identified42. These mutations result in either increased sensitivity to painful stimuli (paroxysmal extreme pain disorder and primary erythermalgia) or channelopathy-associated insensitivity to pain, respectively42. The latter is a rare autosomal recessive disorder in which affected indi-viduals are insensitive to physical pain from birth. Importantly, these individuals have otherwise normal sensory perception, although the consequences of com-plete and persistent insensitivity to pain can be quite detri mental42. Nonetheless, a selective and reversible Nav 1.7 antagonist, perhaps one that inhibits channel activity in a state-dependent manner, will probably prove to be a very effective topical or oral analgesic agent43. Non-selective sodium channel blockers, such as the local anesthetic lidocaine and certain anticonvulsants such as phenytoin and carbamezepine, may in part work through Nav 1.7, but finding more selective antagonists could revolutionize the treatment of pain43. Moreover, as was the case for PcSK9, clinical POc can be rapidly obtained in Phase I using various human pain models.
These two drug targets have one important feature in common. Mutations in their genes cause a loss of function that results in a clinical phenotype (low lDl–cholesterol or insensitivity to pain) that could be mim-icked by a drug with potentially desirable therapeutic consequences. The validation of these two targets derives primarily from human genetics, coupled with a very good (but admittedly still incomplete) understanding of their biological mechanisms and clinical consequences. we estimate that there are now at least a dozen or more drug targets with similar human validation and this number will undoubtedly grow as advances in functional genomics continue to materialize.
Using these two approaches (better target validation and early POc studies) we have estimated that the p(TS) of Phase II compounds can be increased to approxi-mately 50%. As can be seen in our sensitivity analysis (FIG. 3), reducing Phase II attrition by this much will by itself lower the cost per NME by approximately 30%.
In our view, resolution of technical uncertainty early in development, especially whether or not a molecule engages its target and has desired pharmacological activity in humans is necessary to improve R&D productivity. we refer to this as our ‘quick win, fast fail’ paradigm of drug development (FIG. 5), whereby the ‘sweet spot’ of R&D resides prior to Phase II with a heavy emphasis on having sufficient discovery capacity and capability to assure selection of validated targets, and sufficient dis-covery WIP to yield enough good Phase-I-ready mole-cules. A resolute focus and portfolio metric is to establish POc in the clinic very early, preferably in Phase I. This can reliably be achieved for most, but obviously not all, drug candidates.
we have implemented an alternative clinical devel-opment model called Chorus44, which has served as a highly cost-effective means for establishing POc and has, in part, helped to increase the estimated p(TS) of
Figure 5 | The quick win, fast fail drug development paradigm. This figure illustrates the traditional paradigm of drug development (a) contrasted with an alternative development paradigm referred to as quick win, fast fail (b). In this alternative, technical uncertainty is intentionally decreased before the expensive later development stages (Phase II and Phase III) through the establishment of proof-of-concept (POC). This results in a reduced number of new molecular entities (nMEs) advancing into Phase II and III, but those that do advance have a higher probability of success (p(Ts)) and launch. The savings gained from costly investment in late-stage R&D failures are re-invested in R&D to further enhance R&D productivity. Cs, candidate selection; FED, first efficacy dose; FHD, first human dose; PD, product decision.
212 | MARch 2010 | vOlUME 9 www.nature.com/reviews/drugdisc
nrd_3078_mar10.indd 212 15/2/10 11:08:19
A n A ly s i s
to say that it can be a considerable (and sometimes sus-tained) source of C and lowered R&D efficiency. Technical attrition, on the other hand, occurs when a molecule fails to meet some important success factor, such as failing to demonstrate the requisite safety margin in Phase I or II or expected efficacy in Phase II or III.
compounds fail for many reasons, but some are more avoidable than others. Poor oral bioavailability, pharmacokinetic properties or toxicity issues that are not predicted by animal pharmacology models or by preclinical ADMET (absorption, distribution, metabo-lism, excretion and toxicity) studies, resulting in over-lap of efficacious and toxic doses (and thus lower than desired margins of safety) are often reasons for Phase I and Phase II attrition.
Given their highly specific target-binding character-istics, fully human or humanized monoclonal antibodies have greatly reduced ‘off-target’ toxicity compared with small molecules, which could help reduce attrition. Any cost-effective approach to predict toxicological liability or undesirable ADME properties preclinically (especially for small molecules) will reduce downstream attrition and several approaches to achieve this are being pursued33. In fact, the number (and percentage) of drug candidates successfully reaching Phase I has increased recently18, in part due to better preclinical characterization with improved ADMET properties.
Indeed, in their analysis of attrition rates based on data from large pharmaceutical companies between 1991–2000, Kola and landis highlighted that poor phar-macokinetic properties or bioavailability had become only a minor cause of overall attrition (≤ 10–20%) by 2000, whereas lack of efficacy and low margins of safety were the major causes of Phase II and III attrition19. Assuming that approaches for filtering out compounds with inappropriate drug-like properties have advanced since the 1990s, it seems likely that the recent increase in later-stage (especially Phase II) attrition is primarily due to the unprecedented nature of the drug targets (that is, the biological mechanisms) being pursued as well as the increasing safety hurdles (greater benefit-to-risk ratio) required for approval in most parts of the world.
however, as discussed above, Phase II and Phase III attrition rates remain unacceptably high: 66% and 30%, respectively, based on the most recent PBF benchmark-ing estimates (FIG. 2). Phase II attrition rates in particular have not improved substantially since those reported for the 1991–2000 period (62% attrition rate in Phase II and 45% in Phase III, with some therapeutic areas exhibit-ing even higher attrition rates)19. As highlighted by Kola and landis, clinical attrition rates during the 1990s were higher for central nervous system (cNS) disorders and oncology, with more than 70% of compounds in oncol-ogy failing in Phase II and 59% failing in Phase III. The higher failure rates in these areas are in part due to the relatively unprecedented nature of the drug targets being pursued and to the lack of animal models with a strong capacity to predict human efficacy.
There are two key approaches to reduce Phase II and III attrition, which ideally need to be carried out in tandem. The first is better target selection (selection
of more validated and druggable targets). The second is the routine pursuit of early POc studies in the clinic, especially in Phase I, for which biomarkers and surro-gate endpoints can often be employed. Although these two approaches to reducing attrition and increasing pro-ductivity have been highlighted by others17,19, we under-score their importance, and discuss how they can best be achieved below.
First, target selection is a key early step in the drug discovery and development process, as it generally occurs 10–15 years before the launch of a new drug and initiates the commitment of substantial time and resources to determine whether the target and the approach to modulating it are viable. Obviously, target identification and validation leading up to target selec-tion are also important factors, and can confer a com-petitive advantage to an R&D organization. It was widely predicted that advances in genomics and proteomics, including those resulting directly from the sequencing of the human genome, would yield an abundance of drug targets34,35. however, although many new potential drug targets have been identified by these approaches, far too few have been fully, or even sufficiently, validated so far to have had much impact on pharmaceutical R&D3. Nevertheless, we believe that validated targets for drug discovery are now materializing rapidly.
Target selection is also related to the second key approach to reducing Phase II and III attrition: estab-lishing early POc. This requires first choosing a drug target and disease state for which establishing POc early (preferably in Phase I) is feasible. The use of biomarkers or surrogate endpoints (if not clinical endpoints) is often essential for such POc studies. These biomarkers or sur-rogates can be as simple as assuring target engagement (for example, cNS receptor occupancy by positron emis-sion tomography scanning for neuropsychiatric drugs) or a desired clinical endpoint (for example, the lowering of blood glucose for diabetes or low density lipoprotein (lDl)–cholesterol for dyslipidaemia). A number of clini-cally relevant endpoints can be ascertained in Phase I (especially in the multidose safety studies or Phase Ib studies), including analgesia, lipid or glucose lowering and weight loss, but developing additional biomarkers of both efficacy and safety for a variety of diseases will be necessary to make early ‘go/no-go’ decisions; such biomarkers are especially needed in oncology.
To illustrate the importance of target selection, cou-pled with early POc clinical trials, we discuss two recently validated targets that in our opinion will probably result in very effective and commercially important drugs. The first target is the secreted circulating protease proprotein convertase subtilisin/kexin type 9 (PcSK9). circulating PcSK9 downregulates hepatic lDl receptors and thus increases serum lDl–cholesterol levels36. Gain-of-function missense mutations in the PcSK9 gene result in autosomal dominant hypercholesterolaemia and prema-ture coronary heart disease (chD)37. conversely, loss-of-function mutations are associated with very low serum lDl–cholesterol and a striking reduction in the incidence of chD38. Moreover, hMG coA reductase inhibitors (statins), which lower lDl–cholesterol, simultaneously
NATURE REvIEwS | Drug Discovery vOlUME 9 | MARch 2010 | 211
nrd_3078_mar10.indd 211 15/2/10 11:08:18
A n A ly s i s
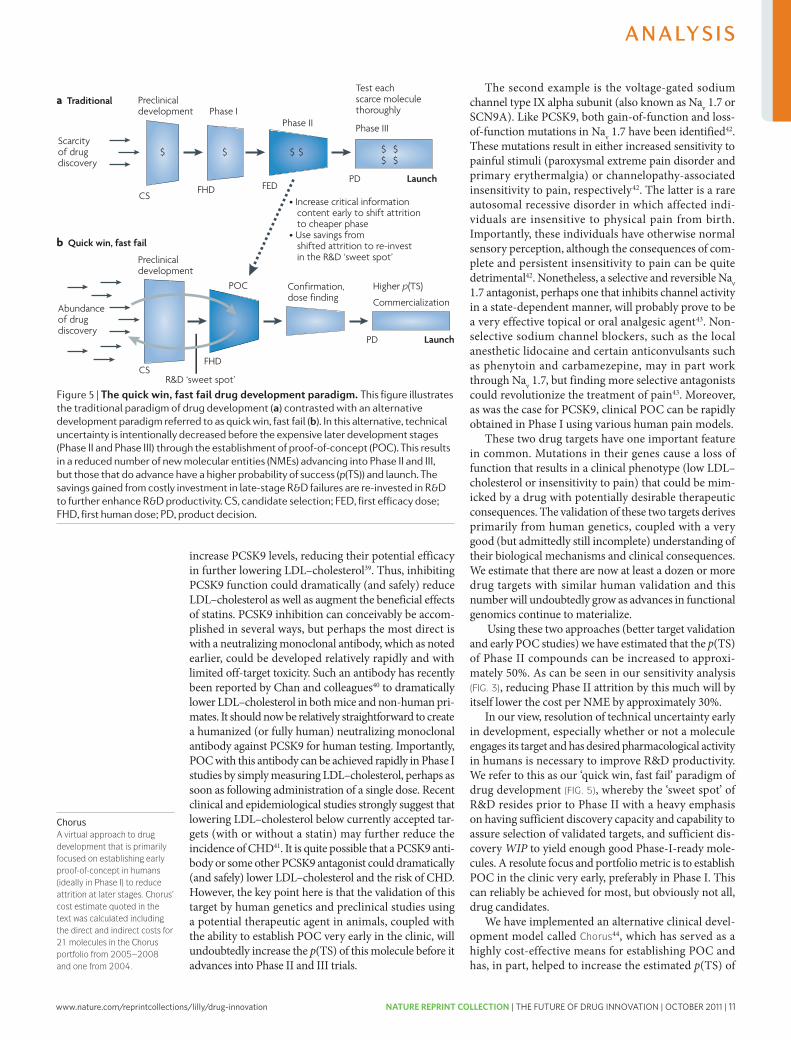
www.nature.com/reprintcollections/lilly/drug-innovation NATURE REPRINT COLLECTION | THE FUTURE OF DRUG INNOVATION | OCTOBER 2011 | 11
Nature Reviews | Drug Discovery
Preclinicaldevelopment
Launch
$
Phase I
$
Phase II
$ $
Phase III
R&D ‘sweet spot’
$ $$ $
CSFHD FED
PD
Test each scarce molecule thoroughly
Scarcity of drugdiscovery
a Traditional
Preclinicaldevelopment
Launch
POC Confirmation,dose finding Commercialization
Higher p(TS)
CSFHD
PD
• Increase critical information content early to shift attrition to cheaper phase• Use savings from shifted attrition to re-invest in the R&D ‘sweet spot’
Abundanceof drugdiscovery
b Quick win, fast fail
ChorusA virtual approach to drug development that is primarily focused on establishing early proof-of-concept in humans (ideally in Phase I) to reduce attrition at later stages. Chorus’ cost estimate quoted in the text was calculated including the direct and indirect costs for 21 molecules in the Chorus portfolio from 2005–2008 and one from 2004.
increase PcSK9 levels, reducing their potential efficacy in further lowering lDl–cholesterol39. Thus, inhibiting PcSK9 function could dramatically (and safely) reduce lDl–cholesterol as well as augment the beneficial effects of statins. PcSK9 inhibition can conceivably be accom-plished in several ways, but perhaps the most direct is with a neutralizing monoclonal antibody, which as noted earlier, could be developed relatively rapidly and with limited off-target toxicity. Such an antibody has recently been reported by chan and colleagues40 to dramatically lower lDl–cholesterol in both mice and non-human pri-mates. It should now be relatively straightforward to create a humanized (or fully human) neutralizing monoclonal antibody against PcSK9 for human testing. Importantly, POc with this antibody can be achieved rapidly in Phase I studies by simply measuring lDl–cholesterol, perhaps as soon as following administration of a single dose. Recent clinical and epidemiological studies strongly suggest that lowering lDl–cholesterol below currently accepted tar-gets (with or without a statin) may further reduce the incidence of chD41. It is quite possible that a PcSK9 anti-body or some other PcSK9 antagonist could dramatically (and safely) lower lDl–cholesterol and the risk of chD. however, the key point here is that the validation of this target by human genetics and preclinical studies using a potential therapeutic agent in animals, coupled with the ability to establish POc very early in the clinic, will undoubtedly increase the p(TS) of this molecule before it advances into Phase II and III trials.
The second example is the voltage-gated sodium channel type IX alpha subunit (also known as Nav 1.7 or ScN9A). like PcSK9, both gain-of-function and loss-of-function mutations in Nav 1.7 have been identified42. These mutations result in either increased sensitivity to painful stimuli (paroxysmal extreme pain disorder and primary erythermalgia) or channelopathy-associated insensitivity to pain, respectively42. The latter is a rare autosomal recessive disorder in which affected indi-viduals are insensitive to physical pain from birth. Importantly, these individuals have otherwise normal sensory perception, although the consequences of com-plete and persistent insensitivity to pain can be quite detri mental42. Nonetheless, a selective and reversible Nav 1.7 antagonist, perhaps one that inhibits channel activity in a state-dependent manner, will probably prove to be a very effective topical or oral analgesic agent43. Non-selective sodium channel blockers, such as the local anesthetic lidocaine and certain anticonvulsants such as phenytoin and carbamezepine, may in part work through Nav 1.7, but finding more selective antagonists could revolutionize the treatment of pain43. Moreover, as was the case for PcSK9, clinical POc can be rapidly obtained in Phase I using various human pain models.
These two drug targets have one important feature in common. Mutations in their genes cause a loss of function that results in a clinical phenotype (low lDl–cholesterol or insensitivity to pain) that could be mim-icked by a drug with potentially desirable therapeutic consequences. The validation of these two targets derives primarily from human genetics, coupled with a very good (but admittedly still incomplete) understanding of their biological mechanisms and clinical consequences. we estimate that there are now at least a dozen or more drug targets with similar human validation and this number will undoubtedly grow as advances in functional genomics continue to materialize.
Using these two approaches (better target validation and early POc studies) we have estimated that the p(TS) of Phase II compounds can be increased to approxi-mately 50%. As can be seen in our sensitivity analysis (FIG. 3), reducing Phase II attrition by this much will by itself lower the cost per NME by approximately 30%.
In our view, resolution of technical uncertainty early in development, especially whether or not a molecule engages its target and has desired pharmacological activity in humans is necessary to improve R&D productivity. we refer to this as our ‘quick win, fast fail’ paradigm of drug development (FIG. 5), whereby the ‘sweet spot’ of R&D resides prior to Phase II with a heavy emphasis on having sufficient discovery capacity and capability to assure selection of validated targets, and sufficient dis-covery WIP to yield enough good Phase-I-ready mole-cules. A resolute focus and portfolio metric is to establish POc in the clinic very early, preferably in Phase I. This can reliably be achieved for most, but obviously not all, drug candidates.
we have implemented an alternative clinical devel-opment model called Chorus44, which has served as a highly cost-effective means for establishing POc and has, in part, helped to increase the estimated p(TS) of
Figure 5 | The quick win, fast fail drug development paradigm. This figure illustrates the traditional paradigm of drug development (a) contrasted with an alternative development paradigm referred to as quick win, fast fail (b). In this alternative, technical uncertainty is intentionally decreased before the expensive later development stages (Phase II and Phase III) through the establishment of proof-of-concept (POC). This results in a reduced number of new molecular entities (nMEs) advancing into Phase II and III, but those that do advance have a higher probability of success (p(Ts)) and launch. The savings gained from costly investment in late-stage R&D failures are re-invested in R&D to further enhance R&D productivity. Cs, candidate selection; FED, first efficacy dose; FHD, first human dose; PD, product decision.
212 | MARch 2010 | vOlUME 9 www.nature.com/reviews/drugdisc
nrd_3078_mar10.indd 212 15/2/10 11:08:19
A n A ly s i s
to say that it can be a considerable (and sometimes sus-tained) source of C and lowered R&D efficiency. Technical attrition, on the other hand, occurs when a molecule fails to meet some important success factor, such as failing to demonstrate the requisite safety margin in Phase I or II or expected efficacy in Phase II or III.
compounds fail for many reasons, but some are more avoidable than others. Poor oral bioavailability, pharmacokinetic properties or toxicity issues that are not predicted by animal pharmacology models or by preclinical ADMET (absorption, distribution, metabo-lism, excretion and toxicity) studies, resulting in over-lap of efficacious and toxic doses (and thus lower than desired margins of safety) are often reasons for Phase I and Phase II attrition.
Given their highly specific target-binding character-istics, fully human or humanized monoclonal antibodies have greatly reduced ‘off-target’ toxicity compared with small molecules, which could help reduce attrition. Any cost-effective approach to predict toxicological liability or undesirable ADME properties preclinically (especially for small molecules) will reduce downstream attrition and several approaches to achieve this are being pursued33. In fact, the number (and percentage) of drug candidates successfully reaching Phase I has increased recently18, in part due to better preclinical characterization with improved ADMET properties.
Indeed, in their analysis of attrition rates based on data from large pharmaceutical companies between 1991–2000, Kola and landis highlighted that poor phar-macokinetic properties or bioavailability had become only a minor cause of overall attrition (≤ 10–20%) by 2000, whereas lack of efficacy and low margins of safety were the major causes of Phase II and III attrition19. Assuming that approaches for filtering out compounds with inappropriate drug-like properties have advanced since the 1990s, it seems likely that the recent increase in later-stage (especially Phase II) attrition is primarily due to the unprecedented nature of the drug targets (that is, the biological mechanisms) being pursued as well as the increasing safety hurdles (greater benefit-to-risk ratio) required for approval in most parts of the world.
however, as discussed above, Phase II and Phase III attrition rates remain unacceptably high: 66% and 30%, respectively, based on the most recent PBF benchmark-ing estimates (FIG. 2). Phase II attrition rates in particular have not improved substantially since those reported for the 1991–2000 period (62% attrition rate in Phase II and 45% in Phase III, with some therapeutic areas exhibit-ing even higher attrition rates)19. As highlighted by Kola and landis, clinical attrition rates during the 1990s were higher for central nervous system (cNS) disorders and oncology, with more than 70% of compounds in oncol-ogy failing in Phase II and 59% failing in Phase III. The higher failure rates in these areas are in part due to the relatively unprecedented nature of the drug targets being pursued and to the lack of animal models with a strong capacity to predict human efficacy.
There are two key approaches to reduce Phase II and III attrition, which ideally need to be carried out in tandem. The first is better target selection (selection
of more validated and druggable targets). The second is the routine pursuit of early POc studies in the clinic, especially in Phase I, for which biomarkers and surro-gate endpoints can often be employed. Although these two approaches to reducing attrition and increasing pro-ductivity have been highlighted by others17,19, we under-score their importance, and discuss how they can best be achieved below.
First, target selection is a key early step in the drug discovery and development process, as it generally occurs 10–15 years before the launch of a new drug and initiates the commitment of substantial time and resources to determine whether the target and the approach to modulating it are viable. Obviously, target identification and validation leading up to target selec-tion are also important factors, and can confer a com-petitive advantage to an R&D organization. It was widely predicted that advances in genomics and proteomics, including those resulting directly from the sequencing of the human genome, would yield an abundance of drug targets34,35. however, although many new potential drug targets have been identified by these approaches, far too few have been fully, or even sufficiently, validated so far to have had much impact on pharmaceutical R&D3. Nevertheless, we believe that validated targets for drug discovery are now materializing rapidly.
Target selection is also related to the second key approach to reducing Phase II and III attrition: estab-lishing early POc. This requires first choosing a drug target and disease state for which establishing POc early (preferably in Phase I) is feasible. The use of biomarkers or surrogate endpoints (if not clinical endpoints) is often essential for such POc studies. These biomarkers or sur-rogates can be as simple as assuring target engagement (for example, cNS receptor occupancy by positron emis-sion tomography scanning for neuropsychiatric drugs) or a desired clinical endpoint (for example, the lowering of blood glucose for diabetes or low density lipoprotein (lDl)–cholesterol for dyslipidaemia). A number of clini-cally relevant endpoints can be ascertained in Phase I (especially in the multidose safety studies or Phase Ib studies), including analgesia, lipid or glucose lowering and weight loss, but developing additional biomarkers of both efficacy and safety for a variety of diseases will be necessary to make early ‘go/no-go’ decisions; such biomarkers are especially needed in oncology.
To illustrate the importance of target selection, cou-pled with early POc clinical trials, we discuss two recently validated targets that in our opinion will probably result in very effective and commercially important drugs. The first target is the secreted circulating protease proprotein convertase subtilisin/kexin type 9 (PcSK9). circulating PcSK9 downregulates hepatic lDl receptors and thus increases serum lDl–cholesterol levels36. Gain-of-function missense mutations in the PcSK9 gene result in autosomal dominant hypercholesterolaemia and prema-ture coronary heart disease (chD)37. conversely, loss-of-function mutations are associated with very low serum lDl–cholesterol and a striking reduction in the incidence of chD38. Moreover, hMG coA reductase inhibitors (statins), which lower lDl–cholesterol, simultaneously
NATURE REvIEwS | Drug Discovery vOlUME 9 | MARch 2010 | 211
nrd_3078_mar10.indd 211 15/2/10 11:08:18
A n A ly s i s
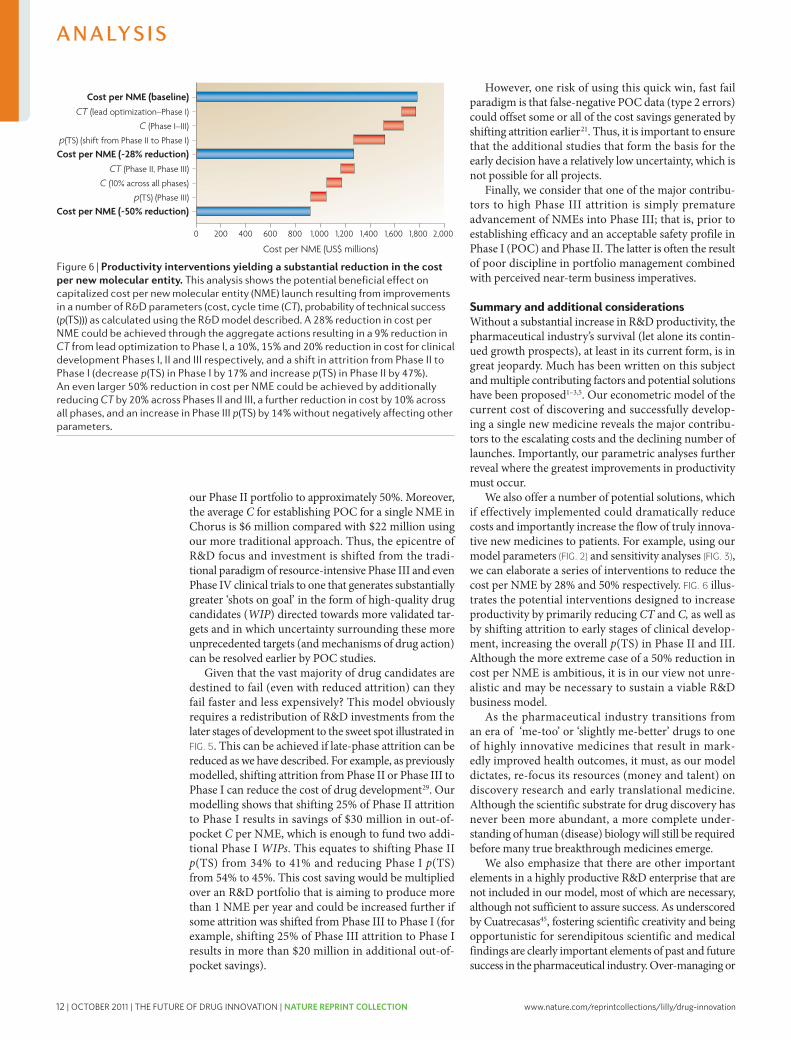
12 | OCTOBER 2011 | THE FUTURE OF DRUG INNOVATION | NATURE REPRINT COLLECTION www.nature.com/reprintcollections/lilly/drug-innovation
even micro-managing R&D by those with little scientific–medical expertise or experience in R&D may well have contributed to recent pipeline gaps and reduced R&D productivity45. Moreover, fostering such scientific crea-tivity and medical opportunism is often challenging, and sometimes incompatible with the short-term and often aspirational goals of business-driven enterprises. Most importantly, in our opinion, there is no substitute for scientific and clinical intuition for any successful R&D
organization, whether it be in the initial selection of drug targets, the design of a clinical trial or the interpretation of clinical data in order to advance a molecule into late-phase clinical development. Simply stated, good ‘process’ will never be a substitute for good people or good science. however, we firmly believe that both good process and good science are not only compatible, but together will yield the greatest return on R&D investments and thus, have the greatest impact on R&D productivity.
1. O’Hagan, P. & Farkas, C. Bringing pharma R.&D back to health. Bain Brief [online], http://www.bain.com/bainweb/PDFs/cms/Public/BB_Managing_RandD_HC.pdf (2009).
2. Lindgardt, Z., Reeves, M. & Wallenstein, J. Waking the giant: business model innovation in the drug industry. In Vivo 26, 1–6 (2008).
3. Garnier, J. Rebuilding the R.&D engine in big pharma. Harvard Bus. Rev. 86, 68–76 (2008).A candid assessment by the former CEO of GlaxoSmithKline of the downsides of the industry’s process culture.
4. Angell, M. The Truth about Drug Companies: How They Deceive Us and What to do About It. (Random House Trade Paperbacks, New York, 2005).
5. Chertkow, J. Trends in pharmaceutical portfolio management: strategies to maintain profitability despite adversity. Datamonitor [online] http://www.datamonitor.com (2008).
6. Murray, A., Berndt, E. R. & Cutler, D. M. Prescription drug spending trends in the United States: looking beyond the turning point. Health Affairs w151–w160, (2008).
7. EvaluatePharma Alpha World Preview 2014. Evaluate Pharma report (2009).
8. Goodman, M. Market watch: Pharma industry performance metrics: 2007–2012E. Nature Rev. Drug Discov. 7, 795 (2008).
9. Mathieu, M. P., ed. Parexel’s Bio/Pharmaceutical R&D Statistical Sourcebook 2008/2009. (Parexel International Corporation, Waltham, 2008).
10. Pisano, G. P. Science Business: the Promise, the Reality, and the Future of Biotech. (Harvard Business School Press, Boston, 2006).An insightful retrospective on the biotech industry, and the reasons why it has not yet lived up to its promises.
11. DiMasi, J. A. & Grabowski, H. G. The cost of biopharmaceutical R&D: Is biotech different? Manage. Decis. Econ. 28, 469–479 (2007).A contemporary assessment of the costs to discover, develop and launch new molecular entities.
12. Kola, I. The state of innovation in drug development. Clin. Pharmacol. Ther. 83, 227–230 (2008).
13. Cohen, F. J. Macro trends in pharmaceutical innovation. Nature Rev. Drug Discov. 4, 78–84 (2005).
14. Lichtenberg, F. R. The impact of new drug launches on longevity: evidence from longitudinal, disease-level data from 52 countries, 1982–2001 Int. J. Health Care Finance Econ. 5, 47–43 (2005).
15. Kimball, T. R., McCoy, C. E., Khoury, P. R., Daniels, S. R. & Dolan, L. M. Obesity, diabetes damage young arteries, could shorten life. News release, American Heart Association website [online] http://americanheart.mediaroom.com/index.php?s=43&item=740 (2009).
16. KMR Group. Pharmaceutical Benchmarking Forum [online] http://kmrgroup.com/ForumsPharma.html (2009).
17. Booth, B. & Zemmil, R. Prospects for productivity. Nature Rev. Drug Discov. 3, 451–456 (2004).Booth and Zemmil framed the issue of productivity in the pharmaceutical industry and provide a qualitative discussion of some of the drivers and potential solutions.
18. Hu, M., Schultz, K., Sheu, J. & Tschopp, D. The innovation gap in pharmaceutical drug discovery & new models for R&D success. [online], http://www.kellogg.northwestern.edu/academic/biotech/faculty/articles/NewRDModel.pdf (2007).
19. Kola, I. & Landis, J. Can the pharmaceutical industry reduce attrition rates? Nature Rev. Drug Discov. 3, 711–715 (2004).This article provides an in-depth analysis of attrition by phase and therapy area, and offers a scientific approach to reduce Phase II and Phase III attrition rates.
20. Innovation or Stagnation? Challenge and Opportunity on the Critical Path to New Medical Products [online], http://www.fda.gov/oc/initiatives/criticalpath/whitepaper.html (2004).A seminal paper on the hurdles that must be overcome to reverse the decline in R&D productivity.
21. Peck, R. W. Driving earlier clinical attrition: if you want to find the needle, burn down the haystack. Considerations for biomarker development. Drug Discov. Today 12, 289–294 (2007).
22. Little, J. D. C. A proof of the queuing formula L = λ W. Oper. Res. 9, 383–387 (1961).
23. Bunch, P. R. & Schacht, A. L. Modeling resource requirements for pharmaceutical R.&D. Res. Technol. Manage. 45, 48–56 (2002).
24. Deloitte Touche Tohmatsu. Threading the talent needle: what global executives are saying about people and work. [online], http://www.deloitte.com/assets/ Dcom-Shared%20Assets/Documents/us_talent_ThreadingtheTalentNeedle_final3409.pdf (2009).
25. PricewaterhouseCoopers. The changing dynamics of pharma outsourcing in Asia: are you readjusting your sights? [online], http://www.pwc.com/gx/en/pharma-life-sciences/outsourcing/index.jhtml (2008).
26. Danzon, P. M., Nicholson S. & Pereira N. S. Productivity in pharmaceutical-biotechnology R&D: the role of experience and alliances. J. Health Econ. 24, 317–339 (2005).
27. Gregson, N., Sparrowhawk, K., Mauskopf, J. & Paul, J. Pricing medicines: theory and practice, challenges and opportunities. Nature Rev. Drug Discov. 4, 121–130 (2005).
28. Woodcock, J. The prospects for ‘‘personalized medicine’’ in drug development and drug therapy. Clin. Pharmacol. Ther. 1, 164–169 (2007).
29. DiMasi, J. A. The value of improving the productivity of the drug development process: faster times and better decisions. Pharmacoeconomics 20, 1–10 (2002).
30. Pyzdek, T. The Six Sigma Handbook: The complete guide for greenbelts, blackbelts, and managers of all levels. 2nd revised edition (McGraw-Hill, New York, 2003).
31. Goldratt, E. M. & Cox J. The goal: a process of ongoing improvement. Third edition. (Gower Publishing, Aldershot, 2004).
32. Maca, J., Bhattacharya, S., Dragalin, V, Gallo, P, Krams, M. Adaptive seamless phase II/III designs—background, operational aspects, and examples. Drug Inf. J. 4, 463–473 (2006).
33. Kramer, J. A., Sagart, J. E. & Morris, D. L. The application of discovery toxicology and pathology towards the design of safer pharmaceutical lead candidates. Nature Rev. Drug Discov. 6, 636–649 (2007).
34. Hopkins, A. L. & Groom, C. R. The druggable genome. Nature Rev. Drug Discov. 1, 727–730 (2002).
35. Grenet, O. Significance of the human genome sequence to drug discovery. Pharmacogenomics J. 1, 11–12 (2001).
36. Horton, J. D., Cohen, J. C. & Hobbs, H. H. PCSK9: a convertase that coordinates LDL catabolism. J. Lipid Res. S172–S177 (2009).
37. Abifadel, M. et al. Mutations in PCSK9 cause autosomal dominant hypercholesterolemia. Nature Genet. 34, 154–156 (2003).
38. Cohen, J. C., Boerwinkle, E., Mosley, Jr., T. H. & Hobbs, H. H. Sequence variations in PCSK9, low LDL, and protection against coronary heart disease. N. Engl. J. Med. 354, 1264–1272 (2006).
39. Cao, G., Qian, Y. W., Kowala, M. C. & Konrad, R. J. Further LDL cholesterol lowering through targeting PCSK9 for coronary artery disease. Endocrine, Metabolic & Immune Disorders – Drug Targets. 8, 238–243 (2008).
40. Chan, J.C. et al. A proprotein convertase subtilisin/kexin type 9 neutralizing antibody reduces serum cholesterol in mice and nonhuman primates. Proc. Natl Acad. Sci. USA 106, 9820–9825 (2009).
41. Shepherd, J. et.al. Effect of lowering LDL cholesterol substantially below currently recommended levels in patients with coronary heart disease and diabetes. Diabetes Care 29, 1220–1226 (2006).
42. Drenth, J. P. H. & Waxman, S. G. Mutations in sodium-channel gene SCN9A cause a spectrum of human genetic pain disorders. J. Clin. Invest. 117, 3603–3609 (2007).
43. Krafte, D. S. & Bannon, A. W. Sodium channels and nociception: recent concepts and therapeutic opportunities. Curr. Opin. Pharmacol. 8, 50–56 (2008).
44. Bonabeau, E. N., Bodick, N. & Armstrong, R. W. A more rational approach to new-product development. Harvard Bus. Rev. 86, 96–102 (2008).A review of Eli Lilly’s Chorus model of early drug development and FIPNet strategy.
45. Cuatrecasas, P. Drug discovery in jeopardy. J. Clin. Invest. 116, 2837–2842 (2006).A frank analysis by one of the most successful R&D leaders of problems that have fostered the current innovation crisis.
AcknowledgementsThe authors wish to acknowledge the seminal thought leader-ship on the issue of R&D productivity that A. Bingham has provided to the pharmaceutical industry. In addition, we wish to thank J.S. Andersen and T. Mason for helping frame the productivity concepts expressed in this manuscript, and G. Pisano and J. DiMasi for helpful suggestions and comments.
Competing interests statementThe authors declare competing financial interests: see web version for details.
DATABASESUniProtKB: http://www.uniprot.orgPCsK9 | sCn9A
SUPPLEMENTARY INFORMATIONsee online article: s1 (box) | s2 (box) | s3 (box)
All links Are AcTive in The online PDf
214 | MARch 2010 | vOlUME 9 www.nature.com/reviews/drugdisc
nrd_3078_mar10.indd 214 15/2/10 11:08:20
A n A ly s i s
Nature Reviews | Drug Discovery
Cost per NME (US$ millions)
2,0001,8001,6001,4001,2001,000800200 400 6000
Cost per NME (baseline)CT (lead optimization–Phase I)
C (Phase I–III)
p(TS) (shift from Phase II to Phase I)
Cost per NME (~28% reduction)CT (Phase II, Phase III)
C (10% across all phases)
p(TS) (Phase III)
Cost per NME (~50% reduction)
our Phase II portfolio to approximately 50%. Moreover, the average C for establishing POc for a single NME in chorus is $6 million compared with $22 million using our more traditional approach. Thus, the epicentre of R&D focus and investment is shifted from the tradi-tional paradigm of resource-intensive Phase III and even Phase Iv clinical trials to one that generates substantially greater ‘shots on goal’ in the form of high-quality drug candidates (WIP) directed towards more validated tar-gets and in which uncertainty surrounding these more unprecedented targets (and mechanisms of drug action) can be resolved earlier by POc studies.
Given that the vast majority of drug candidates are destined to fail (even with reduced attrition) can they fail faster and less expensively? This model obviously requires a redistribution of R&D investments from the later stages of development to the sweet spot illustrated in FIG. 5. This can be achieved if late-phase attrition can be reduced as we have described. For example, as previously modelled, shifting attrition from Phase II or Phase III to Phase I can reduce the cost of drug development29. Our modelling shows that shifting 25% of Phase II attrition to Phase I results in savings of $30 million in out-of-pocket C per NME, which is enough to fund two addi-tional Phase I WIPs. This equates to shifting Phase II p(TS) from 34% to 41% and reducing Phase I p(TS) from 54% to 45%. This cost saving would be multiplied over an R&D portfolio that is aiming to produce more than 1 NME per year and could be increased further if some attrition was shifted from Phase III to Phase I (for example, shifting 25% of Phase III attrition to Phase I results in more than $20 million in additional out-of-pocket savings).
however, one risk of using this quick win, fast fail paradigm is that false-negative POc data (type 2 errors) could offset some or all of the cost savings generated by shifting attrition earlier21. Thus, it is important to ensure that the additional studies that form the basis for the early decision have a relatively low uncertainty, which is not possible for all projects.
Finally, we consider that one of the major contribu-tors to high Phase III attrition is simply premature advancement of NMEs into Phase III; that is, prior to establishing efficacy and an acceptable safety profile in Phase I (POc) and Phase II. The latter is often the result of poor discipline in portfolio management combined with perceived near-term business imperatives.
Summary and additional considerationswithout a substantial increase in R&D productivity, the pharmaceutical industry’s survival (let alone its contin-ued growth prospects), at least in its current form, is in great jeopardy. Much has been written on this subject and multiple contributing factors and potential solutions have been proposed1–3,5. Our econometric model of the current cost of discovering and successfully develop-ing a single new medicine reveals the major contribu-tors to the escalating costs and the declining number of launches. Importantly, our parametric analyses further reveal where the greatest improvements in productivity must occur.
we also offer a number of potential solutions, which if effectively implemented could dramatically reduce costs and importantly increase the flow of truly innova-tive new medicines to patients. For example, using our model parameters (FIG. 2) and sensitivity analyses (FIG. 3), we can elaborate a series of interventions to reduce the cost per NME by 28% and 50% respectively. FIG. 6 illus-trates the potential interventions designed to increase productivity by primarily reducing CT and C, as well as by shifting attrition to early stages of clinical develop-ment, increasing the overall p(TS) in Phase II and III. Although the more extreme case of a 50% reduction in cost per NME is ambitious, it is in our view not unre-alistic and may be necessary to sustain a viable R&D business model.
As the pharmaceutical industry transitions from an era of ‘me-too’ or ‘slightly me-better’ drugs to one of highly innovative medicines that result in mark-edly improved health outcomes, it must, as our model dictates, re-focus its resources (money and talent) on discovery research and early translational medicine. Although the scientific substrate for drug discovery has never been more abundant, a more complete under-standing of human (disease) biology will still be required before many true breakthrough medicines emerge.
we also emphasize that there are other important elements in a highly productive R&D enterprise that are not included in our model, most of which are necessary, although not sufficient to assure success. As underscored by cuatrecasas45, fostering scientific creativity and being opportunistic for serendipitous scientific and medical findings are clearly important elements of past and future success in the pharmaceutical industry. Over-managing or
Figure 6 | Productivity interventions yielding a substantial reduction in the cost per new molecular entity. This analysis shows the potential beneficial effect on capitalized cost per new molecular entity (nME) launch resulting from improvements in a number of R&D parameters (cost, cycle time (CT), probability of technical success (p(Ts))) as calculated using the R&D model described. A 28% reduction in cost per nME could be achieved through the aggregate actions resulting in a 9% reduction in CT from lead optimization to Phase I, a 10%, 15% and 20% reduction in cost for clinical development Phases I, II and III respectively, and a shift in attrition from Phase II to Phase I (decrease p(Ts) in Phase I by 17% and increase p(Ts) in Phase II by 47%). An even larger 50% reduction in cost per nME could be achieved by additionally reducing CT by 20% across Phases II and III, a further reduction in cost by 10% across all phases, and an increase in Phase III p(Ts) by 14% without negatively affecting other parameters.
NATURE REvIEwS | Drug Discovery vOlUME 9 | MARch 2010 | 213
nrd_3078_mar10.indd 213 15/2/10 11:08:20
A n A ly s i s
www.nature.com/reprintcollections/lilly/drug-innovation NATURE REPRINT COLLECTION | THE FUTURE OF DRUG INNOVATION | OCTOBER 2011 | 13
even micro-managing R&D by those with little scientific–medical expertise or experience in R&D may well have contributed to recent pipeline gaps and reduced R&D productivity45. Moreover, fostering such scientific crea-tivity and medical opportunism is often challenging, and sometimes incompatible with the short-term and often aspirational goals of business-driven enterprises. Most importantly, in our opinion, there is no substitute for scientific and clinical intuition for any successful R&D
organization, whether it be in the initial selection of drug targets, the design of a clinical trial or the interpretation of clinical data in order to advance a molecule into late-phase clinical development. Simply stated, good ‘process’ will never be a substitute for good people or good science. however, we firmly believe that both good process and good science are not only compatible, but together will yield the greatest return on R&D investments and thus, have the greatest impact on R&D productivity.
1. O’Hagan, P. & Farkas, C. Bringing pharma R.&D back to health. Bain Brief [online], http://www.bain.com/bainweb/PDFs/cms/Public/BB_Managing_RandD_HC.pdf (2009).
2. Lindgardt, Z., Reeves, M. & Wallenstein, J. Waking the giant: business model innovation in the drug industry. In Vivo 26, 1–6 (2008).
3. Garnier, J. Rebuilding the R.&D engine in big pharma. Harvard Bus. Rev. 86, 68–76 (2008).A candid assessment by the former CEO of GlaxoSmithKline of the downsides of the industry’s process culture.
4. Angell, M. The Truth about Drug Companies: How They Deceive Us and What to do About It. (Random House Trade Paperbacks, New York, 2005).
5. Chertkow, J. Trends in pharmaceutical portfolio management: strategies to maintain profitability despite adversity. Datamonitor [online] http://www.datamonitor.com (2008).
6. Murray, A., Berndt, E. R. & Cutler, D. M. Prescription drug spending trends in the United States: looking beyond the turning point. Health Affairs w151–w160, (2008).
7. EvaluatePharma Alpha World Preview 2014. Evaluate Pharma report (2009).
8. Goodman, M. Market watch: Pharma industry performance metrics: 2007–2012E. Nature Rev. Drug Discov. 7, 795 (2008).
9. Mathieu, M. P., ed. Parexel’s Bio/Pharmaceutical R&D Statistical Sourcebook 2008/2009. (Parexel International Corporation, Waltham, 2008).
10. Pisano, G. P. Science Business: the Promise, the Reality, and the Future of Biotech. (Harvard Business School Press, Boston, 2006).An insightful retrospective on the biotech industry, and the reasons why it has not yet lived up to its promises.
11. DiMasi, J. A. & Grabowski, H. G. The cost of biopharmaceutical R&D: Is biotech different? Manage. Decis. Econ. 28, 469–479 (2007).A contemporary assessment of the costs to discover, develop and launch new molecular entities.
12. Kola, I. The state of innovation in drug development. Clin. Pharmacol. Ther. 83, 227–230 (2008).
13. Cohen, F. J. Macro trends in pharmaceutical innovation. Nature Rev. Drug Discov. 4, 78–84 (2005).
14. Lichtenberg, F. R. The impact of new drug launches on longevity: evidence from longitudinal, disease-level data from 52 countries, 1982–2001 Int. J. Health Care Finance Econ. 5, 47–43 (2005).
15. Kimball, T. R., McCoy, C. E., Khoury, P. R., Daniels, S. R. & Dolan, L. M. Obesity, diabetes damage young arteries, could shorten life. News release, American Heart Association website [online] http://americanheart.mediaroom.com/index.php?s=43&item=740 (2009).
16. KMR Group. Pharmaceutical Benchmarking Forum [online] http://kmrgroup.com/ForumsPharma.html (2009).
17. Booth, B. & Zemmil, R. Prospects for productivity. Nature Rev. Drug Discov. 3, 451–456 (2004).Booth and Zemmil framed the issue of productivity in the pharmaceutical industry and provide a qualitative discussion of some of the drivers and potential solutions.
18. Hu, M., Schultz, K., Sheu, J. & Tschopp, D. The innovation gap in pharmaceutical drug discovery & new models for R&D success. [online], http://www.kellogg.northwestern.edu/academic/biotech/faculty/articles/NewRDModel.pdf (2007).
19. Kola, I. & Landis, J. Can the pharmaceutical industry reduce attrition rates? Nature Rev. Drug Discov. 3, 711–715 (2004).This article provides an in-depth analysis of attrition by phase and therapy area, and offers a scientific approach to reduce Phase II and Phase III attrition rates.
20. Innovation or Stagnation? Challenge and Opportunity on the Critical Path to New Medical Products [online], http://www.fda.gov/oc/initiatives/criticalpath/whitepaper.html (2004).A seminal paper on the hurdles that must be overcome to reverse the decline in R&D productivity.
21. Peck, R. W. Driving earlier clinical attrition: if you want to find the needle, burn down the haystack. Considerations for biomarker development. Drug Discov. Today 12, 289–294 (2007).
22. Little, J. D. C. A proof of the queuing formula L = λ W. Oper. Res. 9, 383–387 (1961).
23. Bunch, P. R. & Schacht, A. L. Modeling resource requirements for pharmaceutical R.&D. Res. Technol. Manage. 45, 48–56 (2002).
24. Deloitte Touche Tohmatsu. Threading the talent needle: what global executives are saying about people and work. [online], http://www.deloitte.com/assets/ Dcom-Shared%20Assets/Documents/us_talent_ThreadingtheTalentNeedle_final3409.pdf (2009).
25. PricewaterhouseCoopers. The changing dynamics of pharma outsourcing in Asia: are you readjusting your sights? [online], http://www.pwc.com/gx/en/pharma-life-sciences/outsourcing/index.jhtml (2008).
26. Danzon, P. M., Nicholson S. & Pereira N. S. Productivity in pharmaceutical-biotechnology R&D: the role of experience and alliances. J. Health Econ. 24, 317–339 (2005).
27. Gregson, N., Sparrowhawk, K., Mauskopf, J. & Paul, J. Pricing medicines: theory and practice, challenges and opportunities. Nature Rev. Drug Discov. 4, 121–130 (2005).
28. Woodcock, J. The prospects for ‘‘personalized medicine’’ in drug development and drug therapy. Clin. Pharmacol. Ther. 1, 164–169 (2007).
29. DiMasi, J. A. The value of improving the productivity of the drug development process: faster times and better decisions. Pharmacoeconomics 20, 1–10 (2002).
30. Pyzdek, T. The Six Sigma Handbook: The complete guide for greenbelts, blackbelts, and managers of all levels. 2nd revised edition (McGraw-Hill, New York, 2003).
31. Goldratt, E. M. & Cox J. The goal: a process of ongoing improvement. Third edition. (Gower Publishing, Aldershot, 2004).
32. Maca, J., Bhattacharya, S., Dragalin, V, Gallo, P, Krams, M. Adaptive seamless phase II/III designs—background, operational aspects, and examples. Drug Inf. J. 4, 463–473 (2006).
33. Kramer, J. A., Sagart, J. E. & Morris, D. L. The application of discovery toxicology and pathology towards the design of safer pharmaceutical lead candidates. Nature Rev. Drug Discov. 6, 636–649 (2007).
34. Hopkins, A. L. & Groom, C. R. The druggable genome. Nature Rev. Drug Discov. 1, 727–730 (2002).
35. Grenet, O. Significance of the human genome sequence to drug discovery. Pharmacogenomics J. 1, 11–12 (2001).
36. Horton, J. D., Cohen, J. C. & Hobbs, H. H. PCSK9: a convertase that coordinates LDL catabolism. J. Lipid Res. S172–S177 (2009).
37. Abifadel, M. et al. Mutations in PCSK9 cause autosomal dominant hypercholesterolemia. Nature Genet. 34, 154–156 (2003).
38. Cohen, J. C., Boerwinkle, E., Mosley, Jr., T. H. & Hobbs, H. H. Sequence variations in PCSK9, low LDL, and protection against coronary heart disease. N. Engl. J. Med. 354, 1264–1272 (2006).
39. Cao, G., Qian, Y. W., Kowala, M. C. & Konrad, R. J. Further LDL cholesterol lowering through targeting PCSK9 for coronary artery disease. Endocrine, Metabolic & Immune Disorders – Drug Targets. 8, 238–243 (2008).
40. Chan, J.C. et al. A proprotein convertase subtilisin/kexin type 9 neutralizing antibody reduces serum cholesterol in mice and nonhuman primates. Proc. Natl Acad. Sci. USA 106, 9820–9825 (2009).
41. Shepherd, J. et.al. Effect of lowering LDL cholesterol substantially below currently recommended levels in patients with coronary heart disease and diabetes. Diabetes Care 29, 1220–1226 (2006).
42. Drenth, J. P. H. & Waxman, S. G. Mutations in sodium-channel gene SCN9A cause a spectrum of human genetic pain disorders. J. Clin. Invest. 117, 3603–3609 (2007).
43. Krafte, D. S. & Bannon, A. W. Sodium channels and nociception: recent concepts and therapeutic opportunities. Curr. Opin. Pharmacol. 8, 50–56 (2008).
44. Bonabeau, E. N., Bodick, N. & Armstrong, R. W. A more rational approach to new-product development. Harvard Bus. Rev. 86, 96–102 (2008).A review of Eli Lilly’s Chorus model of early drug development and FIPNet strategy.
45. Cuatrecasas, P. Drug discovery in jeopardy. J. Clin. Invest. 116, 2837–2842 (2006).A frank analysis by one of the most successful R&D leaders of problems that have fostered the current innovation crisis.
AcknowledgementsThe authors wish to acknowledge the seminal thought leader-ship on the issue of R&D productivity that A. Bingham has provided to the pharmaceutical industry. In addition, we wish to thank J.S. Andersen and T. Mason for helping frame the productivity concepts expressed in this manuscript, and G. Pisano and J. DiMasi for helpful suggestions and comments.
Competing interests statementThe authors declare competing financial interests: see web version for details.
DATABASESUniProtKB: http://www.uniprot.orgPCsK9 | sCn9A
SUPPLEMENTARY INFORMATIONsee online article: s1 (box) | s2 (box) | s3 (box)
All links Are AcTive in The online PDf
214 | MARch 2010 | vOlUME 9 www.nature.com/reviews/drugdisc
nrd_3078_mar10.indd 214 15/2/10 11:08:20
A n A ly s i s
Nature Reviews | Drug Discovery
Cost per NME (US$ millions)
2,0001,8001,6001,4001,2001,000800200 400 6000
Cost per NME (baseline)CT (lead optimization–Phase I)
C (Phase I–III)
p(TS) (shift from Phase II to Phase I)
Cost per NME (~28% reduction)CT (Phase II, Phase III)
C (10% across all phases)
p(TS) (Phase III)
Cost per NME (~50% reduction)
our Phase II portfolio to approximately 50%. Moreover, the average C for establishing POc for a single NME in chorus is $6 million compared with $22 million using our more traditional approach. Thus, the epicentre of R&D focus and investment is shifted from the tradi-tional paradigm of resource-intensive Phase III and even Phase Iv clinical trials to one that generates substantially greater ‘shots on goal’ in the form of high-quality drug candidates (WIP) directed towards more validated tar-gets and in which uncertainty surrounding these more unprecedented targets (and mechanisms of drug action) can be resolved earlier by POc studies.
Given that the vast majority of drug candidates are destined to fail (even with reduced attrition) can they fail faster and less expensively? This model obviously requires a redistribution of R&D investments from the later stages of development to the sweet spot illustrated in FIG. 5. This can be achieved if late-phase attrition can be reduced as we have described. For example, as previously modelled, shifting attrition from Phase II or Phase III to Phase I can reduce the cost of drug development29. Our modelling shows that shifting 25% of Phase II attrition to Phase I results in savings of $30 million in out-of-pocket C per NME, which is enough to fund two addi-tional Phase I WIPs. This equates to shifting Phase II p(TS) from 34% to 41% and reducing Phase I p(TS) from 54% to 45%. This cost saving would be multiplied over an R&D portfolio that is aiming to produce more than 1 NME per year and could be increased further if some attrition was shifted from Phase III to Phase I (for example, shifting 25% of Phase III attrition to Phase I results in more than $20 million in additional out-of-pocket savings).
however, one risk of using this quick win, fast fail paradigm is that false-negative POc data (type 2 errors) could offset some or all of the cost savings generated by shifting attrition earlier21. Thus, it is important to ensure that the additional studies that form the basis for the early decision have a relatively low uncertainty, which is not possible for all projects.
Finally, we consider that one of the major contribu-tors to high Phase III attrition is simply premature advancement of NMEs into Phase III; that is, prior to establishing efficacy and an acceptable safety profile in Phase I (POc) and Phase II. The latter is often the result of poor discipline in portfolio management combined with perceived near-term business imperatives.
Summary and additional considerationswithout a substantial increase in R&D productivity, the pharmaceutical industry’s survival (let alone its contin-ued growth prospects), at least in its current form, is in great jeopardy. Much has been written on this subject and multiple contributing factors and potential solutions have been proposed1–3,5. Our econometric model of the current cost of discovering and successfully develop-ing a single new medicine reveals the major contribu-tors to the escalating costs and the declining number of launches. Importantly, our parametric analyses further reveal where the greatest improvements in productivity must occur.
we also offer a number of potential solutions, which if effectively implemented could dramatically reduce costs and importantly increase the flow of truly innova-tive new medicines to patients. For example, using our model parameters (FIG. 2) and sensitivity analyses (FIG. 3), we can elaborate a series of interventions to reduce the cost per NME by 28% and 50% respectively. FIG. 6 illus-trates the potential interventions designed to increase productivity by primarily reducing CT and C, as well as by shifting attrition to early stages of clinical develop-ment, increasing the overall p(TS) in Phase II and III. Although the more extreme case of a 50% reduction in cost per NME is ambitious, it is in our view not unre-alistic and may be necessary to sustain a viable R&D business model.
As the pharmaceutical industry transitions from an era of ‘me-too’ or ‘slightly me-better’ drugs to one of highly innovative medicines that result in mark-edly improved health outcomes, it must, as our model dictates, re-focus its resources (money and talent) on discovery research and early translational medicine. Although the scientific substrate for drug discovery has never been more abundant, a more complete under-standing of human (disease) biology will still be required before many true breakthrough medicines emerge.
we also emphasize that there are other important elements in a highly productive R&D enterprise that are not included in our model, most of which are necessary, although not sufficient to assure success. As underscored by cuatrecasas45, fostering scientific creativity and being opportunistic for serendipitous scientific and medical findings are clearly important elements of past and future success in the pharmaceutical industry. Over-managing or
Figure 6 | Productivity interventions yielding a substantial reduction in the cost per new molecular entity. This analysis shows the potential beneficial effect on capitalized cost per new molecular entity (nME) launch resulting from improvements in a number of R&D parameters (cost, cycle time (CT), probability of technical success (p(Ts))) as calculated using the R&D model described. A 28% reduction in cost per nME could be achieved through the aggregate actions resulting in a 9% reduction in CT from lead optimization to Phase I, a 10%, 15% and 20% reduction in cost for clinical development Phases I, II and III respectively, and a shift in attrition from Phase II to Phase I (decrease p(Ts) in Phase I by 17% and increase p(Ts) in Phase II by 47%). An even larger 50% reduction in cost per nME could be achieved by additionally reducing CT by 20% across Phases II and III, a further reduction in cost by 10% across all phases, and an increase in Phase III p(Ts) by 14% without negatively affecting other parameters.
NATURE REvIEwS | Drug Discovery vOlUME 9 | MARch 2010 | 213
nrd_3078_mar10.indd 213 15/2/10 11:08:20
A n A ly s i s
14 | OCTOBER 2011 | THE FUTURE OF DRUG INNOVATION | NATURE REPRINT COLLECTION www.nature.com/reprintcollections/lilly/drug-innovation
multiple proteins may be required to perturb robust pheno-types13,16,17. The emergent phenotype that occurs with the perturba-tion of multiple nodes is experimentally demonstrated by syntheticbehaviors: synthetic lethality, synthetic sickness and synthetic rescue.Dual knockouts in a number of model systems have shown thatalthough the isolated deletion of two individual genes may demon-strate no effect, the simultaneous deletion of the two genes can belethal (synthetic lethality) or deleterious (synthetic sickness)18. Arecent large-scale study by Hillenmeyer et al. demonstrates the extentof synthetic lethality when gene deletions are augmented by chemicalinterventions19. Under ideal conditions, only 34% of single-genedeletions in yeast resulted in lethality or sickness. However, whenthe whole genome panel of yeast single-gene knockouts was screenedagainst a diverse small-molecule library and assayed against awide range of environmental conditions, an additional 63% ofgene knockouts showed a growth phenotype19, resulting in 97% ofgenes demonstrating a fitness defect when challenged with asmall molecule under at least one environmental condition. Thus,although the majority of genes may be redundant under anyone environment, there seems to be little redundancy across aspectrum of conditions when a genetic perturbation is combinedwith a chemical insult.As increased understanding of the role of networks in the robust-
ness and redundancy of biological systems challenges the dominantassumption of single target drug discovery16,20–23, a new approach todrug discovery—that of polypharmacology16,17,20,21,24–29—is emer-ging. Polypharmacology is not to be confused with the behavior ofpromiscuous aggregators (as identified by McGovern et al.) that arisefrom certain small molecules self-associating into colloids athigh concentrations in biological buffers30. Instead, polypharmacologyis the specific binding of a compound to two or more moleculartargets. In an analogy to Paracelsus’ axiom that the difference betweena drug and a poison is the dose, the utility or toxicity of syntheticallylethal and synthetically sick combinations is found in the biologicalcontext to which they are applied. Therefore, understanding thepolypharmacology of a drug and its effect on biological networksand phenotype is essential if we wish to improve efficacy but alsounderstand toxicity.
Synthetic lethality in cancerThe fundamental challenge of anticancer therapy is the need for agentsthat eliminate cancer cells with a therapeutic index that is safelytolerated by the patient. Most current anticancer drugs inhibitessential functions that are present in both normal and cancerouscells. Although these differentially impact rapidly dividing cancer cells,the essential nature of the targets of most cytotoxic anticancer drugsresults in narrow therapeutic indices. In recent years, a new generationof drugs have targeted protein kinases, such as ABL, EGRF andERBB2, that are differentially expressed in different cancers. Thesenew drugs, which target non-essential proteins, have more manageableside effect profiles than cytotoxics; however, clinical efficacy is, ingeneral, limited. An ideal cancer therapy, therefore, would be one thattargeted proteins or interactions that are essential in cancer cells butnon-essential in normal cells.Cancer-specific molecular targets are rare. Most mutated oncogenic
proteins are also present in normal cells, and selective inhibition of themutant form can be a challenge. For example, the chronic myeloidleukemia (CML)-specific BCR-ABL fusion protein is inhibited byimatinib. However, imatinib also inhibits the non-oncogenic C-Ablkinase in normal cells, and long-term administration of the drug canlead to cardiotoxicity31. To overcome the difficulty of identifying and
targeting differential features in a cancer, synthetic lethality has beenproposed as a possible strategy for therapeutic intervention32. In thecontext of oncology, genetic and epigenetic changes in a cancer cellmay change not only the relative expression levels but also thestoichiometry of the interaction network, and thus change the relativedependence on specific proteins relative to normal cells. Thus, twoproteins that are non-essential in a normal cell may be essential in thecontext of a re-wired cancer cell network. In short, though themajority of the protein inventory in a cancer cell is the same as anormal cell, the differences in the topology of the biological networkscould be targeted to produce an improved therapeutic index. Indeed,subtle differences in network stability and structure between cancercells may explain the wide variance in cell fate that has been observedin individual cells of the same genetic lineage33.Whitehurst et al. recently conducted a whole-genome synthetic
lethality screen in combination with paclitaxel, resulting in thediscovery of new drug-drug combinations34. From the whole-genomeRNA interference screening, 87 initial genes were identified thatsensitized a human non-small-cell lung cancer line to paclitaxel,including the gene encoding vacuolar ATPase, the target of salicyli-halamide A. Subsequent testing of salicylihalamide A and paclitaxel incombination was shown to reduce cancer cell viability. Sensitizationsynthetic lethality screens can also be used to discover potentialsynergistic combinations that can enhance the effectiveness of thera-pies. For example, breast cancer cells with deficiencies in BRAC1 andBRAC2 show differential synthetic lethality to inhibition of poly(ADP-ribose)-polymerase-1 (PARP). Screening a PARP inhibitor for addi-tional synthetic lethality with an RNAi library identified a set ofkinases, including CDK5, whose knockdown resulted in increasedsensitization to the PARP inhibitor35. In addition to whole-genomescreening, hypotheses for new drug combinations can be discovered byanalysis of gene expression signatures. For example, analysis of breastcancer gene expression data revealed that the ‘‘gang of four’’ (COX2,MMP1, MMP2 and epiregulin) is essential for lung metastasis36,37.Genetic and pharmacological inhibition of these four genes, incombination, resulted in the halting of metastatic progression in amouse model36. Previous advances in cancer combination therapies,such as those against childhood leukemia, were developed empiricallyover three decades. Synthetic lethality chemical sensitization screensoffer a promising method to help systematically explore candidatecancer drug combinations efficiently in the laboratory.The relationship between kinetics and systemic responses to per-
turbations offers an intriguing additional dimension in which networkpharmacology strategies can be applied; it also provides a frameworkfor understanding systems responses38–40. The sequence in which acombination is dosed may create different perturbations to the net-work that may have a dramatic effect on efficacy38,41. The systemiceffects of network perturbations suggest that further studies on dosingsequence should follow the discovery of even modest effects ofcombination therapies.
Antibacterial polypharmacologyThe single-target approach has been a major assumption behindgenomics-based drug discovery strategies so far, including the searchfor new antibacterial targets42–45. However, the biologically led strategyfor new antibacterial drugs, usually consisting of the search for singleproteins that are essential when deleted, is flawed for two fundamentalreasons: the downstream difficulty of discovering small-moleculecompounds has often been considered only after significant invest-ment in biology and a single amino acid mutation in the target proteinis often enough to confer drug resistance. Many effective antibiotics
REV I EW
NATURE CHEMICAL BIOLOGY VOLUME 4 NUMBER 11 NOVEMBER 2008 683
Network pharmacology: the next paradigm indrug discoveryAndrew L Hopkins
The dominant paradigm in drug discovery is the concept of designing maximally selective ligands to act on individual drugtargets. However, many effective drugs act via modulation of multiple proteins rather than single targets. Advances in systemsbiology are revealing a phenotypic robustness and a network structure that strongly suggests that exquisitely selective compounds,compared with multitarget drugs, may exhibit lower than desired clinical efficacy. This new appreciation of the role ofpolypharmacology has significant implications for tackling the two major sources of attrition in drug development—efficacy andtoxicity. Integrating network biology and polypharmacology holds the promise of expanding the current opportunity space fordruggable targets. However, the rational design of polypharmacology faces considerable challenges in the need for new methodsto validate target combinations and optimize multiple structure-activity relationships while maintaining drug-like properties.Advances in these areas are creating the foundation of the next paradigm in drug discovery: network pharmacology.
Over the past decade, there has been a significant decrease in the ratethat new drug candidates are being translated into effective therapies inthe clinic. In particular, there has been a worrying rise in late-stageattrition in phase 2 and phase 3 (ref. 1). Currently, the two single mostimportant reasons for attrition in clinical development are (i) lack ofefficacy and (ii) clinical safety or toxicology, which each account for30% of failures1. These late-stage attrition rates are at the heart of muchof the relative decline in productivity of the pharmaceutical industry.Moreover, the decline in productivity is creating a major financialshock to the pharmaceutical industry. Owing to patents expiring onthe current generation of marketed drugs, from 2010 onward, phar-maceutical companies will face the first fall in revenue in four decades.Many reasons have been proposed for this decline in pharmaceu-
tical research and development productivity. However, the funda-mental problem may not be technological, environmental or evenscientific but philosophical—there may be issues with the coreassumptions that frame our approach to drug discovery. The increasein the rate of drugs failing in late-stage clinical development over thepast decade has been concurrent with the dominance of the assump-tion that the goal of drug discovery is to design exquisitely selectiveligands that act on a single disease target. This philosophy of rationaldrug design, or more specifically, the ‘one gene, one drug, one disease’paradigm, arose from a congruence between genetic reductionism andnew molecular biology technologies that enabled the isolation andcharacterization of individual ‘disease-causing’ genes2, therebyenabling the full realization of Ehrlich’s philosophy of ‘magic bullets’targeting individual chemoreceptors3. The underlying assumption ofthe current approach is that safer, more effective drugs will result from
designing very selective ligands where undesirable and potentiallytoxic side activities have been removed. However, after nearly twodecades of focusing on developing highly selective ligands, the clinicalattrition figures challenge this hypothesis.
Need for a one-two punchClinical attrition rates are not the only data to challenge the currentparadigm in drug discovery. Large-scale functional genomics studiesin a variety of model organisms have revealed that under laboratoryconditions, many single-gene knockouts by themselves exhibit little orno effect on phenotype, with approximately 19% of genes beingessential across a number of model organisms4–6. In addition to the19% lethality rate, systematic genome-wide homozygous gene deletionexperiments in yeast reveal that only 15% of knockouts result in afitness defect in ideal conditions7. A project to delete each of thedruggable genes8 in the mouse genome and profile each knockoutacross a battery of phenotypic assays has revealed that as few as 10% ofknockouts demonstrate phenotypes that may be of value for drugtarget validation4,9–11.This robustness of phenotype can be understood in terms of
redundant functions and alternative compensatory signaling routes12.Network analysis of biological pathways and interactions has revealedthat much of the robustness of biological systems can derive from thestructure of the network13,14. The scale-free nature of many biologicalnetworks results in systems that are resilient against random deletionof any one node but that are also critically dependent on a few highlyconnected hubs. The inherent robustness of interaction networks, asan underlying property, has profound implications for drug discovery;instead of searching for the ‘disease-causing’ genes, network biologysuggests that the strategy should be to identify the perturbations in thedisease-causing network15.Network biology analysis predicts that if, in most cases, deletion of
individual nodes has little effect on disease networks, modulatingPublished online 20 October 2008; doi:10.1038/nchembio.118
Division of Biological Chemistry and Drug Discovery, College of Life Science,University of Dundee, Dow Street, Dundee DD1 3DF, UK. Correspondence shouldbe addressed to A.L.H. ([email protected]).
682 VOLUME 4 NUMBER 11 NOVEMBER 2008 NATURE CHEMICAL BIOLOGY
R EV I EW
First published in Nature Chemical Biology 4, 682 - 690 (2008)
www.nature.com/reprintcollections/lilly/drug-innovation NATURE REPRINT COLLECTION | THE FUTURE OF DRUG INNOVATION | OCTOBER 2011 | 15
multiple proteins may be required to perturb robust pheno-types13,16,17. The emergent phenotype that occurs with the perturba-tion of multiple nodes is experimentally demonstrated by syntheticbehaviors: synthetic lethality, synthetic sickness and synthetic rescue.Dual knockouts in a number of model systems have shown thatalthough the isolated deletion of two individual genes may demon-strate no effect, the simultaneous deletion of the two genes can belethal (synthetic lethality) or deleterious (synthetic sickness)18. Arecent large-scale study by Hillenmeyer et al. demonstrates the extentof synthetic lethality when gene deletions are augmented by chemicalinterventions19. Under ideal conditions, only 34% of single-genedeletions in yeast resulted in lethality or sickness. However, whenthe whole genome panel of yeast single-gene knockouts was screenedagainst a diverse small-molecule library and assayed against awide range of environmental conditions, an additional 63% ofgene knockouts showed a growth phenotype19, resulting in 97% ofgenes demonstrating a fitness defect when challenged with asmall molecule under at least one environmental condition. Thus,although the majority of genes may be redundant under anyone environment, there seems to be little redundancy across aspectrum of conditions when a genetic perturbation is combinedwith a chemical insult.As increased understanding of the role of networks in the robust-
ness and redundancy of biological systems challenges the dominantassumption of single target drug discovery16,20–23, a new approach todrug discovery—that of polypharmacology16,17,20,21,24–29—is emer-ging. Polypharmacology is not to be confused with the behavior ofpromiscuous aggregators (as identified by McGovern et al.) that arisefrom certain small molecules self-associating into colloids athigh concentrations in biological buffers30. Instead, polypharmacologyis the specific binding of a compound to two or more moleculartargets. In an analogy to Paracelsus’ axiom that the difference betweena drug and a poison is the dose, the utility or toxicity of syntheticallylethal and synthetically sick combinations is found in the biologicalcontext to which they are applied. Therefore, understanding thepolypharmacology of a drug and its effect on biological networksand phenotype is essential if we wish to improve efficacy but alsounderstand toxicity.
Synthetic lethality in cancerThe fundamental challenge of anticancer therapy is the need for agentsthat eliminate cancer cells with a therapeutic index that is safelytolerated by the patient. Most current anticancer drugs inhibitessential functions that are present in both normal and cancerouscells. Although these differentially impact rapidly dividing cancer cells,the essential nature of the targets of most cytotoxic anticancer drugsresults in narrow therapeutic indices. In recent years, a new generationof drugs have targeted protein kinases, such as ABL, EGRF andERBB2, that are differentially expressed in different cancers. Thesenew drugs, which target non-essential proteins, have more manageableside effect profiles than cytotoxics; however, clinical efficacy is, ingeneral, limited. An ideal cancer therapy, therefore, would be one thattargeted proteins or interactions that are essential in cancer cells butnon-essential in normal cells.Cancer-specific molecular targets are rare. Most mutated oncogenic
proteins are also present in normal cells, and selective inhibition of themutant form can be a challenge. For example, the chronic myeloidleukemia (CML)-specific BCR-ABL fusion protein is inhibited byimatinib. However, imatinib also inhibits the non-oncogenic C-Ablkinase in normal cells, and long-term administration of the drug canlead to cardiotoxicity31. To overcome the difficulty of identifying and
targeting differential features in a cancer, synthetic lethality has beenproposed as a possible strategy for therapeutic intervention32. In thecontext of oncology, genetic and epigenetic changes in a cancer cellmay change not only the relative expression levels but also thestoichiometry of the interaction network, and thus change the relativedependence on specific proteins relative to normal cells. Thus, twoproteins that are non-essential in a normal cell may be essential in thecontext of a re-wired cancer cell network. In short, though themajority of the protein inventory in a cancer cell is the same as anormal cell, the differences in the topology of the biological networkscould be targeted to produce an improved therapeutic index. Indeed,subtle differences in network stability and structure between cancercells may explain the wide variance in cell fate that has been observedin individual cells of the same genetic lineage33.Whitehurst et al. recently conducted a whole-genome synthetic
lethality screen in combination with paclitaxel, resulting in thediscovery of new drug-drug combinations34. From the whole-genomeRNA interference screening, 87 initial genes were identified thatsensitized a human non-small-cell lung cancer line to paclitaxel,including the gene encoding vacuolar ATPase, the target of salicyli-halamide A. Subsequent testing of salicylihalamide A and paclitaxel incombination was shown to reduce cancer cell viability. Sensitizationsynthetic lethality screens can also be used to discover potentialsynergistic combinations that can enhance the effectiveness of thera-pies. For example, breast cancer cells with deficiencies in BRAC1 andBRAC2 show differential synthetic lethality to inhibition of poly(ADP-ribose)-polymerase-1 (PARP). Screening a PARP inhibitor for addi-tional synthetic lethality with an RNAi library identified a set ofkinases, including CDK5, whose knockdown resulted in increasedsensitization to the PARP inhibitor35. In addition to whole-genomescreening, hypotheses for new drug combinations can be discovered byanalysis of gene expression signatures. For example, analysis of breastcancer gene expression data revealed that the ‘‘gang of four’’ (COX2,MMP1, MMP2 and epiregulin) is essential for lung metastasis36,37.Genetic and pharmacological inhibition of these four genes, incombination, resulted in the halting of metastatic progression in amouse model36. Previous advances in cancer combination therapies,such as those against childhood leukemia, were developed empiricallyover three decades. Synthetic lethality chemical sensitization screensoffer a promising method to help systematically explore candidatecancer drug combinations efficiently in the laboratory.The relationship between kinetics and systemic responses to per-
turbations offers an intriguing additional dimension in which networkpharmacology strategies can be applied; it also provides a frameworkfor understanding systems responses38–40. The sequence in which acombination is dosed may create different perturbations to the net-work that may have a dramatic effect on efficacy38,41. The systemiceffects of network perturbations suggest that further studies on dosingsequence should follow the discovery of even modest effects ofcombination therapies.
Antibacterial polypharmacologyThe single-target approach has been a major assumption behindgenomics-based drug discovery strategies so far, including the searchfor new antibacterial targets42–45. However, the biologically led strategyfor new antibacterial drugs, usually consisting of the search for singleproteins that are essential when deleted, is flawed for two fundamentalreasons: the downstream difficulty of discovering small-moleculecompounds has often been considered only after significant invest-ment in biology and a single amino acid mutation in the target proteinis often enough to confer drug resistance. Many effective antibiotics
REV I EW
NATURE CHEMICAL BIOLOGY VOLUME 4 NUMBER 11 NOVEMBER 2008 683
Network pharmacology: the next paradigm indrug discoveryAndrew L Hopkins
The dominant paradigm in drug discovery is the concept of designing maximally selective ligands to act on individual drugtargets. However, many effective drugs act via modulation of multiple proteins rather than single targets. Advances in systemsbiology are revealing a phenotypic robustness and a network structure that strongly suggests that exquisitely selective compounds,compared with multitarget drugs, may exhibit lower than desired clinical efficacy. This new appreciation of the role ofpolypharmacology has significant implications for tackling the two major sources of attrition in drug development—efficacy andtoxicity. Integrating network biology and polypharmacology holds the promise of expanding the current opportunity space fordruggable targets. However, the rational design of polypharmacology faces considerable challenges in the need for new methodsto validate target combinations and optimize multiple structure-activity relationships while maintaining drug-like properties.Advances in these areas are creating the foundation of the next paradigm in drug discovery: network pharmacology.
Over the past decade, there has been a significant decrease in the ratethat new drug candidates are being translated into effective therapies inthe clinic. In particular, there has been a worrying rise in late-stageattrition in phase 2 and phase 3 (ref. 1). Currently, the two single mostimportant reasons for attrition in clinical development are (i) lack ofefficacy and (ii) clinical safety or toxicology, which each account for30% of failures1. These late-stage attrition rates are at the heart of muchof the relative decline in productivity of the pharmaceutical industry.Moreover, the decline in productivity is creating a major financialshock to the pharmaceutical industry. Owing to patents expiring onthe current generation of marketed drugs, from 2010 onward, phar-maceutical companies will face the first fall in revenue in four decades.Many reasons have been proposed for this decline in pharmaceu-
tical research and development productivity. However, the funda-mental problem may not be technological, environmental or evenscientific but philosophical—there may be issues with the coreassumptions that frame our approach to drug discovery. The increasein the rate of drugs failing in late-stage clinical development over thepast decade has been concurrent with the dominance of the assump-tion that the goal of drug discovery is to design exquisitely selectiveligands that act on a single disease target. This philosophy of rationaldrug design, or more specifically, the ‘one gene, one drug, one disease’paradigm, arose from a congruence between genetic reductionism andnew molecular biology technologies that enabled the isolation andcharacterization of individual ‘disease-causing’ genes2, therebyenabling the full realization of Ehrlich’s philosophy of ‘magic bullets’targeting individual chemoreceptors3. The underlying assumption ofthe current approach is that safer, more effective drugs will result from
designing very selective ligands where undesirable and potentiallytoxic side activities have been removed. However, after nearly twodecades of focusing on developing highly selective ligands, the clinicalattrition figures challenge this hypothesis.
Need for a one-two punchClinical attrition rates are not the only data to challenge the currentparadigm in drug discovery. Large-scale functional genomics studiesin a variety of model organisms have revealed that under laboratoryconditions, many single-gene knockouts by themselves exhibit little orno effect on phenotype, with approximately 19% of genes beingessential across a number of model organisms4–6. In addition to the19% lethality rate, systematic genome-wide homozygous gene deletionexperiments in yeast reveal that only 15% of knockouts result in afitness defect in ideal conditions7. A project to delete each of thedruggable genes8 in the mouse genome and profile each knockoutacross a battery of phenotypic assays has revealed that as few as 10% ofknockouts demonstrate phenotypes that may be of value for drugtarget validation4,9–11.This robustness of phenotype can be understood in terms of
redundant functions and alternative compensatory signaling routes12.Network analysis of biological pathways and interactions has revealedthat much of the robustness of biological systems can derive from thestructure of the network13,14. The scale-free nature of many biologicalnetworks results in systems that are resilient against random deletionof any one node but that are also critically dependent on a few highlyconnected hubs. The inherent robustness of interaction networks, asan underlying property, has profound implications for drug discovery;instead of searching for the ‘disease-causing’ genes, network biologysuggests that the strategy should be to identify the perturbations in thedisease-causing network15.Network biology analysis predicts that if, in most cases, deletion of
individual nodes has little effect on disease networks, modulatingPublished online 20 October 2008; doi:10.1038/nchembio.118
Division of Biological Chemistry and Drug Discovery, College of Life Science,University of Dundee, Dow Street, Dundee DD1 3DF, UK. Correspondence shouldbe addressed to A.L.H. ([email protected]).
682 VOLUME 4 NUMBER 11 NOVEMBER 2008 NATURE CHEMICAL BIOLOGY
R EV I EW
16 | OCTOBER 2011 | THE FUTURE OF DRUG INNOVATION | NATURE REPRINT COLLECTION www.nature.com/reprintcollections/lilly/drug-innovation
way drugs perturb networks compared to genetic deletions. Geneticdeletions completely remove all the interactions and functions of thenode from a network, whereas a drug may only partially ablate someinteractions78 (such as decreasing the concentration of a metabolite)but leave other links fully intact (such as protein-protein interactions).In contrast, agonists may strengthen particular links in a network.Thus, modeling attacks on links rather than nodes should provide acloser model of drug action71,78. Furthermore, an essential point isthat only about 15% of any protein nodes in a network may bechemically tractable with small-molecule drugs8; therefore, it isnecessary to map druggability and polypharmacology interactionson integrated biological networks in order to identify the optimalpoints of interaction for drug discovery.
Designer polypharmacologyNetwork analysis does not preclude the identification of individualtargets that by virtue of their position in a disease network could bemodulated to achieve a beneficial clinical outcome. Indeed, the
theoretical work on synthetic rescue suggests that inactivation ofone node, for example, by mutation or environmental factors, couldbe compensated for by the therapeutic inactivation of a secondnode15,79. Indeed, in terms of synthetic lethality, oncogenic mutationsmay themselves form half of a synthetically lethal pair, therebyresulting in the need to pharmacologically inhibit only one target34,35.However, if drug hunters are to embrace the wider opportunity
posed by network pharmacology, then what is required is a ‘playbook’of polypharmacology strategies to design therapies that act on severalnodes in a disease network (Box 1). For good reason, medicinalchemists have tried to decrease the off-target effects of drug candidatesto try to decrease the chances of off-target toxicities. Analysis of theBioprint database of the complete screening matrix of FDA-approveddrugs against approximately 200 assays reveals a strong relationshipbetween calculated lipophilicity (clogP) and low-affinity off-targetpromiscuity80. The number of potential off-target activities appearsto double above the value clogP ¼ 3.75 (ref. 80). The goal ofpolypharmacology is not to lazily introduce nonspecific promiscuityinto a compound by increasing the lipophilicity but to identify acompound with a desired biological profile across multiple targetswhose combined modulation will perturb a disease state. Thus,understanding the broader polypharmacology profile of a compoundand rationally modifying its profiles should equally benefit safetypharmacology as well as disease efficacy.Specific design strategies are required to balance a set of biological
activities in one compound. Morphy et al. have described thecontinuum of design strategies medicinal chemists have traditionallyused to design drugs with multiple activities81. At one end of thespectrum are conjugated ligands, which contain separate pharmaco-poeia entities connected by a linker. Ligands designed by conjugatingtwo distinct pharmacophores are more likely to have high molecularweight and less likely to have oral drug-like physicochemical proper-ties82. At the other end of the spectrum are ligands where multiplepharmacophores overlap or are highly integrated. Compounds withoverlapping or integrated pharmacophores are likely to have lowermolecular weight and potentially more drug-like physicochemicalproperties. Ligands where polypharmacology has been deliberatelydesigned in, by conjugation or overlapping pharmacophores, tend tohave lower ligand efficiency than general preclinical compounds. Thisfinding is not surprising given that the compounds are not optimizedfor one single target.Designers of polypharmacology can also take lessons from the work
on drug resistance, particularly in the field of HIV-1 therapies.Mutations of single amino acid residues are often sufficient to conferdrug resistance to many anti-HIV drugs, such as the non-nucleosidereverse transcriptase inhibitors (NNRTIs). Efforts to discover second-generation NNRTIs required compounds to be active against both thewild type and the common drug-resistant mutations. Thus, second-generation NNRTIs can be considered as multitarget drugs as they arerequired to bind to several structurally distinct binding sites on aspectrum of mutated reverse transcriptases. Crystallographic analysesof the NNRTIs revealed that one design strategy is to identifyinhibitors that make strong molecular interactions with conservedregions of the binding site, such as structurally important residues andmain chain atoms; this has the added advantage of reducing depen-dence on interactions with mutable residues83. Several of these designstrategies have also been derived a priori by theoretical analysis ofdrug-resistant target ensembles53.In addition to the relationship between lipophilicity and promis-
cuity, a strong relationship has also been reported between molecularweight25,82 and molecular complexity84 and promiscuity. In an
Three strategies are available to the designers of multitarget therapies. The first
strategy, which is the most conventional, is to prescribe multiple individual
medications. Multidrug combination cocktails are the mainstay of highly active
antiretroviral therapy for HIV and a large number of anticancer protocols. The
drawback of prescribing multiple medications is patient compliance and the
danger of drug-drug interactions. To overcome these issues, a second strategy is
the development of multicomponent drugs that contain two or more active
ingredients formulated in the same delivery device, such as a single pill, capsule
or inhaler22,52. Several successful drug combinations have now been reformu-
lated in single multicomponent medicines, such as Atripla, Advair, Caduet,
Combivir, Epzicom, Rebetron and Truvada. Advances in formulation technolo-
gies are expanding the number of drug combinations that can be effectively
combined into a single delivery mechanism. However, given the significant
differences in pharmacokinetics, metabolisms and bioavailability, reformulation
of drug combinations is not a trivial problem. Further, two drugs that are
generally safe when dosed individually cannot be assumed to be safe in
combination. In addition to the possibility of adverse drug-drug interactions, if
the theory of network pharmacology indicates that an effect on phenotype may
derive from hitting multiple targets, then that combined phenotypic perturbation
may be efficacious or deleterious. The major challenge to both drug combination
strategies is the regulatory requirement for each individual drug to be shown to
be safe as an individual agent and in combination. Therefore, most multi-
component drug development has focused on exploiting combinations of
approved drugs, with the notable exception of the torcetrapib-atorvastatin
combination that was being developed by Pfizer. A drawback of this approach
to drug combinations is that the target universe of the current pharmacopeia is
very limited. Current estimates are that the entire formulary of approximately
1,200 FDA-approved drugs only acts on about 320 molecular targets115
(excluding the incredibly promiscuous kinase drug sunitinib (Sutent,
SU11248), which itself binds to 79 protein kinases with Kd o 10 mM)116.
The third strategy for multitarget therapy is to design a single compound with
selective polypharmacology25,27,81. The advent of wide-ligand profiling has
revealed the extent of polypharmacology across the pharmacopeia, and it has
also shown that many approved drugs act on multiple targets25,115. Dosing with a
single compound may have advantages over a drug combination in terms of
equitable pharmacokinetics and biodistribution. Indeed, troughs in drug expo-
sure due to incompatible pharmacokinetics between components of a combina-
tion therapy may create a low-dose window of opportunity where a reduced
selection pressure can lead to drug resistance. In terms of drug registration,
approval of a single compound acting on multiple targets faces significantly lower
regulatory barriers than approval of a combination of new drugs.
Box 1 Polypharmacology playbook
REV I EW
NATURE CHEMICAL BIOLOGY VOLUME 4 NUMBER 11 NOVEMBER 2008 685
act by targeting multiple proteins simultaneously rather than indivi-dual proteins46. For example, the antibacterial action ofb-lactams is dependent on the inhibition of at least two of themultiple penicillin-binding proteins (PBPs). Indeed, because multiplePBPs can be deleted with no effect on phenotype47, the strategy ofsingle target essentiality would not have discovered this importantclass of antibacterial drug targets. Similarly, fluoroquinolone antibio-tics are dual-targeted inhibitors of the proteins ParC and GyrA(ref. 48). D-Cycloserine inhibits four targets, both pairs of alanineracemases and D-Ala-D-Ala ligases. Likewise, fosfomycin overcomesthe redundancy of UDP N-acetylglucosamine enolpyruvyl transferasesby inhibiting them both. Therefore, if we wish to design single drugsthat limit drug resistance, we could consider the development ofmethods to search and prioritize which combinations of targets can beinhibited by the same drug and are essential, either individually (‘dualessentials’) or in combination (‘synthetic lethals’).A strategy of antibacterial polypharmacology can challenge the
current approach to genome-based drug discovery of anti-infectivesin four important ways. First, the druggability of a target isprioritized over single target essentiality. Second, the target doesnot need to be unique to the organism or absent in the host.Although many essential housekeeping enzymes may be commonbetween the host and infectious agent, drug selectivity between thehost and infectious agent can be determined at the binding sitelevel. Third, targets are sought that are lethal in combination butmay have been overlooked as non-essential in individual geneknockout studies, and fourth, groups of targets that are predicted topotentially bind the same compound are prioritized over singletondruggable targets. By targeting two or more essential genes with asingle chemical agent, the ability to delay drug resistance is designedinto the target discovery strategy from the start. Given the failure ofcurrent genome-based strategies for discovering new antibacterialdrugs45, learning the lessons of the previous successful generation ofantibacterial drugs may encourage the development of antibacterialpolypharmacology discovery strategies.
Topology of targetsThe two key challenges facing the development of network pharma-cology are identifying a node or combination of nodes in a biologicalnetwork whose perturbation results in a desired therapeutic out-come49,50, and discovering agents with the desired polypharmacologyprofile to perturb those nodes. Three complementary methods for thecomparative analysis of disease networks are systematic screening,knowledge-based combinations and network analysis. Presently, com-bination screening of mixtures of drugs, chemical tools and RNAi incell-based disease models is the most efficient means of systematicallydiscovering new drug-drug combinations and synthetically lethal genepairs. However, as with all preclinical models, active combinationsdiscovered in the laboratory do not necessarily translate into theclinic51. Moreover, idealized synergist screens between drugs or RNAiin preclinical assays do not account for the complications of dosing,scheduling pharmacokinetics and metabolism necessary to optimize atherapeutic drug cocktail in the clinic. Owing to the size of the searchmatrix, RNAi–chemical sensitization screens are usually performedwith a single drug against a whole-genome RNAi array34. Likewise,systematic combination screening of approximately 1,000 US Foodand Drug Administration (FDA)-approved drugs required the use ofhigh-throughput screening methods to assay the massive data matrixrequired for the factorial isobolgram analysis of each combinationthrough the full dose range52,53. Therefore, if we are to effectivelysearch for new drug combinations, there is a pressing need for
computational methods that could reduce the global search spacefor target combinations49,51.Owing to the vast number of possible drug and target combinations
and the ethical considerations and resource constraints on usingin vivo models and conducting clinical trials, most new combinationshave been selected for empirical testing based on a knowledge of theunderlying disease biology. Such knowledge-based approaches areoften incremental but can make a dramatic impact on disease out-comes, as demonstrated by the success of multidrug highly activeantiretroviral therapy in decreasing human immunodeficiency virus(HIV) mortality rates in the developed world. Advances in pathwayanalysis54 and text mining of the biomedical literature55–58 canpotentially be used to enable the large-scale text mining of diseaseknowledge to postulate new combination hypotheses by associativetechniques of inductive and abductive inference59,60. However, thoughadvances in informatics methods can aid the generation of newhypotheses from connecting concepts in the literature, the drawbackof the knowledge-based methods is that they do not provide a robustmodeling analysis of the emergent properties of a network and systemwhen perturbed in new ways. Thus, counterintuitive, paradoxical andunexpected system responses cannot necessarily be predicted by theseassociative methods39.An intriguing possibility for systematic target identification is that
the structures of biological networks themselves may provide valuableinformation in assessing targets and their combinations14,17,38,61. Earlynetwork analysis indicated the possibility of a direct correlationbetween lethality and the degree of connectivity of nodes, where highlyconnected hubs in protein interaction networks are more likely to beessential62. Subsequent re-analysis of the data challenged the relation-ship between the number of interactions of a protein and its essenti-ality63. However, the hypothesis that protein function relates tonetwork topology has been strengthened by recent work that hasrefined the relationship between network topology and system functionby focusing on ‘betweenness centrality’ (the number of nonredundantshortest paths traveling through a node64,65) and ‘bridging centrality’(nodes between and connecting subgraph clusters defined by the ratioof the number of interactions of a neighboring node in a subgraph overthe number of remaining edges in the subgraph66), in addition to themetric of the ‘degree centrality’ (the number of direct interactionsintersecting a node14). Bottlenecks with high betweenness values tendto be better correlated with gene expression dynamics and essentialitythan highly connected hubs64,67. These findings complement theanalysis on ‘party’ and ‘dates’ hubs, which suggests that hubs withhigh betweenness values have pleiotropic functions across the net-work68. Unexpectedly, non-hub bottlenecks with transient interac-tions65 and bridging proteins are less likely to be lethal than averageand tend to be independently regulated66. Thus, given their position incommunication between network clusters and their low lethality,bridging nodes have been suggested as potential drug targets, althoughmodulation of the bridging targets themselves may still be indirect66.An initial network analysis on the current drug targets of approveddrugs indicated that drug targets are commonly highly connected butnot essential69,70.Despite initial challenges, several compelling theoretical and experi-
mental studies support the hypothesis that network topology is anessential feature in the emergent system function of the protein whenit is perturbed; thus, this gives hope that systematic network analysesmay be a useful basis for developing methods to prioritize drug targetsand combinations of targets17,61,71–77. However, if we are to success-fully exploit network analysis for target identification, then we mustrecognize the fundamentally different dynamics and kinetics in the
REV I EW
684 VOLUME 4 NUMBER 11 NOVEMBER 2008 NATURE CHEMICAL BIOLOGY
www.nature.com/reprintcollections/lilly/drug-innovation NATURE REPRINT COLLECTION | THE FUTURE OF DRUG INNOVATION | OCTOBER 2011 | 17
way drugs perturb networks compared to genetic deletions. Geneticdeletions completely remove all the interactions and functions of thenode from a network, whereas a drug may only partially ablate someinteractions78 (such as decreasing the concentration of a metabolite)but leave other links fully intact (such as protein-protein interactions).In contrast, agonists may strengthen particular links in a network.Thus, modeling attacks on links rather than nodes should provide acloser model of drug action71,78. Furthermore, an essential point isthat only about 15% of any protein nodes in a network may bechemically tractable with small-molecule drugs8; therefore, it isnecessary to map druggability and polypharmacology interactionson integrated biological networks in order to identify the optimalpoints of interaction for drug discovery.
Designer polypharmacologyNetwork analysis does not preclude the identification of individualtargets that by virtue of their position in a disease network could bemodulated to achieve a beneficial clinical outcome. Indeed, the
theoretical work on synthetic rescue suggests that inactivation ofone node, for example, by mutation or environmental factors, couldbe compensated for by the therapeutic inactivation of a secondnode15,79. Indeed, in terms of synthetic lethality, oncogenic mutationsmay themselves form half of a synthetically lethal pair, therebyresulting in the need to pharmacologically inhibit only one target34,35.However, if drug hunters are to embrace the wider opportunity
posed by network pharmacology, then what is required is a ‘playbook’of polypharmacology strategies to design therapies that act on severalnodes in a disease network (Box 1). For good reason, medicinalchemists have tried to decrease the off-target effects of drug candidatesto try to decrease the chances of off-target toxicities. Analysis of theBioprint database of the complete screening matrix of FDA-approveddrugs against approximately 200 assays reveals a strong relationshipbetween calculated lipophilicity (clogP) and low-affinity off-targetpromiscuity80. The number of potential off-target activities appearsto double above the value clogP ¼ 3.75 (ref. 80). The goal ofpolypharmacology is not to lazily introduce nonspecific promiscuityinto a compound by increasing the lipophilicity but to identify acompound with a desired biological profile across multiple targetswhose combined modulation will perturb a disease state. Thus,understanding the broader polypharmacology profile of a compoundand rationally modifying its profiles should equally benefit safetypharmacology as well as disease efficacy.Specific design strategies are required to balance a set of biological
activities in one compound. Morphy et al. have described thecontinuum of design strategies medicinal chemists have traditionallyused to design drugs with multiple activities81. At one end of thespectrum are conjugated ligands, which contain separate pharmaco-poeia entities connected by a linker. Ligands designed by conjugatingtwo distinct pharmacophores are more likely to have high molecularweight and less likely to have oral drug-like physicochemical proper-ties82. At the other end of the spectrum are ligands where multiplepharmacophores overlap or are highly integrated. Compounds withoverlapping or integrated pharmacophores are likely to have lowermolecular weight and potentially more drug-like physicochemicalproperties. Ligands where polypharmacology has been deliberatelydesigned in, by conjugation or overlapping pharmacophores, tend tohave lower ligand efficiency than general preclinical compounds. Thisfinding is not surprising given that the compounds are not optimizedfor one single target.Designers of polypharmacology can also take lessons from the work
on drug resistance, particularly in the field of HIV-1 therapies.Mutations of single amino acid residues are often sufficient to conferdrug resistance to many anti-HIV drugs, such as the non-nucleosidereverse transcriptase inhibitors (NNRTIs). Efforts to discover second-generation NNRTIs required compounds to be active against both thewild type and the common drug-resistant mutations. Thus, second-generation NNRTIs can be considered as multitarget drugs as they arerequired to bind to several structurally distinct binding sites on aspectrum of mutated reverse transcriptases. Crystallographic analysesof the NNRTIs revealed that one design strategy is to identifyinhibitors that make strong molecular interactions with conservedregions of the binding site, such as structurally important residues andmain chain atoms; this has the added advantage of reducing depen-dence on interactions with mutable residues83. Several of these designstrategies have also been derived a priori by theoretical analysis ofdrug-resistant target ensembles53.In addition to the relationship between lipophilicity and promis-
cuity, a strong relationship has also been reported between molecularweight25,82 and molecular complexity84 and promiscuity. In an
Three strategies are available to the designers of multitarget therapies. The first
strategy, which is the most conventional, is to prescribe multiple individual
medications. Multidrug combination cocktails are the mainstay of highly active
antiretroviral therapy for HIV and a large number of anticancer protocols. The
drawback of prescribing multiple medications is patient compliance and the
danger of drug-drug interactions. To overcome these issues, a second strategy is
the development of multicomponent drugs that contain two or more active
ingredients formulated in the same delivery device, such as a single pill, capsule
or inhaler22,52. Several successful drug combinations have now been reformu-
lated in single multicomponent medicines, such as Atripla, Advair, Caduet,
Combivir, Epzicom, Rebetron and Truvada. Advances in formulation technolo-
gies are expanding the number of drug combinations that can be effectively
combined into a single delivery mechanism. However, given the significant
differences in pharmacokinetics, metabolisms and bioavailability, reformulation
of drug combinations is not a trivial problem. Further, two drugs that are
generally safe when dosed individually cannot be assumed to be safe in
combination. In addition to the possibility of adverse drug-drug interactions, if
the theory of network pharmacology indicates that an effect on phenotype may
derive from hitting multiple targets, then that combined phenotypic perturbation
may be efficacious or deleterious. The major challenge to both drug combination
strategies is the regulatory requirement for each individual drug to be shown to
be safe as an individual agent and in combination. Therefore, most multi-
component drug development has focused on exploiting combinations of
approved drugs, with the notable exception of the torcetrapib-atorvastatin
combination that was being developed by Pfizer. A drawback of this approach
to drug combinations is that the target universe of the current pharmacopeia is
very limited. Current estimates are that the entire formulary of approximately
1,200 FDA-approved drugs only acts on about 320 molecular targets115
(excluding the incredibly promiscuous kinase drug sunitinib (Sutent,
SU11248), which itself binds to 79 protein kinases with Kd o 10 mM)116.
The third strategy for multitarget therapy is to design a single compound with
selective polypharmacology25,27,81. The advent of wide-ligand profiling has
revealed the extent of polypharmacology across the pharmacopeia, and it has
also shown that many approved drugs act on multiple targets25,115. Dosing with a
single compound may have advantages over a drug combination in terms of
equitable pharmacokinetics and biodistribution. Indeed, troughs in drug expo-
sure due to incompatible pharmacokinetics between components of a combina-
tion therapy may create a low-dose window of opportunity where a reduced
selection pressure can lead to drug resistance. In terms of drug registration,
approval of a single compound acting on multiple targets faces significantly lower
regulatory barriers than approval of a combination of new drugs.
Box 1 Polypharmacology playbook
REV I EW
NATURE CHEMICAL BIOLOGY VOLUME 4 NUMBER 11 NOVEMBER 2008 685
act by targeting multiple proteins simultaneously rather than indivi-dual proteins46. For example, the antibacterial action ofb-lactams is dependent on the inhibition of at least two of themultiple penicillin-binding proteins (PBPs). Indeed, because multiplePBPs can be deleted with no effect on phenotype47, the strategy ofsingle target essentiality would not have discovered this importantclass of antibacterial drug targets. Similarly, fluoroquinolone antibio-tics are dual-targeted inhibitors of the proteins ParC and GyrA(ref. 48). D-Cycloserine inhibits four targets, both pairs of alanineracemases and D-Ala-D-Ala ligases. Likewise, fosfomycin overcomesthe redundancy of UDP N-acetylglucosamine enolpyruvyl transferasesby inhibiting them both. Therefore, if we wish to design single drugsthat limit drug resistance, we could consider the development ofmethods to search and prioritize which combinations of targets can beinhibited by the same drug and are essential, either individually (‘dualessentials’) or in combination (‘synthetic lethals’).A strategy of antibacterial polypharmacology can challenge the
current approach to genome-based drug discovery of anti-infectivesin four important ways. First, the druggability of a target isprioritized over single target essentiality. Second, the target doesnot need to be unique to the organism or absent in the host.Although many essential housekeeping enzymes may be commonbetween the host and infectious agent, drug selectivity between thehost and infectious agent can be determined at the binding sitelevel. Third, targets are sought that are lethal in combination butmay have been overlooked as non-essential in individual geneknockout studies, and fourth, groups of targets that are predicted topotentially bind the same compound are prioritized over singletondruggable targets. By targeting two or more essential genes with asingle chemical agent, the ability to delay drug resistance is designedinto the target discovery strategy from the start. Given the failure ofcurrent genome-based strategies for discovering new antibacterialdrugs45, learning the lessons of the previous successful generation ofantibacterial drugs may encourage the development of antibacterialpolypharmacology discovery strategies.
Topology of targetsThe two key challenges facing the development of network pharma-cology are identifying a node or combination of nodes in a biologicalnetwork whose perturbation results in a desired therapeutic out-come49,50, and discovering agents with the desired polypharmacologyprofile to perturb those nodes. Three complementary methods for thecomparative analysis of disease networks are systematic screening,knowledge-based combinations and network analysis. Presently, com-bination screening of mixtures of drugs, chemical tools and RNAi incell-based disease models is the most efficient means of systematicallydiscovering new drug-drug combinations and synthetically lethal genepairs. However, as with all preclinical models, active combinationsdiscovered in the laboratory do not necessarily translate into theclinic51. Moreover, idealized synergist screens between drugs or RNAiin preclinical assays do not account for the complications of dosing,scheduling pharmacokinetics and metabolism necessary to optimize atherapeutic drug cocktail in the clinic. Owing to the size of the searchmatrix, RNAi–chemical sensitization screens are usually performedwith a single drug against a whole-genome RNAi array34. Likewise,systematic combination screening of approximately 1,000 US Foodand Drug Administration (FDA)-approved drugs required the use ofhigh-throughput screening methods to assay the massive data matrixrequired for the factorial isobolgram analysis of each combinationthrough the full dose range52,53. Therefore, if we are to effectivelysearch for new drug combinations, there is a pressing need for
computational methods that could reduce the global search spacefor target combinations49,51.Owing to the vast number of possible drug and target combinations
and the ethical considerations and resource constraints on usingin vivo models and conducting clinical trials, most new combinationshave been selected for empirical testing based on a knowledge of theunderlying disease biology. Such knowledge-based approaches areoften incremental but can make a dramatic impact on disease out-comes, as demonstrated by the success of multidrug highly activeantiretroviral therapy in decreasing human immunodeficiency virus(HIV) mortality rates in the developed world. Advances in pathwayanalysis54 and text mining of the biomedical literature55–58 canpotentially be used to enable the large-scale text mining of diseaseknowledge to postulate new combination hypotheses by associativetechniques of inductive and abductive inference59,60. However, thoughadvances in informatics methods can aid the generation of newhypotheses from connecting concepts in the literature, the drawbackof the knowledge-based methods is that they do not provide a robustmodeling analysis of the emergent properties of a network and systemwhen perturbed in new ways. Thus, counterintuitive, paradoxical andunexpected system responses cannot necessarily be predicted by theseassociative methods39.An intriguing possibility for systematic target identification is that
the structures of biological networks themselves may provide valuableinformation in assessing targets and their combinations14,17,38,61. Earlynetwork analysis indicated the possibility of a direct correlationbetween lethality and the degree of connectivity of nodes, where highlyconnected hubs in protein interaction networks are more likely to beessential62. Subsequent re-analysis of the data challenged the relation-ship between the number of interactions of a protein and its essenti-ality63. However, the hypothesis that protein function relates tonetwork topology has been strengthened by recent work that hasrefined the relationship between network topology and system functionby focusing on ‘betweenness centrality’ (the number of nonredundantshortest paths traveling through a node64,65) and ‘bridging centrality’(nodes between and connecting subgraph clusters defined by the ratioof the number of interactions of a neighboring node in a subgraph overthe number of remaining edges in the subgraph66), in addition to themetric of the ‘degree centrality’ (the number of direct interactionsintersecting a node14). Bottlenecks with high betweenness values tendto be better correlated with gene expression dynamics and essentialitythan highly connected hubs64,67. These findings complement theanalysis on ‘party’ and ‘dates’ hubs, which suggests that hubs withhigh betweenness values have pleiotropic functions across the net-work68. Unexpectedly, non-hub bottlenecks with transient interac-tions65 and bridging proteins are less likely to be lethal than averageand tend to be independently regulated66. Thus, given their position incommunication between network clusters and their low lethality,bridging nodes have been suggested as potential drug targets, althoughmodulation of the bridging targets themselves may still be indirect66.An initial network analysis on the current drug targets of approveddrugs indicated that drug targets are commonly highly connected butnot essential69,70.Despite initial challenges, several compelling theoretical and experi-
mental studies support the hypothesis that network topology is anessential feature in the emergent system function of the protein whenit is perturbed; thus, this gives hope that systematic network analysesmay be a useful basis for developing methods to prioritize drug targetsand combinations of targets17,61,71–77. However, if we are to success-fully exploit network analysis for target identification, then we mustrecognize the fundamentally different dynamics and kinetics in the
REV I EW
684 VOLUME 4 NUMBER 11 NOVEMBER 2008 NATURE CHEMICAL BIOLOGY
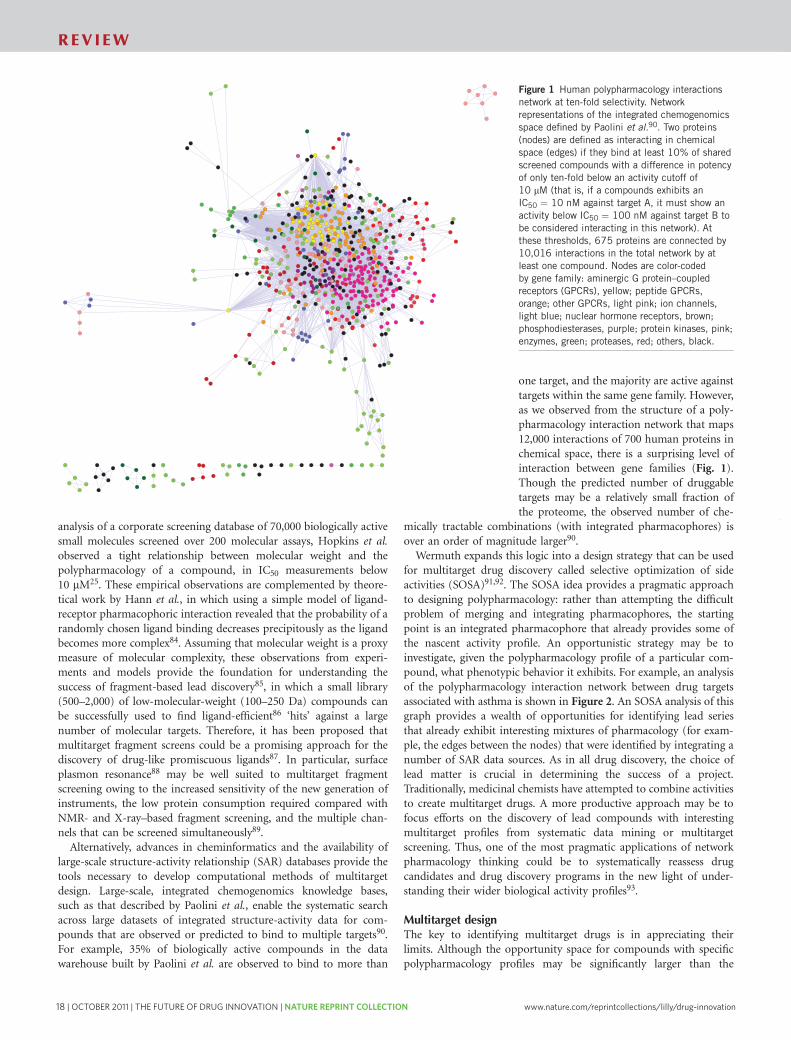
18 | OCTOBER 2011 | THE FUTURE OF DRUG INNOVATION | NATURE REPRINT COLLECTION www.nature.com/reprintcollections/lilly/drug-innovation
opportunity universe for single-target drugs (which is outlined by thedruggable genome8), not all target pair combinations will be accessibleto a single agent with drug-like properties. Predicting chemicallytractable combinations can increase the chances of finding a multi-target compound. In order to develop a drug with a desired poly-pharmacology profile, two problems need to be solved. First, a leadcompound needs to be identified with the desired biological activityagainst multiple targets; then, this lead needs to be optimized into aclinical candidate that combines the desired polypharmacology with asafe, drug-like pharmaceutical profile.The integration of in silico methods, combined with wide-ligand
biological profiling against protein assays and gene expression arrays,can provide drug designers with a new toolbox with which to assesspolypharmacology. First, proteins can be related by binding exact orsimilar endogenous ligands or proteins; this can be determined byexploiting data in gene ontologies and metabolic databases such asKEGG94,95. Second, proteins can be related by known observedpolypharmacology of large sets of ligands such as those found inpharmaceutical company screening sets and the medicinal chemistryliterature. A chemical network can be created that relates proteins thatbind the same ligand, where the strength of each edge can becalculated using metrics of promiscuity69,70,90,96–99.If experimentally derived ligand data are not available, proteins can
be related by predictions of polypharmacology90,100–104. Sets of ligandsfor each protein obtained from chemogenomic data sources can beused to train machine learning algorithms to predict pharmacologyactivity profiles. Bayesian approaches can be used to classify chemicalstructures based on chemical fingerprints90,100,101. Dynamicallycross-comparing the chemical similarity of sets of ligands for eachprotein is a complementary and promising method of predictingpolypharmacology profiles from chemical structure100,101. The struc-ture of the observed polypharmacology network itself alsoprovides information beyond chemical structure similarity thatcould also be utilized using Bayesian network methods, as has
been the case in protein-protein interaction networks105. Thoughpromising, chemical fingerprint–based similarity methods paradoxi-cally are incompatible with the two simplest relationships—thoseof lipophilicity and molecular weight with promiscuity—as largercompounds tend to exhibit a greater number of fingerprints. Thedevelopment of improved polypharmacology prediction methodswill be an important topic in cheminformatics and toxicology.Complementary to chemogenomics approaches to predict drug-target relationships is the use of phenotypic data (such as clinicalside effects)104,106 or gene expression profiles107 to cluster chemicalstructures by functional effects. Clustering compounds by phenotypicand gene signature profiles enables unknown mechanisms tobe inferred.Structural bioinformatics methods that map gene family sequence
alignments onto the structural information of protein binding sitesprovide a valuable first-order assessment of likely selectivity andpromiscuity within a gene family95,108–110. Comparing protein bindingsite similarity with the observed polypharmacology networks couldprovide insight into protein binding site parameters that map with thebehavior of chemical networks. For example, analysis of the proteinkinase superfamily in the human genome reveals discrete clusters ofsubfamilies when the full-length sequences are compared (Fig. 3).However, these subfamily clusters break down when the sequencesimilarity is measured at the level of the ATP binding site, where mostkinase inhibitors bind. Hence, at a first approximation the difficultiesdrug designers have in fine tuning the selectivity profiles of compe-titive kinase inhibitors is not surprising14,111,112. Despite the inherentchallenge of achieving finely tuned kinase activity profiles, derivingkinase SAR data112 from the wealth of large-scale chemogenomicsanalyses and using subtle modification of existing kinase scaffolds toexploit ‘de-hydrons’111 are two promising strategies. Finally, ifthree-dimensional protein structures of the targets of interest areavailable, then parallel large-scale multitarget virtual screening isalso a promising method113.
Figure 2 Expanding opportunity for drug
discovery space with polypharmacology. A subset
of the network data shown in Figure 1 for
literature targets associated with asthma. Drug
targets are represented as nodes, and chemical
matter that binds to two or more nodes is
represented as edges. Targets are colored by gene
family. The color of the edges represents the
strength of the chemical network between two
targets as defined by the number of shared
compounds that are active against both targets
below an affinity of 1 mM: light blue (1 to
10 compounds) to black (41,000 compounds).
Of the 44 targets described in the literature
as potential drug targets for the treatment ofasthma, 44 share polypharmacology of existing
chemical matter with another potential target.
These 44 targets are identified for 137 target
combinations across 410,000 compounds
in this portfolio. Thus, by considering both
single-target and dual pharmacology approaches,
at least 181 potential profile opportunities can
be examined. As this is an analysis of known
chemical matter and biological activities,
many of these profiles could be tested
immediately in appropriate disease models.
The network is represented in Cytoscape117.
Drug targets are color-coded by gene family: aminergic GPCRs, yellow; peptide GPCRs, orange; lipophilic GPCRs, light pink; ion channels, light blue; nuclear
hormone receptors, brown; phosphodiesterases, purple; protein kinases, pink; enzymes, green.
Pl3aPl3b
GR
IKKa
IKKb
SYK
P2X7ITK
EP4
EGRF
LTB4
A1
A2B
A2AM1
M3
M2NK1
NK2NK3
CCR3
CXCR2
5LO
β2
β1
β3
α1a
α2c1
α2aα2c
EP1 DP EP2
DP1
CRTH2
H4
H1
H3
PDE7A PDE4D
PDE7B
PDE4A
PDE4CPDE4B
REV I EW
NATURE CHEMICAL BIOLOGY VOLUME 4 NUMBER 11 NOVEMBER 2008 687
analysis of a corporate screening database of 70,000 biologically activesmall molecules screened over 200 molecular assays, Hopkins et al.observed a tight relationship between molecular weight and thepolypharmacology of a compound, in IC50 measurements below10 mM25. These empirical observations are complemented by theore-tical work by Hann et al., in which using a simple model of ligand-receptor pharmacophoric interaction revealed that the probability of arandomly chosen ligand binding decreases precipitously as the ligandbecomes more complex84. Assuming that molecular weight is a proxymeasure of molecular complexity, these observations from experi-ments and models provide the foundation for understanding thesuccess of fragment-based lead discovery85, in which a small library(500–2,000) of low-molecular-weight (100–250 Da) compounds canbe successfully used to find ligand-efficient86 ‘hits’ against a largenumber of molecular targets. Therefore, it has been proposed thatmultitarget fragment screens could be a promising approach for thediscovery of drug-like promiscuous ligands87. In particular, surfaceplasmon resonance88 may be well suited to multitarget fragmentscreening owing to the increased sensitivity of the new generation ofinstruments, the low protein consumption required compared withNMR- and X-ray–based fragment screening, and the multiple chan-nels that can be screened simultaneously89.Alternatively, advances in cheminformatics and the availability of
large-scale structure-activity relationship (SAR) databases provide thetools necessary to develop computational methods of multitargetdesign. Large-scale, integrated chemogenomics knowledge bases,such as that described by Paolini et al., enable the systematic searchacross large datasets of integrated structure-activity data for com-pounds that are observed or predicted to bind to multiple targets90.For example, 35% of biologically active compounds in the datawarehouse built by Paolini et al. are observed to bind to more than
one target, and the majority are active againsttargets within the same gene family. However,as we observed from the structure of a poly-pharmacology interaction network that maps12,000 interactions of 700 human proteins inchemical space, there is a surprising level ofinteraction between gene families (Fig. 1).Though the predicted number of druggabletargets may be a relatively small fraction ofthe proteome, the observed number of che-
mically tractable combinations (with integrated pharmacophores) isover an order of magnitude larger90.Wermuth expands this logic into a design strategy that can be used
for multitarget drug discovery called selective optimization of sideactivities (SOSA)91,92. The SOSA idea provides a pragmatic approachto designing polypharmacology: rather than attempting the difficultproblem of merging and integrating pharmacophores, the startingpoint is an integrated pharmacophore that already provides some ofthe nascent activity profile. An opportunistic strategy may be toinvestigate, given the polypharmacology profile of a particular com-pound, what phenotypic behavior it exhibits. For example, an analysisof the polypharmacology interaction network between drug targetsassociated with asthma is shown in Figure 2. An SOSA analysis of thisgraph provides a wealth of opportunities for identifying lead seriesthat already exhibit interesting mixtures of pharmacology (for exam-ple, the edges between the nodes) that were identified by integrating anumber of SAR data sources. As in all drug discovery, the choice oflead matter is crucial in determining the success of a project.Traditionally, medicinal chemists have attempted to combine activitiesto create multitarget drugs. A more productive approach may be tofocus efforts on the discovery of lead compounds with interestingmultitarget profiles from systematic data mining or multitargetscreening. Thus, one of the most pragmatic applications of networkpharmacology thinking could be to systematically reassess drugcandidates and drug discovery programs in the new light of under-standing their wider biological activity profiles93.
Multitarget designThe key to identifying multitarget drugs is in appreciating theirlimits. Although the opportunity space for compounds with specificpolypharmacology profiles may be significantly larger than the
Figure 1 Human polypharmacology interactions
network at ten-fold selectivity. Network
representations of the integrated chemogenomics
space defined by Paolini et al.90. Two proteins
(nodes) are defined as interacting in chemical
space (edges) if they bind at least 10% of shared
screened compounds with a difference in potency
of only ten-fold below an activity cutoff of
10 mM (that is, if a compounds exhibits an
IC50 ¼ 10 nM against target A, it must show an
activity below IC50 ¼ 100 nM against target B to
be considered interacting in this network). At
these thresholds, 675 proteins are connected by
10,016 interactions in the total network by at
least one compound. Nodes are color-codedby gene family: aminergic G protein–coupled
receptors (GPCRs), yellow; peptide GPCRs,
orange; other GPCRs, light pink; ion channels,
light blue; nuclear hormone receptors, brown;
phosphodiesterases, purple; protein kinases, pink;
enzymes, green; proteases, red; others, black.
REV I EW
686 VOLUME 4 NUMBER 11 NOVEMBER 2008 NATURE CHEMICAL BIOLOGY
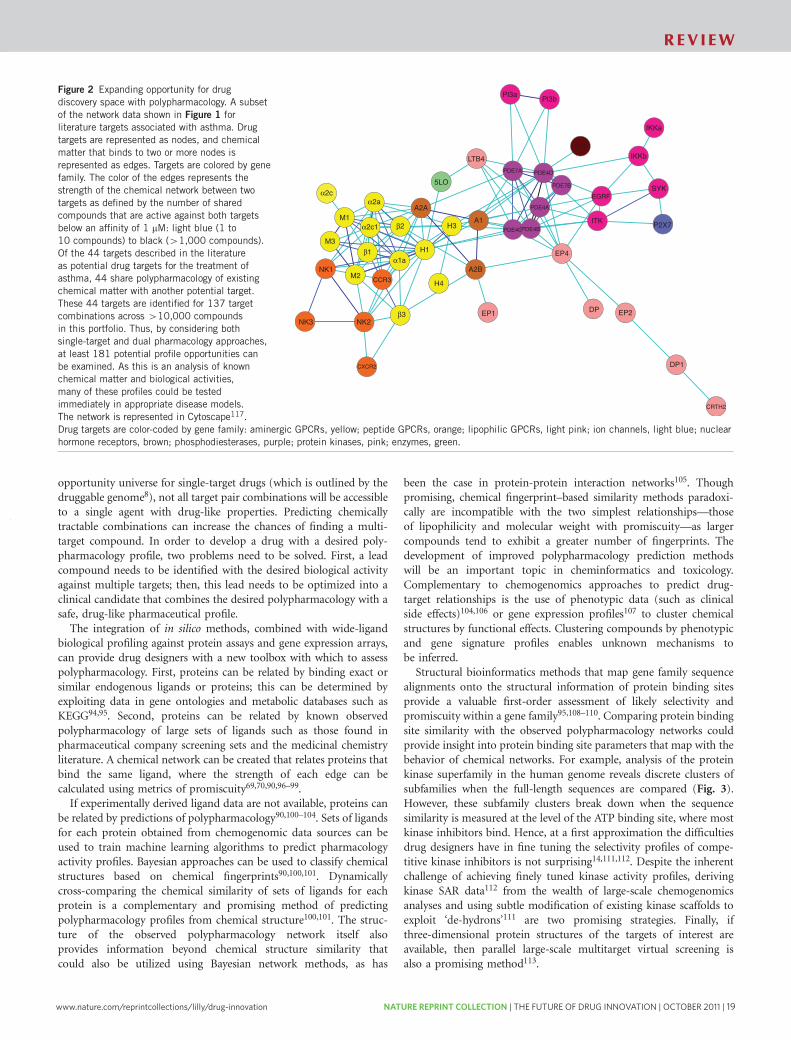
www.nature.com/reprintcollections/lilly/drug-innovation NATURE REPRINT COLLECTION | THE FUTURE OF DRUG INNOVATION | OCTOBER 2011 | 19
opportunity universe for single-target drugs (which is outlined by thedruggable genome8), not all target pair combinations will be accessibleto a single agent with drug-like properties. Predicting chemicallytractable combinations can increase the chances of finding a multi-target compound. In order to develop a drug with a desired poly-pharmacology profile, two problems need to be solved. First, a leadcompound needs to be identified with the desired biological activityagainst multiple targets; then, this lead needs to be optimized into aclinical candidate that combines the desired polypharmacology with asafe, drug-like pharmaceutical profile.The integration of in silico methods, combined with wide-ligand
biological profiling against protein assays and gene expression arrays,can provide drug designers with a new toolbox with which to assesspolypharmacology. First, proteins can be related by binding exact orsimilar endogenous ligands or proteins; this can be determined byexploiting data in gene ontologies and metabolic databases such asKEGG94,95. Second, proteins can be related by known observedpolypharmacology of large sets of ligands such as those found inpharmaceutical company screening sets and the medicinal chemistryliterature. A chemical network can be created that relates proteins thatbind the same ligand, where the strength of each edge can becalculated using metrics of promiscuity69,70,90,96–99.If experimentally derived ligand data are not available, proteins can
be related by predictions of polypharmacology90,100–104. Sets of ligandsfor each protein obtained from chemogenomic data sources can beused to train machine learning algorithms to predict pharmacologyactivity profiles. Bayesian approaches can be used to classify chemicalstructures based on chemical fingerprints90,100,101. Dynamicallycross-comparing the chemical similarity of sets of ligands for eachprotein is a complementary and promising method of predictingpolypharmacology profiles from chemical structure100,101. The struc-ture of the observed polypharmacology network itself alsoprovides information beyond chemical structure similarity thatcould also be utilized using Bayesian network methods, as has
been the case in protein-protein interaction networks105. Thoughpromising, chemical fingerprint–based similarity methods paradoxi-cally are incompatible with the two simplest relationships—thoseof lipophilicity and molecular weight with promiscuity—as largercompounds tend to exhibit a greater number of fingerprints. Thedevelopment of improved polypharmacology prediction methodswill be an important topic in cheminformatics and toxicology.Complementary to chemogenomics approaches to predict drug-target relationships is the use of phenotypic data (such as clinicalside effects)104,106 or gene expression profiles107 to cluster chemicalstructures by functional effects. Clustering compounds by phenotypicand gene signature profiles enables unknown mechanisms tobe inferred.Structural bioinformatics methods that map gene family sequence
alignments onto the structural information of protein binding sitesprovide a valuable first-order assessment of likely selectivity andpromiscuity within a gene family95,108–110. Comparing protein bindingsite similarity with the observed polypharmacology networks couldprovide insight into protein binding site parameters that map with thebehavior of chemical networks. For example, analysis of the proteinkinase superfamily in the human genome reveals discrete clusters ofsubfamilies when the full-length sequences are compared (Fig. 3).However, these subfamily clusters break down when the sequencesimilarity is measured at the level of the ATP binding site, where mostkinase inhibitors bind. Hence, at a first approximation the difficultiesdrug designers have in fine tuning the selectivity profiles of compe-titive kinase inhibitors is not surprising14,111,112. Despite the inherentchallenge of achieving finely tuned kinase activity profiles, derivingkinase SAR data112 from the wealth of large-scale chemogenomicsanalyses and using subtle modification of existing kinase scaffolds toexploit ‘de-hydrons’111 are two promising strategies. Finally, ifthree-dimensional protein structures of the targets of interest areavailable, then parallel large-scale multitarget virtual screening isalso a promising method113.
Figure 2 Expanding opportunity for drug
discovery space with polypharmacology. A subset
of the network data shown in Figure 1 for
literature targets associated with asthma. Drug
targets are represented as nodes, and chemical
matter that binds to two or more nodes is
represented as edges. Targets are colored by gene
family. The color of the edges represents the
strength of the chemical network between two
targets as defined by the number of shared
compounds that are active against both targets
below an affinity of 1 mM: light blue (1 to
10 compounds) to black (41,000 compounds).
Of the 44 targets described in the literature
as potential drug targets for the treatment ofasthma, 44 share polypharmacology of existing
chemical matter with another potential target.
These 44 targets are identified for 137 target
combinations across 410,000 compounds
in this portfolio. Thus, by considering both
single-target and dual pharmacology approaches,
at least 181 potential profile opportunities can
be examined. As this is an analysis of known
chemical matter and biological activities,
many of these profiles could be tested
immediately in appropriate disease models.
The network is represented in Cytoscape117.
Drug targets are color-coded by gene family: aminergic GPCRs, yellow; peptide GPCRs, orange; lipophilic GPCRs, light pink; ion channels, light blue; nuclear
hormone receptors, brown; phosphodiesterases, purple; protein kinases, pink; enzymes, green.
Pl3aPl3b
GR
IKKa
IKKb
SYK
P2X7ITK
EP4
EGRF
LTB4
A1
A2B
A2AM1
M3
M2NK1
NK2NK3
CCR3
CXCR2
5LO
β2
β1
β3
α1a
α2c1
α2aα2c
EP1 DP EP2
DP1
CRTH2
H4
H1
H3
PDE7A PDE4D
PDE7B
PDE4A
PDE4CPDE4B
REV I EW
NATURE CHEMICAL BIOLOGY VOLUME 4 NUMBER 11 NOVEMBER 2008 687
analysis of a corporate screening database of 70,000 biologically activesmall molecules screened over 200 molecular assays, Hopkins et al.observed a tight relationship between molecular weight and thepolypharmacology of a compound, in IC50 measurements below10 mM25. These empirical observations are complemented by theore-tical work by Hann et al., in which using a simple model of ligand-receptor pharmacophoric interaction revealed that the probability of arandomly chosen ligand binding decreases precipitously as the ligandbecomes more complex84. Assuming that molecular weight is a proxymeasure of molecular complexity, these observations from experi-ments and models provide the foundation for understanding thesuccess of fragment-based lead discovery85, in which a small library(500–2,000) of low-molecular-weight (100–250 Da) compounds canbe successfully used to find ligand-efficient86 ‘hits’ against a largenumber of molecular targets. Therefore, it has been proposed thatmultitarget fragment screens could be a promising approach for thediscovery of drug-like promiscuous ligands87. In particular, surfaceplasmon resonance88 may be well suited to multitarget fragmentscreening owing to the increased sensitivity of the new generation ofinstruments, the low protein consumption required compared withNMR- and X-ray–based fragment screening, and the multiple chan-nels that can be screened simultaneously89.Alternatively, advances in cheminformatics and the availability of
large-scale structure-activity relationship (SAR) databases provide thetools necessary to develop computational methods of multitargetdesign. Large-scale, integrated chemogenomics knowledge bases,such as that described by Paolini et al., enable the systematic searchacross large datasets of integrated structure-activity data for com-pounds that are observed or predicted to bind to multiple targets90.For example, 35% of biologically active compounds in the datawarehouse built by Paolini et al. are observed to bind to more than
one target, and the majority are active againsttargets within the same gene family. However,as we observed from the structure of a poly-pharmacology interaction network that maps12,000 interactions of 700 human proteins inchemical space, there is a surprising level ofinteraction between gene families (Fig. 1).Though the predicted number of druggabletargets may be a relatively small fraction ofthe proteome, the observed number of che-
mically tractable combinations (with integrated pharmacophores) isover an order of magnitude larger90.Wermuth expands this logic into a design strategy that can be used
for multitarget drug discovery called selective optimization of sideactivities (SOSA)91,92. The SOSA idea provides a pragmatic approachto designing polypharmacology: rather than attempting the difficultproblem of merging and integrating pharmacophores, the startingpoint is an integrated pharmacophore that already provides some ofthe nascent activity profile. An opportunistic strategy may be toinvestigate, given the polypharmacology profile of a particular com-pound, what phenotypic behavior it exhibits. For example, an analysisof the polypharmacology interaction network between drug targetsassociated with asthma is shown in Figure 2. An SOSA analysis of thisgraph provides a wealth of opportunities for identifying lead seriesthat already exhibit interesting mixtures of pharmacology (for exam-ple, the edges between the nodes) that were identified by integrating anumber of SAR data sources. As in all drug discovery, the choice oflead matter is crucial in determining the success of a project.Traditionally, medicinal chemists have attempted to combine activitiesto create multitarget drugs. A more productive approach may be tofocus efforts on the discovery of lead compounds with interestingmultitarget profiles from systematic data mining or multitargetscreening. Thus, one of the most pragmatic applications of networkpharmacology thinking could be to systematically reassess drugcandidates and drug discovery programs in the new light of under-standing their wider biological activity profiles93.
Multitarget designThe key to identifying multitarget drugs is in appreciating theirlimits. Although the opportunity space for compounds with specificpolypharmacology profiles may be significantly larger than the
Figure 1 Human polypharmacology interactions
network at ten-fold selectivity. Network
representations of the integrated chemogenomics
space defined by Paolini et al.90. Two proteins
(nodes) are defined as interacting in chemical
space (edges) if they bind at least 10% of shared
screened compounds with a difference in potency
of only ten-fold below an activity cutoff of
10 mM (that is, if a compounds exhibits an
IC50 ¼ 10 nM against target A, it must show an
activity below IC50 ¼ 100 nM against target B to
be considered interacting in this network). At
these thresholds, 675 proteins are connected by
10,016 interactions in the total network by at
least one compound. Nodes are color-codedby gene family: aminergic G protein–coupled
receptors (GPCRs), yellow; peptide GPCRs,
orange; other GPCRs, light pink; ion channels,
light blue; nuclear hormone receptors, brown;
phosphodiesterases, purple; protein kinases, pink;
enzymes, green; proteases, red; others, black.
REV I EW
686 VOLUME 4 NUMBER 11 NOVEMBER 2008 NATURE CHEMICAL BIOLOGY
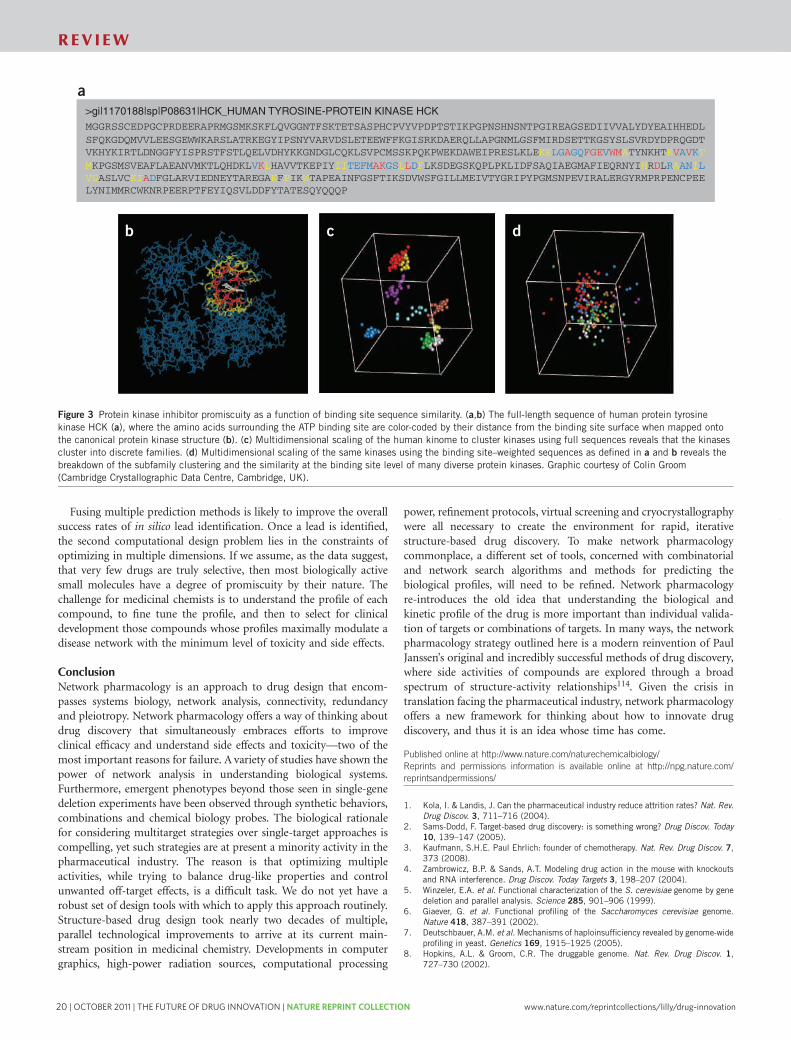
20 | OCTOBER 2011 | THE FUTURE OF DRUG INNOVATION | NATURE REPRINT COLLECTION www.nature.com/reprintcollections/lilly/drug-innovation
9. Austin, C.P. et al. The knockout mouse project. Nat. Genet. 36, 921–924 (2004).10. Zambrowicz, B.P., Turner, C.A. & Sands, A.T. Predicting drug efficacy: knockouts
model pipeline drugs of the pharmaceutical industry. Curr. Opin. Pharmacol. 3,563–570 (2003).
11. Zambrowicz, B.P. & Sands, A.T. Knockouts model the 100 best-selling drugs–willthey model the next 100? Nat. Rev. Drug Discov. 2, 38–51 (2003).
12. Kitano, H. Towards a theory of biological robustness. Mol. Syst. Biol. 3, 137 (2007).13. Barabasi, A.L. & Oltvai, Z.N. Network biology: understanding the cell’s functional
organization. Nat. Rev. Genet. 5, 101–113 (2004).14. Albert, R., Jeong, H. & Barabasi, A.L. Error and attack tolerance of complex networks.
Nature 406, 378–382 (2000).15. Chen, Y. et al. Variations in DNA elucidate molecular networks that cause disease.
Nature 452, 429–435 (2008).16. Csermely, P., Agoston, V. & Pongor, S. The efficiency of multi-target drugs: the
network approach might help drug design. Trends Pharmacol. Sci. 26, 178–182(2005).
17. Korcsmaros, T., Szalay, M.S., Bode, C., Kovacs, I. & Csermely, P. How to design multi-target drugs: target search options in cellular networks. Expert Opin. Drug Discov. 2,1–10 (2007).
18. Ooi, S.L. et al. Global synthetic-lethality analysis and yeast functional profiling.Trends Genet. 22, 56–63 (2006).
19. Hillenmeyer, M.E. et al. The chemical genomic portrait of yeast: uncovering aphenotype for all genes. Science 320, 362–365 (2008).
20. Roth, B.L., Sheffler, D.J. & Kroeze, W.K. Magic shotguns versus magic bullets:selectively non-selective drugs for mood disorders and schizophrenia. Nat. Rev. DrugDiscov. 3, 353–359 (2004).
21. Wermuth, C.G. Multitarget drugs: the end of the ’one-target-one-disease’ philosophy?Drug Discov. Today 9, 826–827 (2004).
22. Keith, C.T., Borisy, A.A. & Stockwel, B.R. Multicomponent therapeutics for networkedsystems. Nat. Rev. Drug Discov. 4, 71–78 (2005).
23. Petrelli, A. & Giordano, S. From single- to multi-target drugs in cancer therapy: whenaspecificity becomes an advantage. Curr. Med. Chem. 15, 422–432 (2008).
24. Mencher, S.K. & Wang, L.G. Promiscuous drugs compared to selective drugs(promiscuity can be a virtue). BMC Clin. Pharmacol. 5, 3 (2005).
25. Hopkins, A.L., Mason, J.S. & Overington, J.P. Can we rationally design promiscuousdrugs? Curr. Opin. Struct. Biol. 16, 127–136 (2006).
26. Flordellis, C.S., Manolis, A.S., Paris, H. & Karabinis, A. Rethinking target discovery inpolygenic diseases. Curr. Top. Med. Chem. 6, 1791–1798 (2006).
27. Dessalew, N. & Workalemahu, M. On the paradigm shift towards multitarget selectivedrug design. Curr. Comput. Aided Drug Des. 4, 76–90 (2008).
28. Keskin, O., Gursoy, A., Ma, B. & Nussinov, R. Towards drugs targeting multipleproteins in a systems biology approach. Curr. Top. Med. Chem. 7, 943–951(2007).
29. Zimmermann, G.R., Lehar, J. & Keith, C.T. Multi-target therapeutics: when the wholeis greater than the sum of the parts. Drug Discov. Today 12, 34–42 (2007).
30. McGovern, S.L., Caselli, E., Grigorieff, N. & Shoichet, B.K. A common mechanismunderlying promiscuous inhibitors from virtual and high-throughput screening.J. Med. Chem. 45, 1712–1722 (2002).
31. Kerkela, R. et al. Cardiotoxicity of the cancer therapeutic agent imatinib mesylate.Nat. Med. 12, 908–916 (2006).
32. Kaelin, W.G., Jr. The concept of synthetic lethality in the context of anticancertherapy. Nat. Rev. Cancer 5, 689–698 (2005).
33. Gascoigne, K.E. & Taylor, S.S. Cancer cells display profound intra- and interlinevariation following prolonged exposure to antimitotic drugs. Cancer Cell 14, 111–122(2008).
34. Whitehurst, A.W. et al. Synthetic lethal screen identification of chemosensitizer loci incancer cells. Nature 446, 815–819 (2007).
35. Turner, N.C. et al. A synthetic lethal siRNA screen identifying genes mediatingsensitivity to a PARP inhibitor. EMBO J. 27, 1368–1377 (2008).
36. Gupta, G.P. et al. Mediators of vascular remodelling co-opted for sequential steps inlung metastasis. Nature 446, 765–770 (2007).
37. Eltarhouny, S.A. et al. Genes controlling spread of breast cancer to lung ‘‘gang of 4’’.Exp. Oncol. 30, 91–95 (2008).
38. Kitano, H. A robustness-based approach to systems-oriented drug design. Nat. Rev.Drug Discov. 6, 202–210 (2007).
39. Bond, R.A. Can intellectualism stifle scientific discovery? Nat. Rev. Drug Discov. 1,825–829 (2002).
40. Dudekula, N., Arora, V., Callaerts-Vegh, Z. & Bond, R.A. The temporal hormesis ofdrug therapies. Dose Response 3, 414–424 (2006).
41. Schwartz, G.K. & Shah, M.A. Targeting the cell cycle: a new approach to cancertherapy. J. Clin. Oncol. 23, 9408–9421 (2005).
42. Mills, S.D. When will the genomics investment pay off for antibacterial discovery?Biochem. Pharmacol. 71, 1096–1102 (2006).
43. Pucci, M.J. Use of genomics to select antibacterial targets. Biochem. Pharmacol. 71,1066–1072 (2006).
44. Payne, D.J., Gwynn, M.N., Holmes, D.J. & Rosenberg, M. Genomic approaches toantibacterial discovery. Methods Mol. Biol. 266, 231–259 (2004).
45. Payne, D.J., Gwynn, M.N., Holmes, D.J. & Pompliano, D.L. Drugs for bad bugs:confronting the challenges of antibacterial discovery. Nat. Rev. Drug Discov. 6, 29–40(2007).
46. Lange, R.P., Locher, H.H., Wyss, P.C. & Then, R.L. The targets of currently usedantibacterial agents: lessons for drug discovery. Curr. Pharm. Des. 13, 3140–3154(2007).
47. Denome, S.A., Elf, P.K., Henderson, T.A., Nelson, D.E. & Young, K.D. Escherichia colimutants lacking all possible combinations of eight penicillin binding proteins:viability, characteristics, and implications for peptidoglycan synthesis. J. Bacteriol.181, 3981–3993 (1999).
48. Janoir, C., Zeller, V., Kitzis, M.D., Moreau, N.J. & Gutmann, L. High-level fluoroqui-nolone resistance in Streptococcus pneumoniae requires mutations in parC and gyrA.Antimicrob. Agents Chemother. 40, 2760–2764 (1996).
49. Ramaswamy, S. Rational design of cancer-drug combinations. N. Engl. J. Med. 357,299–300 (2007).
50. Mayer, L.D. & Janoff, A.S. Optimizing combination chemotherapy by controlling drugratios. Mol. Interv. 7, 216–223 (2007).
51. Dancey, J.E. & Chen, H.X. Strategies for optimizing combinations of molecularlytargeted anticancer agents. Nat. Rev. Drug Discov. 5, 649–659 (2006).
52. Borisy, A.A. et al. Systematic discovery of multicomponent therapeutics. Proc. Natl.Acad. Sci. USA 100, 7977–7982 (2003).
53. Radhakrishnan, M.L. & Tidor, B. Optimal drug cocktail design: methods for targetingmolecular ensembles and insights from theoretical model systems. J. Chem. Inf.Model. 48, 1055–1073 (2008).
54. Tsui, I.F., Chari, R., Buys, T.P. & Lam, W.L. Public databases and software for thepathway analysis of cancer genomes. Cancer Inform. 3, 389–407 (2007).
55. Swanson, D.R. Medical literature as a potential source of new knowledge. Bull. Med.Libr. Assoc. 78, 29–37 (1990).
56. Wren, J.D., Bekeredjian, R., Stewart, J.A., Shohet, R.V. & Garner, H.R. Knowledgediscovery by automated identification and ranking of implicit relationships. Bioinfor-matics 20, 389–398 (2004).
57. Bekhuis, T. Conceptual biology, hypothesis discovery, and text mining: Swanson’slegacy. Biomed. Digit. Libr. 3, 2 (2006).
58. Loging, W., Harland, L. & Williams-Jones, B. High-throughput electronic biology:mining information for drug discovery. Nat. Rev. Drug Discov. 6, 220–230 (2007).
59. Peirce, C.S. The Essential Peirce Vol. 2 (Indiana University Press, Bloomington,Indiana, USA, 1998).
60. Kell, D.B. & Oliver, S.G. Here is the evidence, now what is the hypothesis? Thecomplementary roles of inductive and hypothesis-driven science in the post-genomicera. Bioessays 26, 99–105 (2004).
61. Latora, V. & Marchiori, M. Vulnerability and protection of infrastructure networks.Phys. Rev. E 71, 015103R (2005).
62. Jeong, H., Mason, S.P., Barabasi, A.L. & Oltvai, Z.N. Lethality and centrality inprotein networks. Nature 411, 41–42 (2001).
63. Coulomb, S., Bauer, M., Bernard, D. & Marsolier-Kergoat, M.C. Gene essentiality andthe topology of protein interaction networks. Proc. Biol. Sci. 272, 1721–1725(2005).
64. Joy, M.P., Brock, A., Ingber, D.E. & Huang, S. High-betweenness proteins in the yeastprotein interaction network. J. Biomed. Biotechnol. 2, 96–103 (2005).
65. Yu, H., Kim, P.M., Sprecher, E., Trifonov, V. & Gerstein, M. The importance ofbottlenecks in protein networks: correlation with gene essentiality and expressiondynamics. PLoS Comput. Biol. 3, e59 (2007).
66. Hwang, W.C., Zhang, A. & Ramanathan, M. Identification of information flow-modulating drug targets: a novel bridging paradigm for drug discovery. Clin. Pharma-col. Ther. published online, doi:10.1038/clpt.2008.129 (9 July 2008).
67. Hahn, M.W. & Kern, A.D. Comparative genomics of centrality and essentiality inthree eukaryotic protein-interaction networks. Mol. Biol. Evol. 22, 803–806(2005).
68. Han, J.D. et al. Evidence for dynamically organized modularity in the yeast protein-protein interaction network. Nature 430, 88–93 (2004).
69. Yildirim, M.A., Goh, K.I., Cusick, M.E., Barabasi, A.L. & Vidal, M. Drug-targetnetwork. Nat. Biotechnol. 25, 1119–1126 (2007).
70. Nacher, J.C. & Schwartz, J.M. A global view of drug-therapy interactions. BMCPharmacol. 8, 5 (2008).
71. Motter, A.E., Nishikawa, T. & Lai, Y. Range-based attack on links in scale-freenetworks: are long-range links responsible for the small-world phenomenon? Phys.Rev. E 66, 065103 (2002).
72. Moriya, H., Shimizu-Yoshida, Y. & Kitano, H. In vivo robustness analysis ofcell division cycle genes in Saccharomyces cerevisiae. PLoS Genet. 2, e111(2006).
73. Wunderlich, Z. & Mirny, L.A. Using the topology of metabolic networks to predictviability of mutant strains. Biophys. J. 91, 2304–2311 (2006).
74. Kovacs, I., Csermely, P., Korcsmaros, T. & Szalay, M. WO patent application WO2007-IB50471 2007 0213 (2007).
75. Watterson, S., Marshall, S. & Ghazal, P. Logic models of pathway biology. Drug Discov.Today 13, 447–456 (2008).
76. Gerber, S., Assmus, H., Bakker, B. & Klipp, E. Drug-efficacy depends on the inhibitortype and the target position in a metabolic network—a systematic study. J. Theor.Biol. 252, 442–455 (2008).
77. Potapov, A.P., Goemann, B. & Wingender, E. The pairwise disconnectivity index as anew metric for the topological analysis of regulatory networks. BMC Bioinformatics 9,227 (2008).
78. Agoston, V., Csermely, P. & Pongor, S. Multiple weak hits confuse complex systems: atranscriptional regulatory network as an example. Phys. Rev. E 71, 051909(2005).
79. Motter, A.E., Gulbahce, N., Almaas, E. & Barabasi, A.L. Predicting synthetic rescuesin metabolic networks. Mol. Syst. Biol. 4, 168 (2008).
80. Leeson, P.D. & Springthorpe, B. The influence of drug-like concepts on decision-making in medicinal chemistry. Nat. Rev. Drug Discov. 6, 881–890 (2007).
REV I EW
NATURE CHEMICAL BIOLOGY VOLUME 4 NUMBER 11 NOVEMBER 2008 689
Fusing multiple prediction methods is likely to improve the overallsuccess rates of in silico lead identification. Once a lead is identified,the second computational design problem lies in the constraints ofoptimizing in multiple dimensions. If we assume, as the data suggest,that very few drugs are truly selective, then most biologically activesmall molecules have a degree of promiscuity by their nature. Thechallenge for medicinal chemists is to understand the profile of eachcompound, to fine tune the profile, and then to select for clinicaldevelopment those compounds whose profiles maximally modulate adisease network with the minimum level of toxicity and side effects.
ConclusionNetwork pharmacology is an approach to drug design that encom-passes systems biology, network analysis, connectivity, redundancyand pleiotropy. Network pharmacology offers a way of thinking aboutdrug discovery that simultaneously embraces efforts to improveclinical efficacy and understand side effects and toxicity—two of themost important reasons for failure. A variety of studies have shown thepower of network analysis in understanding biological systems.Furthermore, emergent phenotypes beyond those seen in single-genedeletion experiments have been observed through synthetic behaviors,combinations and chemical biology probes. The biological rationalefor considering multitarget strategies over single-target approaches iscompelling, yet such strategies are at present a minority activity in thepharmaceutical industry. The reason is that optimizing multipleactivities, while trying to balance drug-like properties and controlunwanted off-target effects, is a difficult task. We do not yet have arobust set of design tools with which to apply this approach routinely.Structure-based drug design took nearly two decades of multiple,parallel technological improvements to arrive at its current main-stream position in medicinal chemistry. Developments in computergraphics, high-power radiation sources, computational processing
power, refinement protocols, virtual screening and cryocrystallographywere all necessary to create the environment for rapid, iterativestructure-based drug discovery. To make network pharmacologycommonplace, a different set of tools, concerned with combinatorialand network search algorithms and methods for predicting thebiological profiles, will need to be refined. Network pharmacologyre-introduces the old idea that understanding the biological andkinetic profile of the drug is more important than individual valida-tion of targets or combinations of targets. In many ways, the networkpharmacology strategy outlined here is a modern reinvention of PaulJanssen’s original and incredibly successful methods of drug discovery,where side activities of compounds are explored through a broadspectrum of structure-activity relationships114. Given the crisis intranslation facing the pharmaceutical industry, network pharmacologyoffers a new framework for thinking about how to innovate drugdiscovery, and thus it is an idea whose time has come.
Published online at http://www.nature.com/naturechemicalbiology/
Reprints and permissions information is available online at http://npg.nature.com/
reprintsandpermissions/
1. Kola, I. & Landis, J. Can the pharmaceutical industry reduce attrition rates? Nat. Rev.Drug Discov. 3, 711–716 (2004).
2. Sams-Dodd, F. Target-based drug discovery: is something wrong? Drug Discov. Today10, 139–147 (2005).
3. Kaufmann, S.H.E. Paul Ehrlich: founder of chemotherapy. Nat. Rev. Drug Discov. 7,373 (2008).
4. Zambrowicz, B.P. & Sands, A.T. Modeling drug action in the mouse with knockoutsand RNA interference. Drug Discov. Today Targets 3, 198–207 (2004).
5. Winzeler, E.A. et al. Functional characterization of the S. cerevisiae genome by genedeletion and parallel analysis. Science 285, 901–906 (1999).
6. Giaever, G. et al. Functional profiling of the Saccharomyces cerevisiae genome.Nature 418, 387–391 (2002).
7. Deutschbauer, A.M. et al.Mechanisms of haploinsufficiency revealed by genome-wideprofiling in yeast. Genetics 169, 1915–1925 (2005).
8. Hopkins, A.L. & Groom, C.R. The druggable genome. Nat. Rev. Drug Discov. 1,727–730 (2002).
>gi|1170188|sp|P08631|HCK_HUMAN TYROSINE-PROTEIN KINASE HCK MGGRSSCEDPGCPRDEERAPRMGSMKSKFLQVGGNTFSKTETSASPHCPVYVPDPTSTIKPGPNSHNSNTPGIREAGSEDIIVVALYDYEAIHHEDL SFQKGDQMVVLEESGEWWKARSLATRKEGYIPSNYVARVDSLETEEWFFKGISRKDAERQLLAPGNMLGSFMIRDSETTKGSYSLSVRDYDPRQGDT VKHYKIRTLDNGGFYISPRSTFSTLQELVDHYKKGNDGLCQKLSVPCMSSKPQKPWEKDAWEIPRESLKLEKKLGAGQFGEVWMATYNKHTKVAVKT MKPGSMSVEAFLAEANVMKTLQHDKLVKLHAVVTKEPIYIITEFMAKGSLLDFLKSDEGSKQPLPKLIDFSAQIAEGMAFIEQRNYIHRDLRAANIL VSASLVCKIADFGLARVIEDNEYTAREGAKFPIKWTAPEAINFGSFTIKSDVWSFGILLMEIVTYGRIPYPGMSNPEVIRALERGYRMPRPENCPEE LYNIMMRCWKNRPEERPTFEYIQSVLDDFYTATESQYQQQP
a
b c d
Figure 3 Protein kinase inhibitor promiscuity as a function of binding site sequence similarity. (a,b) The full-length sequence of human protein tyrosine
kinase HCK (a), where the amino acids surrounding the ATP binding site are color-coded by their distance from the binding site surface when mapped onto
the canonical protein kinase structure (b). (c) Multidimensional scaling of the human kinome to cluster kinases using full sequences reveals that the kinases
cluster into discrete families. (d) Multidimensional scaling of the same kinases using the binding site–weighted sequences as defined in a and b reveals the
breakdown of the subfamily clustering and the similarity at the binding site level of many diverse protein kinases. Graphic courtesy of Colin Groom
(Cambridge Crystallographic Data Centre, Cambridge, UK).
REV I EW
688 VOLUME 4 NUMBER 11 NOVEMBER 2008 NATURE CHEMICAL BIOLOGY
www.nature.com/reprintcollections/lilly/drug-innovation NATURE REPRINT COLLECTION | THE FUTURE OF DRUG INNOVATION | OCTOBER 2011 | 21
9. Austin, C.P. et al. The knockout mouse project. Nat. Genet. 36, 921–924 (2004).10. Zambrowicz, B.P., Turner, C.A. & Sands, A.T. Predicting drug efficacy: knockouts
model pipeline drugs of the pharmaceutical industry. Curr. Opin. Pharmacol. 3,563–570 (2003).
11. Zambrowicz, B.P. & Sands, A.T. Knockouts model the 100 best-selling drugs–willthey model the next 100? Nat. Rev. Drug Discov. 2, 38–51 (2003).
12. Kitano, H. Towards a theory of biological robustness. Mol. Syst. Biol. 3, 137 (2007).13. Barabasi, A.L. & Oltvai, Z.N. Network biology: understanding the cell’s functional
organization. Nat. Rev. Genet. 5, 101–113 (2004).14. Albert, R., Jeong, H. & Barabasi, A.L. Error and attack tolerance of complex networks.
Nature 406, 378–382 (2000).15. Chen, Y. et al. Variations in DNA elucidate molecular networks that cause disease.
Nature 452, 429–435 (2008).16. Csermely, P., Agoston, V. & Pongor, S. The efficiency of multi-target drugs: the
network approach might help drug design. Trends Pharmacol. Sci. 26, 178–182(2005).
17. Korcsmaros, T., Szalay, M.S., Bode, C., Kovacs, I. & Csermely, P. How to design multi-target drugs: target search options in cellular networks. Expert Opin. Drug Discov. 2,1–10 (2007).
18. Ooi, S.L. et al. Global synthetic-lethality analysis and yeast functional profiling.Trends Genet. 22, 56–63 (2006).
19. Hillenmeyer, M.E. et al. The chemical genomic portrait of yeast: uncovering aphenotype for all genes. Science 320, 362–365 (2008).
20. Roth, B.L., Sheffler, D.J. & Kroeze, W.K. Magic shotguns versus magic bullets:selectively non-selective drugs for mood disorders and schizophrenia. Nat. Rev. DrugDiscov. 3, 353–359 (2004).
21. Wermuth, C.G. Multitarget drugs: the end of the ’one-target-one-disease’ philosophy?Drug Discov. Today 9, 826–827 (2004).
22. Keith, C.T., Borisy, A.A. & Stockwel, B.R. Multicomponent therapeutics for networkedsystems. Nat. Rev. Drug Discov. 4, 71–78 (2005).
23. Petrelli, A. & Giordano, S. From single- to multi-target drugs in cancer therapy: whenaspecificity becomes an advantage. Curr. Med. Chem. 15, 422–432 (2008).
24. Mencher, S.K. & Wang, L.G. Promiscuous drugs compared to selective drugs(promiscuity can be a virtue). BMC Clin. Pharmacol. 5, 3 (2005).
25. Hopkins, A.L., Mason, J.S. & Overington, J.P. Can we rationally design promiscuousdrugs? Curr. Opin. Struct. Biol. 16, 127–136 (2006).
26. Flordellis, C.S., Manolis, A.S., Paris, H. & Karabinis, A. Rethinking target discovery inpolygenic diseases. Curr. Top. Med. Chem. 6, 1791–1798 (2006).
27. Dessalew, N. & Workalemahu, M. On the paradigm shift towards multitarget selectivedrug design. Curr. Comput. Aided Drug Des. 4, 76–90 (2008).
28. Keskin, O., Gursoy, A., Ma, B. & Nussinov, R. Towards drugs targeting multipleproteins in a systems biology approach. Curr. Top. Med. Chem. 7, 943–951(2007).
29. Zimmermann, G.R., Lehar, J. & Keith, C.T. Multi-target therapeutics: when the wholeis greater than the sum of the parts. Drug Discov. Today 12, 34–42 (2007).
30. McGovern, S.L., Caselli, E., Grigorieff, N. & Shoichet, B.K. A common mechanismunderlying promiscuous inhibitors from virtual and high-throughput screening.J. Med. Chem. 45, 1712–1722 (2002).
31. Kerkela, R. et al. Cardiotoxicity of the cancer therapeutic agent imatinib mesylate.Nat. Med. 12, 908–916 (2006).
32. Kaelin, W.G., Jr. The concept of synthetic lethality in the context of anticancertherapy. Nat. Rev. Cancer 5, 689–698 (2005).
33. Gascoigne, K.E. & Taylor, S.S. Cancer cells display profound intra- and interlinevariation following prolonged exposure to antimitotic drugs. Cancer Cell 14, 111–122(2008).
34. Whitehurst, A.W. et al. Synthetic lethal screen identification of chemosensitizer loci incancer cells. Nature 446, 815–819 (2007).
35. Turner, N.C. et al. A synthetic lethal siRNA screen identifying genes mediatingsensitivity to a PARP inhibitor. EMBO J. 27, 1368–1377 (2008).
36. Gupta, G.P. et al. Mediators of vascular remodelling co-opted for sequential steps inlung metastasis. Nature 446, 765–770 (2007).
37. Eltarhouny, S.A. et al. Genes controlling spread of breast cancer to lung ‘‘gang of 4’’.Exp. Oncol. 30, 91–95 (2008).
38. Kitano, H. A robustness-based approach to systems-oriented drug design. Nat. Rev.Drug Discov. 6, 202–210 (2007).
39. Bond, R.A. Can intellectualism stifle scientific discovery? Nat. Rev. Drug Discov. 1,825–829 (2002).
40. Dudekula, N., Arora, V., Callaerts-Vegh, Z. & Bond, R.A. The temporal hormesis ofdrug therapies. Dose Response 3, 414–424 (2006).
41. Schwartz, G.K. & Shah, M.A. Targeting the cell cycle: a new approach to cancertherapy. J. Clin. Oncol. 23, 9408–9421 (2005).
42. Mills, S.D. When will the genomics investment pay off for antibacterial discovery?Biochem. Pharmacol. 71, 1096–1102 (2006).
43. Pucci, M.J. Use of genomics to select antibacterial targets. Biochem. Pharmacol. 71,1066–1072 (2006).
44. Payne, D.J., Gwynn, M.N., Holmes, D.J. & Rosenberg, M. Genomic approaches toantibacterial discovery. Methods Mol. Biol. 266, 231–259 (2004).
45. Payne, D.J., Gwynn, M.N., Holmes, D.J. & Pompliano, D.L. Drugs for bad bugs:confronting the challenges of antibacterial discovery. Nat. Rev. Drug Discov. 6, 29–40(2007).
46. Lange, R.P., Locher, H.H., Wyss, P.C. & Then, R.L. The targets of currently usedantibacterial agents: lessons for drug discovery. Curr. Pharm. Des. 13, 3140–3154(2007).
47. Denome, S.A., Elf, P.K., Henderson, T.A., Nelson, D.E. & Young, K.D. Escherichia colimutants lacking all possible combinations of eight penicillin binding proteins:viability, characteristics, and implications for peptidoglycan synthesis. J. Bacteriol.181, 3981–3993 (1999).
48. Janoir, C., Zeller, V., Kitzis, M.D., Moreau, N.J. & Gutmann, L. High-level fluoroqui-nolone resistance in Streptococcus pneumoniae requires mutations in parC and gyrA.Antimicrob. Agents Chemother. 40, 2760–2764 (1996).
49. Ramaswamy, S. Rational design of cancer-drug combinations. N. Engl. J. Med. 357,299–300 (2007).
50. Mayer, L.D. & Janoff, A.S. Optimizing combination chemotherapy by controlling drugratios. Mol. Interv. 7, 216–223 (2007).
51. Dancey, J.E. & Chen, H.X. Strategies for optimizing combinations of molecularlytargeted anticancer agents. Nat. Rev. Drug Discov. 5, 649–659 (2006).
52. Borisy, A.A. et al. Systematic discovery of multicomponent therapeutics. Proc. Natl.Acad. Sci. USA 100, 7977–7982 (2003).
53. Radhakrishnan, M.L. & Tidor, B. Optimal drug cocktail design: methods for targetingmolecular ensembles and insights from theoretical model systems. J. Chem. Inf.Model. 48, 1055–1073 (2008).
54. Tsui, I.F., Chari, R., Buys, T.P. & Lam, W.L. Public databases and software for thepathway analysis of cancer genomes. Cancer Inform. 3, 389–407 (2007).
55. Swanson, D.R. Medical literature as a potential source of new knowledge. Bull. Med.Libr. Assoc. 78, 29–37 (1990).
56. Wren, J.D., Bekeredjian, R., Stewart, J.A., Shohet, R.V. & Garner, H.R. Knowledgediscovery by automated identification and ranking of implicit relationships. Bioinfor-matics 20, 389–398 (2004).
57. Bekhuis, T. Conceptual biology, hypothesis discovery, and text mining: Swanson’slegacy. Biomed. Digit. Libr. 3, 2 (2006).
58. Loging, W., Harland, L. & Williams-Jones, B. High-throughput electronic biology:mining information for drug discovery. Nat. Rev. Drug Discov. 6, 220–230 (2007).
59. Peirce, C.S. The Essential Peirce Vol. 2 (Indiana University Press, Bloomington,Indiana, USA, 1998).
60. Kell, D.B. & Oliver, S.G. Here is the evidence, now what is the hypothesis? Thecomplementary roles of inductive and hypothesis-driven science in the post-genomicera. Bioessays 26, 99–105 (2004).
61. Latora, V. & Marchiori, M. Vulnerability and protection of infrastructure networks.Phys. Rev. E 71, 015103R (2005).
62. Jeong, H., Mason, S.P., Barabasi, A.L. & Oltvai, Z.N. Lethality and centrality inprotein networks. Nature 411, 41–42 (2001).
63. Coulomb, S., Bauer, M., Bernard, D. & Marsolier-Kergoat, M.C. Gene essentiality andthe topology of protein interaction networks. Proc. Biol. Sci. 272, 1721–1725(2005).
64. Joy, M.P., Brock, A., Ingber, D.E. & Huang, S. High-betweenness proteins in the yeastprotein interaction network. J. Biomed. Biotechnol. 2, 96–103 (2005).
65. Yu, H., Kim, P.M., Sprecher, E., Trifonov, V. & Gerstein, M. The importance ofbottlenecks in protein networks: correlation with gene essentiality and expressiondynamics. PLoS Comput. Biol. 3, e59 (2007).
66. Hwang, W.C., Zhang, A. & Ramanathan, M. Identification of information flow-modulating drug targets: a novel bridging paradigm for drug discovery. Clin. Pharma-col. Ther. published online, doi:10.1038/clpt.2008.129 (9 July 2008).
67. Hahn, M.W. & Kern, A.D. Comparative genomics of centrality and essentiality inthree eukaryotic protein-interaction networks. Mol. Biol. Evol. 22, 803–806(2005).
68. Han, J.D. et al. Evidence for dynamically organized modularity in the yeast protein-protein interaction network. Nature 430, 88–93 (2004).
69. Yildirim, M.A., Goh, K.I., Cusick, M.E., Barabasi, A.L. & Vidal, M. Drug-targetnetwork. Nat. Biotechnol. 25, 1119–1126 (2007).
70. Nacher, J.C. & Schwartz, J.M. A global view of drug-therapy interactions. BMCPharmacol. 8, 5 (2008).
71. Motter, A.E., Nishikawa, T. & Lai, Y. Range-based attack on links in scale-freenetworks: are long-range links responsible for the small-world phenomenon? Phys.Rev. E 66, 065103 (2002).
72. Moriya, H., Shimizu-Yoshida, Y. & Kitano, H. In vivo robustness analysis ofcell division cycle genes in Saccharomyces cerevisiae. PLoS Genet. 2, e111(2006).
73. Wunderlich, Z. & Mirny, L.A. Using the topology of metabolic networks to predictviability of mutant strains. Biophys. J. 91, 2304–2311 (2006).
74. Kovacs, I., Csermely, P., Korcsmaros, T. & Szalay, M. WO patent application WO2007-IB50471 2007 0213 (2007).
75. Watterson, S., Marshall, S. & Ghazal, P. Logic models of pathway biology. Drug Discov.Today 13, 447–456 (2008).
76. Gerber, S., Assmus, H., Bakker, B. & Klipp, E. Drug-efficacy depends on the inhibitortype and the target position in a metabolic network—a systematic study. J. Theor.Biol. 252, 442–455 (2008).
77. Potapov, A.P., Goemann, B. & Wingender, E. The pairwise disconnectivity index as anew metric for the topological analysis of regulatory networks. BMC Bioinformatics 9,227 (2008).
78. Agoston, V., Csermely, P. & Pongor, S. Multiple weak hits confuse complex systems: atranscriptional regulatory network as an example. Phys. Rev. E 71, 051909(2005).
79. Motter, A.E., Gulbahce, N., Almaas, E. & Barabasi, A.L. Predicting synthetic rescuesin metabolic networks. Mol. Syst. Biol. 4, 168 (2008).
80. Leeson, P.D. & Springthorpe, B. The influence of drug-like concepts on decision-making in medicinal chemistry. Nat. Rev. Drug Discov. 6, 881–890 (2007).
REV I EW
NATURE CHEMICAL BIOLOGY VOLUME 4 NUMBER 11 NOVEMBER 2008 689
Fusing multiple prediction methods is likely to improve the overallsuccess rates of in silico lead identification. Once a lead is identified,the second computational design problem lies in the constraints ofoptimizing in multiple dimensions. If we assume, as the data suggest,that very few drugs are truly selective, then most biologically activesmall molecules have a degree of promiscuity by their nature. Thechallenge for medicinal chemists is to understand the profile of eachcompound, to fine tune the profile, and then to select for clinicaldevelopment those compounds whose profiles maximally modulate adisease network with the minimum level of toxicity and side effects.
ConclusionNetwork pharmacology is an approach to drug design that encom-passes systems biology, network analysis, connectivity, redundancyand pleiotropy. Network pharmacology offers a way of thinking aboutdrug discovery that simultaneously embraces efforts to improveclinical efficacy and understand side effects and toxicity—two of themost important reasons for failure. A variety of studies have shown thepower of network analysis in understanding biological systems.Furthermore, emergent phenotypes beyond those seen in single-genedeletion experiments have been observed through synthetic behaviors,combinations and chemical biology probes. The biological rationalefor considering multitarget strategies over single-target approaches iscompelling, yet such strategies are at present a minority activity in thepharmaceutical industry. The reason is that optimizing multipleactivities, while trying to balance drug-like properties and controlunwanted off-target effects, is a difficult task. We do not yet have arobust set of design tools with which to apply this approach routinely.Structure-based drug design took nearly two decades of multiple,parallel technological improvements to arrive at its current main-stream position in medicinal chemistry. Developments in computergraphics, high-power radiation sources, computational processing
power, refinement protocols, virtual screening and cryocrystallographywere all necessary to create the environment for rapid, iterativestructure-based drug discovery. To make network pharmacologycommonplace, a different set of tools, concerned with combinatorialand network search algorithms and methods for predicting thebiological profiles, will need to be refined. Network pharmacologyre-introduces the old idea that understanding the biological andkinetic profile of the drug is more important than individual valida-tion of targets or combinations of targets. In many ways, the networkpharmacology strategy outlined here is a modern reinvention of PaulJanssen’s original and incredibly successful methods of drug discovery,where side activities of compounds are explored through a broadspectrum of structure-activity relationships114. Given the crisis intranslation facing the pharmaceutical industry, network pharmacologyoffers a new framework for thinking about how to innovate drugdiscovery, and thus it is an idea whose time has come.
Published online at http://www.nature.com/naturechemicalbiology/
Reprints and permissions information is available online at http://npg.nature.com/
reprintsandpermissions/
1. Kola, I. & Landis, J. Can the pharmaceutical industry reduce attrition rates? Nat. Rev.Drug Discov. 3, 711–716 (2004).
2. Sams-Dodd, F. Target-based drug discovery: is something wrong? Drug Discov. Today10, 139–147 (2005).
3. Kaufmann, S.H.E. Paul Ehrlich: founder of chemotherapy. Nat. Rev. Drug Discov. 7,373 (2008).
4. Zambrowicz, B.P. & Sands, A.T. Modeling drug action in the mouse with knockoutsand RNA interference. Drug Discov. Today Targets 3, 198–207 (2004).
5. Winzeler, E.A. et al. Functional characterization of the S. cerevisiae genome by genedeletion and parallel analysis. Science 285, 901–906 (1999).
6. Giaever, G. et al. Functional profiling of the Saccharomyces cerevisiae genome.Nature 418, 387–391 (2002).
7. Deutschbauer, A.M. et al.Mechanisms of haploinsufficiency revealed by genome-wideprofiling in yeast. Genetics 169, 1915–1925 (2005).
8. Hopkins, A.L. & Groom, C.R. The druggable genome. Nat. Rev. Drug Discov. 1,727–730 (2002).
>gi|1170188|sp|P08631|HCK_HUMAN TYROSINE-PROTEIN KINASE HCK MGGRSSCEDPGCPRDEERAPRMGSMKSKFLQVGGNTFSKTETSASPHCPVYVPDPTSTIKPGPNSHNSNTPGIREAGSEDIIVVALYDYEAIHHEDL SFQKGDQMVVLEESGEWWKARSLATRKEGYIPSNYVARVDSLETEEWFFKGISRKDAERQLLAPGNMLGSFMIRDSETTKGSYSLSVRDYDPRQGDT VKHYKIRTLDNGGFYISPRSTFSTLQELVDHYKKGNDGLCQKLSVPCMSSKPQKPWEKDAWEIPRESLKLEKKLGAGQFGEVWMATYNKHTKVAVKT MKPGSMSVEAFLAEANVMKTLQHDKLVKLHAVVTKEPIYIITEFMAKGSLLDFLKSDEGSKQPLPKLIDFSAQIAEGMAFIEQRNYIHRDLRAANIL VSASLVCKIADFGLARVIEDNEYTAREGAKFPIKWTAPEAINFGSFTIKSDVWSFGILLMEIVTYGRIPYPGMSNPEVIRALERGYRMPRPENCPEE LYNIMMRCWKNRPEERPTFEYIQSVLDDFYTATESQYQQQP
a
b c d
Figure 3 Protein kinase inhibitor promiscuity as a function of binding site sequence similarity. (a,b) The full-length sequence of human protein tyrosine
kinase HCK (a), where the amino acids surrounding the ATP binding site are color-coded by their distance from the binding site surface when mapped onto
the canonical protein kinase structure (b). (c) Multidimensional scaling of the human kinome to cluster kinases using full sequences reveals that the kinases
cluster into discrete families. (d) Multidimensional scaling of the same kinases using the binding site–weighted sequences as defined in a and b reveals the
breakdown of the subfamily clustering and the similarity at the binding site level of many diverse protein kinases. Graphic courtesy of Colin Groom
(Cambridge Crystallographic Data Centre, Cambridge, UK).
REV I EW
688 VOLUME 4 NUMBER 11 NOVEMBER 2008 NATURE CHEMICAL BIOLOGY
22 | OCTOBER 2011 | THE FUTURE OF DRUG INNOVATION | NATURE REPRINT COLLECTION www.nature.com/reprintcollections/lilly/drug-innovation
Investment in drug research and development (R&D) has increased substantially in recent decades, but the annual number of truly innovative new medicines approved by the US Food and Drug Administration (FDA) has not increased accordingly, and attrition rates are very high1. Indeed, in a recent analysis2 it was noted that without a dramatic improvement in R&D produc-tivity, the pharmaceutical industry cannot sustain suf-ficient innovation to replace the loss of revenues due to patent expirations for successful products.
The authors of this analysis2 also considered R&D pro-ductivity in two dimensions: efficiency and effectiveness. R&D efficiency represents the ability to translate inputs (such as ideas, investment and effort) into defined out-puts (such as milestones that represent resolved uncer-tainties), whereas R&D effectiveness can be considered as the ability to produce outputs with certain intended and desired qualities. A key efficiency variable for increased productivity is the probability of technical success. If the probability of technical success could be increased (by reducing attrition) for any given drug candidate or, ide-ally, for a portfolio of drug candidates, then productivity would increase accordingly. The authors also suggested that target selection may be one of the most important determinants of attrition and overall R&D productivity2.
Since the dawn of the genomics era in the 1990s, the main focus of drug discovery has been on drug targets,
which are typically proteins that appear to have a key role in disease pathogenesis3–5. Modification of target activity provides a rational basis for the discovery of new medicines; a target-centric approach provides a specific biological hypothesis to be tested and a starting point for the identification of molecules to do this with. Tremendous advances have been made in the develop-ment of new tools to identify targets (for example, RNA interference) and compounds that interact with these targets (for example, high-throughput target-based screening assays that are applicable to key protein fami-lies such as G protein-coupled receptors and kinases). Structure-based tools that can be used to aid lead identification and optimization for some targets have also been developed, including X-ray crystallography and computational modelling and screening (virtual screening).
However, despite the power of these tools to identify potential drug candidates, R&D productivity remains a crucial challenge for the pharmaceutical industry, which raises questions about the possible limitations of a tar-get-centric approach to drug discovery. Indeed, before the introduction of target-based approaches, drug dis-covery was driven primarily by phenotypic assays, often with limited knowledge of the molecular mechanisms of disease. Nevertheless, the pharmaceutical industry was successful in the discovery and development of new
*Roche Palo Alto, 3431 Hillview Avenue, Palo Alto, California 94304, USA.‡iRND3 (Institute for Rare and Neglected Diseases Drug Discovery), 951 Old County Road, PMB 316, Belmont, California 94002‑2760, USA. Correspondence to D.C.S. e‑mail [email protected] doi:10.1038/nrd3480
How were new medicines discovered?David C. Swinney*‡ and Jason Anthony*
Abstract | Preclinical strategies that are used to identify potential drug candidates include target-based screening, phenotypic screening, modification of natural substances and biologic-based approaches. To investigate whether some strategies have been more successful than others in the discovery of new drugs, we analysed the discovery strategies and the molecular mechanism of action (MMOA) for new molecular entities and new biologics that were approved by the US Food and Drug Administration between 1999 and 2008. Out of the 259 agents that were approved, 75 were first-in-class drugs with new MMOAs, and out of these, 50 (67%) were small molecules and 25 (33%) were biologics. The results also show that the contribution of phenotypic screening to the discovery of first-in-class small-molecule drugs exceeded that of target-based approaches — with 28 and 17 of these drugs coming from the two approaches, respectively — in an era in which the major focus was on target-based approaches. We postulate that a target-centric approach for first-in-class drugs, without consideration of an optimal MMOA, may contribute to the current high attrition rates and low productivity in pharmaceutical research and development.
NATURE REVIEWS | DRUG DISCOVERY VOLUME 10 | JULY 2011 | 507
ANALYSIS
nrd_3480_jul11.indd 507 22/06/2011 10:16
81. Morphy, R., Kay, C. & Rankovic, Z. From magic bullets to designed multiple ligands.Drug Discov. Today 9, 641–651 (2004).
82. Morphy, R. & Rankovic, Z. The physicochemical challenges of designing multipleligands. J. Med. Chem. 49, 4961–4970 (2006).
83. Hopkins, A.L. et al. Design of non-nucleoside inhibitors of HIV-1 reverse transcriptasewith improved drug resistance properties. 1. J. Med. Chem. 47, 5912–5922 (2004).
84. Hann, M.M., Leach, A.R. & Harper, G. Molecular complexity and its impact on theprobability of finding leads for drug discovery. J. Chem. Inf. Comput. Sci. 41,856–864 (2001).
85. Leach, A.R., Hann, M.M., Burrows, J.N. & Griffen, E.J. Fragment screening: anintroduction. Mol. Biosyst. 2, 430–446 (2006).
86. Hopkins, A.L., Groom, C.R. & Alex, A. Ligand efficiency: a useful metric for leadselection. Drug Discov. Today 9, 430–431 (2004).
87. Morphy, R. & Rankovic, Z. Fragments, network biology and designing multipleligands. Drug Discov. Today 12, 156–160 (2007).
88. Neumann, T., Junker, H.D., Schmidt, K. & Sekul, R. SPR-based fragment screening:advantages and applications. Curr. Top. Med. Chem. 7, 1630–1642 (2007).
89. Hamalainen, M.D. et al. Label-free primary screening and affinity ranking of fragmentlibraries using parallel analysis of protein panels. J. Biomol. Screen. 13, 202–209(2008).
90. Paolini, G.V., Shapland, R.H., van Hoorn, W.P., Mason, J.S. & Hopkins, A.L. Globalmapping of pharmacological space. Nat. Biotechnol. 24, 805–815 (2006).
91. Wermuth, C.G. Selective optimization of side activities: another way for drugdiscovery. J. Med. Chem. 47, 1303–1314 (2004).
92. Wermuth, C.G. Selective optimization of side activities: the SOSA approach. DrugDiscov. Today 11, 160–164 (2006).
93. Millan, M. Multi-target strategies for the improved treatment of depressive states:conceptual foundations and neuronal substrates, drug discovery and therapeuticapplication. Pharmacol. Ther. 110, 135–370 (2006).
94. Ji, H.F. et al. Distribution patterns of small-molecule ligands in the protein universeand implications for origin of life and drug discovery. Genome Biol. 8, R176 (2007).
95. Park, K. & Kim, D. Binding similarity network of ligand. Proteins 71, 960–971(2008).
96. Kuhn, M., von Mering, C., Campillos, M., Jensen, L.J. & Bork, P. STITCH: interactionnetworks of chemicals and proteins. Nucleic Acids Res. 36, D684–D688 (2008).
97. Gunther, S. et al. SuperTarget and Matador: resources for exploring drug-targetrelationships. Nucleic Acids Res. 36, D919–D922 (2008).
98. Spiro, Z., Kovacs, I.A. & Csermely, P. Drug-therapy networks and the prediction ofnovel drug targets. J. Biol. 7, 20 (2008).
99. Bonchev, D. & Buck, G.A. From molecular to biological structure and back. J. Chem.Inf. Model. 47, 909–917 (2007).
100. Keiser, M.J. et al. Relating protein pharmacology by ligand chemistry. Nat. Biotech-nol. 25, 197–206 (2007).
101. Hert, J., Keiser, M., Irwin, J., Oprea, T. & Shoichet, B. Quantifying the relationshipsamong drug classes. J. Chem. Inf. Model. 48, 755–765 (2008).
102. Yamanishi, Y., Araki, M., Gutteridge, A., Honda, W. & Kanehisa, M. Prediction ofdrug-target interaction networks from the integration of chemical and genomicspaces. Bioinformatics 24, i232–i240 (2008).
103. Kuhn, M., Campillos, M., Gonzalez, P., Jensen, L.J. & Bork, P. Large-scale predictionof drug–target relationships. FEBS Lett. 582, 1283–1289 (2008).
104. Campillos, M., Kuhn, M., Gavin, A.C., Jensen, L.J. & Bork, P. Drug target identifica-tion using side-effect similarity. Science 321, 263–266 (2008).
105. Scott, M.S. & Barton, G.J. Probabilistic prediction and ranking of human protein-protein interactions. BMC Bioinformatics 8, 239 (2007).
106. Fliri, A.F., Loging, W.T., Thadeio, P.F. & Volkmann, R.A. Biospectra analysis: modelproteome characterizations for linking molecular structure and biological response.J. Med. Chem. 48, 6918–6925 (2005).
107. Lamb, J. et al. The connectivity map: using gene-expression signatures toconnect small molecules, genes, and disease. Science 313, 1929–1935(2006).
108. Davies, J.R., Jackson, R.M., Mardia, K.V. & Taylor, C.C. The Poisson index: a newprobabilistic model for protein ligand binding site similarity. Bioinformatics 23,3001–3008 (2007).
109. Baroni, M., Cruciani, G., Sciabola, S., Perruccio, F. & Mason, J.S. A commonreference framework for analyzing/comparing proteins and ligands. Fingerprints forligands and proteins (FLAP): theory and application. J. Chem. Inf. Model. 47,279–294 (2007).
110. Zhang, Z. & Grigorov, M.G. Similarity networks of protein binding sites. Proteins 62,470–478 (2006).
111. Zhang, X., Crespo, A. & Fernandez, A. Turning promiscuous kinase inhibitors intosafer drugs. Trends Biotechnol. 26, 295–301 (2008).
112. Aronov, A.M., McClain, B., Moody, C.S. & Murcko, M.A. Kinase-likeness and kinase-privileged fragments: toward virtual polypharmacology. J. Med. Chem. 51,1214–1222 (2008).
113. Jenwitheesuk, E., Horst, J.A., Rivas, K.L., Van Voorhis, W.C. & Samudrala, R. Novelparadigms for drug discovery: computational multitarget screening. Trends Pharma-col. Sci. 29, 62–71 (2008).
114. Van Gestel, S. & Schuermans, V. Thirty-three years of drug discovery and researchwith Dr. Paul Janssen. Drug Dev. Res. 8, 1–13 (1986).
115. Overington, J.P., Al-Lazikani, B. & Hopkins, A.L. How many drug targets are there?Nat. Rev. Drug Discov. 5, 993–996 (2006).
116. Fabian, M.A. et al. A small molecule�kinase interaction map for clinical kinaseinhibitors. Nat. Biotechnol. 23, 329–336 (2005).
117. Shannon, P. et al. Cytoscape: a software environment for integratedmodels of biomolecular interaction networks. Genome Res. 13, 2498–2504(2003).
REV I EW
690 VOLUME 4 NUMBER 11 NOVEMBER 2008 NATURE CHEMICAL BIOLOGY
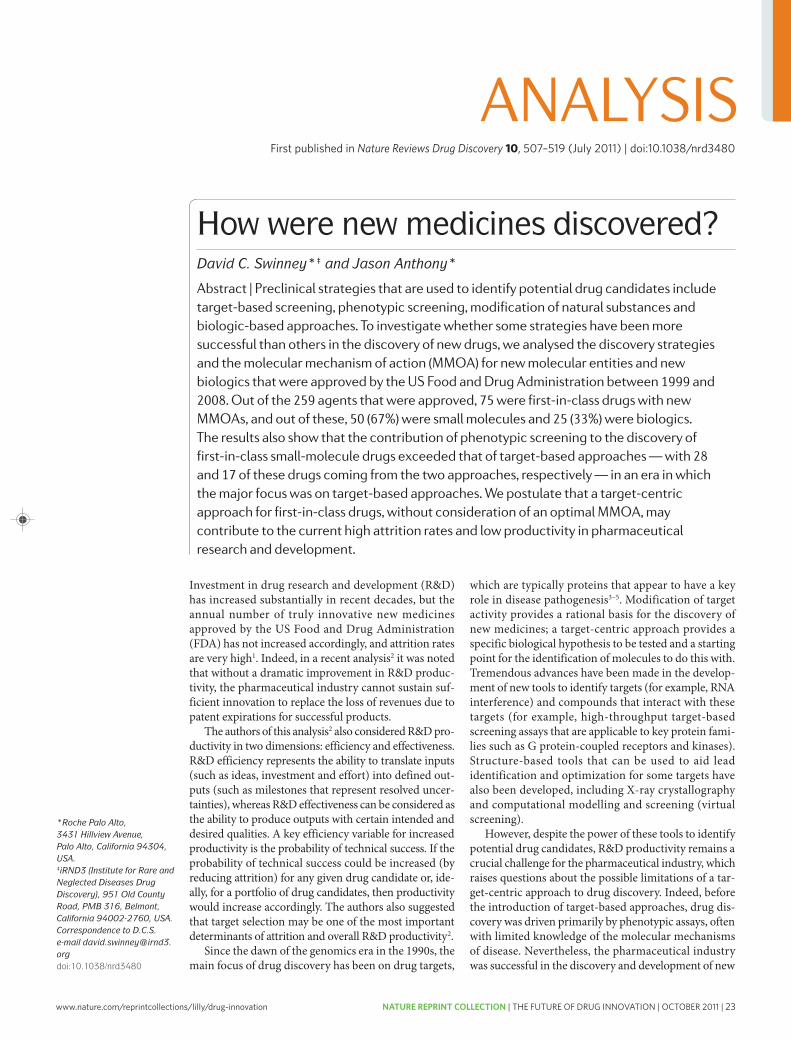
www.nature.com/reprintcollections/lilly/drug-innovation NATURE REPRINT COLLECTION | THE FUTURE OF DRUG INNOVATION | OCTOBER 2011 | 23
Investment in drug research and development (R&D) has increased substantially in recent decades, but the annual number of truly innovative new medicines approved by the US Food and Drug Administration (FDA) has not increased accordingly, and attrition rates are very high1. Indeed, in a recent analysis2 it was noted that without a dramatic improvement in R&D produc-tivity, the pharmaceutical industry cannot sustain suf-ficient innovation to replace the loss of revenues due to patent expirations for successful products.
The authors of this analysis2 also considered R&D pro-ductivity in two dimensions: efficiency and effectiveness. R&D efficiency represents the ability to translate inputs (such as ideas, investment and effort) into defined out-puts (such as milestones that represent resolved uncer-tainties), whereas R&D effectiveness can be considered as the ability to produce outputs with certain intended and desired qualities. A key efficiency variable for increased productivity is the probability of technical success. If the probability of technical success could be increased (by reducing attrition) for any given drug candidate or, ide-ally, for a portfolio of drug candidates, then productivity would increase accordingly. The authors also suggested that target selection may be one of the most important determinants of attrition and overall R&D productivity2.
Since the dawn of the genomics era in the 1990s, the main focus of drug discovery has been on drug targets,
which are typically proteins that appear to have a key role in disease pathogenesis3–5. Modification of target activity provides a rational basis for the discovery of new medicines; a target-centric approach provides a specific biological hypothesis to be tested and a starting point for the identification of molecules to do this with. Tremendous advances have been made in the develop-ment of new tools to identify targets (for example, RNA interference) and compounds that interact with these targets (for example, high-throughput target-based screening assays that are applicable to key protein fami-lies such as G protein-coupled receptors and kinases). Structure-based tools that can be used to aid lead identification and optimization for some targets have also been developed, including X-ray crystallography and computational modelling and screening (virtual screening).
However, despite the power of these tools to identify potential drug candidates, R&D productivity remains a crucial challenge for the pharmaceutical industry, which raises questions about the possible limitations of a tar-get-centric approach to drug discovery. Indeed, before the introduction of target-based approaches, drug dis-covery was driven primarily by phenotypic assays, often with limited knowledge of the molecular mechanisms of disease. Nevertheless, the pharmaceutical industry was successful in the discovery and development of new
*Roche Palo Alto, 3431 Hillview Avenue, Palo Alto, California 94304, USA.‡iRND3 (Institute for Rare and Neglected Diseases Drug Discovery), 951 Old County Road, PMB 316, Belmont, California 94002‑2760, USA. Correspondence to D.C.S. e‑mail [email protected] doi:10.1038/nrd3480
How were new medicines discovered?David C. Swinney*‡ and Jason Anthony*
Abstract | Preclinical strategies that are used to identify potential drug candidates include target-based screening, phenotypic screening, modification of natural substances and biologic-based approaches. To investigate whether some strategies have been more successful than others in the discovery of new drugs, we analysed the discovery strategies and the molecular mechanism of action (MMOA) for new molecular entities and new biologics that were approved by the US Food and Drug Administration between 1999 and 2008. Out of the 259 agents that were approved, 75 were first-in-class drugs with new MMOAs, and out of these, 50 (67%) were small molecules and 25 (33%) were biologics. The results also show that the contribution of phenotypic screening to the discovery of first-in-class small-molecule drugs exceeded that of target-based approaches — with 28 and 17 of these drugs coming from the two approaches, respectively — in an era in which the major focus was on target-based approaches. We postulate that a target-centric approach for first-in-class drugs, without consideration of an optimal MMOA, may contribute to the current high attrition rates and low productivity in pharmaceutical research and development.
NATURE REVIEWS | DRUG DISCOVERY VOLUME 10 | JULY 2011 | 507
ANALYSIS
nrd_3480_jul11.indd 507 22/06/2011 10:16
81. Morphy, R., Kay, C. & Rankovic, Z. From magic bullets to designed multiple ligands.Drug Discov. Today 9, 641–651 (2004).
82. Morphy, R. & Rankovic, Z. The physicochemical challenges of designing multipleligands. J. Med. Chem. 49, 4961–4970 (2006).
83. Hopkins, A.L. et al. Design of non-nucleoside inhibitors of HIV-1 reverse transcriptasewith improved drug resistance properties. 1. J. Med. Chem. 47, 5912–5922 (2004).
84. Hann, M.M., Leach, A.R. & Harper, G. Molecular complexity and its impact on theprobability of finding leads for drug discovery. J. Chem. Inf. Comput. Sci. 41,856–864 (2001).
85. Leach, A.R., Hann, M.M., Burrows, J.N. & Griffen, E.J. Fragment screening: anintroduction. Mol. Biosyst. 2, 430–446 (2006).
86. Hopkins, A.L., Groom, C.R. & Alex, A. Ligand efficiency: a useful metric for leadselection. Drug Discov. Today 9, 430–431 (2004).
87. Morphy, R. & Rankovic, Z. Fragments, network biology and designing multipleligands. Drug Discov. Today 12, 156–160 (2007).
88. Neumann, T., Junker, H.D., Schmidt, K. & Sekul, R. SPR-based fragment screening:advantages and applications. Curr. Top. Med. Chem. 7, 1630–1642 (2007).
89. Hamalainen, M.D. et al. Label-free primary screening and affinity ranking of fragmentlibraries using parallel analysis of protein panels. J. Biomol. Screen. 13, 202–209(2008).
90. Paolini, G.V., Shapland, R.H., van Hoorn, W.P., Mason, J.S. & Hopkins, A.L. Globalmapping of pharmacological space. Nat. Biotechnol. 24, 805–815 (2006).
91. Wermuth, C.G. Selective optimization of side activities: another way for drugdiscovery. J. Med. Chem. 47, 1303–1314 (2004).
92. Wermuth, C.G. Selective optimization of side activities: the SOSA approach. DrugDiscov. Today 11, 160–164 (2006).
93. Millan, M. Multi-target strategies for the improved treatment of depressive states:conceptual foundations and neuronal substrates, drug discovery and therapeuticapplication. Pharmacol. Ther. 110, 135–370 (2006).
94. Ji, H.F. et al. Distribution patterns of small-molecule ligands in the protein universeand implications for origin of life and drug discovery. Genome Biol. 8, R176 (2007).
95. Park, K. & Kim, D. Binding similarity network of ligand. Proteins 71, 960–971(2008).
96. Kuhn, M., von Mering, C., Campillos, M., Jensen, L.J. & Bork, P. STITCH: interactionnetworks of chemicals and proteins. Nucleic Acids Res. 36, D684–D688 (2008).
97. Gunther, S. et al. SuperTarget and Matador: resources for exploring drug-targetrelationships. Nucleic Acids Res. 36, D919–D922 (2008).
98. Spiro, Z., Kovacs, I.A. & Csermely, P. Drug-therapy networks and the prediction ofnovel drug targets. J. Biol. 7, 20 (2008).
99. Bonchev, D. & Buck, G.A. From molecular to biological structure and back. J. Chem.Inf. Model. 47, 909–917 (2007).
100. Keiser, M.J. et al. Relating protein pharmacology by ligand chemistry. Nat. Biotech-nol. 25, 197–206 (2007).
101. Hert, J., Keiser, M., Irwin, J., Oprea, T. & Shoichet, B. Quantifying the relationshipsamong drug classes. J. Chem. Inf. Model. 48, 755–765 (2008).
102. Yamanishi, Y., Araki, M., Gutteridge, A., Honda, W. & Kanehisa, M. Prediction ofdrug-target interaction networks from the integration of chemical and genomicspaces. Bioinformatics 24, i232–i240 (2008).
103. Kuhn, M., Campillos, M., Gonzalez, P., Jensen, L.J. & Bork, P. Large-scale predictionof drug–target relationships. FEBS Lett. 582, 1283–1289 (2008).
104. Campillos, M., Kuhn, M., Gavin, A.C., Jensen, L.J. & Bork, P. Drug target identifica-tion using side-effect similarity. Science 321, 263–266 (2008).
105. Scott, M.S. & Barton, G.J. Probabilistic prediction and ranking of human protein-protein interactions. BMC Bioinformatics 8, 239 (2007).
106. Fliri, A.F., Loging, W.T., Thadeio, P.F. & Volkmann, R.A. Biospectra analysis: modelproteome characterizations for linking molecular structure and biological response.J. Med. Chem. 48, 6918–6925 (2005).
107. Lamb, J. et al. The connectivity map: using gene-expression signatures toconnect small molecules, genes, and disease. Science 313, 1929–1935(2006).
108. Davies, J.R., Jackson, R.M., Mardia, K.V. & Taylor, C.C. The Poisson index: a newprobabilistic model for protein ligand binding site similarity. Bioinformatics 23,3001–3008 (2007).
109. Baroni, M., Cruciani, G., Sciabola, S., Perruccio, F. & Mason, J.S. A commonreference framework for analyzing/comparing proteins and ligands. Fingerprints forligands and proteins (FLAP): theory and application. J. Chem. Inf. Model. 47,279–294 (2007).
110. Zhang, Z. & Grigorov, M.G. Similarity networks of protein binding sites. Proteins 62,470–478 (2006).
111. Zhang, X., Crespo, A. & Fernandez, A. Turning promiscuous kinase inhibitors intosafer drugs. Trends Biotechnol. 26, 295–301 (2008).
112. Aronov, A.M., McClain, B., Moody, C.S. & Murcko, M.A. Kinase-likeness and kinase-privileged fragments: toward virtual polypharmacology. J. Med. Chem. 51,1214–1222 (2008).
113. Jenwitheesuk, E., Horst, J.A., Rivas, K.L., Van Voorhis, W.C. & Samudrala, R. Novelparadigms for drug discovery: computational multitarget screening. Trends Pharma-col. Sci. 29, 62–71 (2008).
114. Van Gestel, S. & Schuermans, V. Thirty-three years of drug discovery and researchwith Dr. Paul Janssen. Drug Dev. Res. 8, 1–13 (1986).
115. Overington, J.P., Al-Lazikani, B. & Hopkins, A.L. How many drug targets are there?Nat. Rev. Drug Discov. 5, 993–996 (2006).
116. Fabian, M.A. et al. A small molecule�kinase interaction map for clinical kinaseinhibitors. Nat. Biotechnol. 23, 329–336 (2005).
117. Shannon, P. et al. Cytoscape: a software environment for integratedmodels of biomolecular interaction networks. Genome Res. 13, 2498–2504(2003).
REV I EW
690 VOLUME 4 NUMBER 11 NOVEMBER 2008 NATURE CHEMICAL BIOLOGY
First published in Nature Reviews Drug Discovery 10, 507–519 (July 2011) | doi:10.1038/nrd3480
24 | OCTOBER 2011 | THE FUTURE OF DRUG INNOVATION | NATURE REPRINT COLLECTION www.nature.com/reprintcollections/lilly/drug-innovation
Table 1 | First-in-class small-molecule new molecular entities approved by the FDA: 1999–2008
Drug (trade name; company) Therapeutic area Target type Molecular mechanism of action Refs
Discovered through phenotypic screening
Aripiprazole (Abilify; Bristol-Myers Squibb/Otsuka Pharmaceutical)
CNS Receptor Conformational/partial agonist 74,75, 80–84
Azacitidine (Vidaza; Celgene/Pfizer) Cancer Enyzme Irreversible inhibition 69,85
Caspofungin (Cancidas; Merck) Infectious disease Enzyme Noncompetitive inhibition 71,86
Cilostazol (Pletal; Otsuka) Cardiovascular Enzyme Inhibition 87
Cinacalcet (Sensipar; Amgen) Metabolic Receptor Allosteric activator 29
Daptomycin (Cubicin; Cubist) Infectious disease NA (disrupts bacterial membrane)
Unknown 88
Docosanol (Abreva; Avanir Pharmaceuticals)
Infectious disease Unknown Unknown 89–92
Ezetimibe (Zetia; Merck) Cardiovascular Transporter Slow binding kinetics 30
Fulvestrant (Faslodex; AstraZeneca) Cancer Receptor Antagonist-induced degradation 47,93,94
Levetiracetam (Keppra; UCB Pharma) CNS Unknown Unknown 95
Linezolid (Zyvox; Pfizer) Infectious disease Enzyme Conformational 28,96,97
Lubiprostone (Amitiza; Sucampo Pharmaceuticals)
Gastrointestinal Unknown Unknown 98–100
Memantine (Namenda; Forest) CNS Receptor Uncompetitive and fast binding kinetics
101–103
Miglustat (Zavesca; Actelion) Rare diseases Enzyme Reversible inhibition 104,105
Nateglinide (Fastic; Novartis/Astellas)
Metabolic Unknown Fast binding kinetics 106–108
Nelarabine (Arranon; GlaxoSmithKline)
Cancer DNA (nucleoside analogue)
Nucleotide chain termination 109–113
Nitazoxanide (Alinia; Roche) Infectious disease Enzyme Irreversible and redox 78,79
Nitisinone (Orfadin; Syngenta) Rare diseases Enzyme Irreversible 114–116
Pemirolast (Alamast; Senten) Immune modulation Unknown Unknown 117
Ranolazine (Ranexa; Gilead) Cardiovascular Unknown Unknown 118–121
Retapamulin (Altabax; GlaxoSmithKline)
Infectious disease Enzyme Allosteric inhibitor 122
Rufinamide (Inovelon; Novartis) CNS Unknown Unknown 123,124
Sinecatechins (Veregen; Medigene)
Infectious disease Unknown Unknown 125
Sirolimus (Rapamune; Pfizer) Immune modulation Enzyme Conformational/inhibition 70,126
Varenicline (Chantix; Pfizer) CNS Ion channel Conformational/partial agonist 76
Vorinostat (Zolinza; Merck) Cancer Enzyme Equilibrium kinetics 127,128
Ziconotide (Prialt; Elan Pharmaceuticals)
Pain and/or CNS Ion channel Equilibrium kinetics 31
Zonisamide (Excegran; Dainippon Pharmaceuticals)
CNS Unknown Unknown 129
Discovered through target-based screening
Aliskiren (Tekturna; Novartis) Cardiovascular Enzyme Equilibrium binding 38,130
Aprepitant (Emend; Merck) Gastrointestinal Receptor Slow binding kinetics 46
Bortezomib (Velcade; Millenium Pharmaceuticals)
Cancer Enzyme Equilibrium binding 131,132
Bosentan (Tracleer; Actelion) Cardiovascular Receptor Equilibrium binding 37
Conivaptan (Vaprisol; Astellas Pharma)
Metabolic Receptor Equilibrium binding 133
Eltrombopag (Promacta; GlaxoSmithKline)
Immune Receptor Noncompetitive agonist 36
Gefitinib (Iressa; AstraZeneca) Cancer Enzyme Stabilize inactive conformation 41,42
A N A LY S I S
NATURE REVIEWS | DRUG DISCOVERY VOLUME 10 | JULY 2011 | 509
nrd_3480_jul11.indd 509 22/06/2011 10:16
New molecular entities(NME). A medication containing an active ingredient that has not been previously approved for marketing in any form in the United States.
innovative medicines; it has therefore been suggested that the more limited use of phenotypic screening in recent years has contributed to the current lack of suc-cess in drug R&D6,7.
These two different approaches to drug discovery — target-based screening and phenotypic screening — each have advantages and disadvantages. The strengths of the target-based approach include the ability to apply molecular and chemical knowledge to investigate spe-cific molecular hypotheses, and the ability to apply both small-molecule screening strategies (which can often be achieved using high-throughput formats) and biologic-based approaches, such as identifying monoclonal anti-bodies. A disadvantage of the target-based approach is that the solution to the specific molecular hypotheses may not be relevant to the disease pathogenesis or pro-vide a sufficient therapeutic index.
A strength of the phenotypic approach is that the assays do not require prior understanding of the molecu-lar mechanism of action (MMOA), and activity in such assays might be translated into therapeutic impact in a given disease state more effectively than in target-based assays, which are often more artificial. A disadvantage of phenotypic screening approaches is the challenge of optimizing the molecular properties of candidate drugs without the design parameters provided by prior knowledge of the MMOA. An additional challenge is to effectively incorporate new screening technologies into phenotypic screening approaches, which is impor-tant for addressing the traditional limitation of some of these assays: a considerably lower throughput than target-based assays.
In order to gain a better understanding of the factors that could contribute to the high attrition rates, and to provide insights that might help to reduce attrition and increase R&D productivity, we decided to investigate the approaches that were used in the discovery of recently introduced medicines. To achieve this, we analysed the characteristics of the new molecular entities (NMEs) and new therapeutic biologics that were approved by the FDA during the 10-year period between 1999 and 2008 by examining the discovery approach, the MMOA and whether the drug was first in its class.
Data and analysisNumbers of NMEs. In the 10-year period between 1999 and 2008, the FDA approved 183 small-molecule drugs, 20 imaging agents and 56 new therapeutic biologics (259 agents overall). Out of these, 75 drugs were identified as first-in-class or with novel MMOAs based on the infor-mation provided in the product labels on the FDA web-site (see the Drugs@FDA website), and primary research and review publications (TABLE 1; Supplementary infor-mation S1 (table)). The specific sources for each drug are referenced in TABLE 1 and in Supplementary information S2 (box).
Discovery approaches. We divided the list of 259 agents into three general categories: first-in-class drugs (75 drugs), follower drugs (164 drugs) and imaging agents (20 agents; these were not further analysed). A
list of all the drugs and their classification is provided in Supplementary information S1 (table) and a brief description of the discovery history of first-in-class drugs is provided in Supplementary information S2 (box). We categorized the method of discovery of each new drug as target-based, phenotypic-based, modification of a natural substance, biologic-based or other (see Supplementary information S1 (table)). Overall, 100 NMEs were dis-covered using target-based approaches, 58 NMEs were discovered using phenotypic-based approaches, 18 NMEs were based on modifications of natural sub-stances and 56 of the agents were biologics. All of the biologics can be considered to have been discovered using a target-based approach, and the main focus of our analysis is on the methods of discovery for small-molecule first-in-class NMEs and follower NMEs; that is, small molecules that are in the same class as a previ-ously approved NME.
MMOA. The MMOA of the NMEs was analysed because the limitations of a target-based approach with respect to the MMOA have been highlighted8–10, and because the MMOA is a characteristic of drugs that has received less attention with regard to its connection to attrition. For the purpose of this article, MMOA is defined as the biochemical mechanism through which the structural interactions between the drug and its target(s) result in a functional response10–12, which is important in both drug efficacy and safety (BOX 1). The MMOA can affect how efficiently a binding interaction is coupled to the functional response, which can be assessed by consider-ing biochemical efficiency (BOX 2).
For instance, resistance to the ATP-competitive kinase inhibitors gefitinib and erlotinib — which target the epidermal growth factor receptor (EGFR) kinase — has been shown to be due to mutations that alter the ATP binding site in such a way that they increase the affinity of the EGFR kinase domain for ATP. The functional consequence of these resistance mutations is therefore to enable ATP to compete more effec-tively with gefitinib and erlotinib12,13. This provides an explanation for the mechanism of resistance to these rapidly reversible ATP-competitive inhibitors, and also provides an explanation as to why irreversible covalent binding inhibitors overcome this resistance13.
An example of how the therapeutic utility of drugs that function through interaction with a receptor is influenced by their MMOA is provided by the tissue-selective functional effects of the selective oestrogen receptor modulators (SERMs), which are mediated by SERM-induced structural changes in the oestrogen receptor14. Binding to the receptor initiates a series of molecular events, which culminate in the activation or repression of specific genes. The SERMs tamoxifen and raloxifene bind at the same site within the core of the ligand-binding domain, but with different bind-ing modes that are translated into distinct conforma-tions of the transactivation domain of the receptor. Transcriptional regulation of the oestrogen receptor is a complex process that involves the participa-tion of co-activators and co-repressors, and the
A N A LY S I S
508 | JULY 2011 | VOLUME 10 www.nature.com/reviews/drugdisc
nrd_3480_jul11.indd 508 22/06/2011 10:16
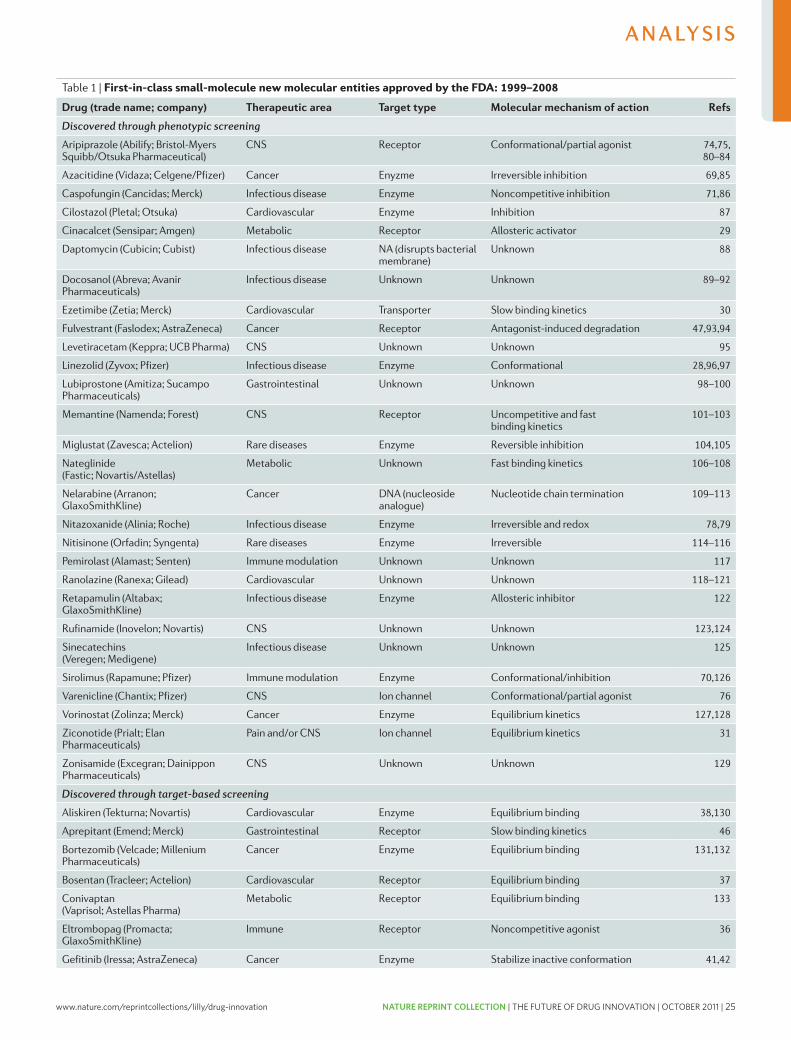
www.nature.com/reprintcollections/lilly/drug-innovation NATURE REPRINT COLLECTION | THE FUTURE OF DRUG INNOVATION | OCTOBER 2011 | 25
Table 1 | First-in-class small-molecule new molecular entities approved by the FDA: 1999–2008
Drug (trade name; company) Therapeutic area Target type Molecular mechanism of action Refs
Discovered through phenotypic screening
Aripiprazole (Abilify; Bristol-Myers Squibb/Otsuka Pharmaceutical)
CNS Receptor Conformational/partial agonist 74,75, 80–84
Azacitidine (Vidaza; Celgene/Pfizer) Cancer Enyzme Irreversible inhibition 69,85
Caspofungin (Cancidas; Merck) Infectious disease Enzyme Noncompetitive inhibition 71,86
Cilostazol (Pletal; Otsuka) Cardiovascular Enzyme Inhibition 87
Cinacalcet (Sensipar; Amgen) Metabolic Receptor Allosteric activator 29
Daptomycin (Cubicin; Cubist) Infectious disease NA (disrupts bacterial membrane)
Unknown 88
Docosanol (Abreva; Avanir Pharmaceuticals)
Infectious disease Unknown Unknown 89–92
Ezetimibe (Zetia; Merck) Cardiovascular Transporter Slow binding kinetics 30
Fulvestrant (Faslodex; AstraZeneca) Cancer Receptor Antagonist-induced degradation 47,93,94
Levetiracetam (Keppra; UCB Pharma) CNS Unknown Unknown 95
Linezolid (Zyvox; Pfizer) Infectious disease Enzyme Conformational 28,96,97
Lubiprostone (Amitiza; Sucampo Pharmaceuticals)
Gastrointestinal Unknown Unknown 98–100
Memantine (Namenda; Forest) CNS Receptor Uncompetitive and fast binding kinetics
101–103
Miglustat (Zavesca; Actelion) Rare diseases Enzyme Reversible inhibition 104,105
Nateglinide (Fastic; Novartis/Astellas)
Metabolic Unknown Fast binding kinetics 106–108
Nelarabine (Arranon; GlaxoSmithKline)
Cancer DNA (nucleoside analogue)
Nucleotide chain termination 109–113
Nitazoxanide (Alinia; Roche) Infectious disease Enzyme Irreversible and redox 78,79
Nitisinone (Orfadin; Syngenta) Rare diseases Enzyme Irreversible 114–116
Pemirolast (Alamast; Senten) Immune modulation Unknown Unknown 117
Ranolazine (Ranexa; Gilead) Cardiovascular Unknown Unknown 118–121
Retapamulin (Altabax; GlaxoSmithKline)
Infectious disease Enzyme Allosteric inhibitor 122
Rufinamide (Inovelon; Novartis) CNS Unknown Unknown 123,124
Sinecatechins (Veregen; Medigene)
Infectious disease Unknown Unknown 125
Sirolimus (Rapamune; Pfizer) Immune modulation Enzyme Conformational/inhibition 70,126
Varenicline (Chantix; Pfizer) CNS Ion channel Conformational/partial agonist 76
Vorinostat (Zolinza; Merck) Cancer Enzyme Equilibrium kinetics 127,128
Ziconotide (Prialt; Elan Pharmaceuticals)
Pain and/or CNS Ion channel Equilibrium kinetics 31
Zonisamide (Excegran; Dainippon Pharmaceuticals)
CNS Unknown Unknown 129
Discovered through target-based screening
Aliskiren (Tekturna; Novartis) Cardiovascular Enzyme Equilibrium binding 38,130
Aprepitant (Emend; Merck) Gastrointestinal Receptor Slow binding kinetics 46
Bortezomib (Velcade; Millenium Pharmaceuticals)
Cancer Enzyme Equilibrium binding 131,132
Bosentan (Tracleer; Actelion) Cardiovascular Receptor Equilibrium binding 37
Conivaptan (Vaprisol; Astellas Pharma)
Metabolic Receptor Equilibrium binding 133
Eltrombopag (Promacta; GlaxoSmithKline)
Immune Receptor Noncompetitive agonist 36
Gefitinib (Iressa; AstraZeneca) Cancer Enzyme Stabilize inactive conformation 41,42
A N A LY S I S
NATURE REVIEWS | DRUG DISCOVERY VOLUME 10 | JULY 2011 | 509
nrd_3480_jul11.indd 509 22/06/2011 10:16
New molecular entities(NME). A medication containing an active ingredient that has not been previously approved for marketing in any form in the United States.
innovative medicines; it has therefore been suggested that the more limited use of phenotypic screening in recent years has contributed to the current lack of suc-cess in drug R&D6,7.
These two different approaches to drug discovery — target-based screening and phenotypic screening — each have advantages and disadvantages. The strengths of the target-based approach include the ability to apply molecular and chemical knowledge to investigate spe-cific molecular hypotheses, and the ability to apply both small-molecule screening strategies (which can often be achieved using high-throughput formats) and biologic-based approaches, such as identifying monoclonal anti-bodies. A disadvantage of the target-based approach is that the solution to the specific molecular hypotheses may not be relevant to the disease pathogenesis or pro-vide a sufficient therapeutic index.
A strength of the phenotypic approach is that the assays do not require prior understanding of the molecu-lar mechanism of action (MMOA), and activity in such assays might be translated into therapeutic impact in a given disease state more effectively than in target-based assays, which are often more artificial. A disadvantage of phenotypic screening approaches is the challenge of optimizing the molecular properties of candidate drugs without the design parameters provided by prior knowledge of the MMOA. An additional challenge is to effectively incorporate new screening technologies into phenotypic screening approaches, which is impor-tant for addressing the traditional limitation of some of these assays: a considerably lower throughput than target-based assays.
In order to gain a better understanding of the factors that could contribute to the high attrition rates, and to provide insights that might help to reduce attrition and increase R&D productivity, we decided to investigate the approaches that were used in the discovery of recently introduced medicines. To achieve this, we analysed the characteristics of the new molecular entities (NMEs) and new therapeutic biologics that were approved by the FDA during the 10-year period between 1999 and 2008 by examining the discovery approach, the MMOA and whether the drug was first in its class.
Data and analysisNumbers of NMEs. In the 10-year period between 1999 and 2008, the FDA approved 183 small-molecule drugs, 20 imaging agents and 56 new therapeutic biologics (259 agents overall). Out of these, 75 drugs were identified as first-in-class or with novel MMOAs based on the infor-mation provided in the product labels on the FDA web-site (see the Drugs@FDA website), and primary research and review publications (TABLE 1; Supplementary infor-mation S1 (table)). The specific sources for each drug are referenced in TABLE 1 and in Supplementary information S2 (box).
Discovery approaches. We divided the list of 259 agents into three general categories: first-in-class drugs (75 drugs), follower drugs (164 drugs) and imaging agents (20 agents; these were not further analysed). A
list of all the drugs and their classification is provided in Supplementary information S1 (table) and a brief description of the discovery history of first-in-class drugs is provided in Supplementary information S2 (box). We categorized the method of discovery of each new drug as target-based, phenotypic-based, modification of a natural substance, biologic-based or other (see Supplementary information S1 (table)). Overall, 100 NMEs were dis-covered using target-based approaches, 58 NMEs were discovered using phenotypic-based approaches, 18 NMEs were based on modifications of natural sub-stances and 56 of the agents were biologics. All of the biologics can be considered to have been discovered using a target-based approach, and the main focus of our analysis is on the methods of discovery for small-molecule first-in-class NMEs and follower NMEs; that is, small molecules that are in the same class as a previ-ously approved NME.
MMOA. The MMOA of the NMEs was analysed because the limitations of a target-based approach with respect to the MMOA have been highlighted8–10, and because the MMOA is a characteristic of drugs that has received less attention with regard to its connection to attrition. For the purpose of this article, MMOA is defined as the biochemical mechanism through which the structural interactions between the drug and its target(s) result in a functional response10–12, which is important in both drug efficacy and safety (BOX 1). The MMOA can affect how efficiently a binding interaction is coupled to the functional response, which can be assessed by consider-ing biochemical efficiency (BOX 2).
For instance, resistance to the ATP-competitive kinase inhibitors gefitinib and erlotinib — which target the epidermal growth factor receptor (EGFR) kinase — has been shown to be due to mutations that alter the ATP binding site in such a way that they increase the affinity of the EGFR kinase domain for ATP. The functional consequence of these resistance mutations is therefore to enable ATP to compete more effec-tively with gefitinib and erlotinib12,13. This provides an explanation for the mechanism of resistance to these rapidly reversible ATP-competitive inhibitors, and also provides an explanation as to why irreversible covalent binding inhibitors overcome this resistance13.
An example of how the therapeutic utility of drugs that function through interaction with a receptor is influenced by their MMOA is provided by the tissue-selective functional effects of the selective oestrogen receptor modulators (SERMs), which are mediated by SERM-induced structural changes in the oestrogen receptor14. Binding to the receptor initiates a series of molecular events, which culminate in the activation or repression of specific genes. The SERMs tamoxifen and raloxifene bind at the same site within the core of the ligand-binding domain, but with different bind-ing modes that are translated into distinct conforma-tions of the transactivation domain of the receptor. Transcriptional regulation of the oestrogen receptor is a complex process that involves the participa-tion of co-activators and co-repressors, and the
A N A LY S I S
508 | JULY 2011 | VOLUME 10 www.nature.com/reviews/drugdisc
nrd_3480_jul11.indd 508 22/06/2011 10:16
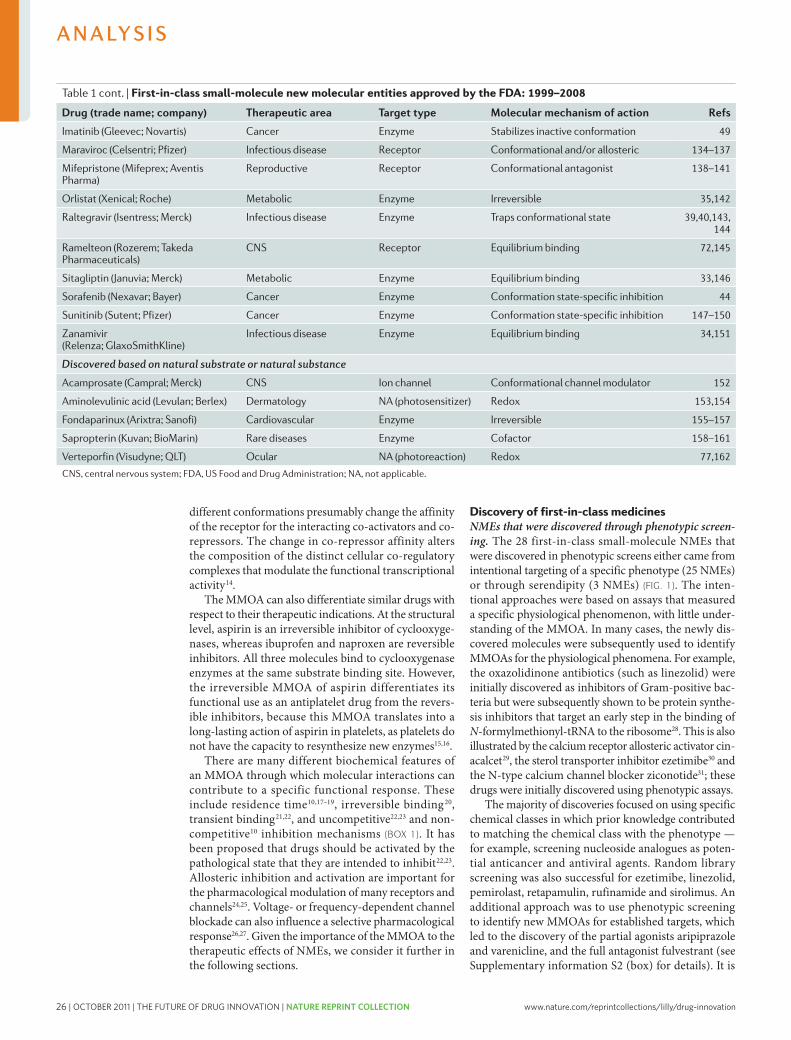
26 | OCTOBER 2011 | THE FUTURE OF DRUG INNOVATION | NATURE REPRINT COLLECTION www.nature.com/reprintcollections/lilly/drug-innovation
worth noting that several of these NMEs (for example, nelarabine, azacitidine and nitazoxanide) were initially described decades before their approval and before the development of new molecular screening approaches. Many of these NMEs were also derived from natural substances, including the nucleoside analogues nelara-bine and azacitidine, the PGE1 derivative lubiprostone and the fatty acid docosanol. Ziconotide, sirolimus and retapamulin were derived from natural products.
NMEs that were developed as synthetic and/or modi-fied versions of natural substances, or discovered by screening such substances. A small fraction of the first-in-class NMEs (5 out of 75) were developed as synthetic versions of natural substances (that were sometimes slightly modified), including the modified heparin fondaparinux, the porphyrin verteporfin, the biopterin cofactor sapropterin, the porphyrin precur-sor aminolevulinic acid and the acetylated homotaurine
Box 1 | Molecular mechanism of action
The molecular mechanism of action (MMOA) is defined here as the interaction between a drug and its target (or targets) that creates a specific response. These specific molecular interactions link structure to function in such a manner as to provide a therapeutically effective and safe response. In this context, the MMOA is differentiated from mechanism of action (MOA), which describes the mechanism in the context of the physiological response — such as antihistamines, anti-inflammatory, and so on.
There are many facets of this interaction that ultimately result in the desired therapeutic outcome. For example, the site of interaction (allosteric or orthosteric), molecular descriptors of the binding interaction (such as affinity and binding kinetics), the functional impact (for example, receptor agonism, modulation or antagonism) and the specificity of the functional outcome (for example, activation of specific signalling pathways) all contribute to the MMOA and affect the ultimate pharmacological response.
Possible MMOAs at a target are listed below, together with selected examples of drugs that act through these MMOAs.
Kinetic mechanismsFor kinetic mechanisms, the pharmacological response to the drug is primarily driven by binding kinetics and residence time at the target12,17–19.
Equilibrium binding. The response to the drug is represented by the equilibrium dissociation constant (Ki) to the target.
The binding has sufficiently fast on and off rates (kon
and koff
) to allow equilibrium to be reached and is thereby sensitive to competition with physiological substrates and/or ligands (for example, bosentan, an endothelin receptor antagonist; and aliskiren, a renin inhibitor)37,38,68.
Slow kinetics. Non-equilibrium and irreversible mechanisms involve slow association and/or dissociation rates (kon
and koff
) that do not allow equilibrium to be reached and are less sensitive to competition with physiological substrates and/or ligands (for example, orlistat binds irreversibly to the active site serine of pancreatic lipase, azacitidine irreversibly binds to DNA methyltransferases and candesartan has a slow dissociation rate from the angiotensin II receptor)17–20,35,63,69.
Conformational mechanismsFor conformational mechanisms, binding of the drug to the target involves a conformational change in the target that couples drug binding to a response (for example, sirolimus binds to the peptidylprolyl isomerase FKBP12, which stabilizes a conformation that subsequently inhibits the kinase activity of mammalian target of rapamycin; and fulvestrant induces a conformation of the oestrogen receptor that is subsequently degraded)8–11,47,70.
Noncompetitive inhibition and/or antagonism. This is a form of MMOA in which the drug binds to a site on the target that is distinct from the physiological substrate- and/or ligand-binding site that results in an inhibition of the response (for example, caspofungin is a noncompetitive inhibitor of 1,3-β-d-glucan synthase owing to the observation that its IC
50
(half-maximal inhibitory concentration) is not influenced by substrate concentrations)68,71.
Uncompetitive inhibition and/or antagonism. An uncompetitive MMOA is contingent on prior activation of the target by the physiological effector (the substrate or the ligand). This means that the same amount of drug blocks higher concentrations of the physiological effector to a greater degree than lower concentrations. For example, memantine is an uncompetitive antagonist that binds only to the activated form of the NMDA receptor. The potency of the inhibition of the NMDA receptor by memantine increases at higher concentrations of glutamate (the physiological ligand) 22,23,68.
Full agonism. Maximal efficacy is produced following drug binding to the receptor and subsequent receptor activation (for example, ramelteon mimics the activity of melatonin for the melatonin receptor through binding at the orthosteric site with efficient coupling to activate specific signalling pathways) 72,73.
Partial agonism. This is a form of MMOA in which only partial efficacy is produced following drug binding to the orthosteric site on the receptor (for example, aripiprazole is a partial agonist of the dopamine D2 receptor and varenciline is a partial agonist of the nicotinic acetylcholine receptors )73,74–76.
Allosteric modulator. This mechanism involves regulation of the biological activity of the target by binding of a drug at a site other than the binding site for the endogenous substrate and/or ligand (allosteric site) (for example, cinacalcet is an allosteric modulator of the calcium receptor by binding to the allosteric site) 29,73.
Redox mechanismsRedox is short for reduction–oxidation reactions in which the pharmacological response to the drug is a consequence of electron transfer between the drug and a physiological target. For example, generation of hydroxyl radicals by verteporfin is thought to contribute to its ability to damage cells, and the antiprotozoal activity of nitazoxanide is believed to be due in part to interference with the pyruvate–ferredoxin oxidoreductase enzyme-dependent electron transfer reaction, which is essential to anaerobic energy metabolism77–79.
A N A LY S I S
NATURE REVIEWS | DRUG DISCOVERY VOLUME 10 | JULY 2011 | 511
nrd_3480_jul11.indd 511 22/06/2011 10:16
different conformations presumably change the affinity of the receptor for the interacting co-activators and co- repressors. The change in co-repressor affinity alters the composition of the distinct cellular co-regulatory complexes that modulate the functional transcriptional activity14.
The MMOA can also differentiate similar drugs with respect to their therapeutic indications. At the structural level, aspirin is an irreversible inhibitor of cyclooxyge-nases, whereas ibuprofen and naproxen are reversible inhibitors. All three molecules bind to cyclooxygenase enzymes at the same substrate binding site. However, the irreversible MMOA of aspirin differentiates its functional use as an antiplatelet drug from the revers-ible inhibitors, because this MMOA translates into a long-lasting action of aspirin in platelets, as platelets do not have the capacity to resynthesize new enzymes15,16.
There are many different biochemical features of an MMOA through which molecular interactions can contribute to a specific functional response. These include residence time10,17–19, irreversible binding20, transient binding21,22, and uncompetitive22,23 and non-competitive10 inhibition mechanisms (BOX 1). It has been proposed that drugs should be activated by the pathological state that they are intended to inhibit22,23. Allosteric inhibition and activation are important for the pharmacological modulation of many receptors and channels24,25. Voltage- or frequency-dependent channel blockade can also influence a selective pharmacological response26,27. Given the importance of the MMOA to the therapeutic effects of NMEs, we consider it further in the following sections.
Discovery of first-in-class medicinesNMEs that were discovered through phenotypic screen-ing. The 28 first-in-class small-molecule NMEs that were discovered in phenotypic screens either came from intentional targeting of a specific phenotype (25 NMEs) or through serendipity (3 NMEs) (FIG. 1). The inten-tional approaches were based on assays that measured a specific physiological phenomenon, with little under-standing of the MMOA. In many cases, the newly dis-covered molecules were subsequently used to identify MMOAs for the physiological phenomena. For example, the oxazolidinone antibiotics (such as linezolid) were initially discovered as inhibitors of Gram-positive bac-teria but were subsequently shown to be protein synthe-sis inhibitors that target an early step in the binding of N-formylmethionyl-tRNA to the ribosome28. This is also illustrated by the calcium receptor allosteric activator cin-acalcet29, the sterol transporter inhibitor ezetimibe30 and the N-type calcium channel blocker ziconotide31; these drugs were initially discovered using phenotypic assays.
The majority of discoveries focused on using specific chemical classes in which prior knowledge contributed to matching the chemical class with the phenotype — for example, screening nucleoside analogues as poten-tial anticancer and antiviral agents. Random library screening was also successful for ezetimibe, linezolid, pemirolast, retapamulin, rufinamide and sirolimus. An additional approach was to use phenotypic screening to identify new MMOAs for established targets, which led to the discovery of the partial agonists aripiprazole and varenicline, and the full antagonist fulvestrant (see Supplementary information S2 (box) for details). It is
Table 1 cont. | First-in-class small-molecule new molecular entities approved by the FDA: 1999–2008
Drug (trade name; company) Therapeutic area Target type Molecular mechanism of action Refs
Imatinib (Gleevec; Novartis) Cancer Enzyme Stabilizes inactive conformation 49
Maraviroc (Celsentri; Pfizer) Infectious disease Receptor Conformational and/or allosteric 134–137
Mifepristone (Mifeprex; Aventis Pharma)
Reproductive Receptor Conformational antagonist 138–141
Orlistat (Xenical; Roche) Metabolic Enzyme Irreversible 35,142
Raltegravir (Isentress; Merck) Infectious disease Enzyme Traps conformational state 39,40,143, 144
Ramelteon (Rozerem; Takeda Pharmaceuticals)
CNS Receptor Equilibrium binding 72,145
Sitagliptin (Januvia; Merck) Metabolic Enzyme Equilibrium binding 33,146
Sorafenib (Nexavar; Bayer) Cancer Enzyme Conformation state-specific inhibition 44
Sunitinib (Sutent; Pfizer) Cancer Enzyme Conformation state-specific inhibition 147–150
Zanamivir (Relenza; GlaxoSmithKline)
Infectious disease Enzyme Equilibrium binding 34,151
Discovered based on natural substrate or natural substance
Acamprosate (Campral; Merck) CNS Ion channel Conformational channel modulator 152
Aminolevulinic acid (Levulan; Berlex) Dermatology NA (photosensitizer) Redox 153,154
Fondaparinux (Arixtra; Sanofi) Cardiovascular Enzyme Irreversible 155–157
Sapropterin (Kuvan; BioMarin) Rare diseases Enzyme Cofactor 158–161
Verteporfin (Visudyne; QLT) Ocular NA (photoreaction) Redox 77,162
CNS, central nervous system; FDA, US Food and Drug Administration; NA, not applicable.
A N A LY S I S
510 | JULY 2011 | VOLUME 10 www.nature.com/reviews/drugdisc
nrd_3480_jul11.indd 510 22/06/2011 10:16
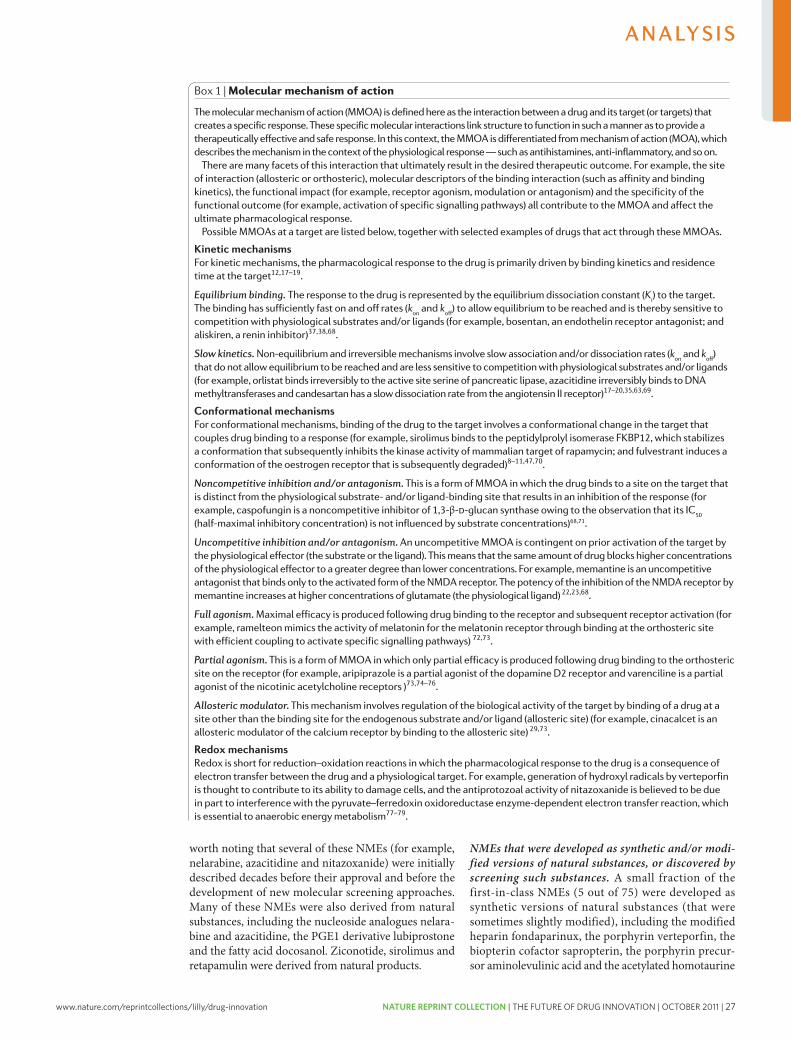
www.nature.com/reprintcollections/lilly/drug-innovation NATURE REPRINT COLLECTION | THE FUTURE OF DRUG INNOVATION | OCTOBER 2011 | 27
worth noting that several of these NMEs (for example, nelarabine, azacitidine and nitazoxanide) were initially described decades before their approval and before the development of new molecular screening approaches. Many of these NMEs were also derived from natural substances, including the nucleoside analogues nelara-bine and azacitidine, the PGE1 derivative lubiprostone and the fatty acid docosanol. Ziconotide, sirolimus and retapamulin were derived from natural products.
NMEs that were developed as synthetic and/or modi-fied versions of natural substances, or discovered by screening such substances. A small fraction of the first-in-class NMEs (5 out of 75) were developed as synthetic versions of natural substances (that were sometimes slightly modified), including the modified heparin fondaparinux, the porphyrin verteporfin, the biopterin cofactor sapropterin, the porphyrin precur-sor aminolevulinic acid and the acetylated homotaurine
Box 1 | Molecular mechanism of action
The molecular mechanism of action (MMOA) is defined here as the interaction between a drug and its target (or targets) that creates a specific response. These specific molecular interactions link structure to function in such a manner as to provide a therapeutically effective and safe response. In this context, the MMOA is differentiated from mechanism of action (MOA), which describes the mechanism in the context of the physiological response — such as antihistamines, anti-inflammatory, and so on.
There are many facets of this interaction that ultimately result in the desired therapeutic outcome. For example, the site of interaction (allosteric or orthosteric), molecular descriptors of the binding interaction (such as affinity and binding kinetics), the functional impact (for example, receptor agonism, modulation or antagonism) and the specificity of the functional outcome (for example, activation of specific signalling pathways) all contribute to the MMOA and affect the ultimate pharmacological response.
Possible MMOAs at a target are listed below, together with selected examples of drugs that act through these MMOAs.
Kinetic mechanismsFor kinetic mechanisms, the pharmacological response to the drug is primarily driven by binding kinetics and residence time at the target12,17–19.
Equilibrium binding. The response to the drug is represented by the equilibrium dissociation constant (Ki) to the target.
The binding has sufficiently fast on and off rates (kon
and koff
) to allow equilibrium to be reached and is thereby sensitive to competition with physiological substrates and/or ligands (for example, bosentan, an endothelin receptor antagonist; and aliskiren, a renin inhibitor)37,38,68.
Slow kinetics. Non-equilibrium and irreversible mechanisms involve slow association and/or dissociation rates (kon
and koff
) that do not allow equilibrium to be reached and are less sensitive to competition with physiological substrates and/or ligands (for example, orlistat binds irreversibly to the active site serine of pancreatic lipase, azacitidine irreversibly binds to DNA methyltransferases and candesartan has a slow dissociation rate from the angiotensin II receptor)17–20,35,63,69.
Conformational mechanismsFor conformational mechanisms, binding of the drug to the target involves a conformational change in the target that couples drug binding to a response (for example, sirolimus binds to the peptidylprolyl isomerase FKBP12, which stabilizes a conformation that subsequently inhibits the kinase activity of mammalian target of rapamycin; and fulvestrant induces a conformation of the oestrogen receptor that is subsequently degraded)8–11,47,70.
Noncompetitive inhibition and/or antagonism. This is a form of MMOA in which the drug binds to a site on the target that is distinct from the physiological substrate- and/or ligand-binding site that results in an inhibition of the response (for example, caspofungin is a noncompetitive inhibitor of 1,3-β-d-glucan synthase owing to the observation that its IC
50
(half-maximal inhibitory concentration) is not influenced by substrate concentrations)68,71.
Uncompetitive inhibition and/or antagonism. An uncompetitive MMOA is contingent on prior activation of the target by the physiological effector (the substrate or the ligand). This means that the same amount of drug blocks higher concentrations of the physiological effector to a greater degree than lower concentrations. For example, memantine is an uncompetitive antagonist that binds only to the activated form of the NMDA receptor. The potency of the inhibition of the NMDA receptor by memantine increases at higher concentrations of glutamate (the physiological ligand) 22,23,68.
Full agonism. Maximal efficacy is produced following drug binding to the receptor and subsequent receptor activation (for example, ramelteon mimics the activity of melatonin for the melatonin receptor through binding at the orthosteric site with efficient coupling to activate specific signalling pathways) 72,73.
Partial agonism. This is a form of MMOA in which only partial efficacy is produced following drug binding to the orthosteric site on the receptor (for example, aripiprazole is a partial agonist of the dopamine D2 receptor and varenciline is a partial agonist of the nicotinic acetylcholine receptors )73,74–76.
Allosteric modulator. This mechanism involves regulation of the biological activity of the target by binding of a drug at a site other than the binding site for the endogenous substrate and/or ligand (allosteric site) (for example, cinacalcet is an allosteric modulator of the calcium receptor by binding to the allosteric site) 29,73.
Redox mechanismsRedox is short for reduction–oxidation reactions in which the pharmacological response to the drug is a consequence of electron transfer between the drug and a physiological target. For example, generation of hydroxyl radicals by verteporfin is thought to contribute to its ability to damage cells, and the antiprotozoal activity of nitazoxanide is believed to be due in part to interference with the pyruvate–ferredoxin oxidoreductase enzyme-dependent electron transfer reaction, which is essential to anaerobic energy metabolism77–79.
A N A LY S I S
NATURE REVIEWS | DRUG DISCOVERY VOLUME 10 | JULY 2011 | 511
nrd_3480_jul11.indd 511 22/06/2011 10:16
different conformations presumably change the affinity of the receptor for the interacting co-activators and co- repressors. The change in co-repressor affinity alters the composition of the distinct cellular co-regulatory complexes that modulate the functional transcriptional activity14.
The MMOA can also differentiate similar drugs with respect to their therapeutic indications. At the structural level, aspirin is an irreversible inhibitor of cyclooxyge-nases, whereas ibuprofen and naproxen are reversible inhibitors. All three molecules bind to cyclooxygenase enzymes at the same substrate binding site. However, the irreversible MMOA of aspirin differentiates its functional use as an antiplatelet drug from the revers-ible inhibitors, because this MMOA translates into a long-lasting action of aspirin in platelets, as platelets do not have the capacity to resynthesize new enzymes15,16.
There are many different biochemical features of an MMOA through which molecular interactions can contribute to a specific functional response. These include residence time10,17–19, irreversible binding20, transient binding21,22, and uncompetitive22,23 and non-competitive10 inhibition mechanisms (BOX 1). It has been proposed that drugs should be activated by the pathological state that they are intended to inhibit22,23. Allosteric inhibition and activation are important for the pharmacological modulation of many receptors and channels24,25. Voltage- or frequency-dependent channel blockade can also influence a selective pharmacological response26,27. Given the importance of the MMOA to the therapeutic effects of NMEs, we consider it further in the following sections.
Discovery of first-in-class medicinesNMEs that were discovered through phenotypic screen-ing. The 28 first-in-class small-molecule NMEs that were discovered in phenotypic screens either came from intentional targeting of a specific phenotype (25 NMEs) or through serendipity (3 NMEs) (FIG. 1). The inten-tional approaches were based on assays that measured a specific physiological phenomenon, with little under-standing of the MMOA. In many cases, the newly dis-covered molecules were subsequently used to identify MMOAs for the physiological phenomena. For example, the oxazolidinone antibiotics (such as linezolid) were initially discovered as inhibitors of Gram-positive bac-teria but were subsequently shown to be protein synthe-sis inhibitors that target an early step in the binding of N-formylmethionyl-tRNA to the ribosome28. This is also illustrated by the calcium receptor allosteric activator cin-acalcet29, the sterol transporter inhibitor ezetimibe30 and the N-type calcium channel blocker ziconotide31; these drugs were initially discovered using phenotypic assays.
The majority of discoveries focused on using specific chemical classes in which prior knowledge contributed to matching the chemical class with the phenotype — for example, screening nucleoside analogues as poten-tial anticancer and antiviral agents. Random library screening was also successful for ezetimibe, linezolid, pemirolast, retapamulin, rufinamide and sirolimus. An additional approach was to use phenotypic screening to identify new MMOAs for established targets, which led to the discovery of the partial agonists aripiprazole and varenicline, and the full antagonist fulvestrant (see Supplementary information S2 (box) for details). It is
Table 1 cont. | First-in-class small-molecule new molecular entities approved by the FDA: 1999–2008
Drug (trade name; company) Therapeutic area Target type Molecular mechanism of action Refs
Imatinib (Gleevec; Novartis) Cancer Enzyme Stabilizes inactive conformation 49
Maraviroc (Celsentri; Pfizer) Infectious disease Receptor Conformational and/or allosteric 134–137
Mifepristone (Mifeprex; Aventis Pharma)
Reproductive Receptor Conformational antagonist 138–141
Orlistat (Xenical; Roche) Metabolic Enzyme Irreversible 35,142
Raltegravir (Isentress; Merck) Infectious disease Enzyme Traps conformational state 39,40,143, 144
Ramelteon (Rozerem; Takeda Pharmaceuticals)
CNS Receptor Equilibrium binding 72,145
Sitagliptin (Januvia; Merck) Metabolic Enzyme Equilibrium binding 33,146
Sorafenib (Nexavar; Bayer) Cancer Enzyme Conformation state-specific inhibition 44
Sunitinib (Sutent; Pfizer) Cancer Enzyme Conformation state-specific inhibition 147–150
Zanamivir (Relenza; GlaxoSmithKline)
Infectious disease Enzyme Equilibrium binding 34,151
Discovered based on natural substrate or natural substance
Acamprosate (Campral; Merck) CNS Ion channel Conformational channel modulator 152
Aminolevulinic acid (Levulan; Berlex) Dermatology NA (photosensitizer) Redox 153,154
Fondaparinux (Arixtra; Sanofi) Cardiovascular Enzyme Irreversible 155–157
Sapropterin (Kuvan; BioMarin) Rare diseases Enzyme Cofactor 158–161
Verteporfin (Visudyne; QLT) Ocular NA (photoreaction) Redox 77,162
CNS, central nervous system; FDA, US Food and Drug Administration; NA, not applicable.
A N A LY S I S
510 | JULY 2011 | VOLUME 10 www.nature.com/reviews/drugdisc
nrd_3480_jul11.indd 510 22/06/2011 10:16
28 | OCTOBER 2011 | THE FUTURE OF DRUG INNOVATION | NATURE REPRINT COLLECTION www.nature.com/reprintcollections/lilly/drug-innovation
β
α
omalizumab, pegvisomant and natalizumab); and deliv-ering other compounds or proteins (denileukin diftitox and gemtuzumab). Thus, the majority of these biologics function by interfering with a molecular activity and, as mentioned above, all of these biologics can be considered to have been discovered using a target-based approach.
Both first-in-class small molecule NMEs and bio-logics were approved for two targets: EGFR kinase (the small-molecule EGFR kinase inhibitor gefitinib and the EGFR-specific monoclonal antibody cetuximab) and TPO (the small-molecule TPO receptor agonist
eltrombopag and the ‘peptibody’ TPO receptor agonist romiplostim). Three first-in-class medicines also act by inhibiting vascular endothelial growth factor (VEGF) signalling: the VEGF-specific monoclonal antibody bevacizumab, and the small-molecule VEGF receptor kinase inhibitors sunitinib, which also inhibits KIT, and sorafenib, which was originally discovered on the basis of its inhibition of RAF kinase44.
Strategies according to disease area. Evaluation of the discovery strategy by disease area showed that a pheno-typic approach was the most successful for central nerv-ous system disorders and infectious diseases, whereas target-based approaches were most successful in can-cer, infectious diseases and metabolic diseases (TABLE 2). Biologics accounted for most of the new medicines that act by modulating the immune system and 50% of the new medicines for cancer.
Discovery of follower drugsThere were 164 follower drugs, out of which 83 (51%) were discovered via target-based approaches, 30 (18%) via phenotypic assays and 31 (19%) were biologics (FIG. 2) (Supplementary information S1 (table)). Seven (4%) of the follower drugs were prodrugs or combinations of previously approved medicines. Considering NMEs alone, target-based approaches accounted for 62% (83 out of 133) of the small-molecule NMEs. The ratio of NMEs from target-based approaches to those from phe-notypic screening increased during the final 4 years of the analysis (FIG. 3b).
Molecular mechanism of action The majority of small-molecule first-in-class NMEs had MMOAs that involved inhibiting the activity of enzymes or modulating receptors (FIG. 4). This trend is consistent with the findings of Imming and colleagues4 in their analysis of the nature and number of all drug targets. The phar-macological responses were often achieved by binding to the target protein to elicit a positive or negative response.
For the first-in-class NMEs and biologics, many different biochemical mechanisms mediated the drug response at the target (BOX 1). These included revers-ible, irreversible and slow binding kinetics; competi-tive, uncompetitive and noncompetitive interactions between physiological substrates/ligands and drugs; as well as inhibition, activation, agonism, partial agonism, allosteric activation and induced degradation.
Illustrative examples in which stimulation of a bio-logical response was achieved included: exenatide, which mimics a natural peptide (glucagon-like peptide 1 (GLP1)) but is resistant to degradation by the protease DPP4 (REF. 45); sitagliptin, which prevents degradation of endogenous GLP1 by inhibiting DPP4 (REF. 33); and cinacalcet, which is an allosteric activator of the calcium-sensing receptor29.
Illustrative examples in which inhibition or antago-nism of a biological response was achieved included: aprepitant, which is a competitive antagonist of the neurokinin-1 receptor46; orlistat, which is an irreversible inhibitor of lipase enzymes35; fulvestrant, which induces
Figure 1 | Discovery strategies used to identify first-in-class medicines. The strategies that were used were categorized as being based on phenotypic screening (a), target-based strategies (b), synthetic versions of natural substances or very close derivatives (c) and biologics (d). Phenotypic strategies were further subdivided into intentional screening with random compound libraries or compound-specific libraries, optimization for molecular mechanism of action (MMOA) and serendipitous discoveries. Drugs that were identified through target-based screening that involved optimization of a natural ligand or identification of the optimal MMOA are highlighted. *Drugs that are derived from natural substances. ‡These medicines have been withdrawn from the market. §Although enfuvirtide and pegvisomant were approved as new molecular entities, for the purpose of this analysis they have been treated as biologics, given that they are both much larger than typical small-molecule drugs (see Supplementary information S2 (box)).
A N A LY S I S
NATURE REVIEWS | DRUG DISCOVERY VOLUME 10 | JULY 2011 | 513
nrd_3480_jul11.indd 513 22/06/2011 10:16
acamprosate (FIG. 1c). Additionally, in some cases, natural substances provided starting points for small-molecule phenotypic screening (10 NMEs (FIG. 1a)) and target-based discovery (3 NMEs (FIG. 1b)). In total, 18 out of the 50 (36%) first-in-class small-molecule NMEs originated from natural substances. These numbers are consistent with those reported by Newman and Cragg32 for the percentage of all medicines derived from natu-ral products, and the supposition that libraries that are derived from natural substances provide good chemi-cal starting points for optimization. For example, two NMEs that were discovered using a target-specific strategy — ramelteon, which targets melatonin recep-tors, and mifepristone, which is a progesterone receptor modulator — were derived from the modification of natural ligands.
Target-based approaches. Target-based approaches led to the discovery of 17 of the 50 first-in-class small-molecule NMEs. Various approaches contributed to these discoveries, and they are illustrated by the fol-lowing examples. Sitagliptin, an inhibitor of the pro-tease dipeptidyl peptidase 4 (DPP4), was discovered in an iterative discovery approach that was aimed at optimizing metabolic properties while retaining effi-cacy33. A computer-assisted drug design strategy that was based on the crystal structure of the influenza viral neuraminidase led to the identification of zanamivir34. A target-directed screening of microbial broths from soil organisms resulted in the discovery of a very potent, selective and irreversible inhibitor of pancreatic lipases, which was named lipstatin (orlistat)35. Eltrombopag was identified by screening small-molecule libraries for the ability to activate a reporter molecule in thrombopoietin (TPO)-dependent cell lines. Lead compounds were ini-tially identified and then optimized for their biological
effect and pharmaceutical properties36. In a programme that was aimed at discovering non-peptide endothelin receptor antagonists, a class of substituted arylsulphon-amidopyrimidines was identified in a chemical com-pound library, which led to the discovery of bosentan37.
However, knowledge of the targets did not necessarily lead to an easy path to discovery. For example, although renin had been a clear target for the treatment of hyper-tension for decades, the development of orally active renin inhibitors, which culminated in the discovery of the NME aliskiren38, was a major challenge.
The development of six of the NMEs that were dis-covered by target-based approaches involved subsequent identification of their effective MMOA at the target that was selected for the initial screening strategies. The kinase inhibitors gefitinib, imatinib, sorafenib and suni-tinib block kinase activation; the HIV integrase inhibi-tor raltegravir traps an intermediate complex between the enzyme and nucleic acid; and maraviroc is an allos-teric antagonist of the the CC chemokine receptor type 5. These inhibitors represent successes of the target-based strategy, but they also highlight that the optimal MMOA at the target may not be apparent at the time of initiating the discovery strategy. For example, the HIV1 integrase inhibitor raltegravir was only discovered after several MMOAs had been investigated using different assay formats39,40. The diketo acids that led to the dis-covery of raltegravir were eventually found to block the strand transfer reaction, and this MMOA provided good in vivo efficacy. The importance of the assay format in the identification of compounds with effective MMOAs at a chosen target is also illustrated by the discovery of gefitinib, which is thought to act by sequestering the EGFR and its ligand into inactive receptor–ligand com-plexes41. Screening for activity in A431 vulval squamous carcinoma cells was the assay format that led to the iden-tification of gefitinib and its MMOA42.
The neurokinin-1 receptor antagonist aprepitant and the proteasome inhibitor bortezomib were originally dis-covered with a view to targeting different indications to those that they were first approved for (Supplementary information S2 (box)). Repositioning was also involved for three of the NMEs that were discovered through phenotypic assays: miglustat, azacitidine and nitisinone (Supplementary information S2 (box)).
Biologics. Biologics that were approved under biolog-ics license applications and large peptide molecules that were approved as NMEs (for example, enfuvirtide and pegvisomant) accounted for 25 (33%) out of the 75 first-in-class medicines (FIG. 1d). The biologics were further categorized according to their pharmacological action as described by Leader, Baca and Golan43. The pharmacological actions of these biologics included enzyme replacement (agalsidase-β, alglucosidase alfa, galsulfase, idursulfase and laronidase), augmenting existing pathways (drotrecogin-α, exenatide, palifermin, pramlintide and romiplostim), providing a novel func-tion (rasburicase), interfering with a molecular activity (alemtuzumab, abatacept, anakinra, alefacept, bevaci-zumab, cetuximab, eculizumab, efalizumab, enfuvirtide,
Box 2 | Biochemical efficiency
The dose of a drug required to achieve the desired physiological response depends on its biochemical efficiency10,11. This is defined as ‘binding affinity/functional response’, which is equivalent to K
i/EC
50 (effector concentration for half-maximal response)
. Good
biochemical efficiency enables efficacy at lower drug concentrations and increases the therapeutic index. It is a property of many approved medicines10,11.
There are many factors that can influence the shift in dose–response curves between binding and functional assays, including:•Pharmacokinetics and ADME (absorption, distribution, metabolism and excretion)
properties
•Assay relevance (is the functional assay appropriate for the target? Are the assays technically accurate?)
•The involvement of the target in the functional readout and biology
•The molecular mechanism of action (MMOA)
Although all of these factors can and do contribute to the relationship between binding affinity and the functional response, the role of the MMOA is not always considered. The concept of biochemical efficiency was introduced to quantify this possibility10,11. When biochemical efficiency is used as a measure of an optimal MMOA, it is important that the other mitigating factors are eliminated. For example, when evaluating biochemical efficiency, the assays must be run in the absence of serum (or plasma) to eliminate the shift in IC
50 (half-maximal inhibitory concentration) owing
to serum protein binding.
A N A LY S I S
512 | JULY 2011 | VOLUME 10 www.nature.com/reviews/drugdisc
nrd_3480_jul11.indd 512 22/06/2011 10:16
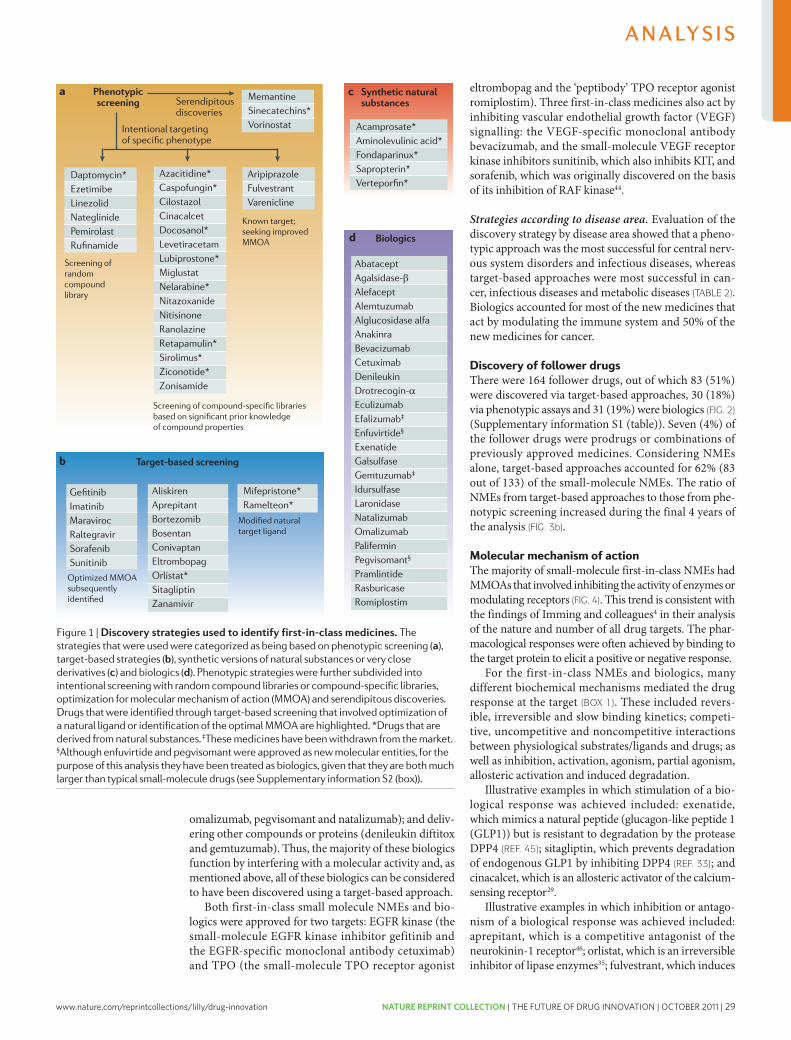
www.nature.com/reprintcollections/lilly/drug-innovation NATURE REPRINT COLLECTION | THE FUTURE OF DRUG INNOVATION | OCTOBER 2011 | 29
β
α
omalizumab, pegvisomant and natalizumab); and deliv-ering other compounds or proteins (denileukin diftitox and gemtuzumab). Thus, the majority of these biologics function by interfering with a molecular activity and, as mentioned above, all of these biologics can be considered to have been discovered using a target-based approach.
Both first-in-class small molecule NMEs and bio-logics were approved for two targets: EGFR kinase (the small-molecule EGFR kinase inhibitor gefitinib and the EGFR-specific monoclonal antibody cetuximab) and TPO (the small-molecule TPO receptor agonist
eltrombopag and the ‘peptibody’ TPO receptor agonist romiplostim). Three first-in-class medicines also act by inhibiting vascular endothelial growth factor (VEGF) signalling: the VEGF-specific monoclonal antibody bevacizumab, and the small-molecule VEGF receptor kinase inhibitors sunitinib, which also inhibits KIT, and sorafenib, which was originally discovered on the basis of its inhibition of RAF kinase44.
Strategies according to disease area. Evaluation of the discovery strategy by disease area showed that a pheno-typic approach was the most successful for central nerv-ous system disorders and infectious diseases, whereas target-based approaches were most successful in can-cer, infectious diseases and metabolic diseases (TABLE 2). Biologics accounted for most of the new medicines that act by modulating the immune system and 50% of the new medicines for cancer.
Discovery of follower drugsThere were 164 follower drugs, out of which 83 (51%) were discovered via target-based approaches, 30 (18%) via phenotypic assays and 31 (19%) were biologics (FIG. 2) (Supplementary information S1 (table)). Seven (4%) of the follower drugs were prodrugs or combinations of previously approved medicines. Considering NMEs alone, target-based approaches accounted for 62% (83 out of 133) of the small-molecule NMEs. The ratio of NMEs from target-based approaches to those from phe-notypic screening increased during the final 4 years of the analysis (FIG. 3b).
Molecular mechanism of action The majority of small-molecule first-in-class NMEs had MMOAs that involved inhibiting the activity of enzymes or modulating receptors (FIG. 4). This trend is consistent with the findings of Imming and colleagues4 in their analysis of the nature and number of all drug targets. The phar-macological responses were often achieved by binding to the target protein to elicit a positive or negative response.
For the first-in-class NMEs and biologics, many different biochemical mechanisms mediated the drug response at the target (BOX 1). These included revers-ible, irreversible and slow binding kinetics; competi-tive, uncompetitive and noncompetitive interactions between physiological substrates/ligands and drugs; as well as inhibition, activation, agonism, partial agonism, allosteric activation and induced degradation.
Illustrative examples in which stimulation of a bio-logical response was achieved included: exenatide, which mimics a natural peptide (glucagon-like peptide 1 (GLP1)) but is resistant to degradation by the protease DPP4 (REF. 45); sitagliptin, which prevents degradation of endogenous GLP1 by inhibiting DPP4 (REF. 33); and cinacalcet, which is an allosteric activator of the calcium-sensing receptor29.
Illustrative examples in which inhibition or antago-nism of a biological response was achieved included: aprepitant, which is a competitive antagonist of the neurokinin-1 receptor46; orlistat, which is an irreversible inhibitor of lipase enzymes35; fulvestrant, which induces
Figure 1 | Discovery strategies used to identify first-in-class medicines. The strategies that were used were categorized as being based on phenotypic screening (a), target-based strategies (b), synthetic versions of natural substances or very close derivatives (c) and biologics (d). Phenotypic strategies were further subdivided into intentional screening with random compound libraries or compound-specific libraries, optimization for molecular mechanism of action (MMOA) and serendipitous discoveries. Drugs that were identified through target-based screening that involved optimization of a natural ligand or identification of the optimal MMOA are highlighted. *Drugs that are derived from natural substances. ‡These medicines have been withdrawn from the market. §Although enfuvirtide and pegvisomant were approved as new molecular entities, for the purpose of this analysis they have been treated as biologics, given that they are both much larger than typical small-molecule drugs (see Supplementary information S2 (box)).
A N A LY S I S
NATURE REVIEWS | DRUG DISCOVERY VOLUME 10 | JULY 2011 | 513
nrd_3480_jul11.indd 513 22/06/2011 10:16
acamprosate (FIG. 1c). Additionally, in some cases, natural substances provided starting points for small-molecule phenotypic screening (10 NMEs (FIG. 1a)) and target-based discovery (3 NMEs (FIG. 1b)). In total, 18 out of the 50 (36%) first-in-class small-molecule NMEs originated from natural substances. These numbers are consistent with those reported by Newman and Cragg32 for the percentage of all medicines derived from natu-ral products, and the supposition that libraries that are derived from natural substances provide good chemi-cal starting points for optimization. For example, two NMEs that were discovered using a target-specific strategy — ramelteon, which targets melatonin recep-tors, and mifepristone, which is a progesterone receptor modulator — were derived from the modification of natural ligands.
Target-based approaches. Target-based approaches led to the discovery of 17 of the 50 first-in-class small-molecule NMEs. Various approaches contributed to these discoveries, and they are illustrated by the fol-lowing examples. Sitagliptin, an inhibitor of the pro-tease dipeptidyl peptidase 4 (DPP4), was discovered in an iterative discovery approach that was aimed at optimizing metabolic properties while retaining effi-cacy33. A computer-assisted drug design strategy that was based on the crystal structure of the influenza viral neuraminidase led to the identification of zanamivir34. A target-directed screening of microbial broths from soil organisms resulted in the discovery of a very potent, selective and irreversible inhibitor of pancreatic lipases, which was named lipstatin (orlistat)35. Eltrombopag was identified by screening small-molecule libraries for the ability to activate a reporter molecule in thrombopoietin (TPO)-dependent cell lines. Lead compounds were ini-tially identified and then optimized for their biological
effect and pharmaceutical properties36. In a programme that was aimed at discovering non-peptide endothelin receptor antagonists, a class of substituted arylsulphon-amidopyrimidines was identified in a chemical com-pound library, which led to the discovery of bosentan37.
However, knowledge of the targets did not necessarily lead to an easy path to discovery. For example, although renin had been a clear target for the treatment of hyper-tension for decades, the development of orally active renin inhibitors, which culminated in the discovery of the NME aliskiren38, was a major challenge.
The development of six of the NMEs that were dis-covered by target-based approaches involved subsequent identification of their effective MMOA at the target that was selected for the initial screening strategies. The kinase inhibitors gefitinib, imatinib, sorafenib and suni-tinib block kinase activation; the HIV integrase inhibi-tor raltegravir traps an intermediate complex between the enzyme and nucleic acid; and maraviroc is an allos-teric antagonist of the the CC chemokine receptor type 5. These inhibitors represent successes of the target-based strategy, but they also highlight that the optimal MMOA at the target may not be apparent at the time of initiating the discovery strategy. For example, the HIV1 integrase inhibitor raltegravir was only discovered after several MMOAs had been investigated using different assay formats39,40. The diketo acids that led to the dis-covery of raltegravir were eventually found to block the strand transfer reaction, and this MMOA provided good in vivo efficacy. The importance of the assay format in the identification of compounds with effective MMOAs at a chosen target is also illustrated by the discovery of gefitinib, which is thought to act by sequestering the EGFR and its ligand into inactive receptor–ligand com-plexes41. Screening for activity in A431 vulval squamous carcinoma cells was the assay format that led to the iden-tification of gefitinib and its MMOA42.
The neurokinin-1 receptor antagonist aprepitant and the proteasome inhibitor bortezomib were originally dis-covered with a view to targeting different indications to those that they were first approved for (Supplementary information S2 (box)). Repositioning was also involved for three of the NMEs that were discovered through phenotypic assays: miglustat, azacitidine and nitisinone (Supplementary information S2 (box)).
Biologics. Biologics that were approved under biolog-ics license applications and large peptide molecules that were approved as NMEs (for example, enfuvirtide and pegvisomant) accounted for 25 (33%) out of the 75 first-in-class medicines (FIG. 1d). The biologics were further categorized according to their pharmacological action as described by Leader, Baca and Golan43. The pharmacological actions of these biologics included enzyme replacement (agalsidase-β, alglucosidase alfa, galsulfase, idursulfase and laronidase), augmenting existing pathways (drotrecogin-α, exenatide, palifermin, pramlintide and romiplostim), providing a novel func-tion (rasburicase), interfering with a molecular activity (alemtuzumab, abatacept, anakinra, alefacept, bevaci-zumab, cetuximab, eculizumab, efalizumab, enfuvirtide,
Box 2 | Biochemical efficiency
The dose of a drug required to achieve the desired physiological response depends on its biochemical efficiency10,11. This is defined as ‘binding affinity/functional response’, which is equivalent to K
i/EC
50 (effector concentration for half-maximal response)
. Good
biochemical efficiency enables efficacy at lower drug concentrations and increases the therapeutic index. It is a property of many approved medicines10,11.
There are many factors that can influence the shift in dose–response curves between binding and functional assays, including:•Pharmacokinetics and ADME (absorption, distribution, metabolism and excretion)
properties
•Assay relevance (is the functional assay appropriate for the target? Are the assays technically accurate?)
•The involvement of the target in the functional readout and biology
•The molecular mechanism of action (MMOA)
Although all of these factors can and do contribute to the relationship between binding affinity and the functional response, the role of the MMOA is not always considered. The concept of biochemical efficiency was introduced to quantify this possibility10,11. When biochemical efficiency is used as a measure of an optimal MMOA, it is important that the other mitigating factors are eliminated. For example, when evaluating biochemical efficiency, the assays must be run in the absence of serum (or plasma) to eliminate the shift in IC
50 (half-maximal inhibitory concentration) owing
to serum protein binding.
A N A LY S I S
512 | JULY 2011 | VOLUME 10 www.nature.com/reviews/drugdisc
nrd_3480_jul11.indd 512 22/06/2011 10:16
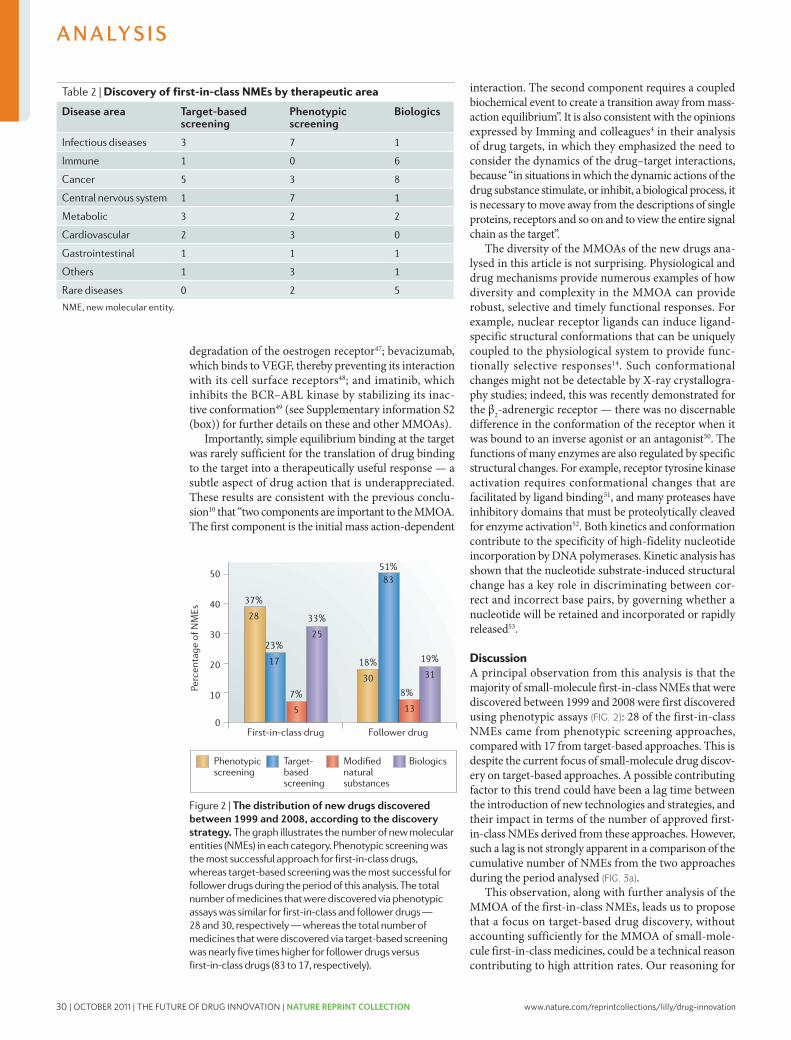
30 | OCTOBER 2011 | THE FUTURE OF DRUG INNOVATION | NATURE REPRINT COLLECTION www.nature.com/reprintcollections/lilly/drug-innovation
this proposal is that the MMOA is a key factor for the success of all approaches, but is addressed in different ways and at different points in the various approaches.
In the more common target-based approach, drug discovery is generally hypothesis-driven, and there are at least three hypotheses that must be correct to result in a new drug. The first hypothesis, which also applies to other discovery approaches, is that activity in the preclinical screens that are used to select a drug candi-date will translate effectively into clinically meaningful activity in patients. The other two hypotheses are that the target that is selected is important in human disease and that the MMOA of drug candidates at the target in question is one that is capable of achieving the desired biological response. Successful target-based discov-ery of first-in-class drugs with tolerable safety profiles requires the time and resources to investigate all three hypotheses. In particular, the importance of hypoth-esis testing to identify an appropriate MMOA may be an underappreciated challenge that — if neglected — could contribute to increased attrition rates for such approaches. In other words, it is clearly difficult to rationally identify the specific molecular interactions from all of the potential dynamic molecular interac-tions that will contribute to an optimal MMOA. Thus, the key biochemical nuances that are important for the translation of the molecular interaction (between a drug and the target) to an optimal pharmacological response could be missed with target-based approaches.
By contrast, in the case of phenotypic-based screening approaches, assuming that a screening assay that trans-lates effectively to human disease is available or can be identified, a potential key advantage of this approach over target-based approaches is that there is no preconceived idea of the MMOA and target hypothesis. This could considerably aid the identification of molecules with appropriate targets (and possibly multiple targets) and MMOAs, which might be less likely to emerge rapidly, if at all, from pursuing a focused target-based hypothesis. However, two limitations of phenotypic-based screening
approaches should also be noted. First, it will often be necessary to characterize the MMOA of active molecules that are identified in phenotypic screens to aid the opti-mization of a drug candidate, but substantial progress has been made in approaches to achieve this — for example, approaches based on RNA interference54,55. Second, phe-notypic assays are often lower in throughput than stand-ard target-based assays, although considerable progress has also been made in recent years to automate such assays and increase their throughput56–58.
Finally, as has often been noted in reviews of the role of natural products in drug discovery32,59, discovery strategies that are based on natural substances have an inherent advantage: the biology, target and MMOA are often likely to be have been optimized already through evolution, and so modifying such substances can be a fruitful approach. Similarly, some of the biologics that have been approved are harnessing endogenous mecha-nisms in a rational way — for example, by providing a natural protein that is reduced in a given disease state, as is the case for enzyme replacement therapies for lyosomal storage disorders. In other cases though, it is apparent that the precise MMOA of biologics might also be important in their biological effects, as illustrated by the differences in the properties of two monoclonal antibodies that target CD20 on B cells60 — rituximab and ofatumumab — although neither of these were approved in the 10-year period we studied. Telling et al.60 conclude that the recognition of a novel epitope cooperates with a slow off-rate in determining the activ-ity of CD20 monoclonal antibodies in the activation of complement and the induction of tumour cell lysis.
The importance of the MMOA is further supported by the evolution of the MMOA within drug classes, from the first-in-class molecule to the best-in-class molecule, which is not widely appreciated. For example, in some cases in which there is no mechanism-based toxicity, the evolution of drugs in a given class towards the best-in-class has been associated with slower dissociation rates at the target. This has been observed with antihistamines
Figure 3 | Cumulative distribution of new drugs by discovery strategy. a | First-in-class drugs. A lag is not strongly apparent in a comparison of the cumulative number of small-molecule new molecular entities (NMEs) that were discovered from the different approaches during the period ana lysed. b | Follower drugs. For follower drugs, the ratio of small-molecule NMEs discovered through target-based screening to those discovered through phenotypic screening appears to increase in the second half of the time period.
A N A LY S I S
NATURE REVIEWS | DRUG DISCOVERY VOLUME 10 | JULY 2011 | 515
nrd_3480_jul11.indd 515 22/06/2011 10:16
degradation of the oestrogen receptor47; bevacizumab, which binds to VEGF, thereby preventing its interaction with its cell surface receptors48; and imatinib, which inhibits the BCR–ABL kinase by stabilizing its inac-tive conformation49 (see Supplementary information S2 (box)) for further details on these and other MMOAs).
Importantly, simple equilibrium binding at the target was rarely sufficient for the translation of drug binding to the target into a therapeutically useful response — a subtle aspect of drug action that is underappreciated. These results are consistent with the previous conclu-sion10 that “two components are important to the MMOA. The first component is the initial mass action-dependent
interaction. The second component requires a coupled biochemical event to create a transition away from mass-action equilibrium”. It is also consistent with the opinions expressed by Imming and colleagues4 in their analysis of drug targets, in which they emphasized the need to consider the dynamics of the drug–target interactions, because “in situations in which the dynamic actions of the drug substance stimulate, or inhibit, a biological process, it is necessary to move away from the descriptions of single proteins, receptors and so on and to view the entire signal chain as the target”.
The diversity of the MMOAs of the new drugs ana-lysed in this article is not surprising. Physiological and drug mechanisms provide numerous examples of how diversity and complexity in the MMOA can provide robust, selective and timely functional responses. For example, nuclear receptor ligands can induce ligand-specific structural conformations that can be uniquely coupled to the physiological system to provide func-tionally selective responses14. Such conformational changes might not be detectable by X-ray crystallogra-phy studies; indeed, this was recently demonstrated for the β2-adrenergic receptor — there was no discernable difference in the conformation of the receptor when it was bound to an inverse agonist or an antagonist50. The functions of many enzymes are also regulated by specific structural changes. For example, receptor tyrosine kinase activation requires conformational changes that are facilitated by ligand binding51, and many proteases have inhibitory domains that must be proteolytically cleaved for enzyme activation52. Both kinetics and conformation contribute to the specificity of high-fidelity nucleotide incorporation by DNA polymerases. Kinetic analysis has shown that the nucleotide substrate-induced structural change has a key role in discriminating between cor-rect and incorrect base pairs, by governing whether a nucleotide will be retained and incorporated or rapidly released53.
DiscussionA principal observation from this analysis is that the majority of small-molecule first-in-class NMEs that were discovered between 1999 and 2008 were first discovered using phenotypic assays (FIG. 2): 28 of the first-in-class NMEs came from phenotypic screening approaches, compared with 17 from target-based approaches. This is despite the current focus of small-molecule drug discov-ery on target-based approaches. A possible contributing factor to this trend could have been a lag time between the introduction of new technologies and strategies, and their impact in terms of the number of approved first-in-class NMEs derived from these approaches. However, such a lag is not strongly apparent in a comparison of the cumulative number of NMEs from the two approaches during the period analysed (FIG. 3a).
This observation, along with further analysis of the MMOA of the first-in-class NMEs, leads us to propose that a focus on target-based drug discovery, without accounting sufficiently for the MMOA of small-mole-cule first-in-class medicines, could be a technical reason contributing to high attrition rates. Our reasoning for
Table 2 | Discovery of first-in-class NMEs by therapeutic area
Disease area Target-based screening
Phenotypic screening
Biologics
Infectious diseases 3 7 1
Immune 1 0 6
Cancer 5 3 8
Central nervous system 1 7 1
Metabolic 3 2 2
Cardiovascular 2 3 0
Gastrointestinal 1 1 1
Others 1 3 1
Rare diseases 0 2 5
NME, new molecular entity.
Figure 2 | The distribution of new drugs discovered between 1999 and 2008, according to the discovery strategy. The graph illustrates the number of new molecular entities (NMEs) in each category. Phenotypic screening was the most successful approach for first-in-class drugs, whereas target-based screening was the most successful for follower drugs during the period of this analysis. The total number of medicines that were discovered via phenotypic assays was similar for first-in-class and follower drugs — 28 and 30, respectively — whereas the total number of medicines that were discovered via target-based screening was nearly five times higher for follower drugs versus first-in-class drugs (83 to 17, respectively).
A N A LY S I S
514 | JULY 2011 | VOLUME 10 www.nature.com/reviews/drugdisc
nrd_3480_jul11.indd 514 22/06/2011 10:16
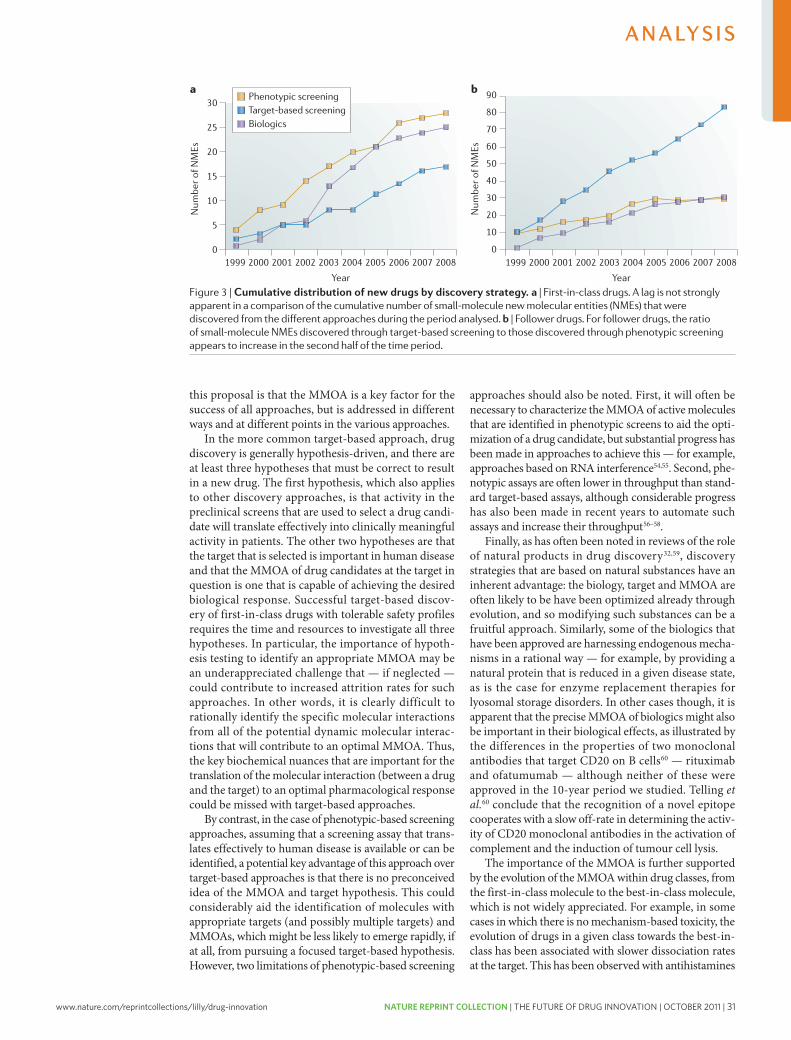
www.nature.com/reprintcollections/lilly/drug-innovation NATURE REPRINT COLLECTION | THE FUTURE OF DRUG INNOVATION | OCTOBER 2011 | 31
this proposal is that the MMOA is a key factor for the success of all approaches, but is addressed in different ways and at different points in the various approaches.
In the more common target-based approach, drug discovery is generally hypothesis-driven, and there are at least three hypotheses that must be correct to result in a new drug. The first hypothesis, which also applies to other discovery approaches, is that activity in the preclinical screens that are used to select a drug candi-date will translate effectively into clinically meaningful activity in patients. The other two hypotheses are that the target that is selected is important in human disease and that the MMOA of drug candidates at the target in question is one that is capable of achieving the desired biological response. Successful target-based discov-ery of first-in-class drugs with tolerable safety profiles requires the time and resources to investigate all three hypotheses. In particular, the importance of hypoth-esis testing to identify an appropriate MMOA may be an underappreciated challenge that — if neglected — could contribute to increased attrition rates for such approaches. In other words, it is clearly difficult to rationally identify the specific molecular interactions from all of the potential dynamic molecular interac-tions that will contribute to an optimal MMOA. Thus, the key biochemical nuances that are important for the translation of the molecular interaction (between a drug and the target) to an optimal pharmacological response could be missed with target-based approaches.
By contrast, in the case of phenotypic-based screening approaches, assuming that a screening assay that trans-lates effectively to human disease is available or can be identified, a potential key advantage of this approach over target-based approaches is that there is no preconceived idea of the MMOA and target hypothesis. This could considerably aid the identification of molecules with appropriate targets (and possibly multiple targets) and MMOAs, which might be less likely to emerge rapidly, if at all, from pursuing a focused target-based hypothesis. However, two limitations of phenotypic-based screening
approaches should also be noted. First, it will often be necessary to characterize the MMOA of active molecules that are identified in phenotypic screens to aid the opti-mization of a drug candidate, but substantial progress has been made in approaches to achieve this — for example, approaches based on RNA interference54,55. Second, phe-notypic assays are often lower in throughput than stand-ard target-based assays, although considerable progress has also been made in recent years to automate such assays and increase their throughput56–58.
Finally, as has often been noted in reviews of the role of natural products in drug discovery32,59, discovery strategies that are based on natural substances have an inherent advantage: the biology, target and MMOA are often likely to be have been optimized already through evolution, and so modifying such substances can be a fruitful approach. Similarly, some of the biologics that have been approved are harnessing endogenous mecha-nisms in a rational way — for example, by providing a natural protein that is reduced in a given disease state, as is the case for enzyme replacement therapies for lyosomal storage disorders. In other cases though, it is apparent that the precise MMOA of biologics might also be important in their biological effects, as illustrated by the differences in the properties of two monoclonal antibodies that target CD20 on B cells60 — rituximab and ofatumumab — although neither of these were approved in the 10-year period we studied. Telling et al.60 conclude that the recognition of a novel epitope cooperates with a slow off-rate in determining the activ-ity of CD20 monoclonal antibodies in the activation of complement and the induction of tumour cell lysis.
The importance of the MMOA is further supported by the evolution of the MMOA within drug classes, from the first-in-class molecule to the best-in-class molecule, which is not widely appreciated. For example, in some cases in which there is no mechanism-based toxicity, the evolution of drugs in a given class towards the best-in-class has been associated with slower dissociation rates at the target. This has been observed with antihistamines
Figure 3 | Cumulative distribution of new drugs by discovery strategy. a | First-in-class drugs. A lag is not strongly apparent in a comparison of the cumulative number of small-molecule new molecular entities (NMEs) that were discovered from the different approaches during the period ana lysed. b | Follower drugs. For follower drugs, the ratio of small-molecule NMEs discovered through target-based screening to those discovered through phenotypic screening appears to increase in the second half of the time period.
A N A LY S I S
NATURE REVIEWS | DRUG DISCOVERY VOLUME 10 | JULY 2011 | 515
nrd_3480_jul11.indd 515 22/06/2011 10:16
degradation of the oestrogen receptor47; bevacizumab, which binds to VEGF, thereby preventing its interaction with its cell surface receptors48; and imatinib, which inhibits the BCR–ABL kinase by stabilizing its inac-tive conformation49 (see Supplementary information S2 (box)) for further details on these and other MMOAs).
Importantly, simple equilibrium binding at the target was rarely sufficient for the translation of drug binding to the target into a therapeutically useful response — a subtle aspect of drug action that is underappreciated. These results are consistent with the previous conclu-sion10 that “two components are important to the MMOA. The first component is the initial mass action-dependent
interaction. The second component requires a coupled biochemical event to create a transition away from mass-action equilibrium”. It is also consistent with the opinions expressed by Imming and colleagues4 in their analysis of drug targets, in which they emphasized the need to consider the dynamics of the drug–target interactions, because “in situations in which the dynamic actions of the drug substance stimulate, or inhibit, a biological process, it is necessary to move away from the descriptions of single proteins, receptors and so on and to view the entire signal chain as the target”.
The diversity of the MMOAs of the new drugs ana-lysed in this article is not surprising. Physiological and drug mechanisms provide numerous examples of how diversity and complexity in the MMOA can provide robust, selective and timely functional responses. For example, nuclear receptor ligands can induce ligand-specific structural conformations that can be uniquely coupled to the physiological system to provide func-tionally selective responses14. Such conformational changes might not be detectable by X-ray crystallogra-phy studies; indeed, this was recently demonstrated for the β2-adrenergic receptor — there was no discernable difference in the conformation of the receptor when it was bound to an inverse agonist or an antagonist50. The functions of many enzymes are also regulated by specific structural changes. For example, receptor tyrosine kinase activation requires conformational changes that are facilitated by ligand binding51, and many proteases have inhibitory domains that must be proteolytically cleaved for enzyme activation52. Both kinetics and conformation contribute to the specificity of high-fidelity nucleotide incorporation by DNA polymerases. Kinetic analysis has shown that the nucleotide substrate-induced structural change has a key role in discriminating between cor-rect and incorrect base pairs, by governing whether a nucleotide will be retained and incorporated or rapidly released53.
DiscussionA principal observation from this analysis is that the majority of small-molecule first-in-class NMEs that were discovered between 1999 and 2008 were first discovered using phenotypic assays (FIG. 2): 28 of the first-in-class NMEs came from phenotypic screening approaches, compared with 17 from target-based approaches. This is despite the current focus of small-molecule drug discov-ery on target-based approaches. A possible contributing factor to this trend could have been a lag time between the introduction of new technologies and strategies, and their impact in terms of the number of approved first-in-class NMEs derived from these approaches. However, such a lag is not strongly apparent in a comparison of the cumulative number of NMEs from the two approaches during the period analysed (FIG. 3a).
This observation, along with further analysis of the MMOA of the first-in-class NMEs, leads us to propose that a focus on target-based drug discovery, without accounting sufficiently for the MMOA of small-mole-cule first-in-class medicines, could be a technical reason contributing to high attrition rates. Our reasoning for
Table 2 | Discovery of first-in-class NMEs by therapeutic area
Disease area Target-based screening
Phenotypic screening
Biologics
Infectious diseases 3 7 1
Immune 1 0 6
Cancer 5 3 8
Central nervous system 1 7 1
Metabolic 3 2 2
Cardiovascular 2 3 0
Gastrointestinal 1 1 1
Others 1 3 1
Rare diseases 0 2 5
NME, new molecular entity.
Figure 2 | The distribution of new drugs discovered between 1999 and 2008, according to the discovery strategy. The graph illustrates the number of new molecular entities (NMEs) in each category. Phenotypic screening was the most successful approach for first-in-class drugs, whereas target-based screening was the most successful for follower drugs during the period of this analysis. The total number of medicines that were discovered via phenotypic assays was similar for first-in-class and follower drugs — 28 and 30, respectively — whereas the total number of medicines that were discovered via target-based screening was nearly five times higher for follower drugs versus first-in-class drugs (83 to 17, respectively).
A N A LY S I S
514 | JULY 2011 | VOLUME 10 www.nature.com/reviews/drugdisc
nrd_3480_jul11.indd 514 22/06/2011 10:16
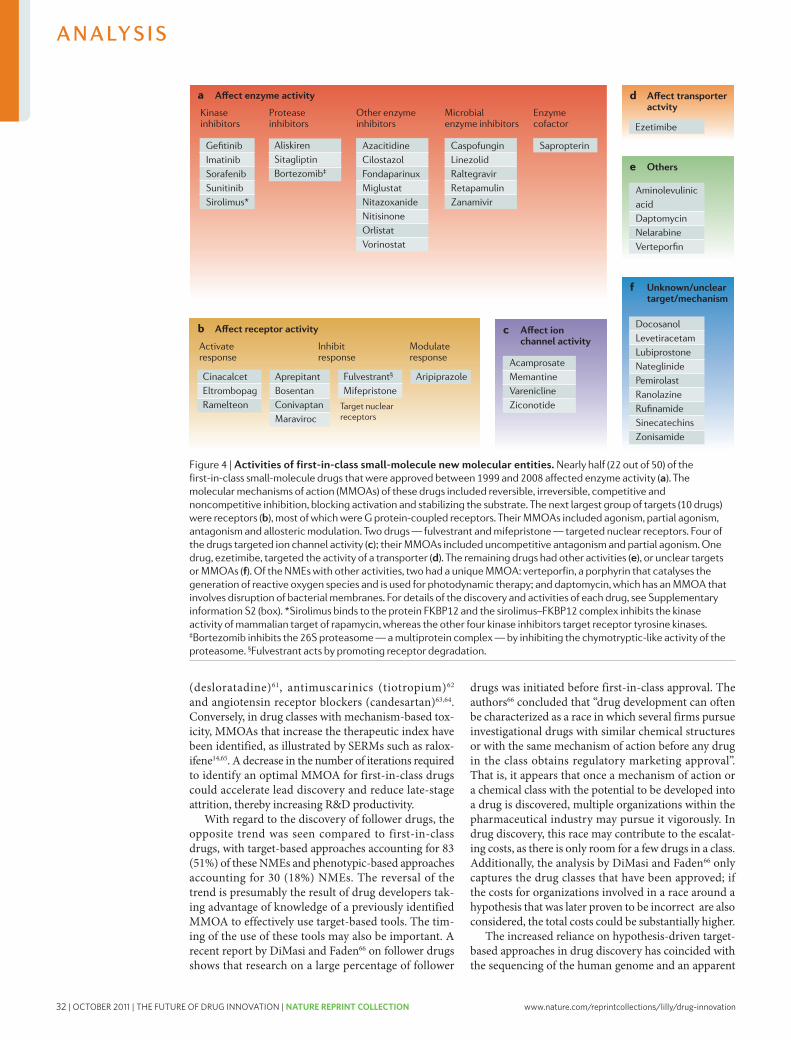
32 | OCTOBER 2011 | THE FUTURE OF DRUG INNOVATION | NATURE REPRINT COLLECTION www.nature.com/reprintcollections/lilly/drug-innovation
belief by some that every target can provide the basis for a drug. As such, research across the pharmaceutical industry as well as academic institutions has increas-ingly focused on targets, arguably at the expense of the development of preclinical assays that translate more effectively into clinical effects in patients with a specific disease. In our analysis, we found that there are numerous diverse MMOAs for approved new first-in-class drugs, but drug discovery at present appears to be dominated by a ‘one size fits all’ approach, in which drugs are optimized for binding affinity with less consideration for binding kinetics and conformation. For optimal application of target-based approaches, it is important to consider how efficiently binding is coupled to the response (BOX 2). However, the molecular descriptors for the coupling fac-tors may not be accurately captured by only consider-ing binding affinity. Furthermore, an excessive focus on affinity at a given target could lead to compromises being made in pharmacokinetic properties that are critical for
the success of drugs, which has also been postulated to be an underlying factor for current attrition rates67.
Reducing the impact of technical uncertainty on the later, more costly stages of drug development through a ‘quick win/fast fail’ strategy has been proposed as a solu-tion to the current problems with R&D productivity2. However, this strategy does not address the key issues that contribute to the greater technical uncertainty and associated risk of failure. Our analysis leads us to conclude that the identification of an optimal MMOA has been a key factor contributing to the success of phenotypic screening in the discovery of the first-in-class NMEs in the 10-year period we studied. Thus, we consider that technical risk and, consequently, overall attrition in drug development could be decreased for first-in-class drugs through the development and greater use of translational phenotypic assays, and by considering diverse MMOAs when using a target-based, hypothesis-driven strategy.
1. Munos, B. Lessons for 60 years of pharmaceutical innovation. Nature Rev. Drug Discov. 8, 959–968 (2009).
2. Paul, S. M. et al. How to improve R.&D productivity: the pharmaceutical industry’s grand challenge. Nature Rev. Drug Discov. 9, 203–214 (2010).
3. Lindsay, M. A. Target discovery. Nature Rev. Drug Discov. 2, 831–838 (2003).
4. Imming, P., Sinning, C. & Meyer A. Drugs, their targets and the nature and number of drug targets. Nature Rev. Drug Discov. 5, 821–834 (2006).
5. Overington, J. P., Al-Lazikani, B. & Hopkins, A. L. How many drug targets are there? Nature Rev. Drug Discov. 5, 993–996 (2006).
6. Williams, M. Systems and integrative biology as alternative guises for pharmacology: prime time for an iPharm concept? Biochem. Pharmacol. 70, 1707–1716 (2005).
7. Flordellis, C. S., Manolis, A. S., Paris, H. & Karabinis, A. Rethinking target discovery in polygenic diseases. Curr. Top. Med. Chem. 6, 1791–1798 (2006).
8. Urban, J. D. et al. Functional selectivity and classical concepts of quantitative pharmacology J. Pharmacol. Exp. Ther. 320, 1–13 (2007).Formalizes the concept of functional selectivity, whereby multiple unique ligands can bind to one receptor to initiate different responses.
9. Kenakin, T. & Miller, L. J. Seven transmembrane receptors as shapeshifting proteins: the impact of allosteric modulation and functional selectivity on drug discovery. Pharmacol. Rev. 62, 265–304 (2010).
10. Swinney, D. C. Biochemical mechanisms of drug action: what does it take for success? Nature Rev. Drug Discov. 3, 801–808 (2004).Describes how the MMOA influences the therapeutic index and utility of a medicine and introduces biochemical efficiency as a metric to quantify this influence.
11. Swinney, D. C. Biochemical mechanisms of new molecular entities (NMEs) approved by United States FDA during 2001–2004: mechanisms leading to optimal efficacy and safety. Curr. Top. Med. Chem. 6, 461–478 (2006).
12. Swinney, D. C. Applications of binding kinetics to drug discovery: translation of binding mechanism to clinically differentiated therapeutic responses. Pharm. Med. 22, 23–34 (2008).
13. Yun, C.H. et al. The T790M mutation in EGFR kinase causes drug resistance by increasing the affinity for ATP. Proc. Natl Acad. Sci. USA 105, 2070–2075 (2008).Provides an illustration of how drug resistance could be overcome through an understanding of the MMOA.
14. Brzozowski, A. M. et al. Molecular basis of agonism and antagonism in the oestrogen receptor. Nature 389, 753–758 (1997).Shows structurally how agonists and antagonists bind at the same site but with different binding modes that result in different responses.
15. Roth, G. J. & Majerus, P. W. The mechanism of the effect of aspirin on human platelets. I. Acetylation of a particulate fraction protein. J. Clin. Invest. 56, 624–632 (1975).
16. Majerus, P. W., Broze, G. J. Jr, Miletich, J. P. & Tollefsen, D. M. in Goodman & Gilman’s The pharmacological basis of therapeutics. (eds Hardman, J. G. & Limbird, L. E.)1353 (McGraw-Hill, New York, 1996).
17. Copeland, R. A., Pompliano, D. L. & Meek, T. D. Drug-target residence time and its implications for lead optimization. Nature Rev. Drug Discov. 5, 730–739 (2006).
18. Timmino, P. J. & Copeland, R. A. Residence time of receptor–ligand complexes and its effect on biological function. Biochemistry 47, 5481–5492 (2008).
19. Lu, H. & Tonge, P. J. Drug-target residence time: critical information for lead optimization. Curr. Opin. Chem. Biol. 14, 1–8 (2010).
20. Johnson, D. S., Weerapana, E. & Cravatt, B. F. Strategies for discovering and derisking covalent, irreversible enzyme inhibitors. Future Med. Chem. 2, 949–964 (2010).
21. Ohlson, S. Designing transient binding drugs: a new concept for drug discovery. Drug Discov. Today 13, 433–439 (2008).
22. Lipton, S. A. Paradigm shift in neuroprotection by NMDA receptor blockade: Memantine and beyond. Nature Rev. Drug Discov. 5, 160–170 (2006).
23. Lipton, S. A. Pathology activated therapeutics for neuroprotection. Nature Rev. Neurosci. 8, 803–808 (2007).Describes the principle that drugs should be activated by the pathological state that they are intended to inhibit.
24. Changeux, J. P. Allosteric receptors: from electric organ to cognition. Annu. Rev. Pharmacol. Toxicol. 50, 1–38 (2010).
25. Conn, J. P., Christopoulos, A. & Lindsley, C. W. Allosteric modulators of GPCRs: a novel approach for the treatment of CNS disorders. Nature Rev. Drug Discov. 8, 41–54 (2009).
26. Hanck, D. A. et al. Using lidocaine and benzocaine to link sodium channel molecular conformations to state-dependent antiarrhythic drug affinity. Circ. Res. 105, 492–499 (2009).
27. Butterworth, J. F. & Strichartz, G. R. Molecular mechanisms of local anesthesia: a review. Anesthesiology 72, 711–734 (1990).
28. Wilson, D. N. et al. The oxazolidinone antibiotics perturb the ribosomal peptidyl-transferase center and effect tRNA positioning. Proc. Natl Acad. Sci. USA 105, 13339–13344 (2008).
29. Nemeth, E. F. Misconceptions about calcimimetics. Ann. NY Acad. Sci. 1068, 471–476 (2006).Discusses lessons learned in the discovery of cinacalcet, with emphasis on the importance of using an understanding of physiology.
30. Salisbury, B. G. et al. Hypocholesterolemic activity of a novel inhibitor of cholesterol absorption, SCH 48461. Athlerosclerosis 115, 45–63 (1995).
31. Valentino, D. et al. A selective N-type calcium channel antagonist protects against neuronal loss after global cerebral ischemia. Proc. Natl Acad. Sci. USA 90, 7894–7897 (1993).
32. Newman, D. J. & Cragg, G. M. Natural products as sources of new drugs over the last 25 years. J. Nat. Prod. 70, 461–477 (2007).Describes the successes of natural products as a source for new drugs.
33. Deacon, C. F. Therapeutic strategies based on glucagon-like peptide-1. Diabetes 53, 2181–2189 (2004).
34. Von Itzstein, M. et al. Rational design of potent sialidase-based inhibitors of influenza virus replication. Nature 363, 418–423 (1993).
35. Weibel, E. K., Hadvary, P., Hochuli, E., Kupfer, E. & Lengsfeld, H. Lipstatin, an inhibitor of pancreatic lipase produced by Streptomyces toxytricini. 1. Producing organism, fermentation, isolation and biological activity. J. Antibiot. 40, 1081–1086 (1987).
36. Kluter, D. J. New thrombopoietic growth factors. Blood 109, 4607–4616 (2007).
37. Remuzzi, G. et al. New therapeutics that antagonize endothelin: promises and frustrations. Nature Rev. Drug Discov. 1, 986–1001 (2002).
38. Wood, J. M. et al. Structure-based design of aliskiren, a novel orally effective renin inhibitor. Biochem. Biophys. Res. Commun. 308, 698–705 (2003).
39. Pommier, Y. et al. Integrase inhibitors to treat HIV/AIDS. Nature Rev. Drug Discov. 4, 236–248 (2005).
40. Espeseth, A. S. et al. HIV-1 integrase inhibitors that compete with the target DNA substrate define a unique strand transfer conformation for integrase. Proc. Natl Acad. Sci. USA 97, 11244–11249 (2000).
41. Lichtner, R. B. et al. Signaling-inactive epidermal growth factor receptor/ligand complexes in intact carcinoma cells by quinazoline kinase inhibitors. Cancer Res. 61, 5790–5795 (2001).
42. Barker, A. J. et al. Studies leading to the identification of ZD1830 (IressaTM): an orally active, selective epidermal growth factor receptor tyrosine kinase inhibitor targeted to the treatment of cancer. Bioorg. Med. Chem. Lett. 11, 1911–1914 (2001).
43. Leader, B., Baca, Q. J. & Golan, D. E. Protein therapeutics: a summary and pharmacological classification. Nature Rev. Drug Discov. 7, 21–39 (2008).
44. Wilhelm, S. et al. Discovery and development of sorafenib: a multikinase inhibitor for treating cancer. Nature Rev. Drug Discov 5, 835–844 (2006).
45. Goke, R. et al. Exendin-4 is a high potency agonist and truncated exendin-(9–39)-amide an antagonist at the glucagon-like peptide 1-(7–36)-amide receptor of insulin-secreting β-cells. J. Biol. Chem. 268, 19650–19655 (1993).
46. Alvaro, G. & Di Fabio, R. Neurokinin 1 receptor antagonists — current prospects. Curr. Opin. Drug Discov. Dev. 10, 613–621 (2007).
A N A LY S I S
NATURE REVIEWS | DRUG DISCOVERY VOLUME 10 | JULY 2011 | 517
nrd_3480_jul11.indd 517 22/06/2011 10:16
(desloratadine)61, antimuscarinics (tiotropium)62 and angiotensin receptor blockers (candesartan)63,64. Conversely, in drug classes with mechanism-based tox-icity, MMOAs that increase the therapeutic index have been identified, as illustrated by SERMs such as ralox-ifene14,65. A decrease in the number of iterations required to identify an optimal MMOA for first-in-class drugs could accelerate lead discovery and reduce late-stage attrition, thereby increasing R&D productivity.
With regard to the discovery of follower drugs, the opposite trend was seen compared to first-in-class drugs, with target-based approaches accounting for 83 (51%) of these NMEs and phenotypic-based approaches accounting for 30 (18%) NMEs. The reversal of the trend is presumably the result of drug developers tak-ing advantage of knowledge of a previously identified MMOA to effectively use target-based tools. The tim-ing of the use of these tools may also be important. A recent report by DiMasi and Faden66 on follower drugs shows that research on a large percentage of follower
drugs was initiated before first-in-class approval. The authors66 concluded that “drug development can often be characterized as a race in which several firms pursue investigational drugs with similar chemical structures or with the same mechanism of action before any drug in the class obtains regulatory marketing approval”. That is, it appears that once a mechanism of action or a chemical class with the potential to be developed into a drug is discovered, multiple organizations within the pharmaceutical industry may pursue it vigorously. In drug discovery, this race may contribute to the escalat-ing costs, as there is only room for a few drugs in a class. Additionally, the analysis by DiMasi and Faden66 only captures the drug classes that have been approved; if the costs for organizations involved in a race around a hypothesis that was later proven to be incorrect are also considered, the total costs could be substantially higher.
The increased reliance on hypothesis-driven target-based approaches in drug discovery has coincided with the sequencing of the human genome and an apparent
Figure 4 | Activities of first-in-class small-molecule new molecular entities. Nearly half (22 out of 50) of the first-in-class small-molecule drugs that were approved between 1999 and 2008 affected enzyme activity (a). The molecular mechanisms of action (MMOAs) of these drugs included reversible, irreversible, competitive and noncompetitive inhibition, blocking activation and stabilizing the substrate. The next largest group of targets (10 drugs) were receptors (b), most of which were G protein-coupled receptors. Their MMOAs included agonism, partial agonism, antagonism and allosteric modulation. Two drugs — fulvestrant and mifepristone — targeted nuclear receptors. Four of the drugs targeted ion channel activity (c); their MMOAs included uncompetitive antagonism and partial agonism. One drug, ezetimibe, targeted the activity of a transporter (d). The remaining drugs had other activities (e), or unclear targets or MMOAs (f). Of the NMEs with other activities, two had a unique MMOA: verteporfin, a porphyrin that catalyses the generation of reactive oxygen species and is used for photodynamic therapy; and daptomycin, which has an MMOA that involves disruption of bacterial membranes. For details of the discovery and activities of each drug, see Supplementary information S2 (box). *Sirolimus binds to the protein FKBP12 and the sirolimus–FKBP12 complex inhibits the kinase activity of mammalian target of rapamycin, whereas the other four kinase inhibitors target receptor tyrosine kinases. ‡Bortezomib inhibits the 26S proteasome — a multiprotein complex — by inhibiting the chymotryptic-like activity of the proteasome. §Fulvestrant acts by promoting receptor degradation.
A N A LY S I S
516 | JULY 2011 | VOLUME 10 www.nature.com/reviews/drugdisc
nrd_3480_jul11.indd 516 22/06/2011 10:16
www.nature.com/reprintcollections/lilly/drug-innovation NATURE REPRINT COLLECTION | THE FUTURE OF DRUG INNOVATION | OCTOBER 2011 | 33
belief by some that every target can provide the basis for a drug. As such, research across the pharmaceutical industry as well as academic institutions has increas-ingly focused on targets, arguably at the expense of the development of preclinical assays that translate more effectively into clinical effects in patients with a specific disease. In our analysis, we found that there are numerous diverse MMOAs for approved new first-in-class drugs, but drug discovery at present appears to be dominated by a ‘one size fits all’ approach, in which drugs are optimized for binding affinity with less consideration for binding kinetics and conformation. For optimal application of target-based approaches, it is important to consider how efficiently binding is coupled to the response (BOX 2). However, the molecular descriptors for the coupling fac-tors may not be accurately captured by only consider-ing binding affinity. Furthermore, an excessive focus on affinity at a given target could lead to compromises being made in pharmacokinetic properties that are critical for
the success of drugs, which has also been postulated to be an underlying factor for current attrition rates67.
Reducing the impact of technical uncertainty on the later, more costly stages of drug development through a ‘quick win/fast fail’ strategy has been proposed as a solu-tion to the current problems with R&D productivity2. However, this strategy does not address the key issues that contribute to the greater technical uncertainty and associated risk of failure. Our analysis leads us to conclude that the identification of an optimal MMOA has been a key factor contributing to the success of phenotypic screening in the discovery of the first-in-class NMEs in the 10-year period we studied. Thus, we consider that technical risk and, consequently, overall attrition in drug development could be decreased for first-in-class drugs through the development and greater use of translational phenotypic assays, and by considering diverse MMOAs when using a target-based, hypothesis-driven strategy.
1. Munos, B. Lessons for 60 years of pharmaceutical innovation. Nature Rev. Drug Discov. 8, 959–968 (2009).
2. Paul, S. M. et al. How to improve R.&D productivity: the pharmaceutical industry’s grand challenge. Nature Rev. Drug Discov. 9, 203–214 (2010).
3. Lindsay, M. A. Target discovery. Nature Rev. Drug Discov. 2, 831–838 (2003).
4. Imming, P., Sinning, C. & Meyer A. Drugs, their targets and the nature and number of drug targets. Nature Rev. Drug Discov. 5, 821–834 (2006).
5. Overington, J. P., Al-Lazikani, B. & Hopkins, A. L. How many drug targets are there? Nature Rev. Drug Discov. 5, 993–996 (2006).
6. Williams, M. Systems and integrative biology as alternative guises for pharmacology: prime time for an iPharm concept? Biochem. Pharmacol. 70, 1707–1716 (2005).
7. Flordellis, C. S., Manolis, A. S., Paris, H. & Karabinis, A. Rethinking target discovery in polygenic diseases. Curr. Top. Med. Chem. 6, 1791–1798 (2006).
8. Urban, J. D. et al. Functional selectivity and classical concepts of quantitative pharmacology J. Pharmacol. Exp. Ther. 320, 1–13 (2007).Formalizes the concept of functional selectivity, whereby multiple unique ligands can bind to one receptor to initiate different responses.
9. Kenakin, T. & Miller, L. J. Seven transmembrane receptors as shapeshifting proteins: the impact of allosteric modulation and functional selectivity on drug discovery. Pharmacol. Rev. 62, 265–304 (2010).
10. Swinney, D. C. Biochemical mechanisms of drug action: what does it take for success? Nature Rev. Drug Discov. 3, 801–808 (2004).Describes how the MMOA influences the therapeutic index and utility of a medicine and introduces biochemical efficiency as a metric to quantify this influence.
11. Swinney, D. C. Biochemical mechanisms of new molecular entities (NMEs) approved by United States FDA during 2001–2004: mechanisms leading to optimal efficacy and safety. Curr. Top. Med. Chem. 6, 461–478 (2006).
12. Swinney, D. C. Applications of binding kinetics to drug discovery: translation of binding mechanism to clinically differentiated therapeutic responses. Pharm. Med. 22, 23–34 (2008).
13. Yun, C.H. et al. The T790M mutation in EGFR kinase causes drug resistance by increasing the affinity for ATP. Proc. Natl Acad. Sci. USA 105, 2070–2075 (2008).Provides an illustration of how drug resistance could be overcome through an understanding of the MMOA.
14. Brzozowski, A. M. et al. Molecular basis of agonism and antagonism in the oestrogen receptor. Nature 389, 753–758 (1997).Shows structurally how agonists and antagonists bind at the same site but with different binding modes that result in different responses.
15. Roth, G. J. & Majerus, P. W. The mechanism of the effect of aspirin on human platelets. I. Acetylation of a particulate fraction protein. J. Clin. Invest. 56, 624–632 (1975).
16. Majerus, P. W., Broze, G. J. Jr, Miletich, J. P. & Tollefsen, D. M. in Goodman & Gilman’s The pharmacological basis of therapeutics. (eds Hardman, J. G. & Limbird, L. E.)1353 (McGraw-Hill, New York, 1996).
17. Copeland, R. A., Pompliano, D. L. & Meek, T. D. Drug-target residence time and its implications for lead optimization. Nature Rev. Drug Discov. 5, 730–739 (2006).
18. Timmino, P. J. & Copeland, R. A. Residence time of receptor–ligand complexes and its effect on biological function. Biochemistry 47, 5481–5492 (2008).
19. Lu, H. & Tonge, P. J. Drug-target residence time: critical information for lead optimization. Curr. Opin. Chem. Biol. 14, 1–8 (2010).
20. Johnson, D. S., Weerapana, E. & Cravatt, B. F. Strategies for discovering and derisking covalent, irreversible enzyme inhibitors. Future Med. Chem. 2, 949–964 (2010).
21. Ohlson, S. Designing transient binding drugs: a new concept for drug discovery. Drug Discov. Today 13, 433–439 (2008).
22. Lipton, S. A. Paradigm shift in neuroprotection by NMDA receptor blockade: Memantine and beyond. Nature Rev. Drug Discov. 5, 160–170 (2006).
23. Lipton, S. A. Pathology activated therapeutics for neuroprotection. Nature Rev. Neurosci. 8, 803–808 (2007).Describes the principle that drugs should be activated by the pathological state that they are intended to inhibit.
24. Changeux, J. P. Allosteric receptors: from electric organ to cognition. Annu. Rev. Pharmacol. Toxicol. 50, 1–38 (2010).
25. Conn, J. P., Christopoulos, A. & Lindsley, C. W. Allosteric modulators of GPCRs: a novel approach for the treatment of CNS disorders. Nature Rev. Drug Discov. 8, 41–54 (2009).
26. Hanck, D. A. et al. Using lidocaine and benzocaine to link sodium channel molecular conformations to state-dependent antiarrhythic drug affinity. Circ. Res. 105, 492–499 (2009).
27. Butterworth, J. F. & Strichartz, G. R. Molecular mechanisms of local anesthesia: a review. Anesthesiology 72, 711–734 (1990).
28. Wilson, D. N. et al. The oxazolidinone antibiotics perturb the ribosomal peptidyl-transferase center and effect tRNA positioning. Proc. Natl Acad. Sci. USA 105, 13339–13344 (2008).
29. Nemeth, E. F. Misconceptions about calcimimetics. Ann. NY Acad. Sci. 1068, 471–476 (2006).Discusses lessons learned in the discovery of cinacalcet, with emphasis on the importance of using an understanding of physiology.
30. Salisbury, B. G. et al. Hypocholesterolemic activity of a novel inhibitor of cholesterol absorption, SCH 48461. Athlerosclerosis 115, 45–63 (1995).
31. Valentino, D. et al. A selective N-type calcium channel antagonist protects against neuronal loss after global cerebral ischemia. Proc. Natl Acad. Sci. USA 90, 7894–7897 (1993).
32. Newman, D. J. & Cragg, G. M. Natural products as sources of new drugs over the last 25 years. J. Nat. Prod. 70, 461–477 (2007).Describes the successes of natural products as a source for new drugs.
33. Deacon, C. F. Therapeutic strategies based on glucagon-like peptide-1. Diabetes 53, 2181–2189 (2004).
34. Von Itzstein, M. et al. Rational design of potent sialidase-based inhibitors of influenza virus replication. Nature 363, 418–423 (1993).
35. Weibel, E. K., Hadvary, P., Hochuli, E., Kupfer, E. & Lengsfeld, H. Lipstatin, an inhibitor of pancreatic lipase produced by Streptomyces toxytricini. 1. Producing organism, fermentation, isolation and biological activity. J. Antibiot. 40, 1081–1086 (1987).
36. Kluter, D. J. New thrombopoietic growth factors. Blood 109, 4607–4616 (2007).
37. Remuzzi, G. et al. New therapeutics that antagonize endothelin: promises and frustrations. Nature Rev. Drug Discov. 1, 986–1001 (2002).
38. Wood, J. M. et al. Structure-based design of aliskiren, a novel orally effective renin inhibitor. Biochem. Biophys. Res. Commun. 308, 698–705 (2003).
39. Pommier, Y. et al. Integrase inhibitors to treat HIV/AIDS. Nature Rev. Drug Discov. 4, 236–248 (2005).
40. Espeseth, A. S. et al. HIV-1 integrase inhibitors that compete with the target DNA substrate define a unique strand transfer conformation for integrase. Proc. Natl Acad. Sci. USA 97, 11244–11249 (2000).
41. Lichtner, R. B. et al. Signaling-inactive epidermal growth factor receptor/ligand complexes in intact carcinoma cells by quinazoline kinase inhibitors. Cancer Res. 61, 5790–5795 (2001).
42. Barker, A. J. et al. Studies leading to the identification of ZD1830 (IressaTM): an orally active, selective epidermal growth factor receptor tyrosine kinase inhibitor targeted to the treatment of cancer. Bioorg. Med. Chem. Lett. 11, 1911–1914 (2001).
43. Leader, B., Baca, Q. J. & Golan, D. E. Protein therapeutics: a summary and pharmacological classification. Nature Rev. Drug Discov. 7, 21–39 (2008).
44. Wilhelm, S. et al. Discovery and development of sorafenib: a multikinase inhibitor for treating cancer. Nature Rev. Drug Discov 5, 835–844 (2006).
45. Goke, R. et al. Exendin-4 is a high potency agonist and truncated exendin-(9–39)-amide an antagonist at the glucagon-like peptide 1-(7–36)-amide receptor of insulin-secreting β-cells. J. Biol. Chem. 268, 19650–19655 (1993).
46. Alvaro, G. & Di Fabio, R. Neurokinin 1 receptor antagonists — current prospects. Curr. Opin. Drug Discov. Dev. 10, 613–621 (2007).
A N A LY S I S
NATURE REVIEWS | DRUG DISCOVERY VOLUME 10 | JULY 2011 | 517
nrd_3480_jul11.indd 517 22/06/2011 10:16
(desloratadine)61, antimuscarinics (tiotropium)62 and angiotensin receptor blockers (candesartan)63,64. Conversely, in drug classes with mechanism-based tox-icity, MMOAs that increase the therapeutic index have been identified, as illustrated by SERMs such as ralox-ifene14,65. A decrease in the number of iterations required to identify an optimal MMOA for first-in-class drugs could accelerate lead discovery and reduce late-stage attrition, thereby increasing R&D productivity.
With regard to the discovery of follower drugs, the opposite trend was seen compared to first-in-class drugs, with target-based approaches accounting for 83 (51%) of these NMEs and phenotypic-based approaches accounting for 30 (18%) NMEs. The reversal of the trend is presumably the result of drug developers tak-ing advantage of knowledge of a previously identified MMOA to effectively use target-based tools. The tim-ing of the use of these tools may also be important. A recent report by DiMasi and Faden66 on follower drugs shows that research on a large percentage of follower
drugs was initiated before first-in-class approval. The authors66 concluded that “drug development can often be characterized as a race in which several firms pursue investigational drugs with similar chemical structures or with the same mechanism of action before any drug in the class obtains regulatory marketing approval”. That is, it appears that once a mechanism of action or a chemical class with the potential to be developed into a drug is discovered, multiple organizations within the pharmaceutical industry may pursue it vigorously. In drug discovery, this race may contribute to the escalat-ing costs, as there is only room for a few drugs in a class. Additionally, the analysis by DiMasi and Faden66 only captures the drug classes that have been approved; if the costs for organizations involved in a race around a hypothesis that was later proven to be incorrect are also considered, the total costs could be substantially higher.
The increased reliance on hypothesis-driven target-based approaches in drug discovery has coincided with the sequencing of the human genome and an apparent
Figure 4 | Activities of first-in-class small-molecule new molecular entities. Nearly half (22 out of 50) of the first-in-class small-molecule drugs that were approved between 1999 and 2008 affected enzyme activity (a). The molecular mechanisms of action (MMOAs) of these drugs included reversible, irreversible, competitive and noncompetitive inhibition, blocking activation and stabilizing the substrate. The next largest group of targets (10 drugs) were receptors (b), most of which were G protein-coupled receptors. Their MMOAs included agonism, partial agonism, antagonism and allosteric modulation. Two drugs — fulvestrant and mifepristone — targeted nuclear receptors. Four of the drugs targeted ion channel activity (c); their MMOAs included uncompetitive antagonism and partial agonism. One drug, ezetimibe, targeted the activity of a transporter (d). The remaining drugs had other activities (e), or unclear targets or MMOAs (f). Of the NMEs with other activities, two had a unique MMOA: verteporfin, a porphyrin that catalyses the generation of reactive oxygen species and is used for photodynamic therapy; and daptomycin, which has an MMOA that involves disruption of bacterial membranes. For details of the discovery and activities of each drug, see Supplementary information S2 (box). *Sirolimus binds to the protein FKBP12 and the sirolimus–FKBP12 complex inhibits the kinase activity of mammalian target of rapamycin, whereas the other four kinase inhibitors target receptor tyrosine kinases. ‡Bortezomib inhibits the 26S proteasome — a multiprotein complex — by inhibiting the chymotryptic-like activity of the proteasome. §Fulvestrant acts by promoting receptor degradation.
A N A LY S I S
516 | JULY 2011 | VOLUME 10 www.nature.com/reviews/drugdisc
nrd_3480_jul11.indd 516 22/06/2011 10:16
34 | OCTOBER 2011 | THE FUTURE OF DRUG INNOVATION | NATURE REPRINT COLLECTION www.nature.com/reprintcollections/lilly/drug-innovation
119. Chaitman, B. R. et al. Anti-ischemic effects and long-term survival during ranolazine monotherapy in patients with chronic severe angina. J. Am. Coll. Cardiol. 43, 1375–1382 (2004).
120. Chaitman, B. R. et al. Effects of ranolazine with atenolol, amlodipine, or diltiazem on exercise tolerance and angina frequency in patients with severe chronic angina: a randomized controlled trial. JAMA 291, 309–316 (2004).
121. Antzelevitch, C. et al. Electrophysiological effects of ranolazine, a novel antianginal agent with antiarrhythmic properties. Circulation 110, 904–910 (2004).
122. Hunt, E. Pleuromutilin antibiotics. Drugs Future 25, 1163–1168 (2000).
123. Jain, K. K. An assessment of rufinamide as an anti-epileptic in comparison with other drugs in clinical development. Expert Opin. Investig. Drugs 9, 829–840 (2000).
124. Rogawski, M. A. Diverse mechanisms of antiepileptic drugs in the development pipeline. Epilepsy Res. 69, 273–294 (2006).
125. Meltzer, S. M., Monk, B. J. & Tewari, K. S. Green tea catechins for treatment of external genital warts. Am. J. Obstet. Gynecol. 200, 233.e1–233.e7 (2009).
126. Vezina, C., Kudelski, A. & Shegal, S. N. Rapamycin. (AY-22,989), a new antifungal antibiotic. I. Taxomony of the producing streptomycete and isolation of the active principle. J. Antibiot. 10, 721–726 (1975).
127. Richon, V. M. et al. Second generation hybrid polar compounds are potent inducers of transformed cell differentiation. Proc. Natl Acad. Sci. USA 93, 5705–5708 (1996).
128. Marks, P. A. & Breslow, R. Dimethyl sulfoxide to vorinostat: development of this histone deacetylase inhibitor as an anticancer drug. Nature Biotech.25, 84–90 (2007).
129. Masuda Y. et al. 3-Sulfamoylmethyl-1,2-benzisoxazole, a new type of anticonvulsant drug: pharmacological profile. Arzneimittelforschung 30, 477–483 (1980).
130. Maibaum, J. et al. Structural modification of the P2’ position of 2,7-dialkyl-substituted 5(S)-amino-4(S)-hydroxy-8-phenyl-octanecarboxamides: the discovery of aliskiren, a potent non-peptide human renin inhibitor active after once daily dosing in marmosets. J. Med. Chem. 50, 4832–4844 (2007).
131. Goldberg, A. in Cancer Drug Discovery and Development: Proteasome Inhibitors in Cancer Therapy (ed. Adams, J.) 17–38 (Humana, Totowa, 2004).
132. Stein, R. L., Ma, Y. T. & Brand, S. Inhibitors of the 26s proteolytic complex and the 20s proteasome contained therein. US Patent 5,693,617 (1995).
133. Decaux, G., Soupart, A. & Vassart, G. Non-peptide arginine-vasopressin antagonists: the vaptans. Lancet 371, 1624–1632 (2008).
134. Flexner, C. HIV drug development: the next 25 years. Nature Rev. Drug Discov. 6, 959–966 (2007).
135. Tsibris, A. M. & Kuritzkes, D. R. Chemokine antagonists as therapeutics: focus on HIV-1. Annu. Rev. Med. 58, 445–459 (2007).
136. Dorr, P. et al. Maraviroc (UK-427,857), a potent, orally bioavailable, and selective small-molecule inhibitor of chemokine receptor CCR5 with broad-spectrum anti-human immunodeficiency virus type 1 activity. Antimicrob. Agents Chemother. 49, 4721–4732 (2005).
137. Watson, C., Jenkinson, S., Kazmierski, W. & Kenakin, T. The CCR5 receptor-based mechanism of action of 873140, a potent allosteric noncompetitive HIV entry inhibitor. Mol. Pharmacol. 67, 1268–1282 (2005).
138. Pincus, G. (ed.) The Control of Fertility. 128–138 (Academic Press, New York, 1965).
139. Belanger, A., Philibert, D. & Teutsch, G. Regio and stereospecific synthesis of 11β-substituted 19-norsteroids. Steroids 37, 361–382 (1981).
140. Mahajan, D. K. & London, S. N. Mifepristone (RU486): a review. Fertil. Steril. 68, 967–976 (1997).
141. Raaijmakers, H. C., Versteegh, J. E. & Uitdehaag, J. C. The X-ray structure of RU486 bound to the progesterone receptor in a destabilized agonistic conformation. J. Biol. Chem. 284, 19572–19579 (2009).
142. Hadvary, P., Lengsfeld, H. & Wolfer, H. Inhibition of pancreatic lipase in vitro by the covalent inhibitor tetrahydrolipstatin. Biochem. J. 256, 357–361 (1988).
143. Hazuda, D. J. et al. Inhibitors of strand transfer that prevent integration and inhibit HIV-1 replication in cells. Science 287, 646–650 (2000).
144. Summa, V. et al. Discovery of raltegravir. A potent, selective orally bioavailable HIV-integrase inhibitor for the treatment of HIV-AIDS infection. J. Med. Chem. 51, 5843–5855 (2008).
145. Buysse, D., Bate, G. & Kirkpatrick, P. Ramelteon. Nature Rev. Drug Discov. 4, 881–882 (2005).
146. Drucker, D. J. The biology of incretin hormones. Cell. Metab. 3, 153–165 (2006).
147. Cohen, H. T. & McGovern, F. J. Renal-cell carcinoma. N. Engl. J. Med. 353, 2477–2490 (2005).
148. Atkins, M. B. et al. Innovations and challenges in renal cancer: consensus statement from the first international conference. Clin. Cancer Res. 9, 6277S–6281S (2004).
149. Bergers, G. et al. Benefits of targeting both pericytes and endothelial cells in the tumor vasculature with kinase inhibitors. J. Clin. Invest. 111, 1287–1295 (2003).
150. Mendel, D. B. et al. In vivo anti-tumor activity of SU11248, a novel tyrosine kinase inhibitor targeting VEGF and PDGF receptors: determination of a pharmacokinetic/pharmacodynamic relationship. Clin. Cancer Res. 9, 327–337 (2003).
151. De Clercq, E. Strategies in the design of antiviral drugs. Nature Rev. Drug Discov. 1, 13–25 (2002).
152. Boismare, F. et al. A homotaurine derivative reduces the voluntary intake of ethanol by rats: are cerebral GABA receptors involved? Pharmacol. Biochem. Behav. 21, 787–789 (1984).
153. Kennedy, J. C., Pottier, R. H. & Pross, D. C. Photodynamic therapy with endogenous protoporphyrin IX: basic principles and present clinical experience. J. Photochem. Photobiol. B 6, 143–148 (1990).
154. Sima, A. A. F., Kennedy, J. C., Blakeslee, D. & Robertson, D. M. Experimental porphyric neuropathy: a preliminary report. Can. J. Neurol. Sci. 8 105–114 (1981).
155. Choay, J. et al. Structure–activity relationship in heparin: a synthetic pentasaccharide with high affinity for antithrombin III and eliciting high anti-factor Xa activity. Biochem. Biophys. Res. Commun. 116, 492–499 (1983).
156. Hirsh, J. et al. Heparin and low-molecular-weight heparin: mechanisms of action, pharmacokinetics, dosing, monitoring, efficacy, and safety. Chest 119, 64S–94S (2001).
157. Walenga, J. M. et al. Development of a synthetic heparin pentasaccharide: fondaparinux. Turk. J. Haematol. 19, 137–150 (2002).
158. Blau, N. & Erlandsen, H. The metabolic and molecular bases of tetrahydrobiopterin-responsive phenylalanine hydroxylase deficiency. Mol. Genet. Metab. 82, 101–111 (2004).
159. Niederwieser, A. & Curtius, H. C. in Inherited Diseases of Amino Acid Metabolism (eds Bickel, H. & Wachtel, U.) 104–121 (Georg Thieme, Stuttgart, 1985).
160. Kure, S. et al. Tetrahydrobiopterin-responsive phenylalanine hydroxylase deficiency. J. Pediatr. 135, 375–378 (1999).
161. Muntau, A. C. et al. Tetrahydrobiopterin as an alternative treatment for mild phenylketonuria. N. Engl. J. Med. 347, 2122–2132 (2002).
162. Mellish, K. J. & Brown, S. B. Verteporfin: a milestone in ophthalmology and photodynamic therapy. Expert Opin. Pharmacother. 2, 351–361 (2001).
AcknowledgementsWe wish to acknowledge the employees of Roche (Palo Alto) who created a great environment to do drug discovery research. We specifically thank the members of the Biochemical Pharmacology Core led by A. Ford and the Virology Disease Biology Area led by N. Cammack for their support and encouragement. D.C.S. also wishes to thank the many scientists whose feedback, constructive criticism and desire to discover new medicines helped to provide the moti-vation for this work.
Competing interests statement: The authors declare competing financial interests: see Web version for details.
FURTHER INFORMATIONDrugs@FDA: http://www.accessdata.fda.gov/scripts/cder/drugsatfda
SUPPLEMENTARY INFORMATIONSee online article: S1 (table) | S2 (box)
ALL LINKS ARE ACTIVE IN THE ONLINE PDF
A N A LY S I S
NATURE REVIEWS | DRUG DISCOVERY VOLUME 10 | JULY 2011 | 519
nrd_3480_jul11.indd 519 22/06/2011 10:16
47. Wijayaratne, A. L. & McDonnell, D. P. The human estrogen receptor-α is a ubiquitinated protein whose stability is affected differentially by agonists, antagonists, and selective estrogen receptor modulators. J. Biol. Chem. 276, 35684–35692 (2001).
48. Ferrara, N. et al. Discovery and development of bevacizumab, an anti-VEGF antibody for treating cancer. Nature Rev. Drug Discov. 3, 391–400 (2004).
49. Capdeville, R., Buchdunger, E., Zimmermann, J. & Matter A. Glivec (ST571, imatinib), a rationally developed, targeted anticancer drug. Nature Rev. Drug. Discov. 1, 493–502 (2002).
50. Wacker, D. et al. Conserved binding mode of human β2 adrenergic receptor inverse agonists and antagonist revealed by X-ray crystallography. J. Am. Chem. Soc. 132, 11443–11445 (2010).
51. Lemmon, M. A. & Schlessinger, J. Cell signaling by receptor tyrosine kinases. Cell 141, 1117–1134 (2010).
52. Li, P. et al. Cytochrome c and dATP-dependent formation of Apaf-1/caspase-9 complex initiates an apoptotic protease cascade. Cell 91, 479–489.
53. Johnson, K. A. Role of induced fit in enzyme specificity: a molecular forward/reverse switch. J. Biol. Chem. 283, 26297–26301 (2008).
54. Sigoillot, F. D. & King, R. W. Vigilance and validation: keys to success in RNAi screening. ACS Chem. Biol. 6, 47–60 (2011).
55. Hergenrother, P. J. & Palchaudhuri, R. Transcript profiling and RNA interference as tools to identify small molecule mechanisms and therapeutic potential. ACS Chem. Biol. 6, 21–33 (2011).
56. Macarron, R. et al. Impact of high-throughput screening in biomedical research. Nature Rev. Drug. Discov. 10, 188–195 (2011).
57. Pruss, R. M. Phenotypic screening strategies for neurodegenerative diseases: a pathway to discover novel drug candidates and potential disease targets or mechanisms. CNS Neurol. Disord. Drug Targets 9, 693–700 (2010).
58. Bickle, M. The beautiful cell: high-content screening in drug discovery. Anal. Bioanal. Chem. 398, 219–226 (2010).
59. Mayer, A. M. et al. The odyssey of marine pharmaceuticals: a current pipeline perspective. Trends Pharmacol. Sci. 31, 255–265 (2010).
60. Telling, J. L. et al. The biological activity of human CD20 monoclonal antibodies is linked to unique epitopes on CD20. J. Immunol. 177, 362–371 (2006).
61. Anthes, J. C. et al. Biochemical characterization of desloratadine, a potent antagonist of the human histamine H1 receptor. Eur. J. Pharmacol. 449, 229–237 (2002).
62. Disse, B. et al. Tiotropium (Spiriva): mechanistic considerations and clinical profile in obstructive lung disease. Life Sci. 64, 457–464 (1999).
63. Vauquelin, G., Fierens, F. & Van Liefde, I. Long-lasting AT1 receptor binding and protection by candesartan: comparison to other biphenyl-tetrazole sartans. J. Hypertens. 24, S23–S30 (2006).
64. Fuchs, B. et al. Comparative pharmacodynamics and pharmacokinetics of candesartan and losartan in man. J. Pharm. Pharmacol. 52, 1075–1083 (2000).
65. Gustafsson, J. A. Raloxifene: magic bullet for heart and bone? Nature Med. 4, 152–153 (1998).
66. DiMasi, J. A. & Fadon, L. B. Competitiveness in follow-on drug R&D: a race or imitation? Nature Rev. Drug Discov. 10, 1–5 (2011).
67. Gleeson, M. P., Hersey, A., Montanari, D. & Overington, J. Probing the links between in vitro potency, ADMET and physiocochemical parameters. Nature Rev. Drug Discov. 10, 197–208 (2011).
68. Fersht, A. Enzyme Structure and Mechanism 88–109 (W. H Freeman and Company, New York,1985).
69. Issa, J. P. J., Kantarjian, H. M. & Kirkpatrick, P. Azacitidine. Nature Rev. Drug Discov. 4, 275–276 (2005).
70. Martel, R. R., Klicius, J. & Galet, S. Inhibition of immune response by rapamycin, a new antifungal antibiotic. Can. J. Physiol. Pharmacol. 55, 48–51 (1977).
71. Bartizal, K. et al. In vitro antifungal activities and in vivo efficacies of 1,3-β-glucan synthesis inhibitors L671,329, L646,991, tetrahydroechinocandin B, and L687,781, a papulacandin. Antimicrob. Agents Chemother. 36, 1648–1657 (1992).
72. Uchikawa, O. et al. Synthesis of a novel series of tricyclic indan derivatives as melatonin receptor agonists. J. Med. Chem. 45, 4222–4239 (2002).
73. Kenakin, T. Pharmacologic Analysis of Drug‑Receptor Interaction 242–395 (Lippincott-Raven Publishers, Philadelphia, 1997).
74. Burris K. D. et al. Aripiprazole, a novel antipsychotic, is a high-affinity partial agonist at human dopamine D2 receptors. J. Pharmacol. Exp. Ther. 302, 381–389 (2002).
75. Pulvirenti, L. & Koob, G. F. Dopamine receptor agonists, partial agonists and psychostimulant addiction. Trends Pharmacol. Sci. 15, 374–379 (1994).
76. Coe, J. E. et al. Varenicline: an α4β2 nicotinic receptor partial agonist for smoking cessation. J. Med. Chem. 48, 3474–3477 (2005).Describes the thinking that led to a mechanism-based search for a partial agonist of nicotinic receptors.
77. Rickter, A. M. et al. Preliminary studies on a more effective phototoxic agent than hematoporphyrin. J. Natl Cancer Inst. 79, 1327–1332 (1987).
78. Hemphill, A., Mueller, J. & Esposito, M. Nitazoxanide, a broad-spectrum thiazolide anti-infective agent for the treatment of gastrointestinal infections. Expert Opin. Pharmacother. 7, 953–964 (2006).
79. Rossignol, J. F. & Maisonneuve, H. Nitazoxanide in the treatment of Teania saginata and Hymenolepis nana infections. Am. J. Trop. Med. Hyg. 33, 511–512 (1984).
80. Lewis, D. A. & Lieberman, J. A. Catching up on schizophrenia: natural history and neurobiology. Neuron 28, 325–334 (2000).
81. Yasuda, Y. et al. 7-[3-[4-(2,3 dimethylphenyl)piperazinyl] propoxy]-2(1H)-quinolinone (OPC-4392), a presynaptic dopamine receptor agonist and postsynaptic D2 receptor antagonist. Life Sci. 42, 1941–1954 (1988).
82. Kikuchi, T. et al. 7-(4-[4-(2,3-dichlorophenyl) -1-piperazinyl]butyloxy)-3,4-dihydro-2(1H)-quinolinone (OPC-14597), a new putative antipsychotic drug with both presynaptic dopamine autoreceptor agonistic activity and postsynaptic D2 receptor antagonistic activity. J. Pharmacol. Exp. Ther. 274, 329–336 (1995).
83. Oshiro, Y. et al. Novel antipsychotic agents with dopamine autoreceptor agonist properties: synthesis and pharmacology of 7-[4-(4-phenyl-1-piperazinyl)butoxy]-3,4-dihydro-2(1H)-quinolinone derivatives. J. Med. Chem. 41, 658–667 (1998).
84. Inoue, T., Domae, M., Yamada, K. & Furukawa, T. Effects of the novel antipsychotic agent 7-(4-[4-(2,3-dichorophenyl)-1-piperazinyl]butyloxy)-3,4-dihydro-2(1H)-quinoline (OPC-14597) on prolactin release from the rat anterior pituitary gland. J. Pharmacol. Exp. Ther. 277, 137–143 (1996).
85. Egger, G., Liang, G., Aparicio, A. & Jones, P. A. Epigenetics in human disease and prospects for epigenetic therapy. Nature 429, 457–463 (2004).
86. Satistowska-Schroder, E. T., Kerridge, D. & Perry, H. Echinocandin inhibition of 1,3-β-D-glucan synthase from Candida albicans. FEBS Lett. 173, 134–138 (1984).
87. Nishi, T. et al. Studies on 2-oxoquinoline derivatives as blood platelet aggregation inhibitors. I. Alkyl 4-(2-oxo-1,2,3,4-tetrahydro-6-quinolyloxy)butyrates and related compounds. Chem. Pharm. Bull. 31, 798–810 (1983).
88. Tally, F. P. & DeBruin M. F. Development of daptomycin for Gram-positive infections. J. Antimicrob. Chemother. 46, 523–526 (2000).
89. Stock, C, C. & Francis, T. J. The inactivation of the virus of epidemic influenza by soaps. J. Exp. Med. 71, 661–681 (1940).
90. Snipes, W., Person, S., Keller, G., Taylor, W. & Keith, A. Inactivation of lipid-containing viruses by long-chain alcohols. Antimicrob. Agents Chemother. 11, 98–104 (1977).
91. Sands, J., Auperin, D. & Snipes, W. Extreme sensitivity of enveloped viruses including herpes-simplex, to long-chain unsaturated monglycerides and alcohols. Antimicrob. Agents Chemother. 15, 67–73 (1979).
92. Katz, D. H., Marcelletti, J. F., Khalil, M. H., Pope, L. E. & Katz, L. E. Antiviral activity of 1-docosanol, an inhibitor of lipid-enveloped viruses including herpes simplex. Proc. Natl Acad. Sci. USA 88, 10825–10829 (1991).
93. Wakeling, A. E., Dukes, M. & Bowler, J. A potent specific pure antiestrogen with clinical potential. Cancer Res. 51, 3867–3873 (1991).
94. Stenoien, D. L. et al. FRAP reveals that mobility of oestrogen receptor-α is ligand- and proteasome-dependent. Nature Cell Biol. 3, 15–23 (2001).
95. Glower, A. J., Noyer, M., Verloes, R., Gobert, J. & Wulfert, E. UCB L059, a novel anti-convulsant drug: pharmacological profile in animals. Eur. J. Pharmacol. 222, 193–203 (1992).
96. Shinabarger, D. Mechanism of action of the oxazolidinone antibacterial agents. Expert Opin. Investig. Drugs 8, 1195–1202 (1999).
97. Brickner, S. J. Oxazolidinone antibacterial agents. Curr. Pharm. Des. 2, 175–194 (1996).
98. Cuppoletti J. et al. Recombinant and native intestinal cell ClC-2 Cl– channels are activated by RU-0211. Gastroenterology 122, A538 (2002).
99. Cuppoletti, J. et al. SPI-0211 activates T84 cell chloride transport and recombinant human ClC-2 chloride currents. Am. J. Physiol. 287, C1173–C1183 (2004).
100. Peña-Münzenmayer, G. et al. Basolateral localization of native ClC-2 chloride channels in absorptive intestinal epithelial cells and basolateral sorting encoded by a CBS-2 domain di-leucine motif. J. Cell Sci. 118, 4243–4252 (2005).
101. Parsons, C. G., Danysz, W. & Quack, G. Memantine is a clinically well-tolerated N-methyl-d-aspartate (NMDA) receptor antagonist — a review of the preclinical data. Neuropharmacology 38, 735–767 (1999).
102. Gerzon, K. et al. The adamantyl group in medicinal agents. I. Hypoglycemic N-arylsulfonyl-N′-adamantylureas. J. Med. Chem. 6, 760–763 (1963).
103. Bormann, J. Memantine is a potent blocker of N-methyl-d-aspartate (NMDA) receptor channels. Eur. J. Pharmacol. 166, 591–592 (1989).
104. Platt, F. M., Neises, G. R., Dwek, R. A. & Butters, T. D. N-butyldeoxynojirimycin is a novel inhibitor of glycolipid biosynthesis. J. Biol. Chem. 269, 8362–8365 (1994).
105. Pastores, G. M. & Barnett, N. L. Substrate reduction therapy: miglustat as a remedy for symptomatic patients with Gaucher disease type 1. Expert Opin. Investig. Drugs. 12, 273–281 (2003).
106. Hu, S. et al. Pancreatic β-cell KATP channel activity and membrane-binding studies with nateglinide: a comarison with sulfonylureas and repaglinide. J. Pharmacol. Ther. 293, 444–452 (2000).
107. Shinkai, H. et al. N-acylphenylanalines and related compounds. A new class of oral hypoglycemic agents. J. Med. Chem. 31, 2092–2097 (1988).
108. Shinkai, H. et al. N-acylphenylanalines and related compounds. A new class of oral hypoglycemic agents. J. Med. Chem. 32, 1436–1441 (1989).
109. Parker, W. B. et al. Purine nucleoside analogues in development for the treatment of cancer. Curr. Opin. Investig. Drugs 5, 592–596 (2004).
110. Rodriguez, C. O. et al. Mechanisms for T-cell selective cytotoxicity of arabinosylguanine. Blood 102, 1842–1848 (2003).
111. Krenitsky, T. A. et al. An enzymatic synthesis of purine-d-arabinonucleosides. Carbohydr. Res. 97, 139–146 (1981).
112. Lambe, C. U. et al. 2-amino-6-methoxypurine arabinoside: an agent for T-cell malignancies. Cancer Res. 55, 3352–3356 (1995).
113. Gandhi, V., Keating, M. J., Bate, G. & Kirkpatrick, P. Nelarabine. Nature Rev. Drug Discov. 5, 17–18 (2006).
114. Lock, E. A. et al. From toxicological problem to therapeutic use: the discovery of the mode of action of 2-(2-nitro-4-trifluoromethylbenzoyl)-1, 3-cyclohexanedione (NTBC), its toxicology and development as a drug. J. Inherit. Metab. Dis. 21, 498–506 (1998).
115. Kavana, M. & Moran, G. R. Interaction of (4-hydroxyphenyl)pyruvate dioxygenase with the specific inhibitor 2-[2-Nitro-4-(trifluoromethyl)benzoly]-1,3-cyclohexanedione. Biochemistry 42, 10238–10245 (2003).
116. Brownlee, J. M., Johnson-Winters, K., Harrison, D. H. T. & Moran, G. R. Structure of the ferrous form of 4-(hydroxyphenyl)pyruvate dehydrogenase from Streptomyces avermitilis in complex with the therapeutic herbicide, NTBC. Biochemistry 43, 6370–6377 (2004).
117. Yanagihara, Y., Kasai, H., Kawashima, T. & Shida, T. Immunopharmacological studies on TBX, a new antiallergic drug (1). Inhibitory effects on passive cutaneous anaphylaxis in rats and guinea pigs. Jpn. J. Pharmacol. 48, 91–101 (1988).
118. Gaffney, S. M. Ranolazine, a novel agent for chronic stable angina. Pharmacotherapy 26, 135–142 (2006).
A N A LY S I S
518 | JULY 2011 | VOLUME 10 www.nature.com/reviews/drugdisc
nrd_3480_jul11.indd 518 22/06/2011 10:16
www.nature.com/reprintcollections/lilly/drug-innovation NATURE REPRINT COLLECTION | THE FUTURE OF DRUG INNOVATION | OCTOBER 2011 | 35
119. Chaitman, B. R. et al. Anti-ischemic effects and long-term survival during ranolazine monotherapy in patients with chronic severe angina. J. Am. Coll. Cardiol. 43, 1375–1382 (2004).
120. Chaitman, B. R. et al. Effects of ranolazine with atenolol, amlodipine, or diltiazem on exercise tolerance and angina frequency in patients with severe chronic angina: a randomized controlled trial. JAMA 291, 309–316 (2004).
121. Antzelevitch, C. et al. Electrophysiological effects of ranolazine, a novel antianginal agent with antiarrhythmic properties. Circulation 110, 904–910 (2004).
122. Hunt, E. Pleuromutilin antibiotics. Drugs Future 25, 1163–1168 (2000).
123. Jain, K. K. An assessment of rufinamide as an anti-epileptic in comparison with other drugs in clinical development. Expert Opin. Investig. Drugs 9, 829–840 (2000).
124. Rogawski, M. A. Diverse mechanisms of antiepileptic drugs in the development pipeline. Epilepsy Res. 69, 273–294 (2006).
125. Meltzer, S. M., Monk, B. J. & Tewari, K. S. Green tea catechins for treatment of external genital warts. Am. J. Obstet. Gynecol. 200, 233.e1–233.e7 (2009).
126. Vezina, C., Kudelski, A. & Shegal, S. N. Rapamycin. (AY-22,989), a new antifungal antibiotic. I. Taxomony of the producing streptomycete and isolation of the active principle. J. Antibiot. 10, 721–726 (1975).
127. Richon, V. M. et al. Second generation hybrid polar compounds are potent inducers of transformed cell differentiation. Proc. Natl Acad. Sci. USA 93, 5705–5708 (1996).
128. Marks, P. A. & Breslow, R. Dimethyl sulfoxide to vorinostat: development of this histone deacetylase inhibitor as an anticancer drug. Nature Biotech.25, 84–90 (2007).
129. Masuda Y. et al. 3-Sulfamoylmethyl-1,2-benzisoxazole, a new type of anticonvulsant drug: pharmacological profile. Arzneimittelforschung 30, 477–483 (1980).
130. Maibaum, J. et al. Structural modification of the P2’ position of 2,7-dialkyl-substituted 5(S)-amino-4(S)-hydroxy-8-phenyl-octanecarboxamides: the discovery of aliskiren, a potent non-peptide human renin inhibitor active after once daily dosing in marmosets. J. Med. Chem. 50, 4832–4844 (2007).
131. Goldberg, A. in Cancer Drug Discovery and Development: Proteasome Inhibitors in Cancer Therapy (ed. Adams, J.) 17–38 (Humana, Totowa, 2004).
132. Stein, R. L., Ma, Y. T. & Brand, S. Inhibitors of the 26s proteolytic complex and the 20s proteasome contained therein. US Patent 5,693,617 (1995).
133. Decaux, G., Soupart, A. & Vassart, G. Non-peptide arginine-vasopressin antagonists: the vaptans. Lancet 371, 1624–1632 (2008).
134. Flexner, C. HIV drug development: the next 25 years. Nature Rev. Drug Discov. 6, 959–966 (2007).
135. Tsibris, A. M. & Kuritzkes, D. R. Chemokine antagonists as therapeutics: focus on HIV-1. Annu. Rev. Med. 58, 445–459 (2007).
136. Dorr, P. et al. Maraviroc (UK-427,857), a potent, orally bioavailable, and selective small-molecule inhibitor of chemokine receptor CCR5 with broad-spectrum anti-human immunodeficiency virus type 1 activity. Antimicrob. Agents Chemother. 49, 4721–4732 (2005).
137. Watson, C., Jenkinson, S., Kazmierski, W. & Kenakin, T. The CCR5 receptor-based mechanism of action of 873140, a potent allosteric noncompetitive HIV entry inhibitor. Mol. Pharmacol. 67, 1268–1282 (2005).
138. Pincus, G. (ed.) The Control of Fertility. 128–138 (Academic Press, New York, 1965).
139. Belanger, A., Philibert, D. & Teutsch, G. Regio and stereospecific synthesis of 11β-substituted 19-norsteroids. Steroids 37, 361–382 (1981).
140. Mahajan, D. K. & London, S. N. Mifepristone (RU486): a review. Fertil. Steril. 68, 967–976 (1997).
141. Raaijmakers, H. C., Versteegh, J. E. & Uitdehaag, J. C. The X-ray structure of RU486 bound to the progesterone receptor in a destabilized agonistic conformation. J. Biol. Chem. 284, 19572–19579 (2009).
142. Hadvary, P., Lengsfeld, H. & Wolfer, H. Inhibition of pancreatic lipase in vitro by the covalent inhibitor tetrahydrolipstatin. Biochem. J. 256, 357–361 (1988).
143. Hazuda, D. J. et al. Inhibitors of strand transfer that prevent integration and inhibit HIV-1 replication in cells. Science 287, 646–650 (2000).
144. Summa, V. et al. Discovery of raltegravir. A potent, selective orally bioavailable HIV-integrase inhibitor for the treatment of HIV-AIDS infection. J. Med. Chem. 51, 5843–5855 (2008).
145. Buysse, D., Bate, G. & Kirkpatrick, P. Ramelteon. Nature Rev. Drug Discov. 4, 881–882 (2005).
146. Drucker, D. J. The biology of incretin hormones. Cell. Metab. 3, 153–165 (2006).
147. Cohen, H. T. & McGovern, F. J. Renal-cell carcinoma. N. Engl. J. Med. 353, 2477–2490 (2005).
148. Atkins, M. B. et al. Innovations and challenges in renal cancer: consensus statement from the first international conference. Clin. Cancer Res. 9, 6277S–6281S (2004).
149. Bergers, G. et al. Benefits of targeting both pericytes and endothelial cells in the tumor vasculature with kinase inhibitors. J. Clin. Invest. 111, 1287–1295 (2003).
150. Mendel, D. B. et al. In vivo anti-tumor activity of SU11248, a novel tyrosine kinase inhibitor targeting VEGF and PDGF receptors: determination of a pharmacokinetic/pharmacodynamic relationship. Clin. Cancer Res. 9, 327–337 (2003).
151. De Clercq, E. Strategies in the design of antiviral drugs. Nature Rev. Drug Discov. 1, 13–25 (2002).
152. Boismare, F. et al. A homotaurine derivative reduces the voluntary intake of ethanol by rats: are cerebral GABA receptors involved? Pharmacol. Biochem. Behav. 21, 787–789 (1984).
153. Kennedy, J. C., Pottier, R. H. & Pross, D. C. Photodynamic therapy with endogenous protoporphyrin IX: basic principles and present clinical experience. J. Photochem. Photobiol. B 6, 143–148 (1990).
154. Sima, A. A. F., Kennedy, J. C., Blakeslee, D. & Robertson, D. M. Experimental porphyric neuropathy: a preliminary report. Can. J. Neurol. Sci. 8 105–114 (1981).
155. Choay, J. et al. Structure–activity relationship in heparin: a synthetic pentasaccharide with high affinity for antithrombin III and eliciting high anti-factor Xa activity. Biochem. Biophys. Res. Commun. 116, 492–499 (1983).
156. Hirsh, J. et al. Heparin and low-molecular-weight heparin: mechanisms of action, pharmacokinetics, dosing, monitoring, efficacy, and safety. Chest 119, 64S–94S (2001).
157. Walenga, J. M. et al. Development of a synthetic heparin pentasaccharide: fondaparinux. Turk. J. Haematol. 19, 137–150 (2002).
158. Blau, N. & Erlandsen, H. The metabolic and molecular bases of tetrahydrobiopterin-responsive phenylalanine hydroxylase deficiency. Mol. Genet. Metab. 82, 101–111 (2004).
159. Niederwieser, A. & Curtius, H. C. in Inherited Diseases of Amino Acid Metabolism (eds Bickel, H. & Wachtel, U.) 104–121 (Georg Thieme, Stuttgart, 1985).
160. Kure, S. et al. Tetrahydrobiopterin-responsive phenylalanine hydroxylase deficiency. J. Pediatr. 135, 375–378 (1999).
161. Muntau, A. C. et al. Tetrahydrobiopterin as an alternative treatment for mild phenylketonuria. N. Engl. J. Med. 347, 2122–2132 (2002).
162. Mellish, K. J. & Brown, S. B. Verteporfin: a milestone in ophthalmology and photodynamic therapy. Expert Opin. Pharmacother. 2, 351–361 (2001).
AcknowledgementsWe wish to acknowledge the employees of Roche (Palo Alto) who created a great environment to do drug discovery research. We specifically thank the members of the Biochemical Pharmacology Core led by A. Ford and the Virology Disease Biology Area led by N. Cammack for their support and encouragement. D.C.S. also wishes to thank the many scientists whose feedback, constructive criticism and desire to discover new medicines helped to provide the moti-vation for this work.
Competing interests statement: The authors declare competing financial interests: see Web version for details.
FURTHER INFORMATIONDrugs@FDA: http://www.accessdata.fda.gov/scripts/cder/drugsatfda
SUPPLEMENTARY INFORMATIONSee online article: S1 (table) | S2 (box)
ALL LINKS ARE ACTIVE IN THE ONLINE PDF
A N A LY S I S
NATURE REVIEWS | DRUG DISCOVERY VOLUME 10 | JULY 2011 | 519
nrd_3480_jul11.indd 519 22/06/2011 10:16
47. Wijayaratne, A. L. & McDonnell, D. P. The human estrogen receptor-α is a ubiquitinated protein whose stability is affected differentially by agonists, antagonists, and selective estrogen receptor modulators. J. Biol. Chem. 276, 35684–35692 (2001).
48. Ferrara, N. et al. Discovery and development of bevacizumab, an anti-VEGF antibody for treating cancer. Nature Rev. Drug Discov. 3, 391–400 (2004).
49. Capdeville, R., Buchdunger, E., Zimmermann, J. & Matter A. Glivec (ST571, imatinib), a rationally developed, targeted anticancer drug. Nature Rev. Drug. Discov. 1, 493–502 (2002).
50. Wacker, D. et al. Conserved binding mode of human β2 adrenergic receptor inverse agonists and antagonist revealed by X-ray crystallography. J. Am. Chem. Soc. 132, 11443–11445 (2010).
51. Lemmon, M. A. & Schlessinger, J. Cell signaling by receptor tyrosine kinases. Cell 141, 1117–1134 (2010).
52. Li, P. et al. Cytochrome c and dATP-dependent formation of Apaf-1/caspase-9 complex initiates an apoptotic protease cascade. Cell 91, 479–489.
53. Johnson, K. A. Role of induced fit in enzyme specificity: a molecular forward/reverse switch. J. Biol. Chem. 283, 26297–26301 (2008).
54. Sigoillot, F. D. & King, R. W. Vigilance and validation: keys to success in RNAi screening. ACS Chem. Biol. 6, 47–60 (2011).
55. Hergenrother, P. J. & Palchaudhuri, R. Transcript profiling and RNA interference as tools to identify small molecule mechanisms and therapeutic potential. ACS Chem. Biol. 6, 21–33 (2011).
56. Macarron, R. et al. Impact of high-throughput screening in biomedical research. Nature Rev. Drug. Discov. 10, 188–195 (2011).
57. Pruss, R. M. Phenotypic screening strategies for neurodegenerative diseases: a pathway to discover novel drug candidates and potential disease targets or mechanisms. CNS Neurol. Disord. Drug Targets 9, 693–700 (2010).
58. Bickle, M. The beautiful cell: high-content screening in drug discovery. Anal. Bioanal. Chem. 398, 219–226 (2010).
59. Mayer, A. M. et al. The odyssey of marine pharmaceuticals: a current pipeline perspective. Trends Pharmacol. Sci. 31, 255–265 (2010).
60. Telling, J. L. et al. The biological activity of human CD20 monoclonal antibodies is linked to unique epitopes on CD20. J. Immunol. 177, 362–371 (2006).
61. Anthes, J. C. et al. Biochemical characterization of desloratadine, a potent antagonist of the human histamine H1 receptor. Eur. J. Pharmacol. 449, 229–237 (2002).
62. Disse, B. et al. Tiotropium (Spiriva): mechanistic considerations and clinical profile in obstructive lung disease. Life Sci. 64, 457–464 (1999).
63. Vauquelin, G., Fierens, F. & Van Liefde, I. Long-lasting AT1 receptor binding and protection by candesartan: comparison to other biphenyl-tetrazole sartans. J. Hypertens. 24, S23–S30 (2006).
64. Fuchs, B. et al. Comparative pharmacodynamics and pharmacokinetics of candesartan and losartan in man. J. Pharm. Pharmacol. 52, 1075–1083 (2000).
65. Gustafsson, J. A. Raloxifene: magic bullet for heart and bone? Nature Med. 4, 152–153 (1998).
66. DiMasi, J. A. & Fadon, L. B. Competitiveness in follow-on drug R&D: a race or imitation? Nature Rev. Drug Discov. 10, 1–5 (2011).
67. Gleeson, M. P., Hersey, A., Montanari, D. & Overington, J. Probing the links between in vitro potency, ADMET and physiocochemical parameters. Nature Rev. Drug Discov. 10, 197–208 (2011).
68. Fersht, A. Enzyme Structure and Mechanism 88–109 (W. H Freeman and Company, New York,1985).
69. Issa, J. P. J., Kantarjian, H. M. & Kirkpatrick, P. Azacitidine. Nature Rev. Drug Discov. 4, 275–276 (2005).
70. Martel, R. R., Klicius, J. & Galet, S. Inhibition of immune response by rapamycin, a new antifungal antibiotic. Can. J. Physiol. Pharmacol. 55, 48–51 (1977).
71. Bartizal, K. et al. In vitro antifungal activities and in vivo efficacies of 1,3-β-glucan synthesis inhibitors L671,329, L646,991, tetrahydroechinocandin B, and L687,781, a papulacandin. Antimicrob. Agents Chemother. 36, 1648–1657 (1992).
72. Uchikawa, O. et al. Synthesis of a novel series of tricyclic indan derivatives as melatonin receptor agonists. J. Med. Chem. 45, 4222–4239 (2002).
73. Kenakin, T. Pharmacologic Analysis of Drug‑Receptor Interaction 242–395 (Lippincott-Raven Publishers, Philadelphia, 1997).
74. Burris K. D. et al. Aripiprazole, a novel antipsychotic, is a high-affinity partial agonist at human dopamine D2 receptors. J. Pharmacol. Exp. Ther. 302, 381–389 (2002).
75. Pulvirenti, L. & Koob, G. F. Dopamine receptor agonists, partial agonists and psychostimulant addiction. Trends Pharmacol. Sci. 15, 374–379 (1994).
76. Coe, J. E. et al. Varenicline: an α4β2 nicotinic receptor partial agonist for smoking cessation. J. Med. Chem. 48, 3474–3477 (2005).Describes the thinking that led to a mechanism-based search for a partial agonist of nicotinic receptors.
77. Rickter, A. M. et al. Preliminary studies on a more effective phototoxic agent than hematoporphyrin. J. Natl Cancer Inst. 79, 1327–1332 (1987).
78. Hemphill, A., Mueller, J. & Esposito, M. Nitazoxanide, a broad-spectrum thiazolide anti-infective agent for the treatment of gastrointestinal infections. Expert Opin. Pharmacother. 7, 953–964 (2006).
79. Rossignol, J. F. & Maisonneuve, H. Nitazoxanide in the treatment of Teania saginata and Hymenolepis nana infections. Am. J. Trop. Med. Hyg. 33, 511–512 (1984).
80. Lewis, D. A. & Lieberman, J. A. Catching up on schizophrenia: natural history and neurobiology. Neuron 28, 325–334 (2000).
81. Yasuda, Y. et al. 7-[3-[4-(2,3 dimethylphenyl)piperazinyl] propoxy]-2(1H)-quinolinone (OPC-4392), a presynaptic dopamine receptor agonist and postsynaptic D2 receptor antagonist. Life Sci. 42, 1941–1954 (1988).
82. Kikuchi, T. et al. 7-(4-[4-(2,3-dichlorophenyl) -1-piperazinyl]butyloxy)-3,4-dihydro-2(1H)-quinolinone (OPC-14597), a new putative antipsychotic drug with both presynaptic dopamine autoreceptor agonistic activity and postsynaptic D2 receptor antagonistic activity. J. Pharmacol. Exp. Ther. 274, 329–336 (1995).
83. Oshiro, Y. et al. Novel antipsychotic agents with dopamine autoreceptor agonist properties: synthesis and pharmacology of 7-[4-(4-phenyl-1-piperazinyl)butoxy]-3,4-dihydro-2(1H)-quinolinone derivatives. J. Med. Chem. 41, 658–667 (1998).
84. Inoue, T., Domae, M., Yamada, K. & Furukawa, T. Effects of the novel antipsychotic agent 7-(4-[4-(2,3-dichorophenyl)-1-piperazinyl]butyloxy)-3,4-dihydro-2(1H)-quinoline (OPC-14597) on prolactin release from the rat anterior pituitary gland. J. Pharmacol. Exp. Ther. 277, 137–143 (1996).
85. Egger, G., Liang, G., Aparicio, A. & Jones, P. A. Epigenetics in human disease and prospects for epigenetic therapy. Nature 429, 457–463 (2004).
86. Satistowska-Schroder, E. T., Kerridge, D. & Perry, H. Echinocandin inhibition of 1,3-β-D-glucan synthase from Candida albicans. FEBS Lett. 173, 134–138 (1984).
87. Nishi, T. et al. Studies on 2-oxoquinoline derivatives as blood platelet aggregation inhibitors. I. Alkyl 4-(2-oxo-1,2,3,4-tetrahydro-6-quinolyloxy)butyrates and related compounds. Chem. Pharm. Bull. 31, 798–810 (1983).
88. Tally, F. P. & DeBruin M. F. Development of daptomycin for Gram-positive infections. J. Antimicrob. Chemother. 46, 523–526 (2000).
89. Stock, C, C. & Francis, T. J. The inactivation of the virus of epidemic influenza by soaps. J. Exp. Med. 71, 661–681 (1940).
90. Snipes, W., Person, S., Keller, G., Taylor, W. & Keith, A. Inactivation of lipid-containing viruses by long-chain alcohols. Antimicrob. Agents Chemother. 11, 98–104 (1977).
91. Sands, J., Auperin, D. & Snipes, W. Extreme sensitivity of enveloped viruses including herpes-simplex, to long-chain unsaturated monglycerides and alcohols. Antimicrob. Agents Chemother. 15, 67–73 (1979).
92. Katz, D. H., Marcelletti, J. F., Khalil, M. H., Pope, L. E. & Katz, L. E. Antiviral activity of 1-docosanol, an inhibitor of lipid-enveloped viruses including herpes simplex. Proc. Natl Acad. Sci. USA 88, 10825–10829 (1991).
93. Wakeling, A. E., Dukes, M. & Bowler, J. A potent specific pure antiestrogen with clinical potential. Cancer Res. 51, 3867–3873 (1991).
94. Stenoien, D. L. et al. FRAP reveals that mobility of oestrogen receptor-α is ligand- and proteasome-dependent. Nature Cell Biol. 3, 15–23 (2001).
95. Glower, A. J., Noyer, M., Verloes, R., Gobert, J. & Wulfert, E. UCB L059, a novel anti-convulsant drug: pharmacological profile in animals. Eur. J. Pharmacol. 222, 193–203 (1992).
96. Shinabarger, D. Mechanism of action of the oxazolidinone antibacterial agents. Expert Opin. Investig. Drugs 8, 1195–1202 (1999).
97. Brickner, S. J. Oxazolidinone antibacterial agents. Curr. Pharm. Des. 2, 175–194 (1996).
98. Cuppoletti J. et al. Recombinant and native intestinal cell ClC-2 Cl– channels are activated by RU-0211. Gastroenterology 122, A538 (2002).
99. Cuppoletti, J. et al. SPI-0211 activates T84 cell chloride transport and recombinant human ClC-2 chloride currents. Am. J. Physiol. 287, C1173–C1183 (2004).
100. Peña-Münzenmayer, G. et al. Basolateral localization of native ClC-2 chloride channels in absorptive intestinal epithelial cells and basolateral sorting encoded by a CBS-2 domain di-leucine motif. J. Cell Sci. 118, 4243–4252 (2005).
101. Parsons, C. G., Danysz, W. & Quack, G. Memantine is a clinically well-tolerated N-methyl-d-aspartate (NMDA) receptor antagonist — a review of the preclinical data. Neuropharmacology 38, 735–767 (1999).
102. Gerzon, K. et al. The adamantyl group in medicinal agents. I. Hypoglycemic N-arylsulfonyl-N′-adamantylureas. J. Med. Chem. 6, 760–763 (1963).
103. Bormann, J. Memantine is a potent blocker of N-methyl-d-aspartate (NMDA) receptor channels. Eur. J. Pharmacol. 166, 591–592 (1989).
104. Platt, F. M., Neises, G. R., Dwek, R. A. & Butters, T. D. N-butyldeoxynojirimycin is a novel inhibitor of glycolipid biosynthesis. J. Biol. Chem. 269, 8362–8365 (1994).
105. Pastores, G. M. & Barnett, N. L. Substrate reduction therapy: miglustat as a remedy for symptomatic patients with Gaucher disease type 1. Expert Opin. Investig. Drugs. 12, 273–281 (2003).
106. Hu, S. et al. Pancreatic β-cell KATP channel activity and membrane-binding studies with nateglinide: a comarison with sulfonylureas and repaglinide. J. Pharmacol. Ther. 293, 444–452 (2000).
107. Shinkai, H. et al. N-acylphenylanalines and related compounds. A new class of oral hypoglycemic agents. J. Med. Chem. 31, 2092–2097 (1988).
108. Shinkai, H. et al. N-acylphenylanalines and related compounds. A new class of oral hypoglycemic agents. J. Med. Chem. 32, 1436–1441 (1989).
109. Parker, W. B. et al. Purine nucleoside analogues in development for the treatment of cancer. Curr. Opin. Investig. Drugs 5, 592–596 (2004).
110. Rodriguez, C. O. et al. Mechanisms for T-cell selective cytotoxicity of arabinosylguanine. Blood 102, 1842–1848 (2003).
111. Krenitsky, T. A. et al. An enzymatic synthesis of purine-d-arabinonucleosides. Carbohydr. Res. 97, 139–146 (1981).
112. Lambe, C. U. et al. 2-amino-6-methoxypurine arabinoside: an agent for T-cell malignancies. Cancer Res. 55, 3352–3356 (1995).
113. Gandhi, V., Keating, M. J., Bate, G. & Kirkpatrick, P. Nelarabine. Nature Rev. Drug Discov. 5, 17–18 (2006).
114. Lock, E. A. et al. From toxicological problem to therapeutic use: the discovery of the mode of action of 2-(2-nitro-4-trifluoromethylbenzoyl)-1, 3-cyclohexanedione (NTBC), its toxicology and development as a drug. J. Inherit. Metab. Dis. 21, 498–506 (1998).
115. Kavana, M. & Moran, G. R. Interaction of (4-hydroxyphenyl)pyruvate dioxygenase with the specific inhibitor 2-[2-Nitro-4-(trifluoromethyl)benzoly]-1,3-cyclohexanedione. Biochemistry 42, 10238–10245 (2003).
116. Brownlee, J. M., Johnson-Winters, K., Harrison, D. H. T. & Moran, G. R. Structure of the ferrous form of 4-(hydroxyphenyl)pyruvate dehydrogenase from Streptomyces avermitilis in complex with the therapeutic herbicide, NTBC. Biochemistry 43, 6370–6377 (2004).
117. Yanagihara, Y., Kasai, H., Kawashima, T. & Shida, T. Immunopharmacological studies on TBX, a new antiallergic drug (1). Inhibitory effects on passive cutaneous anaphylaxis in rats and guinea pigs. Jpn. J. Pharmacol. 48, 91–101 (1988).
118. Gaffney, S. M. Ranolazine, a novel agent for chronic stable angina. Pharmacotherapy 26, 135–142 (2006).
A N A LY S I S
518 | JULY 2011 | VOLUME 10 www.nature.com/reviews/drugdisc
nrd_3480_jul11.indd 518 22/06/2011 10:16
Biopharma Dealmakers features a series of business profi les from the leading biotech and pharmaceutical companies responsible for creating tomorrow’s innovations.
By placing a customized advertising profi le in BioPharma Dealmakers, you can communicate your needs, vision, and unique products and technologies to a global audience of 130,000+ scientifi c infl uencers, business development professionals and fi nanciers. All issues of BioPharma Dealmakers appear in Nature Biotechnology and Nature Reviews Drug Discovery in both print and online. Don’t miss out on this unique opportunity!
www.nature.com/biopharmadealmakers
Attract attention from leading biopharma companies and academia, to find that perfect business partner.
12663-25_BioPharmaDealmakers.indd 1 10/06/2011 13:13
Human monoclonal antibodies (mAbs) are the fastest-growing category of mAb therapeutics entering clinical study1–3. Although the technologies developed in the 1970s and early 1980s to produce murine (rodent-derived) mAbs could be applied to produce human candidates4, few human mAbs entered clinical development owing to manufacturing challenges. Murine anti-bodies are easier to produce, but are limited by safety issues and diminished efficacy owing to the immunogenicity of the mouse-derived protein sequences.
In the mid-1980s, several avenues were explored to improve the characteristics of therapeutic mAbs, based in part on the hypothesis that reducing the extent of, or eliminating, mouse-derived sequences would reduce mAb immunogenicity (BOX 1). One path focused on the develop-ment of mAbs that contained a combination of rodent-derived and human-derived sequences, resulting in chimeric and human-ized mAbs. These versions constituted the majority of candidates in clinical study
during the 1990s (FIG. 1), and two-thirds of the 24 mAbs currently on the market in the United States are either chimeric or humanized products.
An alternative path focused on the generation of human mAbs from transgenic-mouse technologies and phage-display technologies. However, patent disputes impeded broad use of these methods and contributed to the dearth of candidates in the clinic during the 1990s. During the 2000s, human mAbs constituted 45% of the mAb candidates in the clinic (FIG. 1), and 88 are now in clinical develop-ment. So far, seven human mAbs have been approved for marketing in the United States: adalimumab (Humira; Abbott), panitu-mumab (Vectibix; Amgen), golimumab (Simponi; Centocor), canakinumab (Ilaris; Novartis), ustekinumab (Stelara; Johnson & Johnson), ofatumumab (Arzerra; Genmab) and denosumab (Prolia; Amgen). Moreover, three candidates are undergoing review by the US Food and Drug Administration (FDA): raxibacumab and belimumab, both
under development by Human Genome Sciences, and ipilimumab, under development by Bristol-Myers Squibb.
To determine trends in the clinical study of human mAbs, we analysed data for a total of 147 candidates that entered clinical study between 1985 and 2008, focusing primarily on the 131 candidates that entered studies after 1996 (see BOX 2 for an explana-tion of data sources and methods). Owing to the large body of literature on these mAbs, only limited references to the primary litera-ture are given. We analysed data for human mAbs as a single cohort and stratified the data by clinical indication and source technology to determine developmental trends and rates of approval success in the United States. Our results should inform the future research and development of these therapeutics.
Clinical development, 1985–1996Human mAb therapeutics first entered the clinic in the mid-1980s, but only 16 human mAbs that fit the selection criteria (BOX 2) entered clinical development during the 12-year period of 1985–1996. By contrast, 131 human mAbs were first studied in the clinic during the following 12-year period (1997–2008) (FIG. 2). As recombinant DNA technology was at an early stage of develop-ment in the 1980s, human mAbs could be produced through only a few methods — for example, through the generation of human hybridomas derived from human lymphocytes and from myeloma cell lines5–7 or from immortalization of primary human lymphocytes using the Epstein–Barr virus8,9. Although these approaches were innovative at the time, they proved to be unreliable, produced insufficient quantities of antibodies and were vulnerable to con-tamination4,10. An additional limitation was that the source cells were lymphocytes from patients, who produced the cells through natural processes; for ethical reasons, it was not possible to ‘immunize’ patients with an experimental antigen in a controlled manner and then collect the resulting lym-phocytes. Early human mAbs evaluated in the clinic were therefore limited to targets relevant to infectious diseases (62.5%) and cancer (37.5%).
O U T LO O K
Development trends for human monoclonal antibody therapeuticsAaron L. Nelson, Eugen Dhimolea and Janice M. Reichert
Abstract | Fully human monoclonal antibodies (mAbs) are a promising and rapidly growing category of targeted therapeutic agents. The first such agents were developed during the 1980s, but none achieved clinical or commercial success. Advances in technology to generate the molecules for study — in particular, transgenic mice and yeast or phage display — renewed interest in the development of human mAbs during the 1990s. In 2002, adalimumab became the first human mAb to be approved by the US Food and Drug Administration (FDA). Since then, an additional six human mAbs have received FDA approval: panitumumab, golimumab, canakinumab, ustekinumab, ofatumumab and denosumab. In addition, 3 candidates (raxibacumab, belimumab and ipilimumab) are currently under review by the FDA, 7 are in Phase III studies and 81 are in either Phase I or II studies. Here, we analyse data on 147 human mAbs that have entered clinical study to highlight trends in their development and approval, which may help inform future studies of this class of therapeutic agents.
PerSPecTIveS
NATUrE rEVIEWS | Drug Discovery VOlUME 9 | OCTOBEr 2010 | 767
nrd_3229_oct10.indd 767 17/9/10 11:50:12
www.nature.com/reprintcollections/lilly/drug-innovation NATURE REPRINT COLLECTION | THE FUTURE OF DRUG INNOVATION | OCTOBER 2011 | 37
Biopharma Dealmakers features a series of business profi les from the leading biotech and pharmaceutical companies responsible for creating tomorrow’s innovations.
By placing a customized advertising profi le in BioPharma Dealmakers, you can communicate your needs, vision, and unique products and technologies to a global audience of 130,000+ scientifi c infl uencers, business development professionals and fi nanciers. All issues of BioPharma Dealmakers appear in Nature Biotechnology and Nature Reviews Drug Discovery in both print and online. Don’t miss out on this unique opportunity!
www.nature.com/biopharmadealmakers
Attract attention from leading biopharma companies and academia, to find that perfect business partner.
12663-25_BioPharmaDealmakers.indd 1 10/06/2011 13:13
Human monoclonal antibodies (mAbs) are the fastest-growing category of mAb therapeutics entering clinical study1–3. Although the technologies developed in the 1970s and early 1980s to produce murine (rodent-derived) mAbs could be applied to produce human candidates4, few human mAbs entered clinical development owing to manufacturing challenges. Murine anti-bodies are easier to produce, but are limited by safety issues and diminished efficacy owing to the immunogenicity of the mouse-derived protein sequences.
In the mid-1980s, several avenues were explored to improve the characteristics of therapeutic mAbs, based in part on the hypothesis that reducing the extent of, or eliminating, mouse-derived sequences would reduce mAb immunogenicity (BOX 1). One path focused on the develop-ment of mAbs that contained a combination of rodent-derived and human-derived sequences, resulting in chimeric and human-ized mAbs. These versions constituted the majority of candidates in clinical study
during the 1990s (FIG. 1), and two-thirds of the 24 mAbs currently on the market in the United States are either chimeric or humanized products.
An alternative path focused on the generation of human mAbs from transgenic-mouse technologies and phage-display technologies. However, patent disputes impeded broad use of these methods and contributed to the dearth of candidates in the clinic during the 1990s. During the 2000s, human mAbs constituted 45% of the mAb candidates in the clinic (FIG. 1), and 88 are now in clinical develop-ment. So far, seven human mAbs have been approved for marketing in the United States: adalimumab (Humira; Abbott), panitu-mumab (Vectibix; Amgen), golimumab (Simponi; Centocor), canakinumab (Ilaris; Novartis), ustekinumab (Stelara; Johnson & Johnson), ofatumumab (Arzerra; Genmab) and denosumab (Prolia; Amgen). Moreover, three candidates are undergoing review by the US Food and Drug Administration (FDA): raxibacumab and belimumab, both
under development by Human Genome Sciences, and ipilimumab, under development by Bristol-Myers Squibb.
To determine trends in the clinical study of human mAbs, we analysed data for a total of 147 candidates that entered clinical study between 1985 and 2008, focusing primarily on the 131 candidates that entered studies after 1996 (see BOX 2 for an explana-tion of data sources and methods). Owing to the large body of literature on these mAbs, only limited references to the primary litera-ture are given. We analysed data for human mAbs as a single cohort and stratified the data by clinical indication and source technology to determine developmental trends and rates of approval success in the United States. Our results should inform the future research and development of these therapeutics.
Clinical development, 1985–1996Human mAb therapeutics first entered the clinic in the mid-1980s, but only 16 human mAbs that fit the selection criteria (BOX 2) entered clinical development during the 12-year period of 1985–1996. By contrast, 131 human mAbs were first studied in the clinic during the following 12-year period (1997–2008) (FIG. 2). As recombinant DNA technology was at an early stage of develop-ment in the 1980s, human mAbs could be produced through only a few methods — for example, through the generation of human hybridomas derived from human lymphocytes and from myeloma cell lines5–7 or from immortalization of primary human lymphocytes using the Epstein–Barr virus8,9. Although these approaches were innovative at the time, they proved to be unreliable, produced insufficient quantities of antibodies and were vulnerable to con-tamination4,10. An additional limitation was that the source cells were lymphocytes from patients, who produced the cells through natural processes; for ethical reasons, it was not possible to ‘immunize’ patients with an experimental antigen in a controlled manner and then collect the resulting lym-phocytes. Early human mAbs evaluated in the clinic were therefore limited to targets relevant to infectious diseases (62.5%) and cancer (37.5%).
O U T LO O K
Development trends for human monoclonal antibody therapeuticsAaron L. Nelson, Eugen Dhimolea and Janice M. Reichert
Abstract | Fully human monoclonal antibodies (mAbs) are a promising and rapidly growing category of targeted therapeutic agents. The first such agents were developed during the 1980s, but none achieved clinical or commercial success. Advances in technology to generate the molecules for study — in particular, transgenic mice and yeast or phage display — renewed interest in the development of human mAbs during the 1990s. In 2002, adalimumab became the first human mAb to be approved by the US Food and Drug Administration (FDA). Since then, an additional six human mAbs have received FDA approval: panitumumab, golimumab, canakinumab, ustekinumab, ofatumumab and denosumab. In addition, 3 candidates (raxibacumab, belimumab and ipilimumab) are currently under review by the FDA, 7 are in Phase III studies and 81 are in either Phase I or II studies. Here, we analyse data on 147 human mAbs that have entered clinical study to highlight trends in their development and approval, which may help inform future studies of this class of therapeutic agents.
PerSPecTIveS
NATUrE rEVIEWS | Drug Discovery VOlUME 9 | OCTOBEr 2010 | 767
nrd_3229_oct10.indd 767 17/9/10 11:50:12
First published in Nature Reviews Drug Discovery 9, 767-774 (October 2010) | doi:10.1038/nrd3229
38 | OCTOBER 2011 | THE FUTURE OF DRUG INNOVATION | NATURE REPRINT COLLECTION www.nature.com/reprintcollections/lilly/drug-innovation
Nature Reviews | Drug Discovery
mA
b pi
pelin
e (%
)
50
45
40
35
30
25
20
15
10
5
0Humanized HumanChimericMurine
30
7
13.5
9
45
39
11.5
451990–19992000–2008
Approval was based on a single Phase III trial20, as well as on smaller proof-of-concept studies21. CAPS are rare, with the number of patients with CAPS living in the United States estimated to be in the hundreds or low thousands. In October 2009, canakinumab was approved in the European Union for patients with CAPS as young as 4 years old. Canakinumab is currently in early-stage studies for the treatment of other disorders, including rheumatoid arthritis, gout and diabetes mellitus.
Ustekinumab, another UltiMab-derived product, targets the p40 subunit shared by Il-12 and Il-23. The mAb was approved by the FDA in September 2009 as a treatment for plaque psoriasis. Two Phase III studies in patients with moderate to severe plaque psoriasis have been completed, as well as a third Phase III study comparing ustekinumab with etanercept (Enbrel; Amgen/Pfizer), a fusion protein that targets TNF, in the same patient population22. In January 2009, the European Commission approved ustekinu-mab for treating moderate to severe plaque psoriasis in adults. Ustekinumab is also currently in Phase II studies as a treatment for sarcoidosis, and in Phase III studies as a treatment for palmoplantar pustular psoriasis, palmoplantar pustulosis or psoriatic arthritis.
Ofatumumab is a CD20-specific mAb generated from the UltiMab platform. It targets a CD20 epitope that is distinct from the epitope targeted by rituximab (rituxan/MabThera; Genentech/Biogen Idec/roche), the pioneering CD20-specific chimeric mAb. rituximab was approved for the treatment of non-Hodgkin’s lym-phoma in 1997, and subsequently has also received regulatory approval for the treat-ment of rheumatoid arthritis and chronic lymphocytic leukaemia23,24. Ofatumumab was approved by the FDA in October 2009, and given a conditional approval by the European Commission in April 2010, for the treatment of chronic lymphocytic leu-kaemia that is refractory to the humanized mAb alemtuzumab (Campath; Genzyme) and the nucleoside analogue fludarabine. Ofatumumab is under Phase III evaluation in patients with non-Hodgkin’s lymphoma and in patients with rheumatoid arthritis25.
Denosumab, a mAb specific for receptor activator of nuclear factor-κB ligand (rANKl), was approved by the FDA in June 2010 for the treatment of postmeno-pausal osteoporosis (PMO) in women. Trials have also been conducted to support a prevention indication for PMO, as well as for the treatment and prevention of bone loss in patients undergoing hormone ablation therapy for prostate or breast cancer26. Denosumab was approved in Europe for the treatment of PMO and of bone loss in patients with prostate cancer undergoing hormone ablation therapy. It is also undergoing regu-latory review in Switzerland, Australia and Canada for one or more of these indications.
Although not yet approved, three human mAbs — raxibacumab, belimumab and ipilimumab — are currently undergoing review by the FDA. Human Genome Sciences is the sponsor of both raxibacumab and belimumab, and Bristol-Myers Squibb is sponsoring ipilimumab. raxibacumab binds Bacillus anthracis protective antigen and has been developed as a treatment for inhalation anthrax27. Human Genome Sciences initiated the delivery of 20,000 doses of raxibacumab to the US Strategic National Stockpile for emergency use under a contract with the US Biomedical Advanced research and Development Authority, and an additional 45,000 doses were ordered in July 2009.
Belimumab is a human mAb specific for B lymphocyte stimulator, and was identified through use of phage-display-based tech-nologies in collaboration with Cambridge Antibody Technology. GlaxoSmithKline and Human Genome Sciences submitted marketing applications to both the FDA and the European Medicines Agency in June 2010 for the use of belimumab in systemic lupus erythematosus. This submission is based primarily on clinical and biomarker improvements in two pivotal Phase III trials in systemic lupus erythematosus — BlISS-52 and BlISS-76, which collectively involved 1,684 patients with this disease globally28 — as well as favourable post-hoc analyses of Phase II studies29. If the applica-tion is successful, belimumab will be the first new therapeutic approved for systemic lupus erythematosus in 50 years. GlaxoSmithKline and Human Genome Sciences are further
Figure 1 | Percentage of four types of mAbs in clinical development during the periods 1990–1999 and 2000–2008. Monoclonal anti-bodies (mAbs) that entered clinical study spon-sored by commercial firms between 1990 and 1999 and between 2000 and 2008 were classified according to their sequence source: murine only, chimeric (murine variable regions and human constant regions), humanized (human with murine complementarity-determining regions), and human only. These data demonstrate the substantial increase in the clinical study of human mAbs in the 2000s, a trend towards reduced use of humanization and chimeric candidates, and a dramatic reduction in the number of murine mAbs in clinical development in the 2000s.
Box 2 | Analysis criteria
Since it was founded in 1976, the Tufts Center for the Study of Drug Development has collected data on the clinical study and approval of therapeutics and vaccines. Data for monoclonal antibodies (mAbs) were collected by surveying pharmaceutical and biotechnology firms, from public documents and from commercially available databases (IDdb3, IMS R&D Focus and PharmaProjects). Data were updated with all changes that were noted until June 2010.
The data set comprises a total of 147 human mAbs that entered clinical study sponsored by commercial firms between January 1985 and December 2008, 131 of which entered study between 1997 and 2008. The status of the candidates was as follows: 88 were in clinical studies and not yet approved in any country (30 in Phase I, 51 in Phase II and 7 in Phase III); 3 were under regulatory review by the US Food and Drug Administration; 7 were approved in the United States; and 49 were discontinued. Candidates in Phase I or II were assigned to Phase II, and products in Phase II or III were assigned to Phase III. The human mAb data were compared with data for humanized mAbs that entered clinical study between 1988 and 2008 (n = 167) and between 1997 and 2008 (n = 133).
Approval success calculations were based on data for candidates with known fates (market approval in the United States or discontinuation of all clinical studies). Percentage completion was defined as the percentage of candidates with a known fate in a given cohort. Clinical-phase transition probabilities were calculated as follows: the number of candidates that successfully completed a given phase was divided by the difference between the number of candidates that entered the phase and those that were still in the phase at the time of the calculation. Transitions occurring between phases of clinical studies conducted worldwide were included.
P e r s P e c t i v e s
NATUrE rEVIEWS | Drug Discovery VOlUME 9 | OCTOBEr 2010 | 769
nrd_3229_oct10.indd 769 17/9/10 11:50:12
Fifteen out of the 16 early human mAb candidates were terminated during clinical development. One candidate — nebacumab (Centoxin; Centocor) — was approved for marketing, but the product was subsequently withdrawn. Nebacumab was a human hybridoma-derived endotoxin-specific immunoglobulin M (IgM) mAb. It was approved for the treatment of sepsis or Gram-negative bacteraemia11 and was the first human therapeutic mAb to be reviewed by a regulatory agency. Statistically significant benefits that were observed post-hoc in sub-populations in a multi-centre, randomized, double-blind, placebo-controlled clinical trial12 supported marketing approval in several European countries and in New Zealand. A marketing application was submit-ted in the United States, but a second study required by the FDA13,14, the CHESS trial, was terminated early when an interim analysis found a non-statistically significant increase in mortality in patients without Gram-negative bacteraemia treated with the antibody15. Centocor voluntarily withdrew the product and suspended further development.
Clinical development, 1997–2008In the late 1990s, human mAb therapeutics derived from transgenic-mouse or phage-display technologies first entered clinical development. Between 1997 and 2008, a total of 131 human mAbs entered clinical study, at a rate of least 11 per year between 2001 and 2008 (FIG. 2). Of the 131 candidates, 88 were in active clinical development, with 7 in Phase III studies, 51 in Phase II and 30 in Phase I. A total of 7 were approved for marketing by the FDA, 3 are undergoing review by the FDA and the clinical study of 33 was discontinued.
Approved human mAbsSeven human mAbs have been approved in the United States and in the European Union (TABLE 1). The first product (adalimumab) was approved by the FDA in 2002, with the second following in 2006. Notably, a total of four human mAbs were approved by the FDA in 2009.
Adalimumab is specific for tumour necrosis factor (TNF) and was the first human mAb approved by the FDA. The
product, which was developed using phage-display technology from Cambridge Antibody Technology, was approved in December 2002 as a treatment for adult patients with moderately to severely active rheumatoid arthritis. Adalimumab was subsequently approved by the FDA for the following indications: psoriatic arthritis (in 2005), ankylosing spondylitis (in 2006) and Crohn’s disease (in 2007), as well as for juvenile idiopathic arthritis and chronic plaque psoriasis (both in 2008). Adalimumab is also approved for the treatment of these diseases in the European Union. According to the manufacturer, adalimumab generated US$4.5 billion in global sales in 2008 (REF. 16).
Panitumumab is a human mAb that is specific for epidermal growth factor receptor (EGFr) and was discovered using Abgenix’s XenoMouse technology. The product was approved by the FDA in September 2006 for EGFr-expressing refractory metastatic colorectal carcinoma. The clinical develop-ment programme comprised a total of 15 studies initiated before approval, including 10 Phase I studies17. The product was given accelerated approval based on results from one randomized, controlled trial involving 463 patients who showed prolongation of the time to disease progression from 60 days to 97 days, but no impact on overall survival18. In December 2007, the European Commission granted conditional marketing approval for panitumumab as a treatment for EGFr-expressing metastatic colon cancer. Panitumumab generated global sales of $153 million in 2008.
Golimumab is a TNF-specific IgG1 mAb that was approved in April 2009 by the FDA for the treatment of rheumatoid arthritis, psoriatic arthritis and ankylosing spondylitis. The mAb was generated using Medarex’s UltiMab transgenic mouse platform. Although both adalimumab and golimumab are human TNF-specific mAbs, golimumab has a once per month subcutaneous dosing regimen, whereas adalimumab is adminis-tered every other week19. In October 2009, golimumab was approved in the European Union as a once per month, subcutaneous therapy for the treatment of moderate to severe, active rheumatoid arthritis, of active and progressive psoriatic arthritis, and of severe, active ankylosing spondylitis.
Canakinumab, an interleukin-1β (Il-1β)-specific IgG1 mAb derived from the UltiMab platform technology was approved by the FDA in June 2009 as a treatment for cryopyrin-associated periodic syndromes (CAPS), which include rare genetic fever disorders such as Muckle–Wells syndrome.
Box 1 | Immunogenicity of human monoclonal antibodies
The immunogenicity of therapeutic proteins, including monoclonal antibodies (mAbs), affects the safety and efficacy of these products40. Immune responses to therapeutic mAbs are undesirable as they can neutralize the action of therapeutic mAbs41, and hypersensitivity can result in morbidity and mortality42. For example, development of antibodies against adalimumab (Humira; Abbott) has been associated with lower serum drug levels and poor clinical response43,44.
Development of human mAbs was based on the hypothesis that they would prove to be less immunogenic than chimeric or humanized mAbs, both of which contain some murine-derived protein sequences. In general, eliminating rodent sequences reduces the frequency of mAb-targeted immune responses and hypersensitivity reactions45. For example, only 1% of patients treated with panitumumab (Vectibix; Amgen) tested positive for neutralizing antibodies46,47. By contrast, the presence of pretreatment serum autoantibodies (approximately 22% of patients) against the chimeric mAb cetuximab (Erbitux; Bristol-Myers Squibb/Merck/ImClone Systems) was significantly associated with patient hypersensitivity48. However, the immunogenicity of specific mAb candidates cannot be predicted based only on the amount of non-human sequence in the molecule. This is because various other factors can affect immunogenicity rates — for example, the type of disease being treated43,49 or the concomitant administration of immunosuppresive agents50. In addition, immunogenicity rates can vary between studies. Different methods in different studies, such as enzyme-linked immunosorbent assay or surface plasmon resonance, may be used to quantify drug-specific antibodies51, and the results reported will depend on the sensitivity of the assay52.
Several lines of thought suggest that it is unreasonable to expect human mAb therapeutics to have immunogenicity rates of zero. For example, humans are diverse in genotype and phenotype, and immunoglobulin G allotypes differ within and between populations53. In addition, the ability of the human immune system to generate natural anti-idiotypic antibodies is well documented54; the presence of such antibodies in polyclonal intravenous immunoglobulin preparations may contribute to the efficacy of the products55. Various methods to reduce the immunogenicity of human mAbs have been suggested, such as production of allotypical variants of mAb products to match the specific immunoglobulin gene segment alleles found in the genomes of distinct patient populations, or the use of protein engineering on the complementarity-determining region of the mAb53,56. Although the causes of, and potential solutions to, immunogenicity of human mAbs are still being investigated, it is clear that immunogenicity must be included as part of the overall evaluation of the risk to benefit ratio for patients57.
P e r s P e c t i v e s
768 | OCTOBEr 2010 | VOlUME 9 www.nature.com/reviews/drugdisc
nrd_3229_oct10.indd 768 17/9/10 11:50:12
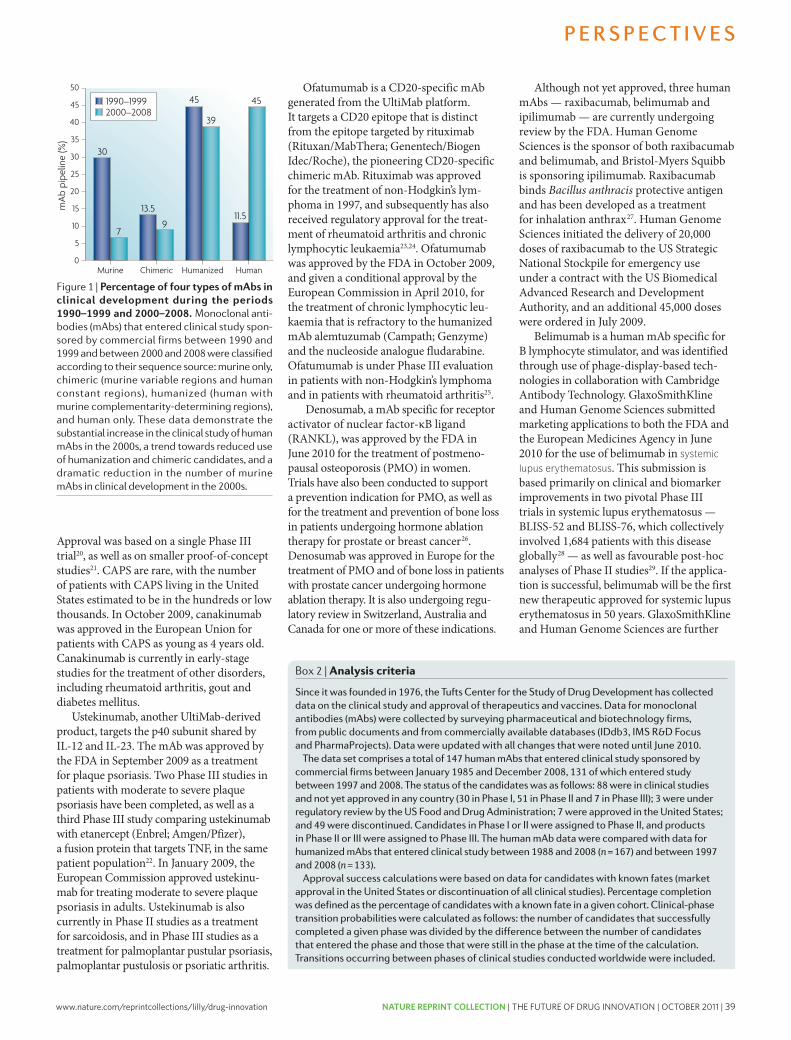
www.nature.com/reprintcollections/lilly/drug-innovation NATURE REPRINT COLLECTION | THE FUTURE OF DRUG INNOVATION | OCTOBER 2011 | 39
Nature Reviews | Drug Discovery
mA
b pi
pelin
e (%
)
50
45
40
35
30
25
20
15
10
5
0Humanized HumanChimericMurine
30
7
13.5
9
45
39
11.5
451990–19992000–2008
Approval was based on a single Phase III trial20, as well as on smaller proof-of-concept studies21. CAPS are rare, with the number of patients with CAPS living in the United States estimated to be in the hundreds or low thousands. In October 2009, canakinumab was approved in the European Union for patients with CAPS as young as 4 years old. Canakinumab is currently in early-stage studies for the treatment of other disorders, including rheumatoid arthritis, gout and diabetes mellitus.
Ustekinumab, another UltiMab-derived product, targets the p40 subunit shared by Il-12 and Il-23. The mAb was approved by the FDA in September 2009 as a treatment for plaque psoriasis. Two Phase III studies in patients with moderate to severe plaque psoriasis have been completed, as well as a third Phase III study comparing ustekinumab with etanercept (Enbrel; Amgen/Pfizer), a fusion protein that targets TNF, in the same patient population22. In January 2009, the European Commission approved ustekinu-mab for treating moderate to severe plaque psoriasis in adults. Ustekinumab is also currently in Phase II studies as a treatment for sarcoidosis, and in Phase III studies as a treatment for palmoplantar pustular psoriasis, palmoplantar pustulosis or psoriatic arthritis.
Ofatumumab is a CD20-specific mAb generated from the UltiMab platform. It targets a CD20 epitope that is distinct from the epitope targeted by rituximab (rituxan/MabThera; Genentech/Biogen Idec/roche), the pioneering CD20-specific chimeric mAb. rituximab was approved for the treatment of non-Hodgkin’s lym-phoma in 1997, and subsequently has also received regulatory approval for the treat-ment of rheumatoid arthritis and chronic lymphocytic leukaemia23,24. Ofatumumab was approved by the FDA in October 2009, and given a conditional approval by the European Commission in April 2010, for the treatment of chronic lymphocytic leu-kaemia that is refractory to the humanized mAb alemtuzumab (Campath; Genzyme) and the nucleoside analogue fludarabine. Ofatumumab is under Phase III evaluation in patients with non-Hodgkin’s lymphoma and in patients with rheumatoid arthritis25.
Denosumab, a mAb specific for receptor activator of nuclear factor-κB ligand (rANKl), was approved by the FDA in June 2010 for the treatment of postmeno-pausal osteoporosis (PMO) in women. Trials have also been conducted to support a prevention indication for PMO, as well as for the treatment and prevention of bone loss in patients undergoing hormone ablation therapy for prostate or breast cancer26. Denosumab was approved in Europe for the treatment of PMO and of bone loss in patients with prostate cancer undergoing hormone ablation therapy. It is also undergoing regu-latory review in Switzerland, Australia and Canada for one or more of these indications.
Although not yet approved, three human mAbs — raxibacumab, belimumab and ipilimumab — are currently undergoing review by the FDA. Human Genome Sciences is the sponsor of both raxibacumab and belimumab, and Bristol-Myers Squibb is sponsoring ipilimumab. raxibacumab binds Bacillus anthracis protective antigen and has been developed as a treatment for inhalation anthrax27. Human Genome Sciences initiated the delivery of 20,000 doses of raxibacumab to the US Strategic National Stockpile for emergency use under a contract with the US Biomedical Advanced research and Development Authority, and an additional 45,000 doses were ordered in July 2009.
Belimumab is a human mAb specific for B lymphocyte stimulator, and was identified through use of phage-display-based tech-nologies in collaboration with Cambridge Antibody Technology. GlaxoSmithKline and Human Genome Sciences submitted marketing applications to both the FDA and the European Medicines Agency in June 2010 for the use of belimumab in systemic lupus erythematosus. This submission is based primarily on clinical and biomarker improvements in two pivotal Phase III trials in systemic lupus erythematosus — BlISS-52 and BlISS-76, which collectively involved 1,684 patients with this disease globally28 — as well as favourable post-hoc analyses of Phase II studies29. If the applica-tion is successful, belimumab will be the first new therapeutic approved for systemic lupus erythematosus in 50 years. GlaxoSmithKline and Human Genome Sciences are further
Figure 1 | Percentage of four types of mAbs in clinical development during the periods 1990–1999 and 2000–2008. Monoclonal anti-bodies (mAbs) that entered clinical study spon-sored by commercial firms between 1990 and 1999 and between 2000 and 2008 were classified according to their sequence source: murine only, chimeric (murine variable regions and human constant regions), humanized (human with murine complementarity-determining regions), and human only. These data demonstrate the substantial increase in the clinical study of human mAbs in the 2000s, a trend towards reduced use of humanization and chimeric candidates, and a dramatic reduction in the number of murine mAbs in clinical development in the 2000s.
Box 2 | Analysis criteria
Since it was founded in 1976, the Tufts Center for the Study of Drug Development has collected data on the clinical study and approval of therapeutics and vaccines. Data for monoclonal antibodies (mAbs) were collected by surveying pharmaceutical and biotechnology firms, from public documents and from commercially available databases (IDdb3, IMS R&D Focus and PharmaProjects). Data were updated with all changes that were noted until June 2010.
The data set comprises a total of 147 human mAbs that entered clinical study sponsored by commercial firms between January 1985 and December 2008, 131 of which entered study between 1997 and 2008. The status of the candidates was as follows: 88 were in clinical studies and not yet approved in any country (30 in Phase I, 51 in Phase II and 7 in Phase III); 3 were under regulatory review by the US Food and Drug Administration; 7 were approved in the United States; and 49 were discontinued. Candidates in Phase I or II were assigned to Phase II, and products in Phase II or III were assigned to Phase III. The human mAb data were compared with data for humanized mAbs that entered clinical study between 1988 and 2008 (n = 167) and between 1997 and 2008 (n = 133).
Approval success calculations were based on data for candidates with known fates (market approval in the United States or discontinuation of all clinical studies). Percentage completion was defined as the percentage of candidates with a known fate in a given cohort. Clinical-phase transition probabilities were calculated as follows: the number of candidates that successfully completed a given phase was divided by the difference between the number of candidates that entered the phase and those that were still in the phase at the time of the calculation. Transitions occurring between phases of clinical studies conducted worldwide were included.
P e r s P e c t i v e s
NATUrE rEVIEWS | Drug Discovery VOlUME 9 | OCTOBEr 2010 | 769
nrd_3229_oct10.indd 769 17/9/10 11:50:12
Fifteen out of the 16 early human mAb candidates were terminated during clinical development. One candidate — nebacumab (Centoxin; Centocor) — was approved for marketing, but the product was subsequently withdrawn. Nebacumab was a human hybridoma-derived endotoxin-specific immunoglobulin M (IgM) mAb. It was approved for the treatment of sepsis or Gram-negative bacteraemia11 and was the first human therapeutic mAb to be reviewed by a regulatory agency. Statistically significant benefits that were observed post-hoc in sub-populations in a multi-centre, randomized, double-blind, placebo-controlled clinical trial12 supported marketing approval in several European countries and in New Zealand. A marketing application was submit-ted in the United States, but a second study required by the FDA13,14, the CHESS trial, was terminated early when an interim analysis found a non-statistically significant increase in mortality in patients without Gram-negative bacteraemia treated with the antibody15. Centocor voluntarily withdrew the product and suspended further development.
Clinical development, 1997–2008In the late 1990s, human mAb therapeutics derived from transgenic-mouse or phage-display technologies first entered clinical development. Between 1997 and 2008, a total of 131 human mAbs entered clinical study, at a rate of least 11 per year between 2001 and 2008 (FIG. 2). Of the 131 candidates, 88 were in active clinical development, with 7 in Phase III studies, 51 in Phase II and 30 in Phase I. A total of 7 were approved for marketing by the FDA, 3 are undergoing review by the FDA and the clinical study of 33 was discontinued.
Approved human mAbsSeven human mAbs have been approved in the United States and in the European Union (TABLE 1). The first product (adalimumab) was approved by the FDA in 2002, with the second following in 2006. Notably, a total of four human mAbs were approved by the FDA in 2009.
Adalimumab is specific for tumour necrosis factor (TNF) and was the first human mAb approved by the FDA. The
product, which was developed using phage-display technology from Cambridge Antibody Technology, was approved in December 2002 as a treatment for adult patients with moderately to severely active rheumatoid arthritis. Adalimumab was subsequently approved by the FDA for the following indications: psoriatic arthritis (in 2005), ankylosing spondylitis (in 2006) and Crohn’s disease (in 2007), as well as for juvenile idiopathic arthritis and chronic plaque psoriasis (both in 2008). Adalimumab is also approved for the treatment of these diseases in the European Union. According to the manufacturer, adalimumab generated US$4.5 billion in global sales in 2008 (REF. 16).
Panitumumab is a human mAb that is specific for epidermal growth factor receptor (EGFr) and was discovered using Abgenix’s XenoMouse technology. The product was approved by the FDA in September 2006 for EGFr-expressing refractory metastatic colorectal carcinoma. The clinical develop-ment programme comprised a total of 15 studies initiated before approval, including 10 Phase I studies17. The product was given accelerated approval based on results from one randomized, controlled trial involving 463 patients who showed prolongation of the time to disease progression from 60 days to 97 days, but no impact on overall survival18. In December 2007, the European Commission granted conditional marketing approval for panitumumab as a treatment for EGFr-expressing metastatic colon cancer. Panitumumab generated global sales of $153 million in 2008.
Golimumab is a TNF-specific IgG1 mAb that was approved in April 2009 by the FDA for the treatment of rheumatoid arthritis, psoriatic arthritis and ankylosing spondylitis. The mAb was generated using Medarex’s UltiMab transgenic mouse platform. Although both adalimumab and golimumab are human TNF-specific mAbs, golimumab has a once per month subcutaneous dosing regimen, whereas adalimumab is adminis-tered every other week19. In October 2009, golimumab was approved in the European Union as a once per month, subcutaneous therapy for the treatment of moderate to severe, active rheumatoid arthritis, of active and progressive psoriatic arthritis, and of severe, active ankylosing spondylitis.
Canakinumab, an interleukin-1β (Il-1β)-specific IgG1 mAb derived from the UltiMab platform technology was approved by the FDA in June 2009 as a treatment for cryopyrin-associated periodic syndromes (CAPS), which include rare genetic fever disorders such as Muckle–Wells syndrome.
Box 1 | Immunogenicity of human monoclonal antibodies
The immunogenicity of therapeutic proteins, including monoclonal antibodies (mAbs), affects the safety and efficacy of these products40. Immune responses to therapeutic mAbs are undesirable as they can neutralize the action of therapeutic mAbs41, and hypersensitivity can result in morbidity and mortality42. For example, development of antibodies against adalimumab (Humira; Abbott) has been associated with lower serum drug levels and poor clinical response43,44.
Development of human mAbs was based on the hypothesis that they would prove to be less immunogenic than chimeric or humanized mAbs, both of which contain some murine-derived protein sequences. In general, eliminating rodent sequences reduces the frequency of mAb-targeted immune responses and hypersensitivity reactions45. For example, only 1% of patients treated with panitumumab (Vectibix; Amgen) tested positive for neutralizing antibodies46,47. By contrast, the presence of pretreatment serum autoantibodies (approximately 22% of patients) against the chimeric mAb cetuximab (Erbitux; Bristol-Myers Squibb/Merck/ImClone Systems) was significantly associated with patient hypersensitivity48. However, the immunogenicity of specific mAb candidates cannot be predicted based only on the amount of non-human sequence in the molecule. This is because various other factors can affect immunogenicity rates — for example, the type of disease being treated43,49 or the concomitant administration of immunosuppresive agents50. In addition, immunogenicity rates can vary between studies. Different methods in different studies, such as enzyme-linked immunosorbent assay or surface plasmon resonance, may be used to quantify drug-specific antibodies51, and the results reported will depend on the sensitivity of the assay52.
Several lines of thought suggest that it is unreasonable to expect human mAb therapeutics to have immunogenicity rates of zero. For example, humans are diverse in genotype and phenotype, and immunoglobulin G allotypes differ within and between populations53. In addition, the ability of the human immune system to generate natural anti-idiotypic antibodies is well documented54; the presence of such antibodies in polyclonal intravenous immunoglobulin preparations may contribute to the efficacy of the products55. Various methods to reduce the immunogenicity of human mAbs have been suggested, such as production of allotypical variants of mAb products to match the specific immunoglobulin gene segment alleles found in the genomes of distinct patient populations, or the use of protein engineering on the complementarity-determining region of the mAb53,56. Although the causes of, and potential solutions to, immunogenicity of human mAbs are still being investigated, it is clear that immunogenicity must be included as part of the overall evaluation of the risk to benefit ratio for patients57.
P e r s P e c t i v e s
768 | OCTOBEr 2010 | VOlUME 9 www.nature.com/reviews/drugdisc
nrd_3229_oct10.indd 768 17/9/10 11:50:12
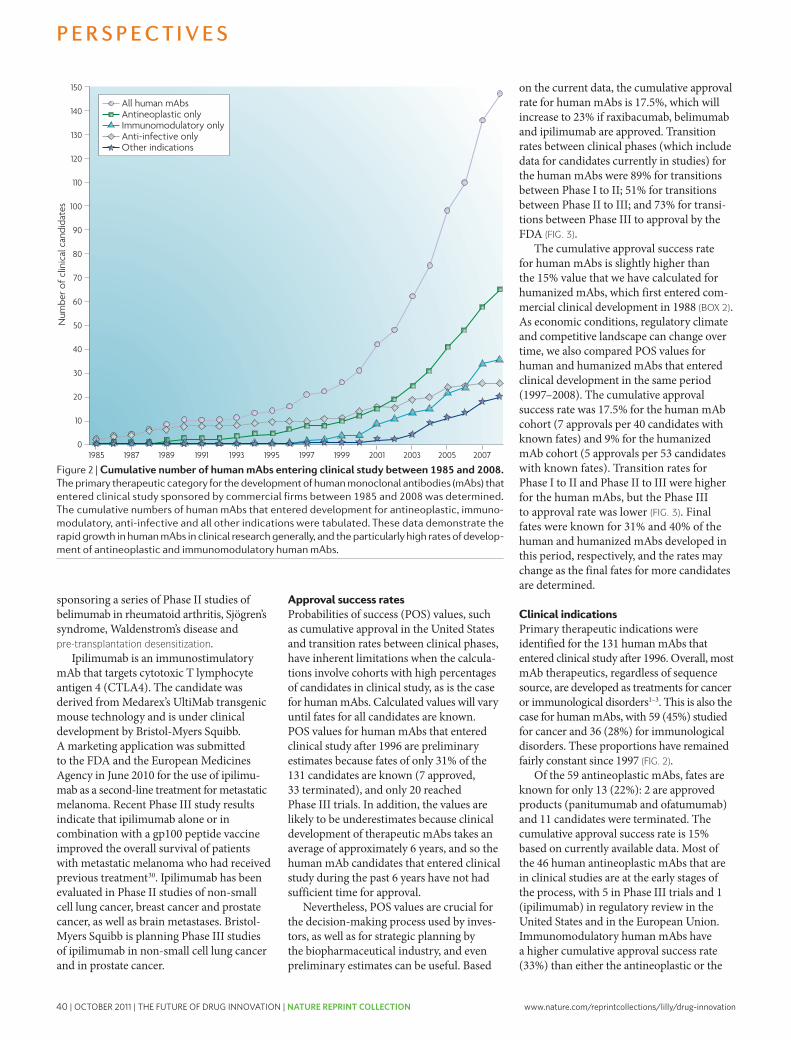
40 | OCTOBER 2011 | THE FUTURE OF DRUG INNOVATION | NATURE REPRINT COLLECTION www.nature.com/reprintcollections/lilly/drug-innovation
overall human mAb cohort. This calculation was based on data for only 12 molecules for which definite fates are known, including adalimumab, golimumab, canakinumab, ustekinumab and 8 terminated candidates. Of the 24 human immunomodulatory mAb candidates currently in clinical development, 8 are in Phase I, 13 are in Phase II, 2 are in Phase III and belimumab is undergoing regulatory review in the United States and in the European Union.
An additional 36 human mAbs that entered clinical study after 1996 were studied for non-traditional indications — that is, disorders that are not cancer or immunological in nature. Half of these were treatments for infectious diseases, with a focus on nosocomial, anthrax and chronic viral infections31. The remaining 18 candi-dates were studied for conditions such as osteoporosis, respiratory disorders, muscular dystrophy, Alzheimer’s disease and pain.
Of the 36 candidates, 1 (denosumab) has been approved, 1 (raxibacumab) is under-going review by the FDA (TABLE 1) and 14 were terminated. The current cumulative success rate for mAbs studied as treatments for these non-traditional indications is 6.6%, which will rise to 12.5% if raxibacumab is approved for inhalation anthrax. The 20 candidates in clinical development were all in either Phase I or II studies.
Molecular targetsThe target of a therapeutic antibody is a major determinant of its efficacy and safety profile. Antigenic targets were identified for 125 of the 131 human mAbs (TABLE 2). These mAbs targeted a total of 89 unique antigens, and only 22 antigens were targeted by two or more human mAbs. Seven antigens — CTlA4, EGFr, fibronectin, insulin-like growth factor 1 receptor (IGF1r), trans-forming growth factor-β (TGFβ), TNF and
TNF-related apoptosis-inducing ligand receptor 2 (TrAIlr2) — were targeted by more than two human mAbs. Of the 125 mAbs, 55 (44%) targeted antigens that are relevant to antineoplastic diseases, 36 (29%) targeted antigens relevant to immunological diseases and 17 (14%) targeted antigens relevant to infectious diseases.
Of the 55 anticancer candidates with known targets, 19 mAbs (33%) were specific for only 5 targets: IGF1r (6 mAbs), TrAIlr2 (4 mAbs), EGFr (3 mAbs), CTlA4 (3 mAbs) and fibronectin (3 mAbs). Of these, only EGFr was among the ten most frequently targeted antigens for all anticancer mAbs studied in the clinic from 1980 to 2005 (REF. 32), suggesting that devel-opers of human mAbs may be focusing on novel therapeutic strategies. Nevertheless, at least some human mAbs share oncology targets with therapeutic mAbs approved by the FDA, including EGFr (target of panitu-mumab and cetuximab) and CD20 (target of rituximab, ibritumomab tiuxetan (Zevalin; Spectrum Pharmaceuticals), iodine-131 tositumomab (Bexxar; GlaxoSmithKline) and ofatumumab). Most of the anti-neoplastic human mAbs target cell-surface molecules; only two were known to target soluble factors (hepatocyte growth factor and platelet-derived growth factor).
By contrast, 24 out of the 36 immuno-modulatory mAbs with known targets were raised against cytokines and serum factors. Interleukins constitute the largest target group; targeted antigens include Il-1β, Il-6, Il-8, Il-12, Il-13, Il-15, Il-18, Il-17A and Il-20. Ten out of the 36 mAbs target markers of leukocyte activity and differentiation, and are in early-phase clinical trials. Two immunomodulatory human mAbs with targets that are unique compared with those of marketed mAbs are currently in Phase II studies: briakinumab (developed by Abbott), which targets the p40 subunit common to Il-12 and Il-23, and AIN457 (developed by Novartis), which is an Il-17A-specific mAb.
The 18 human mAbs intended for the treatment of infectious diseases are a highly heterogeneous group. Ten are directed against targets implicated in viral infections, including HIV (six mAbs), viral hepatitis (three mAbs) and rabies (one mAb); several of these candidates are cocktails of more than one human mAb. Six human mAbs target bacterial antigens, of which four are bacterial cytotoxins, such as Clostridium difficile enterotoxins (MK-3415A; developed by Merck and Co.) and anthrax protective antigen (raxibacumab), and three target cellular features of Pseudomonas aeruginosa
Table 1 | Human mAbs approved or under FDA review*
Human mAb (trade name; company name)
Description indication of first us approval
FDA designations
Date of first us (eu) approval
Adalimumab (Humira; Abbott)
TNF-specific, IgG1κ
rheumatoid arthritis S 31 Dec 2002 (8 Sep 2003)
Panitumumab (vectibix; Amgen)
eGFr-specific, IgG2κ
colorectal cancer P, FT, AA 27 Sep 2006 (3 Dec 2007)
Golimumab (Simponi; centocor)
TNF-specific, IgG1
rheumatoid arthritis, psoriatic arthritis, ankylosing spondylitis
S 24 Apr 2009 (1 Oct 2009)
canakinumab (Ilaris; Novartis)
IL-1β-specific, IgG1κ
cryopyrin-associated periodic syndromes
P, O 18 Jun 2009 (23 Oct 2009)
Ustekinumab (Stelara; Johnson & Johnson)
IL-12/IL-23 p40-specific, IgG1
Plaque psoriasis S 25 Sep 2009 (16 Jan 2009)
Ofatumumab (Arzerra; Genmab)
cD20-specific, IgG1
chronic lymphocytic leukaemia
P, FT 26 Oct 2009 (19 Apr 2010)
Denosumab (Prolia; Amgen)
rANKL- specific, IgG2
Treatment of postmenopausal osteoporosis‡
S 1 Jun 2010 (26 May 2010)
raxibacumab PA-specific, IgG1
Inhalation anthrax P, FT, O Under review by the FDA
Belimumab B lymphocyte stimulator-specific, IgG1
Systemic lupus erythematosus
P, FT Under review by the FDA and the eMA
Ipilimumab cTLA4-specific, IgG1
Metastatic melanoma
P, FT, O Under review by the FDA and the eMA
AA, accelerated approval; cTLA, cytotoxic T lymphocyte-associated antigen; eGFr, epidermal growth factor receptor; eMA, european Medicines Agency; eU, european Union; FDA, US Food and Drug Administration; FT, FDA fast track drug; Ig, immunoglobulin; IL, interleukin; mAb, monoclonal antibody; O, FDA orphan drug; P, priority review; PA, Bacillus anthracis protective antigen; rANKL, receptor for activation of nuclear factor-κB ligand; S, standard review; TNF, tumour necrosis factor. *As of June 2010. ‡Also approved in europe for the treatment of bone loss in patients with prostate cancer undergoing hormone ablation therapy.
P e r s P e c t i v e s
NATUrE rEVIEWS | Drug Discovery VOlUME 9 | OCTOBEr 2010 | 771
nrd_3229_oct10.indd 771 17/9/10 11:50:14
Nature Reviews | Drug Discovery
Num
ber o
f clin
ical
can
dida
tes
150
90
100
110
120
130
140
80
70
60
50
40
30
20
10
01985 1987 1989 1991 1993 1995 1997 1999 2001 2003 2005 2007
All human mAbsAntineoplastic onlyImmunomodulatory onlyAnti-infective onlyOther indications
sponsoring a series of Phase II studies of belimumab in rheumatoid arthritis, Sjögren’s syndrome, Waldenstrom’s disease and pre-transplantation desensitization.
Ipilimumab is an immunostimulatory mAb that targets cytotoxic T lymphocyte antigen 4 (CTlA4). The candidate was derived from Medarex’s UltiMab transgenic mouse technology and is under clinical development by Bristol-Myers Squibb. A marketing application was submitted to the FDA and the European Medicines Agency in June 2010 for the use of ipilimu-mab as a second-line treatment for metastatic melanoma. recent Phase III study results indicate that ipilimumab alone or in combination with a gp100 peptide vaccine improved the overall survival of patients with metastatic melanoma who had received previous treatment30. Ipilimumab has been evaluated in Phase II studies of non-small cell lung cancer, breast cancer and prostate cancer, as well as brain metastases. Bristol-Myers Squibb is planning Phase III studies of ipilimumab in non-small cell lung cancer and in prostate cancer.
Approval success ratesProbabilities of success (POS) values, such as cumulative approval in the United States and transition rates between clinical phases, have inherent limitations when the calcula-tions involve cohorts with high percentages of candidates in clinical study, as is the case for human mAbs. Calculated values will vary until fates for all candidates are known. POS values for human mAbs that entered clinical study after 1996 are preliminary estimates because fates of only 31% of the 131 candidates are known (7 approved, 33 terminated), and only 20 reached Phase III trials. In addition, the values are likely to be underestimates because clinical development of therapeutic mAbs takes an average of approximately 6 years, and so the human mAb candidates that entered clinical study during the past 6 years have not had sufficient time for approval.
Nevertheless, POS values are crucial for the decision-making process used by inves-tors, as well as for strategic planning by the biopharmaceutical industry, and even preliminary estimates can be useful. Based
on the current data, the cumulative approval rate for human mAbs is 17.5%, which will increase to 23% if raxibacumab, belimumab and ipilimumab are approved. Transition rates between clinical phases (which include data for candidates currently in studies) for the human mAbs were 89% for transitions between Phase I to II; 51% for transitions between Phase II to III; and 73% for transi-tions between Phase III to approval by the FDA (FIG. 3).
The cumulative approval success rate for human mAbs is slightly higher than the 15% value that we have calculated for humanized mAbs, which first entered com-mercial clinical development in 1988 (BOX 2). As economic conditions, regulatory climate and competitive landscape can change over time, we also compared POS values for human and humanized mAbs that entered clinical development in the same period (1997–2008). The cumulative approval success rate was 17.5% for the human mAb cohort (7 approvals per 40 candidates with known fates) and 9% for the humanized mAb cohort (5 approvals per 53 candidates with known fates). Transition rates for Phase I to II and Phase II to III were higher for the human mAbs, but the Phase III to approval rate was lower (FIG. 3). Final fates were known for 31% and 40% of the human and humanized mAbs developed in this period, respectively, and the rates may change as the final fates for more candidates are determined.
Clinical indicationsPrimary therapeutic indications were identified for the 131 human mAbs that entered clinical study after 1996. Overall, most mAb therapeutics, regardless of sequence source, are developed as treatments for cancer or immunological disorders1–3. This is also the case for human mAbs, with 59 (45%) studied for cancer and 36 (28%) for immunological disorders. These proportions have remained fairly constant since 1997 (FIG. 2).
Of the 59 antineoplastic mAbs, fates are known for only 13 (22%): 2 are approved products (panitumumab and ofatumumab) and 11 candidates were terminated. The cumulative approval success rate is 15% based on currently available data. Most of the 46 human antineoplastic mAbs that are in clinical studies are at the early stages of the process, with 5 in Phase III trials and 1 (ipilimumab) in regulatory review in the United States and in the European Union. Immunomodulatory human mAbs have a higher cumulative approval success rate (33%) than either the antineoplastic or the
Figure 2 | cumulative number of human mAbs entering clinical study between 1985 and 2008. The primary therapeutic category for the development of human monoclonal antibodies (mAbs) that entered clinical study sponsored by commercial firms between 1985 and 2008 was determined. The cumulative numbers of human mAbs that entered development for antineoplastic, immuno-modulatory, anti-infective and all other indications were tabulated. These data demonstrate the rapid growth in human mAbs in clinical research generally, and the particularly high rates of develop-ment of antineo plastic and immunomodulatory human mAbs.
P e r s P e c t i v e s
770 | OCTOBEr 2010 | VOlUME 9 www.nature.com/reviews/drugdisc
nrd_3229_oct10.indd 770 17/9/10 11:50:13
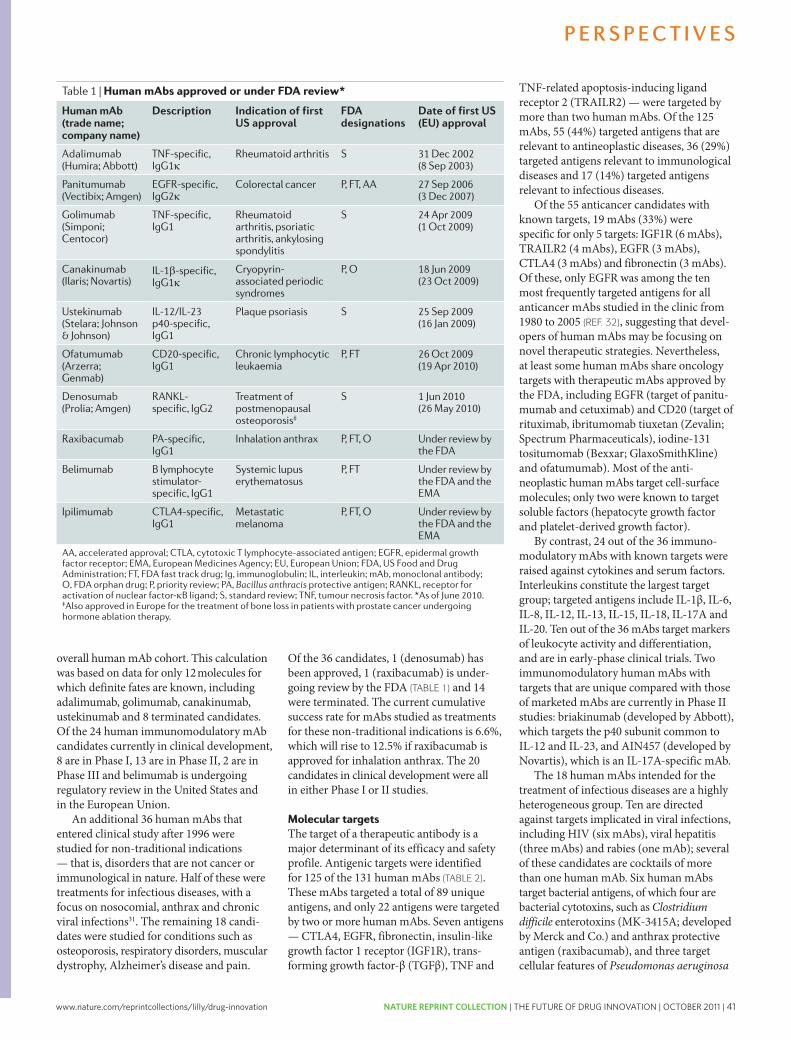
www.nature.com/reprintcollections/lilly/drug-innovation NATURE REPRINT COLLECTION | THE FUTURE OF DRUG INNOVATION | OCTOBER 2011 | 41
overall human mAb cohort. This calculation was based on data for only 12 molecules for which definite fates are known, including adalimumab, golimumab, canakinumab, ustekinumab and 8 terminated candidates. Of the 24 human immunomodulatory mAb candidates currently in clinical development, 8 are in Phase I, 13 are in Phase II, 2 are in Phase III and belimumab is undergoing regulatory review in the United States and in the European Union.
An additional 36 human mAbs that entered clinical study after 1996 were studied for non-traditional indications — that is, disorders that are not cancer or immunological in nature. Half of these were treatments for infectious diseases, with a focus on nosocomial, anthrax and chronic viral infections31. The remaining 18 candi-dates were studied for conditions such as osteoporosis, respiratory disorders, muscular dystrophy, Alzheimer’s disease and pain.
Of the 36 candidates, 1 (denosumab) has been approved, 1 (raxibacumab) is under-going review by the FDA (TABLE 1) and 14 were terminated. The current cumulative success rate for mAbs studied as treatments for these non-traditional indications is 6.6%, which will rise to 12.5% if raxibacumab is approved for inhalation anthrax. The 20 candidates in clinical development were all in either Phase I or II studies.
Molecular targetsThe target of a therapeutic antibody is a major determinant of its efficacy and safety profile. Antigenic targets were identified for 125 of the 131 human mAbs (TABLE 2). These mAbs targeted a total of 89 unique antigens, and only 22 antigens were targeted by two or more human mAbs. Seven antigens — CTlA4, EGFr, fibronectin, insulin-like growth factor 1 receptor (IGF1r), trans-forming growth factor-β (TGFβ), TNF and
TNF-related apoptosis-inducing ligand receptor 2 (TrAIlr2) — were targeted by more than two human mAbs. Of the 125 mAbs, 55 (44%) targeted antigens that are relevant to antineoplastic diseases, 36 (29%) targeted antigens relevant to immunological diseases and 17 (14%) targeted antigens relevant to infectious diseases.
Of the 55 anticancer candidates with known targets, 19 mAbs (33%) were specific for only 5 targets: IGF1r (6 mAbs), TrAIlr2 (4 mAbs), EGFr (3 mAbs), CTlA4 (3 mAbs) and fibronectin (3 mAbs). Of these, only EGFr was among the ten most frequently targeted antigens for all anticancer mAbs studied in the clinic from 1980 to 2005 (REF. 32), suggesting that devel-opers of human mAbs may be focusing on novel therapeutic strategies. Nevertheless, at least some human mAbs share oncology targets with therapeutic mAbs approved by the FDA, including EGFr (target of panitu-mumab and cetuximab) and CD20 (target of rituximab, ibritumomab tiuxetan (Zevalin; Spectrum Pharmaceuticals), iodine-131 tositumomab (Bexxar; GlaxoSmithKline) and ofatumumab). Most of the anti-neoplastic human mAbs target cell-surface molecules; only two were known to target soluble factors (hepatocyte growth factor and platelet-derived growth factor).
By contrast, 24 out of the 36 immuno-modulatory mAbs with known targets were raised against cytokines and serum factors. Interleukins constitute the largest target group; targeted antigens include Il-1β, Il-6, Il-8, Il-12, Il-13, Il-15, Il-18, Il-17A and Il-20. Ten out of the 36 mAbs target markers of leukocyte activity and differentiation, and are in early-phase clinical trials. Two immunomodulatory human mAbs with targets that are unique compared with those of marketed mAbs are currently in Phase II studies: briakinumab (developed by Abbott), which targets the p40 subunit common to Il-12 and Il-23, and AIN457 (developed by Novartis), which is an Il-17A-specific mAb.
The 18 human mAbs intended for the treatment of infectious diseases are a highly heterogeneous group. Ten are directed against targets implicated in viral infections, including HIV (six mAbs), viral hepatitis (three mAbs) and rabies (one mAb); several of these candidates are cocktails of more than one human mAb. Six human mAbs target bacterial antigens, of which four are bacterial cytotoxins, such as Clostridium difficile enterotoxins (MK-3415A; developed by Merck and Co.) and anthrax protective antigen (raxibacumab), and three target cellular features of Pseudomonas aeruginosa
Table 1 | Human mAbs approved or under FDA review*
Human mAb (trade name; company name)
Description indication of first us approval
FDA designations
Date of first us (eu) approval
Adalimumab (Humira; Abbott)
TNF-specific, IgG1κ
rheumatoid arthritis S 31 Dec 2002 (8 Sep 2003)
Panitumumab (vectibix; Amgen)
eGFr-specific, IgG2κ
colorectal cancer P, FT, AA 27 Sep 2006 (3 Dec 2007)
Golimumab (Simponi; centocor)
TNF-specific, IgG1
rheumatoid arthritis, psoriatic arthritis, ankylosing spondylitis
S 24 Apr 2009 (1 Oct 2009)
canakinumab (Ilaris; Novartis)
IL-1β-specific, IgG1κ
cryopyrin-associated periodic syndromes
P, O 18 Jun 2009 (23 Oct 2009)
Ustekinumab (Stelara; Johnson & Johnson)
IL-12/IL-23 p40-specific, IgG1
Plaque psoriasis S 25 Sep 2009 (16 Jan 2009)
Ofatumumab (Arzerra; Genmab)
cD20-specific, IgG1
chronic lymphocytic leukaemia
P, FT 26 Oct 2009 (19 Apr 2010)
Denosumab (Prolia; Amgen)
rANKL- specific, IgG2
Treatment of postmenopausal osteoporosis‡
S 1 Jun 2010 (26 May 2010)
raxibacumab PA-specific, IgG1
Inhalation anthrax P, FT, O Under review by the FDA
Belimumab B lymphocyte stimulator-specific, IgG1
Systemic lupus erythematosus
P, FT Under review by the FDA and the eMA
Ipilimumab cTLA4-specific, IgG1
Metastatic melanoma
P, FT, O Under review by the FDA and the eMA
AA, accelerated approval; cTLA, cytotoxic T lymphocyte-associated antigen; eGFr, epidermal growth factor receptor; eMA, european Medicines Agency; eU, european Union; FDA, US Food and Drug Administration; FT, FDA fast track drug; Ig, immunoglobulin; IL, interleukin; mAb, monoclonal antibody; O, FDA orphan drug; P, priority review; PA, Bacillus anthracis protective antigen; rANKL, receptor for activation of nuclear factor-κB ligand; S, standard review; TNF, tumour necrosis factor. *As of June 2010. ‡Also approved in europe for the treatment of bone loss in patients with prostate cancer undergoing hormone ablation therapy.
P e r s P e c t i v e s
NATUrE rEVIEWS | Drug Discovery VOlUME 9 | OCTOBEr 2010 | 771
nrd_3229_oct10.indd 771 17/9/10 11:50:14
Nature Reviews | Drug Discovery
Num
ber o
f cl
inic
al c
andi
date
s
150
90
100
110
120
130
140
80
70
60
50
40
30
20
10
01985 1987 1989 1991 1993 1995 1997 1999 2001 2003 2005 2007
All human mAbsAntineoplastic onlyImmunomodulatory onlyAnti-infective onlyOther indications
sponsoring a series of Phase II studies of belimumab in rheumatoid arthritis, Sjögren’s syndrome, Waldenstrom’s disease and pre-transplantation desensitization.
Ipilimumab is an immunostimulatory mAb that targets cytotoxic T lymphocyte antigen 4 (CTlA4). The candidate was derived from Medarex’s UltiMab transgenic mouse technology and is under clinical development by Bristol-Myers Squibb. A marketing application was submitted to the FDA and the European Medicines Agency in June 2010 for the use of ipilimu-mab as a second-line treatment for metastatic melanoma. recent Phase III study results indicate that ipilimumab alone or in combination with a gp100 peptide vaccine improved the overall survival of patients with metastatic melanoma who had received previous treatment30. Ipilimumab has been evaluated in Phase II studies of non-small cell lung cancer, breast cancer and prostate cancer, as well as brain metastases. Bristol-Myers Squibb is planning Phase III studies of ipilimumab in non-small cell lung cancer and in prostate cancer.
Approval success ratesProbabilities of success (POS) values, such as cumulative approval in the United States and transition rates between clinical phases, have inherent limitations when the calcula-tions involve cohorts with high percentages of candidates in clinical study, as is the case for human mAbs. Calculated values will vary until fates for all candidates are known. POS values for human mAbs that entered clinical study after 1996 are preliminary estimates because fates of only 31% of the 131 candidates are known (7 approved, 33 terminated), and only 20 reached Phase III trials. In addition, the values are likely to be underestimates because clinical development of therapeutic mAbs takes an average of approximately 6 years, and so the human mAb candidates that entered clinical study during the past 6 years have not had sufficient time for approval.
Nevertheless, POS values are crucial for the decision-making process used by inves-tors, as well as for strategic planning by the biopharmaceutical industry, and even preliminary estimates can be useful. Based
on the current data, the cumulative approval rate for human mAbs is 17.5%, which will increase to 23% if raxibacumab, belimumab and ipilimumab are approved. Transition rates between clinical phases (which include data for candidates currently in studies) for the human mAbs were 89% for transitions between Phase I to II; 51% for transitions between Phase II to III; and 73% for transi-tions between Phase III to approval by the FDA (FIG. 3).
The cumulative approval success rate for human mAbs is slightly higher than the 15% value that we have calculated for humanized mAbs, which first entered com-mercial clinical development in 1988 (BOX 2). As economic conditions, regulatory climate and competitive landscape can change over time, we also compared POS values for human and humanized mAbs that entered clinical development in the same period (1997–2008). The cumulative approval success rate was 17.5% for the human mAb cohort (7 approvals per 40 candidates with known fates) and 9% for the humanized mAb cohort (5 approvals per 53 candidates with known fates). Transition rates for Phase I to II and Phase II to III were higher for the human mAbs, but the Phase III to approval rate was lower (FIG. 3). Final fates were known for 31% and 40% of the human and humanized mAbs developed in this period, respectively, and the rates may change as the final fates for more candidates are determined.
Clinical indicationsPrimary therapeutic indications were identified for the 131 human mAbs that entered clinical study after 1996. Overall, most mAb therapeutics, regardless of sequence source, are developed as treatments for cancer or immunological disorders1–3. This is also the case for human mAbs, with 59 (45%) studied for cancer and 36 (28%) for immunological disorders. These proportions have remained fairly constant since 1997 (FIG. 2).
Of the 59 antineoplastic mAbs, fates are known for only 13 (22%): 2 are approved products (panitumumab and ofatumumab) and 11 candidates were terminated. The cumulative approval success rate is 15% based on currently available data. Most of the 46 human antineoplastic mAbs that are in clinical studies are at the early stages of the process, with 5 in Phase III trials and 1 (ipilimumab) in regulatory review in the United States and in the European Union. Immunomodulatory human mAbs have a higher cumulative approval success rate (33%) than either the antineoplastic or the
Figure 2 | cumulative number of human mAbs entering clinical study between 1985 and 2008. The primary therapeutic category for the development of human monoclonal antibodies (mAbs) that entered clinical study sponsored by commercial firms between 1985 and 2008 was determined. The cumulative numbers of human mAbs that entered development for antineoplastic, immuno-modulatory, anti-infective and all other indications were tabulated. These data demonstrate the rapid growth in human mAbs in clinical research generally, and the particularly high rates of develop-ment of antineo plastic and immunomodulatory human mAbs.
P e r s P e c t i v e s
770 | OCTOBEr 2010 | VOlUME 9 www.nature.com/reviews/drugdisc
nrd_3229_oct10.indd 770 17/9/10 11:50:13
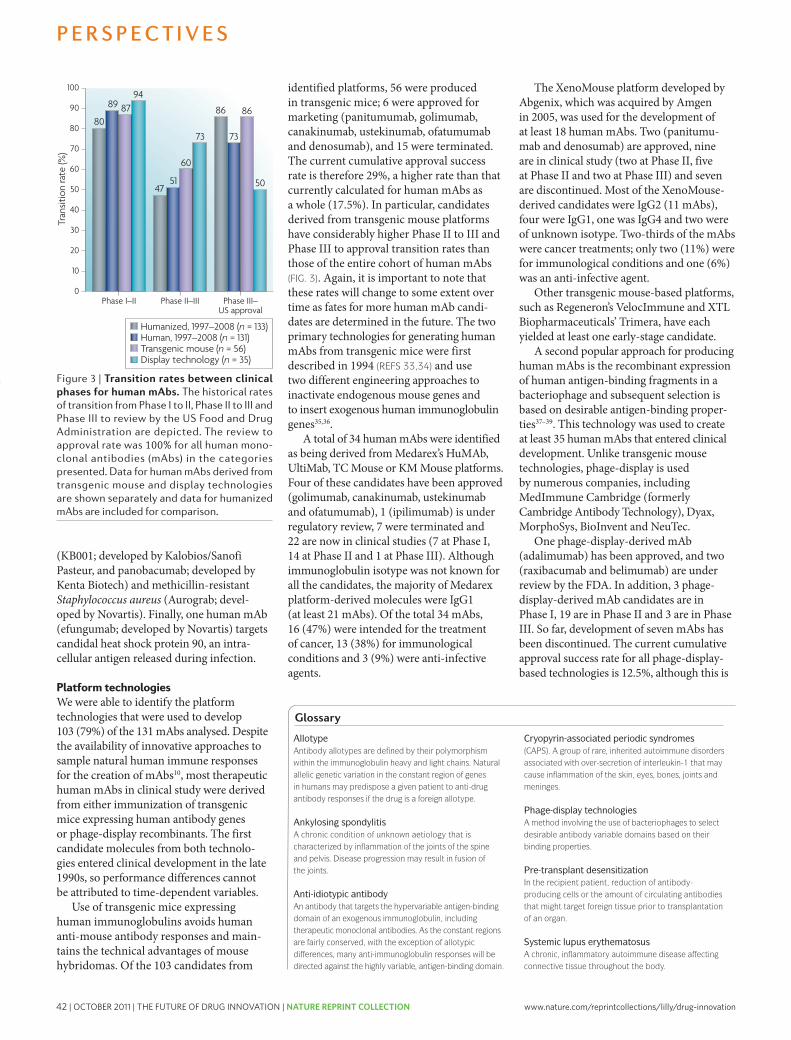
42 | OCTOBER 2011 | THE FUTURE OF DRUG INNOVATION | NATURE REPRINT COLLECTION www.nature.com/reprintcollections/lilly/drug-innovation
based on results for a small number of candidates. This rate is lower than that observed for all human mAbs (17.5%) and for the transgenic-mouse-derived human mAbs (29%); however, if raxibacumab and belimu-mab are approved, the cumulative approval success rate will increase to 30%. Human mAbs derived from phage-display technol-ogy have high Phase I to II and Phase II to III transition rates, but the Phase III to approval rate is currently 50% (FIG. 3).
None of the 35 mAbs known to be derived from phage display was identified as IgG2, which is an interesting observa-tion given the diversity of phage-display platforms. Of those with known isotypes, 20 were IgG1 and 9 were IgG4. Cambridge Antibody Technology was responsible for 15 phage-display-derived human mAbs, including adalimumab and four terminated candidates; these therefore have a cumula-tive success rate of 20% so far, which is comparable to that of Medarex platform-derived mAbs. Cambridge Antibody Technology has also produced a substantial number of IgG4 molecules (7 out of 9 IgG4 mAbs are known to be derived from phage-display technology).
ConclusionsThe acquisition of mAb technology com-panies, including Abgenix, Cambridge Antibody Technology and Medarex, by major drug companies is an indication of the pharmaceutical industry’s increasing interest in human mAb therapeutics. Our analyses indicate that human mAbs are a rich source of new therapeutics, with 7 approved in the United States, 3 under review by the FDA, 7 in late-stage develop-ment and 81 in early-stage development. Although limited data are available, the cur-rent POS rates for human mAbs are similar or superior to those for current humanized mAb candidates. The cumulative approval success rate for human mAbs is currently 17.5%, although this could change substan-tially in the coming years depending on the fate of the high percentage of candidates that are still in clinical study.
We found that human mAbs are primarily in development for the treatment of cancer and immunological disorders. The cumula-tive approval rate for immunomodulatory human mAbs (33%) is higher than that for the antineoplastic (15%) candidates. This difference is also observed when chimeric and humanized therapeutic mAbs are con-sidered1. The majority of human mAbs were derived from transgenic mouse technolo-gies and from phage-display technologies,
although human hybridoma and transformed cells have also been used to produce human mAbs.
The two transgenic mouse technologies have so far generated six mAbs that gained approval (29% POS) and one candidate that is under review by the FDA. The hetero-geneous mix of phage-display technologies collectively have generated one marketed product (12.5% POS) and two candidates that are under review by the FDA. The earliest transgenic-mouse-derived and phage-display-derived human mAbs entered clinical development in the same year, so timing cannot account for the differences. However, if raxibacumab, belimumab and ipilimumab are approved, phage-display-derived human mAbs will have demonstrated preliminary POS rates comparable to mouse-derived human mAbs (30% versus
32%, respectively). A potential disincentive to the use of the transgenic mouse platform is that the intellectual property is controlled by only a few companies, and so access may be costly. Phage-display technologies are particularly advantageous when target antigens are shared by humans and mice.
With the current trend towards devel-oping targeted therapeutics, the focus on human mAbs is likely to intensify owing to a perceived low level of immunogenicity of these agents (BOX 1). The pharmaceutical and biotechnology industry, regulatory agencies, physicians and patients have now gained sufficient experience with mAbs to view them as little different from any other therapeutic. The data so far indicate that mAbs derived from human sequences by various technologies are effective in addressing novel therapeutic targets, and
Table 2 | Antigenic targets of human mAbs in development*
Antigen Therapeutic category No. of human mAbs
Bacillus anthracis PA Infectious disease 2
cD30 cancer 2
cD40 cancer 2
Clostridium difficile enterotoxin Infectious disease 2
cTLA4 cancer 3
eGFr cancer 3
ePcAM cancer 2
Fibronectin cancer 3
GM-cSF Immunological disease 2
Her3 cancer 2
HIv gp41 Infectious disease 2
IGF1r cancer 6
IL-6 Immunological disease 2
IL-8 Immunological disease 2
IL-12 Immunological disease 2
Integrins Immunological disease 2
PDGF cancer, immunological disease 2
PSMA cancer 2
Tenascin cancer 2
TGFβ Immunological, ophthalmic and fibrotic diseases
3
TNF Immunological disease 3
TrAILr2 cancer 4
Unknown cancer, immunological disease 6
cTLA4, cytotoxic T lymphocyte-associated antigen 4; eGFr, epidermal growth factor receptor; ePcAM, epithelial cell adhesion molecule; GM-cSF, granulocyte–macrophage colony-stimulating factor; gp, glycoprotein; Her3, human epidermal growth factor receptor 3 (also known as erBB3); IGF1r, insulin-like growth factor 1 receptor; IL, interleukin; mAb, monoclonal antibody; PA, protective antigen; PDGF, platelet-derived growth factor; PSMA, prostate-specific membrane antigen (also known as FOLH1); TGF, transforming growth factor; TNF, tumour necrosis factor; TrAILr2, tumour necrosis factor-related apoptosis-inducing ligand receptor 2 (also known as TNFrSF10B). *This table lists molecules that were targets for a minimum of two human mAbs that entered clinical study between 1997 and 2008.
P e r s P e c t i v e s
NATUrE rEVIEWS | Drug Discovery VOlUME 9 | OCTOBEr 2010 | 773
nrd_3229_oct10.indd 773 17/9/10 11:50:15
Nature Reviews | Drug Discovery
Tran
sitio
n ra
te (%
)
100
90
80
70
60
50
40
30
20
10
0Phase III–
US approvalPhase II–IIIPhase I–II
80
89 8794
4751
60
73
86
73
86
50
Humanized, 1997–2008 (n = 133)Human, 1997–2008 (n = 131)Transgenic mouse (n = 56)Display technology (n = 35)
(KB001; developed by Kalobios/Sanofi Pasteur, and panobacumab; developed by Kenta Biotech) and methicillin-resistant Staphylococcus aureus (Aurograb; devel-oped by Novartis). Finally, one human mAb (efungumab; developed by Novartis) targets candidal heat shock protein 90, an intra-cellular antigen released during infection.
Platform technologiesWe were able to identify the platform technologies that were used to develop 103 (79%) of the 131 mAbs analysed. Despite the availability of innovative approaches to sample natural human immune responses for the creation of mAbs10, most therapeutic human mAbs in clinical study were derived from either immunization of transgenic mice expressing human antibody genes or phage-display recombinants. The first candidate molecules from both technolo-gies entered clinical development in the late 1990s, so performance differences cannot be attributed to time-dependent variables.
Use of transgenic mice expressing human immunoglobulins avoids human anti-mouse antibody responses and main-tains the technical advantages of mouse hybridomas. Of the 103 candidates from
identified platforms, 56 were produced in transgenic mice; 6 were approved for marketing (panitumumab, golimumab, canakinumab, ustekinumab, ofatumumab and denosumab), and 15 were terminated. The current cumulative approval success rate is therefore 29%, a higher rate than that currently calculated for human mAbs as a whole (17.5%). In particular, candidates derived from transgenic mouse platforms have considerably higher Phase II to III and Phase III to approval transition rates than those of the entire cohort of human mAbs (FIG. 3). Again, it is important to note that these rates will change to some extent over time as fates for more human mAb candi-dates are determined in the future. The two primary technologies for generating human mAbs from transgenic mice were first described in 1994 (REFs 33,34) and use two different engineering approaches to inactivate endogenous mouse genes and to insert exogenous human immunoglobulin genes35,36.
A total of 34 human mAbs were identified as being derived from Medarex’s HuMAb, UltiMab, TC Mouse or KM Mouse platforms. Four of these candidates have been approved (golimumab, canakinumab, ustekinumab and ofatumumab), 1 (ipilimumab) is under regulatory review, 7 were terminated and 22 are now in clinical studies (7 at Phase I, 14 at Phase II and 1 at Phase III). Although immunoglobulin isotype was not known for all the candidates, the majority of Medarex platform-derived molecules were IgG1 (at least 21 mAbs). Of the total 34 mAbs, 16 (47%) were intended for the treatment of cancer, 13 (38%) for immunological conditions and 3 (9%) were anti-infective agents.
The XenoMouse platform developed by Abgenix, which was acquired by Amgen in 2005, was used for the development of at least 18 human mAbs. Two (panitumu-mab and denosumab) are approved, nine are in clinical study (two at Phase II, five at Phase II and two at Phase III) and seven are discontinued. Most of the XenoMouse-derived candidates were IgG2 (11 mAbs), four were IgG1, one was IgG4 and two were of unknown isotype. Two-thirds of the mAbs were cancer treatments; only two (11%) were for immunological conditions and one (6%) was an anti-infective agent.
Other transgenic mouse-based platforms, such as regeneron’s VelocImmune and XTl Biopharmaceuticals’ Trimera, have each yielded at least one early-stage candidate.
A second popular approach for producing human mAbs is the recombinant expression of human antigen-binding fragments in a bacteriophage and subsequent selection is based on desirable antigen-binding proper-ties37–39. This technology was used to create at least 35 human mAbs that entered clinical development. Unlike transgenic mouse technologies, phage-display is used by numerous companies, including MedImmune Cambridge (formerly Cambridge Antibody Technology), Dyax, MorphoSys, BioInvent and NeuTec.
One phage-display-derived mAb (adalimumab) has been approved, and two (raxibacumab and belimumab) are under review by the FDA. In addition, 3 phage-display-derived mAb candidates are in Phase I, 19 are in Phase II and 3 are in Phase III. So far, development of seven mAbs has been discontinued. The current cumulative approval success rate for all phage-display-based technologies is 12.5%, although this is
Figure 3 | Transition rates between clinical phases for human mAbs. The historical rates of transition from Phase I to II, Phase II to III and Phase III to review by the US Food and Drug Administration are depicted. The review to approval rate was 100% for all human mono-clonal antibodies (mAbs) in the categories presented. Data for human mAbs derived from transgenic mouse and display technologies are shown separately and data for humanized mAbs are included for comparison.
glossary
AllotypeAntibody allotypes are defined by their polymorphism within the immunoglobulin heavy and light chains. Natural allelic genetic variation in the constant region of genes in humans may predispose a given patient to anti-drug antibody responses if the drug is a foreign allotype.
Ankylosing spondylitisA chronic condition of unknown aetiology that is characterized by inflammation of the joints of the spine and pelvis. Disease progression may result in fusion of the joints.
Anti-idiotypic antibodyAn antibody that targets the hypervariable antigen-binding domain of an exogenous immunoglobulin, including therapeutic monoclonal antibodies. As the constant regions are fairly conserved, with the exception of allotypic differences, many anti-immunoglobulin responses will be directed against the highly variable, antigen-binding domain.
Cryopyrin-associated periodic syndromes(CAPs). A group of rare, inherited autoimmune disorders associated with over-secretion of interleukin-1 that may cause inflammation of the skin, eyes, bones, joints and meninges.
Phage-display technologiesA method involving the use of bacteriophages to select desirable antibody variable domains based on their binding properties.
Pre-transplant desensitizationIn the recipient patient, reduction of antibody- producing cells or the amount of circulating antibodies that might target foreign tissue prior to transplantation of an organ.
Systemic lupus erythematosusA chronic, inflammatory autoimmune disease affecting connective tissue throughout the body.
glossary
Glossary headGlossary body
Glossary headGlossary body
Glossary headGlossary body
Glossary headGlossary body
Glossary headGlossary body
P e r s P e c t i v e s
772 | OCTOBEr 2010 | VOlUME 9 www.nature.com/reviews/drugdisc
nrd_3229_oct10.indd 772 17/9/10 11:50:14
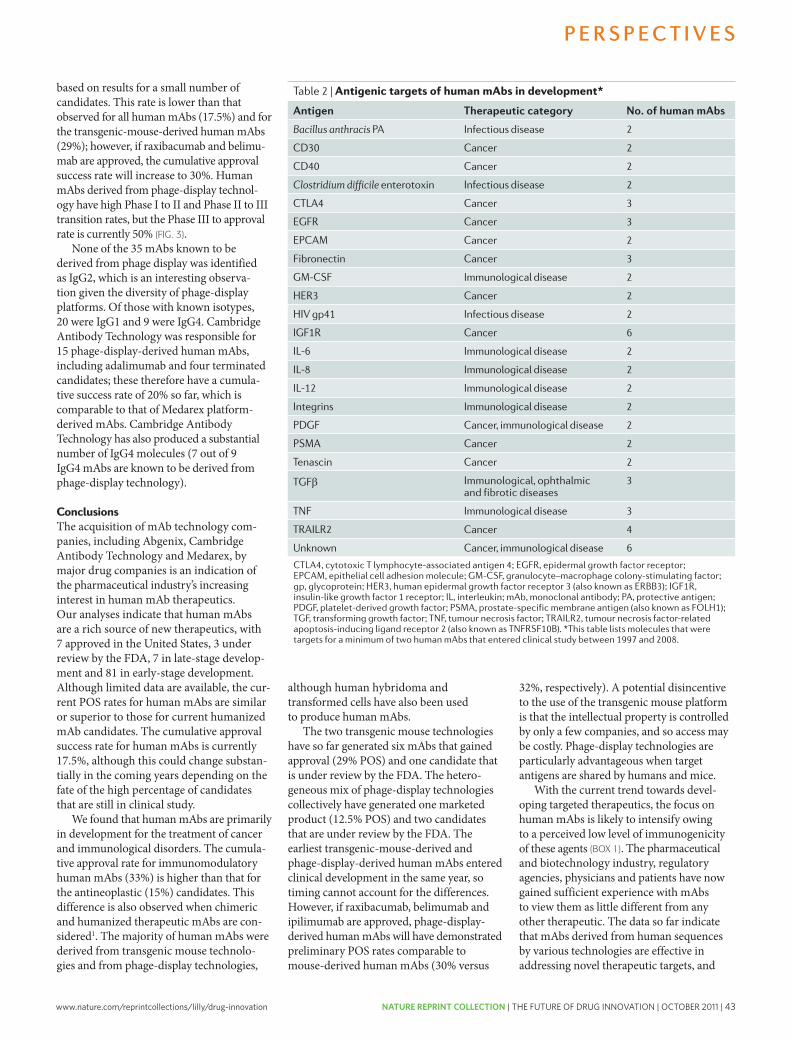
www.nature.com/reprintcollections/lilly/drug-innovation NATURE REPRINT COLLECTION | THE FUTURE OF DRUG INNOVATION | OCTOBER 2011 | 43
based on results for a small number of candidates. This rate is lower than that observed for all human mAbs (17.5%) and for the transgenic-mouse-derived human mAbs (29%); however, if raxibacumab and belimu-mab are approved, the cumulative approval success rate will increase to 30%. Human mAbs derived from phage-display technol-ogy have high Phase I to II and Phase II to III transition rates, but the Phase III to approval rate is currently 50% (FIG. 3).
None of the 35 mAbs known to be derived from phage display was identified as IgG2, which is an interesting observa-tion given the diversity of phage-display platforms. Of those with known isotypes, 20 were IgG1 and 9 were IgG4. Cambridge Antibody Technology was responsible for 15 phage-display-derived human mAbs, including adalimumab and four terminated candidates; these therefore have a cumula-tive success rate of 20% so far, which is comparable to that of Medarex platform-derived mAbs. Cambridge Antibody Technology has also produced a substantial number of IgG4 molecules (7 out of 9 IgG4 mAbs are known to be derived from phage-display technology).
ConclusionsThe acquisition of mAb technology com-panies, including Abgenix, Cambridge Antibody Technology and Medarex, by major drug companies is an indication of the pharmaceutical industry’s increasing interest in human mAb therapeutics. Our analyses indicate that human mAbs are a rich source of new therapeutics, with 7 approved in the United States, 3 under review by the FDA, 7 in late-stage develop-ment and 81 in early-stage development. Although limited data are available, the cur-rent POS rates for human mAbs are similar or superior to those for current humanized mAb candidates. The cumulative approval success rate for human mAbs is currently 17.5%, although this could change substan-tially in the coming years depending on the fate of the high percentage of candidates that are still in clinical study.
We found that human mAbs are primarily in development for the treatment of cancer and immunological disorders. The cumula-tive approval rate for immunomodulatory human mAbs (33%) is higher than that for the antineoplastic (15%) candidates. This difference is also observed when chimeric and humanized therapeutic mAbs are con-sidered1. The majority of human mAbs were derived from transgenic mouse technolo-gies and from phage-display technologies,
although human hybridoma and transformed cells have also been used to produce human mAbs.
The two transgenic mouse technologies have so far generated six mAbs that gained approval (29% POS) and one candidate that is under review by the FDA. The hetero-geneous mix of phage-display technologies collectively have generated one marketed product (12.5% POS) and two candidates that are under review by the FDA. The earliest transgenic-mouse-derived and phage-display-derived human mAbs entered clinical development in the same year, so timing cannot account for the differences. However, if raxibacumab, belimumab and ipilimumab are approved, phage-display-derived human mAbs will have demonstrated preliminary POS rates comparable to mouse-derived human mAbs (30% versus
32%, respectively). A potential disincentive to the use of the transgenic mouse platform is that the intellectual property is controlled by only a few companies, and so access may be costly. Phage-display technologies are particularly advantageous when target antigens are shared by humans and mice.
With the current trend towards devel-oping targeted therapeutics, the focus on human mAbs is likely to intensify owing to a perceived low level of immunogenicity of these agents (BOX 1). The pharmaceutical and biotechnology industry, regulatory agencies, physicians and patients have now gained sufficient experience with mAbs to view them as little different from any other therapeutic. The data so far indicate that mAbs derived from human sequences by various technologies are effective in addressing novel therapeutic targets, and
Table 2 | Antigenic targets of human mAbs in development*
Antigen Therapeutic category No. of human mAbs
Bacillus anthracis PA Infectious disease 2
cD30 cancer 2
cD40 cancer 2
Clostridium difficile enterotoxin Infectious disease 2
cTLA4 cancer 3
eGFr cancer 3
ePcAM cancer 2
Fibronectin cancer 3
GM-cSF Immunological disease 2
Her3 cancer 2
HIv gp41 Infectious disease 2
IGF1r cancer 6
IL-6 Immunological disease 2
IL-8 Immunological disease 2
IL-12 Immunological disease 2
Integrins Immunological disease 2
PDGF cancer, immunological disease 2
PSMA cancer 2
Tenascin cancer 2
TGFβ Immunological, ophthalmic and fibrotic diseases
3
TNF Immunological disease 3
TrAILr2 cancer 4
Unknown cancer, immunological disease 6
cTLA4, cytotoxic T lymphocyte-associated antigen 4; eGFr, epidermal growth factor receptor; ePcAM, epithelial cell adhesion molecule; GM-cSF, granulocyte–macrophage colony-stimulating factor; gp, glycoprotein; Her3, human epidermal growth factor receptor 3 (also known as erBB3); IGF1r, insulin-like growth factor 1 receptor; IL, interleukin; mAb, monoclonal antibody; PA, protective antigen; PDGF, platelet-derived growth factor; PSMA, prostate-specific membrane antigen (also known as FOLH1); TGF, transforming growth factor; TNF, tumour necrosis factor; TrAILr2, tumour necrosis factor-related apoptosis-inducing ligand receptor 2 (also known as TNFrSF10B). *This table lists molecules that were targets for a minimum of two human mAbs that entered clinical study between 1997 and 2008.
P e r s P e c t i v e s
NATUrE rEVIEWS | Drug Discovery VOlUME 9 | OCTOBEr 2010 | 773
nrd_3229_oct10.indd 773 17/9/10 11:50:15
Nature Reviews | Drug Discovery
Tran
sitio
n ra
te (%
)
100
90
80
70
60
50
40
30
20
10
0Phase III–
US approvalPhase II–IIIPhase I–II
80
89 8794
4751
60
73
86
73
86
50
Humanized, 1997–2008 (n = 133)Human, 1997–2008 (n = 131)Transgenic mouse (n = 56)Display technology (n = 35)
(KB001; developed by Kalobios/Sanofi Pasteur, and panobacumab; developed by Kenta Biotech) and methicillin-resistant Staphylococcus aureus (Aurograb; devel-oped by Novartis). Finally, one human mAb (efungumab; developed by Novartis) targets candidal heat shock protein 90, an intra-cellular antigen released during infection.
Platform technologiesWe were able to identify the platform technologies that were used to develop 103 (79%) of the 131 mAbs analysed. Despite the availability of innovative approaches to sample natural human immune responses for the creation of mAbs10, most therapeutic human mAbs in clinical study were derived from either immunization of transgenic mice expressing human antibody genes or phage-display recombinants. The first candidate molecules from both technolo-gies entered clinical development in the late 1990s, so performance differences cannot be attributed to time-dependent variables.
Use of transgenic mice expressing human immunoglobulins avoids human anti-mouse antibody responses and main-tains the technical advantages of mouse hybridomas. Of the 103 candidates from
identified platforms, 56 were produced in transgenic mice; 6 were approved for marketing (panitumumab, golimumab, canakinumab, ustekinumab, ofatumumab and denosumab), and 15 were terminated. The current cumulative approval success rate is therefore 29%, a higher rate than that currently calculated for human mAbs as a whole (17.5%). In particular, candidates derived from transgenic mouse platforms have considerably higher Phase II to III and Phase III to approval transition rates than those of the entire cohort of human mAbs (FIG. 3). Again, it is important to note that these rates will change to some extent over time as fates for more human mAb candi-dates are determined in the future. The two primary technologies for generating human mAbs from transgenic mice were first described in 1994 (REFs 33,34) and use two different engineering approaches to inactivate endogenous mouse genes and to insert exogenous human immunoglobulin genes35,36.
A total of 34 human mAbs were identified as being derived from Medarex’s HuMAb, UltiMab, TC Mouse or KM Mouse platforms. Four of these candidates have been approved (golimumab, canakinumab, ustekinumab and ofatumumab), 1 (ipilimumab) is under regulatory review, 7 were terminated and 22 are now in clinical studies (7 at Phase I, 14 at Phase II and 1 at Phase III). Although immunoglobulin isotype was not known for all the candidates, the majority of Medarex platform-derived molecules were IgG1 (at least 21 mAbs). Of the total 34 mAbs, 16 (47%) were intended for the treatment of cancer, 13 (38%) for immunological conditions and 3 (9%) were anti-infective agents.
The XenoMouse platform developed by Abgenix, which was acquired by Amgen in 2005, was used for the development of at least 18 human mAbs. Two (panitumu-mab and denosumab) are approved, nine are in clinical study (two at Phase II, five at Phase II and two at Phase III) and seven are discontinued. Most of the XenoMouse-derived candidates were IgG2 (11 mAbs), four were IgG1, one was IgG4 and two were of unknown isotype. Two-thirds of the mAbs were cancer treatments; only two (11%) were for immunological conditions and one (6%) was an anti-infective agent.
Other transgenic mouse-based platforms, such as regeneron’s VelocImmune and XTl Biopharmaceuticals’ Trimera, have each yielded at least one early-stage candidate.
A second popular approach for producing human mAbs is the recombinant expression of human antigen-binding fragments in a bacteriophage and subsequent selection is based on desirable antigen-binding proper-ties37–39. This technology was used to create at least 35 human mAbs that entered clinical development. Unlike transgenic mouse technologies, phage-display is used by numerous companies, including MedImmune Cambridge (formerly Cambridge Antibody Technology), Dyax, MorphoSys, BioInvent and NeuTec.
One phage-display-derived mAb (adalimumab) has been approved, and two (raxibacumab and belimumab) are under review by the FDA. In addition, 3 phage-display-derived mAb candidates are in Phase I, 19 are in Phase II and 3 are in Phase III. So far, development of seven mAbs has been discontinued. The current cumulative approval success rate for all phage-display-based technologies is 12.5%, although this is
Figure 3 | Transition rates between clinical phases for human mAbs. The historical rates of transition from Phase I to II, Phase II to III and Phase III to review by the US Food and Drug Administration are depicted. The review to approval rate was 100% for all human mono-clonal antibodies (mAbs) in the categories presented. Data for human mAbs derived from transgenic mouse and display technologies are shown separately and data for humanized mAbs are included for comparison.
glossary
AllotypeAntibody allotypes are defined by their polymorphism within the immunoglobulin heavy and light chains. Natural allelic genetic variation in the constant region of genes in humans may predispose a given patient to anti-drug antibody responses if the drug is a foreign allotype.
Ankylosing spondylitisA chronic condition of unknown aetiology that is characterized by inflammation of the joints of the spine and pelvis. Disease progression may result in fusion of the joints.
Anti-idiotypic antibodyAn antibody that targets the hypervariable antigen-binding domain of an exogenous immunoglobulin, including therapeutic monoclonal antibodies. As the constant regions are fairly conserved, with the exception of allotypic differences, many anti-immunoglobulin responses will be directed against the highly variable, antigen-binding domain.
Cryopyrin-associated periodic syndromes(CAPs). A group of rare, inherited autoimmune disorders associated with over-secretion of interleukin-1 that may cause inflammation of the skin, eyes, bones, joints and meninges.
Phage-display technologiesA method involving the use of bacteriophages to select desirable antibody variable domains based on their binding properties.
Pre-transplant desensitizationIn the recipient patient, reduction of antibody- producing cells or the amount of circulating antibodies that might target foreign tissue prior to transplantation of an organ.
Systemic lupus erythematosusA chronic, inflammatory autoimmune disease affecting connective tissue throughout the body.
glossary
Glossary headGlossary body
Glossary headGlossary body
Glossary headGlossary body
Glossary headGlossary body
Glossary headGlossary body
P e r s P e c t i v e s
772 | OCTOBEr 2010 | VOlUME 9 www.nature.com/reviews/drugdisc
nrd_3229_oct10.indd 772 17/9/10 11:50:14
44 | OCTOBER 2011 | THE FUTURE OF DRUG INNOVATION | NATURE REPRINT COLLECTION www.nature.com/reprintcollections/lilly/drug-innovation
“If it were not for the great variability among individuals, medicine might as well be a science and not an art.” Sir William Osler, 1892
Patients and society expect that the benefits of licensed drugs will outweigh their risks. Drug regulations in all major jurisdictions are aiming to ensure a ‘positive benefit–risk balance’. However, regulatory decisions are based on population-level information, with an understanding that the benefit–risk will not necessarily be positive for all treated patients. Patients are not equally responsive to beneficial effects, and not equally sus-ceptible to adverse effects. Drug developers, drug regulators and health-care profession-als have been aware of patient heterogeneity and that ‘one size doesn’t fit all’. Regulators
attempt to direct prescribers to appropri-ate patient subpopulations and treatment scenarios, whereas health-care professionals aim to tailor drug regimens to their indi-vidual patients, often based on phenotypic markers that are expected to influence a drug’s pharmacokinetics or pharmacody-namics such as creatinine clearance, disease stage or comorbidities. In some cases, pre-scribers can tailor doses to individuals by titrating to their response to the drug.
In spite of such efforts, drugs often do not perform as well in clinical practice as in the clinical trials that provide the basis for marketing authorization. This difference in benefit–risk has been termed the ‘effi-cacy–effectiveness gap’, in which efficacy is defined as “the extent to which an interven-tion does more good than harm under ideal
circumstances” (that is, under clinical trial conditions), whereas effectiveness “is the extent to which an intervention does more good than harm when provided under the usual circumstances of health care practice” (REF. 1). Others have referred to efficacy as “can it work?” and effectiveness as “does it work?” (REF. 2).
There have been several instances in which the quality of prescription drugs dif-fered markedly between the clinical trial medicine assessed by regulators and that being marketed. For example, some marketed heparin products became contaminated with oversulphated chondroitin sulphate3, and the benefit–risk of nelfinavir (Viracept; Pfizer) came under intense scrutiny when batches of the medicine became contaminated with a known genotoxic substance4. However, cases in which pharmaceutical quality issues give rise to differences between efficacy and effec-tiveness are rare and represent a distinct set of regulatory problems; therefore they are not further discussed here.
Another reason for an apparent difference between efficacy and effectiveness may be the inadequate follow up of ‘minor’ safety signals that arise during pre-licensing develop-ment. We re-emphasise the responsibility of manufacturers and regulators to ensure thor-ough post-licensing investigation of safety signals; it is hoped that the introduction of Risk Management Plans (RMPs) in the European Union (EU) and Risk Evaluation and Mitigation Strategies (REMSs) in the United States a few years ago may success-fully address this important issue5. However, in this Opinion article we argue that the efficacy–effectiveness gap is, in most cases, a problem of variability in drug response. We describe biological and behavioural sources of variability. We then summarize current attempts to bridge the efficacy–effectiveness gap by reducing variability. Finally, we specu-late on new opportunities and technologies in this area and what regulators can do to advance the best use of drugs.
Variability and treatment scenariosWe observe that over the past decade there were few, if any, drugs that came under close scrutiny for their benefit–risk profile or that had to be withdrawn from the market
O P I N I O N
Bridging the efficacy–effectiveness gap: a regulator’s perspective on addressing variability of drug responseHans-Georg Eichler, Eric Abadie, Alasdair Breckenridge, Bruno Flamion, Lars L. Gustafsson, Hubert Leufkens, Malcolm Rowland, Christian K. Schneider and Brigitte Bloechl-Daum
Abstract | Drug regulatory agencies should ensure that the benefits of drugs outweigh their risks, but licensed medicines sometimes do not perform as expected in everyday clinical practice. Failure may relate to lower than anticipated efficacy or a higher than anticipated incidence or severity of adverse effects. Here we show that the problem of benefit–risk is to a considerable degree a problem of variability in drug response. We describe biological and behavioural sources of variability and how these contribute to the long-known efficacy–effectiveness gap. In this context, efficacy describes how a drug performs under conditions of clinical trials, whereas effectiveness describes how it performs under conditions of everyday clinical practice. We argue that a broad range of pre- and post-licensing technologies will need to be harnessed to bridge the efficacy–effectiveness gap. Successful approaches will not be limited to the current notion of pharmaco-genomics-based personalized medicines, but will also entail the wider use of electronic health-care tools to improve drug prescribing and patient adherence.
PERSPECTIVES
NATURE REVIEWS | DRUG DISCOVERY VOLUME 10 | JULY 2011 | 495
nrd_3501_jul11.indd 495 20/06/2011 16:34
are likely to be less immunogenic than those with rodent-derived sequences. There is considerable unmet medical need in the three main areas of study for investigational human mAbs — cancer, immunological and infectious diseases — and these emerging agents could therefore provide valuable new treatment options.
Aaron L. Nelson was previously at the Tufts University School of Medicine, Boston, Massachusetts 02118, USA.
Present address: Novartis Institutes for Biomedical Research, Room 7226, 7th floor, 300 Technology Square, Cambridge, Massachusetts 02139, USA.
Eugen Dhimolea is at the Tufts University School of Medicine, 136 Harrison Avenue, Boston,
Massachusetts 02111, USA.
Janice M. Reichert is at the Tufts Center for the Study of Drug Development, Suite 1100, 75 Kneeland Street,
Boston, Massachusetts 02111, USA.
Correspondence to J.M.R. e‑mail: [email protected]
doi:10.1038/nrd3229 Published online 3 september 2010
1. Reichert, J. M. Monoclonal antibodies as innovative therapeutics. Curr. Pharm. Biotechnol. 9, 423–430 (2008).
2. Reichert, J. M., Rosensweig, C. J., Faden, L. B. & Dewitz, M. C. Monoclonal antibody successes in the clinic. Nature Biotech. 23, 1073–1078 (2005).
3. Reichert, J. M. Antibodies to watch in 2010. MAbs 2, 84–100 (2010).
4. James, K. & Bell, G. T. Human monoclonal antibody production. Current status and future prospects. J. Immunol. Methods 100, 5–40 (1987).
5. Olsson, L. & Kaplan, H. S. Human–human hybridomas producing monoclonal antibodies of predefined antigenic specificity. Proc. Natl Acad. Sci. USA 77, 5429–5431 (1980).
6. Shoenfeld, Y. et al. Production of autoantibodies by human–human hybridomas. J. Clin. Invest. 70, 205–208 (1982).
7. Olsson, L. et al. Antibody producing human–human hybridomas. II. Derivation and characterization of an antibody specific for human leukemia cells. J. Exp. Med. 159, 537–550 (1984).
8. Kozbor, D. & Roder, J. C. Requirements for the establishment of high-titered human monoclonal antibodies against tetanus toxoid using the Epstein–Barr virus technique. J. Immunol. 127, 1275–1280 (1981).
9. Kozbor, D., Lagarde, A. E. & Roder, J. C. Human hybridomas constructed with antigen-specific Epstein–Barr virus-transformed cell lines. Proc. Natl Acad. Sci. USA 79, 6651–6655 (1982).
10. Beerli, R. R. & Rader, C. Mining human antibody repertoires. MAbs 2, 361–374 (2010).
11. Teng, N. N. et al. Protection against Gram-negative bacteremia and endotoxemia with human monoclonal IgM antibodies. Proc. Natl Acad. Sci. USA 82, 1790–1794 (1985).
12. Ziegler, E. J. et al. Treatment of Gram-negative bacteremia and septic shock with HA-1A human monoclonal antibody against endotoxin. A randomized, double-blind, placebo-controlled trial. The HA-1A Sepsis Study Group. N. Engl. J. Med. 324, 429–436 (1991).
13. Cross, A. S. Antiendotoxin antibodies: a dead end? Ann. Intern. Med. 121, 58–60 (1994).
14. Luce, J. M. Introduction of new technology into critical care practice: a history of HA-1A human monoclonal antibody against endotoxin. Crit. Care Med. 21, 1233–1241 (1993).
15. McCloskey, R. V., Straube, R. C., Sanders, C., Smith, S. M. & Smith, C. R. Treatment of septic shock with human monoclonal antibody HA-1A. A randomized, double-blind, placebo-controlled trial. CHESS Trial Study Group. Ann. Intern. Med. 121, 1–5 (1994).
16. Abbott. Abbott Annual Report 2008. Abbott website [online], http://www.abbott.com/static/content/microsite/annual_report/2008/16_review1.html (2008).
17. US Food and Drug Administration. Vectibix Panitumumab Injectable. Application No.: 125147. Medical Review(s). FDA website [online], http://www.accessdata.fda.gov/drugsatfda_docs/nda/2006/125147s0000_MedR.pdf (2006).
18. Van Cutsem, E. et al. Open-label phase III trial of panitumumab plus best supportive care compared with best supportive care alone in patients with chemotherapy-refractory metastatic colorectal cancer. J. Clin. Oncol. 25, 1658–1664 (2007).
19. Mazumdar, S. & Greenwald, D. Golimumab. MAbs 1, 422–431 (2009).
20. Lachmann, H. J. et al. Use of canakinumab in the cryopyrin-associated periodic syndrome. N. Engl. J. Med. 360, 2416–2425 (2009).
21. Dhimolea, E. Canakinumab. MAbs 2, 3–13 (2010).22. Cingoz, O. Ustekinumab. MAbs 1, 216–221 (2009).23. Teeling, J. L. et al. The biological activity of human
CD20 monoclonal antibodies is linked to unique epitopes on CD20. J. Immunol. 177, 362–371 (2006).
24. Glennie, M. J., French, R. R., Cragg, M. S. & Taylor, R. P. Mechanisms of killing by anti-CD20 monoclonal antibodies. Mol. Immunol. 44, 3823–3837 (2007).
25. Zhang, B. Ofatumumab. MAbs 1, 326–331 (2009).26. Pageau, S. C. Denosumab. MAbs 1, 210–215 (2009).27. Mazumdar, S. Raxibacumab. MAbs 1, 531–538
(2009).28. Dall’Era, M. & Wofsy, D. Connective tissue diseases:
belimumab for systemic lupus erythematosus: breaking through? Nature Rev. Rheumatol. 6, 124–125 (2010).
29. Wallace, D. J. et al. A phase II, randomized, double-blind, placebo-controlled, dose-ranging study of belimumab in patients with active systemic lupus erythematosus. Arthritis Rheum. 61, 1168–1178 (2009).
30. Hodi, F. S. et al. Improved survival with ipilimumab in patients with metastatic melanoma. N. Engl. J. Med. 363, 711–723 (2010).
31. Reichert, J. M. & Dewitz, M. C. Anti-infective monoclonal antibodies: perils and promise of development. Nature Rev. Drug Discov. 5, 191–195 (2006).
32. Reichert, J. M. & Valge-Archer, V. E. Development trends for monoclonal antibody cancer therapeutics. Nature Rev. Drug Discov. 6, 349–356 (2007).
33. Green, L. L. et al. Antigen-specific human monoclonal antibodies from mice engineered with human Ig heavy and light chain YACs. Nature Genet. 7, 13–21 (1994).
34. Lonberg, N. et al. Antigen-specific human antibodies from mice comprising four distinct genetic modifications. Nature 368, 856–859 (1994).
35. Green, L. L. Antibody engineering via genetic engineering of the mouse: XenoMouse strains are a vehicle for the facile generation of therapeutic human monoclonal antibodies. J. Immunol. Methods 231, 11–23 (1999).
36. Lonberg, N. Human antibodies from transgenic animals. Nature Biotech. 23, 1117–1125 (2005).
37. McCafferty, J., Griffiths, A. D., Winter, G. & Chiswell, D. J. Phage antibodies: filamentous phage displaying antibody variable domains. Nature 348, 552–554 (1990).
38. Vaughan, T. J. et al. Human antibodies with sub-nanomolar affinities isolated from a large non-immunized phage display library. Nature Biotech. 14, 309–314 (1996).
39. Clackson, T., Hoogenboom, H. R., Griffiths, A. D. & Winter, G. Making antibody fragments using phage display libraries. Nature 352, 624–628 (1991).
40. Chirino, A. J., Ary, M. L. & Marshall, S. A. Minimizing the immunogenicity of protein therapeutics. Drug Discov. Today 9, 82–90 (2004).
41. Baert, F. et al. Influence of immunogenicity on the long-term efficacy of infliximab in Crohn’s disease. N. Engl. J. Med. 348, 601–608 (2003).
42. De Groot, A. S. & Scott, D. W. Immunogenicity of protein therapeutics. Trends Immunol. 28, 482–490 (2007).
43. Bartelds, G. M. et al. Clinical response to adalimumab: relationship to anti-adalimumab antibodies and serum adalimumab concentrations in rheumatoid arthritis. Ann. Rheum. Dis. 66, 921–926 (2007).
44. Bender, N. K. et al. Immunogenicity, efficacy and adverse events of adalimumab in RA patients. Rheumatol. Int. 27, 269–274 (2007).
45. Hwang, W. Y. & Foote, J. Immunogenicity of engineered antibodies. Methods 36, 3–10 (2005).
46. Saif, M. W. & Cohenuram, M. Role of panitumumab in the management of metastatic colorectal cancer. Clin. Colorectal Cancer 6, 118–124 (2006).
47. Saif, M. W., Peccerillo, J. & Potter, V. Successful re-challenge with panitumumab in patients who developed hypersensitivity reactions to cetuximab: report of three cases and review of literature. Cancer Chemother. Pharmacol. 63, 1017–1022 (2009).
48. Chung, C. H. et al. Cetuximab-induced anaphylaxis and IgE specific for galactose-α-1,3-galactose. N. Engl. J. Med. 358, 1109–1117 (2008).
49. Lecluse, L. L. A. et al. Extent and clinical consequences of antibody formation against adalimumab in patients with plaque psoriasis. Arch. Dermatol. 146, 127–132 (2010).
50. Weinblatt, M. E. et al. Adalimumab, a fully human anti-tumor necrosis factor monoclonal antibody, for the treatment of rheumatoid arthritis in patients taking concomitant methotrexate: the ARMADA trial. Arthritis Rheum. 48, 35–45 (2003).
51. Nechansky, A. HAHA — nothing to laugh about. Measuring the immunogenicity (human anti-human antibody response) induced by humanized monoclonal antibodies applying ELISA and SPR technology. J. Pharm. Biomed. Anal. 51, 252–254 (2009).
52. Lofgren, J. A. et al. Comparing ELISA and surface plasmon resonance for assessing clinical immunogenicity of panitumumab. J. Immunol. 178, 7467–7472 (2007).
53. Jefferis, R. & LeFranc, M.-P. Human immunoglobulin allotypes — possible implications for immunogenicity. MAbs 1, 332–338 (2009).
54. Gilles, J. G. et al. Natural autoantibodies and anti-idiotypes. Semin. Thromb. Hemost. 26, 151–155 (2000).
55. Emmi, L. The role of intravenous immunoglobulin therapy in autoimmune and inflammatory disorders. Neurol. Sci. 23 (Suppl. 1), 1–8 (2002).
56. Harding, F. A. et al. The immunogenicity of humanized and fully human antibodies: residual immunogenicity residues in the CDR regions. Mabs 2, 256–265 (2010).
57. Shankar, G., Pendley, C. & Stein, K. E. A risk-based bioanalytical strategy for the assessment of antibody immune responses against biological drugs. Nature Biotech. 25, 555–561 (2007).
Competing interests statementThe authors declare no competing financial interests.
FURTHER INFORMATIONtufts center for the study of Drug Development: http://csdd.tufts.edu
All liNks Are AcTive iN THe oNliNe PDF
P e r s P e c t i v e s
774 | OCTOBEr 2010 | VOlUME 9 www.nature.com/reviews/drugdisc
nrd_3229_oct10.indd 774 17/9/10 11:50:15
www.nature.com/reprintcollections/lilly/drug-innovation NATURE REPRINT COLLECTION | THE FUTURE OF DRUG INNOVATION | OCTOBER 2011 | 45
“If it were not for the great variability among individuals, medicine might as well be a science and not an art.” Sir William Osler, 1892
Patients and society expect that the benefits of licensed drugs will outweigh their risks. Drug regulations in all major jurisdictions are aiming to ensure a ‘positive benefit–risk balance’. However, regulatory decisions are based on population-level information, with an understanding that the benefit–risk will not necessarily be positive for all treated patients. Patients are not equally responsive to beneficial effects, and not equally sus-ceptible to adverse effects. Drug developers, drug regulators and health-care profession-als have been aware of patient heterogeneity and that ‘one size doesn’t fit all’. Regulators
attempt to direct prescribers to appropri-ate patient subpopulations and treatment scenarios, whereas health-care professionals aim to tailor drug regimens to their indi-vidual patients, often based on phenotypic markers that are expected to influence a drug’s pharmacokinetics or pharmacody-namics such as creatinine clearance, disease stage or comorbidities. In some cases, pre-scribers can tailor doses to individuals by titrating to their response to the drug.
In spite of such efforts, drugs often do not perform as well in clinical practice as in the clinical trials that provide the basis for marketing authorization. This difference in benefit–risk has been termed the ‘effi-cacy–effectiveness gap’, in which efficacy is defined as “the extent to which an interven-tion does more good than harm under ideal
circumstances” (that is, under clinical trial conditions), whereas effectiveness “is the extent to which an intervention does more good than harm when provided under the usual circumstances of health care practice” (REF. 1). Others have referred to efficacy as “can it work?” and effectiveness as “does it work?” (REF. 2).
There have been several instances in which the quality of prescription drugs dif-fered markedly between the clinical trial medicine assessed by regulators and that being marketed. For example, some marketed heparin products became contaminated with oversulphated chondroitin sulphate3, and the benefit–risk of nelfinavir (Viracept; Pfizer) came under intense scrutiny when batches of the medicine became contaminated with a known genotoxic substance4. However, cases in which pharmaceutical quality issues give rise to differences between efficacy and effec-tiveness are rare and represent a distinct set of regulatory problems; therefore they are not further discussed here.
Another reason for an apparent difference between efficacy and effectiveness may be the inadequate follow up of ‘minor’ safety signals that arise during pre-licensing develop-ment. We re-emphasise the responsibility of manufacturers and regulators to ensure thor-ough post-licensing investigation of safety signals; it is hoped that the introduction of Risk Management Plans (RMPs) in the European Union (EU) and Risk Evaluation and Mitigation Strategies (REMSs) in the United States a few years ago may success-fully address this important issue5. However, in this Opinion article we argue that the efficacy–effectiveness gap is, in most cases, a problem of variability in drug response. We describe biological and behavioural sources of variability. We then summarize current attempts to bridge the efficacy–effectiveness gap by reducing variability. Finally, we specu-late on new opportunities and technologies in this area and what regulators can do to advance the best use of drugs.
Variability and treatment scenariosWe observe that over the past decade there were few, if any, drugs that came under close scrutiny for their benefit–risk profile or that had to be withdrawn from the market
O P I N I O N
Bridging the efficacy–effectiveness gap: a regulator’s perspective on addressing variability of drug responseHans-Georg Eichler, Eric Abadie, Alasdair Breckenridge, Bruno Flamion, Lars L. Gustafsson, Hubert Leufkens, Malcolm Rowland, Christian K. Schneider and Brigitte Bloechl-Daum
Abstract | Drug regulatory agencies should ensure that the benefits of drugs outweigh their risks, but licensed medicines sometimes do not perform as expected in everyday clinical practice. Failure may relate to lower than anticipated efficacy or a higher than anticipated incidence or severity of adverse effects. Here we show that the problem of benefit–risk is to a considerable degree a problem of variability in drug response. We describe biological and behavioural sources of variability and how these contribute to the long-known efficacy–effectiveness gap. In this context, efficacy describes how a drug performs under conditions of clinical trials, whereas effectiveness describes how it performs under conditions of everyday clinical practice. We argue that a broad range of pre- and post-licensing technologies will need to be harnessed to bridge the efficacy–effectiveness gap. Successful approaches will not be limited to the current notion of pharmaco-genomics-based personalized medicines, but will also entail the wider use of electronic health-care tools to improve drug prescribing and patient adherence.
PERSPECTIVES
NATURE REVIEWS | DRUG DISCOVERY VOLUME 10 | JULY 2011 | 495
nrd_3501_jul11.indd 495 20/06/2011 16:34
are likely to be less immunogenic than those with rodent-derived sequences. There is considerable unmet medical need in the three main areas of study for investigational human mAbs — cancer, immunological and infectious diseases — and these emerging agents could therefore provide valuable new treatment options.
Aaron L. Nelson was previously at the Tufts University School of Medicine, Boston, Massachusetts 02118, USA.
Present address: Novartis Institutes for Biomedical Research, Room 7226, 7th floor, 300 Technology Square, Cambridge, Massachusetts 02139, USA.
Eugen Dhimolea is at the Tufts University School of Medicine, 136 Harrison Avenue, Boston,
Massachusetts 02111, USA.
Janice M. Reichert is at the Tufts Center for the Study of Drug Development, Suite 1100, 75 Kneeland Street,
Boston, Massachusetts 02111, USA.
Correspondence to J.M.R. e‑mail: [email protected]
doi:10.1038/nrd3229 Published online 3 september 2010
1. Reichert, J. M. Monoclonal antibodies as innovative therapeutics. Curr. Pharm. Biotechnol. 9, 423–430 (2008).
2. Reichert, J. M., Rosensweig, C. J., Faden, L. B. & Dewitz, M. C. Monoclonal antibody successes in the clinic. Nature Biotech. 23, 1073–1078 (2005).
3. Reichert, J. M. Antibodies to watch in 2010. MAbs 2, 84–100 (2010).
4. James, K. & Bell, G. T. Human monoclonal antibody production. Current status and future prospects. J. Immunol. Methods 100, 5–40 (1987).
5. Olsson, L. & Kaplan, H. S. Human–human hybridomas producing monoclonal antibodies of predefined antigenic specificity. Proc. Natl Acad. Sci. USA 77, 5429–5431 (1980).
6. Shoenfeld, Y. et al. Production of autoantibodies by human–human hybridomas. J. Clin. Invest. 70, 205–208 (1982).
7. Olsson, L. et al. Antibody producing human–human hybridomas. II. Derivation and characterization of an antibody specific for human leukemia cells. J. Exp. Med. 159, 537–550 (1984).
8. Kozbor, D. & Roder, J. C. Requirements for the establishment of high-titered human monoclonal antibodies against tetanus toxoid using the Epstein–Barr virus technique. J. Immunol. 127, 1275–1280 (1981).
9. Kozbor, D., Lagarde, A. E. & Roder, J. C. Human hybridomas constructed with antigen-specific Epstein–Barr virus-transformed cell lines. Proc. Natl Acad. Sci. USA 79, 6651–6655 (1982).
10. Beerli, R. R. & Rader, C. Mining human antibody repertoires. MAbs 2, 361–374 (2010).
11. Teng, N. N. et al. Protection against Gram-negative bacteremia and endotoxemia with human monoclonal IgM antibodies. Proc. Natl Acad. Sci. USA 82, 1790–1794 (1985).
12. Ziegler, E. J. et al. Treatment of Gram-negative bacteremia and septic shock with HA-1A human monoclonal antibody against endotoxin. A randomized, double-blind, placebo-controlled trial. The HA-1A Sepsis Study Group. N. Engl. J. Med. 324, 429–436 (1991).
13. Cross, A. S. Antiendotoxin antibodies: a dead end? Ann. Intern. Med. 121, 58–60 (1994).
14. Luce, J. M. Introduction of new technology into critical care practice: a history of HA-1A human monoclonal antibody against endotoxin. Crit. Care Med. 21, 1233–1241 (1993).
15. McCloskey, R. V., Straube, R. C., Sanders, C., Smith, S. M. & Smith, C. R. Treatment of septic shock with human monoclonal antibody HA-1A. A randomized, double-blind, placebo-controlled trial. CHESS Trial Study Group. Ann. Intern. Med. 121, 1–5 (1994).
16. Abbott. Abbott Annual Report 2008. Abbott website [online], http://www.abbott.com/static/content/microsite/annual_report/2008/16_review1.html (2008).
17. US Food and Drug Administration. Vectibix Panitumumab Injectable. Application No.: 125147. Medical Review(s). FDA website [online], http://www.accessdata.fda.gov/drugsatfda_docs/nda/2006/125147s0000_MedR.pdf (2006).
18. Van Cutsem, E. et al. Open-label phase III trial of panitumumab plus best supportive care compared with best supportive care alone in patients with chemotherapy-refractory metastatic colorectal cancer. J. Clin. Oncol. 25, 1658–1664 (2007).
19. Mazumdar, S. & Greenwald, D. Golimumab. MAbs 1, 422–431 (2009).
20. Lachmann, H. J. et al. Use of canakinumab in the cryopyrin-associated periodic syndrome. N. Engl. J. Med. 360, 2416–2425 (2009).
21. Dhimolea, E. Canakinumab. MAbs 2, 3–13 (2010).22. Cingoz, O. Ustekinumab. MAbs 1, 216–221 (2009).23. Teeling, J. L. et al. The biological activity of human
CD20 monoclonal antibodies is linked to unique epitopes on CD20. J. Immunol. 177, 362–371 (2006).
24. Glennie, M. J., French, R. R., Cragg, M. S. & Taylor, R. P. Mechanisms of killing by anti-CD20 monoclonal antibodies. Mol. Immunol. 44, 3823–3837 (2007).
25. Zhang, B. Ofatumumab. MAbs 1, 326–331 (2009).26. Pageau, S. C. Denosumab. MAbs 1, 210–215 (2009).27. Mazumdar, S. Raxibacumab. MAbs 1, 531–538
(2009).28. Dall’Era, M. & Wofsy, D. Connective tissue diseases:
belimumab for systemic lupus erythematosus: breaking through? Nature Rev. Rheumatol. 6, 124–125 (2010).
29. Wallace, D. J. et al. A phase II, randomized, double-blind, placebo-controlled, dose-ranging study of belimumab in patients with active systemic lupus erythematosus. Arthritis Rheum. 61, 1168–1178 (2009).
30. Hodi, F. S. et al. Improved survival with ipilimumab in patients with metastatic melanoma. N. Engl. J. Med. 363, 711–723 (2010).
31. Reichert, J. M. & Dewitz, M. C. Anti-infective monoclonal antibodies: perils and promise of development. Nature Rev. Drug Discov. 5, 191–195 (2006).
32. Reichert, J. M. & Valge-Archer, V. E. Development trends for monoclonal antibody cancer therapeutics. Nature Rev. Drug Discov. 6, 349–356 (2007).
33. Green, L. L. et al. Antigen-specific human monoclonal antibodies from mice engineered with human Ig heavy and light chain YACs. Nature Genet. 7, 13–21 (1994).
34. Lonberg, N. et al. Antigen-specific human antibodies from mice comprising four distinct genetic modifications. Nature 368, 856–859 (1994).
35. Green, L. L. Antibody engineering via genetic engineering of the mouse: XenoMouse strains are a vehicle for the facile generation of therapeutic human monoclonal antibodies. J. Immunol. Methods 231, 11–23 (1999).
36. Lonberg, N. Human antibodies from transgenic animals. Nature Biotech. 23, 1117–1125 (2005).
37. McCafferty, J., Griffiths, A. D., Winter, G. & Chiswell, D. J. Phage antibodies: filamentous phage displaying antibody variable domains. Nature 348, 552–554 (1990).
38. Vaughan, T. J. et al. Human antibodies with sub-nanomolar affinities isolated from a large non-immunized phage display library. Nature Biotech. 14, 309–314 (1996).
39. Clackson, T., Hoogenboom, H. R., Griffiths, A. D. & Winter, G. Making antibody fragments using phage display libraries. Nature 352, 624–628 (1991).
40. Chirino, A. J., Ary, M. L. & Marshall, S. A. Minimizing the immunogenicity of protein therapeutics. Drug Discov. Today 9, 82–90 (2004).
41. Baert, F. et al. Influence of immunogenicity on the long-term efficacy of infliximab in Crohn’s disease. N. Engl. J. Med. 348, 601–608 (2003).
42. De Groot, A. S. & Scott, D. W. Immunogenicity of protein therapeutics. Trends Immunol. 28, 482–490 (2007).
43. Bartelds, G. M. et al. Clinical response to adalimumab: relationship to anti-adalimumab antibodies and serum adalimumab concentrations in rheumatoid arthritis. Ann. Rheum. Dis. 66, 921–926 (2007).
44. Bender, N. K. et al. Immunogenicity, efficacy and adverse events of adalimumab in RA patients. Rheumatol. Int. 27, 269–274 (2007).
45. Hwang, W. Y. & Foote, J. Immunogenicity of engineered antibodies. Methods 36, 3–10 (2005).
46. Saif, M. W. & Cohenuram, M. Role of panitumumab in the management of metastatic colorectal cancer. Clin. Colorectal Cancer 6, 118–124 (2006).
47. Saif, M. W., Peccerillo, J. & Potter, V. Successful re-challenge with panitumumab in patients who developed hypersensitivity reactions to cetuximab: report of three cases and review of literature. Cancer Chemother. Pharmacol. 63, 1017–1022 (2009).
48. Chung, C. H. et al. Cetuximab-induced anaphylaxis and IgE specific for galactose-α-1,3-galactose. N. Engl. J. Med. 358, 1109–1117 (2008).
49. Lecluse, L. L. A. et al. Extent and clinical consequences of antibody formation against adalimumab in patients with plaque psoriasis. Arch. Dermatol. 146, 127–132 (2010).
50. Weinblatt, M. E. et al. Adalimumab, a fully human anti-tumor necrosis factor monoclonal antibody, for the treatment of rheumatoid arthritis in patients taking concomitant methotrexate: the ARMADA trial. Arthritis Rheum. 48, 35–45 (2003).
51. Nechansky, A. HAHA — nothing to laugh about. Measuring the immunogenicity (human anti-human antibody response) induced by humanized monoclonal antibodies applying ELISA and SPR technology. J. Pharm. Biomed. Anal. 51, 252–254 (2009).
52. Lofgren, J. A. et al. Comparing ELISA and surface plasmon resonance for assessing clinical immunogenicity of panitumumab. J. Immunol. 178, 7467–7472 (2007).
53. Jefferis, R. & LeFranc, M.-P. Human immunoglobulin allotypes — possible implications for immunogenicity. MAbs 1, 332–338 (2009).
54. Gilles, J. G. et al. Natural autoantibodies and anti-idiotypes. Semin. Thromb. Hemost. 26, 151–155 (2000).
55. Emmi, L. The role of intravenous immunoglobulin therapy in autoimmune and inflammatory disorders. Neurol. Sci. 23 (Suppl. 1), 1–8 (2002).
56. Harding, F. A. et al. The immunogenicity of humanized and fully human antibodies: residual immunogenicity residues in the CDR regions. Mabs 2, 256–265 (2010).
57. Shankar, G., Pendley, C. & Stein, K. E. A risk-based bioanalytical strategy for the assessment of antibody immune responses against biological drugs. Nature Biotech. 25, 555–561 (2007).
Competing interests statementThe authors declare no competing financial interests.
FURTHER INFORMATIONtufts center for the study of Drug Development: http://csdd.tufts.edu
All liNks Are AcTive iN THe oNliNe PDF
P e r s P e c t i v e s
774 | OCTOBEr 2010 | VOlUME 9 www.nature.com/reviews/drugdisc
nrd_3229_oct10.indd 774 17/9/10 11:50:15
First published in Nature Reviews Drug Discovery 10, 495-506 (July 2011); doi:10.1038/nrd3501
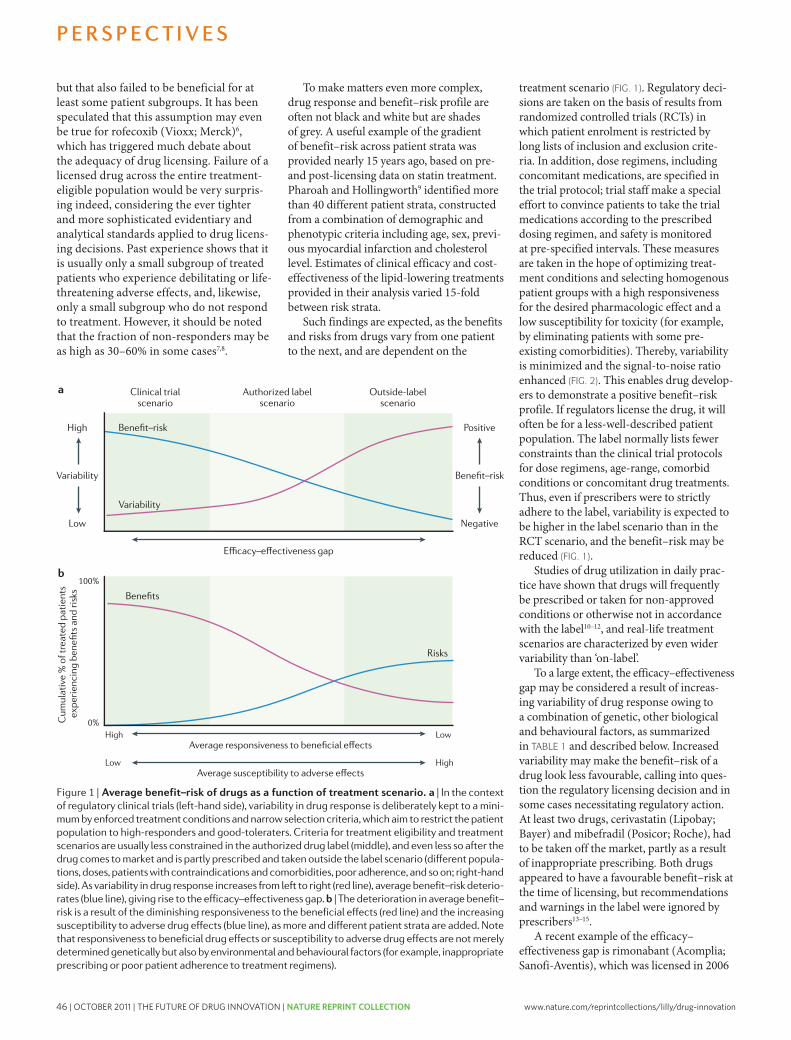
46 | OCTOBER 2011 | THE FUTURE OF DRUG INNOVATION | NATURE REPRINT COLLECTION www.nature.com/reprintcollections/lilly/drug-innovation
in the EU “as an adjunct to diet and exercise for the treatment of obese patients or over-weight patients with associated risk factors […]” (REF. 16). At that time, EU regulators concluded that “in clinical studies in which the patients were treated for more than a year, the weight reducing effect was moder-ate and of clinical relevance for 20–30% of the treated patients […]” (REF. 16). There were also safety questions from early devel-opment; clinical trials had shown increased rates of depressive disorders and suicidal and aggressive behaviour, but, based on the inci-dences observed in the trials, these adverse effects were considered not to outweigh the benefits. After the drug was on the market, however, new data indicated a shorter dura-tion of treatment in real life and, conse-quently, a reduced beneficial effect on body weight. At the same time, safety also became an issue. A prescription survey revealed that adherence by prescribers to the warn-ings and contraindications in the label was less than perfect. It became apparent that the risk of experiencing the known adverse mental effects had increased since the time of approval, with higher absolute risks in
patients with comorbidity. Based on these data, rimonabant was taken off the market in the EU in 2009 (REF. 16).
The rimonabant case study is instructive because it involved a combination of some of the causes of the efficacy–effectiveness gap (FIG. 1; TABLE 1): poor patient persistence on treatment (which reduced the effect size), outside-label prescribing by physicians and increased susceptibility to adverse effects in some patients as a result of a pre-existing comorbidity17. Along similar lines, prescrip-tion of varenicline (Champix/Chantix; Pfizer) to a broader population of patients than was enrolled in clinical trials gave rise to height-ened safety concerns about suicidal ideation18.
Sponsors of drug development pro-grammes will understandably seek to con-trol the treatment scenario in pre-licensing trials in order to optimize benefit–risk. Nonetheless, the transition from the pre-licensing to the post-licensing stage is not always accompanied by a deterioration of benefit–risk. There are some cases in which variability was reduced and benefit–risk improved after marketing. For example, the subgroup of patients who are treatment-responsive to gefitinib (Iressa; AstraZeneca/Teva) was only identified after licensing in the United States19. In this case, both licens-ing status and utilization of the drug shifted from a broader, high-variability population to a smaller, more circumscribed subpopula-tion — that is, from right to left in the graph shown in FIG. 1. There are other instances in which the benefit–risk profile improved after market introduction, including a large number of dose adaptations (gener-ally reductions) in the label after the initial licensing20,21. These cases may be indicative of suboptimal pre-marketing development strategies, such as incomplete dose-ranging studies, and the improved benefit–risk is a result of additional research, serendipity and/or safety-motivated regulatory action; they do not contradict the broader notion of increasing variability of drug response dur-ing the post-marketing phase.
Sources of variability in drug responseAwareness of the variability in drug response has received a boost, under the head-ing of personalized medicine, by growing knowledge about the genomic basis of drug response. For some drugs, a substantial frac-tion of variability in efficacy or toxicity can now be explained on the basis of a single genomic marker. Although the notion of genomic treatment stratification has already proved useful and personalized medicine is expected to make significant contributions
to improving the benefit–risk of drugs, it is unrealistic to assume that even the best pre-dictive biomarkers will eliminate variability or eliminate the efficacy–effectiveness gap. This is because genetics is merely one factor driving variability, albeit an important one. We take a broader view that encompasses the full range of biological and behavioural sources of variability, as depicted in TABLE 1. In the following section, we will briefly describe and illustrate by examples indi-vidual sources of variability.
BiologyPharmacogenomics. It is reasonable to assume that differences in individual patients’ genetic make-up are a major source of variability for many drugs. It is merely our current lack of understanding that precludes us from exploiting these differences to better target drugs to appropriate patients in appro-priate doses (for an overview of pharmaco-genomics, please refer to REF. 22).
Probably the best examples to illustrate the power of genomic markers to reduce variability and optimize a drug’s ben-efits or risks are trastuzumab (Herceptin; Genentech) and abacavir (Ziagen; GlaxoSmithKline).
Trastuzumb is a monoclonal antibody authorized in the EU “for the treatment of patients with HER2 positive meta-static breast cancer” (REF. 23). Trastuzumb targets HER2 (also known as ERBB2), a member of the epidermal growth factor receptor (EGFR) family of tyrosine kinase receptors that is overexpressed in about 25–30% of invasive ductal breast cancers (HER2-positive breast cancer). Identification of the biomarker HER2 and the develop-ment of sufficiently reliable laboratory tests to distinguish between HER2-positive and HER2-negative population strata have ena-bled the developers of this drug to focus on the high-responder subgroup, thereby reducing the number of patients in pre-marketing clinical trials, as well as clinical development cost and time. It has been spec-ulated that without pre-selection of patients with HER2-positive breast cancer, too many patients and too much follow-up time would have been needed to demonstrate a statisti-cally significant benefit with trastuzumab19; the relatively high therapeutic success rate in the HER2-positive stratum would have been diluted by the larger number of non-responders in an unselected high-variability population. Moreover, the availability of a biomarker assay that can be implemented in most health-care settings was shown to adequately guide clinical practice; there is a
Figure 2 | Signal-to-noise ratio in clinical trials. Detecting a statistically significant difference in outcome between treatment groups (for example, between experimental drug groups and placebo groups) can be conceptualized as a signal-to-noise problem. The higher the signal-to-noise ratio, the better the chances of detecting a true difference of a given magnitude and with a prede-fined sample size. a | The signal-to-noise ratio in a clinical trial with narrow patient selection criteria and a tightly controlled treatment scenario, such as clear definition of allowable concomitant medi-cation and monitoring of patient adherence. This ‘clean’ setting is called an explanatory or efficacy trial, and the intergroup difference can be detected with ease. b | The signal-to-noise ratio of a pragmatic or effectiveness trial; in contrast to a, the trial population is more heterogeneous and the treatment scenario resembles everyday clini-cal practice. The signal may now be lost in the noise, even though the drug has not lost its phar-macological activity in those patients who are responsive and adherent; hence the signal is still there (orange oval) but is too small to detect.
P E R S P E C T I V E S
NATURE REVIEWS | DRUG DISCOVERY VOLUME 10 | JULY 2011 | 497
nrd_3501_jul11.indd 497 20/06/2011 16:34
but that also failed to be beneficial for at least some patient subgroups. It has been speculated that this assumption may even be true for rofecoxib (Vioxx; Merck)6, which has triggered much debate about the adequacy of drug licensing. Failure of a licensed drug across the entire treatment-eligible population would be very surpris-ing indeed, considering the ever tighter and more sophisticated evidentiary and analytical standards applied to drug licens-ing decisions. Past experience shows that it is usually only a small subgroup of treated patients who experience debilitating or life-threatening adverse effects, and, likewise, only a small subgroup who do not respond to treatment. However, it should be noted that the fraction of non-responders may be as high as 30–60% in some cases7,8.
To make matters even more complex, drug response and benefit–risk profile are often not black and white but are shades of grey. A useful example of the gradient of benefit–risk across patient strata was provided nearly 15 years ago, based on pre-and post-licensing data on statin treatment. Pharoah and Hollingworth9 identified more than 40 different patient strata, constructed from a combination of demographic and phenotypic criteria including age, sex, previ-ous myocardial infarction and cholesterol level. Estimates of clinical efficacy and cost-effectiveness of the lipid-lowering treatments provided in their analysis varied 15-fold between risk strata.
Such findings are expected, as the benefits and risks from drugs vary from one patient to the next, and are dependent on the
treatment scenario (FIG. 1). Regulatory deci-sions are taken on the basis of results from randomized controlled trials (RCTs) in which patient enrolment is restricted by long lists of inclusion and exclusion crite-ria. In addition, dose regimens, including concomitant medications, are specified in the trial protocol; trial staff make a special effort to convince patients to take the trial medications according to the prescribed dosing regimen, and safety is monitored at pre-specified intervals. These measures are taken in the hope of optimizing treat-ment conditions and selecting homogenous patient groups with a high responsiveness for the desired pharmacologic effect and a low susceptibility for toxicity (for example, by eliminating patients with some pre-existing comorbidities). Thereby, variability is minimized and the signal-to-noise ratio enhanced (FIG. 2). This enables drug develop-ers to demonstrate a positive benefit–risk profile. If regulators license the drug, it will often be for a less-well-described patient population. The label normally lists fewer constraints than the clinical trial protocols for dose regimens, age-range, comorbid conditions or concomitant drug treatments. Thus, even if prescribers were to strictly adhere to the label, variability is expected to be higher in the label scenario than in the RCT scenario, and the benefit–risk may be reduced (FIG. 1).
Studies of drug utilization in daily prac-tice have shown that drugs will frequently be prescribed or taken for non-approved conditions or otherwise not in accordance with the label10–12, and real-life treatment scenarios are characterized by even wider variability than ‘on-label’.
To a large extent, the efficacy–effectiveness gap may be considered a result of increas-ing variability of drug response owing to a combination of genetic, other biological and behavioural factors, as summarized in TABLE 1 and described below. Increased variability may make the benefit–risk of a drug look less favourable, calling into ques-tion the regulatory licensing decision and in some cases necessitating regulatory action. At least two drugs, cerivastatin (Lipobay; Bayer) and mibefradil (Posicor; Roche), had to be taken off the market, partly as a result of inappropriate prescribing. Both drugs appeared to have a favourable benefit–risk at the time of licensing, but recommendations and warnings in the label were ignored by prescribers13–15.
A recent example of the efficacy– effectiveness gap is rimonabant (Acomplia; Sanofi-Aventis), which was licensed in 2006
Figure 1 | Average benefit–risk of drugs as a function of treatment scenario. a | In the context of regulatory clinical trials (left-hand side), variability in drug response is deliberately kept to a mini-mum by enforced treatment conditions and narrow selection criteria, which aim to restrict the patient population to high-responders and good-toleraters. Criteria for treatment eligibility and treatment scenarios are usually less constrained in the authorized drug label (middle), and even less so after the drug comes to market and is partly prescribed and taken outside the label scenario (different popula-tions, doses, patients with contraindications and comorbidities, poor adherence, and so on; right-hand side). As variability in drug response increases from left to right (red line), average benefit–risk deterio-rates (blue line), giving rise to the efficacy–effectiveness gap. b | The deterioration in average benefit–risk is a result of the diminishing responsiveness to the beneficial effects (red line) and the increasing susceptibility to adverse drug effects (blue line), as more and different patient strata are added. Note that responsiveness to beneficial drug effects or susceptibility to adverse drug effects are not merely determined genetically but also by environmental and behavioural factors (for example, inappropriate prescribing or poor patient adherence to treatment regimens).
P E R S P E C T I V E S
496 | JULY 2011 | VOLUME 10 www.nature.com/reviews/drugdisc
nrd_3501_jul11.indd 496 20/06/2011 16:34
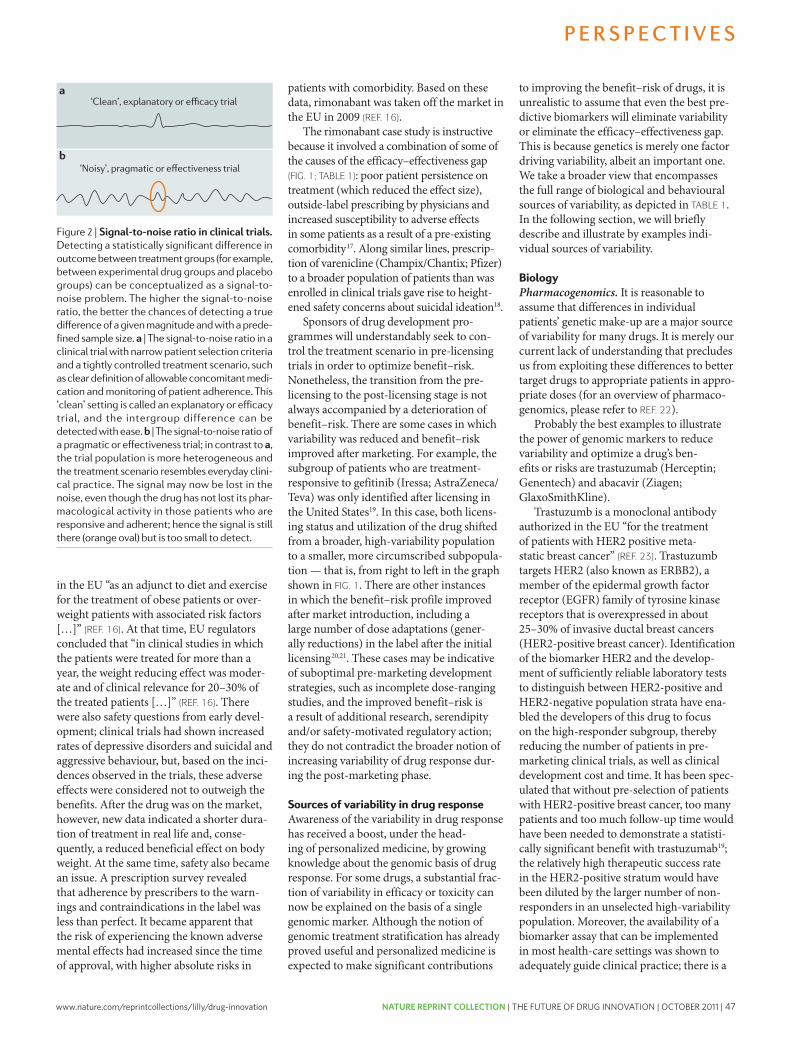
www.nature.com/reprintcollections/lilly/drug-innovation NATURE REPRINT COLLECTION | THE FUTURE OF DRUG INNOVATION | OCTOBER 2011 | 47
in the EU “as an adjunct to diet and exercise for the treatment of obese patients or over-weight patients with associated risk factors […]” (REF. 16). At that time, EU regulators concluded that “in clinical studies in which the patients were treated for more than a year, the weight reducing effect was moder-ate and of clinical relevance for 20–30% of the treated patients […]” (REF. 16). There were also safety questions from early devel-opment; clinical trials had shown increased rates of depressive disorders and suicidal and aggressive behaviour, but, based on the inci-dences observed in the trials, these adverse effects were considered not to outweigh the benefits. After the drug was on the market, however, new data indicated a shorter dura-tion of treatment in real life and, conse-quently, a reduced beneficial effect on body weight. At the same time, safety also became an issue. A prescription survey revealed that adherence by prescribers to the warn-ings and contraindications in the label was less than perfect. It became apparent that the risk of experiencing the known adverse mental effects had increased since the time of approval, with higher absolute risks in
patients with comorbidity. Based on these data, rimonabant was taken off the market in the EU in 2009 (REF. 16).
The rimonabant case study is instructive because it involved a combination of some of the causes of the efficacy–effectiveness gap (FIG. 1; TABLE 1): poor patient persistence on treatment (which reduced the effect size), outside-label prescribing by physicians and increased susceptibility to adverse effects in some patients as a result of a pre-existing comorbidity17. Along similar lines, prescrip-tion of varenicline (Champix/Chantix; Pfizer) to a broader population of patients than was enrolled in clinical trials gave rise to height-ened safety concerns about suicidal ideation18.
Sponsors of drug development pro-grammes will understandably seek to con-trol the treatment scenario in pre-licensing trials in order to optimize benefit–risk. Nonetheless, the transition from the pre-licensing to the post-licensing stage is not always accompanied by a deterioration of benefit–risk. There are some cases in which variability was reduced and benefit–risk improved after marketing. For example, the subgroup of patients who are treatment-responsive to gefitinib (Iressa; AstraZeneca/Teva) was only identified after licensing in the United States19. In this case, both licens-ing status and utilization of the drug shifted from a broader, high-variability population to a smaller, more circumscribed subpopula-tion — that is, from right to left in the graph shown in FIG. 1. There are other instances in which the benefit–risk profile improved after market introduction, including a large number of dose adaptations (gener-ally reductions) in the label after the initial licensing20,21. These cases may be indicative of suboptimal pre-marketing development strategies, such as incomplete dose-ranging studies, and the improved benefit–risk is a result of additional research, serendipity and/or safety-motivated regulatory action; they do not contradict the broader notion of increasing variability of drug response dur-ing the post-marketing phase.
Sources of variability in drug responseAwareness of the variability in drug response has received a boost, under the head-ing of personalized medicine, by growing knowledge about the genomic basis of drug response. For some drugs, a substantial frac-tion of variability in efficacy or toxicity can now be explained on the basis of a single genomic marker. Although the notion of genomic treatment stratification has already proved useful and personalized medicine is expected to make significant contributions
to improving the benefit–risk of drugs, it is unrealistic to assume that even the best pre-dictive biomarkers will eliminate variability or eliminate the efficacy–effectiveness gap. This is because genetics is merely one factor driving variability, albeit an important one. We take a broader view that encompasses the full range of biological and behavioural sources of variability, as depicted in TABLE 1. In the following section, we will briefly describe and illustrate by examples indi-vidual sources of variability.
BiologyPharmacogenomics. It is reasonable to assume that differences in individual patients’ genetic make-up are a major source of variability for many drugs. It is merely our current lack of understanding that precludes us from exploiting these differences to better target drugs to appropriate patients in appro-priate doses (for an overview of pharmaco-genomics, please refer to REF. 22).
Probably the best examples to illustrate the power of genomic markers to reduce variability and optimize a drug’s ben-efits or risks are trastuzumab (Herceptin; Genentech) and abacavir (Ziagen; GlaxoSmithKline).
Trastuzumb is a monoclonal antibody authorized in the EU “for the treatment of patients with HER2 positive meta-static breast cancer” (REF. 23). Trastuzumb targets HER2 (also known as ERBB2), a member of the epidermal growth factor receptor (EGFR) family of tyrosine kinase receptors that is overexpressed in about 25–30% of invasive ductal breast cancers (HER2-positive breast cancer). Identification of the biomarker HER2 and the develop-ment of sufficiently reliable laboratory tests to distinguish between HER2-positive and HER2-negative population strata have ena-bled the developers of this drug to focus on the high-responder subgroup, thereby reducing the number of patients in pre-marketing clinical trials, as well as clinical development cost and time. It has been spec-ulated that without pre-selection of patients with HER2-positive breast cancer, too many patients and too much follow-up time would have been needed to demonstrate a statisti-cally significant benefit with trastuzumab19; the relatively high therapeutic success rate in the HER2-positive stratum would have been diluted by the larger number of non-responders in an unselected high-variability population. Moreover, the availability of a biomarker assay that can be implemented in most health-care settings was shown to adequately guide clinical practice; there is a
Figure 2 | Signal-to-noise ratio in clinical trials. Detecting a statistically significant difference in outcome between treatment groups (for example, between experimental drug groups and placebo groups) can be conceptualized as a signal-to-noise problem. The higher the signal-to-noise ratio, the better the chances of detecting a true difference of a given magnitude and with a prede-fined sample size. a | The signal-to-noise ratio in a clinical trial with narrow patient selection criteria and a tightly controlled treatment scenario, such as clear definition of allowable concomitant medi-cation and monitoring of patient adherence. This ‘clean’ setting is called an explanatory or efficacy trial, and the intergroup difference can be detected with ease. b | The signal-to-noise ratio of a pragmatic or effectiveness trial; in contrast to a, the trial population is more heterogeneous and the treatment scenario resembles everyday clini-cal practice. The signal may now be lost in the noise, even though the drug has not lost its phar-macological activity in those patients who are responsive and adherent; hence the signal is still there (orange oval) but is too small to detect.
P E R S P E C T I V E S
NATURE REVIEWS | DRUG DISCOVERY VOLUME 10 | JULY 2011 | 497
nrd_3501_jul11.indd 497 20/06/2011 16:34
but that also failed to be beneficial for at least some patient subgroups. It has been speculated that this assumption may even be true for rofecoxib (Vioxx; Merck)6, which has triggered much debate about the adequacy of drug licensing. Failure of a licensed drug across the entire treatment-eligible population would be very surpris-ing indeed, considering the ever tighter and more sophisticated evidentiary and analytical standards applied to drug licens-ing decisions. Past experience shows that it is usually only a small subgroup of treated patients who experience debilitating or life-threatening adverse effects, and, likewise, only a small subgroup who do not respond to treatment. However, it should be noted that the fraction of non-responders may be as high as 30–60% in some cases7,8.
To make matters even more complex, drug response and benefit–risk profile are often not black and white but are shades of grey. A useful example of the gradient of benefit–risk across patient strata was provided nearly 15 years ago, based on pre-and post-licensing data on statin treatment. Pharoah and Hollingworth9 identified more than 40 different patient strata, constructed from a combination of demographic and phenotypic criteria including age, sex, previ-ous myocardial infarction and cholesterol level. Estimates of clinical efficacy and cost-effectiveness of the lipid-lowering treatments provided in their analysis varied 15-fold between risk strata.
Such findings are expected, as the benefits and risks from drugs vary from one patient to the next, and are dependent on the
treatment scenario (FIG. 1). Regulatory deci-sions are taken on the basis of results from randomized controlled trials (RCTs) in which patient enrolment is restricted by long lists of inclusion and exclusion crite-ria. In addition, dose regimens, including concomitant medications, are specified in the trial protocol; trial staff make a special effort to convince patients to take the trial medications according to the prescribed dosing regimen, and safety is monitored at pre-specified intervals. These measures are taken in the hope of optimizing treat-ment conditions and selecting homogenous patient groups with a high responsiveness for the desired pharmacologic effect and a low susceptibility for toxicity (for example, by eliminating patients with some pre-existing comorbidities). Thereby, variability is minimized and the signal-to-noise ratio enhanced (FIG. 2). This enables drug develop-ers to demonstrate a positive benefit–risk profile. If regulators license the drug, it will often be for a less-well-described patient population. The label normally lists fewer constraints than the clinical trial protocols for dose regimens, age-range, comorbid conditions or concomitant drug treatments. Thus, even if prescribers were to strictly adhere to the label, variability is expected to be higher in the label scenario than in the RCT scenario, and the benefit–risk may be reduced (FIG. 1).
Studies of drug utilization in daily prac-tice have shown that drugs will frequently be prescribed or taken for non-approved conditions or otherwise not in accordance with the label10–12, and real-life treatment scenarios are characterized by even wider variability than ‘on-label’.
To a large extent, the efficacy–effectiveness gap may be considered a result of increas-ing variability of drug response owing to a combination of genetic, other biological and behavioural factors, as summarized in TABLE 1 and described below. Increased variability may make the benefit–risk of a drug look less favourable, calling into ques-tion the regulatory licensing decision and in some cases necessitating regulatory action. At least two drugs, cerivastatin (Lipobay; Bayer) and mibefradil (Posicor; Roche), had to be taken off the market, partly as a result of inappropriate prescribing. Both drugs appeared to have a favourable benefit–risk at the time of licensing, but recommendations and warnings in the label were ignored by prescribers13–15.
A recent example of the efficacy– effectiveness gap is rimonabant (Acomplia; Sanofi-Aventis), which was licensed in 2006
Figure 1 | Average benefit–risk of drugs as a function of treatment scenario. a | In the context of regulatory clinical trials (left-hand side), variability in drug response is deliberately kept to a mini-mum by enforced treatment conditions and narrow selection criteria, which aim to restrict the patient population to high-responders and good-toleraters. Criteria for treatment eligibility and treatment scenarios are usually less constrained in the authorized drug label (middle), and even less so after the drug comes to market and is partly prescribed and taken outside the label scenario (different popula-tions, doses, patients with contraindications and comorbidities, poor adherence, and so on; right-hand side). As variability in drug response increases from left to right (red line), average benefit–risk deterio-rates (blue line), giving rise to the efficacy–effectiveness gap. b | The deterioration in average benefit–risk is a result of the diminishing responsiveness to the beneficial effects (red line) and the increasing susceptibility to adverse drug effects (blue line), as more and different patient strata are added. Note that responsiveness to beneficial drug effects or susceptibility to adverse drug effects are not merely determined genetically but also by environmental and behavioural factors (for example, inappropriate prescribing or poor patient adherence to treatment regimens).
P E R S P E C T I V E S
496 | JULY 2011 | VOLUME 10 www.nature.com/reviews/drugdisc
nrd_3501_jul11.indd 496 20/06/2011 16:34
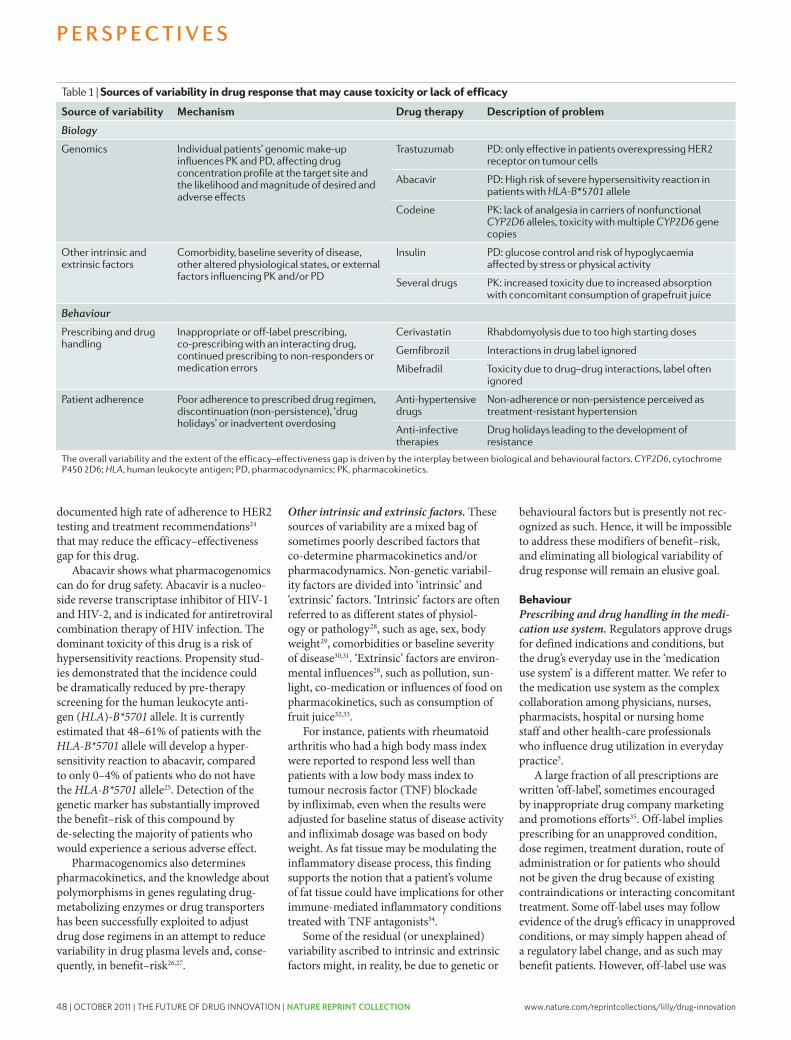
48 | OCTOBER 2011 | THE FUTURE OF DRUG INNOVATION | NATURE REPRINT COLLECTION www.nature.com/reprintcollections/lilly/drug-innovation
shown in many instances to contribute to the efficacy–effectiveness gap owing to more fre-quent adverse effects or reduced benefit36–38. Off-label prescribing is expected to increase variability of drug response, for example because new patients with pre-existing morbidities are being added to the treat-ment population, as occurred in the cases of rimonabant and varenicline (see above).
Effectiveness may be further reduced by inadvertent medication errors, including dis-pensing of the wrong drug or dose strength, inappropriate handling and storage of drugs, and other more subtle examples of poor use of medicines that may occur throughout the medication use system. The impact on pub-lic health is huge and studies have estimated that medication errors, including inappro-priate prescribing, cost tens of thousands of lives each year in the United States alone39.
Patient adherence. “Drugs don’t work in patients who don’t take them.” Also known as ‘Koop’s Law’, that simple observation by C. Everett Koop, former US surgeon general40, was the subject of numerous stud-ies and even of a dedicated World Health Organization report41. Poor adherence (also termed compliance) by patients to pre-scribed drug regimens may come in many forms, ranging from fluctuations in dose-timing to omitting a single day’s dosing to having repeat drug holidays (the sequential omission of 3 or more days’ doses) and, finally, to non-persistence (not taking drugs prescribed for chronic conditions)42.
Patients’ adherence is not perfect even in pre-licensing trials, and especially in long-term outcome trials43. Nonetheless, regulatory trials are usually geared towards maintaining adherence at the highest possible level, and adherence in real-life populations is expected to be substantially lower than in clinical trials44. It has been suggested that poor adherence may be “the single largest source of variance in drug responses” in some settings45, and it is also likely to be one of the principal sources of the efficacy–effectiveness gap.
There is an abundance of reports docu-menting that poor adherence or non-adher-ence by patients is a cause of potentially avoidable morbidity, mortality and lost pro-ductivity. The one class of drugs for which the importance of adherence is probably best understood — and for which lack of adher-ence has been described as the Achilles heel — is oral contraceptives. Because of their relatively low variability in pharmacokinetics and pharmacodynamics, these drugs could achieve a near-perfect therapeutic success
rate — that is, near zero risk of conception — given punctual dosing46. However, based on one estimate, in real-life conditions the conception rate increases 50-fold, from 0.1% per year under ‘perfect use’ conditions to 5.0% under ‘typical use’ (REF. 47).
Studies in HIV-infected patients have demonstrated a significant relation between patient adherence and virologic response48 and possibly also drug-resistance devel-opment49. In a study of patients with schizophrenia, approximately 7% of patients become non-adherent to their prescribed drug regimen each month after discharge from the hospital, and non-adherence was associated with an increased relapse rate50. Vrijens et al. reported that about half of the patients who were prescribed an anti-hypertensive drug had stopped taking it within 1 year51; it is easy to see how lack of drug exposure due to poor adherence may, if it is not reported by the patient and remains undetected by the prescriber, lead to the interpretation of ‘treatment-resistant hypertension’. Adherence is likely to become a factor in driving the clinical outcome of cancer treatments as more and more cancer drugs are administered orally and need to be taken over prolonged periods and in an ambulatory setting. Poor tamoxifen adher-ence was recently shown to be significantly associated with an increased risk of breast cancer events52.
In some treatment situations, adher-ence may take on a broader meaning than just taking a drug dose at a given time and include, for example, dieting and exercising. A lack of lifestyle changes may mitigate the therapeutic success of drug treatment. This was shown by recent findings that patients with early rheumatoid arthritis who smoke are less likely to respond to treatment with methotrexate and TNF inhibitors53.
Variability sources in a real-life settingWe have briefly described the individual influences that govern variability in any given therapeutic scenario. In everyday clini-cal practice, all of them will influence overall variability and the extent of the efficacy–effectiveness gap. However, the interplay of these biological and behavioural factors is not straightforward.
In an early seminal paper, Harter and Peck54 discussed major sources of variability in dose–effect relationships and, impor-tantly, their highly nonlinear interactions. They emphasized that total variability is the square root of the sum of the squares of the variabilities of each individual source54. Urquhart46 pointed out that: “this
nonlinearity has the unhappy consequence that a major reduction in the variability of one component of the system has only a minor effect on the overall variability.”
Harter and Peck also attempted to quan-tify for one model drug the relative contribu-tion of individual sources of variability to the cumulative variability of the overall thera-peutic response. In their estimate, adherence and pharmacokinetics are the most impor-tant drivers of variability of the therapeutic effect of theophylline, a drug that was widely used at the time in patients with asthma54. However, the relative contribution of indi-vidual sources to overall variability is likely to be different from one drug to the next and is unknown, or at least not formally assessed, for most drugs.
Bridging the efficacy–effectiveness gapWhenever expectations (efficacy) do not match reality (effectiveness), there are two ways to bridge the gap: either lower the expectations to the level of reality (in our context this would mean regulators demand pre-marketing studies that fully represent clinical reality and then base licensing deci-sions on effectiveness information) or bring up reality to the level of expectations. This second approach seeks to ensure that every-day practice strictly follows the label and that drug regimens are individualized to meet patients’ needs. Both concepts are useful but present serious challenges.
Lower the expectations to the level of reality. Ideally, regulatory RCTs should be inter-nally valid (that is, their design and conduct must minimize the possibility of bias), but to be clinically useful, the result must also be relevant to a definable group of patients in a particular clinical setting (that is, they must be externally valid)55. A perceived lack of external validity is a frequent criticism of current pre-marketing RCTs, which are often referred to as ‘explanatory’ or efficacy trials. There is a call for trials with higher external validity, also known as ‘pragmatic’ clinical trials (PCTs) or effectiveness trials55. For an in-depth discussion of the domains that characterize explanatory versus prag-matic trials, please refer to the ‘PRECIS framework’ (REF. 56).
An argument can indeed be made in favour of a shift in regulatory evidence standards from efficacy towards effective-ness. Such a shift would imply fewer and broader patient selection criteria (with the exception of validated biomarker-guided selection criteria, see below) and less control over patient management. Pre-licensing
P E R S P E C T I V E S
NATURE REVIEWS | DRUG DISCOVERY VOLUME 10 | JULY 2011 | 499
nrd_3501_jul11.indd 499 20/06/2011 16:34
documented high rate of adherence to HER2 testing and treatment recommendations24 that may reduce the efficacy–effectiveness gap for this drug.
Abacavir shows what pharmacogenomics can do for drug safety. Abacavir is a nucleo-side reverse transcriptase inhibitor of HIV-1 and HIV-2, and is indicated for antiretroviral combination therapy of HIV infection. The dominant toxicity of this drug is a risk of hypersensitivity reactions. Propensity stud-ies demonstrated that the incidence could be dramatically reduced by pre-therapy screening for the human leukocyte anti-gen (HLA)‑B*5701 allele. It is currently estimated that 48–61% of patients with the HLA‑B*5701 allele will develop a hyper-sensitivity reaction to abacavir, compared to only 0–4% of patients who do not have the HLA‑B*5701 allele25. Detection of the genetic marker has substantially improved the benefit–risk of this compound by de-selecting the majority of patients who would experience a serious adverse effect.
Pharmacogenomics also determines pharmacokinetics, and the knowledge about polymorphisms in genes regulating drug-metabolizing enzymes or drug transporters has been successfully exploited to adjust drug dose regimens in an attempt to reduce variability in drug plasma levels and, conse-quently, in benefit–risk26,27.
Other intrinsic and extrinsic factors. These sources of variability are a mixed bag of sometimes poorly described factors that co-determine pharmacokinetics and/or pharmacodynamics. Non-genetic variabil-ity factors are divided into ‘intrinsic’ and ‘extrinsic’ factors. ‘Intrinsic’ factors are often referred to as different states of physiol-ogy or pathology28, such as age, sex, body weight29, comorbidities or baseline severity of disease30,31. ‘Extrinsic’ factors are environ-mental influences28, such as pollution, sun-light, co-medication or influences of food on pharmacokinetics, such as consumption of fruit juice32,33.
For instance, patients with rheumatoid arthritis who had a high body mass index were reported to respond less well than patients with a low body mass index to tumour necrosis factor (TNF) blockade by infliximab, even when the results were adjusted for baseline status of disease activity and infliximab dosage was based on body weight. As fat tissue may be modulating the inflammatory disease process, this finding supports the notion that a patient’s volume of fat tissue could have implications for other immune-mediated inflammatory conditions treated with TNF antagonists34.
Some of the residual (or unexplained) variability ascribed to intrinsic and extrinsic factors might, in reality, be due to genetic or
behavioural factors but is presently not rec-ognized as such. Hence, it will be impossible to address these modifiers of benefit–risk, and eliminating all biological variability of drug response will remain an elusive goal.
BehaviourPrescribing and drug handling in the medi-cation use system. Regulators approve drugs for defined indications and conditions, but the drug’s everyday use in the ‘medication use system’ is a different matter. We refer to the medication use system as the complex collaboration among physicians, nurses, pharmacists, hospital or nursing home staff and other health-care professionals who influence drug utilization in everyday practice5.
A large fraction of all prescriptions are written ‘off-label’, sometimes encouraged by inappropriate drug company marketing and promotions efforts35. Off-label implies prescribing for an unapproved condition, dose regimen, treatment duration, route of administration or for patients who should not be given the drug because of existing contraindications or interacting concomitant treatment. Some off-label uses may follow evidence of the drug’s efficacy in unapproved conditions, or may simply happen ahead of a regulatory label change, and as such may benefit patients. However, off-label use was
Table 1 | Sources of variability in drug response that may cause toxicity or lack of efficacy
Source of variability Mechanism Drug therapy Description of problem
Biology
Genomics Individual patients’ genomic make-up influences PK and PD, affecting drug concentration profile at the target site and the likelihood and magnitude of desired and adverse effects
Trastuzumab PD: only effective in patients overexpressing HER2 receptor on tumour cells
Abacavir PD: High risk of severe hypersensitivity reaction in patients with HLA‑B*5701 allele
Codeine PK: lack of analgesia in carriers of nonfunctional CYP2D6 alleles, toxicity with multiple CYP2D6 gene copies
Other intrinsic and extrinsic factors
Comorbidity, baseline severity of disease, other altered physiological states, or external factors influencing PK and/or PD
Insulin PD: glucose control and risk of hypoglycaemia affected by stress or physical activity
Several drugs PK: increased toxicity due to increased absorption with concomitant consumption of grapefruit juice
Behaviour
Prescribing and drug handling
Inappropriate or off-label prescribing, co-prescribing with an interacting drug, continued prescribing to non-responders or medication errors
Cerivastatin Rhabdomyolysis due to too high starting doses
Gemfibrozil Interactions in drug label ignored
Mibefradil Toxicity due to drug–drug interactions, label often ignored
Patient adherence Poor adherence to prescribed drug regimen, discontinuation (non-persistence), ‘drug holidays’ or inadvertent overdosing
Anti-hypertensive drugs
Non-adherence or non-persistence perceived as treatment-resistant hypertension
Anti-infective therapies
Drug holidays leading to the development of resistance
The overall variability and the extent of the efficacy–effectiveness gap is driven by the interplay between biological and behavioural factors. CYP2D6, cytochrome P450 2D6; HLA, human leukocyte antigen; PD, pharmacodynamics; PK, pharmacokinetics.
P E R S P E C T I V E S
498 | JULY 2011 | VOLUME 10 www.nature.com/reviews/drugdisc
nrd_3501_jul11.indd 498 20/06/2011 16:34
www.nature.com/reprintcollections/lilly/drug-innovation NATURE REPRINT COLLECTION | THE FUTURE OF DRUG INNOVATION | OCTOBER 2011 | 49
shown in many instances to contribute to the efficacy–effectiveness gap owing to more fre-quent adverse effects or reduced benefit36–38. Off-label prescribing is expected to increase variability of drug response, for example because new patients with pre-existing morbidities are being added to the treat-ment population, as occurred in the cases of rimonabant and varenicline (see above).
Effectiveness may be further reduced by inadvertent medication errors, including dis-pensing of the wrong drug or dose strength, inappropriate handling and storage of drugs, and other more subtle examples of poor use of medicines that may occur throughout the medication use system. The impact on pub-lic health is huge and studies have estimated that medication errors, including inappro-priate prescribing, cost tens of thousands of lives each year in the United States alone39.
Patient adherence. “Drugs don’t work in patients who don’t take them.” Also known as ‘Koop’s Law’, that simple observation by C. Everett Koop, former US surgeon general40, was the subject of numerous stud-ies and even of a dedicated World Health Organization report41. Poor adherence (also termed compliance) by patients to pre-scribed drug regimens may come in many forms, ranging from fluctuations in dose-timing to omitting a single day’s dosing to having repeat drug holidays (the sequential omission of 3 or more days’ doses) and, finally, to non-persistence (not taking drugs prescribed for chronic conditions)42.
Patients’ adherence is not perfect even in pre-licensing trials, and especially in long-term outcome trials43. Nonetheless, regulatory trials are usually geared towards maintaining adherence at the highest possible level, and adherence in real-life populations is expected to be substantially lower than in clinical trials44. It has been suggested that poor adherence may be “the single largest source of variance in drug responses” in some settings45, and it is also likely to be one of the principal sources of the efficacy–effectiveness gap.
There is an abundance of reports docu-menting that poor adherence or non-adher-ence by patients is a cause of potentially avoidable morbidity, mortality and lost pro-ductivity. The one class of drugs for which the importance of adherence is probably best understood — and for which lack of adher-ence has been described as the Achilles heel — is oral contraceptives. Because of their relatively low variability in pharmacokinetics and pharmacodynamics, these drugs could achieve a near-perfect therapeutic success
rate — that is, near zero risk of conception — given punctual dosing46. However, based on one estimate, in real-life conditions the conception rate increases 50-fold, from 0.1% per year under ‘perfect use’ conditions to 5.0% under ‘typical use’ (REF. 47).
Studies in HIV-infected patients have demonstrated a significant relation between patient adherence and virologic response48 and possibly also drug-resistance devel-opment49. In a study of patients with schizophrenia, approximately 7% of patients become non-adherent to their prescribed drug regimen each month after discharge from the hospital, and non-adherence was associated with an increased relapse rate50. Vrijens et al. reported that about half of the patients who were prescribed an anti-hypertensive drug had stopped taking it within 1 year51; it is easy to see how lack of drug exposure due to poor adherence may, if it is not reported by the patient and remains undetected by the prescriber, lead to the interpretation of ‘treatment-resistant hypertension’. Adherence is likely to become a factor in driving the clinical outcome of cancer treatments as more and more cancer drugs are administered orally and need to be taken over prolonged periods and in an ambulatory setting. Poor tamoxifen adher-ence was recently shown to be significantly associated with an increased risk of breast cancer events52.
In some treatment situations, adher-ence may take on a broader meaning than just taking a drug dose at a given time and include, for example, dieting and exercising. A lack of lifestyle changes may mitigate the therapeutic success of drug treatment. This was shown by recent findings that patients with early rheumatoid arthritis who smoke are less likely to respond to treatment with methotrexate and TNF inhibitors53.
Variability sources in a real-life settingWe have briefly described the individual influences that govern variability in any given therapeutic scenario. In everyday clini-cal practice, all of them will influence overall variability and the extent of the efficacy–effectiveness gap. However, the interplay of these biological and behavioural factors is not straightforward.
In an early seminal paper, Harter and Peck54 discussed major sources of variability in dose–effect relationships and, impor-tantly, their highly nonlinear interactions. They emphasized that total variability is the square root of the sum of the squares of the variabilities of each individual source54. Urquhart46 pointed out that: “this
nonlinearity has the unhappy consequence that a major reduction in the variability of one component of the system has only a minor effect on the overall variability.”
Harter and Peck also attempted to quan-tify for one model drug the relative contribu-tion of individual sources of variability to the cumulative variability of the overall thera-peutic response. In their estimate, adherence and pharmacokinetics are the most impor-tant drivers of variability of the therapeutic effect of theophylline, a drug that was widely used at the time in patients with asthma54. However, the relative contribution of indi-vidual sources to overall variability is likely to be different from one drug to the next and is unknown, or at least not formally assessed, for most drugs.
Bridging the efficacy–effectiveness gapWhenever expectations (efficacy) do not match reality (effectiveness), there are two ways to bridge the gap: either lower the expectations to the level of reality (in our context this would mean regulators demand pre-marketing studies that fully represent clinical reality and then base licensing deci-sions on effectiveness information) or bring up reality to the level of expectations. This second approach seeks to ensure that every-day practice strictly follows the label and that drug regimens are individualized to meet patients’ needs. Both concepts are useful but present serious challenges.
Lower the expectations to the level of reality. Ideally, regulatory RCTs should be inter-nally valid (that is, their design and conduct must minimize the possibility of bias), but to be clinically useful, the result must also be relevant to a definable group of patients in a particular clinical setting (that is, they must be externally valid)55. A perceived lack of external validity is a frequent criticism of current pre-marketing RCTs, which are often referred to as ‘explanatory’ or efficacy trials. There is a call for trials with higher external validity, also known as ‘pragmatic’ clinical trials (PCTs) or effectiveness trials55. For an in-depth discussion of the domains that characterize explanatory versus prag-matic trials, please refer to the ‘PRECIS framework’ (REF. 56).
An argument can indeed be made in favour of a shift in regulatory evidence standards from efficacy towards effective-ness. Such a shift would imply fewer and broader patient selection criteria (with the exception of validated biomarker-guided selection criteria, see below) and less control over patient management. Pre-licensing
P E R S P E C T I V E S
NATURE REVIEWS | DRUG DISCOVERY VOLUME 10 | JULY 2011 | 499
nrd_3501_jul11.indd 499 20/06/2011 16:34
documented high rate of adherence to HER2 testing and treatment recommendations24 that may reduce the efficacy–effectiveness gap for this drug.
Abacavir shows what pharmacogenomics can do for drug safety. Abacavir is a nucleo-side reverse transcriptase inhibitor of HIV-1 and HIV-2, and is indicated for antiretroviral combination therapy of HIV infection. The dominant toxicity of this drug is a risk of hypersensitivity reactions. Propensity stud-ies demonstrated that the incidence could be dramatically reduced by pre-therapy screening for the human leukocyte anti-gen (HLA)‑B*5701 allele. It is currently estimated that 48–61% of patients with the HLA‑B*5701 allele will develop a hyper-sensitivity reaction to abacavir, compared to only 0–4% of patients who do not have the HLA‑B*5701 allele25. Detection of the genetic marker has substantially improved the benefit–risk of this compound by de-selecting the majority of patients who would experience a serious adverse effect.
Pharmacogenomics also determines pharmacokinetics, and the knowledge about polymorphisms in genes regulating drug-metabolizing enzymes or drug transporters has been successfully exploited to adjust drug dose regimens in an attempt to reduce variability in drug plasma levels and, conse-quently, in benefit–risk26,27.
Other intrinsic and extrinsic factors. These sources of variability are a mixed bag of sometimes poorly described factors that co-determine pharmacokinetics and/or pharmacodynamics. Non-genetic variabil-ity factors are divided into ‘intrinsic’ and ‘extrinsic’ factors. ‘Intrinsic’ factors are often referred to as different states of physiol-ogy or pathology28, such as age, sex, body weight29, comorbidities or baseline severity of disease30,31. ‘Extrinsic’ factors are environ-mental influences28, such as pollution, sun-light, co-medication or influences of food on pharmacokinetics, such as consumption of fruit juice32,33.
For instance, patients with rheumatoid arthritis who had a high body mass index were reported to respond less well than patients with a low body mass index to tumour necrosis factor (TNF) blockade by infliximab, even when the results were adjusted for baseline status of disease activity and infliximab dosage was based on body weight. As fat tissue may be modulating the inflammatory disease process, this finding supports the notion that a patient’s volume of fat tissue could have implications for other immune-mediated inflammatory conditions treated with TNF antagonists34.
Some of the residual (or unexplained) variability ascribed to intrinsic and extrinsic factors might, in reality, be due to genetic or
behavioural factors but is presently not rec-ognized as such. Hence, it will be impossible to address these modifiers of benefit–risk, and eliminating all biological variability of drug response will remain an elusive goal.
BehaviourPrescribing and drug handling in the medi-cation use system. Regulators approve drugs for defined indications and conditions, but the drug’s everyday use in the ‘medication use system’ is a different matter. We refer to the medication use system as the complex collaboration among physicians, nurses, pharmacists, hospital or nursing home staff and other health-care professionals who influence drug utilization in everyday practice5.
A large fraction of all prescriptions are written ‘off-label’, sometimes encouraged by inappropriate drug company marketing and promotions efforts35. Off-label implies prescribing for an unapproved condition, dose regimen, treatment duration, route of administration or for patients who should not be given the drug because of existing contraindications or interacting concomitant treatment. Some off-label uses may follow evidence of the drug’s efficacy in unapproved conditions, or may simply happen ahead of a regulatory label change, and as such may benefit patients. However, off-label use was
Table 1 | Sources of variability in drug response that may cause toxicity or lack of efficacy
Source of variability Mechanism Drug therapy Description of problem
Biology
Genomics Individual patients’ genomic make-up influences PK and PD, affecting drug concentration profile at the target site and the likelihood and magnitude of desired and adverse effects
Trastuzumab PD: only effective in patients overexpressing HER2 receptor on tumour cells
Abacavir PD: High risk of severe hypersensitivity reaction in patients with HLA‑B*5701 allele
Codeine PK: lack of analgesia in carriers of nonfunctional CYP2D6 alleles, toxicity with multiple CYP2D6 gene copies
Other intrinsic and extrinsic factors
Comorbidity, baseline severity of disease, other altered physiological states, or external factors influencing PK and/or PD
Insulin PD: glucose control and risk of hypoglycaemia affected by stress or physical activity
Several drugs PK: increased toxicity due to increased absorption with concomitant consumption of grapefruit juice
Behaviour
Prescribing and drug handling
Inappropriate or off-label prescribing, co-prescribing with an interacting drug, continued prescribing to non-responders or medication errors
Cerivastatin Rhabdomyolysis due to too high starting doses
Gemfibrozil Interactions in drug label ignored
Mibefradil Toxicity due to drug–drug interactions, label often ignored
Patient adherence Poor adherence to prescribed drug regimen, discontinuation (non-persistence), ‘drug holidays’ or inadvertent overdosing
Anti-hypertensive drugs
Non-adherence or non-persistence perceived as treatment-resistant hypertension
Anti-infective therapies
Drug holidays leading to the development of resistance
The overall variability and the extent of the efficacy–effectiveness gap is driven by the interplay between biological and behavioural factors. CYP2D6, cytochrome P450 2D6; HLA, human leukocyte antigen; PD, pharmacodynamics; PK, pharmacokinetics.
P E R S P E C T I V E S
498 | JULY 2011 | VOLUME 10 www.nature.com/reviews/drugdisc
nrd_3501_jul11.indd 498 20/06/2011 16:34
50 | OCTOBER 2011 | THE FUTURE OF DRUG INNOVATION | NATURE REPRINT COLLECTION www.nature.com/reprintcollections/lilly/drug-innovation
of health care; for the second question, the key players will be developers of e-healthcare, physicians and other health professionals, patients, regulators and payers of health care.
In the following section we will discuss how the issues framed by these two ques-tions might successfully be addressed.
Which patient for this drug?The starting point with this approach is the knowledge base on a drug, and the goal is to optimize the treatable patient popula-tion in an attempt to minimize the number needed to treat (NNT) and/or to maximize the number needed to harm (NNH)66. Pharmacogenomics has considerable poten-tial to stratify patients with a given condition into treatment-eligible versus non-eligible groups. The examples of trastuzumab and abacavir show the power of predictive pharmacogenomic biomarkers, but experi-ence with pharmacogenomic (and in some instances also phenotypic) biomarkers has also highlighted a number of challenges for drug regulators.
In the past, many pharmacogenomic bio-markers have been identified retrospectively — that is, during the course of the develop-ment of the drug in question — and much of the data presented to regulatory authorities in support of such biomarkers raised ques-tions of methodological validity and clinical utility19,67.
The difficulty of ensuring an adequate predictive value of the biomarker test, also known as the ‘companion diagnostic test’, is shown by the pitfalls of using immunohisto-chemistry (IHC), a test with less than perfect predictive value to guide EGFR-targeted therapy. Some real target patients will remain unidentified and will be denied effective
treatment (false-negative patients), whereas other patients are unnecessarily exposed to a drug with no benefits but potential adverse effects (false-positive patients)19.
A different challenge is represented by the question: how big a difference between the subpopulations identified by a com-panion diagnostic justifies a label claim? To illustrate this issue we return to the gefi-tinib case study. At least one controlled trial showed that in patients with mutant EGFR, progression free survival (PFS) was clearly superior in the gefitinib group compared to chemotherapy control, but PFS was inferior to control in mutation-negative patients68. Here, the biomarker provides a clear deci-sion rule, as it differentiates subpopulations for which the benefit–risk is dramatically different. By contrast, an example of a less than clear-cut genomic biomarker was reported by Donnelly et al.69, who stud-ied the association of a single nucleotide polymorphism in the 3-hydroxy-3-methyl-glutaryl coenzyme A reductase (HMGCR) gene with the lipid-lowering response to statins. Retrospective analysis identified two strata of patients, one of which reached the total cholesterol target level in 71.9% of the cases, versus 49.0% in the other group69. Considering the relatively benign safety profile of statins at appropriate doses, one may conclude that the benefit–risk is posi-tive for both populations, and restricting the label to the higher response stratum may be unjustified. This case is not unique, and several potential biomarkers do not identify clearly positive or negative ben-efit–risk strata, but merely define different patient subpopulations with marginally different benefit–risk. For clinicians and patients, such biomarkers may have no
added value, but payers of health care might decide to limit coverage of that drug to the biomarker-defined high responder group because — all else being equal — cost effectiveness will be superior in that group. This may even have negative con-sequences, as biomarker stratification may come to be seen not as a means to optimize benefit–risk but to exclude patients from (expensive) treatment. There is at least one reported precedent of a payer using a pharmacogenomic biomarker that is not on the label of the drug to increase the cost effectiveness of a therapy19. The widely publicised debate around the clinical added value of cytochrome P450 2C9 (CYP2C9) and vitamin K epoxide reductase complex subunit 1 (VKORC1) genotyping for bet-ter dosing of the anticoagulant warfarin is another useful case study demonstrating the regulators’ challenges with tests that address only part of the expected variability in drug response. (For reviews of the warfa-rin case, please refer to REFS 70–72.)
The availability of less than clear-cut pre-dictive markers raises the question of whether marker-negative patients can or should be excluded from pivotal clinical trials. The conundrum here is that focusing on expected high responder groups will make the clini-cal development phase faster and cheaper, support the drug development endeavour and bring novel treatment options to (some) patients earlier; however, it may be ethically challenging to exclude patients who may potentially benefit, as in the case of HMGCR gene stratification described above.
Solutions to these issues are, however, beginning to emerge. Industry and the regu-latory community have learned from past experience. The pharmaceutical industry
Table 2 | Restrictions in the wording of regulatory drug labels in 2009
Indication as shown on the label or SmPC No. of drugs in United States (n = 25)
No. of drugs in EU (n = 29)
Broad, unrestricted* (for example, benign prostate hyperplasia) 18 17
Restricted to second-line (for example, carcinoma after failure of prior platinum-containing regimen)
5 6
Restricted to advanced stage of disease (for example, cartilage defects of grade III or IV)
2 2
Restricted to combination therapy (for example, rheumatoid arthritis in combination with methotrexate)
0 3
Restricted to a pharmacogenomic subset (for example, cancer with activating mutations of EGFR-TK)
0 1
For all new drugs approved in 2009, we reviewed the official labels (for US drugs) or the summary of product characteristics (SmPC) (for European Union (EU) drugs). (For the EU, we reviewed only drugs that were approved by centralized procedure.) The list of new biologics and new molecular entities approved by the US Food and Drug Administration (FDA) was obtained from REF. 108, and the list of new active substances for the EU was obtained from REF. 109. Label/SmPC information was obtained from the websites of the FDA and European Medicines Agency (EMA). Only wording under the headings of “Indications and usage” (FDA) or “Therapeutic indication” (EMA) was considered. Note that contraindications and warnings, which may also restrict the treatment-eligible population, were not considered for this analysis. EGFR-TK, epidermal growth factor receptor tyrosine kinase. *Restrictions to age groups are also included under this heading (for example, “not approved for use in pediatric patients”).
P E R S P E C T I V E S
NATURE REVIEWS | DRUG DISCOVERY VOLUME 10 | JULY 2011 | 501
nrd_3501_jul11.indd 501 20/06/2011 16:34
effectiveness trials might allow post-reg-ulatory decision makers, such as payers of health care or clinicians, to better judge to whom results can reasonably be applied to in a realistic health-care setting. However, that benefit would come at a high price. To explain the downside of a ‘regulatory effectiveness paradigm’, we recall that inter-pretation of RCT results can be considered as a signal-to-noise problem. The majority of regulatory clinical trials are superiority showing — that is, they aim to demonstrate a statistically significant positive differ-ence in observed outcome between a group of patients receiving the test drug and a control group, who are most often given placebo. The higher the variability in the trial (‘noise’), the less likely it is that a differ-ence (‘signal’) can be shown — even where it exists. For instance, according to Koop’s Law, poor adherence to the experimental drug regimen by some patients will increase variability and diminish the average effect size. Sponsors of clinical trials are very much aware of that risk and frequently seek to maximize patient adherence by way of patient reminders, frequent office visits or building an initial placebo run-in phase into the trial protocol; in the run-in phase, all eligible patients receive placebo, and those who are poorly compliant are excluded before randomization. Such measures, often referred to as ‘enrichment’ (REF. 57), are expected to increase the signal-to-noise ratio and the chance of the trial to be successful, but they reduce external validity. Threats to the signal-to-noise ratio may also come from overly broad patient selection criteria, such as the inadvertent inclusion of patients with a viral infection into a study of a novel antibacterial agent.
Effectiveness trials, in which condi-tions are less stringently controlled, have higher noise levels and the signal may be reduced or lost in the noise (FIG. 2). At a minimum, this would result in much larger, more expensive trials to achieve statistical significance. In the worst case, it poses the danger of missing potentially useful sub-stances: a drug might be deemed ineffective in a noisy effectiveness trial, even though it may be beneficial to some patients under some conditions. Depriving these patients of valuable treatment options would amount to a false-negative regulatory decision. The pitfalls of requesting effectiveness data as a basis for marketing authorization or of allowing unlimited variation in premarket-ing RCTs are also recognized by proponents of PCTs, some of whom advocate PCTs as “more appropriate vehicles for examining
variation in prescriber or patient adherence” (REF. 18). We support this notion and draw attention to the fact that the demonstration of a drug’s potential for delivering benefits is a very different question from assessing whether that potential is achieved in real life. We argue that, in a situation in which the internal validity of pre-licensing RCTs is not in doubt but where there is an apparent large gap between efficacy and effectiveness, one is not looking at a drug problem but at a health-care delivery problem, and the focus of remedial action should be shifted to improving real-life performance.
Bring up reality to the level of expectations. In an ideal world of evidence-based medi-cine, the label would exactly reflect the evi-dence base — that is, the treatment scenario of regulatory clinical trials (step 1) — and drug utilization would conform to the label (step 2). Alas, both steps cannot be easily realized.
With regards to the first step, defin-ing an indication strictly in line with the clinical trial conditions is not an option, and wording the label is usually a balancing act for regulators who need to refrain from overextrapolating the evidence base while being mindful of practical constraints faced by prescribers. For instance, one external commentator chided regulators for overly narrow labels:
“the FDA approves [cancer drugs] for indications so narrow (an artifact of their archaic statistical evaluation approaches), that most cancer drugs actually are approved for different ‘uses.’ A colon cancer drug isn’t approved by [the] FDA to treat any colon cancer patient at any time, but rather to treat, for example, only those patients who have exhausted all other approved options, because that is the population it was statistically tested in for approval. Also, oncologists don’t use cancer drugs strictly in accordance with the FDA’s narrow approvals because doing so simply wouldn’t work to keep their patients alive.” (REF. 58)
We reviewed the wording of the treat-ment indications in the labels of new active substances authorized in the year 2009 in the United States and the EU (centralized procedure only) (TABLE 2). Our findings sup-port the notion that the label is frequently restricted to what some may consider an artificial subset because, in most cases, the limited indication reflects the clinical trial
scenarios. It is indeed biologically plausible that some of the more narrowly authorized drugs might be equally safe and effica-cious in extended settings, such as first-line therapy or monotherapy. However, too much extrapolation in the wording of the label would violate the principles of evidence-based drug licensing. Overly broad labels could rightfully be criticized as further increasing variability and widening the efficacy–effectiveness gap when extrapola-tion turns out to be unjustified59. The cur-rent model of drug licensing leaves limited room for regulators to address the dilemma between ‘too wide or too narrow’ labels. It is hoped that innovative approaches to licens-ing such as ‘staggered approval’ (or progres-sive authorization) may in future better align the knowledge of a drug with the label claim60–62.
The second step in this process — ensur-ing that drug utilization conforms to the label — is even more difficult to achieve as it requires behavioural changes from all actors in the medication use system and from patients. Past attempts at reducing variability of drug utilization, which were largely based on motivational and educational efforts, were not always successful63.
These considerations highlight that both avenues to address the efficacy–effective-ness gap are fraught with difficulties and neither is likely to achieve satisfactory results on its own. The most useful approach will be to simultaneously address expectations and reality.
The problem may also be framed from a different angle. Drug effects — good or bad — are the result of a successful or bad match between a drug and a given patient. Drugs may be more or less ‘forgiving’ (REF. 64); those with a steep dose–response relation-ship, narrow therapeutic window and rapid elimination are often less forgiving. Also, some patients are more ‘unforgiving’ than others; for example, some patients may have genetic traits that predispose them to an adverse event or they may be taking multiple concomitant medications. Poor therapeutic outcomes result when an unforgiving drug meets an unforgiving patient65, and the key to bridging the efficacy–effectiveness gap is to avoid poor matches. We propose that suc-cessful attempts to this end will have to be centred on two questions: ‘which patient for this drug?’ and ‘which drug regimen for this patient?’ Novel technologies will have to be harnessed both for the pre- and post-licens-ing lifespan of drugs. The call for action to address the first question is directed mostly to developers of drugs, regulators and payers
P E R S P E C T I V E S
500 | JULY 2011 | VOLUME 10 www.nature.com/reviews/drugdisc
nrd_3501_jul11.indd 500 20/06/2011 16:34
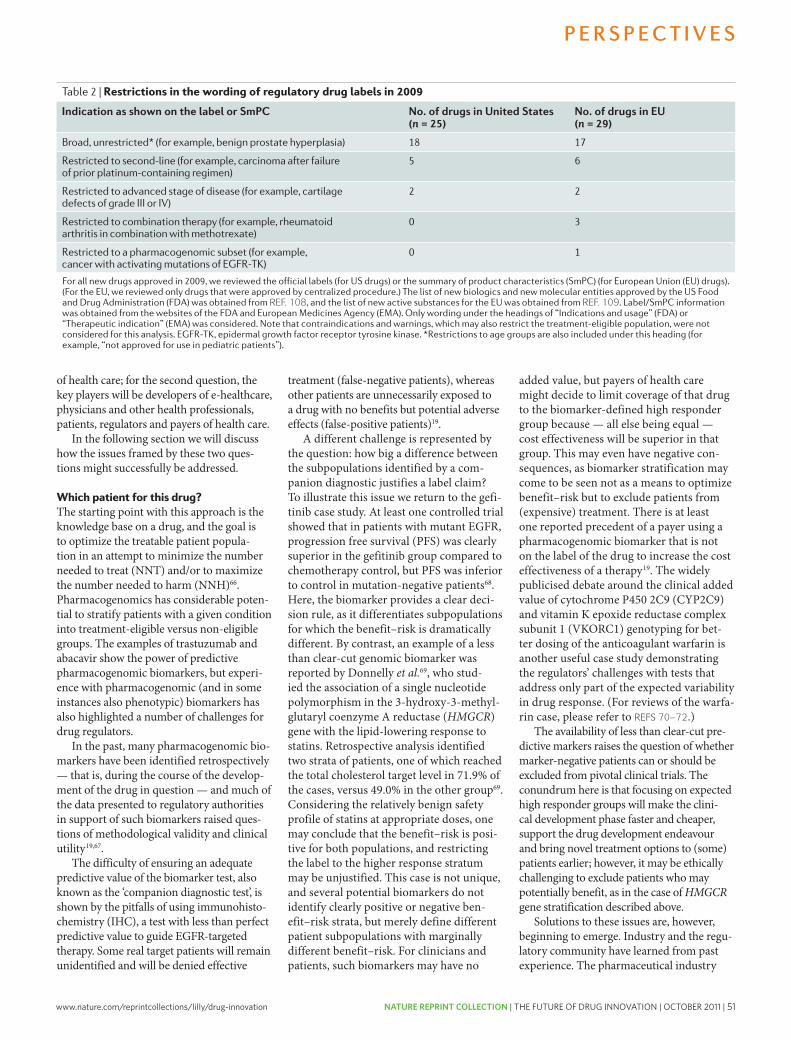
www.nature.com/reprintcollections/lilly/drug-innovation NATURE REPRINT COLLECTION | THE FUTURE OF DRUG INNOVATION | OCTOBER 2011 | 51
of health care; for the second question, the key players will be developers of e-healthcare, physicians and other health professionals, patients, regulators and payers of health care.
In the following section we will discuss how the issues framed by these two ques-tions might successfully be addressed.
Which patient for this drug?The starting point with this approach is the knowledge base on a drug, and the goal is to optimize the treatable patient popula-tion in an attempt to minimize the number needed to treat (NNT) and/or to maximize the number needed to harm (NNH)66. Pharmacogenomics has considerable poten-tial to stratify patients with a given condition into treatment-eligible versus non-eligible groups. The examples of trastuzumab and abacavir show the power of predictive pharmacogenomic biomarkers, but experi-ence with pharmacogenomic (and in some instances also phenotypic) biomarkers has also highlighted a number of challenges for drug regulators.
In the past, many pharmacogenomic bio-markers have been identified retrospectively — that is, during the course of the develop-ment of the drug in question — and much of the data presented to regulatory authorities in support of such biomarkers raised ques-tions of methodological validity and clinical utility19,67.
The difficulty of ensuring an adequate predictive value of the biomarker test, also known as the ‘companion diagnostic test’, is shown by the pitfalls of using immunohisto-chemistry (IHC), a test with less than perfect predictive value to guide EGFR-targeted therapy. Some real target patients will remain unidentified and will be denied effective
treatment (false-negative patients), whereas other patients are unnecessarily exposed to a drug with no benefits but potential adverse effects (false-positive patients)19.
A different challenge is represented by the question: how big a difference between the subpopulations identified by a com-panion diagnostic justifies a label claim? To illustrate this issue we return to the gefi-tinib case study. At least one controlled trial showed that in patients with mutant EGFR, progression free survival (PFS) was clearly superior in the gefitinib group compared to chemotherapy control, but PFS was inferior to control in mutation-negative patients68. Here, the biomarker provides a clear deci-sion rule, as it differentiates subpopulations for which the benefit–risk is dramatically different. By contrast, an example of a less than clear-cut genomic biomarker was reported by Donnelly et al.69, who stud-ied the association of a single nucleotide polymorphism in the 3-hydroxy-3-methyl-glutaryl coenzyme A reductase (HMGCR) gene with the lipid-lowering response to statins. Retrospective analysis identified two strata of patients, one of which reached the total cholesterol target level in 71.9% of the cases, versus 49.0% in the other group69. Considering the relatively benign safety profile of statins at appropriate doses, one may conclude that the benefit–risk is posi-tive for both populations, and restricting the label to the higher response stratum may be unjustified. This case is not unique, and several potential biomarkers do not identify clearly positive or negative ben-efit–risk strata, but merely define different patient subpopulations with marginally different benefit–risk. For clinicians and patients, such biomarkers may have no
added value, but payers of health care might decide to limit coverage of that drug to the biomarker-defined high responder group because — all else being equal — cost effectiveness will be superior in that group. This may even have negative con-sequences, as biomarker stratification may come to be seen not as a means to optimize benefit–risk but to exclude patients from (expensive) treatment. There is at least one reported precedent of a payer using a pharmacogenomic biomarker that is not on the label of the drug to increase the cost effectiveness of a therapy19. The widely publicised debate around the clinical added value of cytochrome P450 2C9 (CYP2C9) and vitamin K epoxide reductase complex subunit 1 (VKORC1) genotyping for bet-ter dosing of the anticoagulant warfarin is another useful case study demonstrating the regulators’ challenges with tests that address only part of the expected variability in drug response. (For reviews of the warfa-rin case, please refer to REFS 70–72.)
The availability of less than clear-cut pre-dictive markers raises the question of whether marker-negative patients can or should be excluded from pivotal clinical trials. The conundrum here is that focusing on expected high responder groups will make the clini-cal development phase faster and cheaper, support the drug development endeavour and bring novel treatment options to (some) patients earlier; however, it may be ethically challenging to exclude patients who may potentially benefit, as in the case of HMGCR gene stratification described above.
Solutions to these issues are, however, beginning to emerge. Industry and the regu-latory community have learned from past experience. The pharmaceutical industry
Table 2 | Restrictions in the wording of regulatory drug labels in 2009
Indication as shown on the label or SmPC No. of drugs in United States (n = 25)
No. of drugs in EU (n = 29)
Broad, unrestricted* (for example, benign prostate hyperplasia) 18 17
Restricted to second-line (for example, carcinoma after failure of prior platinum-containing regimen)
5 6
Restricted to advanced stage of disease (for example, cartilage defects of grade III or IV)
2 2
Restricted to combination therapy (for example, rheumatoid arthritis in combination with methotrexate)
0 3
Restricted to a pharmacogenomic subset (for example, cancer with activating mutations of EGFR-TK)
0 1
For all new drugs approved in 2009, we reviewed the official labels (for US drugs) or the summary of product characteristics (SmPC) (for European Union (EU) drugs). (For the EU, we reviewed only drugs that were approved by centralized procedure.) The list of new biologics and new molecular entities approved by the US Food and Drug Administration (FDA) was obtained from REF. 108, and the list of new active substances for the EU was obtained from REF. 109. Label/SmPC information was obtained from the websites of the FDA and European Medicines Agency (EMA). Only wording under the headings of “Indications and usage” (FDA) or “Therapeutic indication” (EMA) was considered. Note that contraindications and warnings, which may also restrict the treatment-eligible population, were not considered for this analysis. EGFR-TK, epidermal growth factor receptor tyrosine kinase. *Restrictions to age groups are also included under this heading (for example, “not approved for use in pediatric patients”).
P E R S P E C T I V E S
NATURE REVIEWS | DRUG DISCOVERY VOLUME 10 | JULY 2011 | 501
nrd_3501_jul11.indd 501 20/06/2011 16:34
effectiveness trials might allow post-reg-ulatory decision makers, such as payers of health care or clinicians, to better judge to whom results can reasonably be applied to in a realistic health-care setting. However, that benefit would come at a high price. To explain the downside of a ‘regulatory effectiveness paradigm’, we recall that inter-pretation of RCT results can be considered as a signal-to-noise problem. The majority of regulatory clinical trials are superiority showing — that is, they aim to demonstrate a statistically significant positive differ-ence in observed outcome between a group of patients receiving the test drug and a control group, who are most often given placebo. The higher the variability in the trial (‘noise’), the less likely it is that a differ-ence (‘signal’) can be shown — even where it exists. For instance, according to Koop’s Law, poor adherence to the experimental drug regimen by some patients will increase variability and diminish the average effect size. Sponsors of clinical trials are very much aware of that risk and frequently seek to maximize patient adherence by way of patient reminders, frequent office visits or building an initial placebo run-in phase into the trial protocol; in the run-in phase, all eligible patients receive placebo, and those who are poorly compliant are excluded before randomization. Such measures, often referred to as ‘enrichment’ (REF. 57), are expected to increase the signal-to-noise ratio and the chance of the trial to be successful, but they reduce external validity. Threats to the signal-to-noise ratio may also come from overly broad patient selection criteria, such as the inadvertent inclusion of patients with a viral infection into a study of a novel antibacterial agent.
Effectiveness trials, in which condi-tions are less stringently controlled, have higher noise levels and the signal may be reduced or lost in the noise (FIG. 2). At a minimum, this would result in much larger, more expensive trials to achieve statistical significance. In the worst case, it poses the danger of missing potentially useful sub-stances: a drug might be deemed ineffective in a noisy effectiveness trial, even though it may be beneficial to some patients under some conditions. Depriving these patients of valuable treatment options would amount to a false-negative regulatory decision. The pitfalls of requesting effectiveness data as a basis for marketing authorization or of allowing unlimited variation in premarket-ing RCTs are also recognized by proponents of PCTs, some of whom advocate PCTs as “more appropriate vehicles for examining
variation in prescriber or patient adherence” (REF. 18). We support this notion and draw attention to the fact that the demonstration of a drug’s potential for delivering benefits is a very different question from assessing whether that potential is achieved in real life. We argue that, in a situation in which the internal validity of pre-licensing RCTs is not in doubt but where there is an apparent large gap between efficacy and effectiveness, one is not looking at a drug problem but at a health-care delivery problem, and the focus of remedial action should be shifted to improving real-life performance.
Bring up reality to the level of expectations. In an ideal world of evidence-based medi-cine, the label would exactly reflect the evi-dence base — that is, the treatment scenario of regulatory clinical trials (step 1) — and drug utilization would conform to the label (step 2). Alas, both steps cannot be easily realized.
With regards to the first step, defin-ing an indication strictly in line with the clinical trial conditions is not an option, and wording the label is usually a balancing act for regulators who need to refrain from overextrapolating the evidence base while being mindful of practical constraints faced by prescribers. For instance, one external commentator chided regulators for overly narrow labels:
“the FDA approves [cancer drugs] for indications so narrow (an artifact of their archaic statistical evaluation approaches), that most cancer drugs actually are approved for different ‘uses.’ A colon cancer drug isn’t approved by [the] FDA to treat any colon cancer patient at any time, but rather to treat, for example, only those patients who have exhausted all other approved options, because that is the population it was statistically tested in for approval. Also, oncologists don’t use cancer drugs strictly in accordance with the FDA’s narrow approvals because doing so simply wouldn’t work to keep their patients alive.” (REF. 58)
We reviewed the wording of the treat-ment indications in the labels of new active substances authorized in the year 2009 in the United States and the EU (centralized procedure only) (TABLE 2). Our findings sup-port the notion that the label is frequently restricted to what some may consider an artificial subset because, in most cases, the limited indication reflects the clinical trial
scenarios. It is indeed biologically plausible that some of the more narrowly authorized drugs might be equally safe and effica-cious in extended settings, such as first-line therapy or monotherapy. However, too much extrapolation in the wording of the label would violate the principles of evidence-based drug licensing. Overly broad labels could rightfully be criticized as further increasing variability and widening the efficacy–effectiveness gap when extrapola-tion turns out to be unjustified59. The cur-rent model of drug licensing leaves limited room for regulators to address the dilemma between ‘too wide or too narrow’ labels. It is hoped that innovative approaches to licens-ing such as ‘staggered approval’ (or progres-sive authorization) may in future better align the knowledge of a drug with the label claim60–62.
The second step in this process — ensur-ing that drug utilization conforms to the label — is even more difficult to achieve as it requires behavioural changes from all actors in the medication use system and from patients. Past attempts at reducing variability of drug utilization, which were largely based on motivational and educational efforts, were not always successful63.
These considerations highlight that both avenues to address the efficacy–effective-ness gap are fraught with difficulties and neither is likely to achieve satisfactory results on its own. The most useful approach will be to simultaneously address expectations and reality.
The problem may also be framed from a different angle. Drug effects — good or bad — are the result of a successful or bad match between a drug and a given patient. Drugs may be more or less ‘forgiving’ (REF. 64); those with a steep dose–response relation-ship, narrow therapeutic window and rapid elimination are often less forgiving. Also, some patients are more ‘unforgiving’ than others; for example, some patients may have genetic traits that predispose them to an adverse event or they may be taking multiple concomitant medications. Poor therapeutic outcomes result when an unforgiving drug meets an unforgiving patient65, and the key to bridging the efficacy–effectiveness gap is to avoid poor matches. We propose that suc-cessful attempts to this end will have to be centred on two questions: ‘which patient for this drug?’ and ‘which drug regimen for this patient?’ Novel technologies will have to be harnessed both for the pre- and post-licens-ing lifespan of drugs. The call for action to address the first question is directed mostly to developers of drugs, regulators and payers
P E R S P E C T I V E S
500 | JULY 2011 | VOLUME 10 www.nature.com/reviews/drugdisc
nrd_3501_jul11.indd 500 20/06/2011 16:34
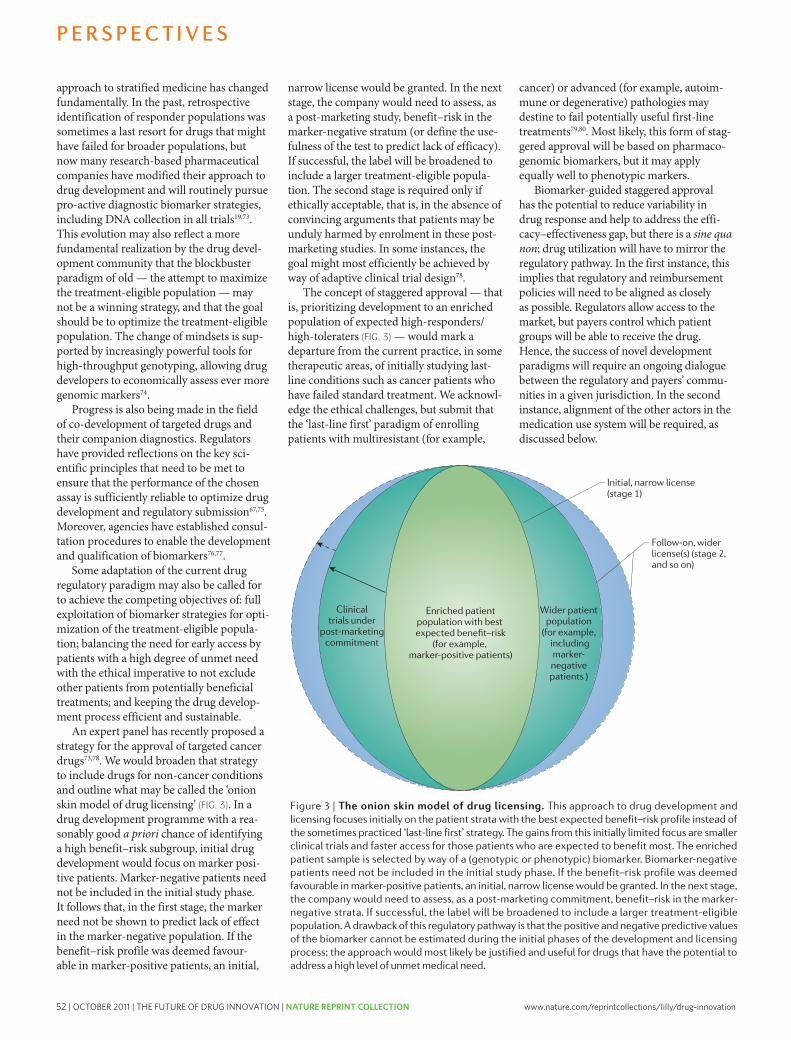
52 | OCTOBER 2011 | THE FUTURE OF DRUG INNOVATION | NATURE REPRINT COLLECTION www.nature.com/reprintcollections/lilly/drug-innovation
Regulators could make a further contribu-tion to addressing the efficacy–effectiveness gap: in select cases in which external trial validity is perceived to be low, or in which problems associated with everyday clini-cal use may be anticipated, the assessment report could provide structured information on expected relevance of pivotal trials to use in practice along the lines of, for example, the PRECIS framework56. At least one post-licensing decision maker, the French Health Technology Assessment body HAS (French National Authority for Health), which advises on the effectiveness and relative effectiveness of drugs to inform reimbursement and pric-ing decisions, has proposed a formal meth-odological framework to predict effectiveness based on regulatory efficacy trials and expert input81. Time will tell whether this or similar methods could be more widely used at the time of licensing.
Which drug regimen for this patient?“The right drug, at the right dose, at the right time, to the right patient” has been at the core of clinical pharmacology teaching for decades82; it implies the consideration of as many genotypic, phenotypic and envi-ronmental patient variables as possible to individualize drug regimes, considering all available treatment options.
Industry and regulators aim to design drug development plans to generate the information required for tailored dose regimens — to the extent that this is possible. Covariate-adjusted analysis of clinical trials has a long tradition in drug development, and is often used to identify patients for whom a treatment is more or less beneficial83. Considerable progress has been made over the past decade or two in the use of pharmacokinetics/phar-macodynamics modelling and simulation (M&S) in drug development to study the interrelationships among multiple factors such as gender, age, feeding and fasting, and comorbidities84. The use of M&S has been encouraged by regulators for optimiz-ing drug development and recommending dose adjustments in defined subpopula-tions, such as children, without specific, full-powered studies85. It will be interesting to explore how such methodologies could be applied to observational post-marketing studies as well.
However, regulators, industry and payers of health care can make further contribu-tions, beyond intelligent pre-licensing trial designs and analyses, to addressing the behavioural side of the efficacy–effectiveness gap (TABLE 1).
Quality of prescribing. There has been no shortage of attempts to promote evidence-based prescribing and reduce inconsistency in everyday patient care; training pro-grammes, dedicated prescriber communi-cations from regulators and industry, and clinical practice guidelines have increasingly been developed86–88. However, many of these efforts have had a limited effect on chang-ing prescriber behaviour, and guideline adoption is variable89,90, but the impact can be substantial if appropriate measures are taken, including a focus on ownership91. The reasons for failure are multiple but include the increasingly demanding health-care environment for prescribers because of the widening choice of medicines available, expanding indications for drug treatment, greater complexity of treatment regimens and the pace of change in therapeutics; new evidence on efficacy or emerging safety signals mean that what is considered good prescribing today may not necessarily be considered so in a year’s time. Providing health-care professionals with only printed reference information, such as formularies or ‘Dear Health-Care Professional’ commu-nications, may no longer be fit for purpose. The information will not be available when needed; prescribers simply do not have the time to consult it as they make rapid ‘point of care’ decisions63. Against this background, the burgeoning field of e-healthcare offers unique opportunities to address prescribing and medication errors. Advances with the development of electronic health records, computerized physician order entry (e-pre-scribing), and decision support systems pro-vide opportunities of linking patient-specific information (for example, comorbidity and renal insufficiency) with electronic drug-specific information (for example, contrain-dications and dose-modification guidance92). Bringing these building blocks of e-health-care together can help prescribers to improve drug regimens by including patient-specific alerts, such as for contraindications, limits of recommended treatment duration or poten-tial interactions between drugs prescribed by different specialists (FIG. 4).
Pilot schemes of complete ‘computerized physician order entry’ and e-prescribing tools in outpatient care are currently being tested93,94. Furthermore, integrated but lim-ited ‘clinical computerized decision support’ applications aimed at guiding clinicians to appropriately handle drug dosing and drug interactions are now up and running95,96. However, the full statutory label information from drug regulatory bodies is not available in a logical format that can interface with
the electronic health record and decision support systems. The European Medicines Agency is exploring ways to make label information available at the time of licensing in an electronic format that can be integrated with the other building blocks of e-health-care at point of care63.
Regulators have traditionally confined themselves to providing information on the rational use of drugs — interference with everyday prescribing was not part of their role. Boundaries have somewhat changed with the establishment of RMPs (in the EU) and REMSs (in the United States). These post-marketing activities are not limited to risk assessment but may include a pro-active risk mitigation component.
A useful example is the anti-epileptic agent vigabatrin. Because of the potential for visual loss, it was approved in the United States with an REMS. One component of an REMS is “elements to assure safe use”, which function as a type of restricted distribution system. The particular elements in this case included special certification of health-care providers who prescribe vigabatrin, special certification of pharmacies that dispense vigabatrin, a requirement that vigabatrin be dispensed to patients with evidence or other documentation of safe-use conditions, and enrolment of each patient using vigabatrin in a registry. In addition to this, the drug has a dedicated implementation plan to facili-tate ongoing benefit–risk assessments; all patients receive a baseline ophthalmologic evaluation and regular vision monitoring to ensure that vigabatrin-induced vision loss is detected as early as possible, and vigaba-trin therapy is discontinued in patients who experience an inadequate clinical response5. This relatively new approach to risk mitigation initiated by regulators may be interpreted as interference with everyday practice, but it is hoped that it will contribute to a favourable benefit–risk profile in real life, reducing the efficacy–effectiveness gap.
Patient adherence. The impact of poor adherence on public health and the cost to the health-care system are well understood97. However, considerations of adherence do not figure prominently in the evaluation of pre-licensing trials, and the regulatory analytical standard, the intention-to-treat (ITT) analysis, is deliberately blind as to whether individual patients followed the treatment protocol. For some treatment scenarios (such as time consuming, mul-tiple drug inhalations for children and adolescents with cystic fibrosis)98, it may be justified to make trials adherence-informed,
P E R S P E C T I V E S
NATURE REVIEWS | DRUG DISCOVERY VOLUME 10 | JULY 2011 | 503
nrd_3501_jul11.indd 503 20/06/2011 16:34
approach to stratified medicine has changed fundamentally. In the past, retrospective identification of responder populations was sometimes a last resort for drugs that might have failed for broader populations, but now many research-based pharmaceutical companies have modified their approach to drug development and will routinely pursue pro-active diagnostic biomarker strategies, including DNA collection in all trials19,73. This evolution may also reflect a more fundamental realization by the drug devel-opment community that the blockbuster paradigm of old — the attempt to maximize the treatment-eligible population — may not be a winning strategy, and that the goal should be to optimize the treatment-eligible population. The change of mindsets is sup-ported by increasingly powerful tools for high-throughput genotyping, allowing drug developers to economically assess ever more genomic markers74.
Progress is also being made in the field of co-development of targeted drugs and their companion diagnostics. Regulators have provided reflections on the key sci-entific principles that need to be met to ensure that the performance of the chosen assay is sufficiently reliable to optimize drug development and regulatory submission67,75. Moreover, agencies have established consul-tation procedures to enable the development and qualification of biomarkers76,77.
Some adaptation of the current drug regulatory paradigm may also be called for to achieve the competing objectives of: full exploitation of biomarker strategies for opti-mization of the treatment-eligible popula-tion; balancing the need for early access by patients with a high degree of unmet need with the ethical imperative to not exclude other patients from potentially beneficial treatments; and keeping the drug develop-ment process efficient and sustainable.
An expert panel has recently proposed a strategy for the approval of targeted cancer drugs73,78. We would broaden that strategy to include drugs for non-cancer conditions and outline what may be called the ‘onion skin model of drug licensing’ (FIG. 3). In a drug development programme with a rea-sonably good a priori chance of identifying a high benefit–risk subgroup, initial drug development would focus on marker posi-tive patients. Marker-negative patients need not be included in the initial study phase. It follows that, in the first stage, the marker need not be shown to predict lack of effect in the marker-negative population. If the benefit–risk profile was deemed favour-able in marker-positive patients, an initial,
narrow license would be granted. In the next stage, the company would need to assess, as a post-marketing study, benefit–risk in the marker-negative stratum (or define the use-fulness of the test to predict lack of efficacy). If successful, the label will be broadened to include a larger treatment-eligible popula-tion. The second stage is required only if ethically acceptable, that is, in the absence of convincing arguments that patients may be unduly harmed by enrolment in these post-marketing studies. In some instances, the goal might most efficiently be achieved by way of adaptive clinical trial design78.
The concept of staggered approval — that is, prioritizing development to an enriched population of expected high-responders/high-toleraters (FIG. 3) — would mark a departure from the current practice, in some therapeutic areas, of initially studying last-line conditions such as cancer patients who have failed standard treatment. We acknowl-edge the ethical challenges, but submit that the ‘last-line first’ paradigm of enrolling patients with multiresistant (for example,
cancer) or advanced (for example, autoim-mune or degenerative) pathologies may destine to fail potentially useful first-line treatments79,80. Most likely, this form of stag-gered approval will be based on pharmaco-genomic biomarkers, but it may apply equally well to phenotypic markers.
Biomarker-guided staggered approval has the potential to reduce variability in drug response and help to address the effi-cacy–effectiveness gap, but there is a sine qua non; drug utilization will have to mirror the regulatory pathway. In the first instance, this implies that regulatory and reimbursement policies will need to be aligned as closely as possible. Regulators allow access to the market, but payers control which patient groups will be able to receive the drug. Hence, the success of novel development paradigms will require an ongoing dialogue between the regulatory and payers’ commu-nities in a given jurisdiction. In the second instance, alignment of the other actors in the medication use system will be required, as discussed below.
Figure 3 | The onion skin model of drug licensing. This approach to drug development and licensing focuses initially on the patient strata with the best expected benefit–risk profile instead of the sometimes practiced ‘last-line first’ strategy. The gains from this initially limited focus are smaller clinical trials and faster access for those patients who are expected to benefit most. The enriched patient sample is selected by way of a (genotypic or phenotypic) biomarker. Biomarker-negative patients need not be included in the initial study phase. If the benefit–risk profile was deemed favourable in marker-positive patients, an initial, narrow license would be granted. In the next stage, the company would need to assess, as a post-marketing commitment, benefit–risk in the marker-negative strata. If successful, the label will be broadened to include a larger treatment-eligible population. A drawback of this regulatory pathway is that the positive and negative predictive values of the biomarker cannot be estimated during the initial phases of the development and licensing process; the approach would most likely be justified and useful for drugs that have the potential to address a high level of unmet medical need.
P E R S P E C T I V E S
502 | JULY 2011 | VOLUME 10 www.nature.com/reviews/drugdisc
nrd_3501_jul11.indd 502 20/06/2011 16:34
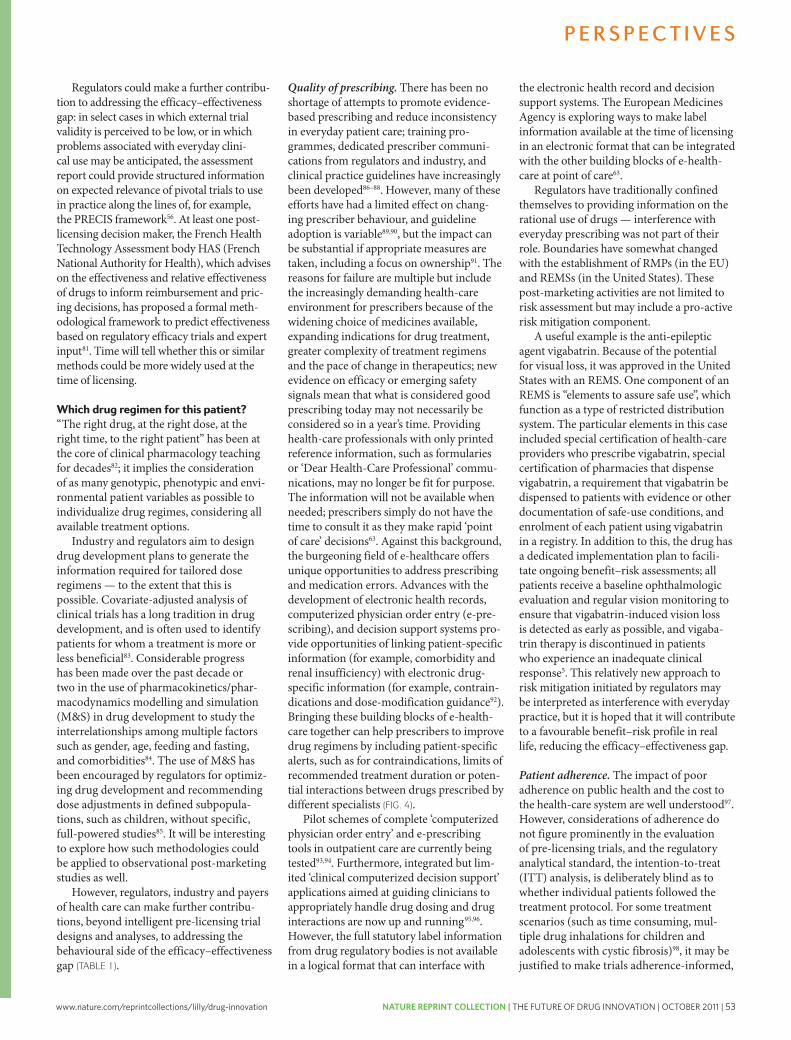
www.nature.com/reprintcollections/lilly/drug-innovation NATURE REPRINT COLLECTION | THE FUTURE OF DRUG INNOVATION | OCTOBER 2011 | 53
Regulators could make a further contribu-tion to addressing the efficacy–effectiveness gap: in select cases in which external trial validity is perceived to be low, or in which problems associated with everyday clini-cal use may be anticipated, the assessment report could provide structured information on expected relevance of pivotal trials to use in practice along the lines of, for example, the PRECIS framework56. At least one post-licensing decision maker, the French Health Technology Assessment body HAS (French National Authority for Health), which advises on the effectiveness and relative effectiveness of drugs to inform reimbursement and pric-ing decisions, has proposed a formal meth-odological framework to predict effectiveness based on regulatory efficacy trials and expert input81. Time will tell whether this or similar methods could be more widely used at the time of licensing.
Which drug regimen for this patient?“The right drug, at the right dose, at the right time, to the right patient” has been at the core of clinical pharmacology teaching for decades82; it implies the consideration of as many genotypic, phenotypic and envi-ronmental patient variables as possible to individualize drug regimes, considering all available treatment options.
Industry and regulators aim to design drug development plans to generate the information required for tailored dose regimens — to the extent that this is possible. Covariate-adjusted analysis of clinical trials has a long tradition in drug development, and is often used to identify patients for whom a treatment is more or less beneficial83. Considerable progress has been made over the past decade or two in the use of pharmacokinetics/phar-macodynamics modelling and simulation (M&S) in drug development to study the interrelationships among multiple factors such as gender, age, feeding and fasting, and comorbidities84. The use of M&S has been encouraged by regulators for optimiz-ing drug development and recommending dose adjustments in defined subpopula-tions, such as children, without specific, full-powered studies85. It will be interesting to explore how such methodologies could be applied to observational post-marketing studies as well.
However, regulators, industry and payers of health care can make further contribu-tions, beyond intelligent pre-licensing trial designs and analyses, to addressing the behavioural side of the efficacy–effectiveness gap (TABLE 1).
Quality of prescribing. There has been no shortage of attempts to promote evidence-based prescribing and reduce inconsistency in everyday patient care; training pro-grammes, dedicated prescriber communi-cations from regulators and industry, and clinical practice guidelines have increasingly been developed86–88. However, many of these efforts have had a limited effect on chang-ing prescriber behaviour, and guideline adoption is variable89,90, but the impact can be substantial if appropriate measures are taken, including a focus on ownership91. The reasons for failure are multiple but include the increasingly demanding health-care environment for prescribers because of the widening choice of medicines available, expanding indications for drug treatment, greater complexity of treatment regimens and the pace of change in therapeutics; new evidence on efficacy or emerging safety signals mean that what is considered good prescribing today may not necessarily be considered so in a year’s time. Providing health-care professionals with only printed reference information, such as formularies or ‘Dear Health-Care Professional’ commu-nications, may no longer be fit for purpose. The information will not be available when needed; prescribers simply do not have the time to consult it as they make rapid ‘point of care’ decisions63. Against this background, the burgeoning field of e-healthcare offers unique opportunities to address prescribing and medication errors. Advances with the development of electronic health records, computerized physician order entry (e-pre-scribing), and decision support systems pro-vide opportunities of linking patient-specific information (for example, comorbidity and renal insufficiency) with electronic drug-specific information (for example, contrain-dications and dose-modification guidance92). Bringing these building blocks of e-health-care together can help prescribers to improve drug regimens by including patient-specific alerts, such as for contraindications, limits of recommended treatment duration or poten-tial interactions between drugs prescribed by different specialists (FIG. 4).
Pilot schemes of complete ‘computerized physician order entry’ and e-prescribing tools in outpatient care are currently being tested93,94. Furthermore, integrated but lim-ited ‘clinical computerized decision support’ applications aimed at guiding clinicians to appropriately handle drug dosing and drug interactions are now up and running95,96. However, the full statutory label information from drug regulatory bodies is not available in a logical format that can interface with
the electronic health record and decision support systems. The European Medicines Agency is exploring ways to make label information available at the time of licensing in an electronic format that can be integrated with the other building blocks of e-health-care at point of care63.
Regulators have traditionally confined themselves to providing information on the rational use of drugs — interference with everyday prescribing was not part of their role. Boundaries have somewhat changed with the establishment of RMPs (in the EU) and REMSs (in the United States). These post-marketing activities are not limited to risk assessment but may include a pro-active risk mitigation component.
A useful example is the anti-epileptic agent vigabatrin. Because of the potential for visual loss, it was approved in the United States with an REMS. One component of an REMS is “elements to assure safe use”, which function as a type of restricted distribution system. The particular elements in this case included special certification of health-care providers who prescribe vigabatrin, special certification of pharmacies that dispense vigabatrin, a requirement that vigabatrin be dispensed to patients with evidence or other documentation of safe-use conditions, and enrolment of each patient using vigabatrin in a registry. In addition to this, the drug has a dedicated implementation plan to facili-tate ongoing benefit–risk assessments; all patients receive a baseline ophthalmologic evaluation and regular vision monitoring to ensure that vigabatrin-induced vision loss is detected as early as possible, and vigaba-trin therapy is discontinued in patients who experience an inadequate clinical response5. This relatively new approach to risk mitigation initiated by regulators may be interpreted as interference with everyday practice, but it is hoped that it will contribute to a favourable benefit–risk profile in real life, reducing the efficacy–effectiveness gap.
Patient adherence. The impact of poor adherence on public health and the cost to the health-care system are well understood97. However, considerations of adherence do not figure prominently in the evaluation of pre-licensing trials, and the regulatory analytical standard, the intention-to-treat (ITT) analysis, is deliberately blind as to whether individual patients followed the treatment protocol. For some treatment scenarios (such as time consuming, mul-tiple drug inhalations for children and adolescents with cystic fibrosis)98, it may be justified to make trials adherence-informed,
P E R S P E C T I V E S
NATURE REVIEWS | DRUG DISCOVERY VOLUME 10 | JULY 2011 | 503
nrd_3501_jul11.indd 503 20/06/2011 16:34
approach to stratified medicine has changed fundamentally. In the past, retrospective identification of responder populations was sometimes a last resort for drugs that might have failed for broader populations, but now many research-based pharmaceutical companies have modified their approach to drug development and will routinely pursue pro-active diagnostic biomarker strategies, including DNA collection in all trials19,73. This evolution may also reflect a more fundamental realization by the drug devel-opment community that the blockbuster paradigm of old — the attempt to maximize the treatment-eligible population — may not be a winning strategy, and that the goal should be to optimize the treatment-eligible population. The change of mindsets is sup-ported by increasingly powerful tools for high-throughput genotyping, allowing drug developers to economically assess ever more genomic markers74.
Progress is also being made in the field of co-development of targeted drugs and their companion diagnostics. Regulators have provided reflections on the key sci-entific principles that need to be met to ensure that the performance of the chosen assay is sufficiently reliable to optimize drug development and regulatory submission67,75. Moreover, agencies have established consul-tation procedures to enable the development and qualification of biomarkers76,77.
Some adaptation of the current drug regulatory paradigm may also be called for to achieve the competing objectives of: full exploitation of biomarker strategies for opti-mization of the treatment-eligible popula-tion; balancing the need for early access by patients with a high degree of unmet need with the ethical imperative to not exclude other patients from potentially beneficial treatments; and keeping the drug develop-ment process efficient and sustainable.
An expert panel has recently proposed a strategy for the approval of targeted cancer drugs73,78. We would broaden that strategy to include drugs for non-cancer conditions and outline what may be called the ‘onion skin model of drug licensing’ (FIG. 3). In a drug development programme with a rea-sonably good a priori chance of identifying a high benefit–risk subgroup, initial drug development would focus on marker posi-tive patients. Marker-negative patients need not be included in the initial study phase. It follows that, in the first stage, the marker need not be shown to predict lack of effect in the marker-negative population. If the benefit–risk profile was deemed favour-able in marker-positive patients, an initial,
narrow license would be granted. In the next stage, the company would need to assess, as a post-marketing study, benefit–risk in the marker-negative stratum (or define the use-fulness of the test to predict lack of efficacy). If successful, the label will be broadened to include a larger treatment-eligible popula-tion. The second stage is required only if ethically acceptable, that is, in the absence of convincing arguments that patients may be unduly harmed by enrolment in these post-marketing studies. In some instances, the goal might most efficiently be achieved by way of adaptive clinical trial design78.
The concept of staggered approval — that is, prioritizing development to an enriched population of expected high-responders/high-toleraters (FIG. 3) — would mark a departure from the current practice, in some therapeutic areas, of initially studying last-line conditions such as cancer patients who have failed standard treatment. We acknowl-edge the ethical challenges, but submit that the ‘last-line first’ paradigm of enrolling patients with multiresistant (for example,
cancer) or advanced (for example, autoim-mune or degenerative) pathologies may destine to fail potentially useful first-line treatments79,80. Most likely, this form of stag-gered approval will be based on pharmaco-genomic biomarkers, but it may apply equally well to phenotypic markers.
Biomarker-guided staggered approval has the potential to reduce variability in drug response and help to address the effi-cacy–effectiveness gap, but there is a sine qua non; drug utilization will have to mirror the regulatory pathway. In the first instance, this implies that regulatory and reimbursement policies will need to be aligned as closely as possible. Regulators allow access to the market, but payers control which patient groups will be able to receive the drug. Hence, the success of novel development paradigms will require an ongoing dialogue between the regulatory and payers’ commu-nities in a given jurisdiction. In the second instance, alignment of the other actors in the medication use system will be required, as discussed below.
Figure 3 | The onion skin model of drug licensing. This approach to drug development and licensing focuses initially on the patient strata with the best expected benefit–risk profile instead of the sometimes practiced ‘last-line first’ strategy. The gains from this initially limited focus are smaller clinical trials and faster access for those patients who are expected to benefit most. The enriched patient sample is selected by way of a (genotypic or phenotypic) biomarker. Biomarker-negative patients need not be included in the initial study phase. If the benefit–risk profile was deemed favourable in marker-positive patients, an initial, narrow license would be granted. In the next stage, the company would need to assess, as a post-marketing commitment, benefit–risk in the marker-negative strata. If successful, the label will be broadened to include a larger treatment-eligible population. A drawback of this regulatory pathway is that the positive and negative predictive values of the biomarker cannot be estimated during the initial phases of the development and licensing process; the approach would most likely be justified and useful for drugs that have the potential to address a high level of unmet medical need.
P E R S P E C T I V E S
502 | JULY 2011 | VOLUME 10 www.nature.com/reviews/drugdisc
nrd_3501_jul11.indd 502 20/06/2011 16:34
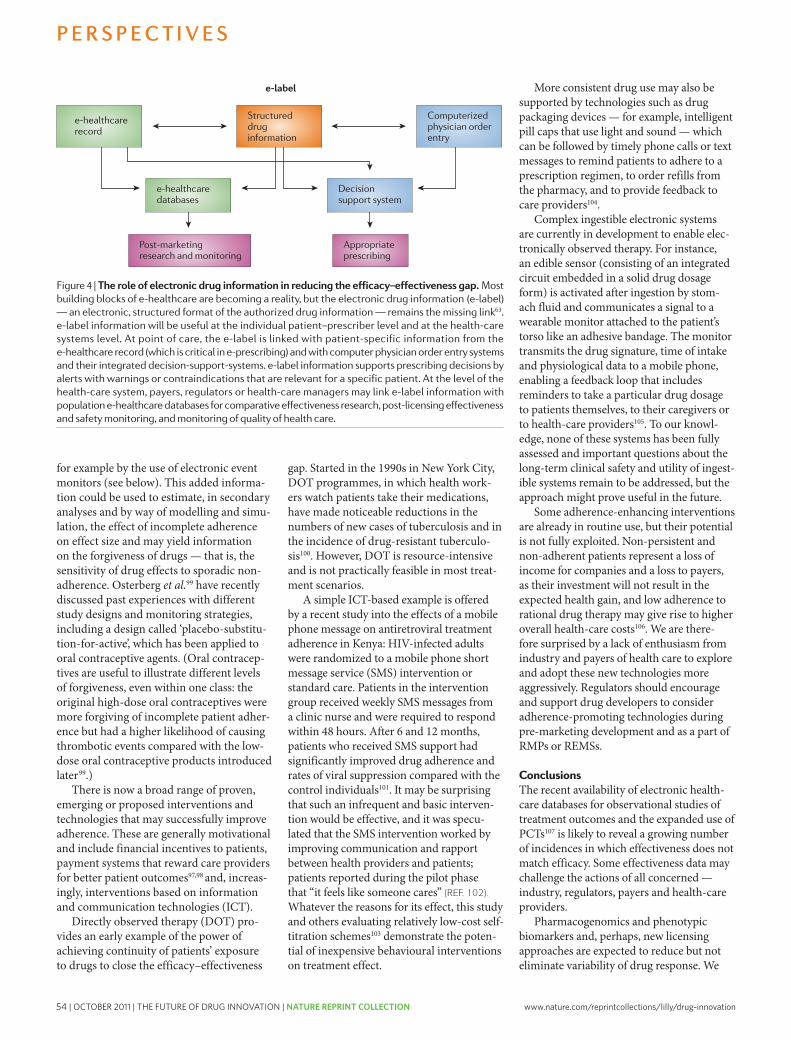
54 | OCTOBER 2011 | THE FUTURE OF DRUG INNOVATION | NATURE REPRINT COLLECTION www.nature.com/reprintcollections/lilly/drug-innovation
have discussed the nonlinear interaction of different sources of variability. It follows that even large reductions in variance from a single source may have counter-intuitively small effects in reducing the overall variance in drug response46. A more holistic effort will therefore be required from all players to tackle the efficacy–effectiveness gap.
Considering the time and cost of bringing new drugs to market, it seems that attempts to improve drug effectiveness in real life repre-sent good value for money; this is a space with low-hanging fruits that might substantially improve public health. Revisiting Sir William Osler’s observation, when this potential is realized, “medicine might [indeed become] a science and not an art”.
Hans-Georg Eichler, Eric Abadie, Bruno Flamion, Hubert Leufkens, Christian K. Schneider and Brigitte
Bloechl-Daum are at the European Medicines Agency, London, UK.
Hans-Georg Eichler is also at the Massachusetts Institute of Technology, Cambridge, Massachusetts, USA.
Eric Abadie is also at the European Medicines Agency Committee for Medicinal Products for Human Use,
London, UK; and the General Directorate Agence Francaise de Securite Sanitaire des Produits de Santé
(AFSSAPS), Paris, France.
Alasdair Breckenridge is at the Medicines and Healthcare Products Regulatory Agency, London, UK.
Bruno Flamion is also at the Agence Fédérale des Médicaments et des Produits de Santé, Brussels,
Belgium.
Lars L. Gustafsson is at the Division of Clinical Pharmacology, Department of Laboratory Medicine,
Karolinska Institutet, Stockholm, Sweden.
Hubert Leufkens is also at the Utrecht Institute for Pharmaceutical Sciences (UIPS), Utrecht,
The Netherlands.
Malcolm Rowland is at the Centre for Applied Pharmacokinetic Research, School of Pharmacy and Pharmaceutical Sciences, University of Manchester,
Manchester, UK.
Christian K. Schneider is also at the Paul-Ehrlich-Institut, Langen, Germany; and the Twincore Centre for Experimental and Clinical Infection Research,
Hannover, Germany.
Brigitte Bloechl-Daum is also at the Department of Clinical Pharmacology, Medical University Vienna,
Vienna, Austria.
Correspondence to B.B.-D. e-mail: [email protected]
doi: 10.1038/nrd3501
Disclaimer: The views expressed in this article are the personal views of the authors and may not be
understood or quoted as being made on behalf of or reflecting the position of the regulatory agencies,
health technology assessment bodies or other organizations that the authors work for.
1. Danish Medicines Agency. Conclusions and recommendations from the Pharmaceutical Forum. Danish Medicines Agency [online], http://www.dkma.dk/1024/visUKLSArtikel.asp?artikelID=17481 (2010).
2. Luce, B. R. et al. EBM, HTA, and CER: clearing the confusion. Millbank Q. 88, 256–276 (2010).
3. European Medicines Agency. European Medicines Agency recommends measures to manage contamination of heparin-containing medicines. European Medicines Agency [online], http://www.ema.europa.eu/ema/index.jsp?curl=pages/news_and_events/news/2009/11/news_detail_000315.jsp&murl=menus/news_and_events/news_and_events.jsp&mid=WC0b01ac058004d5c1&jsenabled=true (2008).
4. European Medicines Agency. Studies assessed by the EMEA indicate no increased risk of developing cancer for patients who have taken Viracept contaminated with ethyl mesilate. European Medicines Agency [online]. http://www.ema.europa.eu/ema/index.jsp?curl=pages/news_and_events/news/2009/11/news_detail_000292.jsp&murl=menus/news_and_events/news_and_events.jsp&mid=WC0b01ac058004d5c1 (2008).
5. Dal Pan, G. J., Blackburn, S. & Karwoski, C. in Textbook of Pharmacoepidemiology (eds Strom, B. L. & Kimmel, S. E.) (John Wiley & Sons, New Jersey), (in the press).
6. Pocock, S. J. & Lubsen, J. More on subgroup analyses in clinical trials. N. Engl. J. Med. 358, 2076 (2008).
7. Ingelman-Sundberg, M. Pharmacogenetics: an opportunity for a safer and more efficient pharmacotherapy. J. Intern. Med. 250, 186–200 (2001).
8. Roses, A. D. Pharmacogenetics in drug discovery and development: a translational perspective. Nature Rev. Drug Discov. 7, 807–817 (2008).
9. Pharoa, P. D. & Hollingworth, W. Cost effectiveness of lowering cholesterol concentration with statins in patients with and without pre-existing coronary heart disease: life table method applied to health authority population. BMJ 312, 1443–1448 (1996).
10. Poole, S. G. & Dooley, M. J. Off-label prescribing in oncology. Support Care Cancer 12, 302–305 (2004).
11. Hsien, L. et al. Off-label drug use among hospitalised children: identifying areas with the highest need for research. Pharm. World Sci. 30, 497–502 (2008).
12. [No authors listed.] Guidance for off-label use of drugs. Lancet Neurol. 7, 285 (2008).
13. Schosser, R. Risk/benefit evaluation of drugs: the role of the pharmaceutical industry in Germany. Eur. Surg. Res. 34, 203–207 (2008).
14. Friedman, M. A. et al. The safety of newly approved medicines: do recent market removals mean there is a problem? JAMA 281, 1728–1734 (1999).
15. [No authors listed.] How a statin might destroy a drug company. Lancet 361, 793 (2003).
16. European Medicines Agency. EPAR Avandia. European Medicines Agency [online], http://www.ema.europa.eu/docs/en_GB/document_library/EPAR_-_Assessment_Report_-_Variation/human/000666/WC500021280.pdf (2009).
17. Forslund, T. et al. Usage, risk and benefit of weight-loss drugs in primary care. Journal of Obesity [online], http://downloads.mts.hindawi.com/MTS-Files/JOBES/papers/regular/459263.v2.pdf?AWSAccessKeyId=0CX53QQSTHRYZZQRKA02&Expires=1305781317&Signature=hAU9a2Tn5%2BKIOsuXtCdGERM0iqA%3D (2010).
18. Center for Medical Technology Policy. Effectiveness Guidance Document: Pragmatic Phase 3 Pharmaceutical Trials. Release Date: September 14, 2010. Center for Medical Technology Policy [online], http://www.cmtpnet.org/cmtp-research/guidance-documents/pragmatic-clinical-trials/PCT3EGD.pdf (2010).
19. Petak, I. et al. Integrating molecular diagnostics into anticancer drug discovery. Nature Rev. Drug Discov. 9, 523–535 (2010).
20. Heerdink, E. R., Urquhart, J. & Leufkens, H. G. Changes in prescribed doses after market introduction. Pharmacoepidemiol. Drug Saf. 11, 447–453 (2002).
21. Cross, J. et al. Postmarketing drug dosage changes of 499 FDA-approved new molecular entities, 1980–1999. Pharmacoepidemiol. Drug Saf. 11, 439–446 (2002).
22. Trusheim, M. R. et al. Stratified medicine: strategic and economic implications of combining drugs and clinical biomarkers. Nature Rev. Drug Discov. 6, 287–293 (2007).
23. European Medicines Agency. Herceptin EPAR. European Medicines Agency [online], http://www.ema.europa.eu/docs/en_GB/document_library/EPAR_-_Product_Information/human/000278/WC500074922.pdf (Last updated 19 May 2011).
24. Barron, J. J., Cziraky, M. J., Weisman, T. & Hicks, D. G. HER2 testing and subsequent trastuzumab treatment for breast cancer in a managed care environment. Oncologist 14, 760–768 (2009).
25. European Medicines Agency. EPAR Ziagen. European Medicines Agency [online], http://www.ema.europa.eu/docs/en_GB/document_library/EPAR_-_Product_Information/human/000252/WC500050343.pdf (Last updated 18 Apr 2011).
26. Stocco, G., Crews, K. R. & Evans, W. E. Genetic polymorphism of inosine-triphosphate- pyrophosphatase influences mercaptopurine metabolism and toxicity during treatment of acute lymphoblastic leukemia individualized for thiopurine-S-methyl-transferase status. Expert Opin. Drug Saf. 9, 23–37 (2010).
27. Zaza, G., Granata, S., Sallustio, F., Grandaliano, G. & Schena, F. P. Pharmacogenomics: a new paradigm to personalize treatments in nephrology patients. Clin. Exp. Immunol.159, 268–280 (2010).
28. ICH Expert Working Group. International Conference on Harmonisation Guideline E5(R1): Ethnic Factors in the Acceptability of Foreign Clinical Data. ICH Harmonisation For Better Health [online], http://www.ich.org/fileadmin/Public_Web_Site/ICH_Products/Guidelines/Efficacy/E5_R1/Step4/E5_R1__Guideline.pdf (1998).
29. Falagas, M. E. & Karageorgopoulos, D. E. Adjustment of dosing of antimicrobial agents for bodyweight in adults. Lancet 375, 248–251 (2010).
30. Kirsch, I. et al. Initial severity and antidepressant benefits: a meta-analysis of data submitted to the Food and Drug Administration. PLoS Med. 5, 260–268 (2008).
31. van Staa, T.-P., Leufkens, H. G., Zhang, B. & Smeeth, L. A comparison of cost effectiveness using data from randomized trials or actual clinical practice: selective Cox-2 inhibitors as an example. PLoS Med. 6, e1000194 (2009).
32. Greenblatt, D. J. Analysis of drug interactions involving fruit beverages and organic anion-transporting polypeptides. J. Clin. Pharmacol. 49, 1403–1407 (2009).
33. Bailey, D. G. Fruit juice inhibition of uptake transport: a new type of food–drug interaction. Br. J. Clin. Pharmacol. 70, 645–655 (2010).
34. Klaasen, R., Wijbrandts, C. A., Gerlag, D. M. & Tak, P. P. Body mass index and clinical response to infliximab in rheumatoid arthritis. Arthritis Rheum. 63, 359–364 (2011).
35. US Government Accountability Office: Report to the Ranking Member, Committee on Finance, US Senate. Prescription drugs: FDA’s oversight of the promotion of drugs for off-label uses; July 2008. US Government Accountability Office [online], http://www.gao.gov/new.items/d08835.pdf (2008).
36. Radley. D.C., Finkelstein, S.N. & Stafford, R. S. Off-label prescribing among office-based physicians. Arch. Intern. Med. 166,1021–1026 (2006).
37. Jonville-Béra, A. P., Béra, F. & Autret-Lecaq, E. Are incorrectly used drugs more frequently involved in adverse drug reactions? A retrospective study. Eur. J. Clin. Pharmacol. 61, 231–236 (2005).
38. Cereza, G., Pedros, C., Garcia, N. & Laporte, J. R. Topiramate in non-approved indications and acute myopia or angle-closure glaucoma. Br. J. Clin. Pharmacol. 60, 578–579 (2005).
39. Kohn, L. T., Corrigan, J. M., & Donaldson, M. S. (eds) To Err is Human: Building a Safer Health System (National Academy Press, Washington DC, 2000).
40. Bonaccorso, S. & Sturchio, J. L. Perspectives from the pharmaceutical industry. BMJ 327, 863–864 (2003).
41. WHO. Adherence to long-term therapies: evidence for action. World Health Organization [online], http://apps.who.int/medicinedocs/en/d/Js4883e/ (2003).
42. Urquhart, J. The odds of the three nons when an aptly prescribed medicine isn’t working: non-compliance, non-absorption, non-response. Br. J. Clin. Pharmacol. 54, 212–220 (2002).
43. Horwitz, R. I. et al. Treatment adherence and risk of death after a myocardial infarction. Lancet 336, 542–545 (1990).
44. Cramer, J. A, Benedict, Á, Muszbek, N., Keskinaslan, A. & Khan, Z. M. The significance of compliance and persistence in the treatment of diabetes, hypertension and dyslipidaemia: a review. Int. J. Clin. Pract. 62, 76–87 (2008).
45. Vrijens, B., Gross, R. & Urquhart, J. The odds that clinically unrecognised poor or partial adherence confuses population pharmacokinetic/
P E R S P E C T I V E S
NATURE REVIEWS | DRUG DISCOVERY VOLUME 10 | JULY 2011 | 505
nrd_3501_jul11.indd 505 20/06/2011 16:34
for example by the use of electronic event monitors (see below). This added informa-tion could be used to estimate, in secondary analyses and by way of modelling and simu-lation, the effect of incomplete adherence on effect size and may yield information on the forgiveness of drugs — that is, the sensitivity of drug effects to sporadic non-adherence. Osterberg et al.99 have recently discussed past experiences with different study designs and monitoring strategies, including a design called ‘placebo-substitu-tion-for-active’, which has been applied to oral contraceptive agents. (Oral contracep-tives are useful to illustrate different levels of forgiveness, even within one class: the original high-dose oral contraceptives were more forgiving of incomplete patient adher-ence but had a higher likelihood of causing thrombotic events compared with the low-dose oral contraceptive products introduced later99.)
There is now a broad range of proven, emerging or proposed interventions and technologies that may successfully improve adherence. These are generally motivational and include financial incentives to patients, payment systems that reward care providers for better patient outcomes97,98 and, increas-ingly, interventions based on information and communication technologies (ICT).
Directly observed therapy (DOT) pro-vides an early example of the power of achieving continuity of patients’ exposure to drugs to close the efficacy–effectiveness
gap. Started in the 1990s in New York City, DOT programmes, in which health work-ers watch patients take their medications, have made noticeable reductions in the numbers of new cases of tuberculosis and in the incidence of drug-resistant tuberculo-sis100. However, DOT is resource-intensive and is not practically feasible in most treat-ment scenarios.
A simple ICT-based example is offered by a recent study into the effects of a mobile phone message on antiretroviral treatment adherence in Kenya: HIV-infected adults were randomized to a mobile phone short message service (SMS) intervention or standard care. Patients in the intervention group received weekly SMS messages from a clinic nurse and were required to respond within 48 hours. After 6 and 12 months, patients who received SMS support had significantly improved drug adherence and rates of viral suppression compared with the control individuals101. It may be surprising that such an infrequent and basic interven-tion would be effective, and it was specu-lated that the SMS intervention worked by improving communication and rapport between health providers and patients; patients reported during the pilot phase that “it feels like someone cares” (REF. 102). Whatever the reasons for its effect, this study and others evaluating relatively low-cost self-titration schemes103 demonstrate the poten-tial of inexpensive behavioural interventions on treatment effect.
More consistent drug use may also be supported by technologies such as drug packaging devices — for example, intelligent pill caps that use light and sound — which can be followed by timely phone calls or text messages to remind patients to adhere to a prescription regimen, to order refills from the pharmacy, and to provide feedback to care providers104.
Complex ingestible electronic systems are currently in development to enable elec-tronically observed therapy. For instance, an edible sensor (consisting of an integrated circuit embedded in a solid drug dosage form) is activated after ingestion by stom-ach fluid and communicates a signal to a wearable monitor attached to the patient’s torso like an adhesive bandage. The monitor transmits the drug signature, time of intake and physiological data to a mobile phone, enabling a feedback loop that includes reminders to take a particular drug dosage to patients themselves, to their caregivers or to health-care providers105. To our knowl-edge, none of these systems has been fully assessed and important questions about the long-term clinical safety and utility of ingest-ible systems remain to be addressed, but the approach might prove useful in the future.
Some adherence-enhancing interventions are already in routine use, but their potential is not fully exploited. Non-persistent and non-adherent patients represent a loss of income for companies and a loss to payers, as their investment will not result in the expected health gain, and low adherence to rational drug therapy may give rise to higher overall health-care costs106. We are there-fore surprised by a lack of enthusiasm from industry and payers of health care to explore and adopt these new technologies more aggressively. Regulators should encourage and support drug developers to consider adherence-promoting technologies during pre-marketing development and as a part of RMPs or REMSs.
ConclusionsThe recent availability of electronic health-care databases for observational studies of treatment outcomes and the expanded use of PCTs107 is likely to reveal a growing number of incidences in which effectiveness does not match efficacy. Some effectiveness data may challenge the actions of all concerned — industry, regulators, payers and health-care providers.
Pharmacogenomics and phenotypic biomarkers and, perhaps, new licensing approaches are expected to reduce but not eliminate variability of drug response. We
Figure 4 | The role of electronic drug information in reducing the efficacy–effectiveness gap. Most building blocks of e-healthcare are becoming a reality, but the electronic drug information (e-label) — an electronic, structured format of the authorized drug information — remains the missing link63. e-label information will be useful at the individual patient–prescriber level and at the health-care systems level. At point of care, the e-label is linked with patient-specific information from the e-healthcare record (which is critical in e-prescribing) and with computer physician order entry systems and their integrated decision-support-systems. e-label information supports prescribing decisions by alerts with warnings or contraindications that are relevant for a specific patient. At the level of the health-care system, payers, regulators or health-care managers may link e-label information with population e-healthcare databases for comparative effectiveness research, post-licensing effectiveness and safety monitoring, and monitoring of quality of health care.
P E R S P E C T I V E S
504 | JULY 2011 | VOLUME 10 www.nature.com/reviews/drugdisc
nrd_3501_jul11.indd 504 20/06/2011 16:34

www.nature.com/reprintcollections/lilly/drug-innovation NATURE REPRINT COLLECTION | THE FUTURE OF DRUG INNOVATION | OCTOBER 2011 | 55
have discussed the nonlinear interaction of different sources of variability. It follows that even large reductions in variance from a single source may have counter-intuitively small effects in reducing the overall variance in drug response46. A more holistic effort will therefore be required from all players to tackle the efficacy–effectiveness gap.
Considering the time and cost of bringing new drugs to market, it seems that attempts to improve drug effectiveness in real life repre-sent good value for money; this is a space with low-hanging fruits that might substantially improve public health. Revisiting Sir William Osler’s observation, when this potential is realized, “medicine might [indeed become] a science and not an art”.
Hans-Georg Eichler, Eric Abadie, Bruno Flamion, Hubert Leufkens, Christian K. Schneider and Brigitte
Bloechl-Daum are at the European Medicines Agency, London, UK.
Hans-Georg Eichler is also at the Massachusetts Institute of Technology, Cambridge, Massachusetts, USA.
Eric Abadie is also at the European Medicines Agency Committee for Medicinal Products for Human Use,
London, UK; and the General Directorate Agence Francaise de Securite Sanitaire des Produits de Santé
(AFSSAPS), Paris, France.
Alasdair Breckenridge is at the Medicines and Healthcare Products Regulatory Agency, London, UK.
Bruno Flamion is also at the Agence Fédérale des Médicaments et des Produits de Santé, Brussels,
Belgium.
Lars L. Gustafsson is at the Division of Clinical Pharmacology, Department of Laboratory Medicine,
Karolinska Institutet, Stockholm, Sweden.
Hubert Leufkens is also at the Utrecht Institute for Pharmaceutical Sciences (UIPS), Utrecht,
The Netherlands.
Malcolm Rowland is at the Centre for Applied Pharmacokinetic Research, School of Pharmacy and Pharmaceutical Sciences, University of Manchester,
Manchester, UK.
Christian K. Schneider is also at the Paul-Ehrlich-Institut, Langen, Germany; and the Twincore Centre for Experimental and Clinical Infection Research,
Hannover, Germany.
Brigitte Bloechl-Daum is also at the Department of Clinical Pharmacology, Medical University Vienna,
Vienna, Austria.
Correspondence to B.B.-D. e-mail: [email protected]
doi: 10.1038/nrd3501
Disclaimer: The views expressed in this article are the personal views of the authors and may not be
understood or quoted as being made on behalf of or reflecting the position of the regulatory agencies,
health technology assessment bodies or other organizations that the authors work for.
1. Danish Medicines Agency. Conclusions and recommendations from the Pharmaceutical Forum. Danish Medicines Agency [online], http://www.dkma.dk/1024/visUKLSArtikel.asp?artikelID=17481 (2010).
2. Luce, B. R. et al. EBM, HTA, and CER: clearing the confusion. Millbank Q. 88, 256–276 (2010).
3. European Medicines Agency. European Medicines Agency recommends measures to manage contamination of heparin-containing medicines. European Medicines Agency [online], http://www.ema.europa.eu/ema/index.jsp?curl=pages/news_and_events/news/2009/11/news_detail_000315.jsp&murl=menus/news_and_events/news_and_events.jsp&mid=WC0b01ac058004d5c1&jsenabled=true (2008).
4. European Medicines Agency. Studies assessed by the EMEA indicate no increased risk of developing cancer for patients who have taken Viracept contaminated with ethyl mesilate. European Medicines Agency [online]. http://www.ema.europa.eu/ema/index.jsp?curl=pages/news_and_events/news/2009/11/news_detail_000292.jsp&murl=menus/news_and_events/news_and_events.jsp&mid=WC0b01ac058004d5c1 (2008).
5. Dal Pan, G. J., Blackburn, S. & Karwoski, C. in Textbook of Pharmacoepidemiology (eds Strom, B. L. & Kimmel, S. E.) (John Wiley & Sons, New Jersey), (in the press).
6. Pocock, S. J. & Lubsen, J. More on subgroup analyses in clinical trials. N. Engl. J. Med. 358, 2076 (2008).
7. Ingelman-Sundberg, M. Pharmacogenetics: an opportunity for a safer and more efficient pharmacotherapy. J. Intern. Med. 250, 186–200 (2001).
8. Roses, A. D. Pharmacogenetics in drug discovery and development: a translational perspective. Nature Rev. Drug Discov. 7, 807–817 (2008).
9. Pharoa, P. D. & Hollingworth, W. Cost effectiveness of lowering cholesterol concentration with statins in patients with and without pre-existing coronary heart disease: life table method applied to health authority population. BMJ 312, 1443–1448 (1996).
10. Poole, S. G. & Dooley, M. J. Off-label prescribing in oncology. Support Care Cancer 12, 302–305 (2004).
11. Hsien, L. et al. Off-label drug use among hospitalised children: identifying areas with the highest need for research. Pharm. World Sci. 30, 497–502 (2008).
12. [No authors listed.] Guidance for off-label use of drugs. Lancet Neurol. 7, 285 (2008).
13. Schosser, R. Risk/benefit evaluation of drugs: the role of the pharmaceutical industry in Germany. Eur. Surg. Res. 34, 203–207 (2008).
14. Friedman, M. A. et al. The safety of newly approved medicines: do recent market removals mean there is a problem? JAMA 281, 1728–1734 (1999).
15. [No authors listed.] How a statin might destroy a drug company. Lancet 361, 793 (2003).
16. European Medicines Agency. EPAR Avandia. European Medicines Agency [online], http://www.ema.europa.eu/docs/en_GB/document_library/EPAR_-_Assessment_Report_-_Variation/human/000666/WC500021280.pdf (2009).
17. Forslund, T. et al. Usage, risk and benefit of weight-loss drugs in primary care. Journal of Obesity [online], http://downloads.mts.hindawi.com/MTS-Files/JOBES/papers/regular/459263.v2.pdf?AWSAccessKeyId=0CX53QQSTHRYZZQRKA02&Expires=1305781317&Signature=hAU9a2Tn5%2BKIOsuXtCdGERM0iqA%3D (2010).
18. Center for Medical Technology Policy. Effectiveness Guidance Document: Pragmatic Phase 3 Pharmaceutical Trials. Release Date: September 14, 2010. Center for Medical Technology Policy [online], http://www.cmtpnet.org/cmtp-research/guidance-documents/pragmatic-clinical-trials/PCT3EGD.pdf (2010).
19. Petak, I. et al. Integrating molecular diagnostics into anticancer drug discovery. Nature Rev. Drug Discov. 9, 523–535 (2010).
20. Heerdink, E. R., Urquhart, J. & Leufkens, H. G. Changes in prescribed doses after market introduction. Pharmacoepidemiol. Drug Saf. 11, 447–453 (2002).
21. Cross, J. et al. Postmarketing drug dosage changes of 499 FDA-approved new molecular entities, 1980–1999. Pharmacoepidemiol. Drug Saf. 11, 439–446 (2002).
22. Trusheim, M. R. et al. Stratified medicine: strategic and economic implications of combining drugs and clinical biomarkers. Nature Rev. Drug Discov. 6, 287–293 (2007).
23. European Medicines Agency. Herceptin EPAR. European Medicines Agency [online], http://www.ema.europa.eu/docs/en_GB/document_library/EPAR_-_Product_Information/human/000278/WC500074922.pdf (Last updated 19 May 2011).
24. Barron, J. J., Cziraky, M. J., Weisman, T. & Hicks, D. G. HER2 testing and subsequent trastuzumab treatment for breast cancer in a managed care environment. Oncologist 14, 760–768 (2009).
25. European Medicines Agency. EPAR Ziagen. European Medicines Agency [online], http://www.ema.europa.eu/docs/en_GB/document_library/EPAR_-_Product_Information/human/000252/WC500050343.pdf (Last updated 18 Apr 2011).
26. Stocco, G., Crews, K. R. & Evans, W. E. Genetic polymorphism of inosine-triphosphate- pyrophosphatase influences mercaptopurine metabolism and toxicity during treatment of acute lymphoblastic leukemia individualized for thiopurine-S-methyl-transferase status. Expert Opin. Drug Saf. 9, 23–37 (2010).
27. Zaza, G., Granata, S., Sallustio, F., Grandaliano, G. & Schena, F. P. Pharmacogenomics: a new paradigm to personalize treatments in nephrology patients. Clin. Exp. Immunol.159, 268–280 (2010).
28. ICH Expert Working Group. International Conference on Harmonisation Guideline E5(R1): Ethnic Factors in the Acceptability of Foreign Clinical Data. ICH Harmonisation For Better Health [online], http://www.ich.org/fileadmin/Public_Web_Site/ICH_Products/Guidelines/Efficacy/E5_R1/Step4/E5_R1__Guideline.pdf (1998).
29. Falagas, M. E. & Karageorgopoulos, D. E. Adjustment of dosing of antimicrobial agents for bodyweight in adults. Lancet 375, 248–251 (2010).
30. Kirsch, I. et al. Initial severity and antidepressant benefits: a meta-analysis of data submitted to the Food and Drug Administration. PLoS Med. 5, 260–268 (2008).
31. van Staa, T.-P., Leufkens, H. G., Zhang, B. & Smeeth, L. A comparison of cost effectiveness using data from randomized trials or actual clinical practice: selective Cox-2 inhibitors as an example. PLoS Med. 6, e1000194 (2009).
32. Greenblatt, D. J. Analysis of drug interactions involving fruit beverages and organic anion-transporting polypeptides. J. Clin. Pharmacol. 49, 1403–1407 (2009).
33. Bailey, D. G. Fruit juice inhibition of uptake transport: a new type of food–drug interaction. Br. J. Clin. Pharmacol. 70, 645–655 (2010).
34. Klaasen, R., Wijbrandts, C. A., Gerlag, D. M. & Tak, P. P. Body mass index and clinical response to infliximab in rheumatoid arthritis. Arthritis Rheum. 63, 359–364 (2011).
35. US Government Accountability Office: Report to the Ranking Member, Committee on Finance, US Senate. Prescription drugs: FDA’s oversight of the promotion of drugs for off-label uses; July 2008. US Government Accountability Office [online], http://www.gao.gov/new.items/d08835.pdf (2008).
36. Radley. D.C., Finkelstein, S.N. & Stafford, R. S. Off-label prescribing among office-based physicians. Arch. Intern. Med. 166,1021–1026 (2006).
37. Jonville-Béra, A. P., Béra, F. & Autret-Lecaq, E. Are incorrectly used drugs more frequently involved in adverse drug reactions? A retrospective study. Eur. J. Clin. Pharmacol. 61, 231–236 (2005).
38. Cereza, G., Pedros, C., Garcia, N. & Laporte, J. R. Topiramate in non-approved indications and acute myopia or angle-closure glaucoma. Br. J. Clin. Pharmacol. 60, 578–579 (2005).
39. Kohn, L. T., Corrigan, J. M., & Donaldson, M. S. (eds) To Err is Human: Building a Safer Health System (National Academy Press, Washington DC, 2000).
40. Bonaccorso, S. & Sturchio, J. L. Perspectives from the pharmaceutical industry. BMJ 327, 863–864 (2003).
41. WHO. Adherence to long-term therapies: evidence for action. World Health Organization [online], http://apps.who.int/medicinedocs/en/d/Js4883e/ (2003).
42. Urquhart, J. The odds of the three nons when an aptly prescribed medicine isn’t working: non-compliance, non-absorption, non-response. Br. J. Clin. Pharmacol. 54, 212–220 (2002).
43. Horwitz, R. I. et al. Treatment adherence and risk of death after a myocardial infarction. Lancet 336, 542–545 (1990).
44. Cramer, J. A, Benedict, Á, Muszbek, N., Keskinaslan, A. & Khan, Z. M. The significance of compliance and persistence in the treatment of diabetes, hypertension and dyslipidaemia: a review. Int. J. Clin. Pract. 62, 76–87 (2008).
45. Vrijens, B., Gross, R. & Urquhart, J. The odds that clinically unrecognised poor or partial adherence confuses population pharmacokinetic/
P E R S P E C T I V E S
NATURE REVIEWS | DRUG DISCOVERY VOLUME 10 | JULY 2011 | 505
nrd_3501_jul11.indd 505 20/06/2011 16:34
for example by the use of electronic event monitors (see below). This added informa-tion could be used to estimate, in secondary analyses and by way of modelling and simu-lation, the effect of incomplete adherence on effect size and may yield information on the forgiveness of drugs — that is, the sensitivity of drug effects to sporadic non-adherence. Osterberg et al.99 have recently discussed past experiences with different study designs and monitoring strategies, including a design called ‘placebo-substitu-tion-for-active’, which has been applied to oral contraceptive agents. (Oral contracep-tives are useful to illustrate different levels of forgiveness, even within one class: the original high-dose oral contraceptives were more forgiving of incomplete patient adher-ence but had a higher likelihood of causing thrombotic events compared with the low-dose oral contraceptive products introduced later99.)
There is now a broad range of proven, emerging or proposed interventions and technologies that may successfully improve adherence. These are generally motivational and include financial incentives to patients, payment systems that reward care providers for better patient outcomes97,98 and, increas-ingly, interventions based on information and communication technologies (ICT).
Directly observed therapy (DOT) pro-vides an early example of the power of achieving continuity of patients’ exposure to drugs to close the efficacy–effectiveness
gap. Started in the 1990s in New York City, DOT programmes, in which health work-ers watch patients take their medications, have made noticeable reductions in the numbers of new cases of tuberculosis and in the incidence of drug-resistant tuberculo-sis100. However, DOT is resource-intensive and is not practically feasible in most treat-ment scenarios.
A simple ICT-based example is offered by a recent study into the effects of a mobile phone message on antiretroviral treatment adherence in Kenya: HIV-infected adults were randomized to a mobile phone short message service (SMS) intervention or standard care. Patients in the intervention group received weekly SMS messages from a clinic nurse and were required to respond within 48 hours. After 6 and 12 months, patients who received SMS support had significantly improved drug adherence and rates of viral suppression compared with the control individuals101. It may be surprising that such an infrequent and basic interven-tion would be effective, and it was specu-lated that the SMS intervention worked by improving communication and rapport between health providers and patients; patients reported during the pilot phase that “it feels like someone cares” (REF. 102). Whatever the reasons for its effect, this study and others evaluating relatively low-cost self-titration schemes103 demonstrate the poten-tial of inexpensive behavioural interventions on treatment effect.
More consistent drug use may also be supported by technologies such as drug packaging devices — for example, intelligent pill caps that use light and sound — which can be followed by timely phone calls or text messages to remind patients to adhere to a prescription regimen, to order refills from the pharmacy, and to provide feedback to care providers104.
Complex ingestible electronic systems are currently in development to enable elec-tronically observed therapy. For instance, an edible sensor (consisting of an integrated circuit embedded in a solid drug dosage form) is activated after ingestion by stom-ach fluid and communicates a signal to a wearable monitor attached to the patient’s torso like an adhesive bandage. The monitor transmits the drug signature, time of intake and physiological data to a mobile phone, enabling a feedback loop that includes reminders to take a particular drug dosage to patients themselves, to their caregivers or to health-care providers105. To our knowl-edge, none of these systems has been fully assessed and important questions about the long-term clinical safety and utility of ingest-ible systems remain to be addressed, but the approach might prove useful in the future.
Some adherence-enhancing interventions are already in routine use, but their potential is not fully exploited. Non-persistent and non-adherent patients represent a loss of income for companies and a loss to payers, as their investment will not result in the expected health gain, and low adherence to rational drug therapy may give rise to higher overall health-care costs106. We are there-fore surprised by a lack of enthusiasm from industry and payers of health care to explore and adopt these new technologies more aggressively. Regulators should encourage and support drug developers to consider adherence-promoting technologies during pre-marketing development and as a part of RMPs or REMSs.
ConclusionsThe recent availability of electronic health-care databases for observational studies of treatment outcomes and the expanded use of PCTs107 is likely to reveal a growing number of incidences in which effectiveness does not match efficacy. Some effectiveness data may challenge the actions of all concerned — industry, regulators, payers and health-care providers.
Pharmacogenomics and phenotypic biomarkers and, perhaps, new licensing approaches are expected to reduce but not eliminate variability of drug response. We
Figure 4 | The role of electronic drug information in reducing the efficacy–effectiveness gap. Most building blocks of e-healthcare are becoming a reality, but the electronic drug information (e-label) — an electronic, structured format of the authorized drug information — remains the missing link63. e-label information will be useful at the individual patient–prescriber level and at the health-care systems level. At point of care, the e-label is linked with patient-specific information from the e-healthcare record (which is critical in e-prescribing) and with computer physician order entry systems and their integrated decision-support-systems. e-label information supports prescribing decisions by alerts with warnings or contraindications that are relevant for a specific patient. At the level of the health-care system, payers, regulators or health-care managers may link e-label information with population e-healthcare databases for comparative effectiveness research, post-licensing effectiveness and safety monitoring, and monitoring of quality of health care.
P E R S P E C T I V E S
504 | JULY 2011 | VOLUME 10 www.nature.com/reviews/drugdisc
nrd_3501_jul11.indd 504 20/06/2011 16:34
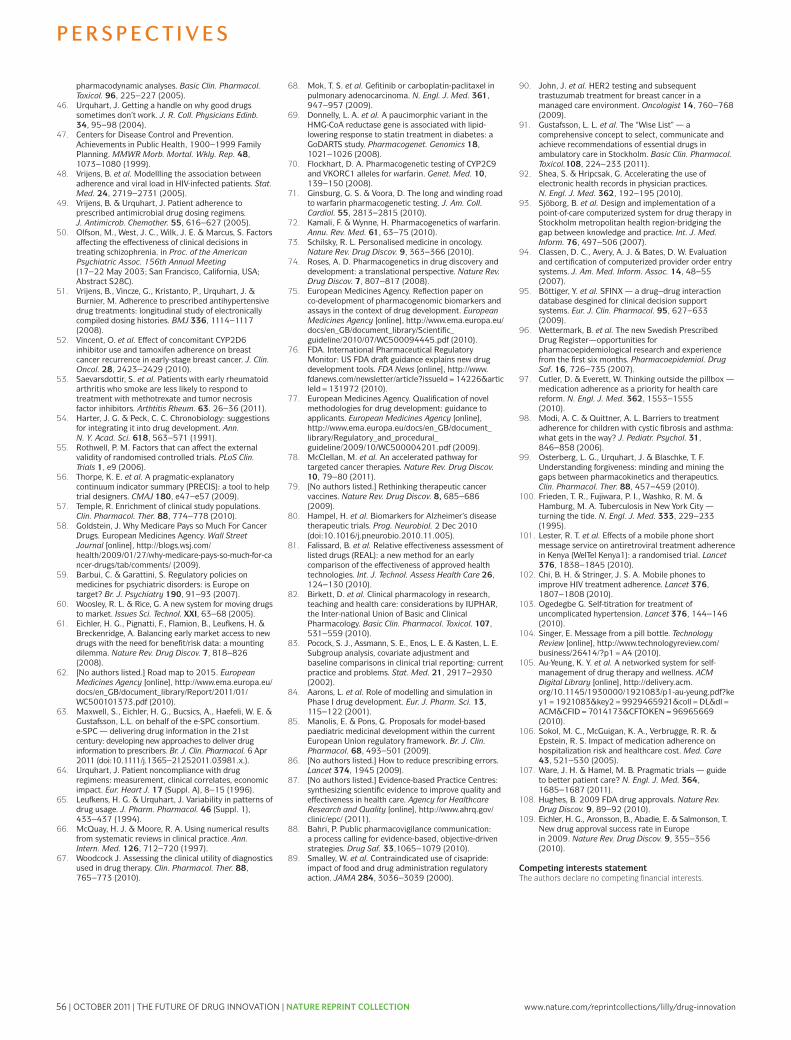
56 | OCTOBER 2011 | THE FUTURE OF DRUG INNOVATION | NATURE REPRINT COLLECTION www.nature.com/reprintcollections/lilly/drug-innovation
35
30
25
20
15
10
5
02004 2006 2007 2008 2009 20102003 2005
applications (NDAs) and investigational new drug applications (INDs) were approved in China between 2003 and 2010. The novel pharmaceuticals discussed in this article only include chemical drugs in classes 1.1 and 1.2 and biological drugs in class 1, which are defined by the SFDA as not being previously approved for marketing as a drug anywhere else in the world. Thus, the scope of novel drugs in this article is narrower than that of the new chemical entities (NCEs) used by the US Food and Drug Administration (FDA). For example, if a drug was first approved by the FDA or the European Medicines Agency, it would not be qualified as a class 1 new drug by the SFDA when its approval is later sought in China. Multinational pharmaceutical companies usually market their drugs in developed countries first, and in our survey, all the innovative drugs approved as class 1 by the SFDA are from domestic Chinese pharmaceutical companies. Consequently, the class 1 approvals by the SFDA reflect the status of innovative drug development solely in domestic Chinese pharmaceutical companies. Additionally, traditional Chinese medicine and vaccines are not discussed here.
AnalysisIn the period analysed, ~25 drug candidates were approved for entry into clinical trials (that is, an IND was granted) and an average of four drugs were approved for marketing per year (FIG. 1). However, there was a significant reduction in the number of drugs approved for marketing since 2006, with less than two approvals per year in comparison with the preceding years that ended with 11 approvals in 2005. This is primarily due to the introduction by the SFDA in 2007 of much more stringent rules and regulations regarding new drug approval and registration.
A total of 187 novel therapeutics are currently in clinical trials. Nearly two-thirds of the therapeutics are in Phase I trials, with those in Phase II and III trials accounting for 19% and 22%, respectively (FIG. 2a). As shown in FIG. 2b, oncology is the most common therapeutic area (32% of therapeutics analysed), followed by infectious diseases (17%) and cardiovascular diseases (10%).
With a population of 1.3 billion people and a rapidly expanding economy, China has recently risen to become the third largest pharmaceutical market globally, and it has been predicted that this market will grow by 25–27% to a value of more than US$50 billion in 2011 (REF. 1). Although many of the drugs in the current market are either generic versions or developed outside China, several multinational pharmaceutical companies have now located research and development (R&D) centres in China, and Chinese pharmaceutical companies are increasingly focusing on innovative drug R&D. Furthermore, the Chinese government implemented a special drug R&D funding programme in which $2.7 billion was invested from 2008 to 2010, with another $6 billion to follow in the next 5 years.
However, information on the output of innovative drug R&D in China is limited. With the aim of addressing this issue, we have collected and analysed information from the Chinese State Food and Drug Administration (SFDA) and the Center for Drug Evaluation of the SFDA (CDE) for all novel pharmaceuticals for which new drug
FROM THE ANALYST’S COUCH
Innovative drug R&D in ChinaJingzong Qi, Qingli Wang, Zhenhang Yu, Xin Chen and Fengshan Wang
Arne Jacobsen: 1969. Dansk Mobelkunst Gallery – www.dmk.dk
Figure 1 | Annual number of approved INDs and NDAs for innovative drugs from Chinese companies. Data were collected from the website of the Chinese State Food and Drug Administration (SFDA) and the Center for Drug Evaluation of the SFDA. IND, investigational new drug application; NDA, new drug application.
Bearing in mind the importance of patent protection in drug R&D as well as the evolution of Chinese patent law in recent years, we also analysed the patenting of the investigational therapeutics in China. Patents for pharmaceuticals are divided into two categories: compound patents and secondary patents, which include preparation, detection, pharmaceutical composition and usage. Out of 187 investigational drugs, 70 have compound patent protection in China, whereas 23 have compound patent protection in the United States and 16 in Europe (FIG. 2c). We also investigated the characteristics of those novel therapeutics that had patent protection in either the United States or Europe, which are presented in TABLE 1.
OutlookThe increased investment by the Chinese government and multinational pharmaceutical companies, as well as other improvements (discussed below), are creating a stronger environment for innovative drug R&D in China. First, in the past two decades, the Chinese regulatory system has undergone a systematic transformation to adapt to the emergence of more INDs. The first drug administration law in China was enacted in 1985, and there have been four major amendments since, with the latest one enacted in 2007. As mentioned above, the SFDA (which itself was founded in 2003) has introduced more robust regulations regarding new drug approval and registration, and to improve transparency and efficiency, which could pave the way for the emergence of more innovative drugs in the long term. For example, the registration status of an IND or NDA is publicly available, and applicants have easy access to all information regarding the approval process for their drugs. Local agencies of the SFDA are authorized to conduct preliminary approval procedures to increase efficiency. Companies that provide false information or samples will be penalized and barred from submitting NDAs for up to 3 years.
Patent protection is a second factor that is essential in innovative drug development. The current Chinese patent law was enacted ▶
doi:10.1038/nrd3435
N E W S & A N A LY S I S
NATURE REVIEWS | DRUG DISCOVERY VOLUME 10 | MAY 2011 | 333
nrd_3435_may11.indd 333 14/04/2011 11:49
pharmacodynamic analyses. Basic Clin. Pharmacol. Toxicol. 96, 225–227 (2005).
46. Urquhart, J. Getting a handle on why good drugs sometimes don’t work. J. R. Coll. Physicians Edinb. 34, 95–98 (2004).
47. Centers for Disease Control and Prevention. Achievements in Public Health, 1900–1999 Family Planning. MMWR Morb. Mortal. Wkly. Rep. 48, 1073–1080 (1999).
48. Vrijens, B. et al. Modellling the association between adherence and viral load in HIV-infected patients. Stat. Med. 24, 2719–2731 (2005).
49. Vrijens, B. & Urquhart, J. Patient adherence to prescribed antimicrobial drug dosing regimens. J. Antimicrob. Chemother. 55, 616–627 (2005).
50. Olfson, M., West, J. C., Wilk, J. E. & Marcus, S. Factors affecting the effectiveness of clinical decisions in treating schizophrenia. in Proc. of the American Psychiatric Assoc. 156th Annual Meeting (17–22 May 2003; San Francisco, California, USA; Abstract S28C).
51. Vrijens, B., Vincze, G., Kristanto, P., Urquhart, J. & Burnier, M. Adherence to prescribed antihypertensive drug treatments: longitudinal study of electronically compiled dosing histories. BMJ 336, 1114–1117 (2008).
52. Vincent, O. et al. Effect of concomitant CYP2D6 inhibitor use and tamoxifen adherence on breast cancer recurrence in early-stage breast cancer. J. Clin. Oncol. 28, 2423–2429 (2010).
53. Saevarsdottir, S. et al. Patients with early rheumatoid arthritis who smoke are less likely to respond to treatment with methotrexate and tumor necrosis factor inhibitors. Arthtitis Rheum. 63. 26–36 (2011).
54. Harter, J. G. & Peck, C. C. Chronobiology: suggestions for integrating it into drug development. Ann. N. Y. Acad. Sci. 618, 563–571 (1991).
55. Rothwell, P. M. Factors that can affect the external validity of randomised controlled trials. PLoS Clin. Trials 1, e9 (2006).
56. Thorpe, K. E. et al. A pragmatic-explanatory continuum indicator summary (PRECIS): a tool to help trial designers. CMAJ 180, e47–e57 (2009).
57. Temple, R. Enrichment of clinical study populations. Clin. Pharmacol. Ther. 88, 774–778 (2010).
58. Goldstein, J. Why Medicare Pays so Much For Cancer Drugs. European Medicines Agency. Wall Street Journal [online], http://blogs.wsj.com/health/2009/01/27/why-medicare-pays-so-much-for-cancer-drugs/tab/comments/ (2009).
59. Barbui, C. & Garattini, S. Regulatory policies on medicines for psychiatric disorders: is Europe on target? Br. J. Psychiatry 190, 91–93 (2007).
60. Woosley, R. L. & Rice, G. A new system for moving drugs to market. Issues Sci. Technol. XXI, 63–68 (2005).
61. Eichler, H. G., Pignatti, F., Flamion, B., Leufkens, H. & Breckenridge, A. Balancing early market access to new drugs with the need for benefit/risk data: a mounting dilemma. Nature Rev. Drug Discov. 7, 818–826 (2008).
62. [No authors listed.] Road map to 2015. European Medicines Agency [online], http://www.ema.europa.eu/docs/en_GB/document_library/Report/2011/01/WC500101373.pdf (2010).
63. Maxwell, S., Eichler, H. G., Bucsics, A., Haefeli, W. E. & Gustafsson, L.L. on behalf of the e-SPC consortium. e-SPC — delivering drug information in the 21st century: developing new approaches to deliver drug information to prescribers. Br. J. Clin. Pharmacol. 6 Apr 2011 (doi:10.1111/j.1365–21252011.03981.x.).
64. Urquhart, J. Patient noncompliance with drug regimens: measurement, clinical correlates, economic impact. Eur. Heart J. 17 (Suppl. A), 8–15 (1996).
65. Leufkens, H. G. & Urquhart, J. Variability in patterns of drug usage. J. Pharm. Pharmacol. 46 (Suppl. 1), 433–437 (1994).
66. McQuay, H. J. & Moore, R. A. Using numerical results from systematic reviews in clinical practice. Ann. Intern. Med. 126, 712–720 (1997).
67. Woodcock J. Assessing the clinical utility of diagnostics used in drug therapy. Clin. Pharmacol. Ther. 88, 765–773 (2010).
68. Mok, T. S. et al. Gefitinib or carboplatin-paclitaxel in pulmonary adenocarcinoma. N. Engl. J. Med. 361, 947–957 (2009).
69. Donnelly, L. A. et al. A paucimorphic variant in the HMG-CoA reductase gene is associated with lipid-lowering response to statin treatment in diabetes: a GoDARTS study. Pharmacogenet. Genomics 18, 1021–1026 (2008).
70. Flockhart, D. A. Pharmacogenetic testing of CYP2C9 and VKORC1 alleles for warfarin. Genet. Med. 10, 139–150 (2008).
71. Ginsburg, G. S. & Voora, D. The long and winding road to warfarin pharmacogenetic testing. J. Am. Coll. Cardiol. 55, 2813–2815 (2010).
72. Kamali, F. & Wynne, H. Pharmacogenetics of warfarin. Annu. Rev. Med. 61, 63–75 (2010).
73. Schilsky, R. L. Personalised medicine in oncology. Nature Rev. Drug Discov. 9, 363–366 (2010).
74. Roses, A. D. Pharmacogenetics in drug discovery and development: a translational perspective. Nature Rev. Drug Discov. 7, 807–817 (2008).
75. European Medicines Agency. Reflection paper on co-development of pharmacogenomic biomarkers and assays in the context of drug development. European Medicines Agency [online], http://www.ema.europa.eu/docs/en_GB/document_library/Scientific_guideline/2010/07/WC500094445.pdf (2010).
76. FDA. International Pharmaceutical Regulatory Monitor: US FDA draft guidance explains new drug development tools. FDA News [online], http://www.fdanews.com/newsletter/article?issueId=14226&articleId=131972 (2010).
77. European Medicines Agency. Qualification of novel methodologies for drug development: guidance to applicants. European Medicines Agency [online], http://www.ema.europa.eu/docs/en_GB/document_library/Regulatory_and_procedural_guideline/2009/10/WC500004201.pdf (2009).
78. McClellan, M. et al. An accelerated pathway for targeted cancer therapies. Nature Rev. Drug Discov. 10, 79–80 (2011).
79. [No authors listed.] Rethinking therapeutic cancer vaccines. Nature Rev. Drug Discov. 8, 685–686 (2009).
80. Hampel, H. et al. Biomarkers for Alzheimer’s disease therapeutic trials. Prog. Neurobiol. 2 Dec 2010 (doi:10.1016/j.pneurobio.2010.11.005).
81. Falissard, B. et al. Relative effectiveness assessment of listed drugs (REAL): a new method for an early comparison of the effectiveness of approved health technologies. Int. J. Technol. Assess Health Care 26, 124–130 (2010).
82. Birkett, D. et al. Clinical pharmacology in research, teaching and health care: considerations by IUPHAR, the Inter-national Union of Basic and Clinical Pharmacology. Basic Clin. Pharmacol. Toxicol. 107, 531–559 (2010).
83. Pocock, S. J., Assmann, S. E., Enos, L. E. & Kasten, L. E. Subgroup analysis, covariate adjustment and baseline comparisons in clinical trial reporting: current practice and problems. Stat. Med. 21, 2917–2930 (2002).
84. Aarons, L. et al. Role of modelling and simulation in Phase I drug development. Eur. J. Pharm. Sci. 13, 115–122 (2001).
85. Manolis, E. & Pons, G. Proposals for model-based paediatric medicinal development within the current European Union regulatory framework. Br. J. Clin. Pharmacol. 68, 493–501 (2009).
86. [No authors listed.] How to reduce prescribing errors. Lancet 374, 1945 (2009).
87. [No authors listed.] Evidence-based Practice Centres: synthesizing scientific evidence to improve quality and effectiveness in health care. Agency for Healthcare Research and Quality [online], http://www.ahrq.gov/clinic/epc/ (2011).
88. Bahri, P. Public pharmacovigilance communication: a process calling for evidence-based, objective-driven strategies. Drug Saf. 33,1065–1079 (2010).
89. Smalley, W. et al. Contraindicated use of cisapride: impact of food and drug administration regulatory action. JAMA 284, 3036–3039 (2000).
90. John, J. et al. HER2 testing and subsequent trastuzumab treatment for breast cancer in a managed care environment. Oncologist 14, 760–768 (2009).
91. Gustafsson, L. L. et al. The “Wise List” — a comprehensive concept to select, communicate and achieve recommendations of essential drugs in ambulatory care in Stockholm. Basic Clin. Pharmacol. Toxicol.108, 224–233 (2011).
92. Shea, S. & Hripcsak, G. Accelerating the use of electronic health records in physician practices. N. Engl. J. Med. 362, 192–195 (2010).
93. Sjöborg, B. et al. Design and implementation of a point-of-care computerized system for drug therapy in Stockholm metropolitan health region-bridging the gap between knowledge and practice. Int. J. Med. Inform. 76, 497–506 (2007).
94. Classen, D. C., Avery, A. J. & Bates, D. W. Evaluation and certification of computerized provider order entry systems. J. Am. Med. Inform. Assoc. 14, 48–55 (2007).
95. Böttiger, Y. et al. SFINX — a drug–drug interaction database desgined for clinical decision support systems. Eur. J. Clin. Pharmacol. 95, 627–633 (2009).
96. Wettermark, B. et al. The new Swedish Prescribed Drug Register—opportunities for pharmacoepidemiological research and experience from the first six months. Pharmacoepidemiol. Drug Saf. 16, 726–735 (2007).
97. Cutler, D. & Everett, W. Thinking outside the pillbox — medication adherence as a priority for health care reform. N. Engl. J. Med. 362, 1553–1555 (2010).
98. Modi, A. C. & Quittner, A. L. Barriers to treatment adherence for children with cystic fibrosis and asthma: what gets in the way? J. Pediatr. Psychol. 31, 846–858 (2006).
99. Osterberg, L. G., Urquhart, J. & Blaschke, T. F. Understanding forgiveness: minding and mining the gaps between pharmacokinetics and therapeutics. Clin. Pharmacol. Ther. 88, 457–459 (2010).
100. Frieden, T. R., Fujiwara, P. I., Washko, R. M. & Hamburg, M. A. Tuberculosis in New York City — turning the tide. N. Engl. J. Med. 333, 229–233 (1995).
101. Lester, R. T. et al. Effects of a mobile phone short message service on antiretroviral treatment adherence in Kenya (WelTel Kenya1): a randomised trial. Lancet 376, 1838–1845 (2010).
102. Chi, B. H. & Stringer, J. S. A. Mobile phones to improve HIV treatment adherence. Lancet 376, 1807–1808 (2010).
103. Ogedegbe G. Self-titration for treatment of uncomplicated hypertension. Lancet 376, 144–146 (2010).
104. Singer, E. Message from a pill bottle. Technology Review [online], http://www.technologyreview.com/business/26414/?p1=A4 (2010).
105. Au-Yeung, K. Y. et al. A networked system for self-management of drug therapy and wellness. ACM Digital Library [online], http://delivery.acm.org/10.1145/1930000/1921083/p1-au-yeung.pdf?key1=1921083&key2=9929465921&coll=DL&dl=ACM&CFID=7014173&CFTOKEN=96965669 (2010).
106. Sokol, M. C., McGuigan, K. A., Verbrugge, R. R. & Epstein, R. S. Impact of medication adherence on hospitalization risk and healthcare cost. Med. Care 43, 521–530 (2005).
107. Ware, J. H. & Hamel, M. B. Pragmatic trials — guide to better patient care? N. Engl. J. Med. 364, 1685–1687 (2011).
108. Hughes, B. 2009 FDA drug approvals. Nature Rev. Drug Discov. 9, 89–92 (2010).
109. Eichler, H. G., Aronsson, B., Abadie, E. & Salmonson, T. New drug approval success rate in Europe in 2009. Nature Rev. Drug Discov. 9, 355–356 (2010).
Competing interests statementThe authors declare no competing financial interests.
P E R S P E C T I V E S
506 | JULY 2011 | VOLUME 10 www.nature.com/reviews/drugdisc
nrd_3501_jul11.indd 506 20/06/2011 16:34
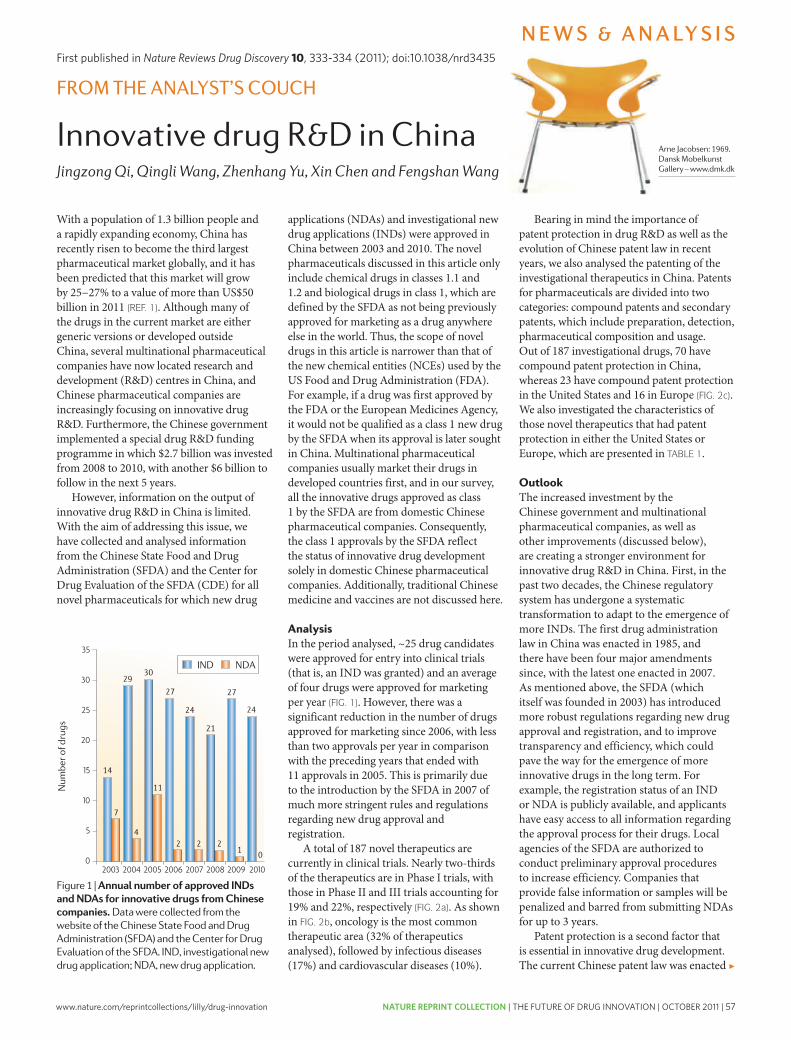
www.nature.com/reprintcollections/lilly/drug-innovation NATURE REPRINT COLLECTION | THE FUTURE OF DRUG INNOVATION | OCTOBER 2011 | 57
35
30
25
20
15
10
5
02004 2006 2007 2008 2009 20102003 2005
applications (NDAs) and investigational new drug applications (INDs) were approved in China between 2003 and 2010. The novel pharmaceuticals discussed in this article only include chemical drugs in classes 1.1 and 1.2 and biological drugs in class 1, which are defined by the SFDA as not being previously approved for marketing as a drug anywhere else in the world. Thus, the scope of novel drugs in this article is narrower than that of the new chemical entities (NCEs) used by the US Food and Drug Administration (FDA). For example, if a drug was first approved by the FDA or the European Medicines Agency, it would not be qualified as a class 1 new drug by the SFDA when its approval is later sought in China. Multinational pharmaceutical companies usually market their drugs in developed countries first, and in our survey, all the innovative drugs approved as class 1 by the SFDA are from domestic Chinese pharmaceutical companies. Consequently, the class 1 approvals by the SFDA reflect the status of innovative drug development solely in domestic Chinese pharmaceutical companies. Additionally, traditional Chinese medicine and vaccines are not discussed here.
AnalysisIn the period analysed, ~25 drug candidates were approved for entry into clinical trials (that is, an IND was granted) and an average of four drugs were approved for marketing per year (FIG. 1). However, there was a significant reduction in the number of drugs approved for marketing since 2006, with less than two approvals per year in comparison with the preceding years that ended with 11 approvals in 2005. This is primarily due to the introduction by the SFDA in 2007 of much more stringent rules and regulations regarding new drug approval and registration.
A total of 187 novel therapeutics are currently in clinical trials. Nearly two-thirds of the therapeutics are in Phase I trials, with those in Phase II and III trials accounting for 19% and 22%, respectively (FIG. 2a). As shown in FIG. 2b, oncology is the most common therapeutic area (32% of therapeutics analysed), followed by infectious diseases (17%) and cardiovascular diseases (10%).
With a population of 1.3 billion people and a rapidly expanding economy, China has recently risen to become the third largest pharmaceutical market globally, and it has been predicted that this market will grow by 25–27% to a value of more than US$50 billion in 2011 (REF. 1). Although many of the drugs in the current market are either generic versions or developed outside China, several multinational pharmaceutical companies have now located research and development (R&D) centres in China, and Chinese pharmaceutical companies are increasingly focusing on innovative drug R&D. Furthermore, the Chinese government implemented a special drug R&D funding programme in which $2.7 billion was invested from 2008 to 2010, with another $6 billion to follow in the next 5 years.
However, information on the output of innovative drug R&D in China is limited. With the aim of addressing this issue, we have collected and analysed information from the Chinese State Food and Drug Administration (SFDA) and the Center for Drug Evaluation of the SFDA (CDE) for all novel pharmaceuticals for which new drug
FROM THE ANALYST’S COUCH
Innovative drug R&D in ChinaJingzong Qi, Qingli Wang, Zhenhang Yu, Xin Chen and Fengshan Wang
Arne Jacobsen: 1969. Dansk Mobelkunst Gallery – www.dmk.dk
Figure 1 | Annual number of approved INDs and NDAs for innovative drugs from Chinese companies. Data were collected from the website of the Chinese State Food and Drug Administration (SFDA) and the Center for Drug Evaluation of the SFDA. IND, investigational new drug application; NDA, new drug application.
Bearing in mind the importance of patent protection in drug R&D as well as the evolution of Chinese patent law in recent years, we also analysed the patenting of the investigational therapeutics in China. Patents for pharmaceuticals are divided into two categories: compound patents and secondary patents, which include preparation, detection, pharmaceutical composition and usage. Out of 187 investigational drugs, 70 have compound patent protection in China, whereas 23 have compound patent protection in the United States and 16 in Europe (FIG. 2c). We also investigated the characteristics of those novel therapeutics that had patent protection in either the United States or Europe, which are presented in TABLE 1.
OutlookThe increased investment by the Chinese government and multinational pharmaceutical companies, as well as other improvements (discussed below), are creating a stronger environment for innovative drug R&D in China. First, in the past two decades, the Chinese regulatory system has undergone a systematic transformation to adapt to the emergence of more INDs. The first drug administration law in China was enacted in 1985, and there have been four major amendments since, with the latest one enacted in 2007. As mentioned above, the SFDA (which itself was founded in 2003) has introduced more robust regulations regarding new drug approval and registration, and to improve transparency and efficiency, which could pave the way for the emergence of more innovative drugs in the long term. For example, the registration status of an IND or NDA is publicly available, and applicants have easy access to all information regarding the approval process for their drugs. Local agencies of the SFDA are authorized to conduct preliminary approval procedures to increase efficiency. Companies that provide false information or samples will be penalized and barred from submitting NDAs for up to 3 years.
Patent protection is a second factor that is essential in innovative drug development. The current Chinese patent law was enacted ▶
N E W S & A N A LY S I S
NATURE REVIEWS | DRUG DISCOVERY VOLUME 10 | MAY 2011 | 333
nrd_3435_may11.indd 333 14/04/2011 11:49
pharmacodynamic analyses. Basic Clin. Pharmacol. Toxicol. 96, 225–227 (2005).
46. Urquhart, J. Getting a handle on why good drugs sometimes don’t work. J. R. Coll. Physicians Edinb. 34, 95–98 (2004).
47. Centers for Disease Control and Prevention. Achievements in Public Health, 1900–1999 Family Planning. MMWR Morb. Mortal. Wkly. Rep. 48, 1073–1080 (1999).
48. Vrijens, B. et al. Modellling the association between adherence and viral load in HIV-infected patients. Stat. Med. 24, 2719–2731 (2005).
49. Vrijens, B. & Urquhart, J. Patient adherence to prescribed antimicrobial drug dosing regimens. J. Antimicrob. Chemother. 55, 616–627 (2005).
50. Olfson, M., West, J. C., Wilk, J. E. & Marcus, S. Factors affecting the effectiveness of clinical decisions in treating schizophrenia. in Proc. of the American Psychiatric Assoc. 156th Annual Meeting (17–22 May 2003; San Francisco, California, USA; Abstract S28C).
51. Vrijens, B., Vincze, G., Kristanto, P., Urquhart, J. & Burnier, M. Adherence to prescribed antihypertensive drug treatments: longitudinal study of electronically compiled dosing histories. BMJ 336, 1114–1117 (2008).
52. Vincent, O. et al. Effect of concomitant CYP2D6 inhibitor use and tamoxifen adherence on breast cancer recurrence in early-stage breast cancer. J. Clin. Oncol. 28, 2423–2429 (2010).
53. Saevarsdottir, S. et al. Patients with early rheumatoid arthritis who smoke are less likely to respond to treatment with methotrexate and tumor necrosis factor inhibitors. Arthtitis Rheum. 63. 26–36 (2011).
54. Harter, J. G. & Peck, C. C. Chronobiology: suggestions for integrating it into drug development. Ann. N. Y. Acad. Sci. 618, 563–571 (1991).
55. Rothwell, P. M. Factors that can affect the external validity of randomised controlled trials. PLoS Clin. Trials 1, e9 (2006).
56. Thorpe, K. E. et al. A pragmatic-explanatory continuum indicator summary (PRECIS): a tool to help trial designers. CMAJ 180, e47–e57 (2009).
57. Temple, R. Enrichment of clinical study populations. Clin. Pharmacol. Ther. 88, 774–778 (2010).
58. Goldstein, J. Why Medicare Pays so Much For Cancer Drugs. European Medicines Agency. Wall Street Journal [online], http://blogs.wsj.com/health/2009/01/27/why-medicare-pays-so-much-for-cancer-drugs/tab/comments/ (2009).
59. Barbui, C. & Garattini, S. Regulatory policies on medicines for psychiatric disorders: is Europe on target? Br. J. Psychiatry 190, 91–93 (2007).
60. Woosley, R. L. & Rice, G. A new system for moving drugs to market. Issues Sci. Technol. XXI, 63–68 (2005).
61. Eichler, H. G., Pignatti, F., Flamion, B., Leufkens, H. & Breckenridge, A. Balancing early market access to new drugs with the need for benefit/risk data: a mounting dilemma. Nature Rev. Drug Discov. 7, 818–826 (2008).
62. [No authors listed.] Road map to 2015. European Medicines Agency [online], http://www.ema.europa.eu/docs/en_GB/document_library/Report/2011/01/WC500101373.pdf (2010).
63. Maxwell, S., Eichler, H. G., Bucsics, A., Haefeli, W. E. & Gustafsson, L.L. on behalf of the e-SPC consortium. e-SPC — delivering drug information in the 21st century: developing new approaches to deliver drug information to prescribers. Br. J. Clin. Pharmacol. 6 Apr 2011 (doi:10.1111/j.1365–21252011.03981.x.).
64. Urquhart, J. Patient noncompliance with drug regimens: measurement, clinical correlates, economic impact. Eur. Heart J. 17 (Suppl. A), 8–15 (1996).
65. Leufkens, H. G. & Urquhart, J. Variability in patterns of drug usage. J. Pharm. Pharmacol. 46 (Suppl. 1), 433–437 (1994).
66. McQuay, H. J. & Moore, R. A. Using numerical results from systematic reviews in clinical practice. Ann. Intern. Med. 126, 712–720 (1997).
67. Woodcock J. Assessing the clinical utility of diagnostics used in drug therapy. Clin. Pharmacol. Ther. 88, 765–773 (2010).
68. Mok, T. S. et al. Gefitinib or carboplatin-paclitaxel in pulmonary adenocarcinoma. N. Engl. J. Med. 361, 947–957 (2009).
69. Donnelly, L. A. et al. A paucimorphic variant in the HMG-CoA reductase gene is associated with lipid-lowering response to statin treatment in diabetes: a GoDARTS study. Pharmacogenet. Genomics 18, 1021–1026 (2008).
70. Flockhart, D. A. Pharmacogenetic testing of CYP2C9 and VKORC1 alleles for warfarin. Genet. Med. 10, 139–150 (2008).
71. Ginsburg, G. S. & Voora, D. The long and winding road to warfarin pharmacogenetic testing. J. Am. Coll. Cardiol. 55, 2813–2815 (2010).
72. Kamali, F. & Wynne, H. Pharmacogenetics of warfarin. Annu. Rev. Med. 61, 63–75 (2010).
73. Schilsky, R. L. Personalised medicine in oncology. Nature Rev. Drug Discov. 9, 363–366 (2010).
74. Roses, A. D. Pharmacogenetics in drug discovery and development: a translational perspective. Nature Rev. Drug Discov. 7, 807–817 (2008).
75. European Medicines Agency. Reflection paper on co-development of pharmacogenomic biomarkers and assays in the context of drug development. European Medicines Agency [online], http://www.ema.europa.eu/docs/en_GB/document_library/Scientific_guideline/2010/07/WC500094445.pdf (2010).
76. FDA. International Pharmaceutical Regulatory Monitor: US FDA draft guidance explains new drug development tools. FDA News [online], http://www.fdanews.com/newsletter/article?issueId=14226&articleId=131972 (2010).
77. European Medicines Agency. Qualification of novel methodologies for drug development: guidance to applicants. European Medicines Agency [online], http://www.ema.europa.eu/docs/en_GB/document_library/Regulatory_and_procedural_guideline/2009/10/WC500004201.pdf (2009).
78. McClellan, M. et al. An accelerated pathway for targeted cancer therapies. Nature Rev. Drug Discov. 10, 79–80 (2011).
79. [No authors listed.] Rethinking therapeutic cancer vaccines. Nature Rev. Drug Discov. 8, 685–686 (2009).
80. Hampel, H. et al. Biomarkers for Alzheimer’s disease therapeutic trials. Prog. Neurobiol. 2 Dec 2010 (doi:10.1016/j.pneurobio.2010.11.005).
81. Falissard, B. et al. Relative effectiveness assessment of listed drugs (REAL): a new method for an early comparison of the effectiveness of approved health technologies. Int. J. Technol. Assess Health Care 26, 124–130 (2010).
82. Birkett, D. et al. Clinical pharmacology in research, teaching and health care: considerations by IUPHAR, the Inter-national Union of Basic and Clinical Pharmacology. Basic Clin. Pharmacol. Toxicol. 107, 531–559 (2010).
83. Pocock, S. J., Assmann, S. E., Enos, L. E. & Kasten, L. E. Subgroup analysis, covariate adjustment and baseline comparisons in clinical trial reporting: current practice and problems. Stat. Med. 21, 2917–2930 (2002).
84. Aarons, L. et al. Role of modelling and simulation in Phase I drug development. Eur. J. Pharm. Sci. 13, 115–122 (2001).
85. Manolis, E. & Pons, G. Proposals for model-based paediatric medicinal development within the current European Union regulatory framework. Br. J. Clin. Pharmacol. 68, 493–501 (2009).
86. [No authors listed.] How to reduce prescribing errors. Lancet 374, 1945 (2009).
87. [No authors listed.] Evidence-based Practice Centres: synthesizing scientific evidence to improve quality and effectiveness in health care. Agency for Healthcare Research and Quality [online], http://www.ahrq.gov/clinic/epc/ (2011).
88. Bahri, P. Public pharmacovigilance communication: a process calling for evidence-based, objective-driven strategies. Drug Saf. 33,1065–1079 (2010).
89. Smalley, W. et al. Contraindicated use of cisapride: impact of food and drug administration regulatory action. JAMA 284, 3036–3039 (2000).
90. John, J. et al. HER2 testing and subsequent trastuzumab treatment for breast cancer in a managed care environment. Oncologist 14, 760–768 (2009).
91. Gustafsson, L. L. et al. The “Wise List” — a comprehensive concept to select, communicate and achieve recommendations of essential drugs in ambulatory care in Stockholm. Basic Clin. Pharmacol. Toxicol.108, 224–233 (2011).
92. Shea, S. & Hripcsak, G. Accelerating the use of electronic health records in physician practices. N. Engl. J. Med. 362, 192–195 (2010).
93. Sjöborg, B. et al. Design and implementation of a point-of-care computerized system for drug therapy in Stockholm metropolitan health region-bridging the gap between knowledge and practice. Int. J. Med. Inform. 76, 497–506 (2007).
94. Classen, D. C., Avery, A. J. & Bates, D. W. Evaluation and certification of computerized provider order entry systems. J. Am. Med. Inform. Assoc. 14, 48–55 (2007).
95. Böttiger, Y. et al. SFINX — a drug–drug interaction database desgined for clinical decision support systems. Eur. J. Clin. Pharmacol. 95, 627–633 (2009).
96. Wettermark, B. et al. The new Swedish Prescribed Drug Register—opportunities for pharmacoepidemiological research and experience from the first six months. Pharmacoepidemiol. Drug Saf. 16, 726–735 (2007).
97. Cutler, D. & Everett, W. Thinking outside the pillbox — medication adherence as a priority for health care reform. N. Engl. J. Med. 362, 1553–1555 (2010).
98. Modi, A. C. & Quittner, A. L. Barriers to treatment adherence for children with cystic fibrosis and asthma: what gets in the way? J. Pediatr. Psychol. 31, 846–858 (2006).
99. Osterberg, L. G., Urquhart, J. & Blaschke, T. F. Understanding forgiveness: minding and mining the gaps between pharmacokinetics and therapeutics. Clin. Pharmacol. Ther. 88, 457–459 (2010).
100. Frieden, T. R., Fujiwara, P. I., Washko, R. M. & Hamburg, M. A. Tuberculosis in New York City — turning the tide. N. Engl. J. Med. 333, 229–233 (1995).
101. Lester, R. T. et al. Effects of a mobile phone short message service on antiretroviral treatment adherence in Kenya (WelTel Kenya1): a randomised trial. Lancet 376, 1838–1845 (2010).
102. Chi, B. H. & Stringer, J. S. A. Mobile phones to improve HIV treatment adherence. Lancet 376, 1807–1808 (2010).
103. Ogedegbe G. Self-titration for treatment of uncomplicated hypertension. Lancet 376, 144–146 (2010).
104. Singer, E. Message from a pill bottle. Technology Review [online], http://www.technologyreview.com/business/26414/?p1=A4 (2010).
105. Au-Yeung, K. Y. et al. A networked system for self-management of drug therapy and wellness. ACM Digital Library [online], http://delivery.acm.org/10.1145/1930000/1921083/p1-au-yeung.pdf?key1=1921083&key2=9929465921&coll=DL&dl=ACM&CFID=7014173&CFTOKEN=96965669 (2010).
106. Sokol, M. C., McGuigan, K. A., Verbrugge, R. R. & Epstein, R. S. Impact of medication adherence on hospitalization risk and healthcare cost. Med. Care 43, 521–530 (2005).
107. Ware, J. H. & Hamel, M. B. Pragmatic trials — guide to better patient care? N. Engl. J. Med. 364, 1685–1687 (2011).
108. Hughes, B. 2009 FDA drug approvals. Nature Rev. Drug Discov. 9, 89–92 (2010).
109. Eichler, H. G., Aronsson, B., Abadie, E. & Salmonson, T. New drug approval success rate in Europe in 2009. Nature Rev. Drug Discov. 9, 355–356 (2010).
Competing interests statementThe authors declare no competing financial interests.
P E R S P E C T I V E S
506 | JULY 2011 | VOLUME 10 www.nature.com/reviews/drugdisc
nrd_3501_jul11.indd 506 20/06/2011 16:34
First published in Nature Reviews Drug Discovery 10, 333-334 (2011); doi:10.1038/nrd3435
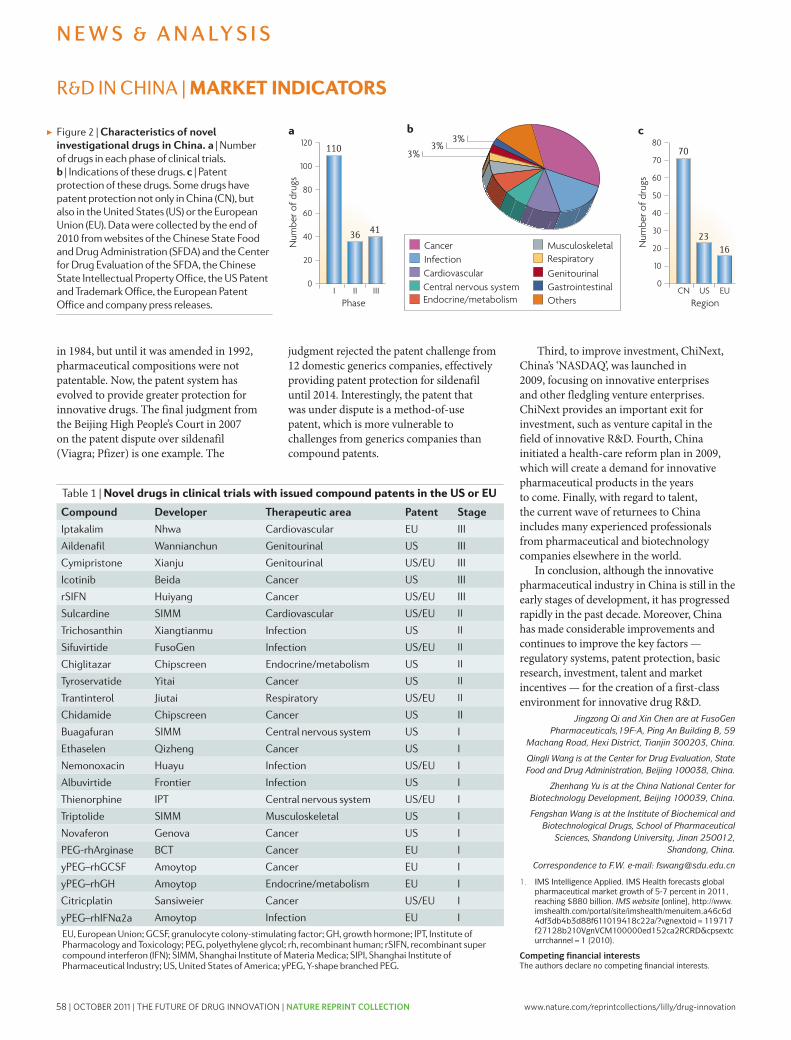
58 | OCTOBER 2011 | THE FUTURE OF DRUG INNOVATION | NATURE REPRINT COLLECTION www.nature.com/reprintcollections/lilly/drug-innovation
The impact of mergers on pharmaceutical R&DJohn L. LaMattina
Mergers and acquisitions in the pharmaceutical industry have substantially reduced the number of major companies over the past 15 years. The short-term business rationale for this extensive consolidation might have been reasonable, but at what cost to research and development productivity?
John L. LaMattina is the former President of Pfizer Global Research and Development, and is currently Senior Partner at Puretech Ventures, Boston, Massachusetts 02116, USA.e-mail: [email protected]:10.1038/nrd3514
Concerns about the productivity of pharmaceutical research and development (R&D) are becoming increas-ingly common in both the mainstream media and sci-entific literature. A range of possible causes have been identified, from more challenging therapeutic targets to excessive bureaucracy, and various approaches to address these issues have been put forward (for example, see REFS 1,2). However, the impact of mergers and acqui-sitions on R&D productivity is less well documented, because R&D integrations and cuts are largely done pri-vately. In this article, it is argued that although mergers and acquisitions in the pharmaceutical industry might have had a reasonable short-term business rationale, their impact on the R&D of the organizations involved has been devastating.
Industry consolidationWhen people bemoan the poor productivity of the phar-maceutical industry at present, they often refer back to the heyday of new drug approvals by the US Food and Drug Administration (FDA): the 1990s. Indeed, in terms of the number of new drugs that were approved, this decade was more productive, with an average of 31 drugs per year between 1990 and 1999 (compared with 24 per year between 2000 and 2009), with a peak of 54 drugs in 1996. One possible contributory factor is that multiple entries in a single drug class (such as statins) were more economically viable at the time.
However, another underlying factor contributing to the productivity observed in the 1990s was the large number of pharmaceutical companies at that time. Many of the drugs that were approved in 1996 origi-nated from companies that no longer exist; indeed, out of the 42 members of the Pharmaceutical Research and Manufacturers of America (PhRMA) in 1988, only 11 (~25%) remain today (see Supplementary information S1 (figure)).
The R&D portfolios of these companies, although differing in size, tended to be broader in scope than
those of start-up companies that arose during this time, and it is likely that when a new idea for treating cancer arose in 1990, 20 companies would have initiated pro-jects on it. Given the difficulties that are encountered in R&D, it could reasonably be assumed that only three or four of these companies would have been success-ful at bringing a drug based on this idea to market. Furthermore, the greater diversity of portfolios among a larger number of companies — both large and small — could increase the chances of finding new drugs in general. Indeed, a recent analysis has indicated that the number of new drug approvals during the past 60 years is correlated with the number of companies3. Now, with so many fewer major companies involved in pharmaceu-tical R&D, the chances of success in the industry overall are likely to be dropping precipitously.
R&D reductionsFrom a business perspective, mergers and acquisitions are often considered to be attractive as they remove duplication, reduce costs and produce synergies. Furthermore, in the early days of mergers in the phar-maceutical industry, organizations often described them as being part of a growth story. In these situations — for example, the merger of Bristol Myers with Squibb in 1989 — the R&D divisions were fused. Programme overlap was minimized and new projects were added, and major R&D cuts did not occur.
This has changed radically in the past decade. In major mergers today, not only are R&D cuts made, but entire research sites are eliminated. Nowhere is this more evident than with Pfizer. Before 1999, Pfizer had never made a major acquisition. Over the next decade, it acquired three large companies — Warner-Lambert (in 2000), Pharmacia (in 2003) and Wyeth (in 2009) — and multiple smaller companies, such as Vicuron, Rinat and Esperion (Supplementary information S1 (figure)). Over this time frame, to meet its business objectives (a euphemism for raising its stock price) Pfizer closed
COMMENT
NATURE REVIEWS | DRUG DISCOVERY VOLUME 10 | AUGUST 2011 | 559
nrd_3514_aug11.indd 559 19/07/2011 15:03
Num
ber o
f dru
gs0
20
40
60
80
100
120
I II IIIPhase Region
10
20
30
40
50
60
70
80
Num
ber o
f dru
gs
0CN US EU
CancerInfectionCardiovascularCentral nervous systemEndocrine/metabolism
MusculoskeletalRespiratoryGenitourinalGastrointestinalOthers
R&D IN CHINA | MARKET INDICATORS
▶
in 1984, but until it was amended in 1992, pharmaceutical compositions were not patentable. Now, the patent system has evolved to provide greater protection for innovative drugs. The final judgment from the Beijing High People’s Court in 2007 on the patent dispute over sildenafil (Viagra; Pfizer) is one example. The
judgment rejected the patent challenge from 12 domestic generics companies, effectively providing patent protection for sildenafil until 2014. Interestingly, the patent that was under dispute is a method-of-use patent, which is more vulnerable to challenges from generics companies than compound patents.
Third, to improve investment, ChiNext, China’s ‘NASDAQ’, was launched in 2009, focusing on innovative enterprises and other fledgling venture enterprises. ChiNext provides an important exit for investment, such as venture capital in the field of innovative R&D. Fourth, China initiated a health-care reform plan in 2009, which will create a demand for innovative pharmaceutical products in the years to come. Finally, with regard to talent, the current wave of returnees to China includes many experienced professionals from pharmaceutical and biotechnology companies elsewhere in the world.
In conclusion, although the innovative pharmaceutical industry in China is still in the early stages of development, it has progressed rapidly in the past decade. Moreover, China has made considerable improvements and continues to improve the key factors — regulatory systems, patent protection, basic research, investment, talent and market incentives — for the creation of a first-class environment for innovative drug R&D.
Jingzong Qi and Xin Chen are at FusoGen Pharmaceuticals,19F-A, Ping An Building B, 59
Machang Road, Hexi District, Tianjin 300203, China.
Qingli Wang is at the Center for Drug Evaluation, State Food and Drug Administration, Beijing 100038, China.
Zhenhang Yu is at the China National Center for Biotechnology Development, Beijing 100039, China.
Fengshan Wang is at the Institute of Biochemical and Biotechnological Drugs, School of Pharmaceutical
Sciences, Shandong University, Jinan 250012, Shandong, China.
Correspondence to F.W. e-mail: [email protected]
1. IMS Intelligence Applied. IMS Health forecasts global pharmaceutical market growth of 5-7 percent in 2011, reaching $880 billion. IMS website [online], http://www.imshealth.com/portal/site/imshealth/menuitem.a46c6d4df3db4b3d88f611019418c22a/?vgnextoid=119717f27128b210VgnVCM100000ed152ca2RCRD&cpsextcurrchannel=1 (2010).
Competing financial interestsThe authors declare no competing financial interests.
Table 1 | Novel drugs in clinical trials with issued compound patents in the US or EU
Compound Developer Therapeutic area Patent Stage
Iptakalim Nhwa Cardiovascular EU III
Aildenafil Wannianchun Genitourinal US III
Cymipristone Xianju Genitourinal US/EU III
Icotinib Beida Cancer US III
rSIFN Huiyang Cancer US/EU III
Sulcardine SIMM Cardiovascular US/EU II
Trichosanthin Xiangtianmu Infection US II
Sifuvirtide FusoGen Infection US/EU II
Chiglitazar Chipscreen Endocrine/metabolism US II
Tyroservatide Yitai Cancer US II
Trantinterol Jiutai Respiratory US/EU II
Chidamide Chipscreen Cancer US II
Buagafuran SIMM Central nervous system US I
Ethaselen Qizheng Cancer US I
Nemonoxacin Huayu Infection US/EU I
Albuvirtide Frontier Infection US I
Thienorphine IPT Central nervous system US/EU I
Triptolide SIMM Musculoskeletal US I
Novaferon Genova Cancer US I
PEG-rhArginase BCT Cancer EU I
yPEG–rhGCSF Amoytop Cancer EU I
yPEG–rhGH Amoytop Endocrine/metabolism EU I
Citricplatin Sansiweier Cancer US/EU I
yPEG–rhIFNα2a Amoytop Infection EU I
EU, European Union; GCSF, granulocyte colony-stimulating factor; GH, growth hormone; IPT, Institute of Pharmacology and Toxicology; PEG, polyethylene glycol; rh, recombinant human; rSIFN, recombinant super compound interferon (IFN); SIMM, Shanghai Institute of Materia Medica; SIPI, Shanghai Institute of Pharmaceutical Industry; US, United States of America; yPEG, Y-shape branched PEG.
Figure 2 | Characteristics of novel investigational drugs in China. a | Number of drugs in each phase of clinical trials. b | Indications of these drugs. c | Patent protection of these drugs. Some drugs have patent protection not only in China (CN), but also in the United States (US) or the European Union (EU). Data were collected by the end of 2010 from websites of the Chinese State Food and Drug Administration (SFDA) and the Center for Drug Evaluation of the SFDA, the Chinese State Intellectual Property Office, the US Patent and Trademark Office, the European Patent Office and company press releases.
N E W S & A N A LY S I S
334 | MAY 2011 | VOLUME 10 www.nature.com/reviews/jrnl
nrd_3435_may11.indd 334 14/04/2011 11:49
www.nature.com/reprintcollections/lilly/drug-innovation NATURE REPRINT COLLECTION | THE FUTURE OF DRUG INNOVATION | OCTOBER 2011 | 59
The impact of mergers on pharmaceutical R&DJohn L. LaMattina
Mergers and acquisitions in the pharmaceutical industry have substantially reduced the number of major companies over the past 15 years. The short-term business rationale for this extensive consolidation might have been reasonable, but at what cost to research and development productivity?
John L. LaMattina is the former President of Pfizer Global Research and Development, and is currently Senior Partner at Puretech Ventures, Boston, Massachusetts 02116, USA.e-mail: [email protected]:10.1038/nrd3514
Concerns about the productivity of pharmaceutical research and development (R&D) are becoming increas-ingly common in both the mainstream media and sci-entific literature. A range of possible causes have been identified, from more challenging therapeutic targets to excessive bureaucracy, and various approaches to address these issues have been put forward (for example, see REFS 1,2). However, the impact of mergers and acqui-sitions on R&D productivity is less well documented, because R&D integrations and cuts are largely done pri-vately. In this article, it is argued that although mergers and acquisitions in the pharmaceutical industry might have had a reasonable short-term business rationale, their impact on the R&D of the organizations involved has been devastating.
Industry consolidationWhen people bemoan the poor productivity of the phar-maceutical industry at present, they often refer back to the heyday of new drug approvals by the US Food and Drug Administration (FDA): the 1990s. Indeed, in terms of the number of new drugs that were approved, this decade was more productive, with an average of 31 drugs per year between 1990 and 1999 (compared with 24 per year between 2000 and 2009), with a peak of 54 drugs in 1996. One possible contributory factor is that multiple entries in a single drug class (such as statins) were more economically viable at the time.
However, another underlying factor contributing to the productivity observed in the 1990s was the large number of pharmaceutical companies at that time. Many of the drugs that were approved in 1996 origi-nated from companies that no longer exist; indeed, out of the 42 members of the Pharmaceutical Research and Manufacturers of America (PhRMA) in 1988, only 11 (~25%) remain today (see Supplementary information S1 (figure)).
The R&D portfolios of these companies, although differing in size, tended to be broader in scope than
those of start-up companies that arose during this time, and it is likely that when a new idea for treating cancer arose in 1990, 20 companies would have initiated pro-jects on it. Given the difficulties that are encountered in R&D, it could reasonably be assumed that only three or four of these companies would have been success-ful at bringing a drug based on this idea to market. Furthermore, the greater diversity of portfolios among a larger number of companies — both large and small — could increase the chances of finding new drugs in general. Indeed, a recent analysis has indicated that the number of new drug approvals during the past 60 years is correlated with the number of companies3. Now, with so many fewer major companies involved in pharmaceu-tical R&D, the chances of success in the industry overall are likely to be dropping precipitously.
R&D reductionsFrom a business perspective, mergers and acquisitions are often considered to be attractive as they remove duplication, reduce costs and produce synergies. Furthermore, in the early days of mergers in the phar-maceutical industry, organizations often described them as being part of a growth story. In these situations — for example, the merger of Bristol Myers with Squibb in 1989 — the R&D divisions were fused. Programme overlap was minimized and new projects were added, and major R&D cuts did not occur.
This has changed radically in the past decade. In major mergers today, not only are R&D cuts made, but entire research sites are eliminated. Nowhere is this more evident than with Pfizer. Before 1999, Pfizer had never made a major acquisition. Over the next decade, it acquired three large companies — Warner-Lambert (in 2000), Pharmacia (in 2003) and Wyeth (in 2009) — and multiple smaller companies, such as Vicuron, Rinat and Esperion (Supplementary information S1 (figure)). Over this time frame, to meet its business objectives (a euphemism for raising its stock price) Pfizer closed
COMMENT
NATURE REVIEWS | DRUG DISCOVERY VOLUME 10 | AUGUST 2011 | 559
nrd_3514_aug11.indd 559 19/07/2011 15:03
Num
ber o
f dru
gs
0
20
40
60
80
100
120
I II IIIPhase Region
10
20
30
40
50
60
70
80
Num
ber o
f dru
gs
0CN US EU
CancerInfectionCardiovascularCentral nervous systemEndocrine/metabolism
MusculoskeletalRespiratoryGenitourinalGastrointestinalOthers
R&D IN CHINA | MARKET INDICATORS
▶
in 1984, but until it was amended in 1992, pharmaceutical compositions were not patentable. Now, the patent system has evolved to provide greater protection for innovative drugs. The final judgment from the Beijing High People’s Court in 2007 on the patent dispute over sildenafil (Viagra; Pfizer) is one example. The
judgment rejected the patent challenge from 12 domestic generics companies, effectively providing patent protection for sildenafil until 2014. Interestingly, the patent that was under dispute is a method-of-use patent, which is more vulnerable to challenges from generics companies than compound patents.
Third, to improve investment, ChiNext, China’s ‘NASDAQ’, was launched in 2009, focusing on innovative enterprises and other fledgling venture enterprises. ChiNext provides an important exit for investment, such as venture capital in the field of innovative R&D. Fourth, China initiated a health-care reform plan in 2009, which will create a demand for innovative pharmaceutical products in the years to come. Finally, with regard to talent, the current wave of returnees to China includes many experienced professionals from pharmaceutical and biotechnology companies elsewhere in the world.
In conclusion, although the innovative pharmaceutical industry in China is still in the early stages of development, it has progressed rapidly in the past decade. Moreover, China has made considerable improvements and continues to improve the key factors — regulatory systems, patent protection, basic research, investment, talent and market incentives — for the creation of a first-class environment for innovative drug R&D.
Jingzong Qi and Xin Chen are at FusoGen Pharmaceuticals,19F-A, Ping An Building B, 59
Machang Road, Hexi District, Tianjin 300203, China.
Qingli Wang is at the Center for Drug Evaluation, State Food and Drug Administration, Beijing 100038, China.
Zhenhang Yu is at the China National Center for Biotechnology Development, Beijing 100039, China.
Fengshan Wang is at the Institute of Biochemical and Biotechnological Drugs, School of Pharmaceutical
Sciences, Shandong University, Jinan 250012, Shandong, China.
Correspondence to F.W. e-mail: [email protected]
1. IMS Intelligence Applied. IMS Health forecasts global pharmaceutical market growth of 5-7 percent in 2011, reaching $880 billion. IMS website [online], http://www.imshealth.com/portal/site/imshealth/menuitem.a46c6d4df3db4b3d88f611019418c22a/?vgnextoid=119717f27128b210VgnVCM100000ed152ca2RCRD&cpsextcurrchannel=1 (2010).
Competing financial interestsThe authors declare no competing financial interests.
Table 1 | Novel drugs in clinical trials with issued compound patents in the US or EU
Compound Developer Therapeutic area Patent Stage
Iptakalim Nhwa Cardiovascular EU III
Aildenafil Wannianchun Genitourinal US III
Cymipristone Xianju Genitourinal US/EU III
Icotinib Beida Cancer US III
rSIFN Huiyang Cancer US/EU III
Sulcardine SIMM Cardiovascular US/EU II
Trichosanthin Xiangtianmu Infection US II
Sifuvirtide FusoGen Infection US/EU II
Chiglitazar Chipscreen Endocrine/metabolism US II
Tyroservatide Yitai Cancer US II
Trantinterol Jiutai Respiratory US/EU II
Chidamide Chipscreen Cancer US II
Buagafuran SIMM Central nervous system US I
Ethaselen Qizheng Cancer US I
Nemonoxacin Huayu Infection US/EU I
Albuvirtide Frontier Infection US I
Thienorphine IPT Central nervous system US/EU I
Triptolide SIMM Musculoskeletal US I
Novaferon Genova Cancer US I
PEG-rhArginase BCT Cancer EU I
yPEG–rhGCSF Amoytop Cancer EU I
yPEG–rhGH Amoytop Endocrine/metabolism EU I
Citricplatin Sansiweier Cancer US/EU I
yPEG–rhIFNα2a Amoytop Infection EU I
EU, European Union; GCSF, granulocyte colony-stimulating factor; GH, growth hormone; IPT, Institute of Pharmacology and Toxicology; PEG, polyethylene glycol; rh, recombinant human; rSIFN, recombinant super compound interferon (IFN); SIMM, Shanghai Institute of Materia Medica; SIPI, Shanghai Institute of Pharmaceutical Industry; US, United States of America; yPEG, Y-shape branched PEG.
Figure 2 | Characteristics of novel investigational drugs in China. a | Number of drugs in each phase of clinical trials. b | Indications of these drugs. c | Patent protection of these drugs. Some drugs have patent protection not only in China (CN), but also in the United States (US) or the European Union (EU). Data were collected by the end of 2010 from websites of the Chinese State Food and Drug Administration (SFDA) and the Center for Drug Evaluation of the SFDA, the Chinese State Intellectual Property Office, the US Patent and Trademark Office, the European Patent Office and company press releases.
N E W S & A N A LY S I S
334 | MAY 2011 | VOLUME 10 www.nature.com/reviews/jrnl
nrd_3435_may11.indd 334 14/04/2011 11:49
First published in Nature Reviews Drug Discovery 10, 559-560 (August 2011); doi: 10.1038/nrd3514
60 | OCTOBER 2011 | THE FUTURE OF DRUG INNOVATION | NATURE REPRINT COLLECTION www.nature.com/reprintcollections/lilly/drug-innovation
Crowd sourcing in drug discoveryCrowd sourcing is emerging as an open-innovation approach to promote collaboration and harness the complementary expertise of academic and industrial partners in the early stages of drug discovery. Here, we highlight examples of such initiatives and discuss key success factors.
Greater collaboration between academic institutions and the pharmaceutical industry is increasingly being pur-sued to access and foster innovation in the early stages of drug discovery. The hope is that such collaborations could help to address the need to improve research and development (R&D) productivity in industry1, and also enable academic institutions to more effectively exploit the translational potential of their research. Although there are a growing number of examples of industry collaborating closely with a major academic partner, approaches that harness the expertise of a larger sci-entific community to address a specific question have been more limited. Nevertheless, using the internet as a platform, an open-innovation model known as ‘crowd sourcing’2 is now being tested in early-stage drug dis-covery by several organizations. This model has suc-cessfully been used in other sectors (for example, the Procter & Gamble connect and develop portal (www.pgconnectdevelop.com) through which consumers can put forward their ideas for product improvements or novel products).
Applications of crowd sourcingOriginally, crowd sourcing was defined as a mechanism by which specific problems are communicated to an unknown group of potential solvers in the form of an open call, usually via the internet; the community (the crowd) is asked to provide solutions and the ‘winners’ are rewarded. In 2001, Eli Lilly was the first company to introduce this concept in drug discovery, with the estab-lishment of the InnoCentive platform (www.innocen-tive.com). Organizations in need of answers (seekers) post specific questions (challenges) on an internet mar-ketplace. The web community can then provide solu-tions to the challenge (solvers). In each challenge, the seeking company can select the ‘best’ solution and the winning solver transfers the intellectual property (IP) to the seeker in return for a financial reward. InnoCentive is now an independent organization with a solver com-munity of more than 200,000 experts from more than 20 countries.
Further crowd sourcing initiatives in the area of early-stage drug discovery have followed in the past 2 years (see Supplementary information S1 (table) for more
details of the examples discussed below). Importantly, in contrast to the classical concept of crowd sourcing, in which the task is finished once the solution has been provided, the goal of these initiatives is to seek novel ideas that are then pursued further in a more collabora-tive approach. The key benefits are that potential solvers, most of whom are researchers in academic institutes or small companies, gain access to specific tools or knowl-edge, such as data, assays, compounds or drug discovery expertise in large pharmaceutical companies, whereas the searching organization gains novel ideas, targets, compounds or tools (such as novel assays or models) that help to address a specific challenge.
For example, in May 2009 Bayer Healthcare intro-duced its Grants4Targets initiative (G4T; www.grant-s4targets.com)3, the goal of which is to discover new therapeutic options by bringing together knowledge on potential novel targets in academia with drug devel-opment expertise within the company. Grants for the validation of innovative targets in oncology, cardiology, molecular imaging and gynaecology are provided for a period of 1 year. To promote the validation process and generate value for both partners, senior scientists from the company are appointed to support the projects with expertise and tools. Three types of grants are provided (support, focus and collaborative), and IP remains fully with the applicants for the support and the focus grants3. After the grant period, promising targets may be pursued further via collaborative agreements. So far, four calls have been completed, more than 380 grant applications have been received, and 59 grants have been awarded to academic groups worldwide3.
A similar approach was recently initiated by MRC Technology (MRCT), the technology transfer arm of the Medical Research Council (MRC) UK. MRCT’s Centre for Therapeutics Discovery is focused on ‘de-risking’ early-stage academic projects in areas of substantial unmet medical need, showing their potential in pre-clinical models before partnering with industry. This resource was originally developed to translate MRC-based research, but in 2010 they started their Call for Targets programme (www.callfortargets.org) to identify early-stage projects from non-MRC sources. The review process has two stages: an initial triage, which is followed
Monika Lessl and Khusru Asadullah are at Global Drug Discovery Bayer HealthCare Pharmaceuticals, Muellerstraße 178, 13342 Berlin, Germany. Justin. S. Bryans is at the Centre for Therapeutics Discovery, MRC Technology, 1–3 Burtonhole Lane, London NW7 1AD, UK. Duncan Richards is at GlaxoSmithKIine, Academic Discovery Performance Unit, Medicines Research Centre, Stevenage SG1 2NY, UK. Correspondence to M.L. e-mail: [email protected]
COMMENT
NATURE REVIEWS | DRUG DISCOVERY VOLUME 10 | APRIL 2011 | 241
nrd_3412_apr11.indd 241 17/03/2011 11:40
numerous research sites in the United States, includ-ing those at Kalamazoo, Michigan (formerly a site for Upjohn), Ann Arbor, Michigan (formerly a site for Warner-Lambert) and Skokie, Illinois (formerly a site for Searle). It has also recently announced the closure of the Sandwich site in the UK. These sites housed thou-sands of scientists, and many major drugs — such as atorvastatin (Lipitor), amlodipine (Norvasc) and silde-nafil (Viagra) — were discovered there. The same pat-tern has been observed after most of the mergers and acquisitions by other major pharmaceutical companies during the past decade.
There is another key aspect to such cuts. Historically, the pharmaceutical industry has prided itself on invest-ing more in R&D (as a percentage of revenues) than any other industry. At times, companies have invested as much as 20% of top-line revenues into their pipeline. However, Pfizer now projects that in 2012 this figure will only be 11% (between US$6.5 and $7 billion). The extent of this decrease is further emphasized by com-parison with the pre-merger R&D expenses of Pfizer and Wyeth in 2008: $7.95 billion and $3.37 billion, respec-tively, and $11.3 billion in total. Other large pharma-ceutical companies have announced similar cuts in recent years.
Thus, at a time when our understanding of the basis of diseases continues to increase substantially, the ability to exploit this information in the private sector is being compromised. It is hard to envision that R&D output, as measured by new drug approvals, will improve in the coming years based on this reduced investment.
Pipeline advancementAfter a major merger, the rate of progress of compounds in the development pipeline seems to decrease. For example, comparing data from Pfizer’s pipeline updates (which are posted on its website every 6 months) before the Wyeth merger in February 2008, and in February 2011, reveals that 40% of the compounds (not including those from Wyeth) have been in Phase II development for more than 3 years, which is below the industry aver-age (J. Arrowsmith, personal communication).
Indeed, R&D seems to be especially vulnerable to the negative impact of mergers and acquisitions. Having a sense of how mergers occur in R&D organizations is helpful for understanding this impact. R&D organi-zations will be the last part of the companies to begin merger discussions before regulatory approval because of the commercial sensitivity of the pipeline and the intellectual property of the company. And when the discussions about integrating the R&D organiza-tions finally occur, the initial focus is on Phase III programmes, followed by mid-stage candidates, with the early-stage discovery programmes handled last. These reviews are extensive and time-consuming, as they require careful consideration of scientific issues such as efficacy and safety data for each programme, as well as commercial issues such as potential duplica-tion and strategic directions of the merged company. In addition, research organizations often differ proce-durally in some fundamental processes such as IT
platforms, data handling or adverse event monitoring. Establishing which system to use or creating a hybrid takes substantial time for decision-making as well as implementation.
It is easy to see how early-stage R&D will be slowed in such situations, as during this period — which can take at least 9 months — generally no new programmes are started and hiring will be frozen. Undergoing one merger will have a substantial negative impact on the momentum of research programmes, but enduring this multiple times can be crippling.
Social consequencesFor individual employees of companies that are in the process of merging, uncertainty about their future is often high. It is hard to quantify the impact that such uncertainty has on productivity, except that it is nega-tive, and probably strongly so in many cases. Leaders of organizations who have completed multiple mergers may express the view: “We’ve done this before and we know how to do it.” Mechanically, this may be true, but for many employees who survive mergers, the thought of repeating the exercise is not embraced, and could prove to be numbing to their motivation.
Going forwardIt is unlikely that the era of large mergers in the phar-maceutical industry has ended. However, as a strategy to achieve top-line growth, it has a clear flaw — if the R&D engine is not growing robustly enough to keep pace, more mergers and acquisitions will be needed to continue growth.
Not all CEOs of major pharmaceutical companies believe in this strategy; for example, John Lechleiter, CEO of Lilly, has stated his opposition to large-scale combination. And not all CEOs of merged companies believe in cutting back R&D; for example, Merck’s new CEO, Kenneth Frazier, has recently stated that Merck will focus on investing in drug development to drive growth. Whether other leaders in the pharmaceutical industry will come around to the views of Lechleiter and Frazier remains to be seen. However, the experience from the past decade on the negative impact of merg-ers and acquisitions on R&D productivity should make these leaders pause when considering major mergers in the future.
Such mergers should also be concerning to patients, physicians and payers, particularly bearing in mind recent cutbacks in areas of research such as antibacte-rial drugs and neuroscience. Industry consolidation has resulted in less competition and less investment in R&D. At a time when there is a major need for new treatments for conditions such as Alzheimer’s disease, drug-resistant infections and diabetes, such a trend is alarming.1. Paul, S. M. et al. How to improve R&D productivity: the
pharmaceutical industry’s grand challenge. Nature Rev. Drug Discov. 9, 203–214 (2010).
2. Garnier, J.-P. Rebuilding the R&D engine in Big Pharma. Harvard Bus. Rev. 86, 68–76 (2008).
3. Munos, B. Lessons from 60 years of pharmaceutical innovation. Nature Rev. Drug Discov. 8, 959–968 (2009).
Competing interests statementThe author declares no competing financial interests.
560 | AUGUST 2011 | VOLUME 10 www.nature.com/reviews/drugdisc
C O M M E N T
nrd_3514_aug11.indd 560 19/07/2011 15:03
www.nature.com/reprintcollections/lilly/drug-innovation NATURE REPRINT COLLECTION | THE FUTURE OF DRUG INNOVATION | OCTOBER 2011 | 61
Crowd sourcing in drug discoveryCrowd sourcing is emerging as an open-innovation approach to promote collaboration and harness the complementary expertise of academic and industrial partners in the early stages of drug discovery. Here, we highlight examples of such initiatives and discuss key success factors.
Greater collaboration between academic institutions and the pharmaceutical industry is increasingly being pur-sued to access and foster innovation in the early stages of drug discovery. The hope is that such collaborations could help to address the need to improve research and development (R&D) productivity in industry1, and also enable academic institutions to more effectively exploit the translational potential of their research. Although there are a growing number of examples of industry collaborating closely with a major academic partner, approaches that harness the expertise of a larger sci-entific community to address a specific question have been more limited. Nevertheless, using the internet as a platform, an open-innovation model known as ‘crowd sourcing’2 is now being tested in early-stage drug dis-covery by several organizations. This model has suc-cessfully been used in other sectors (for example, the Procter & Gamble connect and develop portal (www.pgconnectdevelop.com) through which consumers can put forward their ideas for product improvements or novel products).
Applications of crowd sourcingOriginally, crowd sourcing was defined as a mechanism by which specific problems are communicated to an unknown group of potential solvers in the form of an open call, usually via the internet; the community (the crowd) is asked to provide solutions and the ‘winners’ are rewarded. In 2001, Eli Lilly was the first company to introduce this concept in drug discovery, with the estab-lishment of the InnoCentive platform (www.innocen-tive.com). Organizations in need of answers (seekers) post specific questions (challenges) on an internet mar-ketplace. The web community can then provide solu-tions to the challenge (solvers). In each challenge, the seeking company can select the ‘best’ solution and the winning solver transfers the intellectual property (IP) to the seeker in return for a financial reward. InnoCentive is now an independent organization with a solver com-munity of more than 200,000 experts from more than 20 countries.
Further crowd sourcing initiatives in the area of early-stage drug discovery have followed in the past 2 years (see Supplementary information S1 (table) for more
details of the examples discussed below). Importantly, in contrast to the classical concept of crowd sourcing, in which the task is finished once the solution has been provided, the goal of these initiatives is to seek novel ideas that are then pursued further in a more collabora-tive approach. The key benefits are that potential solvers, most of whom are researchers in academic institutes or small companies, gain access to specific tools or knowl-edge, such as data, assays, compounds or drug discovery expertise in large pharmaceutical companies, whereas the searching organization gains novel ideas, targets, compounds or tools (such as novel assays or models) that help to address a specific challenge.
For example, in May 2009 Bayer Healthcare intro-duced its Grants4Targets initiative (G4T; www.grant-s4targets.com)3, the goal of which is to discover new therapeutic options by bringing together knowledge on potential novel targets in academia with drug devel-opment expertise within the company. Grants for the validation of innovative targets in oncology, cardiology, molecular imaging and gynaecology are provided for a period of 1 year. To promote the validation process and generate value for both partners, senior scientists from the company are appointed to support the projects with expertise and tools. Three types of grants are provided (support, focus and collaborative), and IP remains fully with the applicants for the support and the focus grants3. After the grant period, promising targets may be pursued further via collaborative agreements. So far, four calls have been completed, more than 380 grant applications have been received, and 59 grants have been awarded to academic groups worldwide3.
A similar approach was recently initiated by MRC Technology (MRCT), the technology transfer arm of the Medical Research Council (MRC) UK. MRCT’s Centre for Therapeutics Discovery is focused on ‘de-risking’ early-stage academic projects in areas of substantial unmet medical need, showing their potential in pre-clinical models before partnering with industry. This resource was originally developed to translate MRC-based research, but in 2010 they started their Call for Targets programme (www.callfortargets.org) to identify early-stage projects from non-MRC sources. The review process has two stages: an initial triage, which is followed
Monika Lessl and Khusru Asadullah are at Global Drug Discovery Bayer HealthCare Pharmaceuticals, Muellerstraße 178, 13342 Berlin, Germany. Justin. S. Bryans is at the Centre for Therapeutics Discovery, MRC Technology, 1–3 Burtonhole Lane, London NW7 1AD, UK. Duncan Richards is at GlaxoSmithKIine, Academic Discovery Performance Unit, Medicines Research Centre, Stevenage SG1 2NY, UK. Correspondence to M.L. e-mail: [email protected]
COMMENT
NATURE REVIEWS | DRUG DISCOVERY VOLUME 10 | APRIL 2011 | 241
nrd_3412_apr11.indd 241 17/03/2011 11:40
numerous research sites in the United States, includ-ing those at Kalamazoo, Michigan (formerly a site for Upjohn), Ann Arbor, Michigan (formerly a site for Warner-Lambert) and Skokie, Illinois (formerly a site for Searle). It has also recently announced the closure of the Sandwich site in the UK. These sites housed thou-sands of scientists, and many major drugs — such as atorvastatin (Lipitor), amlodipine (Norvasc) and silde-nafil (Viagra) — were discovered there. The same pat-tern has been observed after most of the mergers and acquisitions by other major pharmaceutical companies during the past decade.
There is another key aspect to such cuts. Historically, the pharmaceutical industry has prided itself on invest-ing more in R&D (as a percentage of revenues) than any other industry. At times, companies have invested as much as 20% of top-line revenues into their pipeline. However, Pfizer now projects that in 2012 this figure will only be 11% (between US$6.5 and $7 billion). The extent of this decrease is further emphasized by com-parison with the pre-merger R&D expenses of Pfizer and Wyeth in 2008: $7.95 billion and $3.37 billion, respec-tively, and $11.3 billion in total. Other large pharma-ceutical companies have announced similar cuts in recent years.
Thus, at a time when our understanding of the basis of diseases continues to increase substantially, the ability to exploit this information in the private sector is being compromised. It is hard to envision that R&D output, as measured by new drug approvals, will improve in the coming years based on this reduced investment.
Pipeline advancementAfter a major merger, the rate of progress of compounds in the development pipeline seems to decrease. For example, comparing data from Pfizer’s pipeline updates (which are posted on its website every 6 months) before the Wyeth merger in February 2008, and in February 2011, reveals that 40% of the compounds (not including those from Wyeth) have been in Phase II development for more than 3 years, which is below the industry aver-age (J. Arrowsmith, personal communication).
Indeed, R&D seems to be especially vulnerable to the negative impact of mergers and acquisitions. Having a sense of how mergers occur in R&D organizations is helpful for understanding this impact. R&D organi-zations will be the last part of the companies to begin merger discussions before regulatory approval because of the commercial sensitivity of the pipeline and the intellectual property of the company. And when the discussions about integrating the R&D organiza-tions finally occur, the initial focus is on Phase III programmes, followed by mid-stage candidates, with the early-stage discovery programmes handled last. These reviews are extensive and time-consuming, as they require careful consideration of scientific issues such as efficacy and safety data for each programme, as well as commercial issues such as potential duplica-tion and strategic directions of the merged company. In addition, research organizations often differ proce-durally in some fundamental processes such as IT
platforms, data handling or adverse event monitoring. Establishing which system to use or creating a hybrid takes substantial time for decision-making as well as implementation.
It is easy to see how early-stage R&D will be slowed in such situations, as during this period — which can take at least 9 months — generally no new programmes are started and hiring will be frozen. Undergoing one merger will have a substantial negative impact on the momentum of research programmes, but enduring this multiple times can be crippling.
Social consequencesFor individual employees of companies that are in the process of merging, uncertainty about their future is often high. It is hard to quantify the impact that such uncertainty has on productivity, except that it is nega-tive, and probably strongly so in many cases. Leaders of organizations who have completed multiple mergers may express the view: “We’ve done this before and we know how to do it.” Mechanically, this may be true, but for many employees who survive mergers, the thought of repeating the exercise is not embraced, and could prove to be numbing to their motivation.
Going forwardIt is unlikely that the era of large mergers in the phar-maceutical industry has ended. However, as a strategy to achieve top-line growth, it has a clear flaw — if the R&D engine is not growing robustly enough to keep pace, more mergers and acquisitions will be needed to continue growth.
Not all CEOs of major pharmaceutical companies believe in this strategy; for example, John Lechleiter, CEO of Lilly, has stated his opposition to large-scale combination. And not all CEOs of merged companies believe in cutting back R&D; for example, Merck’s new CEO, Kenneth Frazier, has recently stated that Merck will focus on investing in drug development to drive growth. Whether other leaders in the pharmaceutical industry will come around to the views of Lechleiter and Frazier remains to be seen. However, the experience from the past decade on the negative impact of merg-ers and acquisitions on R&D productivity should make these leaders pause when considering major mergers in the future.
Such mergers should also be concerning to patients, physicians and payers, particularly bearing in mind recent cutbacks in areas of research such as antibacte-rial drugs and neuroscience. Industry consolidation has resulted in less competition and less investment in R&D. At a time when there is a major need for new treatments for conditions such as Alzheimer’s disease, drug-resistant infections and diabetes, such a trend is alarming.1. Paul, S. M. et al. How to improve R&D productivity: the
pharmaceutical industry’s grand challenge. Nature Rev. Drug Discov. 9, 203–214 (2010).
2. Garnier, J.-P. Rebuilding the R&D engine in Big Pharma. Harvard Bus. Rev. 86, 68–76 (2008).
3. Munos, B. Lessons from 60 years of pharmaceutical innovation. Nature Rev. Drug Discov. 8, 959–968 (2009).
Competing interests statementThe author declares no competing financial interests.
560 | AUGUST 2011 | VOLUME 10 www.nature.com/reviews/drugdisc
C O M M E N T
nrd_3514_aug11.indd 560 19/07/2011 15:03
First published in Nature Reviews Drug Discovery 10, 241-242 (April 2011); doi:10.1038/nrd3412
62 | OCTOBER 2011 | THE FUTURE OF DRUG INNOVATION | NATURE REPRINT COLLECTION www.nature.com/reprintcollections/lilly/drug-innovation
A g U i D E To D R U g D i S C ov E Ry — o p i n i o n
The future of drug development: advancing clinical trial designJohn Orloff, Frank Douglas, Jose Pinheiro, Susan Levinson, Michael Branson, Pravin Chaturvedi, Ene Ette, Paul Gallo, Gigi Hirsch, Cyrus Mehta, Nitin Patel, Sameer Sabir, Stacy Springs, Donald Stanski, Matthias R. Evers, Edd Fleming, Navjot Singh, Tony Tramontin and Howard Golub
Abstract | Declining pharmaceutical industry productivity is well recognized by drug developers, regulatory authorities and patient groups. A key part of the problem is that clinical studies are increasingly expensive, driven by the rising costs of conducting Phase ii and iii trials. it is therefore crucial to ensure that these phases of drug development are conducted more efficiently and cost-effectively, and that attrition rates are reduced. in this article, we argue that moving from the traditional clinical development approach based on sequential, distinct phases towards a more integrated view that uses adaptive design tools to increase flexibility and maximize the use of accumulated knowledge could have an important role in achieving these goals. Applications and examples of the use of these tools — such as Bayesian methodologies — in early- and late-stage drug development are discussed, as well as the advantages, challenges and barriers to their more widespread implementation.
Pharmaceutical innovation is increasingly risky, costly and at times inefficient, which has led to decreased industry productivity1–3. estimates for the average cost of bringing a new drug to market range between $800 million and $2 billion, in which late-stage failures and the rising costs of Phase II and III trials represent key components4–9. Conducting these phases of development more effectively and reducing attrition rates are therefore major goals. The problem of attrition is particularly acute in Phase II trials10, owing to factors such as the lack of proof of relevance for the biological target in a given disease intervention and insufficient understanding of the dose–response relationship of the new molecular entity.
as recognized by the US Food and drug administration (Fda) Critical Path Initiative, novel approaches to clinical trial and programme design could have a key role in overcoming these challenges. The traditional approach to drug development separates clinical development into sequential, distinct phases, in which progress is measured at discrete milestones, separated by ‘white space’. We argue that the effective-ness of the clinical development can be improved by adopting a more integrated model that increases flexibility and maxi-mizes the use of accumulated knowledge.
In this model, broader, more flexible phases leading to submission for approval are designated ‘exploratory’ and ‘confirmatory’ (FIG. 1). This model is adaptive, parallel and data-led, and allows all available knowledge to be appropriately shared across the breadth of development studies to improve the quality, timeliness and efficiency of the process.
Central to this model of drug develop-ment are novel tools, including modelling and simulation, Bayesian methodologies, and adaptive designs, such as seamless adaptive designs and sample-size re-estimation methods (BOX 1). These can ensure the judi-cious use of limited patient resources, reduce patient exposure to ineffective or poorly tolerated doses, and lead to the recruitment of patients who, on the basis of biomarker analysis, are most likely to respond and those with the most favourable benefit/risk ratio.
In this article, we describe the general issues and methods involved, and illustrate how the tools can be applied in both explora-tory and confirmatory drug development by using specific cases in which modern trial designs and statistical approaches have been successful. We hope to raise awareness of these issues among those involved in clinical trials and provide guidelines to ensure that
the most appropriate solutions are imple-mented, with the ultimate goal of increasing the efficiency and probability of success in clinical development.
Exploratory phase of developmentModelling is a key feature of the more integrated approach to drug development (FIG. 1). Biological modelling is used to under-stand genetic, biochemical and physiological networks, as well as pathways and processes underlying disease and pharmacotherapy11,12. Pharmacological modelling guides clinical trial design, dose selection and development strategies13,14. Finally, statistical modelling can be used to assess development strategies and trial designs in populations11,12,15. These three types of modelling should be used throughout the drug development process to maximize their impact and synergies.
In the exploratory phase, modelling and simulation can help refine dose selection and study design. early development studies are conducted with fairly restricted resources (duration, sample sizes and so on), and the use of all available information is crucial for effective decision making16. However, it should be noted that early development decisions based on biomarkers that have not been fully qualified can be misguided if such biomarkers eventually do not prove to correlate with, or be predictive of, the final outcome. accordingly, it is important to conduct methodology research in parallel to the development programme to establish the correlation between the biomarker and late-stage endpoints or outcomes.
Modelling and simulation approaches can be used to represent dose–response and time–response behaviour of safety and efficacy endpoints. Furthermore, these approaches can be combined with Bayesian methods to provide a continuous flow of information across different phases of development. For example, preclinical data can be used to construct models and to provide prior information on model parameters. likewise, the results from a proof-of-concept (PoC) study can be used to form prior distributions for a similar model to be used in a subsequent dose-finding study11,12,17,18.
an additional benefit of modelling in early development is that it allows the use of external information (for example, baseline values for safety endpoints) to estimate char-acteristics of interest about the population. Given the vast quantity of data from other development programmes that are available in most pharmaceutical companies, as well as current discussions within the industry
P e r s P e c t i v e s
naTUre revIeWS | Drug Discovery volUMe 8 | deCeMBer 2009 | 949
nrd_persp_dec09.indd 949 16/11/09 13:57:40
by a full proposal that is reviewed in conjunction with an external panel of experts. Key criteria include target novelty, medical need, disease association, reagent avail-ability and structural data. So far, out of 112 proposals received, 52 projects have passed the triage and out of the 17 heard at full application stage, 13 have been accepted and collaborative projects have either started or are under negotiation. Projects are progressed as true collaborations between MRCT and the academic group and, impor-tantly, no transfer of IP rights is required — any IP that is developed as part of the collaboration is jointly owned and any revenue that is generated is split between the two parties under the terms of a pre-negotiated agreement.
Aiming for novel compounds rather than targets, Eli Lilly introduced its Phenotypic Drug Discovery pro-gramme (PD2; www.pd2.lilly.com) in June 2009 as a platform to search for novel chemical compounds with high structural diversity. Structures can be submitted via the internet and are evaluated by specific cheminfor-matics tools to determine whether they meet Eli Lilly-defined minimum criteria, such as structural novelty or drug-like properties. If a compound passes the first-line evaluation, Eli Lilly analyses the compound in a panel of phenotypic screens to evaluate whether the compound has activities linked to its key indications (Alzheimer’s disease, cancer, diabetes or bone formation). If the screen provides promising data (which are provided freely to the investigators), the compound can be evaluated fur-ther through either in-licensing or collaboration.
Another approach has been taken by GlaxoSmithKline with their Pharma in Partnership programme (www.pharmainpartnership.gsk.com), in which the company posts information on assets that are either potentially suitable for repurposing because they show clear phar-macology but have perhaps failed in their initial indi-cations, or that are novel targets for which additional information is required to validate the target or identify the optimal clinical indication. Academics are invited to register for updates as new molecules or mechanisms are posted, and to submit proposals to address the key question posed for that asset. The potential outcomes for successful proposals are flexible, ranging from a material transfer agreement for an in vitro study to full adoption as a GlaxoSmithKline clinical programme. One particu-lar expectation is that the successful proposals will lead to research collaborations with a substantial contribu-tion from the proposer. The programme was launched in April 2010, and since then five molecules/mechanisms have been posted. The first successful proposal has been identified and a collaboration is under negotiation.
Factors for successTo use crowd sourcing successfully, it is critical that the questions or challenges to be addressed are suitable, precisely defined and clearly presented, and that what is expected from potential solvers and offered by the
searching organization is clearly communicated. In the examples mentioned, the organizations are seeking novel targets or compounds in clearly defined indications, or additional therapeutic options for specific, well-defined compounds. Use of specific questions within the submis-sion template can guide the proposer to ensure that they are addressing the key questions. A precise definition of search terms (for example, ‘what is a target?’) avoids futile efforts. This also means that organizations have to be sufficiently transparent in explaining what they are interested in, and they have to overcome concerns regarding confidentiality of the information provided.
Operational implementation is another key success factor. An accessible internet submission tool that pro-vides a simple and transparent submission process is needed. A good example is the flow chart of the PD2 initiative. The transparency and speed of the evaluation procedure are important. In the case of the G4T pro-gramme, applicants receive feedback on the success of their application within 8 weeks of submission, and for Pharma in Partnership, feedback is sent within 28 days of the call closing. Low bureaucratic hurdles for both partners are also needed to make submissions attractive and manageable, and the IP policy should also be clearly defined. Pre-negotiated master contracts can facilitate rapid execution of agreements.
To generate awareness of the call, the initiative has to be communicated appropriately; for example, through scientific conferences, targeted advertising and mail-ings to relevant institutions, societies and field leaders. Finally, it is essential that proposer organizations are willing and ready to take up externally generated ideas. Collaboration with external parties needs particu-lar attention to relationship management and usually requires dedicated resources.
Crowd sourcing initiatives in drug discovery are still in their infancy, and whether they will have a substan-tial impact has yet to be proven. Nevertheless, an initial evaluation of the impact of the InnoCentive initiative was promising4, and our own experience so far suggests that such initiatives could provide an important source of future innovation in early-stage drug discovery.
Monika Lessl, Justin S. Bryans, Duncan Richards and Khusru Asadullah
1. Paul, S. M. et al. How to improve R&D productivity: the pharmaceutical industry’s grand challenge. Nature Rev. Drug. Discov. 9, 203–214 (2010).
2. Howe, J. (ed.) Crowdsourcing: Why the Power of the Crowd is Driving the Future of Business. (Crown Publishing Group, New York, 2008).
3. Lessl, M. et al. Grants4Targets — a novel approach to translate basic research to novel drugs. Drug Discov. Today 1 Dec 2010 (doi:10.1016/j.drudis.2010.11.013).
4. Bishop, M. The total economic impact of InnoCentive’s enterprise solution: challenges, InnoCentive@work and ONRAMP. (Forrester Business Consulting, Cambridge, Massachusetts, 2010).
Competing financial interestsThe authors declare competing financial interests: see Web version for details.
AcknowledgementsThe authors thank S. Schoepe for her valuable contributions in editing the manuscript.
242 | APRIL 2011 | VOLUME 10 www.nature.com/reviews/drugdisc
C O M M E N T
nrd_3412_apr11.indd 242 17/03/2011 11:40
www.nature.com/reprintcollections/lilly/drug-innovation NATURE REPRINT COLLECTION | THE FUTURE OF DRUG INNOVATION | OCTOBER 2011 | 63
A g U i D E To D R U g D i S C ov E Ry — o p i n i o n
The future of drug development: advancing clinical trial designJohn Orloff, Frank Douglas, Jose Pinheiro, Susan Levinson, Michael Branson, Pravin Chaturvedi, Ene Ette, Paul Gallo, Gigi Hirsch, Cyrus Mehta, Nitin Patel, Sameer Sabir, Stacy Springs, Donald Stanski, Matthias R. Evers, Edd Fleming, Navjot Singh, Tony Tramontin and Howard Golub
Abstract | Declining pharmaceutical industry productivity is well recognized by drug developers, regulatory authorities and patient groups. A key part of the problem is that clinical studies are increasingly expensive, driven by the rising costs of conducting Phase ii and iii trials. it is therefore crucial to ensure that these phases of drug development are conducted more efficiently and cost-effectively, and that attrition rates are reduced. in this article, we argue that moving from the traditional clinical development approach based on sequential, distinct phases towards a more integrated view that uses adaptive design tools to increase flexibility and maximize the use of accumulated knowledge could have an important role in achieving these goals. Applications and examples of the use of these tools — such as Bayesian methodologies — in early- and late-stage drug development are discussed, as well as the advantages, challenges and barriers to their more widespread implementation.
Pharmaceutical innovation is increasingly risky, costly and at times inefficient, which has led to decreased industry productivity1–3. estimates for the average cost of bringing a new drug to market range between $800 million and $2 billion, in which late-stage failures and the rising costs of Phase II and III trials represent key components4–9. Conducting these phases of development more effectively and reducing attrition rates are therefore major goals. The problem of attrition is particularly acute in Phase II trials10, owing to factors such as the lack of proof of relevance for the biological target in a given disease intervention and insufficient understanding of the dose–response relationship of the new molecular entity.
as recognized by the US Food and drug administration (Fda) Critical Path Initiative, novel approaches to clinical trial and programme design could have a key role in overcoming these challenges. The traditional approach to drug development separates clinical development into sequential, distinct phases, in which progress is measured at discrete milestones, separated by ‘white space’. We argue that the effective-ness of the clinical development can be improved by adopting a more integrated model that increases flexibility and maxi-mizes the use of accumulated knowledge.
In this model, broader, more flexible phases leading to submission for approval are designated ‘exploratory’ and ‘confirmatory’ (FIG. 1). This model is adaptive, parallel and data-led, and allows all available knowledge to be appropriately shared across the breadth of development studies to improve the quality, timeliness and efficiency of the process.
Central to this model of drug develop-ment are novel tools, including modelling and simulation, Bayesian methodologies, and adaptive designs, such as seamless adaptive designs and sample-size re-estimation methods (BOX 1). These can ensure the judi-cious use of limited patient resources, reduce patient exposure to ineffective or poorly tolerated doses, and lead to the recruitment of patients who, on the basis of biomarker analysis, are most likely to respond and those with the most favourable benefit/risk ratio.
In this article, we describe the general issues and methods involved, and illustrate how the tools can be applied in both explora-tory and confirmatory drug development by using specific cases in which modern trial designs and statistical approaches have been successful. We hope to raise awareness of these issues among those involved in clinical trials and provide guidelines to ensure that
the most appropriate solutions are imple-mented, with the ultimate goal of increasing the efficiency and probability of success in clinical development.
Exploratory phase of developmentModelling is a key feature of the more integrated approach to drug development (FIG. 1). Biological modelling is used to under-stand genetic, biochemical and physiological networks, as well as pathways and processes underlying disease and pharmacotherapy11,12. Pharmacological modelling guides clinical trial design, dose selection and development strategies13,14. Finally, statistical modelling can be used to assess development strategies and trial designs in populations11,12,15. These three types of modelling should be used throughout the drug development process to maximize their impact and synergies.
In the exploratory phase, modelling and simulation can help refine dose selection and study design. early development studies are conducted with fairly restricted resources (duration, sample sizes and so on), and the use of all available information is crucial for effective decision making16. However, it should be noted that early development decisions based on biomarkers that have not been fully qualified can be misguided if such biomarkers eventually do not prove to correlate with, or be predictive of, the final outcome. accordingly, it is important to conduct methodology research in parallel to the development programme to establish the correlation between the biomarker and late-stage endpoints or outcomes.
Modelling and simulation approaches can be used to represent dose–response and time–response behaviour of safety and efficacy endpoints. Furthermore, these approaches can be combined with Bayesian methods to provide a continuous flow of information across different phases of development. For example, preclinical data can be used to construct models and to provide prior information on model parameters. likewise, the results from a proof-of-concept (PoC) study can be used to form prior distributions for a similar model to be used in a subsequent dose-finding study11,12,17,18.
an additional benefit of modelling in early development is that it allows the use of external information (for example, baseline values for safety endpoints) to estimate char-acteristics of interest about the population. Given the vast quantity of data from other development programmes that are available in most pharmaceutical companies, as well as current discussions within the industry
P e r s P e c t i v e s
naTUre revIeWS | Drug Discovery volUMe 8 | deCeMBer 2009 | 949
nrd_persp_dec09.indd 949 16/11/09 13:57:40
by a full proposal that is reviewed in conjunction with an external panel of experts. Key criteria include target novelty, medical need, disease association, reagent avail-ability and structural data. So far, out of 112 proposals received, 52 projects have passed the triage and out of the 17 heard at full application stage, 13 have been accepted and collaborative projects have either started or are under negotiation. Projects are progressed as true collaborations between MRCT and the academic group and, impor-tantly, no transfer of IP rights is required — any IP that is developed as part of the collaboration is jointly owned and any revenue that is generated is split between the two parties under the terms of a pre-negotiated agreement.
Aiming for novel compounds rather than targets, Eli Lilly introduced its Phenotypic Drug Discovery pro-gramme (PD2; www.pd2.lilly.com) in June 2009 as a platform to search for novel chemical compounds with high structural diversity. Structures can be submitted via the internet and are evaluated by specific cheminfor-matics tools to determine whether they meet Eli Lilly-defined minimum criteria, such as structural novelty or drug-like properties. If a compound passes the first-line evaluation, Eli Lilly analyses the compound in a panel of phenotypic screens to evaluate whether the compound has activities linked to its key indications (Alzheimer’s disease, cancer, diabetes or bone formation). If the screen provides promising data (which are provided freely to the investigators), the compound can be evaluated fur-ther through either in-licensing or collaboration.
Another approach has been taken by GlaxoSmithKline with their Pharma in Partnership programme (www.pharmainpartnership.gsk.com), in which the company posts information on assets that are either potentially suitable for repurposing because they show clear phar-macology but have perhaps failed in their initial indi-cations, or that are novel targets for which additional information is required to validate the target or identify the optimal clinical indication. Academics are invited to register for updates as new molecules or mechanisms are posted, and to submit proposals to address the key question posed for that asset. The potential outcomes for successful proposals are flexible, ranging from a material transfer agreement for an in vitro study to full adoption as a GlaxoSmithKline clinical programme. One particu-lar expectation is that the successful proposals will lead to research collaborations with a substantial contribu-tion from the proposer. The programme was launched in April 2010, and since then five molecules/mechanisms have been posted. The first successful proposal has been identified and a collaboration is under negotiation.
Factors for successTo use crowd sourcing successfully, it is critical that the questions or challenges to be addressed are suitable, precisely defined and clearly presented, and that what is expected from potential solvers and offered by the
searching organization is clearly communicated. In the examples mentioned, the organizations are seeking novel targets or compounds in clearly defined indications, or additional therapeutic options for specific, well-defined compounds. Use of specific questions within the submis-sion template can guide the proposer to ensure that they are addressing the key questions. A precise definition of search terms (for example, ‘what is a target?’) avoids futile efforts. This also means that organizations have to be sufficiently transparent in explaining what they are interested in, and they have to overcome concerns regarding confidentiality of the information provided.
Operational implementation is another key success factor. An accessible internet submission tool that pro-vides a simple and transparent submission process is needed. A good example is the flow chart of the PD2 initiative. The transparency and speed of the evaluation procedure are important. In the case of the G4T pro-gramme, applicants receive feedback on the success of their application within 8 weeks of submission, and for Pharma in Partnership, feedback is sent within 28 days of the call closing. Low bureaucratic hurdles for both partners are also needed to make submissions attractive and manageable, and the IP policy should also be clearly defined. Pre-negotiated master contracts can facilitate rapid execution of agreements.
To generate awareness of the call, the initiative has to be communicated appropriately; for example, through scientific conferences, targeted advertising and mail-ings to relevant institutions, societies and field leaders. Finally, it is essential that proposer organizations are willing and ready to take up externally generated ideas. Collaboration with external parties needs particu-lar attention to relationship management and usually requires dedicated resources.
Crowd sourcing initiatives in drug discovery are still in their infancy, and whether they will have a substan-tial impact has yet to be proven. Nevertheless, an initial evaluation of the impact of the InnoCentive initiative was promising4, and our own experience so far suggests that such initiatives could provide an important source of future innovation in early-stage drug discovery.
Monika Lessl, Justin S. Bryans, Duncan Richards and Khusru Asadullah
1. Paul, S. M. et al. How to improve R&D productivity: the pharmaceutical industry’s grand challenge. Nature Rev. Drug. Discov. 9, 203–214 (2010).
2. Howe, J. (ed.) Crowdsourcing: Why the Power of the Crowd is Driving the Future of Business. (Crown Publishing Group, New York, 2008).
3. Lessl, M. et al. Grants4Targets — a novel approach to translate basic research to novel drugs. Drug Discov. Today 1 Dec 2010 (doi:10.1016/j.drudis.2010.11.013).
4. Bishop, M. The total economic impact of InnoCentive’s enterprise solution: challenges, InnoCentive@work and ONRAMP. (Forrester Business Consulting, Cambridge, Massachusetts, 2010).
Competing financial interestsThe authors declare competing financial interests: see Web version for details.
AcknowledgementsThe authors thank S. Schoepe for her valuable contributions in editing the manuscript.
242 | APRIL 2011 | VOLUME 10 www.nature.com/reviews/drugdisc
C O M M E N T
nrd_3412_apr11.indd 242 17/03/2011 11:40
First published in Nature Reviews Drug Discovery 8, 949-957 (December 2009); doi:10.1038/nrd3025
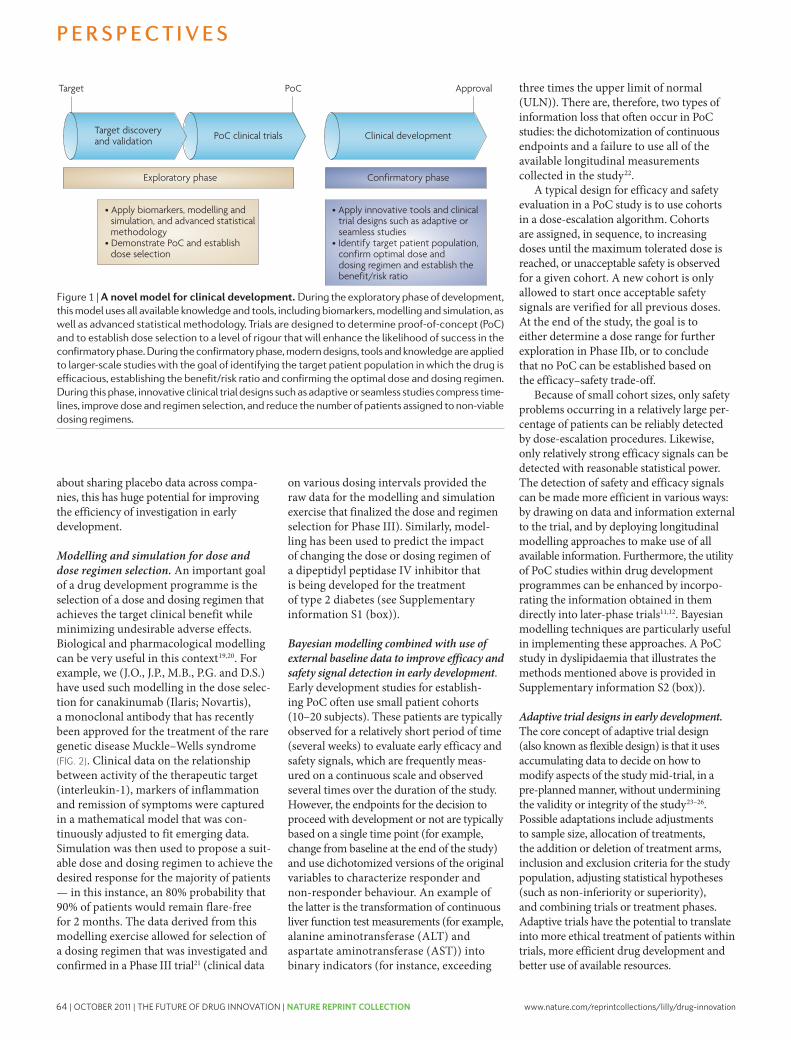
64 | OCTOBER 2011 | THE FUTURE OF DRUG INNOVATION | NATURE REPRINT COLLECTION www.nature.com/reprintcollections/lilly/drug-innovation
The standard approach to early develop-ment programmes is to separate the trials for PoC, dose ranging and dose selection. adaptive designs offer several benefits over the standard approach. For example, a PoC trial can be combined with a dose-ranging trial (BOX 2). This approach has distinct advantages, in that it reduces start-up costs and the time between trials, and potentially increases statistical power and improves
estimates of dose–response. adaptive designs can also enable trialists to work with more candidate doses without increasing sample size. This is important to reduce risk of failure in confirmatory trials, where it has been estimated that, industry-wide, 45% of Phase III programmes do not have the optimum dose3. adaptive dose-ranging studies are discussed further in BOX 3 (REFS 27,28).
There are a number of requirements for successful implementation of adaptive trial designs23–26. drug responses need to be rapidly observable relative to accrual rate; alternatively, good longitudinal models can be used to forecast endpoints in time to adapt dose assignments for future sub-jects (assuming, of course, that the early measurements are good predictors of the late endpoint values). adaptive trials also necessitate more up-front statistical work to model dose–response curves and to perform simulations — and many simulations are required to find the best combinations of sample size, the randomi-zation ratio between placebo and drug, starting dose and number of doses. This in turn demands efficient program-ming to develop complex algorithms and fast computing platforms.
Confirmatory phase of developmentThe primary goals of a confirmatory clinical trial are to ensure that the diagnostic or therapeutic intervention causes less harm than good (safety) and to efficiently and confidently find the actual effect size on the chosen primary outcome(s) within the identified patient population (efficacy). optimization of trial design during con-firmatory development holds the promise of greater success rates, improved efficiency, better detection of safety signals, compressed timelines, smaller overall programmes and lower attrition rates. a number of novel approaches to confirmatory development that can contribute to fulfilling this promise are highlighted below.
Seamless adaptive designs. efficiency of the drug development process can be increased through the use of seamless adaptive designs, which aim to combine objectives traditionally addressed in separate trials into a single trial25,29. a specific example is the seamless adaptive Phase II/III design addressing objectives normally achieved through separate Phase II and III trials. These trials are confirmatory in nature, as opposed to seamless adaptive trials in early development, which are essentially exploratory. The first stage of a seamless adaptive Phase II/III trial might be similar to a late-Phase II trial, with a control group and several treatment groups (for example, different dose levels of the same treatment). results are examined at the end of the first stage, and one or more of the treatment groups are selected to continue, along with the control group, into the trial’s second stage. The final analysis comparing the
Box 1 | Tools, methods and designs for enhancing clinical development
Here, we summarize some of the key tools, methods and designs that can be incorporated into the drug development process.
Modelling and simulation These techniques are a cornerstone of the novel drug development model. In the exploratory phase, modelling and simulation can help refine dose selection and study design, and to represent dose–response and time–response behaviour of safety and efficacy endpoints. In combination with Bayesian methods, these can provide a continuous flow of information across different phases of development. Modelling in early development also enables the use of external information (an important issue in light of current discussions within the industry about sharing placebo data across companies), which could greatly increase the efficiency of investigations in early development.
In the confirmatory phase, simulation can clarify how different study designs affect the outcome and likelihood of success, thereby guiding development strategy. In the latter case, this is facilitated by pooling many sources of data both from prior studies of the drug and external data that might be an informative guide to achieve better decision-making. Furthermore, these techniques can be used not just during the trial-design process, but also mid-study through the use of adaptive trial designs.
Bayesian methodology This relies on the use of probability models to describe knowledge about parameters of interest (for example, the treatment effect of a drug in development). Bayesian inference uses principles from the scientific method to combine prior beliefs with observed data, producing enhanced, updated information (for reviews, see REFS 22,23). Using Bayesian methodologies, initial beliefs about the parameters are summarized in their prior distribution. Then, new data values are collected experimentally (for example, patient survival in an oncology trial) and the probability distribution of these values leads to the likelihood function (the observed evidence on the parameters). The two elements are then combined, using Bayes’ theorem, to produce the posterior distribution of the parameters — that is, the updated knowledge given the observed evidence. By contrast, frequentist methods rely solely on observed evidence for inferences, and typically do not formally take into account prior information.
Adaptive designs In adaptive trial designs, interim data from a trial is used to modify and improve the study design, in a pre-planned manner and without undermining its validity or integrity. In the exploratory setting, an adaptive trial can assign a larger proportion of the enrolled subjects to the treatment arms that are performing well, drop arms that are performing poorly, and investigate a wider range of doses so as to more effectively select doses that are most likely to succeed in the confirmatory phase. In the confirmatory phase, adaptive design can facilitate the early identification of efficacious treatments, decisions to drop poorly performing trial arms, determining whether the trial should be terminated for futility and making sample-size adjustments at interim time points to ensure that the trial is adequately powered. In some cases, it might even be possible to enrich the patient population by altering the eligibility criteria at an interim time point.
seamless designs Such designs combine, in a single trial, the objectives that are traditionally addressed in separate trials. A seamless adaptive design addresses objectives normally achieved through separate trials using data from all trial stages, such as seamless adaptive Phase II/III trials.
sample size re-estimation methods These provide the flexibility to either increase or decrease the sample size at an interim point in the trial. This is important in cases in which there is uncertainty about between-subject variance in the response or uncertainty about the clinically meaningful effect size at which to power the trial. These methods allow the study to begin with a certain sample size that can be increased or decreased at an interim point, and even allow for an efficacy-stopping boundary.
P e r s P e c t i v e s
naTUre revIeWS | Drug Discovery volUMe 8 | deCeMBer 2009 | 951
nrd_persp_dec09.indd 951 16/11/09 13:57:41
Target PoC Approval
Nature Reviews | Drug Discovery
• Apply innovative tools and clinical trial designs such as adaptive or seamless studies• Identify target patient population, confirm optimal dose and dosing regimen and establish the benefit/risk ratio
• Apply biomarkers, modelling and simulation, and advanced statistical methodology• Demonstrate PoC and establish dose selection
Exploratory phase Confirmatory phase
Target discovery and validation PoC clinical trials Clinical development
about sharing placebo data across compa-nies, this has huge potential for improving the efficiency of investigation in early development.
Modelling and simulation for dose and dose regimen selection. an important goal of a drug development programme is the selection of a dose and dosing regimen that achieves the target clinical benefit while minimizing undesirable adverse effects. Biological and pharmacological modelling can be very useful in this context19,20. For example, we (J.o., J.P., M.B., P.G. and d.S.) have used such modelling in the dose selec-tion for canakinumab (Ilaris; novartis), a monoclonal antibody that has recently been approved for the treatment of the rare genetic disease Muckle–Wells syndrome (FIG. 2). Clinical data on the relationship between activity of the therapeutic target (interleukin-1), markers of inflammation and remission of symptoms were captured in a mathematical model that was con-tinuously adjusted to fit emerging data. Simulation was then used to propose a suit-able dose and dosing regimen to achieve the desired response for the majority of patients — in this instance, an 80% probability that 90% of patients would remain flare-free for 2 months. The data derived from this modelling exercise allowed for selection of a dosing regimen that was investigated and confirmed in a Phase III trial21 (clinical data
on various dosing intervals provided the raw data for the modelling and simulation exercise that finalized the dose and regimen selection for Phase III). Similarly, model-ling has been used to predict the impact of changing the dose or dosing regimen of a dipeptidyl peptidase Iv inhibitor that is being developed for the treatment of type 2 diabetes (see Supplementary information S1 (box)).
Bayesian modelling combined with use of external baseline data to improve efficacy and safety signal detection in early development. early development studies for establish-ing PoC often use small patient cohorts (10–20 subjects). These patients are typically observed for a relatively short period of time (several weeks) to evaluate early efficacy and safety signals, which are frequently meas-ured on a continuous scale and observed several times over the duration of the study. However, the endpoints for the decision to proceed with development or not are typically based on a single time point (for example, change from baseline at the end of the study) and use dichotomized versions of the original variables to characterize responder and non-responder behaviour. an example of the latter is the transformation of continuous liver function test measurements (for example, alanine aminotransferase (alT) and aspartate aminotransferase (aST)) into binary indicators (for instance, exceeding
three times the upper limit of normal (Uln)). There are, therefore, two types of information loss that often occur in PoC studies: the dichotomization of continuous endpoints and a failure to use all of the available longitudinal measurements collected in the study22.
a typical design for efficacy and safety evaluation in a PoC study is to use cohorts in a dose-escalation algorithm. Cohorts are assigned, in sequence, to increasing doses until the maximum tolerated dose is reached, or unacceptable safety is observed for a given cohort. a new cohort is only allowed to start once acceptable safety signals are verified for all previous doses. at the end of the study, the goal is to either determine a dose range for further exploration in Phase IIb, or to conclude that no PoC can be established based on the efficacy–safety trade-off.
Because of small cohort sizes, only safety problems occurring in a relatively large per-centage of patients can be reliably detected by dose-escalation procedures. likewise, only relatively strong efficacy signals can be detected with reasonable statistical power. The detection of safety and efficacy signals can be made more efficient in various ways: by drawing on data and information external to the trial, and by deploying longitudinal modelling approaches to make use of all available information. Furthermore, the utility of PoC studies within drug development programmes can be enhanced by incorpo-rating the information obtained in them directly into later-phase trials11,12. Bayesian modelling techniques are particularly useful in implementing these approaches. a PoC study in dyslipidaemia that illustrates the methods mentioned above is provided in Supplementary information S2 (box)).
Adaptive trial designs in early development. The core concept of adaptive trial design (also known as flexible design) is that it uses accumulating data to decide on how to modify aspects of the study mid-trial, in a pre-planned manner, without undermining the validity or integrity of the study23–26. Possible adaptations include adjustments to sample size, allocation of treatments, the addition or deletion of treatment arms, inclusion and exclusion criteria for the study population, adjusting statistical hypotheses (such as non-inferiority or superiority), and combining trials or treatment phases. adaptive trials have the potential to translate into more ethical treatment of patients within trials, more efficient drug development and better use of available resources.
Figure 1 | A novel model for clinical development. During the exploratory phase of development, this model uses all available knowledge and tools, including biomarkers, modelling and simulation, as well as advanced statistical methodology. Trials are designed to determine proof-of-concept (Poc) and to establish dose selection to a level of rigour that will enhance the likelihood of success in the confirmatory phase. During the confirmatory phase, modern designs, tools and knowledge are applied to larger-scale studies with the goal of identifying the target patient population in which the drug is efficacious, establishing the benefit/risk ratio and confirming the optimal dose and dosing regimen. During this phase, innovative clinical trial designs such as adaptive or seamless studies compress time-lines, improve dose and regimen selection, and reduce the number of patients assigned to non-viable dosing regimens.
P e r s P e c t i v e s
950 | deCeMBer 2009 | volUMe 8 www.nature.com/reviews/drugdisc
nrd_persp_dec09.indd 950 16/11/09 13:57:41
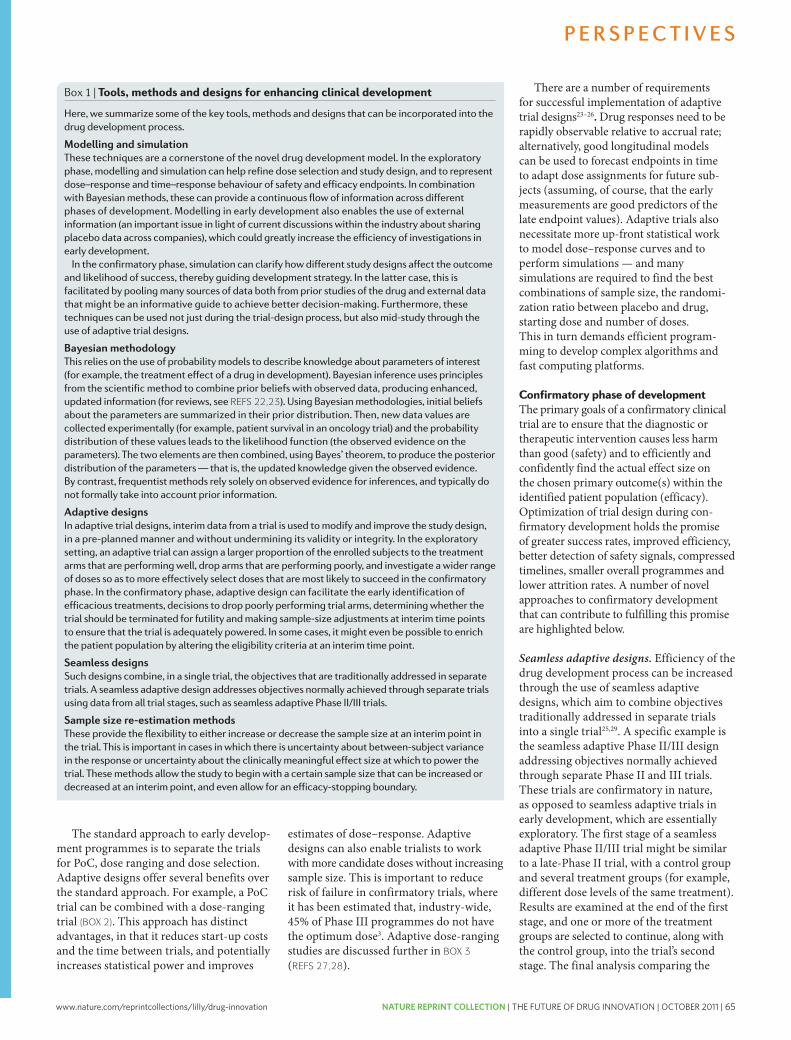
www.nature.com/reprintcollections/lilly/drug-innovation NATURE REPRINT COLLECTION | THE FUTURE OF DRUG INNOVATION | OCTOBER 2011 | 65
The standard approach to early develop-ment programmes is to separate the trials for PoC, dose ranging and dose selection. adaptive designs offer several benefits over the standard approach. For example, a PoC trial can be combined with a dose-ranging trial (BOX 2). This approach has distinct advantages, in that it reduces start-up costs and the time between trials, and potentially increases statistical power and improves
estimates of dose–response. adaptive designs can also enable trialists to work with more candidate doses without increasing sample size. This is important to reduce risk of failure in confirmatory trials, where it has been estimated that, industry-wide, 45% of Phase III programmes do not have the optimum dose3. adaptive dose-ranging studies are discussed further in BOX 3 (REFS 27,28).
There are a number of requirements for successful implementation of adaptive trial designs23–26. drug responses need to be rapidly observable relative to accrual rate; alternatively, good longitudinal models can be used to forecast endpoints in time to adapt dose assignments for future sub-jects (assuming, of course, that the early measurements are good predictors of the late endpoint values). adaptive trials also necessitate more up-front statistical work to model dose–response curves and to perform simulations — and many simulations are required to find the best combinations of sample size, the randomi-zation ratio between placebo and drug, starting dose and number of doses. This in turn demands efficient program-ming to develop complex algorithms and fast computing platforms.
Confirmatory phase of developmentThe primary goals of a confirmatory clinical trial are to ensure that the diagnostic or therapeutic intervention causes less harm than good (safety) and to efficiently and confidently find the actual effect size on the chosen primary outcome(s) within the identified patient population (efficacy). optimization of trial design during con-firmatory development holds the promise of greater success rates, improved efficiency, better detection of safety signals, compressed timelines, smaller overall programmes and lower attrition rates. a number of novel approaches to confirmatory development that can contribute to fulfilling this promise are highlighted below.
Seamless adaptive designs. efficiency of the drug development process can be increased through the use of seamless adaptive designs, which aim to combine objectives traditionally addressed in separate trials into a single trial25,29. a specific example is the seamless adaptive Phase II/III design addressing objectives normally achieved through separate Phase II and III trials. These trials are confirmatory in nature, as opposed to seamless adaptive trials in early development, which are essentially exploratory. The first stage of a seamless adaptive Phase II/III trial might be similar to a late-Phase II trial, with a control group and several treatment groups (for example, different dose levels of the same treatment). results are examined at the end of the first stage, and one or more of the treatment groups are selected to continue, along with the control group, into the trial’s second stage. The final analysis comparing the
Box 1 | Tools, methods and designs for enhancing clinical development
Here, we summarize some of the key tools, methods and designs that can be incorporated into the drug development process.
Modelling and simulation These techniques are a cornerstone of the novel drug development model. In the exploratory phase, modelling and simulation can help refine dose selection and study design, and to represent dose–response and time–response behaviour of safety and efficacy endpoints. In combination with Bayesian methods, these can provide a continuous flow of information across different phases of development. Modelling in early development also enables the use of external information (an important issue in light of current discussions within the industry about sharing placebo data across companies), which could greatly increase the efficiency of investigations in early development.
In the confirmatory phase, simulation can clarify how different study designs affect the outcome and likelihood of success, thereby guiding development strategy. In the latter case, this is facilitated by pooling many sources of data both from prior studies of the drug and external data that might be an informative guide to achieve better decision-making. Furthermore, these techniques can be used not just during the trial-design process, but also mid-study through the use of adaptive trial designs.
Bayesian methodology This relies on the use of probability models to describe knowledge about parameters of interest (for example, the treatment effect of a drug in development). Bayesian inference uses principles from the scientific method to combine prior beliefs with observed data, producing enhanced, updated information (for reviews, see REFS 22,23). Using Bayesian methodologies, initial beliefs about the parameters are summarized in their prior distribution. Then, new data values are collected experimentally (for example, patient survival in an oncology trial) and the probability distribution of these values leads to the likelihood function (the observed evidence on the parameters). The two elements are then combined, using Bayes’ theorem, to produce the posterior distribution of the parameters — that is, the updated knowledge given the observed evidence. By contrast, frequentist methods rely solely on observed evidence for inferences, and typically do not formally take into account prior information.
Adaptive designs In adaptive trial designs, interim data from a trial is used to modify and improve the study design, in a pre-planned manner and without undermining its validity or integrity. In the exploratory setting, an adaptive trial can assign a larger proportion of the enrolled subjects to the treatment arms that are performing well, drop arms that are performing poorly, and investigate a wider range of doses so as to more effectively select doses that are most likely to succeed in the confirmatory phase. In the confirmatory phase, adaptive design can facilitate the early identification of efficacious treatments, decisions to drop poorly performing trial arms, determining whether the trial should be terminated for futility and making sample-size adjustments at interim time points to ensure that the trial is adequately powered. In some cases, it might even be possible to enrich the patient population by altering the eligibility criteria at an interim time point.
seamless designs Such designs combine, in a single trial, the objectives that are traditionally addressed in separate trials. A seamless adaptive design addresses objectives normally achieved through separate trials using data from all trial stages, such as seamless adaptive Phase II/III trials.
sample size re-estimation methods These provide the flexibility to either increase or decrease the sample size at an interim point in the trial. This is important in cases in which there is uncertainty about between-subject variance in the response or uncertainty about the clinically meaningful effect size at which to power the trial. These methods allow the study to begin with a certain sample size that can be increased or decreased at an interim point, and even allow for an efficacy-stopping boundary.
P e r s P e c t i v e s
naTUre revIeWS | Drug Discovery volUMe 8 | deCeMBer 2009 | 951
nrd_persp_dec09.indd 951 16/11/09 13:57:41
Target PoC Approval
Nature Reviews | Drug Discovery
• Apply innovative tools and clinical trial designs such as adaptive or seamless studies• Identify target patient population, confirm optimal dose and dosing regimen and establish the benefit/risk ratio
• Apply biomarkers, modelling and simulation, and advanced statistical methodology• Demonstrate PoC and establish dose selection
Exploratory phase Confirmatory phase
Target discovery and validation PoC clinical trials Clinical development
about sharing placebo data across compa-nies, this has huge potential for improving the efficiency of investigation in early development.
Modelling and simulation for dose and dose regimen selection. an important goal of a drug development programme is the selection of a dose and dosing regimen that achieves the target clinical benefit while minimizing undesirable adverse effects. Biological and pharmacological modelling can be very useful in this context19,20. For example, we (J.o., J.P., M.B., P.G. and d.S.) have used such modelling in the dose selec-tion for canakinumab (Ilaris; novartis), a monoclonal antibody that has recently been approved for the treatment of the rare genetic disease Muckle–Wells syndrome (FIG. 2). Clinical data on the relationship between activity of the therapeutic target (interleukin-1), markers of inflammation and remission of symptoms were captured in a mathematical model that was con-tinuously adjusted to fit emerging data. Simulation was then used to propose a suit-able dose and dosing regimen to achieve the desired response for the majority of patients — in this instance, an 80% probability that 90% of patients would remain flare-free for 2 months. The data derived from this modelling exercise allowed for selection of a dosing regimen that was investigated and confirmed in a Phase III trial21 (clinical data
on various dosing intervals provided the raw data for the modelling and simulation exercise that finalized the dose and regimen selection for Phase III). Similarly, model-ling has been used to predict the impact of changing the dose or dosing regimen of a dipeptidyl peptidase Iv inhibitor that is being developed for the treatment of type 2 diabetes (see Supplementary information S1 (box)).
Bayesian modelling combined with use of external baseline data to improve efficacy and safety signal detection in early development. early development studies for establish-ing PoC often use small patient cohorts (10–20 subjects). These patients are typically observed for a relatively short period of time (several weeks) to evaluate early efficacy and safety signals, which are frequently meas-ured on a continuous scale and observed several times over the duration of the study. However, the endpoints for the decision to proceed with development or not are typically based on a single time point (for example, change from baseline at the end of the study) and use dichotomized versions of the original variables to characterize responder and non-responder behaviour. an example of the latter is the transformation of continuous liver function test measurements (for example, alanine aminotransferase (alT) and aspartate aminotransferase (aST)) into binary indicators (for instance, exceeding
three times the upper limit of normal (Uln)). There are, therefore, two types of information loss that often occur in PoC studies: the dichotomization of continuous endpoints and a failure to use all of the available longitudinal measurements collected in the study22.
a typical design for efficacy and safety evaluation in a PoC study is to use cohorts in a dose-escalation algorithm. Cohorts are assigned, in sequence, to increasing doses until the maximum tolerated dose is reached, or unacceptable safety is observed for a given cohort. a new cohort is only allowed to start once acceptable safety signals are verified for all previous doses. at the end of the study, the goal is to either determine a dose range for further exploration in Phase IIb, or to conclude that no PoC can be established based on the efficacy–safety trade-off.
Because of small cohort sizes, only safety problems occurring in a relatively large per-centage of patients can be reliably detected by dose-escalation procedures. likewise, only relatively strong efficacy signals can be detected with reasonable statistical power. The detection of safety and efficacy signals can be made more efficient in various ways: by drawing on data and information external to the trial, and by deploying longitudinal modelling approaches to make use of all available information. Furthermore, the utility of PoC studies within drug development programmes can be enhanced by incorpo-rating the information obtained in them directly into later-phase trials11,12. Bayesian modelling techniques are particularly useful in implementing these approaches. a PoC study in dyslipidaemia that illustrates the methods mentioned above is provided in Supplementary information S2 (box)).
Adaptive trial designs in early development. The core concept of adaptive trial design (also known as flexible design) is that it uses accumulating data to decide on how to modify aspects of the study mid-trial, in a pre-planned manner, without undermining the validity or integrity of the study23–26. Possible adaptations include adjustments to sample size, allocation of treatments, the addition or deletion of treatment arms, inclusion and exclusion criteria for the study population, adjusting statistical hypotheses (such as non-inferiority or superiority), and combining trials or treatment phases. adaptive trials have the potential to translate into more ethical treatment of patients within trials, more efficient drug development and better use of available resources.
Figure 1 | A novel model for clinical development. During the exploratory phase of development, this model uses all available knowledge and tools, including biomarkers, modelling and simulation, as well as advanced statistical methodology. Trials are designed to determine proof-of-concept (Poc) and to establish dose selection to a level of rigour that will enhance the likelihood of success in the confirmatory phase. During the confirmatory phase, modern designs, tools and knowledge are applied to larger-scale studies with the goal of identifying the target patient population in which the drug is efficacious, establishing the benefit/risk ratio and confirming the optimal dose and dosing regimen. During this phase, innovative clinical trial designs such as adaptive or seamless studies compress time-lines, improve dose and regimen selection, and reduce the number of patients assigned to non-viable dosing regimens.
P e r s P e c t i v e s
950 | deCeMBer 2009 | volUMe 8 www.nature.com/reviews/drugdisc
nrd_persp_dec09.indd 950 16/11/09 13:57:41
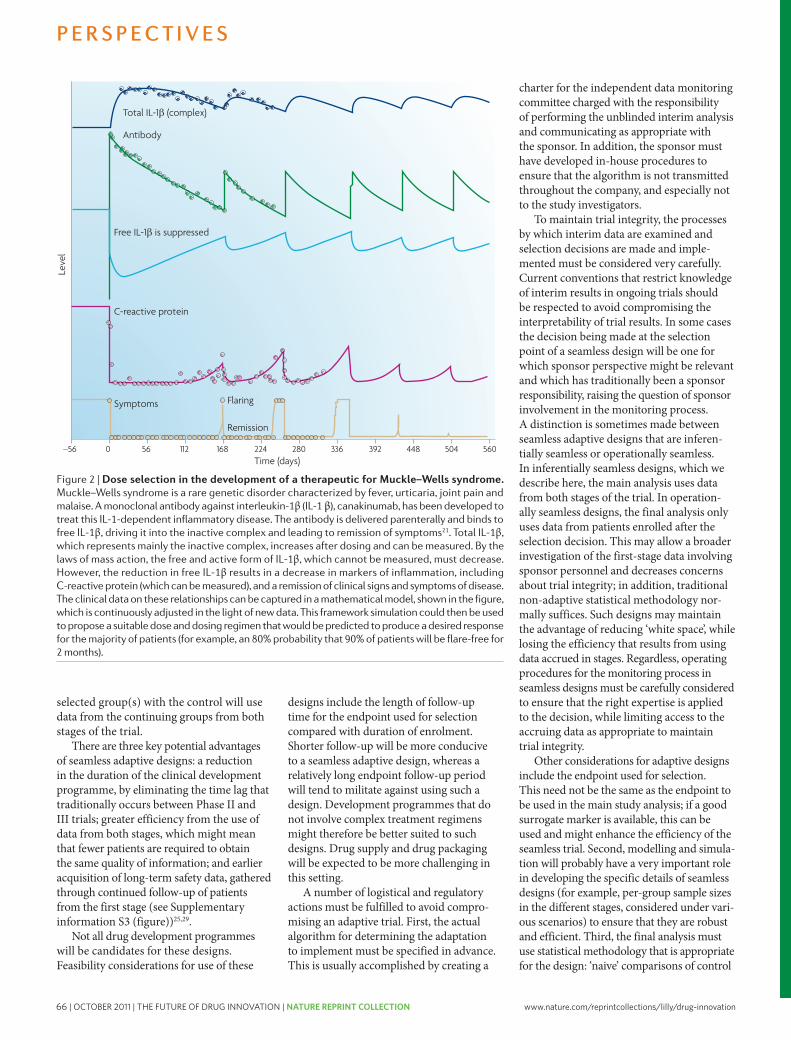
66 | OCTOBER 2011 | THE FUTURE OF DRUG INNOVATION | NATURE REPRINT COLLECTION www.nature.com/reprintcollections/lilly/drug-innovationNature Reviews | Drug Discovery
Mea
n re
spon
se
25
20
15
10
5
06 875432
Dose
Scenario 1Scenario 2Scenario 3
1
a
Scenario 4Scenario 5
Scenario 6Scenario 7
Ave
rage
allo
catio
n
20
18
16
12
14
10
8
6
4
2
0
Dose
Average allocationEfficiency
c
b
Effic
ienc
y
Effic
ienc
y
10
9
8
6
7
5
4
3
2
1
0
10
9
8
6
7
5
4
3
2
1
06 75432
Dose
Adaptive design (sample size = 120)Adaptive design (sample size = 60)Standard design (sample size = 120)
1
d
1 2 3 4 5 6 7
Scenario Power of standard PoC trial*
Power of combined adaptive design
1234567
53332868510099
5846710099100100
*Sample size = 30.
versus the selected treatment that do not account for the design will not be appropriate. Finally, the appropriateness of the design does not depend on any particular algorithm for choosing the patient group to be contin-ued; it is not even necessary for a firm algorithm to be specified in advance, although the general principles that will govern the decision should be clear in advance.
Sample size re-estimation within a confirmatory trial (Phase III). Sample size re-estimation (SSr) provides a mechanism for appropriately using the information obtained during a confirmatory study to inform and adjust the necessary sample size going for-ward30,31. This process increases confidence that an appropriate sample size has been chosen to answer the primary study questions.
The standard approach used to power a confirmatory study is to first estimate the underlying treatment effect on the primary endpoint based on available prior informa-tion. The parameter δ denotes the true underlying difference between the treat-ment and control arms with respect to the primary endpoint. even though the true value of δ is unknown, the trial investigators will usually have in mind a specific value, δmin, which represents the smallest clinically important delta (SCId) for this clinical trial. next, the trial designers will determine the sample size that can detect values of δ, based on prior information, that exceed the SCId with good power. The standard deviation σ (between subject variability) is a ‘nuisance parameter’ whose true value must be estimated in order to proceed with the sample size calculation.
The SCId can often be pre-specified from purely clinical arguments, whereas the actual effect size is unknown. Therefore, it is possible in principle to design a study with a fixed sample size that will have adequate power to detect the SCId, in the absence of adequate prior information about the actual effect size of the test agent. This is what statisticians envisaged when they created the fixed-sample methodology. However, this fixed sample methodology has several drawbacks. If the actual effect is substantially larger than the SCId, a smaller sample size would have sufficed to attain adequate power32.
Sponsors will not often risk significant resources on trial sizes based on SCId assumptions that would lead to larger trials than the current ‘best guess’ about the actual effect size (BOX 4). Instead, a smaller trial corresponding to that best guess may be run; if that assumption is too optimistic, and the
Box 2 | Case study: combining poC and dose-ranging trials into a single adaptive trial
This example illustrates how a single adaptive trial can replace two standard trials — proof-of-concept (PoC) and dose-ranging — and that the combined trial has greater power than the standard PoC design, and is substantially better at estimating the dose–response curve.
The trial evaluated an analgesic drug to treat dental pain and tested seven doses of the drug. Several designs with different sample sizes, randomization ratios of drug to placebo and starting doses were simulated against several scenarios. Here, we describe one design with a sample size of 120 subjects (40 placebo, 80 drug). Bayesian adaptive trials were simulated over seven drug–response scenarios to enable comparisons with standard designs. Seven scenarios, which represent the gamut of probable dose–response curves were chosen as shown in panel a in the figure. In simulations, it was found that across all seven scenarios, a single adaptive trial can replace two standard trials (PoC and dose-ranging). The power of the trend test for PoC was always greater for the adaptive design, as shown in panel b. When there was a small dose–response effect (scenarios 2 and 3), the power of the adaptive design was about double that of the standard design. When the effect size was modest (scenarios 4 and 5), the power was increased to practically 100%. When effect sizes were large (scenarios 6 and 7), the power was almost 100% for both adaptive and standard designs.
For the same total sample size, the adaptive combined PoC–dose-finding trial is more efficient than the two standard trials in estimating the response at every dose (see panel c). The continuous curve shows the efficiency of the adaptive design relative to the standard dose-ranging design for scenario 7. Efficiency at each dose is defined as the ratio of the square of the estimation error of the standard design to the square of the estimation error of the adaptive design. The bars show the number of subjects allocated to each dose by the adaptive design. These results are computed by averaging the results of 1,000 simulations.The overall efficiency across all doses is greater by a factor of five, whereas for the sloping part of the dose response curve (doses 4, 5 and 6) the adaptive design is three times more efficient. In panel d, the adaptive combined PoC–dose-ranging trial with 60 subjects is as efficient in estimating the response at every dose as the two standard trials with a combined sample size of 120 subjects. It is also as powerful in testing for PoC.
These results are true irrespective of which of the seven scenarios reflects the true dose–response curve. For all seven scenarios for the same sample size, the efficiency of the adaptive design was about five times that of the standard design over all doses. It was three times that of the standard design for estimating dose–response in the sloping part of the dose–response curve. Another way to think about this result is that for half the sample size, the adaptive design is as powerful and efficient as the standard approach with two trials.
P e r s P e c t i v e s
naTUre revIeWS | Drug Discovery volUMe 8 | deCeMBer 2009 | 953
nrd_persp_dec09.indd 953 16/11/09 13:57:42
Nature Reviews | Drug Discovery
Leve
l
280 336 392 448 504 56022416811256Time (days)
–56 0
Total IL-1β (complex)
Antibody
Free IL-1β is suppressed
C-reactive protein
Symptoms Flaring
Remission
selected group(s) with the control will use data from the continuing groups from both stages of the trial.
There are three key potential advantages of seamless adaptive designs: a reduction in the duration of the clinical development programme, by eliminating the time lag that traditionally occurs between Phase II and III trials; greater efficiency from the use of data from both stages, which might mean that fewer patients are required to obtain the same quality of information; and earlier acquisition of long-term safety data, gathered through continued follow-up of patients from the first stage (see Supplementary information S3 (figure))25,29.
not all drug development programmes will be candidates for these designs. Feasibility considerations for use of these
designs include the length of follow-up time for the endpoint used for selection compared with duration of enrolment. Shorter follow-up will be more conducive to a seamless adaptive design, whereas a relatively long endpoint follow-up period will tend to militate against using such a design. development programmes that do not involve complex treatment regimens might therefore be better suited to such designs. drug supply and drug packaging will be expected to be more challenging in this setting.
a number of logistical and regulatory actions must be fulfilled to avoid compro-mising an adaptive trial. First, the actual algorithm for determining the adaptation to implement must be specified in advance. This is usually accomplished by creating a
charter for the independent data monitoring committee charged with the responsibility of performing the unblinded interim analysis and communicating as appropriate with the sponsor. In addition, the sponsor must have developed in-house procedures to ensure that the algorithm is not transmitted throughout the company, and especially not to the study investigators.
To maintain trial integrity, the processes by which interim data are examined and selection decisions are made and imple-mented must be considered very carefully. Current conventions that restrict knowledge of interim results in ongoing trials should be respected to avoid compromising the interpretability of trial results. In some cases the decision being made at the selection point of a seamless design will be one for which sponsor perspective might be relevant and which has traditionally been a sponsor responsibility, raising the question of sponsor involvement in the monitoring process. a distinction is sometimes made between seamless adaptive designs that are inferen-tially seamless or operationally seamless. In inferentially seamless designs, which we describe here, the main analysis uses data from both stages of the trial. In operation-ally seamless designs, the final analysis only uses data from patients enrolled after the selection decision. This may allow a broader investigation of the first-stage data involving sponsor personnel and decreases concerns about trial integrity; in addition, traditional non-adaptive statistical methodology nor-mally suffices. Such designs may maintain the advantage of reducing ‘white space’, while losing the efficiency that results from using data accrued in stages. regardless, operating procedures for the monitoring process in seamless designs must be carefully considered to ensure that the right expertise is applied to the decision, while limiting access to the accruing data as appropriate to maintain trial integrity.
other considerations for adaptive designs include the endpoint used for selection. This need not be the same as the endpoint to be used in the main study analysis; if a good surrogate marker is available, this can be used and might enhance the efficiency of the seamless trial. Second, modelling and simula-tion will probably have a very important role in developing the specific details of seamless designs (for example, per-group sample sizes in the different stages, considered under vari-ous scenarios) to ensure that they are robust and efficient. Third, the final analysis must use statistical methodology that is appropriate for the design: ‘naive’ comparisons of control
Figure 2 | Dose selection in the development of a therapeutic for Muckle–Wells syndrome. Muckle–Wells syndrome is a rare genetic disorder characterized by fever, urticaria, joint pain and malaise. A monoclonal antibody against interleukin-1β (iL-1 β), canakinumab, has been developed to treat this iL-1-dependent inflammatory disease. The antibody is delivered parenterally and binds to free iL-1β, driving it into the inactive complex and leading to remission of symptoms21. Total iL-1β, which represents mainly the inactive complex, increases after dosing and can be measured. By the laws of mass action, the free and active form of iL-1β, which cannot be measured, must decrease. However, the reduction in free iL-1β results in a decrease in markers of inflammation, including c-reactive protein (which can be measured), and a remission of clinical signs and symptoms of disease. The clinical data on these relationships can be captured in a mathematical model, shown in the figure, which is continuously adjusted in the light of new data. This framework simulation could then be used to propose a suitable dose and dosing regimen that would be predicted to produce a desired response for the majority of patients (for example, an 80% probability that 90% of patients will be flare-free for 2 months).
P e r s P e c t i v e s
952 | deCeMBer 2009 | volUMe 8 www.nature.com/reviews/drugdisc
nrd_persp_dec09.indd 952 16/11/09 13:57:42

www.nature.com/reprintcollections/lilly/drug-innovation NATURE REPRINT COLLECTION | THE FUTURE OF DRUG INNOVATION | OCTOBER 2011 | 67Nature Reviews | Drug Discovery
Mea
n re
spon
se
25
20
15
10
5
06 875432
Dose
Scenario 1Scenario 2Scenario 3
1
a
Scenario 4Scenario 5
Scenario 6Scenario 7
Ave
rage
allo
catio
n
20
18
16
12
14
10
8
6
4
2
0
Dose
Average allocationEfficiency
c
b
Effic
ienc
y
Effic
ienc
y
10
9
8
6
7
5
4
3
2
1
0
10
9
8
6
7
5
4
3
2
1
06 75432
Dose
Adaptive design (sample size = 120)Adaptive design (sample size = 60)Standard design (sample size = 120)
1
d
1 2 3 4 5 6 7
Scenario Power of standard PoC trial*
Power of combined adaptive design
1234567
53332868510099
5846710099100100
*Sample size = 30.
versus the selected treatment that do not account for the design will not be appropriate. Finally, the appropriateness of the design does not depend on any particular algorithm for choosing the patient group to be contin-ued; it is not even necessary for a firm algorithm to be specified in advance, although the general principles that will govern the decision should be clear in advance.
Sample size re-estimation within a confirmatory trial (Phase III). Sample size re-estimation (SSr) provides a mechanism for appropriately using the information obtained during a confirmatory study to inform and adjust the necessary sample size going for-ward30,31. This process increases confidence that an appropriate sample size has been chosen to answer the primary study questions.
The standard approach used to power a confirmatory study is to first estimate the underlying treatment effect on the primary endpoint based on available prior informa-tion. The parameter δ denotes the true underlying difference between the treat-ment and control arms with respect to the primary endpoint. even though the true value of δ is unknown, the trial investigators will usually have in mind a specific value, δmin, which represents the smallest clinically important delta (SCId) for this clinical trial. next, the trial designers will determine the sample size that can detect values of δ, based on prior information, that exceed the SCId with good power. The standard deviation σ (between subject variability) is a ‘nuisance parameter’ whose true value must be estimated in order to proceed with the sample size calculation.
The SCId can often be pre-specified from purely clinical arguments, whereas the actual effect size is unknown. Therefore, it is possible in principle to design a study with a fixed sample size that will have adequate power to detect the SCId, in the absence of adequate prior information about the actual effect size of the test agent. This is what statisticians envisaged when they created the fixed-sample methodology. However, this fixed sample methodology has several drawbacks. If the actual effect is substantially larger than the SCId, a smaller sample size would have sufficed to attain adequate power32.
Sponsors will not often risk significant resources on trial sizes based on SCId assumptions that would lead to larger trials than the current ‘best guess’ about the actual effect size (BOX 4). Instead, a smaller trial corresponding to that best guess may be run; if that assumption is too optimistic, and the
Box 2 | Case study: combining poC and dose-ranging trials into a single adaptive trial
This example illustrates how a single adaptive trial can replace two standard trials — proof-of-concept (PoC) and dose-ranging — and that the combined trial has greater power than the standard PoC design, and is substantially better at estimating the dose–response curve.
The trial evaluated an analgesic drug to treat dental pain and tested seven doses of the drug. Several designs with different sample sizes, randomization ratios of drug to placebo and starting doses were simulated against several scenarios. Here, we describe one design with a sample size of 120 subjects (40 placebo, 80 drug). Bayesian adaptive trials were simulated over seven drug–response scenarios to enable comparisons with standard designs. Seven scenarios, which represent the gamut of probable dose–response curves were chosen as shown in panel a in the figure. In simulations, it was found that across all seven scenarios, a single adaptive trial can replace two standard trials (PoC and dose-ranging). The power of the trend test for PoC was always greater for the adaptive design, as shown in panel b. When there was a small dose–response effect (scenarios 2 and 3), the power of the adaptive design was about double that of the standard design. When the effect size was modest (scenarios 4 and 5), the power was increased to practically 100%. When effect sizes were large (scenarios 6 and 7), the power was almost 100% for both adaptive and standard designs.
For the same total sample size, the adaptive combined PoC–dose-finding trial is more efficient than the two standard trials in estimating the response at every dose (see panel c). The continuous curve shows the efficiency of the adaptive design relative to the standard dose-ranging design for scenario 7. Efficiency at each dose is defined as the ratio of the square of the estimation error of the standard design to the square of the estimation error of the adaptive design. The bars show the number of subjects allocated to each dose by the adaptive design. These results are computed by averaging the results of 1,000 simulations.The overall efficiency across all doses is greater by a factor of five, whereas for the sloping part of the dose response curve (doses 4, 5 and 6) the adaptive design is three times more efficient. In panel d, the adaptive combined PoC–dose-ranging trial with 60 subjects is as efficient in estimating the response at every dose as the two standard trials with a combined sample size of 120 subjects. It is also as powerful in testing for PoC.
These results are true irrespective of which of the seven scenarios reflects the true dose–response curve. For all seven scenarios for the same sample size, the efficiency of the adaptive design was about five times that of the standard design over all doses. It was three times that of the standard design for estimating dose–response in the sloping part of the dose–response curve. Another way to think about this result is that for half the sample size, the adaptive design is as powerful and efficient as the standard approach with two trials.
P e r s P e c t i v e s
naTUre revIeWS | Drug Discovery volUMe 8 | deCeMBer 2009 | 953
nrd_persp_dec09.indd 953 16/11/09 13:57:42
Nature Reviews | Drug Discovery
Leve
l
280 336 392 448 504 56022416811256Time (days)
–56 0
Total IL-1β (complex)
Antibody
Free IL-1β is suppressed
C-reactive protein
Symptoms Flaring
Remission
selected group(s) with the control will use data from the continuing groups from both stages of the trial.
There are three key potential advantages of seamless adaptive designs: a reduction in the duration of the clinical development programme, by eliminating the time lag that traditionally occurs between Phase II and III trials; greater efficiency from the use of data from both stages, which might mean that fewer patients are required to obtain the same quality of information; and earlier acquisition of long-term safety data, gathered through continued follow-up of patients from the first stage (see Supplementary information S3 (figure))25,29.
not all drug development programmes will be candidates for these designs. Feasibility considerations for use of these
designs include the length of follow-up time for the endpoint used for selection compared with duration of enrolment. Shorter follow-up will be more conducive to a seamless adaptive design, whereas a relatively long endpoint follow-up period will tend to militate against using such a design. development programmes that do not involve complex treatment regimens might therefore be better suited to such designs. drug supply and drug packaging will be expected to be more challenging in this setting.
a number of logistical and regulatory actions must be fulfilled to avoid compro-mising an adaptive trial. First, the actual algorithm for determining the adaptation to implement must be specified in advance. This is usually accomplished by creating a
charter for the independent data monitoring committee charged with the responsibility of performing the unblinded interim analysis and communicating as appropriate with the sponsor. In addition, the sponsor must have developed in-house procedures to ensure that the algorithm is not transmitted throughout the company, and especially not to the study investigators.
To maintain trial integrity, the processes by which interim data are examined and selection decisions are made and imple-mented must be considered very carefully. Current conventions that restrict knowledge of interim results in ongoing trials should be respected to avoid compromising the interpretability of trial results. In some cases the decision being made at the selection point of a seamless design will be one for which sponsor perspective might be relevant and which has traditionally been a sponsor responsibility, raising the question of sponsor involvement in the monitoring process. a distinction is sometimes made between seamless adaptive designs that are inferen-tially seamless or operationally seamless. In inferentially seamless designs, which we describe here, the main analysis uses data from both stages of the trial. In operation-ally seamless designs, the final analysis only uses data from patients enrolled after the selection decision. This may allow a broader investigation of the first-stage data involving sponsor personnel and decreases concerns about trial integrity; in addition, traditional non-adaptive statistical methodology nor-mally suffices. Such designs may maintain the advantage of reducing ‘white space’, while losing the efficiency that results from using data accrued in stages. regardless, operating procedures for the monitoring process in seamless designs must be carefully considered to ensure that the right expertise is applied to the decision, while limiting access to the accruing data as appropriate to maintain trial integrity.
other considerations for adaptive designs include the endpoint used for selection. This need not be the same as the endpoint to be used in the main study analysis; if a good surrogate marker is available, this can be used and might enhance the efficiency of the seamless trial. Second, modelling and simula-tion will probably have a very important role in developing the specific details of seamless designs (for example, per-group sample sizes in the different stages, considered under vari-ous scenarios) to ensure that they are robust and efficient. Third, the final analysis must use statistical methodology that is appropriate for the design: ‘naive’ comparisons of control
Figure 2 | Dose selection in the development of a therapeutic for Muckle–Wells syndrome. Muckle–Wells syndrome is a rare genetic disorder characterized by fever, urticaria, joint pain and malaise. A monoclonal antibody against interleukin-1β (iL-1 β), canakinumab, has been developed to treat this iL-1-dependent inflammatory disease. The antibody is delivered parenterally and binds to free iL-1β, driving it into the inactive complex and leading to remission of symptoms21. Total iL-1β, which represents mainly the inactive complex, increases after dosing and can be measured. By the laws of mass action, the free and active form of iL-1β, which cannot be measured, must decrease. However, the reduction in free iL-1β results in a decrease in markers of inflammation, including c-reactive protein (which can be measured), and a remission of clinical signs and symptoms of disease. The clinical data on these relationships can be captured in a mathematical model, shown in the figure, which is continuously adjusted in the light of new data. This framework simulation could then be used to propose a suitable dose and dosing regimen that would be predicted to produce a desired response for the majority of patients (for example, an 80% probability that 90% of patients will be flare-free for 2 months).
P e r s P e c t i v e s
952 | deCeMBer 2009 | volUMe 8 www.nature.com/reviews/drugdisc
nrd_persp_dec09.indd 952 16/11/09 13:57:42
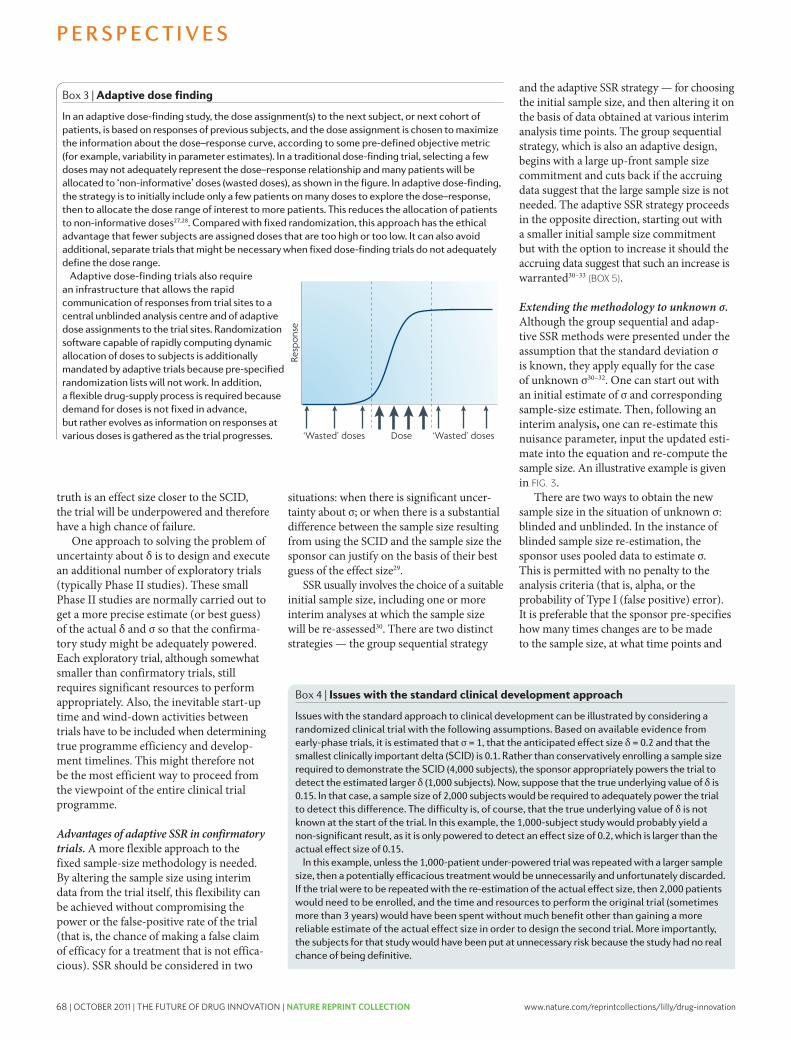
68 | OCTOBER 2011 | THE FUTURE OF DRUG INNOVATION | NATURE REPRINT COLLECTION www.nature.com/reprintcollections/lilly/drug-innovation
Box 5 | group-sequential and adaptive designs for sample size re-estimation
Group-sequential design. Suppose that the sponsor is unsure of the true value of δ, but nevertheless believes that it is larger than the smallest clinically important delta (SCID). In this case, a group-sequential design might be considered. Such a design is characterized by a maximum sample size, an interim monitoring strategy and a corresponding boundary for early stopping for efficacy. The maximum sample size is computed so that the study has adequate power to detect a value of δ that the sponsor believes represents a reasonable estimate of the efficacy of the experimental compound, provided this estimate is at least as large as the SCID. If the sponsor wishes to be very conservative about this estimate, the maximum sample size needed can be computed to have adequate power at the SCID itself. An up-front commitment is made to enrol patients up to this maximum sample size. However, if the true δ exceeds the SCID, the trial may terminate earlier with high probability by crossing an early stopping boundary at an interim analysis.
Returning to the example discussed in BOX 4, suppose that the sponsor decides to make an up-front commitment of 4,000 patients to the trial but intends to monitor the accruing data up to four times, after 1,000, 2,000, 3,000 and 4,000 patients become evaluable for the primary endpoint. The commitment of 4,000 patients ensures that the trial will have 88% power to detect a difference as small as δ = 0.1 (in this case the SCID). Although this is a rather large sample size to commit to the trial, the actual sample size is expected to be substantially smaller if the true δ is larger than the SCID. This is because at each of the four interim monitoring time points there is a chance of early termination and a declaration of statistical significance. At each interim analysis, a test for statistical significance using all available primary endpoint data would be performed, and the result would be compared with a properly determined early-stopping boundary value. The trial could be terminated the first time that a boundary is reached, with a valid claim that the experimental arm is more efficacious than the control arm.
However, sometimes a sponsor might not be willing to make such a large up-front commitment, particularly when the only currently available data on δ are from one or two small Phase II trials. The sponsor might feel more comfortable with a design that starts out with a smaller sample size of, say, 1,000 patients, with the opportunity to increase the sample size at an interim time point and after observing data from the trial. This is the motivation for the adaptive design below.
The adaptive design. The group-sequential design described above is characterized by pre-specifying a maximum sample size up-front and terminating earlier if the true δ is larger than anticipated. By contrast, an adaptive design pre-specifies a smaller initial sample size, but with the possibility of increasing the commitment after seeing some interim data from the trial. On the surface, this is similar to the usual practice of first running a small Phase II trial to obtain an idea about efficacy and safety and then following it up with a larger Phase III trial once the efficacy and safety of the compound have been established. There is, however, an important distinction between the conventional Phase II followed by Phase III strategy and the adaptive strategy outlined below.
In the conventional approach, the data from the Phase II trial are not combined with the data from the Phase III trial. The adaptive design, however, uses all the data from both stages for the final analysis. This can have important advantages both in terms of gaining additional statistical power, as well as shortening the drug development time. In our example, we stated that the SCID was 0.1. Supposing that the sponsor believes that the true δ = 0.2 — that is, twice as large as the SCID — if this is indeed the case, then a total sample size of 1,000 patients will have 89% power at a one-sided α level of 0.025. On this basis, the sponsor is prepared to make an initial investment of 1,000 patients to this trial. As an insurance policy, however, the sponsor intends to take an interim look at the accruing data at the mid-point of the trial, after 500 patients are evaluable for response. If the estimate of δ obtained from these 500 is smaller than the sponsor expected, then the sponsor might choose to increase the sample size to preserve the power of the trial.
Many different criteria can be used to decide whether an increase in sample size is warranted. A commonly used criterion is ‘conditional power’. The conditional power at an interim analysis is the probability, given the observed data, that the experimental compound will demonstrate efficacy on completion of the trial. The conditional power computation requires specifying a value for δ. One can choose the value specified at the initial design stage or the value estimated from the interim data. In this example, we use the interim estimated value of δ for evaluating conditional power. The table below displays conditional power for various estimated values of δ at the interim time point, along with the total sample size needed to achieve 80% conditional power at the final analysis. The entries in the table assume that σ = 1.
interim estimate (δ)
conditional power without sample size increase
total sample size needed to achieve 80% conditional power
0.2 95% 720 (sample size reduction)
0.175 86% 890 (sample size reduction)
0.15 72% 1,166 (sample size increase)
0.125 51% 1,757 (sample size increase)
0.1 30% 2,990 (sample size increase)
how the new sample size will be calculated. Usually, this type of adjustment will not be permitted by regulatory authorities more than once.
For unblinded sample size re-estimation, the sponsor sets up a mechanism (possibly with the data monitoring committee of the trial) whereby the SSr is based on an unblinded estimate of variability (or statistical information) at the interim analysis. Sample size may be altered one or more times, but the maximum statistical information must be pre-specified.
If the sponsor agrees that there will be no early stopping for efficacy following an interim analysis, then no adjustment to the final analysis criteria is necessary. The data monitoring committee may monitor the data one or more times and adjust the sample size up or down based on the unblinded estimate of variability and attempt to reach the pre-specified maximum information.
When the sponsor pre-specifies the interim time points at which it is permis-sible to terminate early for efficacy, the criteria for each interim analysis must be pre-specified in a manner that controls the false-positive rate across the entire study. This will result in adjustment to the final analysis criterion if the study is not stopped early. Interim looks undertaken solely for administrative purposes, with no inten-tion of stopping the trial in light of efficacy data, do not need to have defined criteria. The trial then proceeds until either it is ter-minated early for efficacy on the basis of the pre-defined criteria being reached, or until the planned maximum information (sample size or number of events) is reached.
Tackling challenges of new trial designsBecause they are so flexible, these new trial designs require significant statistical analyses, simulations and logistical considerations to verify their operating characteristics, and therefore tend to require more time for the planning and protocol development phase. regulatory agencies and Institutional review Boards also need to approve the design format for interim analysis, and these discussions can sometimes take considerable time. Such time considerations can lead a company to follow the traditional route to clinical development, without fully appre-ciating the advantages that adaptive designs can eventually bring in terms of time and cost savings, and probability of success.
as described above, adaptive designs further require the following: quickly observable responses relative to the patient
P e r s P e c t i v e s
naTUre revIeWS | Drug Discovery volUMe 8 | deCeMBer 2009 | 955
nrd_persp_dec09.indd 955 16/11/09 13:57:43
Nature Reviews | Drug Discovery
Resp
onse
‘Wasted’ doses Dose ‘Wasted’ doses
Box 3 | Adaptive dose finding
In an adaptive dose-finding study, the dose assignment(s) to the next subject, or next cohort of patients, is based on responses of previous subjects, and the dose assignment is chosen to maximize the information about the dose–response curve, according to some pre-defined objective metric (for example, variability in parameter estimates). In a traditional dose-finding trial, selecting a few doses may not adequately represent the dose–response relationship and many patients will be allocated to ‘non-informative’ doses (wasted doses), as shown in the figure. In adaptive dose-finding, the strategy is to initially include only a few patients on many doses to explore the dose–response, then to allocate the dose range of interest to more patients. This reduces the allocation of patients to non-informative doses27,28. Compared with fixed randomization, this approach has the ethical advantage that fewer subjects are assigned doses that are too high or too low. It can also avoid additional, separate trials that might be necessary when fixed dose-finding trials do not adequately define the dose range.
Adaptive dose-finding trials also require an infrastructure that allows the rapid communication of responses from trial sites to a central unblinded analysis centre and of adaptive dose assignments to the trial sites. Randomization software capable of rapidly computing dynamic allocation of doses to subjects is additionally mandated by adaptive trials because pre-specified randomization lists will not work. In addition, a flexible drug-supply process is required because demand for doses is not fixed in advance, but rather evolves as information on responses at various doses is gathered as the trial progresses.
Box 4 | issues with the standard clinical development approach
Issues with the standard approach to clinical development can be illustrated by considering a randomized clinical trial with the following assumptions. Based on available evidence from early-phase trials, it is estimated that σ = 1, that the anticipated effect size δ = 0.2 and that the smallest clinically important delta (SCID) is 0.1. Rather than conservatively enrolling a sample size required to demonstrate the SCID (4,000 subjects), the sponsor appropriately powers the trial to detect the estimated larger δ (1,000 subjects). Now, suppose that the true underlying value of δ is 0.15. In that case, a sample size of 2,000 subjects would be required to adequately power the trial to detect this difference. The difficulty is, of course, that the true underlying value of δ is not known at the start of the trial. In this example, the 1,000-subject study would probably yield a non-significant result, as it is only powered to detect an effect size of 0.2, which is larger than the actual effect size of 0.15.
In this example, unless the 1,000-patient under-powered trial was repeated with a larger sample size, then a potentially efficacious treatment would be unnecessarily and unfortunately discarded. If the trial were to be repeated with the re-estimation of the actual effect size, then 2,000 patients would need to be enrolled, and the time and resources to perform the original trial (sometimes more than 3 years) would have been spent without much benefit other than gaining a more reliable estimate of the actual effect size in order to design the second trial. More importantly, the subjects for that study would have been put at unnecessary risk because the study had no real chance of being definitive.
truth is an effect size closer to the SCId, the trial will be underpowered and therefore have a high chance of failure.
one approach to solving the problem of uncertainty about δ is to design and execute an additional number of exploratory trials (typically Phase II studies). These small Phase II studies are normally carried out to get a more precise estimate (or best guess) of the actual δ and σ so that the confirma-tory study might be adequately powered. each exploratory trial, although somewhat smaller than confirmatory trials, still requires significant resources to perform appropriately. also, the inevitable start-up time and wind-down activities between trials have to be included when determining true programme efficiency and develop-ment timelines. This might therefore not be the most efficient way to proceed from the viewpoint of the entire clinical trial programme.
Advantages of adaptive SSR in confirmatory trials. a more flexible approach to the fixed sample-size methodology is needed. By altering the sample size using interim data from the trial itself, this flexibility can be achieved without compromising the power or the false-positive rate of the trial (that is, the chance of making a false claim of efficacy for a treatment that is not effica-cious). SSr should be considered in two
situations: when there is significant uncer-tainty about σ; or when there is a substantial difference between the sample size resulting from using the SCId and the sample size the sponsor can justify on the basis of their best guess of the effect size29.
SSr usually involves the choice of a suitable initial sample size, including one or more interim analyses at which the sample size will be re-assessed30. There are two distinct strategies — the group sequential strategy
and the adaptive SSr strategy — for choosing the initial sample size, and then altering it on the basis of data obtained at various interim analysis time points. The group sequential strategy, which is also an adaptive design, begins with a large up-front sample size commitment and cuts back if the accruing data suggest that the large sample size is not needed. The adaptive SSr strategy proceeds in the opposite direction, starting out with a smaller initial sample size commitment but with the option to increase it should the accruing data suggest that such an increase is warranted30–33 (BOX 5).
Extending the methodology to unknown σ. although the group sequential and adap-tive SSr methods were presented under the assumption that the standard deviation σ is known, they apply equally for the case of unknown σ30–32. one can start out with an initial estimate of σ and corresponding sample-size estimate. Then, following an interim analysis, one can re-estimate this nuisance parameter, input the updated esti-mate into the equation and re-compute the sample size. an illustrative example is given in FIG. 3.
There are two ways to obtain the new sample size in the situation of unknown σ: blinded and unblinded. In the instance of blinded sample size re-estimation, the sponsor uses pooled data to estimate σ. This is permitted with no penalty to the analysis criteria (that is, alpha, or the probability of Type I (false positive) error). It is preferable that the sponsor pre-specifies how many times changes are to be made to the sample size, at what time points and
P e r s P e c t i v e s
954 | deCeMBer 2009 | volUMe 8 www.nature.com/reviews/drugdisc
nrd_persp_dec09.indd 954 16/11/09 13:57:43
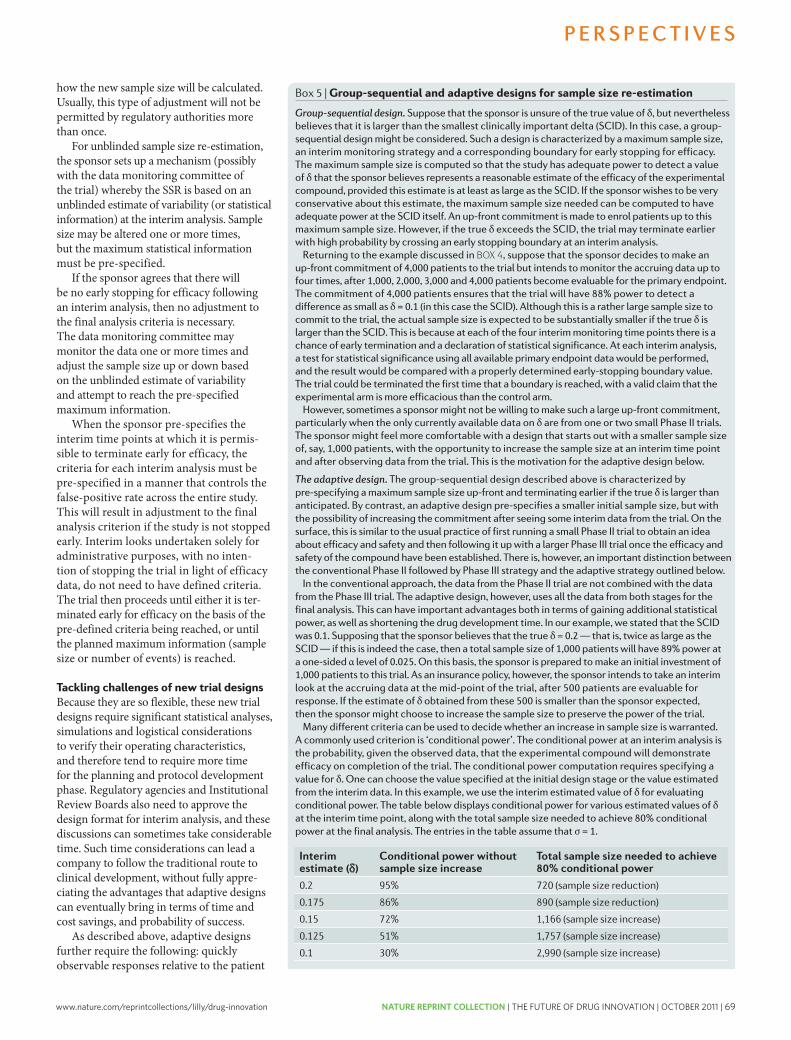
www.nature.com/reprintcollections/lilly/drug-innovation NATURE REPRINT COLLECTION | THE FUTURE OF DRUG INNOVATION | OCTOBER 2011 | 69
Box 5 | group-sequential and adaptive designs for sample size re-estimation
Group-sequential design. Suppose that the sponsor is unsure of the true value of δ, but nevertheless believes that it is larger than the smallest clinically important delta (SCID). In this case, a group-sequential design might be considered. Such a design is characterized by a maximum sample size, an interim monitoring strategy and a corresponding boundary for early stopping for efficacy. The maximum sample size is computed so that the study has adequate power to detect a value of δ that the sponsor believes represents a reasonable estimate of the efficacy of the experimental compound, provided this estimate is at least as large as the SCID. If the sponsor wishes to be very conservative about this estimate, the maximum sample size needed can be computed to have adequate power at the SCID itself. An up-front commitment is made to enrol patients up to this maximum sample size. However, if the true δ exceeds the SCID, the trial may terminate earlier with high probability by crossing an early stopping boundary at an interim analysis.
Returning to the example discussed in BOX 4, suppose that the sponsor decides to make an up-front commitment of 4,000 patients to the trial but intends to monitor the accruing data up to four times, after 1,000, 2,000, 3,000 and 4,000 patients become evaluable for the primary endpoint. The commitment of 4,000 patients ensures that the trial will have 88% power to detect a difference as small as δ = 0.1 (in this case the SCID). Although this is a rather large sample size to commit to the trial, the actual sample size is expected to be substantially smaller if the true δ is larger than the SCID. This is because at each of the four interim monitoring time points there is a chance of early termination and a declaration of statistical significance. At each interim analysis, a test for statistical significance using all available primary endpoint data would be performed, and the result would be compared with a properly determined early-stopping boundary value. The trial could be terminated the first time that a boundary is reached, with a valid claim that the experimental arm is more efficacious than the control arm.
However, sometimes a sponsor might not be willing to make such a large up-front commitment, particularly when the only currently available data on δ are from one or two small Phase II trials. The sponsor might feel more comfortable with a design that starts out with a smaller sample size of, say, 1,000 patients, with the opportunity to increase the sample size at an interim time point and after observing data from the trial. This is the motivation for the adaptive design below.
The adaptive design. The group-sequential design described above is characterized by pre-specifying a maximum sample size up-front and terminating earlier if the true δ is larger than anticipated. By contrast, an adaptive design pre-specifies a smaller initial sample size, but with the possibility of increasing the commitment after seeing some interim data from the trial. On the surface, this is similar to the usual practice of first running a small Phase II trial to obtain an idea about efficacy and safety and then following it up with a larger Phase III trial once the efficacy and safety of the compound have been established. There is, however, an important distinction between the conventional Phase II followed by Phase III strategy and the adaptive strategy outlined below.
In the conventional approach, the data from the Phase II trial are not combined with the data from the Phase III trial. The adaptive design, however, uses all the data from both stages for the final analysis. This can have important advantages both in terms of gaining additional statistical power, as well as shortening the drug development time. In our example, we stated that the SCID was 0.1. Supposing that the sponsor believes that the true δ = 0.2 — that is, twice as large as the SCID — if this is indeed the case, then a total sample size of 1,000 patients will have 89% power at a one-sided α level of 0.025. On this basis, the sponsor is prepared to make an initial investment of 1,000 patients to this trial. As an insurance policy, however, the sponsor intends to take an interim look at the accruing data at the mid-point of the trial, after 500 patients are evaluable for response. If the estimate of δ obtained from these 500 is smaller than the sponsor expected, then the sponsor might choose to increase the sample size to preserve the power of the trial.
Many different criteria can be used to decide whether an increase in sample size is warranted. A commonly used criterion is ‘conditional power’. The conditional power at an interim analysis is the probability, given the observed data, that the experimental compound will demonstrate efficacy on completion of the trial. The conditional power computation requires specifying a value for δ. One can choose the value specified at the initial design stage or the value estimated from the interim data. In this example, we use the interim estimated value of δ for evaluating conditional power. The table below displays conditional power for various estimated values of δ at the interim time point, along with the total sample size needed to achieve 80% conditional power at the final analysis. The entries in the table assume that σ = 1.
interim estimate (δ)
conditional power without sample size increase
total sample size needed to achieve 80% conditional power
0.2 95% 720 (sample size reduction)
0.175 86% 890 (sample size reduction)
0.15 72% 1,166 (sample size increase)
0.125 51% 1,757 (sample size increase)
0.1 30% 2,990 (sample size increase)
how the new sample size will be calculated. Usually, this type of adjustment will not be permitted by regulatory authorities more than once.
For unblinded sample size re-estimation, the sponsor sets up a mechanism (possibly with the data monitoring committee of the trial) whereby the SSr is based on an unblinded estimate of variability (or statistical information) at the interim analysis. Sample size may be altered one or more times, but the maximum statistical information must be pre-specified.
If the sponsor agrees that there will be no early stopping for efficacy following an interim analysis, then no adjustment to the final analysis criteria is necessary. The data monitoring committee may monitor the data one or more times and adjust the sample size up or down based on the unblinded estimate of variability and attempt to reach the pre-specified maximum information.
When the sponsor pre-specifies the interim time points at which it is permis-sible to terminate early for efficacy, the criteria for each interim analysis must be pre-specified in a manner that controls the false-positive rate across the entire study. This will result in adjustment to the final analysis criterion if the study is not stopped early. Interim looks undertaken solely for administrative purposes, with no inten-tion of stopping the trial in light of efficacy data, do not need to have defined criteria. The trial then proceeds until either it is ter-minated early for efficacy on the basis of the pre-defined criteria being reached, or until the planned maximum information (sample size or number of events) is reached.
Tackling challenges of new trial designsBecause they are so flexible, these new trial designs require significant statistical analyses, simulations and logistical considerations to verify their operating characteristics, and therefore tend to require more time for the planning and protocol development phase. regulatory agencies and Institutional review Boards also need to approve the design format for interim analysis, and these discussions can sometimes take considerable time. Such time considerations can lead a company to follow the traditional route to clinical development, without fully appre-ciating the advantages that adaptive designs can eventually bring in terms of time and cost savings, and probability of success.
as described above, adaptive designs further require the following: quickly observable responses relative to the patient
P e r s P e c t i v e s
naTUre revIeWS | Drug Discovery volUMe 8 | deCeMBer 2009 | 955
nrd_persp_dec09.indd 955 16/11/09 13:57:43
Nature Reviews | Drug Discovery
Resp
onse
‘Wasted’ doses Dose ‘Wasted’ doses
Box 3 | Adaptive dose finding
In an adaptive dose-finding study, the dose assignment(s) to the next subject, or next cohort of patients, is based on responses of previous subjects, and the dose assignment is chosen to maximize the information about the dose–response curve, according to some pre-defined objective metric (for example, variability in parameter estimates). In a traditional dose-finding trial, selecting a few doses may not adequately represent the dose–response relationship and many patients will be allocated to ‘non-informative’ doses (wasted doses), as shown in the figure. In adaptive dose-finding, the strategy is to initially include only a few patients on many doses to explore the dose–response, then to allocate the dose range of interest to more patients. This reduces the allocation of patients to non-informative doses27,28. Compared with fixed randomization, this approach has the ethical advantage that fewer subjects are assigned doses that are too high or too low. It can also avoid additional, separate trials that might be necessary when fixed dose-finding trials do not adequately define the dose range.
Adaptive dose-finding trials also require an infrastructure that allows the rapid communication of responses from trial sites to a central unblinded analysis centre and of adaptive dose assignments to the trial sites. Randomization software capable of rapidly computing dynamic allocation of doses to subjects is additionally mandated by adaptive trials because pre-specified randomization lists will not work. In addition, a flexible drug-supply process is required because demand for doses is not fixed in advance, but rather evolves as information on responses at various doses is gathered as the trial progresses.
Box 4 | issues with the standard clinical development approach
Issues with the standard approach to clinical development can be illustrated by considering a randomized clinical trial with the following assumptions. Based on available evidence from early-phase trials, it is estimated that σ = 1, that the anticipated effect size δ = 0.2 and that the smallest clinically important delta (SCID) is 0.1. Rather than conservatively enrolling a sample size required to demonstrate the SCID (4,000 subjects), the sponsor appropriately powers the trial to detect the estimated larger δ (1,000 subjects). Now, suppose that the true underlying value of δ is 0.15. In that case, a sample size of 2,000 subjects would be required to adequately power the trial to detect this difference. The difficulty is, of course, that the true underlying value of δ is not known at the start of the trial. In this example, the 1,000-subject study would probably yield a non-significant result, as it is only powered to detect an effect size of 0.2, which is larger than the actual effect size of 0.15.
In this example, unless the 1,000-patient under-powered trial was repeated with a larger sample size, then a potentially efficacious treatment would be unnecessarily and unfortunately discarded. If the trial were to be repeated with the re-estimation of the actual effect size, then 2,000 patients would need to be enrolled, and the time and resources to perform the original trial (sometimes more than 3 years) would have been spent without much benefit other than gaining a more reliable estimate of the actual effect size in order to design the second trial. More importantly, the subjects for that study would have been put at unnecessary risk because the study had no real chance of being definitive.
truth is an effect size closer to the SCId, the trial will be underpowered and therefore have a high chance of failure.
one approach to solving the problem of uncertainty about δ is to design and execute an additional number of exploratory trials (typically Phase II studies). These small Phase II studies are normally carried out to get a more precise estimate (or best guess) of the actual δ and σ so that the confirma-tory study might be adequately powered. each exploratory trial, although somewhat smaller than confirmatory trials, still requires significant resources to perform appropriately. also, the inevitable start-up time and wind-down activities between trials have to be included when determining true programme efficiency and develop-ment timelines. This might therefore not be the most efficient way to proceed from the viewpoint of the entire clinical trial programme.
Advantages of adaptive SSR in confirmatory trials. a more flexible approach to the fixed sample-size methodology is needed. By altering the sample size using interim data from the trial itself, this flexibility can be achieved without compromising the power or the false-positive rate of the trial (that is, the chance of making a false claim of efficacy for a treatment that is not effica-cious). SSr should be considered in two
situations: when there is significant uncer-tainty about σ; or when there is a substantial difference between the sample size resulting from using the SCId and the sample size the sponsor can justify on the basis of their best guess of the effect size29.
SSr usually involves the choice of a suitable initial sample size, including one or more interim analyses at which the sample size will be re-assessed30. There are two distinct strategies — the group sequential strategy
and the adaptive SSr strategy — for choosing the initial sample size, and then altering it on the basis of data obtained at various interim analysis time points. The group sequential strategy, which is also an adaptive design, begins with a large up-front sample size commitment and cuts back if the accruing data suggest that the large sample size is not needed. The adaptive SSr strategy proceeds in the opposite direction, starting out with a smaller initial sample size commitment but with the option to increase it should the accruing data suggest that such an increase is warranted30–33 (BOX 5).
Extending the methodology to unknown σ. although the group sequential and adap-tive SSr methods were presented under the assumption that the standard deviation σ is known, they apply equally for the case of unknown σ30–32. one can start out with an initial estimate of σ and corresponding sample-size estimate. Then, following an interim analysis, one can re-estimate this nuisance parameter, input the updated esti-mate into the equation and re-compute the sample size. an illustrative example is given in FIG. 3.
There are two ways to obtain the new sample size in the situation of unknown σ: blinded and unblinded. In the instance of blinded sample size re-estimation, the sponsor uses pooled data to estimate σ. This is permitted with no penalty to the analysis criteria (that is, alpha, or the probability of Type I (false positive) error). It is preferable that the sponsor pre-specifies how many times changes are to be made to the sample size, at what time points and
P e r s P e c t i v e s
954 | deCeMBer 2009 | volUMe 8 www.nature.com/reviews/drugdisc
nrd_persp_dec09.indd 954 16/11/09 13:57:43
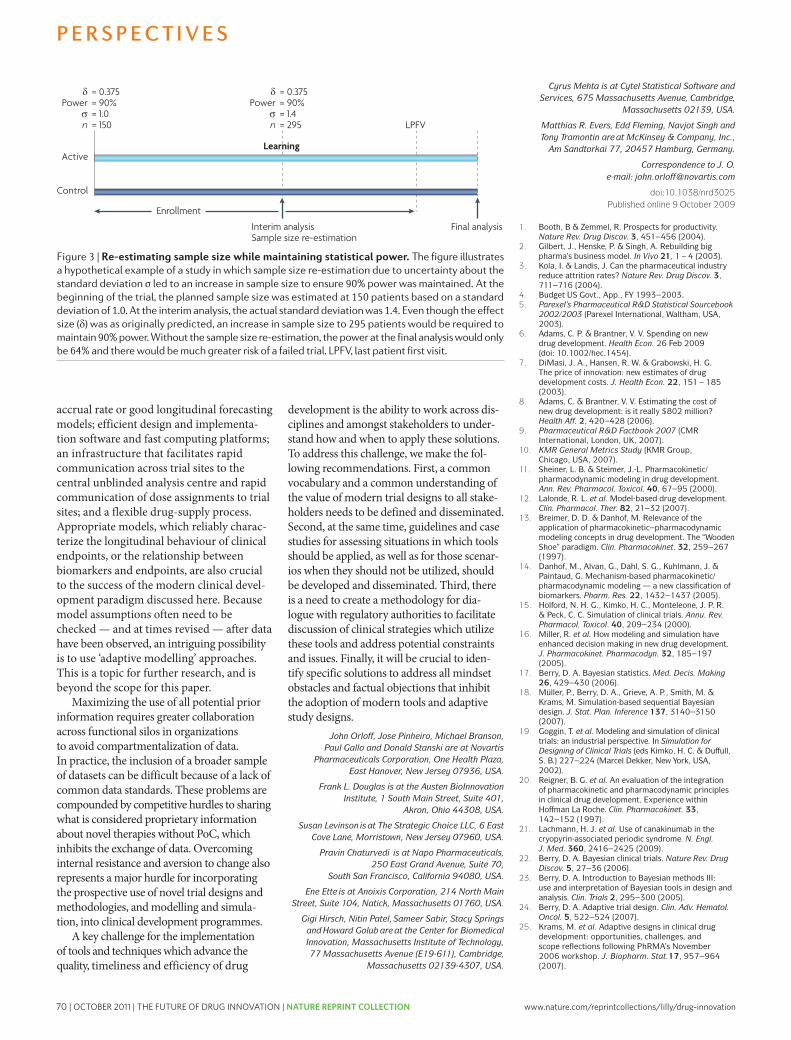
70 | OCTOBER 2011 | THE FUTURE OF DRUG INNOVATION | NATURE REPRINT COLLECTION www.nature.com/reprintcollections/lilly/drug-innovation
26. Gallo, P. et al. Adaptive designs in clinical drug development — an executive summary of the PhRMA Working Group. J. Biopharm. Stat. 16, 275–283 (2006).
27. Bornkamp, B. et al. Innovative approaches for designing and analyzing adaptive dose-ranging trials. J. Biopharm. Stat. 17, 965–995 (2007).
28. Weir, C. J., Spiegelhalter, D. J. & Grieve, A. P. Flexible design and efficient implementation of adaptive dose-finding studies. J. Biopharm. Stat. 17, 1033–1050 (2007).
29. Bretz, F., Schmidli, H., König, F., Racine, A. & Maurer, W. Confirmatory seamless Phase II/III clinical trials with hypotheses selection at interim: general concepts. Biom. J. 48, 623–634 (2006).
30. Mehta, C. R. & Patel, N. R. Adaptive, group sequential and decision theoretic approaches to sample size determination. Stat. Med. 25, 3250–3269 (2006).
31. Chuang-Stein, C., Anderson, K., Gallo, P. & Collins, S. Sample size reestimation: a review and recommendations. Drug Inf. J. 40, 475–484 (2006).
32. Golub, H. L. The need for more efficient clinical trials. Stat. Med. 25, 3231–3235 (2006).
33. Tsiatis, A. A. & Mehta, C. On the inefficiency of the adaptive design for monitoring clinical trials. Biometrika 90, 367–378 (2003).
AcknowledgementsA special acknowledgment to W. Dere (Amgen), S. Cummings (UCSF), A. Lee (Pfizer) and E. Berndt (MIT-CBI) for signifi-cant contributions to discussions leading to this manuscript. Also, many thanks to the McKinsey Trial Design Team for their support (M. E., E. F., N. S. and T. T.).
Competing interests statementThe authors declare competing financial interests: see web version for details.
DATABASESOMiM: http://www.ncbi.nlm.nih.gov/entrez/query.fcgi?db=OMiMMuckle–Wells syndrome | type 2 diabetes
SUppLEMEnTARy inFoRMATionsee online article: s1 (box) | s2 (box) | s3 (figure)
ALL Links Are Active in the onLine PDf
P e r s P e c t i v e s
naTUre revIeWS | Drug Discovery volUMe 8 | deCeMBer 2009 | 957
nrd_persp_dec09.indd 957 16/11/09 13:57:44
Nature Reviews | Drug Discovery
Active
Final analysis
LPFV
Interim analysisSample size re-estimation
Enrollment
Control
δPower
σn
= 0.375= 90%= 1.0= 150
δPower
σn
= 0.375= 90%= 1.4= 295
Learning
Figure 3 | re-estimating sample size while maintaining statistical power. The figure illustrates a hypothetical example of a study in which sample size re-estimation due to uncertainty about the standard deviation σ led to an increase in sample size to ensure 90% power was maintained. At the beginning of the trial, the planned sample size was estimated at 150 patients based on a standard deviation of 1.0. At the interim analysis, the actual standard deviation was 1.4. even though the effect size (δ) was as originally predicted, an increase in sample size to 295 patients would be required to maintain 90% power. Without the sample size re-estimation, the power at the final analysis would only be 64% and there would be much greater risk of a failed trial. LPFv, last patient first visit.
accrual rate or good longitudinal forecasting models; efficient design and implementa-tion software and fast computing platforms; an infrastructure that facilitates rapid communication across trial sites to the central unblinded analysis centre and rapid communication of dose assignments to trial sites; and a flexible drug-supply process. appropriate models, which reliably charac-terize the longitudinal behaviour of clinical endpoints, or the relationship between biomarkers and endpoints, are also crucial to the success of the modern clinical devel-opment paradigm discussed here. Because model assumptions often need to be checked — and at times revised — after data have been observed, an intriguing possibility is to use ‘adaptive modelling’ approaches. This is a topic for further research, and is beyond the scope for this paper.
Maximizing the use of all potential prior information requires greater collaboration across functional silos in organizations to avoid compartmentalization of data. In practice, the inclusion of a broader sample of datasets can be difficult because of a lack of common data standards. These problems are compounded by competitive hurdles to sharing what is considered proprietary information about novel therapies without PoC, which inhibits the exchange of data. overcoming internal resistance and aversion to change also represents a major hurdle for incorporating the prospective use of novel trial designs and methodologies, and modelling and simula-tion, into clinical development programmes.
a key challenge for the implementation of tools and techniques which advance the quality, timeliness and efficiency of drug
development is the ability to work across dis-ciplines and amongst stakeholders to under-stand how and when to apply these solutions. To address this challenge, we make the fol-lowing recommendations. First, a common vocabulary and a common understanding of the value of modern trial designs to all stake-holders needs to be defined and disseminated. Second, at the same time, guidelines and case studies for assessing situations in which tools should be applied, as well as for those scenar-ios when they should not be utilized, should be developed and disseminated. Third, there is a need to create a methodology for dia-logue with regulatory authorities to facilitate discussion of clinical strategies which utilize these tools and address potential constraints and issues. Finally, it will be crucial to iden-tify specific solutions to address all mindset obstacles and factual objections that inhibit the adoption of modern tools and adaptive study designs.
John Orloff, Jose Pinheiro, Michael Branson, Paul Gallo and Donald Stanski are at Novartis
Pharmaceuticals Corporation, One Health Plaza, East Hanover, New Jersey 07936, USA.
Frank L. Douglas is at the Austen BioInnovation Institute, 1 South Main Street, Suite 401,
Akron, Ohio 44308, USA.
Susan Levinson is at The Strategic Choice LLC, 6 East Cove Lane, Morristown, New Jersey 07960, USA.
Pravin Chaturvedi is at Napo Pharmaceuticals, 250 East Grand Avenue, Suite 70,
South San Francisco, California 94080, USA.
Ene Ette is at Anoixis Corporation, 214 North Main Street, Suite 104, Natick, Massachusetts 01760, USA.
Gigi Hirsch, Nitin Patel, Sameer Sabir, Stacy Springs and Howard Golub are at the Center for Biomedical Innovation, Massachusetts Institute of Technology, 77 Massachusetts Avenue (E19‑611), Cambridge,
Massachusetts 02139‑4307, USA.
Cyrus Mehta is at Cytel Statistical Software and Services, 675 Massachusetts Avenue, Cambridge,
Massachusetts 02139, USA.
Matthias R. Evers, Edd Fleming, Navjot Singh and Tony Tramontin are at McKinsey & Company, Inc.,
Am Sandtorkai 77, 20457 Hamburg, Germany.
Correspondence to J. O. e‑mail: [email protected]
doi:10.1038/nrd3025 Published online 9 October 2009
1. Booth, B & Zemmel, R. Prospects for productivity. Nature Rev. Drug Discov. 3, 451–456 (2004).
2. Gilbert, J., Henske, P. & Singh, A. Rebuilding big pharma’s business model. In Vivo 21, 1−4 (2003).
3. Kola, I. & Landis, J. Can the pharmaceutical industry reduce attrition rates? Nature Rev. Drug Discov. 3, 711–716 (2004).
4. Budget US Govt., App., FY 1993–2003.5. Parexel’s Pharmaceutical R&D Statistical Sourcebook
2002/2003 (Parexel International, Waltham, USA, 2003).
6. Adams, C. P. & Brantner, V. V. Spending on new drug development. Health Econ. 26 Feb 2009 (doi: 10.1002/hec.1454).
7. DiMasi, J. A., Hansen, R. W. & Grabowski, H. G. The price of innovation: new estimates of drug development costs. J. Health Econ. 22, 151−185 (2003).
8. Adams, C. & Brantner, V. V. Estimating the cost of new drug development: is it really $802 million? Health Aff. 2, 420–428 (2006).
9. Pharmaceutical R&D Factbook 2007 (CMR International, London, UK, 2007).
10. KMR General Metrics Study (KMR Group, Chicago, USA, 2007).
11. Sheiner, L. B. & Steimer, J.-L. Pharmacokinetic/pharmacodynamic modeling in drug development. Ann. Rev. Pharmacol. Toxicol. 40, 67–95 (2000).
12. Lalonde, R. L. et al. Model-based drug development. Clin. Pharmacol. Ther. 82, 21–32 (2007).
13. Breimer, D. D. & Danhof, M. Relevance of the application of pharmacokinetic–pharmacodynamic modeling concepts in drug development. The “Wooden Shoe” paradigm. Clin. Pharmacokinet. 32, 259–267 (1997).
14. Danhof, M., Alvan, G., Dahl, S. G., Kuhlmann, J. & Paintaud, G. Mechanism-based pharmacokinetic/pharmacodynamic modeling — a new classification of biomarkers. Pharm. Res. 22, 1432–1437 (2005).
15. Holford, N. H. G., Kimko, H. C., Monteleone, J. P. R. & Peck, C. C. Simulation of clinical trials. Annu. Rev. Pharmacol. Toxicol. 40, 209–234 (2000).
16. Miller, R. et al. How modeling and simulation have enhanced decision making in new drug development. J. Pharmacokinet. Pharmacodyn. 32, 185–197 (2005).
17. Berry, D. A. Bayesian statistics. Med. Decis. Making 26, 429–430 (2006).
18. Müller, P., Berry, D. A., Grieve, A. P., Smith, M. & Krams, M. Simulation-based sequential Bayesian design. J. Stat. Plan. Inference 137, 3140–3150 (2007).
19. Goggin, T. et al. Modeling and simulation of clinical trials: an industrial perspective. In Simulation for Designing of Clinical Trials (eds Kimko, H. C. & Duffull, S. B.) 227–224 (Marcel Dekker, New York, USA, 2002).
20. Reigner, B. G. et al. An evaluation of the integration of pharmacokinetic and pharmacodynamic principles in clinical drug development. Experience within Hoffman La Roche. Clin. Pharmacokinet. 33, 142–152 (1997).
21. Lachmann, H. J. et al. Use of canakinumab in the cryopyrin-associated periodic syndrome. N. Engl. J. Med. 360, 2416–2425 (2009).
22. Berry, D. A. Bayesian clinical trials. Nature Rev. Drug Discov. 5, 27–36 (2006).
23. Berry, D. A. Introduction to Bayesian methods III: use and interpretation of Bayesian tools in design and analysis. Clin. Trials 2, 295–300 (2005).
24. Berry, D. A. Adaptive trial design. Clin. Adv. Hematol. Oncol. 5, 522–524 (2007).
25. Krams, M. et al. Adaptive designs in clinical drug development: opportunities, challenges, and scope reflections following PhRMA’s November 2006 workshop. J. Biopharm. Stat.17, 957–964 (2007).
P e r s P e c t i v e s
956 | deCeMBer 2009 | volUMe 8 www.nature.com/reviews/drugdisc
nrd_persp_dec09.indd 956 16/11/09 13:57:44
www.nature.com/reprintcollections/lilly/drug-innovation NATURE REPRINT COLLECTION | THE FUTURE OF DRUG INNOVATION | OCTOBER 2011 | 71
26. Gallo, P. et al. Adaptive designs in clinical drug development — an executive summary of the PhRMA Working Group. J. Biopharm. Stat. 16, 275–283 (2006).
27. Bornkamp, B. et al. Innovative approaches for designing and analyzing adaptive dose-ranging trials. J. Biopharm. Stat. 17, 965–995 (2007).
28. Weir, C. J., Spiegelhalter, D. J. & Grieve, A. P. Flexible design and efficient implementation of adaptive dose-finding studies. J. Biopharm. Stat. 17, 1033–1050 (2007).
29. Bretz, F., Schmidli, H., König, F., Racine, A. & Maurer, W. Confirmatory seamless Phase II/III clinical trials with hypotheses selection at interim: general concepts. Biom. J. 48, 623–634 (2006).
30. Mehta, C. R. & Patel, N. R. Adaptive, group sequential and decision theoretic approaches to sample size determination. Stat. Med. 25, 3250–3269 (2006).
31. Chuang-Stein, C., Anderson, K., Gallo, P. & Collins, S. Sample size reestimation: a review and recommendations. Drug Inf. J. 40, 475–484 (2006).
32. Golub, H. L. The need for more efficient clinical trials. Stat. Med. 25, 3231–3235 (2006).
33. Tsiatis, A. A. & Mehta, C. On the inefficiency of the adaptive design for monitoring clinical trials. Biometrika 90, 367–378 (2003).
AcknowledgementsA special acknowledgment to W. Dere (Amgen), S. Cummings (UCSF), A. Lee (Pfizer) and E. Berndt (MIT-CBI) for signifi-cant contributions to discussions leading to this manuscript. Also, many thanks to the McKinsey Trial Design Team for their support (M. E., E. F., N. S. and T. T.).
Competing interests statementThe authors declare competing financial interests: see web version for details.
DATABASESOMiM: http://www.ncbi.nlm.nih.gov/entrez/query.fcgi?db=OMiMMuckle–Wells syndrome | type 2 diabetes
SUppLEMEnTARy inFoRMATionsee online article: s1 (box) | s2 (box) | s3 (figure)
ALL Links Are Active in the onLine PDf
P e r s P e c t i v e s
naTUre revIeWS | Drug Discovery volUMe 8 | deCeMBer 2009 | 957
nrd_persp_dec09.indd 957 16/11/09 13:57:44
Nature Reviews | Drug Discovery
Active
Final analysis
LPFV
Interim analysisSample size re-estimation
Enrollment
Control
δPower
σn
= 0.375= 90%= 1.0= 150
δPower
σn
= 0.375= 90%= 1.4= 295
Learning
Figure 3 | re-estimating sample size while maintaining statistical power. The figure illustrates a hypothetical example of a study in which sample size re-estimation due to uncertainty about the standard deviation σ led to an increase in sample size to ensure 90% power was maintained. At the beginning of the trial, the planned sample size was estimated at 150 patients based on a standard deviation of 1.0. At the interim analysis, the actual standard deviation was 1.4. even though the effect size (δ) was as originally predicted, an increase in sample size to 295 patients would be required to maintain 90% power. Without the sample size re-estimation, the power at the final analysis would only be 64% and there would be much greater risk of a failed trial. LPFv, last patient first visit.
accrual rate or good longitudinal forecasting models; efficient design and implementa-tion software and fast computing platforms; an infrastructure that facilitates rapid communication across trial sites to the central unblinded analysis centre and rapid communication of dose assignments to trial sites; and a flexible drug-supply process. appropriate models, which reliably charac-terize the longitudinal behaviour of clinical endpoints, or the relationship between biomarkers and endpoints, are also crucial to the success of the modern clinical devel-opment paradigm discussed here. Because model assumptions often need to be checked — and at times revised — after data have been observed, an intriguing possibility is to use ‘adaptive modelling’ approaches. This is a topic for further research, and is beyond the scope for this paper.
Maximizing the use of all potential prior information requires greater collaboration across functional silos in organizations to avoid compartmentalization of data. In practice, the inclusion of a broader sample of datasets can be difficult because of a lack of common data standards. These problems are compounded by competitive hurdles to sharing what is considered proprietary information about novel therapies without PoC, which inhibits the exchange of data. overcoming internal resistance and aversion to change also represents a major hurdle for incorporating the prospective use of novel trial designs and methodologies, and modelling and simula-tion, into clinical development programmes.
a key challenge for the implementation of tools and techniques which advance the quality, timeliness and efficiency of drug
development is the ability to work across dis-ciplines and amongst stakeholders to under-stand how and when to apply these solutions. To address this challenge, we make the fol-lowing recommendations. First, a common vocabulary and a common understanding of the value of modern trial designs to all stake-holders needs to be defined and disseminated. Second, at the same time, guidelines and case studies for assessing situations in which tools should be applied, as well as for those scenar-ios when they should not be utilized, should be developed and disseminated. Third, there is a need to create a methodology for dia-logue with regulatory authorities to facilitate discussion of clinical strategies which utilize these tools and address potential constraints and issues. Finally, it will be crucial to iden-tify specific solutions to address all mindset obstacles and factual objections that inhibit the adoption of modern tools and adaptive study designs.
John Orloff, Jose Pinheiro, Michael Branson, Paul Gallo and Donald Stanski are at Novartis
Pharmaceuticals Corporation, One Health Plaza, East Hanover, New Jersey 07936, USA.
Frank L. Douglas is at the Austen BioInnovation Institute, 1 South Main Street, Suite 401,
Akron, Ohio 44308, USA.
Susan Levinson is at The Strategic Choice LLC, 6 East Cove Lane, Morristown, New Jersey 07960, USA.
Pravin Chaturvedi is at Napo Pharmaceuticals, 250 East Grand Avenue, Suite 70,
South San Francisco, California 94080, USA.
Ene Ette is at Anoixis Corporation, 214 North Main Street, Suite 104, Natick, Massachusetts 01760, USA.
Gigi Hirsch, Nitin Patel, Sameer Sabir, Stacy Springs and Howard Golub are at the Center for Biomedical Innovation, Massachusetts Institute of Technology, 77 Massachusetts Avenue (E19‑611), Cambridge,
Massachusetts 02139‑4307, USA.
Cyrus Mehta is at Cytel Statistical Software and Services, 675 Massachusetts Avenue, Cambridge,
Massachusetts 02139, USA.
Matthias R. Evers, Edd Fleming, Navjot Singh and Tony Tramontin are at McKinsey & Company, Inc.,
Am Sandtorkai 77, 20457 Hamburg, Germany.
Correspondence to J. O. e‑mail: [email protected]
doi:10.1038/nrd3025 Published online 9 October 2009
1. Booth, B & Zemmel, R. Prospects for productivity. Nature Rev. Drug Discov. 3, 451–456 (2004).
2. Gilbert, J., Henske, P. & Singh, A. Rebuilding big pharma’s business model. In Vivo 21, 1−4 (2003).
3. Kola, I. & Landis, J. Can the pharmaceutical industry reduce attrition rates? Nature Rev. Drug Discov. 3, 711–716 (2004).
4. Budget US Govt., App., FY 1993–2003.5. Parexel’s Pharmaceutical R&D Statistical Sourcebook
2002/2003 (Parexel International, Waltham, USA, 2003).
6. Adams, C. P. & Brantner, V. V. Spending on new drug development. Health Econ. 26 Feb 2009 (doi: 10.1002/hec.1454).
7. DiMasi, J. A., Hansen, R. W. & Grabowski, H. G. The price of innovation: new estimates of drug development costs. J. Health Econ. 22, 151−185 (2003).
8. Adams, C. & Brantner, V. V. Estimating the cost of new drug development: is it really $802 million? Health Aff. 2, 420–428 (2006).
9. Pharmaceutical R&D Factbook 2007 (CMR International, London, UK, 2007).
10. KMR General Metrics Study (KMR Group, Chicago, USA, 2007).
11. Sheiner, L. B. & Steimer, J.-L. Pharmacokinetic/pharmacodynamic modeling in drug development. Ann. Rev. Pharmacol. Toxicol. 40, 67–95 (2000).
12. Lalonde, R. L. et al. Model-based drug development. Clin. Pharmacol. Ther. 82, 21–32 (2007).
13. Breimer, D. D. & Danhof, M. Relevance of the application of pharmacokinetic–pharmacodynamic modeling concepts in drug development. The “Wooden Shoe” paradigm. Clin. Pharmacokinet. 32, 259–267 (1997).
14. Danhof, M., Alvan, G., Dahl, S. G., Kuhlmann, J. & Paintaud, G. Mechanism-based pharmacokinetic/pharmacodynamic modeling — a new classification of biomarkers. Pharm. Res. 22, 1432–1437 (2005).
15. Holford, N. H. G., Kimko, H. C., Monteleone, J. P. R. & Peck, C. C. Simulation of clinical trials. Annu. Rev. Pharmacol. Toxicol. 40, 209–234 (2000).
16. Miller, R. et al. How modeling and simulation have enhanced decision making in new drug development. J. Pharmacokinet. Pharmacodyn. 32, 185–197 (2005).
17. Berry, D. A. Bayesian statistics. Med. Decis. Making 26, 429–430 (2006).
18. Müller, P., Berry, D. A., Grieve, A. P., Smith, M. & Krams, M. Simulation-based sequential Bayesian design. J. Stat. Plan. Inference 137, 3140–3150 (2007).
19. Goggin, T. et al. Modeling and simulation of clinical trials: an industrial perspective. In Simulation for Designing of Clinical Trials (eds Kimko, H. C. & Duffull, S. B.) 227–224 (Marcel Dekker, New York, USA, 2002).
20. Reigner, B. G. et al. An evaluation of the integration of pharmacokinetic and pharmacodynamic principles in clinical drug development. Experience within Hoffman La Roche. Clin. Pharmacokinet. 33, 142–152 (1997).
21. Lachmann, H. J. et al. Use of canakinumab in the cryopyrin-associated periodic syndrome. N. Engl. J. Med. 360, 2416–2425 (2009).
22. Berry, D. A. Bayesian clinical trials. Nature Rev. Drug Discov. 5, 27–36 (2006).
23. Berry, D. A. Introduction to Bayesian methods III: use and interpretation of Bayesian tools in design and analysis. Clin. Trials 2, 295–300 (2005).
24. Berry, D. A. Adaptive trial design. Clin. Adv. Hematol. Oncol. 5, 522–524 (2007).
25. Krams, M. et al. Adaptive designs in clinical drug development: opportunities, challenges, and scope reflections following PhRMA’s November 2006 workshop. J. Biopharm. Stat.17, 957–964 (2007).
P e r s P e c t i v e s
956 | deCeMBer 2009 | volUMe 8 www.nature.com/reviews/drugdisc
nrd_persp_dec09.indd 956 16/11/09 13:57:44
Brought to you by
Access the insights, advice and commentary of scientists and entrepreneurs building biotech sectors around the world.
Trade Secrets is an interactive platform aiming to inform a new generation of biotech innovators byproviding � rst-person accounts from industry insiders, and by allowing readers to directly interact withbloggers via the comments section. Our contributors hail from India, China, Latin American, NorthAmerica, Europe and beyond, and their backgrounds span the biotech spectrum. Recent posts have coveredbusiness models, recent returns from VC funds, and the Chinese government’s role in growingbiotech, to name a few.
Join the global dialogue on life science entrepreneurship. Scan this code using your mobile device to bookmark the site:
http://blogs.nature.com/trade_secrets
Trade SecretsA Nature Network blog by Bioentrepreneur
23034-06_Nature_Network_TradeSecrets.indd 1 14/06/2011 16:51
Large pharma is in trouble, but is essential for the success of the industry. Tadataka ‘Tachi’ Yamada, President, Global Health Program, Bill and Melinda Gates Foundation
The pharmaceutical industry is currently facing the key challenges of declining R&D productivity, higher barriers to commercial success for innovative drugs and substantial imminent losses of revenue from successful products due to generic competition. For example, it has been estimated that for every US dollar of revenue lost from established products by the largest pharmaceutical companies as a group between 2007 and 2012, only 26 cents will be replaced by revenue from new products1.
Awareness of these challenges has catalysed — and continues to drive — considerable reorganizations in the R&D structures of large pharmaceutical companies. Among the goals of such reorganizations has been the promotion of the type of entrepreneurial culture and behaviour that is considered to thrive in smaller biotechnology companies2 in the hope that this will increase R&D productivity. Indeed, industry observers have attributed some of the present crises in the pharmaceutical industry to the discouragement of entrepreneurial behaviour by limitations inherent in the unwieldy bureaucracies that can proliferate in large pharmaceutical companies3.
Given that the R&D departments in large pharmaceutical companies in theory provide strong platforms for innovation and thus competitive advantage, we therefore sought to investigate three interrelated questions about the potential for entrepreneurship in such companies. First, to what extent is there evidence of entrepreneurial behaviour in large pharmaceutical companies? Second, can the entrepreneurial behaviour characteristic of small biotechnology firms coexist in the context of the largescale and latestage development activities typical in large pharmaceutical companies? And third, are there any lessons from the experiences of R&D leaders in such companies that could be used to inform the future development of corporate cultures in the pharmaceutical industry?
In an attempt to answer these questions, we first reviewed the relevant literature and identified some of the characteristics associated with entrepreneurial behaviour4. It must, however, be noted that there is a paucity of literature on entrepreneurial behaviour in industries with a prolonged cycle time between the application of new science and product launch, as is the case in the pharmaceutical industry. We chose to focus on three principal characteristics of entrepreneurs — which we termed vision, bias for action and winning attitude — and identified forms of behaviour corresponding to each category for both individual
entrepreneurs and entrepreneurial organizations. Vision refers to the ability to see and the drive to realize the potential value of nascent ideas and technologies. Bias for action refers to a readiness to make and to implement decisions and to modify these actions as new information becomes available. Winning attitude is the propensity to see hurdles as manageable challenges and to treat what others consider failure merely as unwanted or unexpected outcomes.
Our research relied on openended interviews with former and present leaders of R&D departments in pharmaceutical and biotechnology companies (see BOX 1 for the affiliations of the interviewees and BOX 2 for the interview methods). Together, these organizations represented greater than 35% of the pharmaceutical industry output in 2007 (as measured in sales)5,6. In this article, we synthesize the findings from these interviews to highlight common themes and key factors that could promote entrepreneurial behaviour in the pharmaceutical industry, and thereby help to enhance R&D productivity.
Theme 1: fewer shots on goalSuccess isn’t necessarily how many shots on goal, but on betting on the high probability. It’s fewer shots on goal. Phil Needleman, former Senior Executive Vice President and Chief Scientist, Pharmacia
Approaches to drug discovery that focus on the number of compounds, which were established in some companies from the late 1990s onwards, may have actually discouraged entrepreneurial behaviour during the discovery phase. “The ‘compound progression model’ [which focuses on the significance of attrition during each phase of development] might have rendered a major disservice to the biopharmaceutical industry,” noted Yamada. “It took the industry away from innovation and pushed it to volume.”
The consequence of this approach was a focus on portfolio management and on quantity instead of quality, and an emphasis on the production of new molecular entities (NMEs) at each stage. As Yamada explained, large companies were then evaluated and rewarded by analysts for the number of compounds in their R&D pipeline and,
O u T lO O k
The case for entrepreneurship in R&D in the pharmaceutical industryFrank L. Douglas, V. K. Narayanan, Lesa Mitchell and Robert E. Litan
Abstract | A lack of entrepreneurial behaviour has often been highlighted as a contributor to the decline in the research and development (R&D) productivity of the pharmaceutical industry. Here, we present an assessment of entrepreneurship in the industry, based on interviews with 26 former and current leaders of R&D departments at major pharmaceutical and biotechnology companies. Factors are highlighted that could be important in promoting entrepreneurial behaviour, which might serve as a catalyst for revitalizing R&D productivity.
PeRsPectives
NATURE REVIEWS | Drug Discovery VOlUME 9 | SEPTEMBER 2010 | 683
nrd_persp_sep10.indd 683 18/8/10 14:06:26
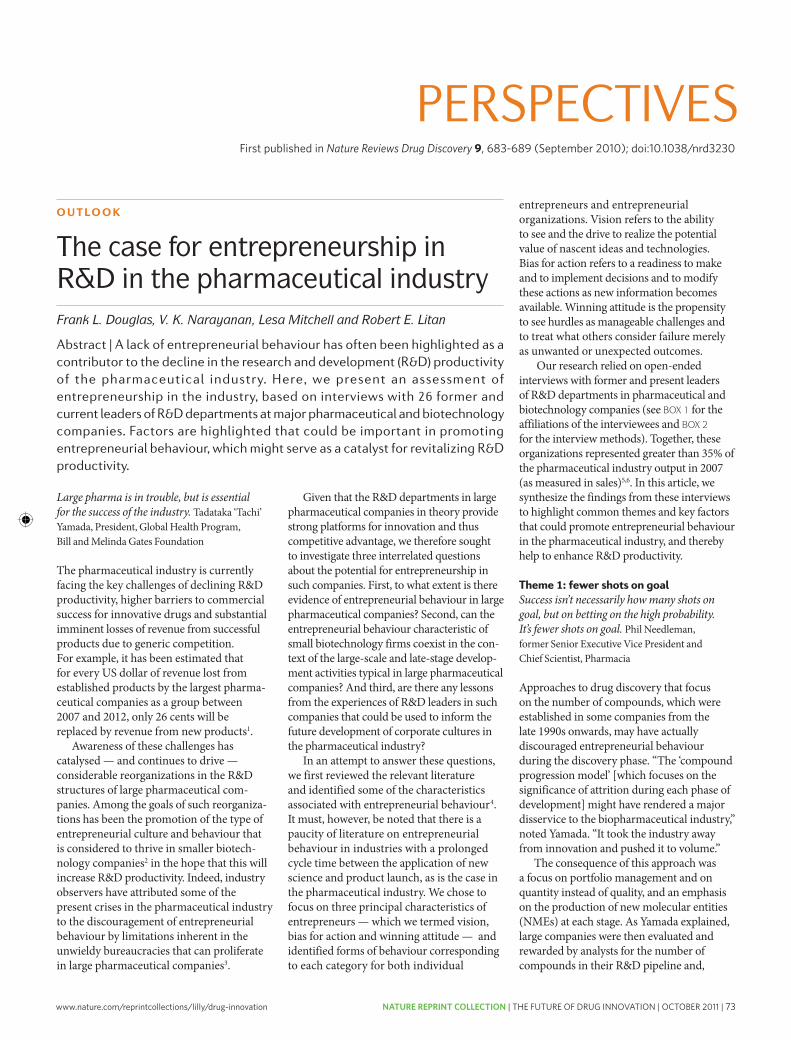
www.nature.com/reprintcollections/lilly/drug-innovation NATURE REPRINT COLLECTION | THE FUTURE OF DRUG INNOVATION | OCTOBER 2011 | 73
Brought to you by
Access the insights, advice and commentary of scientists and entrepreneurs building biotech sectors around the world.
Trade Secrets is an interactive platform aiming to inform a new generation of biotech innovators byproviding � rst-person accounts from industry insiders, and by allowing readers to directly interact withbloggers via the comments section. Our contributors hail from India, China, Latin American, NorthAmerica, Europe and beyond, and their backgrounds span the biotech spectrum. Recent posts have coveredbusiness models, recent returns from VC funds, and the Chinese government’s role in growingbiotech, to name a few.
Join the global dialogue on life science entrepreneurship. Scan this code using your mobile device to bookmark the site:
http://blogs.nature.com/trade_secrets
Trade SecretsA Nature Network blog by Bioentrepreneur
23034-06_Nature_Network_TradeSecrets.indd 1 14/06/2011 16:51
Large pharma is in trouble, but is essential for the success of the industry. Tadataka ‘Tachi’ Yamada, President, Global Health Program, Bill and Melinda Gates Foundation
The pharmaceutical industry is currently facing the key challenges of declining R&D productivity, higher barriers to commercial success for innovative drugs and substantial imminent losses of revenue from successful products due to generic competition. For example, it has been estimated that for every US dollar of revenue lost from established products by the largest pharmaceutical companies as a group between 2007 and 2012, only 26 cents will be replaced by revenue from new products1.
Awareness of these challenges has catalysed — and continues to drive — considerable reorganizations in the R&D structures of large pharmaceutical companies. Among the goals of such reorganizations has been the promotion of the type of entrepreneurial culture and behaviour that is considered to thrive in smaller biotechnology companies2 in the hope that this will increase R&D productivity. Indeed, industry observers have attributed some of the present crises in the pharmaceutical industry to the discouragement of entrepreneurial behaviour by limitations inherent in the unwieldy bureaucracies that can proliferate in large pharmaceutical companies3.
Given that the R&D departments in large pharmaceutical companies in theory provide strong platforms for innovation and thus competitive advantage, we therefore sought to investigate three interrelated questions about the potential for entrepreneurship in such companies. First, to what extent is there evidence of entrepreneurial behaviour in large pharmaceutical companies? Second, can the entrepreneurial behaviour characteristic of small biotechnology firms coexist in the context of the largescale and latestage development activities typical in large pharmaceutical companies? And third, are there any lessons from the experiences of R&D leaders in such companies that could be used to inform the future development of corporate cultures in the pharmaceutical industry?
In an attempt to answer these questions, we first reviewed the relevant literature and identified some of the characteristics associated with entrepreneurial behaviour4. It must, however, be noted that there is a paucity of literature on entrepreneurial behaviour in industries with a prolonged cycle time between the application of new science and product launch, as is the case in the pharmaceutical industry. We chose to focus on three principal characteristics of entrepreneurs — which we termed vision, bias for action and winning attitude — and identified forms of behaviour corresponding to each category for both individual
entrepreneurs and entrepreneurial organizations. Vision refers to the ability to see and the drive to realize the potential value of nascent ideas and technologies. Bias for action refers to a readiness to make and to implement decisions and to modify these actions as new information becomes available. Winning attitude is the propensity to see hurdles as manageable challenges and to treat what others consider failure merely as unwanted or unexpected outcomes.
Our research relied on openended interviews with former and present leaders of R&D departments in pharmaceutical and biotechnology companies (see BOX 1 for the affiliations of the interviewees and BOX 2 for the interview methods). Together, these organizations represented greater than 35% of the pharmaceutical industry output in 2007 (as measured in sales)5,6. In this article, we synthesize the findings from these interviews to highlight common themes and key factors that could promote entrepreneurial behaviour in the pharmaceutical industry, and thereby help to enhance R&D productivity.
Theme 1: fewer shots on goalSuccess isn’t necessarily how many shots on goal, but on betting on the high probability. It’s fewer shots on goal. Phil Needleman, former Senior Executive Vice President and Chief Scientist, Pharmacia
Approaches to drug discovery that focus on the number of compounds, which were established in some companies from the late 1990s onwards, may have actually discouraged entrepreneurial behaviour during the discovery phase. “The ‘compound progression model’ [which focuses on the significance of attrition during each phase of development] might have rendered a major disservice to the biopharmaceutical industry,” noted Yamada. “It took the industry away from innovation and pushed it to volume.”
The consequence of this approach was a focus on portfolio management and on quantity instead of quality, and an emphasis on the production of new molecular entities (NMEs) at each stage. As Yamada explained, large companies were then evaluated and rewarded by analysts for the number of compounds in their R&D pipeline and,
O u T lO O k
The case for entrepreneurship in R&D in the pharmaceutical industryFrank L. Douglas, V. K. Narayanan, Lesa Mitchell and Robert E. Litan
Abstract | A lack of entrepreneurial behaviour has often been highlighted as a contributor to the decline in the research and development (R&D) productivity of the pharmaceutical industry. Here, we present an assessment of entrepreneurship in the industry, based on interviews with 26 former and current leaders of R&D departments at major pharmaceutical and biotechnology companies. Factors are highlighted that could be important in promoting entrepreneurial behaviour, which might serve as a catalyst for revitalizing R&D productivity.
PeRsPectives
NATURE REVIEWS | Drug Discovery VOlUME 9 | SEPTEMBER 2010 | 683
nrd_persp_sep10.indd 683 18/8/10 14:06:26
First published in Nature Reviews Drug Discovery 9, 683-689 (September 2010); doi:10.1038/nrd3230
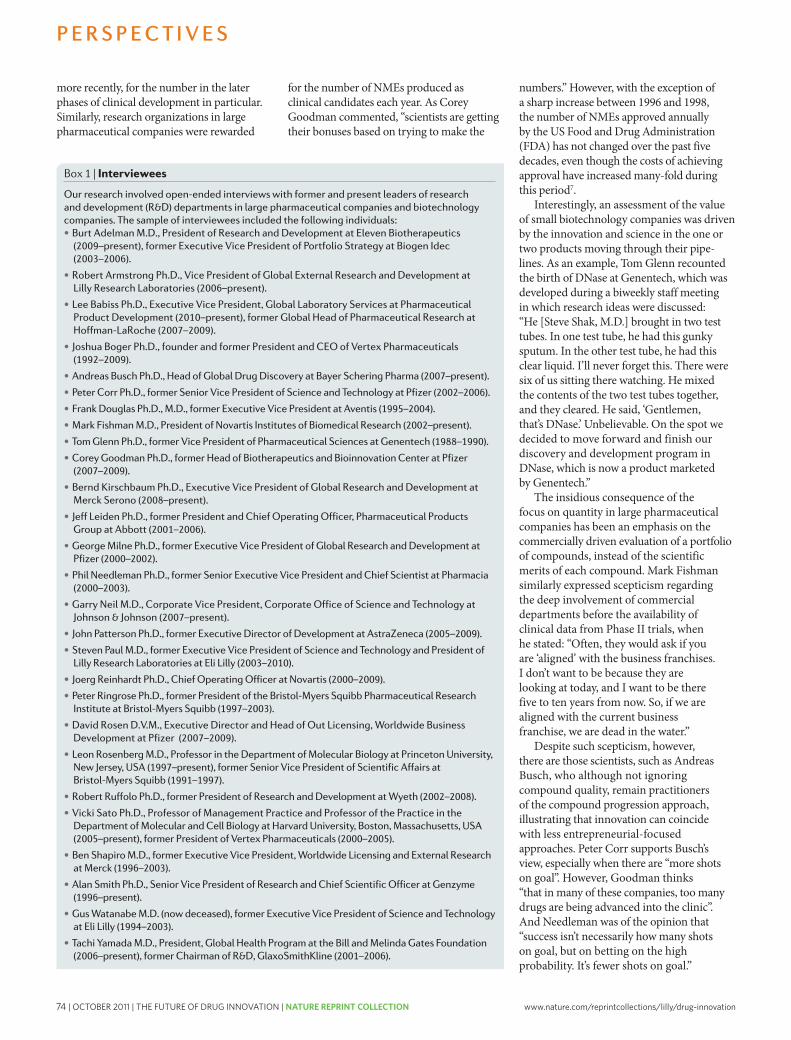
74 | OCTOBER 2011 | THE FUTURE OF DRUG INNOVATION | NATURE REPRINT COLLECTION www.nature.com/reprintcollections/lilly/drug-innovation
Theme 2: smaller is betterI think the key is creating something which is close to a biotech company … within big pharma. Garry Neil, Corporate Vice President, Corporate Office of Science and Technology (COSAT), Group President, Johnson & Johnson pharmaceutical R&D
Several heads of research departments expressed the view that “small is better”. Frank Douglas and Tachi Yamada each tried to reduce size and complexity in their companies. In 1998, Douglas introduced the drug innovation and approval (DI&A) organization at Hoechst Marion Roussel (now part of SanofiAventis) in which each of the three discovery sites (one each in New Jersey, USA, Frankfurt, Germany, and Paris, France) was responsible for no more than two to three therapeutic areas through to Phase IIa, and a global development centre coordinated the latestage development and regulatory submission activities. A product development committee determined which compounds would be further developed beyond Phase IIa by the global development centre.
Yamada introduced the Centres of Excellence for Drug Discovery (CEDDs) at GlaxoSmithKline. Each CEDD was responsible for one or two therapeutic areas through to Phase IIa trials. There was more autonomy in the CEDD, as compared to the DI&A, in that the only item that was centrally controlled was headcount. Recently, GlaxoSmithKline evolved the CEDDs into smaller subgroups, as they thought the CEDDs had become too bureaucratic.
There seems to be an inverse correlation between the size of an organization and its potential to develop trust among its constituents and facilitate the rapid exchange of data for the generation and testing of hypotheses. Joshua Boger and Vicki Sato described the focus of Vertex Pharmaceuticals as building a culture in which people are rewarded for making quality data rapidly available and ready for integration. “I think they [large pharmaceutical companies] have difficulty sharing information quickly … holding onto information can be a form of power … it is part of a behaviour pattern that contributes to things taking longer, costing more and creating redundancy,” said Sato.
Confidence in the quality of data presented allowed departments to circumvent the wasteful practice of rechecking data because of a lack of trust in the expertise or in the care of those who initially generated the data. The accessibility of senior managers and their involvement in project status discussions is essential in reinforcing these
principles of rapid exchange of quality data and testing of hypotheses, all of which are hampered as organizations increase in size. Boger and Sato also noted that as Vertex increased in size, much more time was required to build these cultural aspects. Sato added: “I went to every project team meeting and before I joined Vertex, Josh went to every team meeting. It allowed us as senior executives to lead by example and build the culture. You can do that when you are small.”
However, with 200 to 250 researchers per therapeutic area, the DI&A and CEDD groups were still too large in the view of Goodman, who feels that “the optimum size of a discovery group is one in which all members could assemble in a modestsized room and conduct a discussion without recourse to a microphone.” Corr, who led groups at Searle, ParkeDavis and Pfizer, thinks that the optimal number is closer to 20 to 40 individuals operating as an autonomous group. Corr discovered that very small teams at ParkeDavis allowed for the rapid sharing of information and resource allocation, as well as the efficient termination of projects that would eventually fail. Yamada similarly talked about small groups being “agile and interconnected to the other person.”
A recent experiment at Pfizer, known as the Biotherapeutics and Bioinnovation Center, which was led by Goodman and has since been dissolved, was focused on managing four to five independent small biotechnology companies in a network. In this arrangement, best practices could be shared and resources leveraged, but each unit remained autonomous and was to some extent free to advance its own culture. The head of each small company was therefore endowed with a sense of ownership and could more or less operate as an entrepreneur. According to Goodman, Pfizer wanted to see whether such ‘skunkworks’ strategies, similar to those used in the information technology and electrical engineering fields, could be harnessed to change the way compounds were typically developed. Neil also supports this view of the potential of small companies to produce changes within their respective larger corporate structures. He characterizes the culture at Johnson & Johnson as “a hybrid between biotech and large pharma” and attributes its success to the strategy of maintaining the cultures of newly acquired companies and adopting their best practices.
Contributing to the apparent consensus on behalf of the entrepreneurial potential inherent in smaller teams, Fishman offered his perspective on the importance of individuals in innovation: “To me, innovation is generally
an individual effort. There is a person who sees something different, sees something new, has a clarity of vision, and the courage to pursue it. That individual expands to work in an entrepreneurial team to bring the innovation to fruition.” Alan Smith expressed a similar view, noting that in his opinion it is indeed the “curiosity” of the individual scientist that is most often the driver for discovery efforts. Robert Armstrong, in commenting on CHORUS — a unit of 32 lilly employees who comprise an autonomous entity he heads that conducts ‘lean’ development from the candidate selection stage to the proofofconcept of selected lilly compounds — said: “not all of them need to be serial entrepreneurs, but there are individuals who perceive radically different ways to develop new molecules and want to enable these concepts” (see also the section on middle managers).
Although many of those interviewed spoke on behalf of smaller and more entrepreneurial discovery units, Burt Adelman pointed out that such scale does not in itself necessarily engender the “sense of urgency” crucial to successful product innovation. He argued that entrepreneurial behaviour diminished even in biotechnology companies when the focus was primarily on publications rather than on products. In this context, he poses the difficult question of why scientists who have not been associated even with a failed drug after 6 or 7 years should still be employed by that company.
George Milne conceded the previously cited benefits associated with small size, but also presented an argument on behalf of larger corporate structures in which smaller units benefit from the experiences and tacit aggregate knowledge of the larger organization. Milne considers that the biopharmaceutical industry must learn to scale small entrepreneurial units without introducing excessive bureaucracy. Such units thus become empowered to unleash “random and purposeful action”. Milne also noted that “one of the scalebased advantages that a large, entrepreneurial organization has over a small one is that you actually get to learn from experiences.”
A comment from Jeff leiden provides an eloquent if blunt summary to a consideration of the benefits associated with the deployment of smaller teams and the instinctive, curiositydriven culture they foster: “So, it became clear to me that the way to organize R&D, and frankly I think the whole business, is in much smaller entrepreneurial units where people feel both responsible and accountable for producing or their unit won’t be renewed. They know that their careers depend directly on their productivity.”
P e r s P e c t i v e s
NATURE REVIEWS | Drug Discovery VOlUME 9 | SEPTEMBER 2010 | 685
nrd_persp_sep10.indd 685 18/8/10 14:06:26
more recently, for the number in the later phases of clinical development in particular. Similarly, research organizations in large pharmaceutical companies were rewarded
for the number of NMEs produced as clinical candidates each year. As Corey Goodman commented, “scientists are getting their bonuses based on trying to make the
numbers.” However, with the exception of a sharp increase between 1996 and 1998, the number of NMEs approved annually by the US Food and Drug Administration (FDA) has not changed over the past five decades, even though the costs of achieving approval have increased manyfold during this period7.
Interestingly, an assessment of the value of small biotechnology companies was driven by the innovation and science in the one or two products moving through their pipelines. As an example, Tom Glenn recounted the birth of DNase at Genentech, which was developed during a biweekly staff meeting in which research ideas were discussed: “He [Steve Shak, M.D.] brought in two test tubes. In one test tube, he had this gunky sputum. In the other test tube, he had this clear liquid. I’ll never forget this. There were six of us sitting there watching. He mixed the contents of the two test tubes together, and they cleared. He said, ‘Gentlemen, that’s DNase.’ Unbelievable. On the spot we decided to move forward and finish our discovery and development program in DNase, which is now a product marketed by Genentech.”
The insidious consequence of the focus on quantity in large pharmaceutical companies has been an emphasis on the commercially driven evaluation of a portfolio of compounds, instead of the scientific merits of each compound. Mark Fishman similarly expressed scepticism regarding the deep involvement of commercial departments before the availability of clinical data from Phase II trials, when he stated: “Often, they would ask if you are ‘aligned’ with the business franchises. I don’t want to be because they are looking at today, and I want to be there five to ten years from now. So, if we are aligned with the current business franchise, we are dead in the water.”
Despite such scepticism, however, there are those scientists, such as Andreas Busch, who although not ignoring compound quality, remain practitioners of the compound progression approach, illustrating that innovation can coincide with less entrepreneurialfocused approaches. Peter Corr supports Busch’s view, especially when there are “more shots on goal”. However, Goodman thinks “that in many of these companies, too many drugs are being advanced into the clinic”. And Needleman was of the opinion that “success isn’t necessarily how many shots on goal, but on betting on the high probability. It’s fewer shots on goal.”
Box 1 | Interviewees
Our research involved open-ended interviews with former and present leaders of research and development (R&D) departments in large pharmaceutical companies and biotechnology companies. The sample of interviewees included the following individuals:•Burt Adelman M.D., President of Research and Development at Eleven Biotherapeutics
(2009–present), former Executive Vice President of Portfolio Strategy at Biogen Idec (2003–2006).
•Robert Armstrong Ph.D., Vice President of Global External Research and Development at Lilly Research Laboratories (2006–present).
•Lee Babiss Ph.D., Executive Vice President, Global Laboratory Services at Pharmaceutical Product Development (2010–present), former Global Head of Pharmaceutical Research at Hoffman-LaRoche (2007–2009).
•Joshua Boger Ph.D., founder and former President and CEO of Vertex Pharmaceuticals (1992–2009).
•Andreas Busch Ph.D., Head of Global Drug Discovery at Bayer Schering Pharma (2007–present).
•Peter Corr Ph.D., former Senior Vice President of Science and Technology at Pfizer (2002–2006).
•Frank Douglas Ph.D., M.D., former Executive Vice President at Aventis (1995–2004).
•Mark Fishman M.D., President of Novartis Institutes of Biomedical Research (2002–present).
•Tom Glenn Ph.D., former Vice President of Pharmaceutical Sciences at Genentech (1988–1990).
•Corey Goodman Ph.D., former Head of Biotherapeutics and Bioinnovation Center at Pfizer (2007–2009).
•Bernd Kirschbaum Ph.D., Executive Vice President of Global Research and Development at Merck Serono (2008–present).
•Jeff Leiden Ph.D., former President and Chief Operating Officer, Pharmaceutical Products Group at Abbott (2001–2006).
•George Milne Ph.D., former Executive Vice President of Global Research and Development at Pfizer (2000–2002).
•Phil Needleman Ph.D., former Senior Executive Vice President and Chief Scientist at Pharmacia (2000–2003).
•Garry Neil M.D., Corporate Vice President, Corporate Office of Science and Technology at Johnson & Johnson (2007–present).
•John Patterson Ph.D., former Executive Director of Development at AstraZeneca (2005–2009).
•Steven Paul M.D., former Executive Vice President of Science and Technology and President of Lilly Research Laboratories at Eli Lilly (2003–2010).
•Joerg Reinhardt Ph.D., Chief Operating Officer at Novartis (2000–2009).
•Peter Ringrose Ph.D., former President of the Bristol-Myers Squibb Pharmaceutical Research Institute at Bristol-Myers Squibb (1997–2003).
•David Rosen D.V.M., Executive Director and Head of Out Licensing, Worldwide Business Development at Pfizer (2007–2009).
•Leon Rosenberg M.D., Professor in the Department of Molecular Biology at Princeton University, New Jersey, USA (1997–present), former Senior Vice President of Scientific Affairs at Bristol-Myers Squibb (1991–1997).
•Robert Ruffolo Ph.D., former President of Research and Development at Wyeth (2002–2008).
•Vicki Sato Ph.D., Professor of Management Practice and Professor of the Practice in the Department of Molecular and Cell Biology at Harvard University, Boston, Massachusetts, USA (2005–present), former President of Vertex Pharmaceuticals (2000–2005).
•Ben Shapiro M.D., former Executive Vice President, Worldwide Licensing and External Research at Merck (1996–2003).
•Alan Smith Ph.D., Senior Vice President of Research and Chief Scientific Officer at Genzyme (1996–present).
•Gus Watanabe M.D. (now deceased), former Executive Vice President of Science and Technology at Eli Lilly (1994–2003).
•Tachi Yamada M.D., President, Global Health Program at the Bill and Melinda Gates Foundation (2006–present), former Chairman of R&D, GlaxoSmithKline (2001–2006).
P e r s P e c t i v e s
684 | SEPTEMBER 2010 | VOlUME 9 www.nature.com/reviews/drugdisc
nrd_persp_sep10.indd 684 18/8/10 14:06:26
www.nature.com/reprintcollections/lilly/drug-innovation NATURE REPRINT COLLECTION | THE FUTURE OF DRUG INNOVATION | OCTOBER 2011 | 75
Theme 2: smaller is betterI think the key is creating something which is close to a biotech company … within big pharma. Garry Neil, Corporate Vice President, Corporate Office of Science and Technology (COSAT), Group President, Johnson & Johnson pharmaceutical R&D
Several heads of research departments expressed the view that “small is better”. Frank Douglas and Tachi Yamada each tried to reduce size and complexity in their companies. In 1998, Douglas introduced the drug innovation and approval (DI&A) organization at Hoechst Marion Roussel (now part of SanofiAventis) in which each of the three discovery sites (one each in New Jersey, USA, Frankfurt, Germany, and Paris, France) was responsible for no more than two to three therapeutic areas through to Phase IIa, and a global development centre coordinated the latestage development and regulatory submission activities. A product development committee determined which compounds would be further developed beyond Phase IIa by the global development centre.
Yamada introduced the Centres of Excellence for Drug Discovery (CEDDs) at GlaxoSmithKline. Each CEDD was responsible for one or two therapeutic areas through to Phase IIa trials. There was more autonomy in the CEDD, as compared to the DI&A, in that the only item that was centrally controlled was headcount. Recently, GlaxoSmithKline evolved the CEDDs into smaller subgroups, as they thought the CEDDs had become too bureaucratic.
There seems to be an inverse correlation between the size of an organization and its potential to develop trust among its constituents and facilitate the rapid exchange of data for the generation and testing of hypotheses. Joshua Boger and Vicki Sato described the focus of Vertex Pharmaceuticals as building a culture in which people are rewarded for making quality data rapidly available and ready for integration. “I think they [large pharmaceutical companies] have difficulty sharing information quickly … holding onto information can be a form of power … it is part of a behaviour pattern that contributes to things taking longer, costing more and creating redundancy,” said Sato.
Confidence in the quality of data presented allowed departments to circumvent the wasteful practice of rechecking data because of a lack of trust in the expertise or in the care of those who initially generated the data. The accessibility of senior managers and their involvement in project status discussions is essential in reinforcing these
principles of rapid exchange of quality data and testing of hypotheses, all of which are hampered as organizations increase in size. Boger and Sato also noted that as Vertex increased in size, much more time was required to build these cultural aspects. Sato added: “I went to every project team meeting and before I joined Vertex, Josh went to every team meeting. It allowed us as senior executives to lead by example and build the culture. You can do that when you are small.”
However, with 200 to 250 researchers per therapeutic area, the DI&A and CEDD groups were still too large in the view of Goodman, who feels that “the optimum size of a discovery group is one in which all members could assemble in a modestsized room and conduct a discussion without recourse to a microphone.” Corr, who led groups at Searle, ParkeDavis and Pfizer, thinks that the optimal number is closer to 20 to 40 individuals operating as an autonomous group. Corr discovered that very small teams at ParkeDavis allowed for the rapid sharing of information and resource allocation, as well as the efficient termination of projects that would eventually fail. Yamada similarly talked about small groups being “agile and interconnected to the other person.”
A recent experiment at Pfizer, known as the Biotherapeutics and Bioinnovation Center, which was led by Goodman and has since been dissolved, was focused on managing four to five independent small biotechnology companies in a network. In this arrangement, best practices could be shared and resources leveraged, but each unit remained autonomous and was to some extent free to advance its own culture. The head of each small company was therefore endowed with a sense of ownership and could more or less operate as an entrepreneur. According to Goodman, Pfizer wanted to see whether such ‘skunkworks’ strategies, similar to those used in the information technology and electrical engineering fields, could be harnessed to change the way compounds were typically developed. Neil also supports this view of the potential of small companies to produce changes within their respective larger corporate structures. He characterizes the culture at Johnson & Johnson as “a hybrid between biotech and large pharma” and attributes its success to the strategy of maintaining the cultures of newly acquired companies and adopting their best practices.
Contributing to the apparent consensus on behalf of the entrepreneurial potential inherent in smaller teams, Fishman offered his perspective on the importance of individuals in innovation: “To me, innovation is generally
an individual effort. There is a person who sees something different, sees something new, has a clarity of vision, and the courage to pursue it. That individual expands to work in an entrepreneurial team to bring the innovation to fruition.” Alan Smith expressed a similar view, noting that in his opinion it is indeed the “curiosity” of the individual scientist that is most often the driver for discovery efforts. Robert Armstrong, in commenting on CHORUS — a unit of 32 lilly employees who comprise an autonomous entity he heads that conducts ‘lean’ development from the candidate selection stage to the proofofconcept of selected lilly compounds — said: “not all of them need to be serial entrepreneurs, but there are individuals who perceive radically different ways to develop new molecules and want to enable these concepts” (see also the section on middle managers).
Although many of those interviewed spoke on behalf of smaller and more entrepreneurial discovery units, Burt Adelman pointed out that such scale does not in itself necessarily engender the “sense of urgency” crucial to successful product innovation. He argued that entrepreneurial behaviour diminished even in biotechnology companies when the focus was primarily on publications rather than on products. In this context, he poses the difficult question of why scientists who have not been associated even with a failed drug after 6 or 7 years should still be employed by that company.
George Milne conceded the previously cited benefits associated with small size, but also presented an argument on behalf of larger corporate structures in which smaller units benefit from the experiences and tacit aggregate knowledge of the larger organization. Milne considers that the biopharmaceutical industry must learn to scale small entrepreneurial units without introducing excessive bureaucracy. Such units thus become empowered to unleash “random and purposeful action”. Milne also noted that “one of the scalebased advantages that a large, entrepreneurial organization has over a small one is that you actually get to learn from experiences.”
A comment from Jeff leiden provides an eloquent if blunt summary to a consideration of the benefits associated with the deployment of smaller teams and the instinctive, curiositydriven culture they foster: “So, it became clear to me that the way to organize R&D, and frankly I think the whole business, is in much smaller entrepreneurial units where people feel both responsible and accountable for producing or their unit won’t be renewed. They know that their careers depend directly on their productivity.”
P e r s P e c t i v e s
NATURE REVIEWS | Drug Discovery VOlUME 9 | SEPTEMBER 2010 | 685
nrd_persp_sep10.indd 685 18/8/10 14:06:26
more recently, for the number in the later phases of clinical development in particular. Similarly, research organizations in large pharmaceutical companies were rewarded
for the number of NMEs produced as clinical candidates each year. As Corey Goodman commented, “scientists are getting their bonuses based on trying to make the
numbers.” However, with the exception of a sharp increase between 1996 and 1998, the number of NMEs approved annually by the US Food and Drug Administration (FDA) has not changed over the past five decades, even though the costs of achieving approval have increased manyfold during this period7.
Interestingly, an assessment of the value of small biotechnology companies was driven by the innovation and science in the one or two products moving through their pipelines. As an example, Tom Glenn recounted the birth of DNase at Genentech, which was developed during a biweekly staff meeting in which research ideas were discussed: “He [Steve Shak, M.D.] brought in two test tubes. In one test tube, he had this gunky sputum. In the other test tube, he had this clear liquid. I’ll never forget this. There were six of us sitting there watching. He mixed the contents of the two test tubes together, and they cleared. He said, ‘Gentlemen, that’s DNase.’ Unbelievable. On the spot we decided to move forward and finish our discovery and development program in DNase, which is now a product marketed by Genentech.”
The insidious consequence of the focus on quantity in large pharmaceutical companies has been an emphasis on the commercially driven evaluation of a portfolio of compounds, instead of the scientific merits of each compound. Mark Fishman similarly expressed scepticism regarding the deep involvement of commercial departments before the availability of clinical data from Phase II trials, when he stated: “Often, they would ask if you are ‘aligned’ with the business franchises. I don’t want to be because they are looking at today, and I want to be there five to ten years from now. So, if we are aligned with the current business franchise, we are dead in the water.”
Despite such scepticism, however, there are those scientists, such as Andreas Busch, who although not ignoring compound quality, remain practitioners of the compound progression approach, illustrating that innovation can coincide with less entrepreneurialfocused approaches. Peter Corr supports Busch’s view, especially when there are “more shots on goal”. However, Goodman thinks “that in many of these companies, too many drugs are being advanced into the clinic”. And Needleman was of the opinion that “success isn’t necessarily how many shots on goal, but on betting on the high probability. It’s fewer shots on goal.”
Box 1 | Interviewees
Our research involved open-ended interviews with former and present leaders of research and development (R&D) departments in large pharmaceutical companies and biotechnology companies. The sample of interviewees included the following individuals:•Burt Adelman M.D., President of Research and Development at Eleven Biotherapeutics
(2009–present), former Executive Vice President of Portfolio Strategy at Biogen Idec (2003–2006).
•Robert Armstrong Ph.D., Vice President of Global External Research and Development at Lilly Research Laboratories (2006–present).
•Lee Babiss Ph.D., Executive Vice President, Global Laboratory Services at Pharmaceutical Product Development (2010–present), former Global Head of Pharmaceutical Research at Hoffman-LaRoche (2007–2009).
•Joshua Boger Ph.D., founder and former President and CEO of Vertex Pharmaceuticals (1992–2009).
•Andreas Busch Ph.D., Head of Global Drug Discovery at Bayer Schering Pharma (2007–present).
•Peter Corr Ph.D., former Senior Vice President of Science and Technology at Pfizer (2002–2006).
•Frank Douglas Ph.D., M.D., former Executive Vice President at Aventis (1995–2004).
•Mark Fishman M.D., President of Novartis Institutes of Biomedical Research (2002–present).
•Tom Glenn Ph.D., former Vice President of Pharmaceutical Sciences at Genentech (1988–1990).
•Corey Goodman Ph.D., former Head of Biotherapeutics and Bioinnovation Center at Pfizer (2007–2009).
•Bernd Kirschbaum Ph.D., Executive Vice President of Global Research and Development at Merck Serono (2008–present).
•Jeff Leiden Ph.D., former President and Chief Operating Officer, Pharmaceutical Products Group at Abbott (2001–2006).
•George Milne Ph.D., former Executive Vice President of Global Research and Development at Pfizer (2000–2002).
•Phil Needleman Ph.D., former Senior Executive Vice President and Chief Scientist at Pharmacia (2000–2003).
•Garry Neil M.D., Corporate Vice President, Corporate Office of Science and Technology at Johnson & Johnson (2007–present).
•John Patterson Ph.D., former Executive Director of Development at AstraZeneca (2005–2009).
•Steven Paul M.D., former Executive Vice President of Science and Technology and President of Lilly Research Laboratories at Eli Lilly (2003–2010).
•Joerg Reinhardt Ph.D., Chief Operating Officer at Novartis (2000–2009).
•Peter Ringrose Ph.D., former President of the Bristol-Myers Squibb Pharmaceutical Research Institute at Bristol-Myers Squibb (1997–2003).
•David Rosen D.V.M., Executive Director and Head of Out Licensing, Worldwide Business Development at Pfizer (2007–2009).
•Leon Rosenberg M.D., Professor in the Department of Molecular Biology at Princeton University, New Jersey, USA (1997–present), former Senior Vice President of Scientific Affairs at Bristol-Myers Squibb (1991–1997).
•Robert Ruffolo Ph.D., former President of Research and Development at Wyeth (2002–2008).
•Vicki Sato Ph.D., Professor of Management Practice and Professor of the Practice in the Department of Molecular and Cell Biology at Harvard University, Boston, Massachusetts, USA (2005–present), former President of Vertex Pharmaceuticals (2000–2005).
•Ben Shapiro M.D., former Executive Vice President, Worldwide Licensing and External Research at Merck (1996–2003).
•Alan Smith Ph.D., Senior Vice President of Research and Chief Scientific Officer at Genzyme (1996–present).
•Gus Watanabe M.D. (now deceased), former Executive Vice President of Science and Technology at Eli Lilly (1994–2003).
•Tachi Yamada M.D., President, Global Health Program at the Bill and Melinda Gates Foundation (2006–present), former Chairman of R&D, GlaxoSmithKline (2001–2006).
P e r s P e c t i v e s
684 | SEPTEMBER 2010 | VOlUME 9 www.nature.com/reviews/drugdisc
nrd_persp_sep10.indd 684 18/8/10 14:06:26
76 | OCTOBER 2011 | THE FUTURE OF DRUG INNOVATION | NATURE REPRINT COLLECTION www.nature.com/reprintcollections/lilly/drug-innovation
also introduced the proofofconcept unit CHORUS (see above), and in an extension of this concept, lilly launched a joint venture with Jubilant Organosys in Bangalore, India, to develop molecules between preclinical and Phase II testing in May 2009. Through this collaboration, lilly also benefits from the potential opportunity to have access to successful proofofconcept compounds from sources other than their own research laboratories. Armstrong said that lilly has expanded this concept to several companies in India and China, who work on selected compounds that lilly has the right to buy back when predetermined milestones are achieved. “These activities dismantle vestiges of the ‘not invented here’ syndrome that can mean certain death to entrepreneurial behaviour,” he noted.
Paul of Eli lilly summarizes this more broadly: “So, one element of the transformation from a corporate perspective structurally is to go from this FIPCO (Fully Integrated Pharmaceutical Company) structure to a FIPNET, Fully Integrated Pharmaceutical Network. We’ve defined three levels of this FIPNET. level one is more traditional outsourcing. level two leverages partnerships with universities and small as well as larger companies. These valuesharing partnerships provide both risk sharing and cost sharing. Finally, a level three FIPNET or partial ownership model allows small companies to pursue projects within the context of their unique cultures.”
Our interviews also suggest that discovery stage collaborations are perceived to be effective when the collaborators share a common sense of curiosity and focus on science. The importance of ‘curiosity’ as a driver for the selection of technology, biological mechanisms and collaborations was stressed as a key component of the culture at Genzyme by Smith, who added that curiosity refers to a desire to learn and benefit from knowledge that others “in that university in India or in France” might deem interesting.
We determined that among the tasks that need to be performed at the middle management level are the maintenance of organizational knowledge, the nurturing of mavericks and true believers, and the provision of support for the drug discovery teams. Essential to these roles is the need to remain close to science.
One of the distinguishing characteristics of the biotechnology researchers we interviewed was their closeness to science and their desire to retain this proximity. In large pharmaceutical companies, however, excessive concern with milestones often detracts
from the ability of research teams to remain close to science. Yet to the extent that the rewards system associated with middle management is based on the attainment of milestones and not on the nurturing of science, bureaucracy imposes barriers that are detrimental to drug innovation. Indeed, evolving a more sophisticated and nuanced reward system for middle management may be among the most important organizational priorities for large pharmaceutical companies to stimulate productivity in the crucial discovery stage.
Theme 5: CEO–Head of R&D interactionYou have to really be able to communicate with your CEO if you’re going to do your job optimally in R&D. Gus Watanabe, former Executive Vice President of Science and Technology, Eli lilly
Several of the interviewees, including leon Rosenberg, Watanabe, Goodman, Milne and Glenn, stressed the importance of a close alignment between the CEO and the head of R&D in building and maintaining an optimal culture in discovery. Boger described building an innovative and productive organization as more of a social experiment than a technical one. He and Sato described in nearly identical terms their tireless and consistent efforts to build, nurture and maintain elements such as interdisciplinary teamwork, rapid access to information and a sense of ownership in their organization. Rosenberg described the weekly meetings that he used to have with the CEO: “He wasn’t a scientist, but he appreciated science, and he liked scientists. He and I would converse regularly after he would read his weekly copy of The New England Journal of Medicine. This was a great joy of mine because it kept me very close to him. It allowed me to put science high in the order of his thoughts.” Smith described similar efforts and alignment with Genzyme CEO Henri Termeer in maintaining their organizational culture. Busch and Bernd Kirschbaum gave examples of the considerable challenges and efforts needed to build a common culture in a newly merged organization and its impact on innovation, and the important role that alignment with their CEOs had in their efforts to build the desired culture in discovery. Douglas also commented on the importance of the close alignment between him and Richard Markham when they took on the task of building Hoechst Marion Roussel, the result of merging Hoechst Pharmaceutical, Marion Merrell Dow and Roussel Uclaf, in their respective roles as Head of R&D and CEO.
Theme 6: technology and R&D modelsMy major responsibilities as given to me by the CEO when I joined BMS were to forge a single R&D organization out of two groups with differing strengths in Discovery and Development. leon Rosenberg, Professor at Princeton University and former Senior Vice President of Scientific Affairs, BristolMyers Squibb
The interviews revealed the unexpected finding that although each R&D leader recognized that changing science and technology influenced how they organized their research units, most had not reflected on the impact that organizational changes might have on entrepreneurial behaviour. The interviewees identified four types of organizational structures or models that defined the point at which commitment was made to the fullscale clinical development of a compound (FIG. 1).
First, they described a traditional R&D organization, in which the transition from research to development occurred with the filing of an investigational new drug application. This is termed the preclinical proofofconcept (pPoC) model. The second structure mentioned — the human proofofconcept (hPoC) model — was similar to this, with the addition of clinical pharmacology to improve dose selection and the search for efficacy in humans.
The third structure, known as the clinical proofofconcept (cPoC) model, includes Phase I and Phase IIa trials in research. It uses biomarkers and pharmacokinetic studies to select the best compound to determine efficacy in the target patients, with efficacy in Phase IIa trials being the crucial decision point for full development (FIG. 1).
Watanabe, deceased since the interviews, introduced this concept by having M.D.s or M.D./Ph.D.s responsible for each discovery therapeutic unit from the concept stage to Phase IIa trials at Eli lilly. Glenn introduced the ‘clinical biology unit’ concept in research at Ciba Geigy in 1984 with the goal of carrying out specific studies in patients to achieve proof of concept. Several other companies have adopted this model in various forms. These include the research and early development (RED) units at Johnson & Johnson, the research units at MerckSerono, global drug discovery at Bayer Schering Pharma and disease biology areas at Roche (it should be noted that Roche’s new focus on personalized healthcare by interweaving their diagnostic and pharmaceutical divisions has moved them to the fourth model;
P e r s P e c t i v e s
NATURE REVIEWS | Drug Discovery VOlUME 9 | SEPTEMBER 2010 | 687
nrd_persp_sep10.indd 687 18/8/10 14:06:26
Theme 3: reward systems matterI am firmly a believer that you get what you reward. Josh Boger, former CEO, Vertex Pharmaceuticals
In most industries, as companies grow, there is pressure for each to offer uniform compensation, rewards and benefits. Fishman and Goodman, as well as Peter Ringrose, each referred to the tendency for all departments to compensate in a similar fashion as a “homogenizing effect”. What is curious is that although large companies recognize the need to implement special bonus systems to incentivize sale representatives to act ‘entrepreneurially’, the opposite occurs in R&D. The lack of incentives has persisted owing to organizational inertia, but thoughtful R&D leaders have begun to address this issue by instituting different evaluation and reward systems.
For example, Yamada observed that Sir James Black, who had the key role in the development of βblockers and histamine blockers, never received a major bonus for his discoveries. As a consequence of this awareness, Yamada established a new reward system at GlaxoSmithKline: “I set
up a program where once we had a proofofconcept molecule, we’d form a team of the top scientists in the company. It was like a Nobel committee. They’d go back and research how was it we got here. If they could identify one or two or three people that were really the fundamental reason for the success of that molecule, then those people got an extraordinary deal.” However, although Armstrong admits that they should find a way to reward the members of the CHORUS that might be different from the rest of R&D at Eli lilly, he remarked: “In this experiment, this group, first and foremost, is hugely motivated, very energetic in large part because they’re uniquely empowered to actually carry on a tremendous amount of work in the organization.”
Theme 4: underutilized middle managersI used to give a lecture, and still do, which is entitled ‘The power of the light you shine’. George Milne, former Executive Vice President of Global Research and Development, Pfizer
The role of middle managers — defined as those individuals in large pharmaceutical companies who are not at the executive level,
but who lead large groups or departments and have considerable responsibilities for the successful conduct of projects and programmes — emerged as an important concern in the productivity of discovery units, even more so than in the case of development. Milne observed that scientists become middle managers as a reward for their outstanding scientific contributions and often for their entrepreneurial behaviour. However, after they attain the status of middle managers, they are rewarded for productivity as measured by the number of compounds at the required phase, by achieving timelines and by performing activities that engender need for control and predictability, none of which might be the appropriate measures for discovery. Consequently, middle managers can become frustrated with this change in strategies. Milne motivated middle managers through his Hawthorneeffectstyle lecture, reminding them that although they may not feel that important, the scientists working under them feel they are really important and, as a result, “could tell them where their light shines and where it doesn’t.”
As we probed the desired qualities that would facilitate the selection of middle managers most likely to foster entrepreneurial behaviour, Yamada, Ringrose, Sato and Douglas identified two discovery types, which we term ‘mavericks’ and ‘true believers’. Mavericks are those scientists who, although they may share the goals of the organization, seem to achieve superior results by thinking and working outside the prescribed or routine organizational conventions. True believers not only are convinced of the scientific approach of their given project, but can also communicate and recruit organizational support and resources for the project — a particularly important quality, according to Sato.
Steven Paul, Armstrong, Boger and Fishman stressed the importance of middle managers retaining their scientific/technical edge if the company is to benefit from collaborations. Paul and Armstrong also described a series of approaches used at Eli lilly to engage middle managers in entrepreneurial activities. They focused on the ‘sourcing of innovation’ as a means of getting their middle and senior managers to take ownership for finding the best solutions, regardless of where they were identified. Thus, lilly was an early adopter of the practice of leveraging knowledge from outside the company for solutions to internal problems. This successful approach was later spun out as Innocentive. lilly
Box 2 | Study methods
Before our interviews, we sent each interviewee our lists of behaviours that described both individual and organizational entrepreneurship and the following questions to serve as a basis for the interview:
general questions •Did ‘entrepreneurial’ and ‘big firm’ characteristics fuel the growth of large biopharmaceutical
companies (‘big pharma’)?
•Was or is there entrepreneurial behaviour in big pharma?
•Were there lessons that can inform new organizational paradigms to increase productivity?
interview questions •How would you describe your R&D organization when you assumed leadership?
•What were its strengths and weaknesses?
•What were some of the organizational changes you introduced?
•What did you hope to achieve?
•How did you balance individual recognition versus team recognition?
•What specific outcomes can you cite that were affected by the changes you introduced?
•What are the differences between today’s challenges and those that existed when you were head of R&D?
•What would you do today to address those challenges?
•Did you create any special teams, spin-outs or collaborations to achieve your objectives?
•How did you access R&D knowledge from outside your firm? How has this changed in recent times?
•How did you balance your portfolio with respect to investing in long-term projects versus short-term projects?
The interviews were carried out by teleconference by F. L. Douglas and V. K. Narayanan and were taped with the permission of the participants. This process allowed us to focus on the interview and use the transcripts afterwards to improve our understanding of an issue or later send questions for clarification to the interviewees.
P e r s P e c t i v e s
686 | SEPTEMBER 2010 | VOlUME 9 www.nature.com/reviews/drugdisc
nrd_persp_sep10.indd 686 18/8/10 14:06:26
www.nature.com/reprintcollections/lilly/drug-innovation NATURE REPRINT COLLECTION | THE FUTURE OF DRUG INNOVATION | OCTOBER 2011 | 77
also introduced the proofofconcept unit CHORUS (see above), and in an extension of this concept, lilly launched a joint venture with Jubilant Organosys in Bangalore, India, to develop molecules between preclinical and Phase II testing in May 2009. Through this collaboration, lilly also benefits from the potential opportunity to have access to successful proofofconcept compounds from sources other than their own research laboratories. Armstrong said that lilly has expanded this concept to several companies in India and China, who work on selected compounds that lilly has the right to buy back when predetermined milestones are achieved. “These activities dismantle vestiges of the ‘not invented here’ syndrome that can mean certain death to entrepreneurial behaviour,” he noted.
Paul of Eli lilly summarizes this more broadly: “So, one element of the transformation from a corporate perspective structurally is to go from this FIPCO (Fully Integrated Pharmaceutical Company) structure to a FIPNET, Fully Integrated Pharmaceutical Network. We’ve defined three levels of this FIPNET. level one is more traditional outsourcing. level two leverages partnerships with universities and small as well as larger companies. These valuesharing partnerships provide both risk sharing and cost sharing. Finally, a level three FIPNET or partial ownership model allows small companies to pursue projects within the context of their unique cultures.”
Our interviews also suggest that discovery stage collaborations are perceived to be effective when the collaborators share a common sense of curiosity and focus on science. The importance of ‘curiosity’ as a driver for the selection of technology, biological mechanisms and collaborations was stressed as a key component of the culture at Genzyme by Smith, who added that curiosity refers to a desire to learn and benefit from knowledge that others “in that university in India or in France” might deem interesting.
We determined that among the tasks that need to be performed at the middle management level are the maintenance of organizational knowledge, the nurturing of mavericks and true believers, and the provision of support for the drug discovery teams. Essential to these roles is the need to remain close to science.
One of the distinguishing characteristics of the biotechnology researchers we interviewed was their closeness to science and their desire to retain this proximity. In large pharmaceutical companies, however, excessive concern with milestones often detracts
from the ability of research teams to remain close to science. Yet to the extent that the rewards system associated with middle management is based on the attainment of milestones and not on the nurturing of science, bureaucracy imposes barriers that are detrimental to drug innovation. Indeed, evolving a more sophisticated and nuanced reward system for middle management may be among the most important organizational priorities for large pharmaceutical companies to stimulate productivity in the crucial discovery stage.
Theme 5: CEO–Head of R&D interactionYou have to really be able to communicate with your CEO if you’re going to do your job optimally in R&D. Gus Watanabe, former Executive Vice President of Science and Technology, Eli lilly
Several of the interviewees, including leon Rosenberg, Watanabe, Goodman, Milne and Glenn, stressed the importance of a close alignment between the CEO and the head of R&D in building and maintaining an optimal culture in discovery. Boger described building an innovative and productive organization as more of a social experiment than a technical one. He and Sato described in nearly identical terms their tireless and consistent efforts to build, nurture and maintain elements such as interdisciplinary teamwork, rapid access to information and a sense of ownership in their organization. Rosenberg described the weekly meetings that he used to have with the CEO: “He wasn’t a scientist, but he appreciated science, and he liked scientists. He and I would converse regularly after he would read his weekly copy of The New England Journal of Medicine. This was a great joy of mine because it kept me very close to him. It allowed me to put science high in the order of his thoughts.” Smith described similar efforts and alignment with Genzyme CEO Henri Termeer in maintaining their organizational culture. Busch and Bernd Kirschbaum gave examples of the considerable challenges and efforts needed to build a common culture in a newly merged organization and its impact on innovation, and the important role that alignment with their CEOs had in their efforts to build the desired culture in discovery. Douglas also commented on the importance of the close alignment between him and Richard Markham when they took on the task of building Hoechst Marion Roussel, the result of merging Hoechst Pharmaceutical, Marion Merrell Dow and Roussel Uclaf, in their respective roles as Head of R&D and CEO.
Theme 6: technology and R&D modelsMy major responsibilities as given to me by the CEO when I joined BMS were to forge a single R&D organization out of two groups with differing strengths in Discovery and Development. leon Rosenberg, Professor at Princeton University and former Senior Vice President of Scientific Affairs, BristolMyers Squibb
The interviews revealed the unexpected finding that although each R&D leader recognized that changing science and technology influenced how they organized their research units, most had not reflected on the impact that organizational changes might have on entrepreneurial behaviour. The interviewees identified four types of organizational structures or models that defined the point at which commitment was made to the fullscale clinical development of a compound (FIG. 1).
First, they described a traditional R&D organization, in which the transition from research to development occurred with the filing of an investigational new drug application. This is termed the preclinical proofofconcept (pPoC) model. The second structure mentioned — the human proofofconcept (hPoC) model — was similar to this, with the addition of clinical pharmacology to improve dose selection and the search for efficacy in humans.
The third structure, known as the clinical proofofconcept (cPoC) model, includes Phase I and Phase IIa trials in research. It uses biomarkers and pharmacokinetic studies to select the best compound to determine efficacy in the target patients, with efficacy in Phase IIa trials being the crucial decision point for full development (FIG. 1).
Watanabe, deceased since the interviews, introduced this concept by having M.D.s or M.D./Ph.D.s responsible for each discovery therapeutic unit from the concept stage to Phase IIa trials at Eli lilly. Glenn introduced the ‘clinical biology unit’ concept in research at Ciba Geigy in 1984 with the goal of carrying out specific studies in patients to achieve proof of concept. Several other companies have adopted this model in various forms. These include the research and early development (RED) units at Johnson & Johnson, the research units at MerckSerono, global drug discovery at Bayer Schering Pharma and disease biology areas at Roche (it should be noted that Roche’s new focus on personalized healthcare by interweaving their diagnostic and pharmaceutical divisions has moved them to the fourth model;
P e r s P e c t i v e s
NATURE REVIEWS | Drug Discovery VOlUME 9 | SEPTEMBER 2010 | 687
nrd_persp_sep10.indd 687 18/8/10 14:06:26
Theme 3: reward systems matterI am firmly a believer that you get what you reward. Josh Boger, former CEO, Vertex Pharmaceuticals
In most industries, as companies grow, there is pressure for each to offer uniform compensation, rewards and benefits. Fishman and Goodman, as well as Peter Ringrose, each referred to the tendency for all departments to compensate in a similar fashion as a “homogenizing effect”. What is curious is that although large companies recognize the need to implement special bonus systems to incentivize sale representatives to act ‘entrepreneurially’, the opposite occurs in R&D. The lack of incentives has persisted owing to organizational inertia, but thoughtful R&D leaders have begun to address this issue by instituting different evaluation and reward systems.
For example, Yamada observed that Sir James Black, who had the key role in the development of βblockers and histamine blockers, never received a major bonus for his discoveries. As a consequence of this awareness, Yamada established a new reward system at GlaxoSmithKline: “I set
up a program where once we had a proofofconcept molecule, we’d form a team of the top scientists in the company. It was like a Nobel committee. They’d go back and research how was it we got here. If they could identify one or two or three people that were really the fundamental reason for the success of that molecule, then those people got an extraordinary deal.” However, although Armstrong admits that they should find a way to reward the members of the CHORUS that might be different from the rest of R&D at Eli lilly, he remarked: “In this experiment, this group, first and foremost, is hugely motivated, very energetic in large part because they’re uniquely empowered to actually carry on a tremendous amount of work in the organization.”
Theme 4: underutilized middle managersI used to give a lecture, and still do, which is entitled ‘The power of the light you shine’. George Milne, former Executive Vice President of Global Research and Development, Pfizer
The role of middle managers — defined as those individuals in large pharmaceutical companies who are not at the executive level,
but who lead large groups or departments and have considerable responsibilities for the successful conduct of projects and programmes — emerged as an important concern in the productivity of discovery units, even more so than in the case of development. Milne observed that scientists become middle managers as a reward for their outstanding scientific contributions and often for their entrepreneurial behaviour. However, after they attain the status of middle managers, they are rewarded for productivity as measured by the number of compounds at the required phase, by achieving timelines and by performing activities that engender need for control and predictability, none of which might be the appropriate measures for discovery. Consequently, middle managers can become frustrated with this change in strategies. Milne motivated middle managers through his Hawthorneeffectstyle lecture, reminding them that although they may not feel that important, the scientists working under them feel they are really important and, as a result, “could tell them where their light shines and where it doesn’t.”
As we probed the desired qualities that would facilitate the selection of middle managers most likely to foster entrepreneurial behaviour, Yamada, Ringrose, Sato and Douglas identified two discovery types, which we term ‘mavericks’ and ‘true believers’. Mavericks are those scientists who, although they may share the goals of the organization, seem to achieve superior results by thinking and working outside the prescribed or routine organizational conventions. True believers not only are convinced of the scientific approach of their given project, but can also communicate and recruit organizational support and resources for the project — a particularly important quality, according to Sato.
Steven Paul, Armstrong, Boger and Fishman stressed the importance of middle managers retaining their scientific/technical edge if the company is to benefit from collaborations. Paul and Armstrong also described a series of approaches used at Eli lilly to engage middle managers in entrepreneurial activities. They focused on the ‘sourcing of innovation’ as a means of getting their middle and senior managers to take ownership for finding the best solutions, regardless of where they were identified. Thus, lilly was an early adopter of the practice of leveraging knowledge from outside the company for solutions to internal problems. This successful approach was later spun out as Innocentive. lilly
Box 2 | Study methods
Before our interviews, we sent each interviewee our lists of behaviours that described both individual and organizational entrepreneurship and the following questions to serve as a basis for the interview:
general questions •Did ‘entrepreneurial’ and ‘big firm’ characteristics fuel the growth of large biopharmaceutical
companies (‘big pharma’)?
•Was or is there entrepreneurial behaviour in big pharma?
•Were there lessons that can inform new organizational paradigms to increase productivity?
interview questions •How would you describe your R&D organization when you assumed leadership?
•What were its strengths and weaknesses?
•What were some of the organizational changes you introduced?
•What did you hope to achieve?
•How did you balance individual recognition versus team recognition?
•What specific outcomes can you cite that were affected by the changes you introduced?
•What are the differences between today’s challenges and those that existed when you were head of R&D?
•What would you do today to address those challenges?
•Did you create any special teams, spin-outs or collaborations to achieve your objectives?
•How did you access R&D knowledge from outside your firm? How has this changed in recent times?
•How did you balance your portfolio with respect to investing in long-term projects versus short-term projects?
The interviews were carried out by teleconference by F. L. Douglas and V. K. Narayanan and were taped with the permission of the participants. This process allowed us to focus on the interview and use the transcripts afterwards to improve our understanding of an issue or later send questions for clarification to the interviewees.
P e r s P e c t i v e s
686 | SEPTEMBER 2010 | VOlUME 9 www.nature.com/reviews/drugdisc
nrd_persp_sep10.indd 686 18/8/10 14:06:26
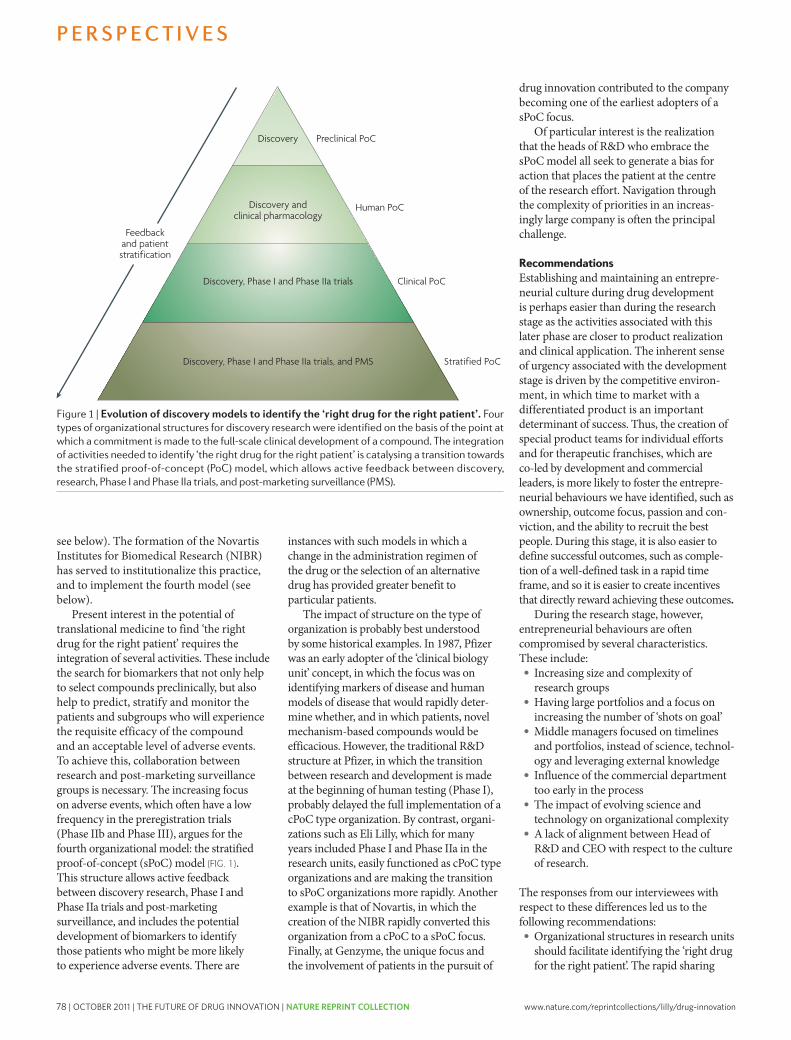
78 | OCTOBER 2011 | THE FUTURE OF DRUG INNOVATION | NATURE REPRINT COLLECTION www.nature.com/reprintcollections/lilly/drug-innovation
and integration of information generated by all the relevant disciplines, regardless of where it is found, must be assisted and rewarded. We recommend that companies seek to move towards the sPoC model (FIG. 1), which extends research to Phase IIa and also incorporates feedback from postmarketing surveillance studies to fuel the continued search for new targets, bio markers and an understanding of offtarget effects. These activities are crucial in the search for the right therapy for the right patient, and will heighten the sense of urgency to get drugs to patients.
•Middle managers should be given incentives to access the best ideas and the best people globally to drive curiosity and ‘open innovation’. Managing external networks and rapidly internalizing the results of new scientific and technical approaches should also be among their priorities. Rewards for managers should be based on the speed with which they achieve the progression of projects, facilitated by their capacity to foster the integration of knowledge and to provide appropriate guidance to ‘true believers’ and ‘mavericks’. Ultimately, companies should use middle managers to transform their culture from something analogous to a “supertanker” to “a flotilla of diverse, nimble and innovative ships”, consisting of the following elements: focus on the patient, scientific curiosity, collaboration, speed to solution and rewards that are aligned with goals.
•Multidisciplinary research teams should consist of no more than 20–40 members who focus on the preclinical and clinical validation of novel targets/mechanisms with responsibility through to clinical proofofconcept in Phase IIa trials. These ‘units of innovation’ should be supported by the traditional discovery research expert groups, such as molecular biology and chemistry, which focus on assessing the molecular validation or relevance of the target and finding lead molecules that interact with the target. Both of these groups should include specialists in postmarketing surveillance to ensure relevance to the patient.
They should also perform relevant studies with academic clinicians to generate information from subsets of patients, which might inform the research efforts and ensure a sPoC approach.
•Heads of R&D must focus indefatigably on building and maintaining an appropriate entrepreneurial culture. Furthermore, the support of the CEO for this focus must be visible and active.
•Companies should be more innovative with respect to reward and recognition for discovery scientists, to foster bias for action, ownership and an appropriate sense of urgency.
•Companies should examine what we term the ‘columns outside the doors’ phenomenon and the subtle impact that this form of recognition might have on entrepreneurial behaviour. Smith described this phenomenon, which occurs across the world: as startup companies become successful, they are relocated from humble laboratories to grander buildings with columns outside their doors. Interestingly, such edifices often violate the observed inverse square relationship between communication among scientists in laboratories and the distance between these laboratories. We offer this insight more as a provocative thought than as a firm recommendation.
We offer one final thought regarding the transferability of these insights from drug discovery research to drug development. In discovery, our data and previous research suggests that concept realization — the metric relevant for gauging the effectiveness of discovery — improves as the size of the innovation unit grows to around 20 to 40 researchers, but then declines as the size of the unit increases and diseconomies of scale take effect. In development, it is common wisdom that the optimal efficiency of the process is obtained when the size of the unit is considerably larger than the optimal size of discovery units. Interestingly, in large pharmaceutical companies, it has become increasingly common to outsource many developmentrelated activities, and as this extends, it is likely that the efficiency–size relationship
may be turned on its head, with pharmaceutical companies managing development with relatively smaller units than they have at present. In that case, the management of discovery units may hold valuable lessons for the conduct of development. These observations might stimulate large pharmaceutical companies to do that which Yamada maintains they can: “transform the industry.”
Frank L. Douglas, Lesa Mitchell and Robert E. Litan are at the Ewing Marion Kauffman Foundation,
Kansas City, Missouri, USA.
Frank L. Douglas is also at the Austen BioInnovation Institute, Akron, Ohio, USA.
V. K. Narayanan is at the Center for Research Excellence, LeBow College of Business,
Drexel University, Philadelphia, Pennsylvania, USA.
Correspondence to F.L.D. e-mail: [email protected]
doi:10.1038/nrd3230 Published online 20 August 2010
1. Goodman, M. Pharma industry performance metrics: 2007–2012E. Nature Rev. Drug Discov. 7, 795 (2008).
2. Pisano, G. P. Science Business: The Promise, the Reality, and the Future of Biotech (Harvard Business School Press, Boston, Massachusetts, USA, 2006).
3. Cuervo, A., Ribeiro, D. & Roig, S (eds) Entrepreneurship: Concepts, Theory and Perspective (Springer, Berlin, Germany, 2007).
4. Schramm, C. J. The Entrepreneurial Imperative: How America’s Economic Miracle Will Reshape the World (and Change Your Life) (HarperCollins, 2006).
5. Pharmaceutical Research and Manufacturers of America. PhRMA Annual Membership Survey. PhRMA website [online], http://www.phrma.org/files/attachments/PhRMA%202009%20Profile%20FINAL.pdf (2009).
6. IMS Health. Global Pharmaceutical Sales, 2001–2008. IMS Health website [online], http://www.imshealth.com/deployedfiles/imshealth/Global/Content/StaticFile/Top_Line_Data/Global_Pharma_Sales_2001-2008_Version_2.pdf (2009).
7. Munos, B. Lessons from 60 years of pharmaceutical innovation. Nature Rev. Drug Discov. 8, 959–968 (2009).
AcknowledgementsWith special thanks to D. Kaiser, M. Tribbitt and T. Flores for their research and editorial assistance. We would also like to thank the following colleagues who participated in these inter-views: B. Adelman, R. Armstrong, L. Babiss, J. Boger, A. Busch, P. Corr, M. Fishman, T. Glenn, C. Goodman, B. Kirschbaum, J. Leiden, G. Milne, P. Needleman, G. Neil, J. Patterson, S. Paul, J. Reinhardt, P. Ringrose, D. Rosen, L. Rosenberg, R. Ruffolo, V. Sato, B. Shapiro, A. Smith, G. Watanabe and T. Yamada (see Box 1).
Competing interests statementThe authors declare competing financial interests: see web version for details.
FuRTHER INFORMATIONAusten Bioinnovation institution homepage: www.abiakron.org
All links Are Active in the online pDf
P e r s P e c t i v e s
NATURE REVIEWS | Drug Discovery VOlUME 9 | SEPTEMBER 2010 | 689
nrd_persp_sep10.indd 689 18/8/10 14:06:27
Nature Reviews | Drug Discovery
Discovery
Discovery and clinical pharmacology
Discovery, Phase I and Phase IIa trials
Discovery, Phase I and Phase IIa trials, and PMS
Preclinical PoC
Human PoC
Clinical PoC
Stratified PoC
Feedback and patientstratification
see below). The formation of the Novartis Institutes for Biomedical Research (NIBR) has served to institutionalize this practice, and to implement the fourth model (see below).
Present interest in the potential of translational medicine to find ‘the right drug for the right patient’ requires the integration of several activities. These include the search for biomarkers that not only help to select compounds preclinically, but also help to predict, stratify and monitor the patients and subgroups who will experience the requisite efficacy of the compound and an acceptable level of adverse events. To achieve this, collaboration between research and postmarketing surveillance groups is necessary. The increasing focus on adverse events, which often have a low frequency in the preregistration trials (Phase IIb and Phase III), argues for the fourth organizational model: the stratified proofofconcept (sPoC) model (FIG. 1). This structure allows active feedback between discovery research, Phase I and Phase IIa trials and postmarketing surveillance, and includes the potential development of biomarkers to identify those patients who might be more likely to experience adverse events. There are
instances with such models in which a change in the administration regimen of the drug or the selection of an alternative drug has provided greater benefit to particular patients.
The impact of structure on the type of organization is probably best understood by some historical examples. In 1987, Pfizer was an early adopter of the ‘clinical biology unit’ concept, in which the focus was on identifying markers of disease and human models of disease that would rapidly determine whether, and in which patients, novel mechanismbased compounds would be efficacious. However, the traditional R&D structure at Pfizer, in which the transition between research and development is made at the beginning of human testing (Phase I), probably delayed the full implementation of a cPoC type organization. By contrast, organizations such as Eli lilly, which for many years included Phase I and Phase IIa in the research units, easily functioned as cPoC type organizations and are making the transition to sPoC organizations more rapidly. Another example is that of Novartis, in which the creation of the NIBR rapidly converted this organization from a cPoC to a sPoC focus. Finally, at Genzyme, the unique focus and the involvement of patients in the pursuit of
drug innovation contributed to the company becoming one of the earliest adopters of a sPoC focus.
Of particular interest is the realization that the heads of R&D who embrace the sPoC model all seek to generate a bias for action that places the patient at the centre of the research effort. Navigation through the complexity of priorities in an increasingly large company is often the principal challenge.
RecommendationsEstablishing and maintaining an entrepreneurial culture during drug development is perhaps easier than during the research stage as the activities associated with this later phase are closer to product realization and clinical application. The inherent sense of urgency associated with the development stage is driven by the competitive environment, in which time to market with a differentiated product is an important determinant of success. Thus, the creation of special product teams for individual efforts and for therapeutic franchises, which are coled by development and commercial leaders, is more likely to foster the entrepreneurial behaviours we have identified, such as ownership, outcome focus, passion and conviction, and the ability to recruit the best people. During this stage, it is also easier to define successful outcomes, such as completion of a welldefined task in a rapid time frame, and so it is easier to create incentives that directly reward achieving these outcomes.
During the research stage, however, entrepreneurial behaviours are often compromised by several characteristics. These include:• Increasing size and complexity of
research groups•Having large portfolios and a focus on
increasing the number of ‘shots on goal’•Middle managers focused on timelines
and portfolios, instead of science, technology and leveraging external knowledge
• Influence of the commercial department too early in the process
•The impact of evolving science and technology on organizational complexity
•A lack of alignment between Head of R&D and CEO with respect to the culture of research.
The responses from our interviewees with respect to these differences led us to the following recommendations:•Organizational structures in research units
should facilitate identifying the ‘right drug for the right patient’. The rapid sharing
Figure 1 | evolution of discovery models to identify the ‘right drug for the right patient’. Four types of organizational structures for discovery research were identified on the basis of the point at which a commitment is made to the full-scale clinical development of a compound. the integration of activities needed to identify ‘the right drug for the right patient’ is catalysing a transition towards the stratified proof-of-concept (Poc) model, which allows active feedback between discovery, research, Phase i and Phase iia trials, and post-marketing surveillance (PMs).
P e r s P e c t i v e s
688 | SEPTEMBER 2010 | VOlUME 9 www.nature.com/reviews/drugdisc
nrd_persp_sep10.indd 688 18/8/10 14:06:27
www.nature.com/reprintcollections/lilly/drug-innovation NATURE REPRINT COLLECTION | THE FUTURE OF DRUG INNOVATION | OCTOBER 2011 | 79
and integration of information generated by all the relevant disciplines, regardless of where it is found, must be assisted and rewarded. We recommend that companies seek to move towards the sPoC model (FIG. 1), which extends research to Phase IIa and also incorporates feedback from postmarketing surveillance studies to fuel the continued search for new targets, bio markers and an understanding of offtarget effects. These activities are crucial in the search for the right therapy for the right patient, and will heighten the sense of urgency to get drugs to patients.
•Middle managers should be given incentives to access the best ideas and the best people globally to drive curiosity and ‘open innovation’. Managing external networks and rapidly internalizing the results of new scientific and technical approaches should also be among their priorities. Rewards for managers should be based on the speed with which they achieve the progression of projects, facilitated by their capacity to foster the integration of knowledge and to provide appropriate guidance to ‘true believers’ and ‘mavericks’. Ultimately, companies should use middle managers to transform their culture from something analogous to a “supertanker” to “a flotilla of diverse, nimble and innovative ships”, consisting of the following elements: focus on the patient, scientific curiosity, collaboration, speed to solution and rewards that are aligned with goals.
•Multidisciplinary research teams should consist of no more than 20–40 members who focus on the preclinical and clinical validation of novel targets/mechanisms with responsibility through to clinical proofofconcept in Phase IIa trials. These ‘units of innovation’ should be supported by the traditional discovery research expert groups, such as molecular biology and chemistry, which focus on assessing the molecular validation or relevance of the target and finding lead molecules that interact with the target. Both of these groups should include specialists in postmarketing surveillance to ensure relevance to the patient.
They should also perform relevant studies with academic clinicians to generate information from subsets of patients, which might inform the research efforts and ensure a sPoC approach.
•Heads of R&D must focus indefatigably on building and maintaining an appropriate entrepreneurial culture. Furthermore, the support of the CEO for this focus must be visible and active.
•Companies should be more innovative with respect to reward and recognition for discovery scientists, to foster bias for action, ownership and an appropriate sense of urgency.
•Companies should examine what we term the ‘columns outside the doors’ phenomenon and the subtle impact that this form of recognition might have on entrepreneurial behaviour. Smith described this phenomenon, which occurs across the world: as startup companies become successful, they are relocated from humble laboratories to grander buildings with columns outside their doors. Interestingly, such edifices often violate the observed inverse square relationship between communication among scientists in laboratories and the distance between these laboratories. We offer this insight more as a provocative thought than as a firm recommendation.
We offer one final thought regarding the transferability of these insights from drug discovery research to drug development. In discovery, our data and previous research suggests that concept realization — the metric relevant for gauging the effectiveness of discovery — improves as the size of the innovation unit grows to around 20 to 40 researchers, but then declines as the size of the unit increases and diseconomies of scale take effect. In development, it is common wisdom that the optimal efficiency of the process is obtained when the size of the unit is considerably larger than the optimal size of discovery units. Interestingly, in large pharmaceutical companies, it has become increasingly common to outsource many developmentrelated activities, and as this extends, it is likely that the efficiency–size relationship
may be turned on its head, with pharmaceutical companies managing development with relatively smaller units than they have at present. In that case, the management of discovery units may hold valuable lessons for the conduct of development. These observations might stimulate large pharmaceutical companies to do that which Yamada maintains they can: “transform the industry.”
Frank L. Douglas, Lesa Mitchell and Robert E. Litan are at the Ewing Marion Kauffman Foundation,
Kansas City, Missouri, USA.
Frank L. Douglas is also at the Austen BioInnovation Institute, Akron, Ohio, USA.
V. K. Narayanan is at the Center for Research Excellence, LeBow College of Business,
Drexel University, Philadelphia, Pennsylvania, USA.
Correspondence to F.L.D. e-mail: [email protected]
doi:10.1038/nrd3230 Published online 20 August 2010
1. Goodman, M. Pharma industry performance metrics: 2007–2012E. Nature Rev. Drug Discov. 7, 795 (2008).
2. Pisano, G. P. Science Business: The Promise, the Reality, and the Future of Biotech (Harvard Business School Press, Boston, Massachusetts, USA, 2006).
3. Cuervo, A., Ribeiro, D. & Roig, S (eds) Entrepreneurship: Concepts, Theory and Perspective (Springer, Berlin, Germany, 2007).
4. Schramm, C. J. The Entrepreneurial Imperative: How America’s Economic Miracle Will Reshape the World (and Change Your Life) (HarperCollins, 2006).
5. Pharmaceutical Research and Manufacturers of America. PhRMA Annual Membership Survey. PhRMA website [online], http://www.phrma.org/files/attachments/PhRMA%202009%20Profile%20FINAL.pdf (2009).
6. IMS Health. Global Pharmaceutical Sales, 2001–2008. IMS Health website [online], http://www.imshealth.com/deployedfiles/imshealth/Global/Content/StaticFile/Top_Line_Data/Global_Pharma_Sales_2001-2008_Version_2.pdf (2009).
7. Munos, B. Lessons from 60 years of pharmaceutical innovation. Nature Rev. Drug Discov. 8, 959–968 (2009).
AcknowledgementsWith special thanks to D. Kaiser, M. Tribbitt and T. Flores for their research and editorial assistance. We would also like to thank the following colleagues who participated in these inter-views: B. Adelman, R. Armstrong, L. Babiss, J. Boger, A. Busch, P. Corr, M. Fishman, T. Glenn, C. Goodman, B. Kirschbaum, J. Leiden, G. Milne, P. Needleman, G. Neil, J. Patterson, S. Paul, J. Reinhardt, P. Ringrose, D. Rosen, L. Rosenberg, R. Ruffolo, V. Sato, B. Shapiro, A. Smith, G. Watanabe and T. Yamada (see Box 1).
Competing interests statementThe authors declare competing financial interests: see web version for details.
FuRTHER INFORMATIONAusten Bioinnovation institution homepage: www.abiakron.org
All links Are Active in the online pDf
P e r s P e c t i v e s
NATURE REVIEWS | Drug Discovery VOlUME 9 | SEPTEMBER 2010 | 689
nrd_persp_sep10.indd 689 18/8/10 14:06:27
Nature Reviews | Drug Discovery
Discovery
Discovery and clinical pharmacology
Discovery, Phase I and Phase IIa trials
Discovery, Phase I and Phase IIa trials, and PMS
Preclinical PoC
Human PoC
Clinical PoC
Stratified PoC
Feedback and patientstratification
see below). The formation of the Novartis Institutes for Biomedical Research (NIBR) has served to institutionalize this practice, and to implement the fourth model (see below).
Present interest in the potential of translational medicine to find ‘the right drug for the right patient’ requires the integration of several activities. These include the search for biomarkers that not only help to select compounds preclinically, but also help to predict, stratify and monitor the patients and subgroups who will experience the requisite efficacy of the compound and an acceptable level of adverse events. To achieve this, collaboration between research and postmarketing surveillance groups is necessary. The increasing focus on adverse events, which often have a low frequency in the preregistration trials (Phase IIb and Phase III), argues for the fourth organizational model: the stratified proofofconcept (sPoC) model (FIG. 1). This structure allows active feedback between discovery research, Phase I and Phase IIa trials and postmarketing surveillance, and includes the potential development of biomarkers to identify those patients who might be more likely to experience adverse events. There are
instances with such models in which a change in the administration regimen of the drug or the selection of an alternative drug has provided greater benefit to particular patients.
The impact of structure on the type of organization is probably best understood by some historical examples. In 1987, Pfizer was an early adopter of the ‘clinical biology unit’ concept, in which the focus was on identifying markers of disease and human models of disease that would rapidly determine whether, and in which patients, novel mechanismbased compounds would be efficacious. However, the traditional R&D structure at Pfizer, in which the transition between research and development is made at the beginning of human testing (Phase I), probably delayed the full implementation of a cPoC type organization. By contrast, organizations such as Eli lilly, which for many years included Phase I and Phase IIa in the research units, easily functioned as cPoC type organizations and are making the transition to sPoC organizations more rapidly. Another example is that of Novartis, in which the creation of the NIBR rapidly converted this organization from a cPoC to a sPoC focus. Finally, at Genzyme, the unique focus and the involvement of patients in the pursuit of
drug innovation contributed to the company becoming one of the earliest adopters of a sPoC focus.
Of particular interest is the realization that the heads of R&D who embrace the sPoC model all seek to generate a bias for action that places the patient at the centre of the research effort. Navigation through the complexity of priorities in an increasingly large company is often the principal challenge.
RecommendationsEstablishing and maintaining an entrepreneurial culture during drug development is perhaps easier than during the research stage as the activities associated with this later phase are closer to product realization and clinical application. The inherent sense of urgency associated with the development stage is driven by the competitive environment, in which time to market with a differentiated product is an important determinant of success. Thus, the creation of special product teams for individual efforts and for therapeutic franchises, which are coled by development and commercial leaders, is more likely to foster the entrepreneurial behaviours we have identified, such as ownership, outcome focus, passion and conviction, and the ability to recruit the best people. During this stage, it is also easier to define successful outcomes, such as completion of a welldefined task in a rapid time frame, and so it is easier to create incentives that directly reward achieving these outcomes.
During the research stage, however, entrepreneurial behaviours are often compromised by several characteristics. These include:• Increasing size and complexity of
research groups•Having large portfolios and a focus on
increasing the number of ‘shots on goal’•Middle managers focused on timelines
and portfolios, instead of science, technology and leveraging external knowledge
• Influence of the commercial department too early in the process
•The impact of evolving science and technology on organizational complexity
•A lack of alignment between Head of R&D and CEO with respect to the culture of research.
The responses from our interviewees with respect to these differences led us to the following recommendations:•Organizational structures in research units
should facilitate identifying the ‘right drug for the right patient’. The rapid sharing
Figure 1 | evolution of discovery models to identify the ‘right drug for the right patient’. Four types of organizational structures for discovery research were identified on the basis of the point at which a commitment is made to the full-scale clinical development of a compound. the integration of activities needed to identify ‘the right drug for the right patient’ is catalysing a transition towards the stratified proof-of-concept (Poc) model, which allows active feedback between discovery, research, Phase i and Phase iia trials, and post-marketing surveillance (PMs).
P e r s P e c t i v e s
688 | SEPTEMBER 2010 | VOlUME 9 www.nature.com/reviews/drugdisc
nrd_persp_sep10.indd 688 18/8/10 14:06:27
We’re Up for the Innovation Challenge. We at Eli Lilly and Company are on a mission: to optimize cutting edge science and technology in order to develop medicines that help people live longer, healthier and more active lives. It’s a legacy that began for us 135 years ago in a small building in Indianapolis and has expanded globally. Today, Lilly delivers medicines to millions of patients in 143 countries.
Discovering and developing a new medicine has always been a highly complex endeavor, often requiring clever, breakthrough solutions. Today the challenge is even greater. We need to draw on all the brainpower and creativity we can, no matter where in the world that expertise resides.
That is one of the reasons we are strong advocates of collaboration, both within Lilly and with our external partners.
Throughout Lilly’s history, advances in human health have been achieved because an individual scientist, or a team of scientists, looked beyond what was easy, familiar and safe. True innovation requires us to solve daunting scientific problems and, often, explore unknown territory. It means that each of us must be willing to stretch and challenge ourselves every day. Lilly scientists don’t avoid difficult scientific problems because they involve greater risk. We take the risk openly and as a team. In this way, we can continue to find unique medicines that deliver improved outcomes for individual patients.

“Research is the Heart of the business, the Soul of the enterprise.”
– Mr. Eli Lilly, grandson of the company founder, Colonel Eli Lilly

clinical collectionsreprint collectioncollections
www.nature.com/reprintcollections/lilly/drug-innovation