ejournal.iainsurakarta.ac.idejournal.iainsurakarta.ac.id/docs/template/template-dinik… · web...
TRANSCRIPT
The Jakarta Islamic Index-LQ 45: Rate Financial Performance, Beta Stocks and Stock Price on
the Indonesian Stock Exchange
Tajus SubqiFaculty of Sharia, Institut Ilmu Keislaman Annuqayah (Instika),
Guluk-Guluk Madura
AbstractThis research analyzes the effect of financial performance and stock beta (systematic risk) on the stock price of eight listed companies in the Jakarta Islamic Index (JII) – LQ 45 for the period of 2012-2014. The data was gathered through a literature review and documentation of financial statements. Multiple regressions were used to measure the effect of independent variable towards dependent variable along with ttest and F test. The results based on overall test suggested that only ROE and NPM had opposite direction correlation with the stock price, meanwhile other variables had a positive direction correlation. From the partial test with 5% level of significance, only EPS and PER had significant effect on stock price while other variables had no effect.
Keywords : financial performance analysis, stock price, stock beta (systematic risk)
This paper questions whether a company’s financial performance and beta stock influence its stock price on the Jakarta Islamic Index (JII) - LQ 45 on the syaria stock market – of the Indonesian stock exchange. This question is important since there is little academic research on this topic. Zulkifli Harahap and Agusni Pasaribu (2007) conducted research on “the influence of fundamental factor and systemic risk on the manufacture companies registered on the Jakarta Stock Exchange (JSE)”, which involved the 120 manufacturing companies listed on the JSE since 2002-2005 that actively reported their financial reports. The analysis using SPSS 11.5 indicates that underlying factors and systematic risks simultaneously affect the price of shares. Only Book Value per Share (BVS) and beta stock, however, significantly effect the price of shares, while Return on Assets (ROE) and Debt to Equity Ratio (DER) have no significant effect on the price of shares (Harahap and Pasaribu 2007).
Anwar’s (2010) research on the fundamental influence and systematic risk of stock financing sector companies in the Stock Exchange 2012-2014 to shows that the variables of Gross Profit Margin (GPM), Operating Profit Margin (OPM), Net Profit Margin (NPM), Earning Per Share (EPS), price Earnings Ratio
(PER), Book Value Per Share (BVS), price to Book Value (PBV), and Beta, simultaneously influence the stock price of the financing companies on the Indonesian Stock Exchange, while partial effect influence comes from BVS and PBV variables. Related to JII, Hasthoro and Jepriyanto (2011) describe the influence of fundamental financial factors and systematic risk on the stock price of the companies which are incorporated in the JII. Their research shows that empirically the influence of fundamental financial factors consisting of return on assets (ROE), return on equity (ROE), debt to total assets ratio (DTA), debt to equity ratio (DTE), and the systematic risk to stock price companies incorporated in the JII. Beta shares as systematic risk do not significantly affect the stock prices of companies incorporated on the JII.
A similar study was conducted by Aulianisa (2013) on the fundamental influences and systematic risk on stock price in the Islamic capital market. Observations were made of 30 companies belonging to the JII and listed on the Indonesia Stock Exchange (BEI) between 2012-2014. The results showed that only the return on investment (ROE) and Net Profit Margin (NPM) have no relation with the direction of the share price, while other variables have a direct relationship. The partial test with 5 % degree of confidence showed only two variables: Earning Per Share (EPS) and Price Earnings Ratio (PER) have a significant impact on stock prices and other variables proved to have none. There are numerous other studies related to the effect of financial performance and beta shares on stock prices, however, the linkages or effects are difficult to measure so that there is a gap in the research. Moreover, the studies above were only done partially in relation to the issuer’s shares of JII or LQ 45. This study seeks to present an analysis of the merger of shares between JII and LQ 45.
By looking at the unique characteristics of the sharia capital market, the writer has an opportunity to conduct research related to the influence of complex fundamental factors and their systematic risk (beta shares) toward the sharia stock price incorporated in JII - LQ 45 during the 2012-2014 periods. Hence, it can be used to determine whether CFP and BS influence CSP, which are Incorp in the JII-LQ 45 in the ICM or whether there are other factors that more significantly influence CSP.
The World of Indonesian Shares

The development of the stock price of a company reflects the company’s stock value. So, the prosperity of shareholders is reflected in the market price of the company’s shares (Husnan, 2001). Shares as securities traded on the stock market, experience fluctuations in price from time to time. Fluctuation of the stock price is affected by external and internal factors. External factors include economic conditions, government policy, level of income, inflation, and so on, while internal factors include the company’s fundamental condition, and the wisdom and experience of the directors, among other factors (Usman, 1990).
Investors must have prior knowledge about the value of a company, so that the shares can be bought and sold at a reasonable market price. The presence of shari’a shares on the Islamic Capital Market-Indonesia Stock Exchange is represented by shares incorporated in the JII in the midst of the conventional capital markets, which often justifies any means to get great returns. The presence of Sharia shares is expected to give a new feel and color to the share market. Moreover, this study combines the stock listed companies incorporated in JII and that are at the same time listed in LQ 45. Investors in companies incorporated in the LQ 45 and JII should at eliminate irrationality by being familiar with the details of the company.
In these conditions, Muslim investors, in particular, should learn in advance the condition of a company before deciding to buy or sell the stock, as the value of the shares represents the value of the company. Investors often compare the stock price or the value of the actual price of the shares before deciding to buy or sell stock. The actual value (intrinsic value) is often referred to as the fundamental value. Fundamental values can be calculated by using two types of securities analyses: fundamental securities analysis and technical securities analysis (Jogiyanto, 2003). The data required for fundamental analysis is derived from the financial statements of companies such as return on assets (ROE), Return on Equity (ROE) and the company’s other financial performance factors. While the technical approach is done through a method of forecasting by taking into account the tendencies of the stock charts.
Factors from the issuer’s financial performance were selected in this study and are related to such aspects as financial ratios Earnings per Share (EPS), Price Earnings Ratio (PER). Debt to Equity Ratio (DER), the Current Ratio (CR), Net Profit Margin (NPM) and Return on Equity (ROE). There are two things
investors consider in making an investment, namely the level of expected return and level of risk that will be covered. Investments always contain an element of uncertainty: the higher the level of expected return, the higher the risk borne from these investments. There are two kinds of risk inherent in a stock, namely systematic risk and unsystematic risk. Systematic risk is the market risk experienced by all companies and cannot be eliminated, while unsystematic risks are specific risks faced by a company and which can be eliminated or minimized (Husnan, 2001).
The most relevant risk to be considered by investors in making investment decisions is the systematic risk or market risk (Husnan, 2001), because investors can eliminate unsystematic risk through the establishment of an investment portfolio. In the financial literature, systematic risk or market risk is often expressed by beta (β). Thus, for the sake of investment, investors must assess the amount of beta stocks as a measure of investment risk in the capital market. Based on the above description, the writer is interested in conducting research regarding company financial performance, beta stocks and stock prices. Financial performance is closely related to a company’s financial ratios including Earnings per Share (EPS), Price Earnings Ratio (PER). Debt to Equity Ratio), the Current Ratio (CR), Net Profit Margin (NPM) and Return on Equity (ROE).
Methods of Finding the Influence
This research uses a descriptive analytic method that describes and explains the independent variables to analyze how they affect the stock price which is incorporated in the JII - LQ 45 during the period of study. The type of research is correlational research, as it aims to investigate the extent to which variations in a factor relate to variations in one or more other factors based on the correlation coefficient. This study assesses the extent to which fundamental factors and systematic risk as independent variables influence the stock prices of companies incorporated in the JII - LQ 45 during 2012-2014.
The population of this study were all the shares on the Jakarta Islamic Index (JII) - LQ 45 listed on the Indonesia Stock Exchange (BEI) during 2012-2014. Each year, shares in the JII consist of two semesters, where in each, half of a total of 30 companies were considered as fulfilling the criteria for listing in
the JII. While the LQ 45 also annually consists semester in which in each semester it is announced which 45 companies will be included in the LQ 45 list. The sample is done with a non-probability sampling approach with a purposive sampling method. The researchers have made boundaries based on characteristics of the subjects as the sample of the research (Supardi, 2005). The limitation is set for companies listed on the Indonesia Stock Exchange, and incorporated in the JII - LQ 45 during the period 2012-2014, and which have published full financial statements for the period. The JII data was taken from the online sources http://yahoofinance.com and http://jiianalisa.com, while the LQ 45 share data was taken from http://sahamok.com and http://idx.co.id.
This study has two variables, namely dependent and independent variables. The dependent variable in this research is the price of shares in companies incorporated in the JII - LQ 45 from 2012 to 2014, that is, the dependent variable (Y) is the annual stock price (Closing Price) during the period of observation. The independent variables included the variables of the company’s financial performance displayed in the financial ratios of the company. They are:1) Earning Per Share (EPS)
Earning Per Share ( EPS ) is a ratio that indicates how much profit (return) is obtained by investors or shareholders per share. The higher the value of EPS the greater the profit to shareholders. EPS is calculated using the formula:
2) Price Earning Ratio (PER) This ratio is the ratio of stock price to earnings per share. Investors in the
capital market use the price earnings ratio (PER) to measure whether a stock is underpriced or overpriced. PER is an important measure that has become the cornerstone for investor consideration in buying or selling a company’s stock. PER is mathematically formulated as follows:
3) Debt to Equity Ratio (DER) The ratio of debt to equity ratio (DER) is used to measure the level of
leverage (use of debt) to total equity held by the company. This ratio is measured by comparing the debts to total equity.
High debt ratio has an adverse impact on corporate performance because of the higher debt level, which means that interest expense will be greater so as to reduce profits. In contrast, the level of the debt ratio might indicate a better performance because it causes a higher rate of return (Ang, 1997).4) Return on Equity (ROE)
This ratio, often referred to as the return on net worth, is a profitability ratio that indicates the ratio between profit after tax or earnings after tax (EAT) to total owned capital (equity), which is derived from the payment of capital owners, profit undivided and other reserves collected by the company. ROE is formulated as follows:
This ratio shows the extent to which companies manage their own capital (equity) effectively, and measures the rate of profit from investments owners made in their own capital or shareholders. The higher the ROE indicates more efficient use of the company’s own capital to generate profit or net profit. ROE is used to measure the level of return the company, or the effectiveness of the company in profit from the use of equity (shareholders’ equity) owned by the company.5) Net Profit Margin (NPM)
This ratio is gained using the formula:
This ratio may indicate efectiveness and efficiency in running the company.6). Current Ratio (CR)
This ratio is a liquidity ratio that is most often used by investors as a measure of the liquidity of a company. So, it can be assumed that majority investors understand the true meaning of CR owned by the company and act in accordance with their preferences. CR can be formulated as follows:
7). Systematic Risk (Beta Shares)

Systematic Risk (Beta). Indicators used in calculating Beta stock use a Single Index Model (Single Index Model). Regression equations used to obtain the regression coefficients stock return to market return (Jogiyanto, 2003) are as follows:
Ri = αi + βi (Rm) + ei
Information:Ri : return the securities to - i.αi : expectations of the return value of the securities that are
independent of market return.βi : Beta coefficient that measures Ri as a result of changes in Rm.Rom : rate of return on the market index is also a random variable.ei : residual error, is a random variable with a value equal to zero or
expectations E ( ei = 0 ).
The equation used to calculate market return uses the composite stock price index (Jogiyanto, 2003) as follows:
Information:Rm : Stock Market Index Back Into T ON display duration.IHSGt : JCI ON Dateline To T (Duration) IHSGt-1 : JCI IN Dateline Kate -1 (Yang Alo) Duration.
The equation used Recalculating In Stock (Jogiyanto, 2003), as follows:
Information:Rit : I stock returns in the period to-t.Pt : closing stock price at period-t (current period).Pt-1 : The closing share price in the period ket-1 (the last period).
The data analysis technique used is multiple linear regression (multiple regression), which is a technique to measure the influence of independent

variables on the dependent variable (Hadi, 2006). The independent variables in this study are the Earning per Share (EPS), Price Earning Ratio (PER). Debt to Equity Ratio (DER), the Current Ratio (CR), Net Profit Margin (NPM) and Return on Equity (ROE), while the dependent variable is the share price.
The classical assumption of this research needs to be done so that there are no issues of normality, multicollinearity, heteroscedasticity and autocorrelation. The coefficient of determination is a value that describes the amount of change or variation of the dependent variable that can be explained by changes or variations of the independent variables. By knowing the coefficient of determination, researchers can explain the merits of the regression model in predicting the dependent variable. There are two types of coefficients, that is, the usual determination coefficient r and the coefficient of adjusted determination (adjusted R Square).
In multiple regression, the use of the coefficient of determination that has been adapted to better see how well the model compared to the coefficient of determination. The coefficient of adjusted determination is the result of the adjustment of the level of freedom of prediction equations. It protects from the increase in bias or error due to a rise in the number of independent variables and an increase in the number of samples (Santosa and Ashari, 2005).
Partial test was used to prove the second hypothesis. T test was used in order to know the effect of each independent variable on the dependent variable. T test was used to determine whether a variable financial performance has a partially significant effect on the variable stock price or not. Simultaneous test was used to indicate whether all the independent variables included in the model had no effect either simultaneously / together on the dependent variable. By doing test F it can be determined whether the independent variables consisting of Earning per Share (EPS), Price Earning Ratio (PER). Debt to Equity Ratio), the Current Ratio (CR), Net Profit Margin (NPM) and Return on Equity (ROE) simultaneously significantly affect stock prices or not.
A hypothesis is a statement or allegation that is temporary to a research problem of which the truth is still weak and should be tested empirically (Hasan, 2004). In formulating the hypothesis in this study, the author referred to and noted the types of hypotheses and hypotheses test results in previous studies. Therefore, the hypothesis of this study is that there is significant

relationship between financial performance, Earning per Share (EPS), and Price Earning Ratio (PER). Debt to Equity Ratio (DER), the Current Ratio (CR), Net Profit Margin (NPM) Return on Assets (ROE) and systematic risk (beta) on stock prices for companies incorporated in the JII - LQ 45 in Islamic Capital Market - Indonesia stock Exchange Period 2012-2014, either partially or simultaneously.
From Defensive to Safety: a Result This study utilizes several theories ranging from the Islamic capital
market, and Jakarta Islamic Sharia Stock Index (JII), risk and return to the beta coefficient. Various perspectives are important in developing a perspective in reading the results of the analysis. The capital market is a meeting between the parties that have excess funds and those who need funds by way of trade in securities for the long term, and in the narrow sense is a concrete market.
As with any market where trading is carried out between sellers and buyers, in the capital market funds or capital in the form of stocks, bonds or other forms, are traded. The offer and sale of securities is carried out in the institution officially known as the Stock Exchange (Khairandy, 2010). Meanwhile, according to Law No. 8/1995 Article 1 point 13 of the Capital Market (Capital Market Law), the capital market is an activity concerned with the public offering and trading of securities, public companies relating to securities issuance, as well as institutions and professions related to the effect.
From the above, it can be seen that the capital markets are the Shariah-run capital market that operates under Shari’ah principles. Trading of securities (securities) on the capital market is conducted in accordance with the provisions of Islamic law (Manan, 2009). Conform to Islamic or Shari’ah principles embodied in the Shari’ah capital markets means that the implementation of Shariah capital markets should be based on fatwa made by the National Sharia Board of the Indonesian Council of Ulama (DSN-MUI) and Bapepam-LK as these are not inconsistent with each other.
Sharia based activity in the capital markets related to trading securities (securities shari’a) which have been offered to the public are in the form of share ownership or the issuance of Islamic bonds. According to the fatwa DSN No. 40 / DSN-MUI / X / 2003, understanding the effects of Shari’ah on securities as defined in the legislation in the field of the capital market in terms of the
contract, the management of the company, and the way its publications comply with the principles of Shariah (Burhandiiwn, 2009). Prohibited market transactions are transactions that contain elements of gharar (Isl. uncertainty), maysir (gambling) and manipulation.
The next theory used is Shari’a Stocks and the Jakarta Islamic Index (JII). Shares are categorized into Islamic stocks and non-Islamic shares. This difference lies in the business activities and objectives. According to Auliyah and Hamzah (2006), Islamic stocks are stocks that have characteristics in accordance with Islamic law, or are sharia-compliant. While non-Islamic stocks are stocks in business activities that are not in accordance with the principles of Islamic Shariah.
Under the direction of the National Sharia Council and Bapepam - LK No. IX.A.13 on issuance of Islamic securities, the types of main activities of an enterprise that are judged as not meeting the requirements of Islamic law are as follows: (1) The businesses of gambling and gaming (which are classified as gambling or prohibited trading); (2) Carrying out financial services that apply the concept of usury, trading and risk containing gharar and maysir; (3) Producing, distributing, trading and / or providing goods and or services that are unlawful because of the substance used (haram lidzatihi), goods and or services that are forbidden not because of substance (haram li ghairihi) as established by DSNMUI, as well as goods and or services that are morally damaging and harm; (4) Investing in companies that at the time of the transaction have a level (ratio) of corporate debt to financial institutions with more dominant riba than their capital, unless the investment conforms to the shari’a charactristics by DSNMUI.
While the criteria for stocks that fall into the category of sharia are: (1) do not conduct business activities as described above; (2) do not engage in trade that is not accompanied by the delivery of goods or services and trade with counterfeit supply and demand; (3) do not exceed the financial ratios are total interest-based debt compared with total equity is not more than 82% (interest-based debt compared with total equity of no more than 45%: 55%) and total interest and other lawful income does not compare to total income (revenue) not more than 10%.
In the Indonesian capital market, the Indonesia Stock Exchange (BEI) along with PT. Danareksa Investment Management (DIM) have launched a

stock index that is based on Islamic law, namely the Jakarta Islamic Index (JII). Shares in the JII consist of 30 stocks selected from stocks that are in accordance with Islamic sharia, which is evaluated every six months. Determination of the components of the index are made each January and July, while changes in the types of business issuers will be monitored continuously based on publicly available data.
Calculation of the JII conducted by the Indonesia Stock Exchange (BEI) uses the method of calculation of the index set by the Indonesian Stock Exchange (BEI), which is the weight of market capitalization (market cap weighted). The index calculation also includes adjustments (adjustment) due to changes in the data caused by the issuer’s corporate actions. JII was launched on July 3, 2000. However, to obtain long enough historical data, the base used is dated from January 2, 1995, with a score of 100. The JII requires stock to be of the types of business that are not operating contrary to Islamic principles and that have been in operation for more than the three months unless it is included in group of ten largest companies.
Stock selection is based on annual financial statements or the middle of the year ends that have a maximum ratio of liabilities to assets of 90%. Furthermore, 60 stocks from the above stock arrangement are selected in order of largest average market capitalization during the past year. The JII also has 30 shares with a sequence based on the average level of liquidity of regular trading value during the past year. The JII was intended to be used as a benchmark to measure the performance of an investment in shares on the basis of sharia. The index is expected to increase the confidence of investors to develop investment in equity by sharia.
The selection process to set the shares to be included in the calculation of the JII is as follows (Auliyah and Hamzah, 2006): (1) shares will be selected based on the List of Islamic Securities (DES) issued by Bapepam - LK; (2) choose the 60 stocks from the List of Islamic Securities (DES) based on the sequence of the largest market capitalization in the past year; (3) Of the 60 stocks, 30 stocks are selected based on the level of liquidity, that is, the value of transactions in the regular market during the past year.
The next theory is LQ 54. LQ 45 index shares are traded on the Indonesia Stock Exchange (BEI), which means the 45 stocks of companies that meet the following criteria: (1) included in the 60 largest companies with assets in the

last 12 months; (2) included in the 60 companies with the largest transaction value on the stock market in the last 12 months; (3) listed on the Indonesia Stock Exchange for at least 3 months; (4) company’s financial performance has been good in terms of frequency and volume. The list of companies that enter into the LQ 45 is based on research conducted by the BEI. It can be concluded that the stocks included in the LQ 45 are stocks that have a high level of transactions and are therefore very illiquid.
In order to assess the price of shares, the authors use the theory of fundamental analysis and its techniques for the assessment of the stock price. Fundamental analysis (Achsien, 2003) are techniques that try to predict stock prices in the future by (1) estimating the values of the fundamental factors that affect stock prices in the future and (2) Assessing the relationship of these variables to obtain the estimated price of the stockThe term “technical analysis” is a complex terminology for the most basic method in investment. Simply put, technical analysis is the study of prices using charts as the main tool. Technical analysis is an analytical technique that uses data or records regarding the market to try to access the demand and supply of a particular stock or the overall market.
This analytical approach uses published market data, such as stock price, trading volume, stock price index and the individual, as well as other technical factors. Therefore, this approach is also referred to as an approach to market analysis or internal analysis. The underlying assumptions of technical analysis (Salim, 2003) are (1) there is a systematic dependence on return which can be exploited to abnormal returns; (2) the markets are not efficient: not all past price information is observed when predicting the return distribution of securities; (3) the value of a stock is a function of demand and supply.
Risk has a positive and linear relationship to the expected return on an investment. Thus, the greater the expected return, the greater the risk to be borne by an investor. In making stock investment decisions on securities, the return obtained is on the basis of two sources, namely dividends and capital gains, while the risk of stock investments is reflected in the variability of earnings (return stock) acquired (Huda and Nasution, 2005). Beta is a calculation to measure volatility or a systematic risk measurement, where the notion of volatility is a fluctuation of a return of a security within a certain period. If fluctuations statistically follow return securities market return

fluctuations, the beta of the securities is worth one. For example, if the market return increased by 5%, then the investor will expect a return securities rise by 5%. According to Jogiyanto (2003), beta is a measure of systematic risk from a stock which can not be avoided even though the investor diversifies. These risks relate to conditions prevailing in the market in general, such as changes in macroeconomics, interest rate risk, political risk, inflation risk, exchange rate risk and market risk (Jogiyanto, 2003).
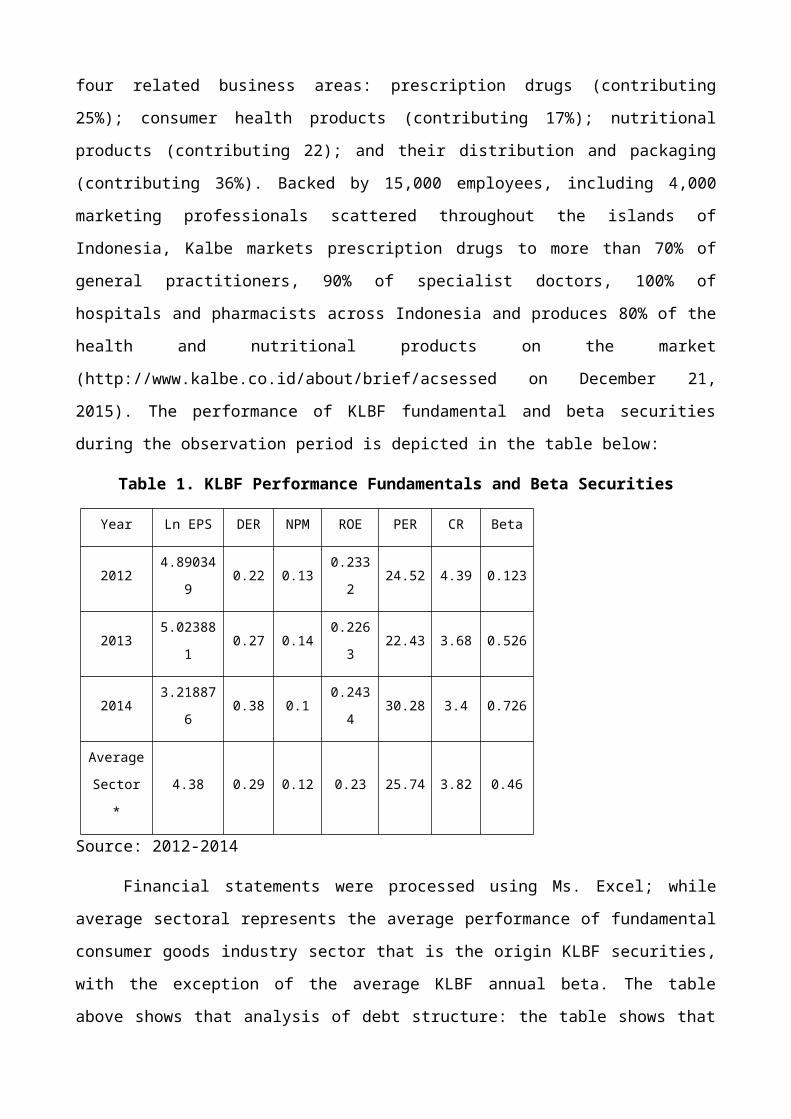
By utilizing the various theories or perspectives above, this research would look at some companies: (1) Kalbe Farma, known as Kalbe stock code KLBF became a public company in 1991 with its shares listed on the Stock Exchange. Kalbe focuses its business in four related business areas: prescription drugs (contributing 25%); consumer health products (contributing 17%); nutritional products (contributing 22); and their distribution and packaging (contributing 36%). Backed by 15,000 employees, including 4,000 marketing professionals scattered throughout the islands of Indonesia, Kalbe markets prescription drugs to more than 70% of general practitioners, 90% of specialist doctors, 100% of hospitals and pharmacists across Indonesia and produces 80% of the health and nutritional products on the market (http://www.kalbe.co.id/about/brief/acsessed on December 21, 2015). The performance of KLBF fundamental and beta securities during the observation period is depicted in the table below:
Table 1. KLBF Performance Fundamentals and Beta Securities
Year Ln EPS DER NPM ROE PER CR Beta
20124.89034
90.22 0.13
0.2332
24.52 4.39 0.123
20135.02388
10.27 0.14
0.2263
22.43 3.68 0.526
20143.21887
60.38 0.1
0.2434
30.28 3.4 0.726
Average Sector *
4.38 0.29 0.12 0.23 25.74 3.82 0.46
Source: 2012-2014

Financial statements were processed using Ms. Excel; while average sectoral represents the average performance of fundamental consumer goods industry sector that is the origin KLBF securities, with the exception of the average KLBF annual beta. The table above shows that analysis of debt structure: the table shows that the ratio of DER KLBF increased in the first 3 years of the observation period so that the company’s capital structure financed as much as 26.1%, which is above the average DER sectoral worth 22.9%. This indicates the company was aggressive in using debt to fund its capital structure. On the one hand, this could weigh on the company because of the cost of debt to be borne each year, and on the other, there is a possibility the company was expanding its business and thus required more capital. Nevertheless, the ratio of which increased this DER in 2014 by 5% to 17.9%. The company is aggressive in its use of debt is still in the normal stages for not occur on an ongoing basis where KLBF still trying to reduce its dependence on debt, and if comparedaverage DER sectoral ranges from 29%, the ratio of DER KLBF there is still far below that.
Profitability Analysis: KLBF ROE ratios tend to show an increase which in 2012 had decreased by 1.1%. In the following years, this ratio continued to rise though not significantly. If a comparative analysis is done, the ROE is always there above the average sectoral ROE reached 10.3%. The increase in this ratio needs to be appreciated from the view that the manager is able to efficiently manage the total assets of the company to generate profits and maintain the financial stability of the company.
Cost efficiency analysis: NPM ratio tends to be stable, and didnot experience sharp spikes or drastic declines. This ratio shows that the management is quite effective in generating net income and this needs to be increased, or at least maintained. Investors would prefer the issuer’s profitability or efficiency ratio of costs exceeding the average sectoral as more promising and profitable, so from the view of historical analysis or comparison, KLBF is eligible to be used as a means of investment.
Analysis of market performance: EPS from year to year also stagnated, in the sense that although there was an increase, it was not significant, so that the value of EPS was always a below-average EPS sectoral worth Rp 151.91 for the 3-year observation period. Meanwhile, if viewed PER, only in 2013 under the sectoral PER ranged 22:43 times. PER was highest in 2014 which reached
30.28 times. Although at the end of 2014 PER value decreased to reach 23.7 times, it remained above the sector average PER. This shows the enthusiasm of investors in KLBF shares so PER comparatively quite high.
Analysis of beta securities: KLBF beta securities in the 3-year period of observation showed less than 1, which means the KLBF stock were defensive indicating the stock was less sensitive to changes in market return so that at this point the systematic risk borne by investors was relatively small because the risk of the securities was under the market average, whereas in 2014 the beta value increased to 0.72 (or if rounded up to 1). This shows that fluctuations in KLBF’s returns statistically follow the fluctuations of the market return, so that if the market return experienced changes by one percent either up or down, then KLBF stock returns will also follow the market return.
(2) Tambang Batubara Bukit Asam Tbk (PTBA), this is a company engaged in coal mining, initiated under Dutch colonial administration. Simultaneously with development of national energy security program, in 1990 the company was commissioned by the government to a develop coal briquette business. On December 23, 2002, the company became a public company (public) listed on the Stock Exchange (http://ptba.co.id/en/about/history). The performance of PTBA’s fundamental and beta securities aredepicted in the following table:

Table 2. Performance Fundamentals and Beta Securities PTBA
Year Ln Price Ln EPS DER NPM ROE PER CR
20126.51025
80.35 0.25 0.3121 26.32 5.79
-0.061
20137.20042
50.41 0.29 0.3783 12.85 4.62 0.255
20146.40522
80.38 0.3 0.2689 13.53 4.5 0.455
Average
sector*
6.71 0.38 0.28 0.32 17.57 4.97 0.22
Source: financial statements in 2012-2014 were processed by Ms. Excel
Average is the average sectoral fundamental performance of the mining sector that is the origin PTBA securities, with the exception of the average beta that represents the average annual beta PTBA. The table above can be described as an analysis of debt structure. The PTBA historical analysis shows the DER rasio decreasing every year. If, in 2007, this ratio is almost equal to the average debt ratio in the range of sectoral 33.4%, so in 2007 this successful ratio fell 7% to 26.2%. Although not as low as the debt ratio of similar companies in the sector, the decline in the DER ratio indicates that PTBA was trying to reduce its dependence on debt and this suggests the independence of the company as it is increasingly confident in running its business activity. On the other hand, it is advantageous for investors because the risks covered will wane if one day the shocks of the financial crisis and the resulting operation interest are eroded because the cost of debt burden is too great.
Analysis of profitability: ROE in the table above looks quite stable. Despite increases or decreases that occurred during the three-year observation period, the value of this ratio remains above the average ROE of 10.1% sectoral range. This shows that PTBA was able to maintain financial stability by making efficient use of the company’s assets to generate optimal profit. Analysis of cost efficiency: the ratio of NPM in the table above also looks quite stable. Increases or decreases that occurred around 5-7% in the range of 20-

30% over the three-year observation period, but remained above at the average sectoral valuable NPM 11.9%. Financial stability will be maintained by the company considering this ratio for investors. Managers must be able to perform cost efficiency in overall corporate profitability which can be optimized to improve company performance in the eyes of investors.
Analysis of market performance: the value of EPS in the above table indicates the number is quite fantastic, with a range of Rp 700 - Rp 1,100, which means there it always above the average EPS sectoral of around Rp 503.34. Investors in the long term will certainly benefit from the earnings stability, let alone the value of PTBA’s PER was also stable, despite the fact that in 2012 the ratio between the share price and earnings granted reached 26.3 times or 11.4 times greater than the average PER sectoral reached 14.9 times, this indicates investor interest in PTBA stock was quite high when compared to the EPS value. An historical analysis of beta securities shows that in the period 2013-2014, the PTBA beta value was less than 1 which indicates that the stock was defensive or less sensitive to changes in the market so as to have a below-average risk of the market. The average annual beta shows PTBA defensive stock that is safe and feasible to be a container investment because the systematic risk borne by investors is below the market average.
Islamic Capital Markets in Islamic FinanceIt is a fact that the development of Islamic finance is a representation of
the entry of the religious laws in the area of commercial life. Islamic finance is challenging secular finance which is pressumed by commercial law to be more efficient and superior, and is separated him from religious considerations and compliance with the Islamic teachings (Achsien, 2003). The birth of the Shari’ah capital markets did not escape from their Shari’ah laws applicable therein, for the sake of the people who make transactions therein. In the case of the capital market, a lack of knowledge or information (jahalah, ignorance) on the parties to a contract can be categorized as a transaction that contains garar and should be avoided. Fundamental analysis is one means by which to identify issuers that will become a place of investment.
Description of the object of research by previous authors offers some idea about the fundamental performance of the 8 selected sample companies.
All were consistently listed in JII and bear the respective codes: AALI, ASII, INTP, KLBF, PTBA, SMGR, TLKM, and UNTR. Based on descriptive analysis of the financial performance (individual or sector) and systematic risk conducted on the 8 samples, we can conclude that all of the sample companies are worthy and safe for investment purposes. Based on the analysis of profitability and cost-efficiency averages, they are all above the sectoral average, indicating that the issuer has a good performance. If viewed from the EPS, although some issuers have a EPS value that is below average for their respective sectors, such as ASII, KLBF and PTBA, overall all have stable and positive EPS values, so investors are not harmed. Meanwhile, if viewed from the analysis of beta securities, the eight in the sample had an average beta below or less than one which indicates that these stocks are less sensitive to movements or changes in the market.
This is advantageous for investors who are classified as risk averters or who do not like risk because of the risks covered if they invest in issuers that have a beta value of less than one is below the market average. However, if we look at the debt structure, there are two companies that still have a high debt structure, and tend to have a greater than average debt ratio for their sector, such as UNTR and TLKM. This needs to be watched though as essentially debt level is still mixed up with interest-based debt. The use of debt that is too high will place the issuer in the unstable condition of a high level of financial risk and also reduces the independence of the issuer in conducting business activities and in decision making.
At this point, the supposed criteria for the maximum 45% limit on the debt structure of the Shariah capital market in Indonesia actually applied to create new rules for loading non-usurious debt ratios in the financial statements. Thus, it can be seen that pure debt ratio is not based on riba, whether it meets the maximum standards set or not. It is also to facilitate potential investors who will invest in related issuers. While the stock investment decisions from the analysis of the financial statements are as follows; choosing companies with high ROE, which means effective in managing assets to generate earnings; choosing a company with a high NPM value of, which means efficient in making a profit; choosing a company with a low or medium DER value, which means passive in using debt; choosing a

company with a low or below sectoral PER value average. In other words, to choose a company with a good performance and a low PER value.
By judging the foundation of stock investment decisions, the writer recommends AALI and INTP as a means of investing. Despite the fact that the eight issuers had a fundamentally good performance, the two had low DER ratio, with their ROE and NPM stable above the average sectoral and their PER low or below sectoral average. It is possible, however, to do another analysis to determine the stock investment decisions. If compared to statistical test results, it can be seen that all fundamental factors in this study (DER, ROE, NPM, EPS, CR and PER) and systematic risk (beta) together significantly influence stock prices where EPS has contributed the most to stock price movements. This is in accordance with the partial test stating that EPS significantly influences stock prices, as well as the PER. If EPS and PER significantly effecting the stock price, investors must be careful to analyze these two factors before deciding to invest in a particular issuer. High EPS value indicates a high earnings obtained by investors each year, but differ from PER value which often does not correspond to the theory.
High PER value is often used as an indicator of high investor interest in related stocks, though not all issuers that have a high PER value have a fundamentally healthy performance. If we refer back to the definition of PER, which is the ratio between the stock price and EPS, it should be the case that stocks with low PER are very attractive to buy and those with a high PER are not, but this is not so. Therefore, keen investors with long-term vision can not decide their investment decisions solely on the factors of PER or EPS to assess whether the stock price is overpriced, underpriced or normal. Investors need to keep analyzing other factors fundamental to an issuer’s performance.
Stock price is affected by many factors and financial performance analysis is only one way to predict the factors that affect stock price movements. Fundamental analysis is the most convenient way to avoid the element of investor ignorance about an issuer’s shares to be purchased or otherwise. By eliminating this jahalah element, an investor will be freed from gharar, maysir or other actions that are not justified under Islamic law. Investments made by Muslim investors are required to be free from illicit elements. The legal basis of the principles of Islamic finance will provide a way for investors who want to use the principles of Islam to critically assess

available issuers in the Islamic capital market. Through critical assessment, the investor does not necessarily immediately receive a list of issuers listed in JII because it still does not close the possibility to carry out improvements and innovations that provide new bid for the welfare and wider benefit.
ConclusionBased on the description and analysis above, it can be concluded that
based on the partial test (t test) of 7 (seven) independent variables (financial performance and stock beta) only the variables of EPS and PER have a significant effect on stock prices, each with a significant value of 0000 and 0013 by 5%, while the other independent variables (DER, ROE, NPM and Beta) did not have a significant effect on the change / movement of stock prices. The results of the simultaneous test (F test) showed that the fundamental factors (DER, ROE, NPM, EPS, PER, CR) and systematic risk (beta) simultaneously significantly affect the movement or changes in stock prices of companies listed in JII-LQ 45 during 2012-2014 with a significance value of 0.000 or less than 5%.
For the sake of the progress of the development of the Islamic capital market in Indonesia, somesuggestions put forward, namely (a) necessity to apply the rules regarding the inclusion of non-usurious proportions of debt that do not mix with usury-based debt in order to avoid ambiguity in defining the structure of debt to equity in order not to exceed the maximum limit of 45%; (b) diclosure financial statements should be made more timely and appropriately at the end of a certain period (quarterly, semi-annual, annual) so as to facilitate research or analysis of the data in the financial statements; (c) for future studies, a different method of analysis to examine factors related to the stock price or certain related stocks, such as technical analysis or financial ratio analysis model, to complete fundamental analysis based on financial ratios is needed. Expected results of the research will be more comprehensive and make it easier for investors to make investment decisions.

References
Achsien Iggi H. (2003), Investasi Syari’ah di Pasar Modal: Menggagas Konsep dan Praktek Manajemen Portofolio. Jakarta: Gramedia Pustaka Utama.
Al-Quran Karim dan Terjemahan Artinya. (1999). (Translated Zaini Dahlan). Yogyakarta: UII Press.
Anastasia, Njo, Yanny Widiastuty and Imelda Wijiyanto (2003). Analisis Faktor Fundamental dan Risiko Sistematik terhadap Harga Saham Properti di BEJ, Jurnal Ekonomi Akuntansi Vol. 5, No. 2, 123-134.
Ang, Robert. (1997). Buku Pintar: Pasar Modal Indonesia. Penerbit Mediasoft Indonesia.
Ardi, A., Kiryanto dan Amalia D. (2008), Overreaksi Pasar terhadap Harga Saham Perusahaan-perusahaan di Indonesia (Studi Kasus di Bursa Efek Indonesia), Jurnal Akuntansi dan Keuangan, Vol. 5, No. 2.
Burhanudin (2009). Pasar Modal Syari’ah. Yogyakarta: UII Press.Fakhruddin, M. And M. Sopian Hadianto. (2001), Perangkat dan Model Analisis
Investasi PasarModal, Buku Satu. Jakarta: Elex Media Komputindo.Hadi, Syamsul. (2006). Metodologi Penelitian Kuantitatif untuk Akuntansi dan
Keuangan. Yogyakarta: Ekonisia.Harahap, Zulkifli and Agusni Pasaribu. (2007). Pengaruh Faktor Fundamental
dan Risiko Sistematik terhadap Harga Saham pada Perusahaan Manufaktur yang Terdaftar di Bursa Efek Jakarta, Mepa Ekonomi: Jurnal Magister Ilmu Ekonomi, Vol. 2, No. 1, pp. 68-77.
Hasan, Iqbal. (2004). Analisis Data dengan Statistik. Jakarta: PT Bumi Aksara.Husnan, Suad (2001). Dasar-dasar Teori Portfolio dan Analisis Sekuritas.
Yogyakarta: UPP AMP YKPN.http://www.kalbe.co.id/about/brief/accessed 21 December 2015.http://ptba.co.id/en/about/historyaccessed 21 December 2015.Huda, Nurul and Mustafa Edwin Nasution. (2005), Investasi pada pasar Modal
Syari’ah. Jakarta: Kencana Prenada Media.Jogiyanto. (2003). Teori Portofolio dan Analisis Investasi. Yogyakarta: BPFE
UGM.Khairandy, Ridwan. (2010). Hukum Pasar Modal I. Yogyakarta: FH UII Press.Manan, Abdul. (2009), Aspek Hukum dalam Penyelenggaraan Investasi di Pasar
Modal Syari’ah Indonesia. Jakarta: Kencana.Nasarudin, Irsan and Indra Surya. (2004). Aspek Hukum Pasar Modal Indonesia.
Jakarta: Prenada. Purbayu, Budi Santosa and Ashari. (2005). Analisis Statistik dengan Microsoft
Excel & SPSS. Yogyakarta: Penerbit Andi.

Salim, Lani. (2003). Analisa Teknikal dalam Perdagangan Saham. Jakarta: Elex Media Komputindo.
Sugiyanto. (2004). Analisis Statistika Sosial. Malang: Bayumedia.Supardi. (2005). Metode Penelitian Ekonomi dan Bisnis. Yogyakarta: UII Press.Syahib, Natarsyah. (2000). Analisis Pengaruh Beberapa Faktor Fundamental
dan Risiko Sistematik terhadap Harga Saham (Kasus Industri Barang dan Konsumsi yang Go Public di Pasar Modal Indonesia), Jurnal Ekonomi dan Bisnis Indonesia, Vol. 15, No. 3.
Usman, Marzuki. (1990). ABC Pasar Modal Indonesia, LPPI/BI dan ISEI, Jakarta.Widiasari, Destri Rusi. (2009). Pengaruh Faktor Fundamental dan Risiko
Sistematik terhadap Harga Saham pada Perusahaan Manufaktur yang Terdaftar di Bursa Efek Indonesia, Skripsi, http://repository.usu.ac.id/handle/123456789/4046 accessed 13 December 2015.
Widiastuti, Ekaningtyas and Dwita Dermawati. (2010). Analisa Market Overreaction pada Saham LQ 45 di Bursa Efek Indonesia, Jurnal Fokus Ekonomi, Vol. 9, No. 3, pp. 128-202.