livrepository.liverpool.ac.uklivrepository.liverpool.ac.uk/.../1/pkpdteicoplanin_resubmission_vrm.… ·...
TRANSCRIPT
Population Pharmacokinetics and Pharmacodynamics of
Teicoplanin in Neonates: Making Better use of C- Reactive
Protein to Deliver Individualized Therapy
Running Title: Population PK-PD of Teicoplanin in Neonates
Ramos- Martín V 1,2, Neely MN 3, McGowan P 4, Siner S 2, Padmore K 2, Peak M 2,
Beresford MW 2,5, Turner MA4,5, Paulus S 2 , Hope WW 1#
1 Molecular and Clinical Pharmacology Department, Institute of Translational Medicine,
University of Liverpool, United Kingdom.
2Alder Hey Children’s NHS Foundation Trust, Liverpool, United Kingdom.
3 Laboratory of Applied Pharmacokinetics and Bioinformatics, The Saban Research
Institute and The Division of Pediatric Infectious Diseases, Children´s Hospital Los
Angeles, University of Southern California, Los Angeles, California.
4 Liverpool Women´s NHS Foundation Trust, Liverpool, United Kingdom.
5 Department of Women´s and Children´s Health, Institute of Translational Medicine,
University of Liverpool, Liverpool, United Kingdom.
# Antimicrobial Pharmacodynamics and Therapeutics, Department of Molecular and
Clinical Pharmacology, University of Liverpool, 1.09 Sherrington Building, Liverpool
L69 3GE, United Kingdom. T: +44 (0) 151 794 5941 E: [email protected]
Abstract word count: 252 words; Main text: 3785 words
1
2
3
4
5
6
7
8
9
10
11
12
13
14
15
16
17
18
19
1
ABSTRACT
Background: There is uncertainty about the optimal teicoplanin regimens for neonates.
The study aim was to determine the population PK of teicoplanin in neonates, evaluate
currently recommended regimens and explore the exposure-effect relationships.
Methods: An open label pharmacokinetic (PK) study was conducted. Neonates from
26-44 weeks post-menstrual age (PMA) were recruited (n=18). Teicoplanin regimen
was 16 mg/ kg loading dose, followed by 8 mg/kg once daily. Therapeutic drug
monitoring (TDM) and dose adjustment were not conducted. A standard 2-compartment
PK model was developed, followed by models that incorporated weight. A
pharmacokinetic-pharmacodynamic (PK-PD) model with C-reactive (CRP) serial
measurements as the PD input was fitted to the data. Monte Carlo simulations (n=5000)
were performed using Pmetrics. The AUCs at steady state and the proportion of patients
achieving the recommended drug exposures (i.e Cmin >15 mg/L) were determined.
Results: The PK allometric model best accounted for the observed data. The PK
parameters medians were: Clearance=0.435*(weight /70) 0.75 (L/h), Volume 0.765 (L),
Kcp 1.3 (h-1), Kpc 0.629 (h-1). The individual time-course of CRP was well described
using the Bayesian posterior estimates for each patient. The simulated median AUC 96-120
was 302.3 mg*h/L, median Cmin at 120 h was 12.9 mg/L. A 38.8% of patients attained
a Cmin >15 mg/L by 120h.
Conclusion: Teicoplanin population PK is highly variable in neonates, weight being the
best descriptor of PK variability. A low percentage of neonates were able to achieve
Cmin >15 mg/L. The routine use of TDM and improved knowledge on the PD of
teicoplanin is required.
20
21
22
23
24
25
26
27
28
29
30
31
32
33
34
35
36
37
38
39
40
41
42
2
INTRODUCTION
Gram-positive bacterial pathogens are an important cause of nosocomial
infection in neonates.1 The risk factors include prematurity and the extensive use of
central venous catheters. There is high attributable mortality and the potential for
serious longer-term morbidity.1–3 Teicoplanin is a glycopeptide antibiotic with activity
against methicillin-resistant staphylococci (MRSA and CoNS) and has several potential
advantages over vancomycin including better tolerability, lower risk of nephrotoxicity
and improved ease of administration.4,5 In older children, there is considerable
pharmacokinetic (PK) variability in comparison with adults, with a much wider drug
exposure (AUC) distribution among children.6 Little is known about the PK of
teicoplanin in neonates.
Serial concentrations of C-reactive protein (CRP) are a useful adjunct to the
clinical assessment of neonates with acute infection.7 The diagnosis of neonatal
bloodstream infection and its subsequent management remains challenging. Clinical
signs are nonspecific.2 Blood cultures are notoriously insensitive and often only
intermittently positive in this population because of the low yield of small blood
volumes collected.8,9 A fall in CRP is reassuring evidence of response to antimicrobial
therapy and CRP is frequently used to guide antimicrobial therapy in neonates with
proven or suspected infection.10,11 Much of this decision-making has not been formalised
using pharmacokinetic-pharmacodynamic (PK-PD) models or dosing algorithms.
In this study we developed a population PK-PD mathematical model to describe
the serum pharmacokinetics of teicoplanin in neonates with the pharmacodynamics
quantified in terms of circulating CRP concentrations. Our objectives were as follows:
(1) describe and quantify measures of central tendency and inter-patient neonatal PK
43
44
45
46
47
48
49
50
51
52
53
54
55
56
57
58
59
60
61
62
63
64
65
66
3
variability; (2) evaluate teicoplanin exposure in the neonatal population with currently
recommended regimens; and (3) investigate the relationship between drug exposure and
time-course of CRP. The latter is a first critical step for the development of algorithms
to control both serum drug concentrations and clinically relevant biomarkers such as
CRP.
67
68
69
70
71
72
4
MATERIAL AND METHODS
Study design, patient population and sample collection
An open label, hospital-based PK study using a sparse blood sampling strategy
was conducted. Both pre-term and term neonates from 26 to 44 weeks postmenstrual
age (PMA) were recruited from Alder Hey Children´s NHS Foundation Trust and
Liverpool Women´s NHS Foundation Trust (Liverpool, United Kingdom).
Participants were screened and recruited according to five age categories to
ensure a range of sizes was studied. The following categories were used for recruitment:
24-27, 28-31, 32-35, 36-39 and 40-44 weeks PMA. All patients that received
teicoplanin for proven or suspected CoNS sepsis and/or central-line associated infection
and likely to survive more than 72 hours were eligible for the study. All patients had co-
administered ciprofloxacin or gentamicin as part of the combined empirical therapy for
central-line associated bloodstream infection.
Teicoplanin was used at the discretion of the treating neonatologist. The regimen
for neonates 44 weeks PMA was a loading dose of 16 mg/kg, followed 24 hours later
by 8 mg/kg administered once daily.12 Teicoplanin was infused over 30 minutes.
Therapeutic drug monitoring (TDM) is not routinely performed and dose adjustment
was not conducted in this study. The duration of treatment was also at the discretion of
the treating neonatologist.
Blood samples (0.2 mL) were obtained throughout the first and last dose
intervals (1, 3, 6 and 24h post-dose). Patients weighing <1000 grams at inclusion could
have a maximum of two study-specific sampling episodes per dose interval to minimise
blood loss. The total sampling period was to a maximum of 168 h for the majority of
patients. If the first dose administration occurred before informed consent had been
73
74
75
76
77
78
79
80
81
82
83
84
85
86
87
88
89
90
91
92
93
94
95
96
5
obtained, a pre-dose sample was obtained. Whenever possible, a washout sample was
collected 24 hours after the last dose. Samples were centrifuged at 1500 g for 10
minutes and serum was stored at -80ºC prior to analysis.
The demographic variables with a potential impact on the PK of teicoplanin
and/or influence on the determination of teicoplanin (concomitant medications) were
collected for each patient (i.e. weight and serum creatinine). Concentrations of CRP
before, during and after teicoplanin treatment were measured as part of standard care.
Demographic data were analysed with SPSS Statistics version 22 (IBM Corporation,
New York, United States, [http://www-01.ibm.com/software/analytics/
spss/downloads.html]).
Ethics
The study was approved by the Medicines and Healthcare Products Regulatory Agency
(clinical trial authorisation reference number: 21362/0003/001-0002) and the National
Research Ethics Service and Regional Committee (REC: 13/NW/0023). Written
informed consent was obtained from parents and/or legal guardians. The study was
registered in the European Clinical Trials Database Registry (EudraCT): 2012-005738-
12.
Measurement of Teicoplanin Concentrations
Teicoplanin concentrations were measured using a commercially available
fluorescence polarization immunoassay (FPIA; Thermo Fisher Scientific, Germany)
The limit of quantification (LOQ) was < 3.0 mg/L. The dynamic range was 3-100 mg/L
and overall precision was < 6%.
Measurement of CRP concentrations
97
98
99
100
101
102
103
104
105
106
107
108
109
110
111
112
113
114
115
116
117
118
119
6

A Multigen CRP Vario (Abbott, Wiesbaden, Germany) latex immunoassay
was used for the immunoturbidimetric determination of CRP in the plasma of patients,
and also implemented in the Abbott Architect ci4100 system. The limit of quantification
(LOQ) was < 0.2 mg/L (reported clinically as < 4 mg/L) for the standard and wide range
methods (analyte concentration at which the CV=20%). The dynamic range was 0.2-480
mg/L (wide range method) and total precision was 6%. A CRP cut-off value > 10
mg/L was considered positive.
Microbiological investigation
Microbiological specimens, including blood cultures, were collected as part of
routine clinical care. Positive microbiological samples were stored for identification
with a Bruker Biotyper MALDI-TOF MS System (Bruker Daltonics, Billerica, MA) and
susceptibility testing was performed using E-test (bioMérieux, Hampshire, UK),
following BSAC methodology.13
120
121
122
123
124
125
126
127
128
129
130
131
132
7
Population Pharmacokinetic Models
All data were analysed using Pmetrics.14 The inverse of the estimated assay
variance was used as the weighting function for all models. Three structural PK models
were explored in this study. The first represented a standard two-compartment PK
model with time-delimited zero-order intravenous input and first-order elimination from
central compartment. The model is described by the differential equations 1a and 1b
below.
dX (1 )dt
=R (1 )−(Kcp+ SCLVc ) ∙ X (1 )+[ Kpc ∙ X (2 ) ](1 a)
dX (2 )dt
=Kcp∙ X (1 )−Kpc ∙ X (2 )(1 b)
Where X(1) and X(2) represent the amount of teicoplanin (mg) in the central (c)
and peripheral (p) compartments, respectively. R(1) is the rate of infusion of drug into
the central compartment (mg/h). The central compartment has volume (Vc) in liters (L),
from which there is clearance (SCL) in liters per hour (L/h). The central and peripheral
compartments are connected by the first-order rate constants Kcp and Kpc (h-1).
The effect of weight, PMA, post-natal age (PNA), serum creatinine and
estimated glomerular filtration rate (eGFR) using the Haycock-Schwartz formula
(K*Height/ serum creatinine);15 ( the UK population median height values for age and
sex were used for each patient; and K=0.33 for pre-term neonates and K=0.45 for term
neonates) on the population PK of teicoplanin was explored.16,17 The Bayesian estimates
for clearance and volume of distribution from each patient were obtained from the
standard model (above) and plotted against weight, PMA, PNA, serum creatinine and
133
134
135
136
137
138
139
140
141
142
143
144
145
146
147
148
149
150
151
152
153
154
8
GFR, using both linear and logarithmic scales. Since both linear and logarithmic
relationships between clearance and weight appeared tenable, linear and allometric
models that incorporated weight as a covariate were developed. Ultimately, an
allometric power model was used. Such a model has been widely used to determine the
effect of size on the pharmacokinetics of various compounds in children and
neonates.18,19 The allometric scaling exponent in equation 3a was fixed at 0.75. Only
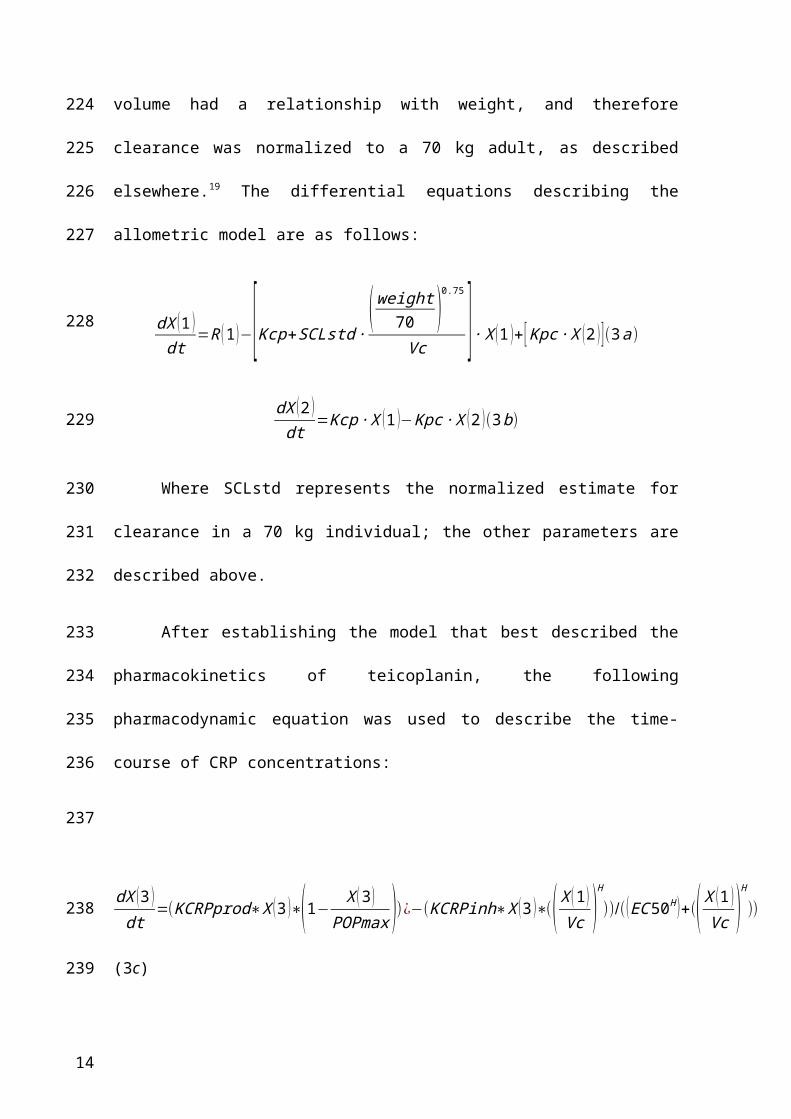
clearance and not volume had a relationship with weight, and therefore clearance was
normalized to a 70 kg adult, as described elsewhere.19 The differential equations
describing the allometric model are as follows:
dX (1 )dt
=R (1 )−[Kcp+SCLstd ∙( weight
70 )0.75
Vc ] ∙ X (1 )+ [ Kpc∙ X (2 ) ](3a)
dX (2 )dt
=Kcp∙ X (1 )−Kpc ∙ X (2 )(3 b)
Where SCLstd represents the normalized estimate for clearance in a 70 kg
individual; the other parameters are described above.
After establishing the model that best described the pharmacokinetics of
teicoplanin, the following pharmacodynamic equation was used to describe the time-
course of CRP concentrations:
dX (3 )dt
=(KCRPprod∗X (3 )∗(1−X (3 )
POPmax ))¿−(KCRPinh∗X (3 )∗(( X (1 )Vc )
H
))/(( EC50H )+(( X (1 )Vc )
H
))
(3c)
155
156
157
158
159
160
161
162
163
164
165
166
167
168
169
170
171
172
173
9
Where KCRPprod is the maximum rate of CRP production (mg/L*h-1), POPmax is the
theoretical maximum CRP concentration (mg/L), KCRPinh is the maximum rate of
CRP inhibition (mg/L*h-1), EC50 is the concentration of teicoplanin (mg/L) that
produces half-maximal effect (CRP inhibition) and H is the slope function for the CRP
inhibition term.
Given the high PK variability in the population and in order to avoid biased
parameter estimates in the PK-PD model, the Bayesian posterior estimates for each
patient´s PK parameters (from the final PK model described above) were fixed and the
PD parameters were then estimated by fitting the PD component of the model to each
patient´s CRP data. The Bayesian posterior estimates for each subject were used to
estimate the concentration-time profiles for teicoplanin and CRP for each patient.
Average AUC and trough (Cmin) for each 24 h of therapy were calculated from the
Bayesian posterior estimates.
Monte Carlo simulation
Monte Carlo simulations were performed using a semi-parametric sampling
methodology14,20 that generated a simulated population of 5,000 neonates receiving a
given teicoplanin regimen. For each simulated patient, the weight-based dose of
teicoplanin (administered in mg per kg) was administered to each neonate (30 minute
infusion) as an absolute dose of teicoplanin (in mg) by multiplying the rate of infusion
(in mg/h) by the simulated weight.
All calculations were performed at steady state between day 4 and 5 of
treatment. The proportion of patients achieving Cmin >10, >15, 20, 30, 40 and 60 mg/L
(recommended safety cut-off) was determined. A comparison of the variability of
distribution of drug exposures (AUCs) achieved in the neonatal simulated population
174
175
176
177
178
179
180
181
182
183
184
185
186
187
188
189
190
191
192
193
194
195
196
197
10
was performed with the distribution of drug exposures in older children (1 month-16
years old) and adults receiving also currently recommended dosage regimens of
teicoplanin. This comparison was based on Monte Carlo simulations conducted on a
previous teicoplanin PK study with older children and adults.6
Exposure-response relationships
A newly described PD index (AUC: EC50) was used to link drug exposure with
therapeutic response (terminal CRP concentration).21 An Emax sigmoidal model was
fitted to the data. The use of a more conventional index (e.g. AUC:MIC ratio) was
infeasible because the MIC of the invading microorganism was not available for the
majority of patients. The EC50 is the estimated drug concentration required to induce
half-maximal reduction in the CRP concentrations and it is therefore an in vivo estimate
of drug activity.
198
199
200
201
202
203
204
205
206
207
208
209
210
11
RESULTS
Demographics
A total of 18 neonates were recruited from two different hospitals in Liverpool
(Alder Hey NHS Children´s Foundation Trust and Liverpool Women´s Hospital) over a
20 month-period (April 2013 and January 2015). Ten patients were recruited from the
neonatal intensive care unit at the Liverpool Women´s Hospital. The number of
recruited patients by sub-category PMA (weeks) was: 24-27 (n=1), 28-31 (n=5), 32-35
(n=2), 36-39 (n=5) and 40-44 (n=5). A description of the demographic data is presented
in table 1.
Microbiological results
A total of 44.4% of recruited patients (n=8) had a positive blood culture obtained
from either a central or peripheral i.v. line. A total of 33.3% of those recruited (n=6)
were Gram-positive infections (100% CoNS including S. haemolyticus (n=2), S.
epidermidis (n=1) and n=3 unidentified species). All were susceptible to teicoplanin
(MIC 4 mg/L using the EUCAST breakpoint).22 The remaining 11.1 % (n=2) were
Gram-negative bacterial infections (n=1 had P. aeruginosa and n=1 had Klebsiella
oxytoca) (These two patients only received two doses of teicoplanin each and were
excluded from the subsequent exposure-relationship analysis).
Teicoplanin and CRP concentrations
The concentration time-profile of teicoplanin and corresponding CRP
concentrations for each patient is shown in figure 1a and 1b, respectively. A total of 96
PK samples were available for analysis (mean of 5.3 samples per patient). Fourteen PK
concentrations, from 4 patients were excluded from the analysis because of incorrect or
absent sampling times. The mean (sd) from the observed teicoplanin concentrations was
211
212
213
214
215
216
217
218
219
220
221
222
223
224
225
226
227
228
229
230
231
232
233
234
12
18 (9.11) mg/L and a median of 17.32 mg/L (range 3.1-38.7 mg/L). A total of 104 CRP
samples were available for analysis as part of the standard care of the patients.
Population PK models
Both the population PK linear and allometric models performed similarly with
an acceptable fit to the observed data and comparable measures of bias and precision.
However, on the basis of the individual Bayesian estimates of the observed-versus-
predicted fit of the data, the allometric PK model better accounted for the observed data
and was chosen for further analyses. The model diagnostics are shown in table 2. For
the allometric model the linear regression of observed versus predicted values had a
coefficient of determination of r2 = 0.815 with measures of bias and precision of 0.03
and 0.8, respectively (shown in figure 2a). The population PK parameter estimates of
the allometric model are shown in table 3.
Population PK-PD model
The fit of the PK-PD data was acceptable. The linear regression of observed
versus predicted values had a coefficient of determination of r2 = 0.95 with measures of
bias and precision of 0.09 and 0.9, respectively (shown in figure 2b). The time-course of
CRP in each individual patient was described with a high degree of precision and
minimal bias using the Bayesian posterior median estimates for each patient. The
population PK-PD parameter estimates are summarised in table 3. The Bayesian
individual posterior estimates for the linked PK and the PD are shown in Figure 3.
Monte Carlo simulation
Based on the simulations, the mean (SD) 24-hour steady-state AUC from 96-120
h was 365.4 (267.1) with a median of 302.3 mg*h/L. The mean (SD) trough at 96 h was
235
236
237
238
239
240
241
242
243
244
245
246
247
248
249
250
251
252
253
254
255
256
257
13
15.7 (11.7) mg/L with a median of 12.9 mg/L. Only 38.8 % of neonates achieved a
Cmin at 120h > 15 mg/L. In addition, 69.1%, 22.4%, 8.56%, 3.92% and 1.1% achieved
Cmin > 10, 20, 30, 40 and 60 mg/L, respectively. Comparative distribution histograms
of the achieved AUCs at steady state for the simulated neonates, as well as for simulated
older children and adult populations are shown in figure 4. The neonatal population
achieved median AUCs at steady state (302.3 mg*h/L) comparable to the median AUC
attained by a population of adults receiving 400 mg/day (291.81 mg*h/L), but with
more variability (neonatal AUC IQR= 227.5 versus adult AUC IQR= 101.59 mg*h/L).
Exposure-response relationships
The Bayesian posterior estimates for the exposure-response relationships (AUC,
Cmin and AUC:EC50) are shown in figure 5. If patients 1 and 7 (infected with
Pseudomonas auriginosa and Klebsiella oxytoca, respectively) are excluded, 56 % of
the patients (9/16) were able to suppress CRP under the cut-off value of 10 mg/L by 96-
120 h. Subject 16 (gastroschisis) was not included in the inhibitory sigmoid Emax
model (the patient’s data are shown in Figure 5c). An AUC:EC50 of 68.3 is predictive
of a terminal CRP 10 mg/L. The relationship between AUC:EC50 and predicted CRP
at the end of therapy is shown in figure 5c. Patients with an AUC:EC50 >68.3 tended to
have a more consistently lower terminal CRP level than patients with an
AUC:C50<68.3 (p=0.002) (figure 6).
258
259
260
261
262
263
264
265
266
267
268
269
270
271
272
273
274
275
276
277
14
DISCUSSION
Teicoplanin is used for the treatment of serious staphylococcal infections.23–25
Currently, teicoplanin is not licensed in the EU for treatment of neonates or infants < 2
months of age. The PK-PD study provides a rationale to address issues related to the
appropriate teicoplanin regimen and extent of variability in both drug exposure and
response. Furthermore, the study provides the necessary tools to take the next critical
steps to provide truly individualised antimicrobial therapy for neonates receiving
teicoplanin.
The extent of inter-patient PK variability in this neonatal population was high
(figure 1a). Of the multiple covariates that were studied, only weight accounted for any
portion of the observed PK variability. Incorporation of weight into structural PK
models resulted in better fits and statistically more likely solutions. Of note, we could
have equally reasonably related weight to clearance using linear or power scaling terms,
despite the convention for using a scaling exponent of 0.75.19,26 We could not
demonstrate any relationship between teicoplanin clearance and PMA, estimated
glomerular filtration rate (eGFR) or serum creatinine. This is somewhat surprising
because teicoplanin is almost completely renally (98%) cleared by glomerular
filtration.27 The absence of any relationship probably reflects the small sample size as
well as the relatively poor estimates of eGFR in neonates using current nomograms.
This finding does call into question whether teicoplanin dosing should be adjusted on
the basis of eGFR and further studies are required to specifically address this question.
Monte Carlo simulations suggest that the median AUCs at steady state in
neonates receiving 16 mg/kg as a loading dose, followed by 8 mg/kg q24 h are
comparable to adults receiving 400 mg/day. However, there is much larger PK
variability in the AUCs of neonates (Figure 4). While the matching of measures of
278
279
280
281
282
283
284
285
286
287
288
289
290
291
292
293
294
295
296
297
298
299
300
301
302
15
central tendency is straightforward, the best way to match two completely different
AUC distributions is less clear. The high variability makes identification of a fixed
weight-based regimen challenging because of the unacceptably high proportion of
neonates with both low and high drug exposure. Any attempt to address this problem
results in an unsatisfactory trade between effect and toxicity and eventual
acknowledgment that TDM is required to optimise dosing and drug exposure.
While TDM is the only current way teicoplanin dosing can be optimised, there
are a number of significant challenges to this process: first and most obviously
obtaining repeated blood draws in premature neonates is never trivial; second, there is
persistent uncertainty about drug exposure targets for TDM. A trough concentration of
15 mg/L (measured by FPIA) is proposed in the summary of product characteristics
(SPC) by day 3 to 5 of therapy for both adults and children, but recently increased to 20
mg/L and 30-40 mg/L for the treatment of deep-seated infections and infective
endocarditis, respectively.28 Moreover, safe concentrations are recommended not to
exceed 60 mg/L, despite the little evidence for any relationship between serum
concentrations and toxicity in neonates.29 Such recommendations are based on scant
clinical evidence in adult patients and with only a rudimentary understanding of the
pharmacodynamics of teicoplanin.30–32 The use of Bayesian feedback tools for dosage
individualisation, which requires the availability of robust population PK models and
optimally sampled concentrations, may enable the attainment of desired AUC targets
(and surrogate trough concentrations) for any individual patient.33
This study is too small to resolve clinical exposure-response relationships.
Inadequate power was further compounded by a Gram-positive pathogen being isolated
in only 6/18 (33.3%) of patients. Hence, there was no opportunity to examine the
relationship between the magnitude of any traditional pharmacodynamic indices (e.g.
303
304
305
306
307
308
309
310
311
312
313
314
315
316
317
318
319
320
321
322
323
324
325
326
327
16
AUC:MIC) and outcome. Even in larger datasets, the problem of culture negativity is
frequently present. In this situation, most investigators use a population value (e.g.
MIC90) to calculate drug exposure for an individual patient. Assuming such patients are
infected with the most resistant pathogen is conservative, but necessarily biased. The
use of CRP and a novel pharmacodynamic index (the AUC:EC50) circumvents some of
these issues. The rationale behind this quotient is that EC50 is an in vivo measure of
drug potency and the AUC:EC50 is a measure of the exposure of drug relative to the
potency of its effect. A major advantage of this approach is that it allows for drug
exposure targets that are more individualised for a specific patient. The EC50 (and
therefore AUC:EC50) is influenced by both the patient and characteristics of the
infecting organism. The EC50 captures the impact of multiple variables on exposure-
response relationships (e.g., in vitro resistance, high bacterial load, a persistent infective
focus, biofilms and immune response). In contrast, when the measure of potency is the
MIC alone, as for AUC:MIC, it is only the organism's characteristics that are
considered, and all the other factors implicit in EC50 are ignored. The Bayesian
posterior EC50 estimates ranged widely (0.6-18.7 mg/L), which again reflects highly
variable pharmacodynamics and in vivo potency. In this study, the AUC:EC50 predicted
the terminal CRP levels after 5 days of therapy (figure 5c) for a majority of patients.
The use of CRP as a biomarker deserves some comment. CRP is widely used in
clinical practice to guide anti-infective therapy, but much of that process is informal and
intuitive. 11,34,35 In this study, we explicitly link teicoplanin serum concentrations and
changes with circulating CRP. The measurement of CRP in an individual patient
provides a real-time estimate of the response to drug. There are clearly some
advantages to such an approach: CRP is quantitative, widely available, well validated,
and readily accepted by clinicians. It is the most extensively studied biomarker in
328
329
330
331
332
333
334
335
336
337
338
339
340
341
342
343
344
345
346
347
348
349
350
351
352
17
neonatal sepsis. In addition, a recent systematic review has showed higher specificity
and predictive values at symptom onset and after 24-48 hours than procalcitonin (PCT)
in neonatal bacterial sepsis.36 PCT has been investigated mainly in early onset sepsis
and with different cut-off values depending on time after birth. Its value in neonates is
limited by a marked physiological increase after birth.37 The ability to link drug
concentrations with a biomarker provides the prospect for truly individualised therapy
where the dosing of drug is designed to manage a biomarker rather than a serum drug
concentration. However, there are some obvious limitations. CRP is a nonspecific
marker of infection and inflammation, and adjusting a dose solely on the basis of
climbing CRP may be dangerous if the CRP elevation is a result of Gram-negative
bacteraemia as was the case in patients 1 and 7, or the result of a severe non-infectious
inflammation as appears likely for patient 16 (Figure 3). Thus, to guide teicoplanin
dosing, there needs to be confidence that the CRP elevation is a result of a teicoplanin-
susceptible pathogen. In our study, we had microbiological evidence of a teicoplanin-
susceptible organism in a third of patients. However, there was a high clinical suspicion
on this being the case for the remaining patients (clinical, laboratory markers of
infection and specific risk factors such as a central line inserted). In our setting,
teicoplanin and ciprofloxacin constitute the empirical treatment in the context of
central-line associated bloodstream infection. All patients had co-administered
ciprofloxacin or gentamicin until a blood culture result became available. The other
antimicrobial could have certainly had an impact on CRP decline in the case of a Gram
negative causing microorganism, nonetheless, CoNS was the most commonly isolated
microorganism and teicoplanin was only discontinued in two patients with Gram
negative infection. Interestingly, a recent study has also showed that serial CRP
measurements can optimally predict whether an organism is sensitive to the empirical
353
354
355
356
357
358
359
360
361
362
363
364
365
366
367
368
369
370
371
372
373
374
375
376
377
18
antimicrobial therapy in the first 48 hours of treatment of neonatal sepsis.38 These
findings need further and prospective evaluation.
Despite any potential limitations, this study extends the standard
pharmacometric approach whereby the population PK is described, Monte Carlo
simulations are performed and post hoc analyses such as the probability of target
attainment analyses are performed, often using PD targets of questionable clinical
significance. While the current approach has limitations because of the non-specificity
of the biomarker, the analyses begin to refocus therapeutic arguments on the individual
patient, using real data to deliver a regimen that is both safe and effective for the clinical
problem in hand.
378
379
380
381
382
383
384
385
386
387
388
389
19
ACKNOWLEDGEMENTS
We thank the NIHR Alder Hey Clinical Research Facility (CRF) and Alder Hey NHS
Foundation Trust Business Unit for supporting the study.
The Neonatal Intensive Care Unit at the Liverpool Women´s NHS Foundation Trust and
the Paediatric Intensive Care Unit at Alder Hey NHS Foundation Trust.
The CRF and Liverpool Women´s NHS Foundation Trust research nurses Bronagh
Howell, Joanne Windrow, Karen Harvey and Gail Wallace for contributing to the
recruitment of patients and data collection.
Elaine Scott for supporting the data management and eCRF development.
Richard Drew and Timothy Neal, consultant microbiologists, for their input and
support.
We thank all the patients and families that participated in the study.
390391392
393
394
395
396
397
398
399
400
401
402
403404405406407408
20
FUNDING
The study and Virginia Ramos-Martín were funded by the NIHR Alder Hey Clinical
Research Facility for Experimental Medicine and Alder Hey NHS Foundation Trust
Business Unit.
William Hope is supported by a National Institutes of Health Research (NIHR)
Clinician Scientist Fellowship.
The CRP serial measurements were generated as part of the standard of care of patients
in Alder Hey Children´s and Liverpool Women´s NHS Foundation Trusts and were
collected for this study.
409410411
412
413
414
415
416
417
418
419
21
TRANSPARENCY DECLARATION
William Hope has received research funding from Pfizer, Gilead, Astellas, AiCuris,
Amplyx and F2G, and acted as a consultant and/or given talks for Pfizer, Basilea,
Astellas, F2G, Nordic Pharma, Amplyx, Mayne Pharma and Pulmocide.
All other authors: none to declare.
420421422
423
424
425
426427
22
REFERENCES
1. Stoll BJ, Hansen N, Fanaroff AA, et al. Late-onset sepsis in very low birth weight neonates: the experience of the NICHD Neonatal Research Network. Pediatrics 2002; 110: 285–91.
2. Marchant EA, Boyce GK, Sadarangani M, et al. Neonatal sepsis due to coagulase-negative staphylococci. Clin Dev Immunol 2013; 2013: 586076.
3. Adams-Chapman I, Stoll BJ. Neonatal infection and long-term neurodevelopmental outcome in the preterm infant. Curr Opin Infect Dis 2006; 19: 290–7.
4. Svetitsky S, Leibovici L, Paul M. Comparative efficacy and safety of vancomycin versus teicoplanin: Systematic review and meta-analysis. Antimicrob Agents Chemother 2009; 53: 4069–79.
5. Cavalcanti AB, Goncalves a. R, Almeida CS, Gomes DB, et al. Teicoplanin versus vancomycin for proven or suspected infection. Cochrane Database Syst Rev 2008.
6. Ramos-Martin V, Paulus S, Siner S, et al. Population Pharmacokinetics of Teicoplanin in Children. Antimicrob Agents Chemother 2014; 58: 6920–7.
7. Philip AG, Mills PC. Use of C-reactive protein in minimizing antibiotic exposure: experience with infants initially admitted to a well-baby nursery. Pediatrics 2000; 106: E4.
8. Connell TG, Rele M, Cowley D, et al. How reliable is a negative blood culture result? Volume of blood submitted for culture in routine practice in a children’s hospital. Pediatrics 2007; 119: 891–6.
9. Lutsar I, Chazallon C, Carducci FIC, et al. Current management of late onset neonatal bacterial sepsis in five European countries. Eur J Pediatr 2014; 173: 997–1004.
10. Benitz WE, Han MY, Madan A, et al. Serial Serum C-Reactive Protein Levels in the Diagnosis of Neonatal Infection. Pediatrics 1998; 102: e41.
11. Ehl S, Gering B, Bartmann P, et al. C-Reactive Protein Is a Useful Marker for Guiding Duration of Antibiotic Therapy in Suspected Neonatal Bacterial Infection. Pediatrics 1997; 99: 216.
12. BMJ Group, the Royal Pharmaceutical Society of Great Britain and RPL 2014. British National Formulary for Children 2014-2015. 2014: 289–90. Available at: http://www.evidence.nhs.uk/formulary/bnfc/current/5-infections/51-antibacterial-drugs/517-some-other-antibacterials/vancomycin-and-teicoplanin/vancomycin.
13. Andrews JMTBS of AC. Determination of Minimum Inhibitory Concentrations. Br Soc Antimicrob Chemother 2006: 1–19. Available at: http://www.bsac.org.uk/wp-content/uploads/2012/02/Chapter-2-Determination-of-MICs-2006updated.pdf.
14. Neely MN, van Guilder MG, Yamada WM, et al. Accurate Detection of Outliers and Subpopulations With Pmetrics, a Nonparametric and Parametric Pharmacometric Modeling and Simulation Package for R. Ther Drug Monit 2012; 34: 467–76.
428
429430431
432433
434435
436437438
439440
441442
443444445
446447448
449450451
452453
454455456
457458459460
461462463
464465466
23
15. Martini S, Prévot A, Mosig D, et al. Glomerular filtration rate: measure creatinine and height rather than cystatin C! Acta Paediatr 2003; 92: 1052–7.
16. Brion LP, Fleischman AR, McCarton C, et al. A simple estimate of glomerular filtration rate in low birth weight infants during the first year of life: noninvasive assessment of body composition and growth. J Pediatr 1986; 109: 698–707.
17. Schwartz GJ, Feld LG, Langford DJ. A simple estimate of glomerular filtration rate in full-term infants during the first year of life. J Pediatr 1984; 104: 849–54.
18. Wurthwein G, Groll AH, Hempel G, et al. Population pharmacokinetics of amphotericin B lipid complex in neonates. Antimicrob Agents Chemother 2005; 49: 5092–8.
19. Hope WW, Seibel NL, Schwartz CL, et al. Population pharmacokinetics of micafungin in pediatric patients and implications for antifungal dosing. Antimicrob Agents Chemother 2007; 51: 3714–9.
20. Goutelle S, Bourguignon L, Maire PH, et al. Population modeling and Monte Carlo simulation study of the pharmacokinetics and antituberculosis pharmacodynamics of rifampin in lungs. Antimicrob Agents Chemother 2009; 53: 2974–81.
21. Huurneman LJ, Neely M, Veringa A, et al. Pharmacodynamics of Voriconazole in Children: Further Steps Along the Path to True Individualized Therapy. Antimicrob Agents Chemother 2016. Available at: http://www.ncbi.nlm.nih.gov/pubmed/26833158. Accessed February 3, 2016.
22. Committee TE, Testing AS, Changes N, Pseudomonas E. European Committee on Antimicrobial Susceptibility Testing Breakpoint tables for interpretation of MICs and zone diameters European Committee on Antimicrobial Susceptibility Testing Breakpoint tables for interpretation of MICs and zone diameters. Available at: http://www.eucast.org/fileadmin/src/media/PDFs/EUCAST_files/Breakpoint_tables/v_5.0_Breakpoint_Table_01.pdf. Accessed February 19, 2015.
23. Kacet N, Dubos J, Roussel-Delvallez M. Teicoplanin and amikacin in neonates with staphylococcal infection. Pediatr Infect Dis J 1993; 12: 10.
24. Yalaz M, Cetin H, Akisu M, et al. Experience with teicoplanin in the treatment of neonatal staphylococcal sepsis. J Int Med Res 32: 540–8.
25. Fanos V, Kacet N, Mosconi G. A review of teicoplanin in the treatment of serious neonatal infections. Eur J Pediatr 1997; 156: 423–7.
26. Wade KC, Wu D, Kaufman DA, et al. Population pharmacokinetics of fluconazole in young infants. Antimicrob Agents Chemother 2008; 52: 4043–9.
27. Wilson AP. Clinical pharmacokinetics of teicoplanin. Clin Pharmacokinet 2000; 39: 167–83.
28. The electronic Medicines Compendium. Targocid 200mg - Summary of Product Characteristics (SPC) - (eMC). 2014. Available at: http://www.medicines.org.uk/emc/medicine/27319/SPC. Accessed January 19, 2016.
29. Yamada T, Kubota T, Nakamura M, et al. Evaluation of teicoplanin concentrations
467468
469470471
472473
474475476
477478479
480481482
483484485486
487488489490491492
493494
495496
497498
499500
501502
503504505
506
24
and safety analysis in neonates. Int J Antimicrob Agents 2014; 44: 458–62.
30. Matthews PC, Taylor A, Byren I, et al. Teicoplanin levels in bone and joint infections: are standard doses subtherapeutic? J Infect 2007; 55: 408–13.
31. Sato M, Chida K, Suda T, et al. Recommended initial loading dose of teicoplanin, established by therapeutic drug monitoring, and outcome in terms of optimal trough level. J Infect Chemother 2006; 12: 185–9.
32. Ueda T, Takesue Y, Nakajima K, et al. Evaluation of teicoplanin dosing designs to achieve a new target trough concentration. J Infect Chemother 2012; 18: 296–302.
33. Neely MN, Youn G, Jones B, et al. Are vancomycin trough concentrations adequate for optimal dosing? Antimicrob Agents Chemother 2014; 58: 309–16.
34. Bomela HN, Ballot DE, Cory BJ, et al. Use of C-reactive protein to guide duration of empiric antibiotic therapy in suspected early neonatal sepsis. Pediatr Infect Dis J 2000; 19: 531–5.
35. Pourcyrous M, Bada HS, Korones SB, et al. Significance of serial C-reactive protein responses in neonatal infection and other disorders. Pediatrics 1993; 92: 431–5.
36. Hedegaard SS, Wisborg K, Hvas A-M. Diagnostic utility of biomarkers for neonatal sepsis--a systematic review. Infect Dis (London, England) 2015; 47: 117–24.
37. Turner D, Hammerman C, Rudensky B, et al. Procalcitonin in preterm infants during the first few days of life: introducing an age related nomogram. Arch Dis Child Fetal Neonatal Ed 2006; 91: F283–6.
38. Patil S, Dutta S, Attri SV, et al. Serial C reactive protein values predict sensitivity of organisms to empirical antibiotics in neonates: a nested case–control study. Arch Dis Child - Fetal Neonatal Ed 2016: fetalneonatal – 2015–309158. Available at: http://fn.bmj.com/lookup/doi/10.1136/archdischild-2015-309158.
507
508509
510511512
513514
515516
517518519
520521
522523
524525526
527528529530
531
532
25
TABLES
Table 1. Demographics
PMA (weeks)
Age (days) Weight at birth (Kg)
Weight at enrolment
(Kg)
eGFR (ml/min/ 1.70 m2 )
Creat. (1st
day of TEC) (mol/L)
Creat. (last day of TEC)
(mol/L)
CRP (1st day of TEC) (mg/L)
CRP (last day of TEC)
(mg/L)
n 18 18 18 18 18 18 13 18 16
Range 26-44 4-69 0.69-4.2 0.69-5.08 5.4-95.2 21-265 28-114 4-172.6 4-163.7
Median (IQR)
37 (29.7-40) 17 (10.5-26) 1.42 (0.9-3) 2.04 (1.16-3.23)
42.8(27.8-53.3)
44.5 (36-57.7)
38 (34-63.5) 41.9 (12.1-122.25)
6.9 (4-13.1)
PMA: Post-menstrual age. eGFR= estimated glomerular filtration rate (Schwartz-Haycock). Creat.= creatinine . TEC= teicoplanin. CRP = C-reactive protein. IQR= interquartile range.
533
534
26
Table 2. Model diagnostics for the PK models
Model Log-likelihood Pop r2 * Post r2* Slope (95% CI) Intercept (95% CI)
Standard PK -253.8 0.159 0.814 0.925 (-1.3-2.8) 0.768 (-1.3-2.8)
Linear (weight) PK -254.1 0.271 0.807 0.941 (0.8-1.04) 0.922 (-1.14-2.98)
Allometric (weight) PK -254.4 0.249 0.815 0.981 (0.9-1.1) 0.26 (-1.8-2.3)
* relative to the regression line fitted for the observed versus predicted values after the Bayesian step. CI: confidence interval.
535
536
537
538
27
Table 3. Population PK and PD parameter estimations.
Population PK parameter
Mean SD Median
Clstd (L/h) 0.45 0.2 0.43
Vc (L) 0.81 0.48 0.76
Kcp (h-1) 1.45 0.99 1.3
Kpc (h-1) 0.84 1.05 0.63
Population PD parameter
Kgmax (mg/L*h-1) 0.05 0.03 0.05
Popmax (mg/L) 159.76 62.6 139.15
H 18.48 3.46 19.99
Kkmax (mg/L*h-1) 0.05 0.02 0.06
EC50 (mg/L) 7.1 6.11 5.79
IC3 (mg/L) 55.32 54.24 24.99
Clstd= Clearance standardized [Clearance=Clstd*(wt/70)^0.75]; Vc=Volume of distribution in the central compartment; Kcp and Kpc= firs-order rate constants from central to peripheral compartments and from peripheral to central compartments, respectively; Kgmax= maximum rate of CRP production; Popmax= theoretical maximum CRP concentration; H=Hill slope; C50= Teicoplanin concentration producing half-maximal CRP reduction; IC3= initial condition in CRP concentrations.
539
540
541542543544545
546
547
548
28
FIGURES
Figure 1. a) Teicoplanin (empty circles) and b) CRP (empty triangles) concomitant concentration time-profiles for the 18 neonates.
549
550
551
552
553
554555
556
29
Figure 2. Individual posterior observed versus predicted plots (after the Bayesian step) from the PK-PD model. Panel a) PK (teicoplanin concentrations), Predicted teicoplanin concentrations=0.917x-0.06; Panel b) PD (CRP concentrations), Predicted CRP concentrations= 1.01x+0.254
557
558
559
560
561562563
30
564
565
31
Figure 3. Individual concentration-time plots after the Bayesian step showing teicoplanin (black) and CRP (grey) predicted (continuous line) and observed (crosses) concentrations over time for each of the patients. The y axis observations refer to both: teicoplanin and CRP concentrations. Individuals 1 and 7 were infected with Gram-negative bacteria and only received 2 doses of teicoplanin. The individual average Cmin and AUC drug exposures are reported for each patient.
566567568569570
32
Figure 4. Comparison of the simulated (n=5000 per population group) teicoplanin AUC (mg*h/L) distribution histograms in different populations, such as a) neonates (0.7-5 Kg) b), c) and d) children >1 month-16 years old with fix weights of 10, 25 and 50 Kg, respectively and e) adults receiving current teicoplanin dosage regimen.
571
572
573
574
575576577578
33
Figure 5. Exposure-response relationships from the Bayesian posteriors from the PK-PD linked model using a) AUC average, b) Cmin average and c) AUC:EC50 ratio (log10 scale) as the pharmacodynamics relevant index versus predicted CRP concentrations at the end of therapy. An Emax model was fitted to the data. Patients with ID 1, 7 (Gram-negative bacterial infection) and 16 (multiple inflammatory co-morbidities with persistently high CRP levels> 100 mg/L and negative blood culture) were excluded from this analysis but shown in panel c.
579
580
581582583584585586
34
Figure 6. AUC:EC50 box-plot suggesting that patients attaining >68.3 drug exposures (>AUC 389.3 mg*h/L) had a more consistently lower CRP at the end of therapy (Mean 18.18 vs 5.7 mg/L), p value=0.002 (two sample t-test).
587
588
589
590591592
35